
Off-Design Dynamic Performance Analysis of a Solar Aided Coal-Fired Power Plant


School of Energy, Power and Mechanical Engineering, North China Electric Power University, Beijing 102206, China
*
Author to whom correspondence should be addressed.
Energies 2021, 14(10), 2950; https://0-doi-org.brum.beds.ac.uk/10.3390/en14102950
Submission received: 24 March 2021
/
Revised: 1 May 2021
/
Accepted: 13 May 2021
/
Published: 19 May 2021
(This article belongs to the Special Issue Solar PV, Thermal, Concentrator and Hybrid Power Systems)
Abstract
:Coal consumption and CO2 emissions are the major concerns of the 21st century. Solar aided (coal-fired) power generation (SAPG) is paid more and more attention globally, due to the lesser coal rate and initial cost than the original coal-fired power plant and CSP technology respectively. In this paper, the off-design dynamic performance simulation model of a solar aided coal-fired power plant is established. A 330 MW subcritical coal-fired power plant is taken as a case study. On a typical day, three various collector area solar fields are integrated into the coal-fired power plant. By introducing the solar heat, the variations of system performances are analyzed at design load, 75% load, and 50% load. Analyzed parameters with the change of DNI include the thermal oil mass flow rate, the mass flow rate of feed water heated by the solar energy, steam extraction mass flow rate, coal consumption, and the plant thermal efficiency. The research results show that, as DNI increases over a day, the coal saving rate will also increase, the maximum coal saving rate reaches up to 5%, and plant thermal efficiency reaches 40%. It is analyzed that the SAPG system gives the best performance at a lower load and a large aperture area.
1. Introduction
In recent years, fossil fuel consumption and their adverse impacts on the environment, renewable energy technologies [1], such as solar thermal power technology has been paid more attention globally. However, the initial cost [2] and the inherent shortcomings of solar energy such as intensity, variability, and reliability are the challenges face by solo solar thermal power technology. To overcome these obstacles, integrating the solar thermal energy with coal-fired power generation, named solar aided coal-fired power generation could reduce coal consumption rate and pollutant emissions of the conventional coal-fired power plant and, simultaneously it can increase economic benefit compared with the solar thermal power plant [3,4,5,6]. Zoschak [7] was the first, who studied seven different integration schemes of solar energy with the coal-fired power plant. According to his study preheating boiler feed water with solar energy was proven to be a preferable option. Pai [8] proposed a concept of boiler feedwater heating by an integration of a solar field in a 210 MW coal-fired power plant. According to his results, at the fuel-saving operation mode, 47,000 tons of coal will be saved annually. The feed water heating process in the regenerative Rankine cycle by using the steam extraction results in great exergy losses, Ying et al. [9] proposed that if solar energy was used for preheating of boiler feed water then exergy losses would be reduced obviously. MK Gupta et al. [10,11,12] showed advantages of regenerative Rankine power plant with the solar thermal integration [13]. Analyze the comparison of both solar aided and stand-alone solar concentrating power generation. According to results, SAPG is 1.8 times more cost-effective and generates 25% excess electricity than stand-alone CSP.
Popov [14] established a fuel-saving type simulation model of the solar energy-aided steam power plant. In his study, the low-pressure feedwater heaters, high-pressure feedwater heaters, both high-pressure feedwater heaters, and economizer were heated by the solar field. Yang [15] demonstrated two operation modes (fuel saving and power boosting) of a solar-aided coal-fired power plant. Further, he discussed an efficient way to utilize solar thermal energy in a low and medium temperature range of power generation by replacing the extraction steam in the regenerative Rankine cycle. Detailed performance analysis of a tower solar collector aided coal-based power generation was carried out [16,17,18,19]. Peng [20] and Bakos [21] studied the annual thermodynamics performance of solar-aided coal-fired power plants.
Suresh [22] analyzed the energy, exergy, environmental, and economic benefits of solar aided coal-fired subcritical and supercritical power plants. Mehrpooya [23] and Rashid [24] performed a thermo-economic and techno-economic performance research of power generation plants with solar energy under different operation modes and integration schemes.
However, more work has been done on solar aided coal-fired power generation, mostly on thermodynamic, economic, all previous work based on design conditions. While adding solar energy to the coal-fired power plant, the solar aided coal-fired unit will operate on the off-design conditions.
In this paper, an off-design model of a 330 MW solar aided coal-fired power plant is established. System off-design performance analyzed under three different solar collector fields. On a typical day, variations of system main parameters are investigated for different solar field heat outputs.
2. System Description
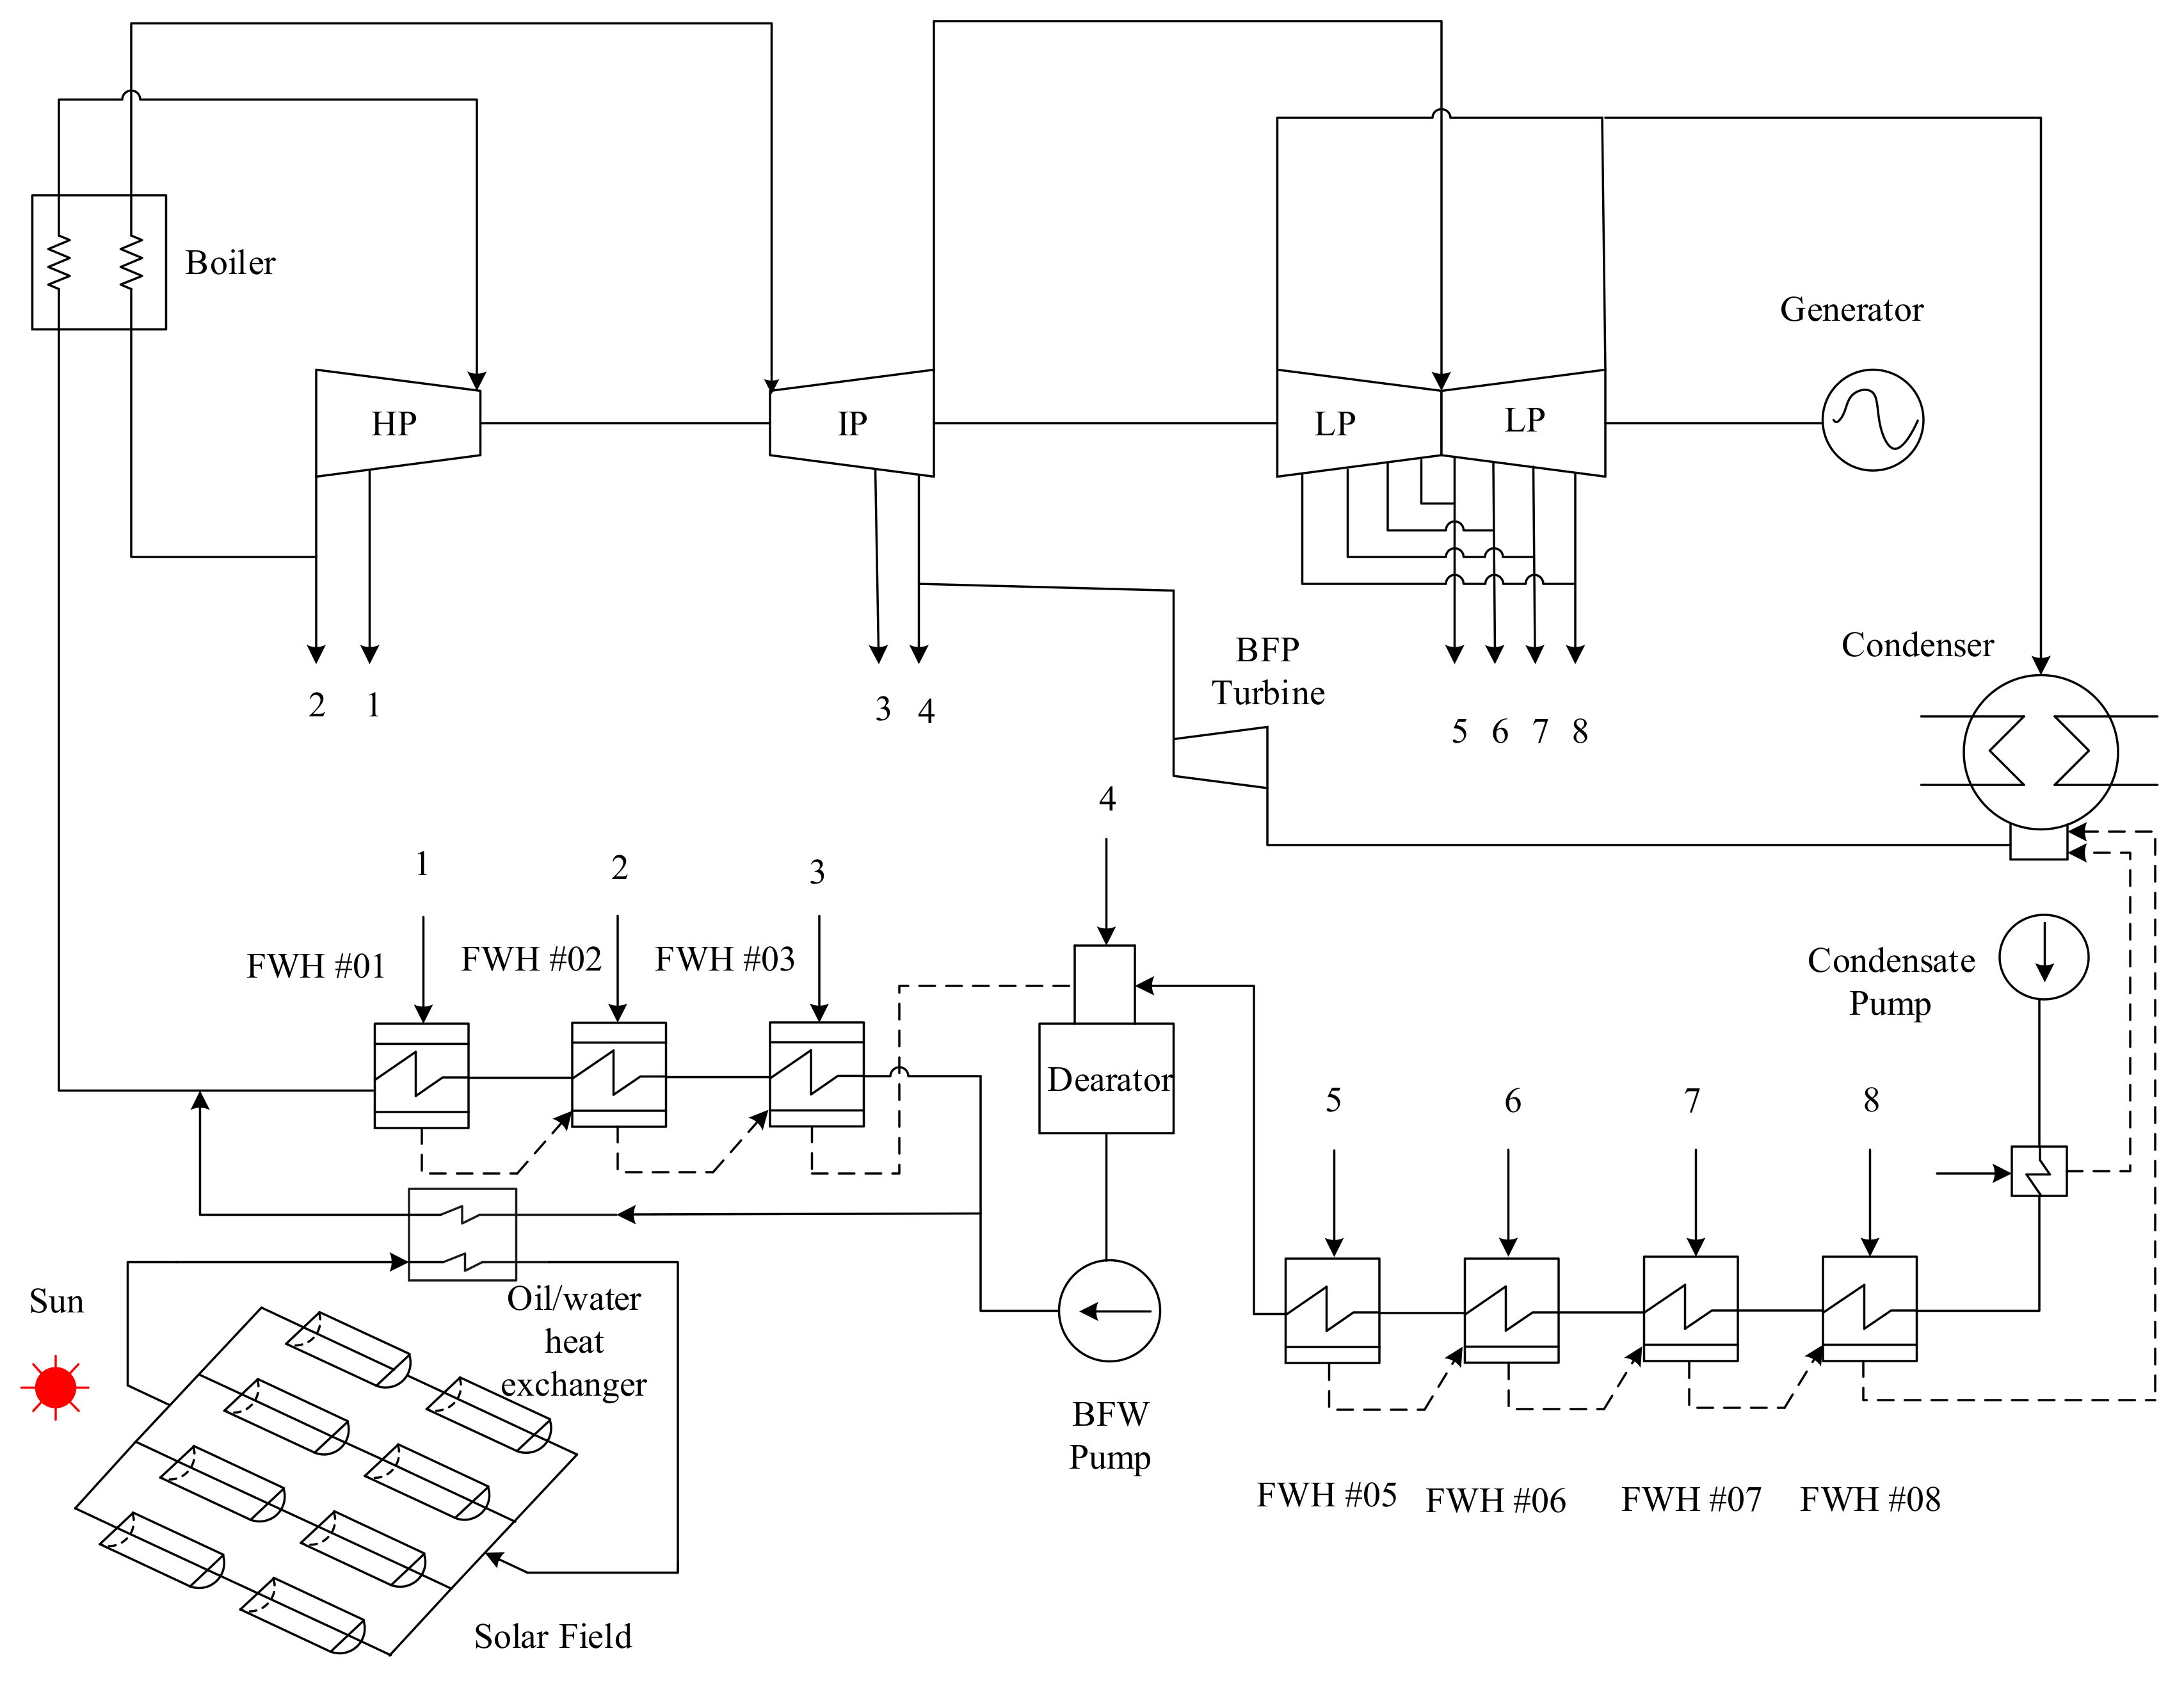
Most of the electricity generation in the world comes from fossil fuels, and almost all coal-fired steam power plants are running on the regenerative Rankine cycle, in which extracting or bleeding of steam at various points from the turbine to heat the boiler feed water [11,14,25]. The extraction steam can produce more work by further expansion in the turbine, to heat the boiler feedwater instead. The regenerative Rankine cycle can increase the thermal efficiency of the basic Rankine cycle, decrease the boiler heat load and the condenser load, however, the cycle net output power will also be decreased. In this paper, a 330 MW subcritical coal-fired, single reheat, and regenerative steam cycle system with three high-pressure (HP) feedwater heaters, one deaerator, and four low-pressure (LP) feedwater heaters are selected as the reference system and integrated with solar energy. The flowchart of the obtained solar aided coal-fired power plant is shown in Figure 1. In this proposed system, high-pressure steam extraction for the feedwater heaters FWH#01, FWH#02, and FWH#03 are replaced by solar thermal energy, and the corresponding boiler load will be decreased, which will directly decrease the coal consumption rate.
For the reference system without integration with solar energy, the boiler feedwater is heated by the extracted steam in feedwater heater, and in this proposed system (as shown in Figure 1) the boiler feedwater is either heated by the extracted steam or by the solar thermal energy or both. During low solar insolation periods (or no sunlight) the boiler feed water is heated by the extracted steam as the conventional operation and during periods of high solar insolation rate, the steam extraction will decrease, the decreased amount will be fulfilled by the solar thermal energy or part of boiler feed water is heated by the solar energy in the thermal oil-water heat exchanger. According to the demand, it can lower the coal consumption while the same power generation named as FUEL SAVING MODE or it can also boost the plant power output while the same coal consumption named as POWER BOOSTING MODE. In this paper, the plant is simulated at only fuel-saving mode.
3. System Modeling & Simulation
In this paper, the model of the solar thermal energy aided 330 MW coal-fired power plant with the coal saving mode has been developed. System modeling and simulation have been performed with the EBSILON Professional 14, STEAG Energy Services, Zwingenberg, Germany [26]. EBSILON Professional is a highly suitable software to simulate thermodynamic cycles, design and optimize the performance of power plants [27,28,29].
3.1. Solar Field Model
In this paper, the line concentrating solar collectors field is used to preheat the boiler feed water. The available solar heat or thermal output of a solar field (kW), is calculated by three parts. The heat absorbed, (kW), by HTF in the absorbing tube. The receivers heat loss, (kW), due to the convection and radiation between the surface and the ambient air, and thermal losses of field piping, (kW). In simple, it is thermal energy balance, energy absorbed by the thermal fluid that circulates in the solar field deducing heat losses in the solar field as shown in Equation (1)
The solar energy input is determined by the following equation [30]:
where, is the direct normal irradiance, W/m2; is the net aperture area, m2; is the peak optical efficiency, is incidence angle modifier.
3.2. Steam Turbine Model
Integrating solar thermal energy with the feed water regenerative system will make the steam extraction rate from the turbine decrease and will directly or indirectly affect the variation of the steam mass flow rate in lower pressure stages of the turbine. According to Bartlett [32], a decrease in the turbine isentropic efficiency () can be considered as a function of the ratio of the steam mass flow at part load to the steam mass flow under the design load.
where, both m and are the mass flow rates of steam at part load the design load, respectively, kg/h.
Therefore, the turbine isentropic efficiency is expressed as follows:
where, is the turbine isentropic efficiency and is the reference turbine isentropic efficiency.
3.3. System Performance Evaluation
The thermal efficiency of the overall system is calculated as follows,
where, is power output, MW; is the mass flow rate of coal, kg/h; and is the lower heating value of coal, kJ/kg.
Coal consumption () of this hybrid system is calculated as follows:
is the rate of the effective heat absorbed by water/steam from the combustion of coal in the boiler, W; is the lower heating value of coal, kJ/kg; and is the boiler efficiency.
The power generated by the solar energy , MW; in a SAPG plant operated in fuel saving mode [30].
where, is the solar effective heat added to feedwater, W.
where, is the mass flow rate of the feed water entering into oil/water heat exchanger, kg/h, and is the enthalpy difference of the feed water in the oil/water heat exchanger.
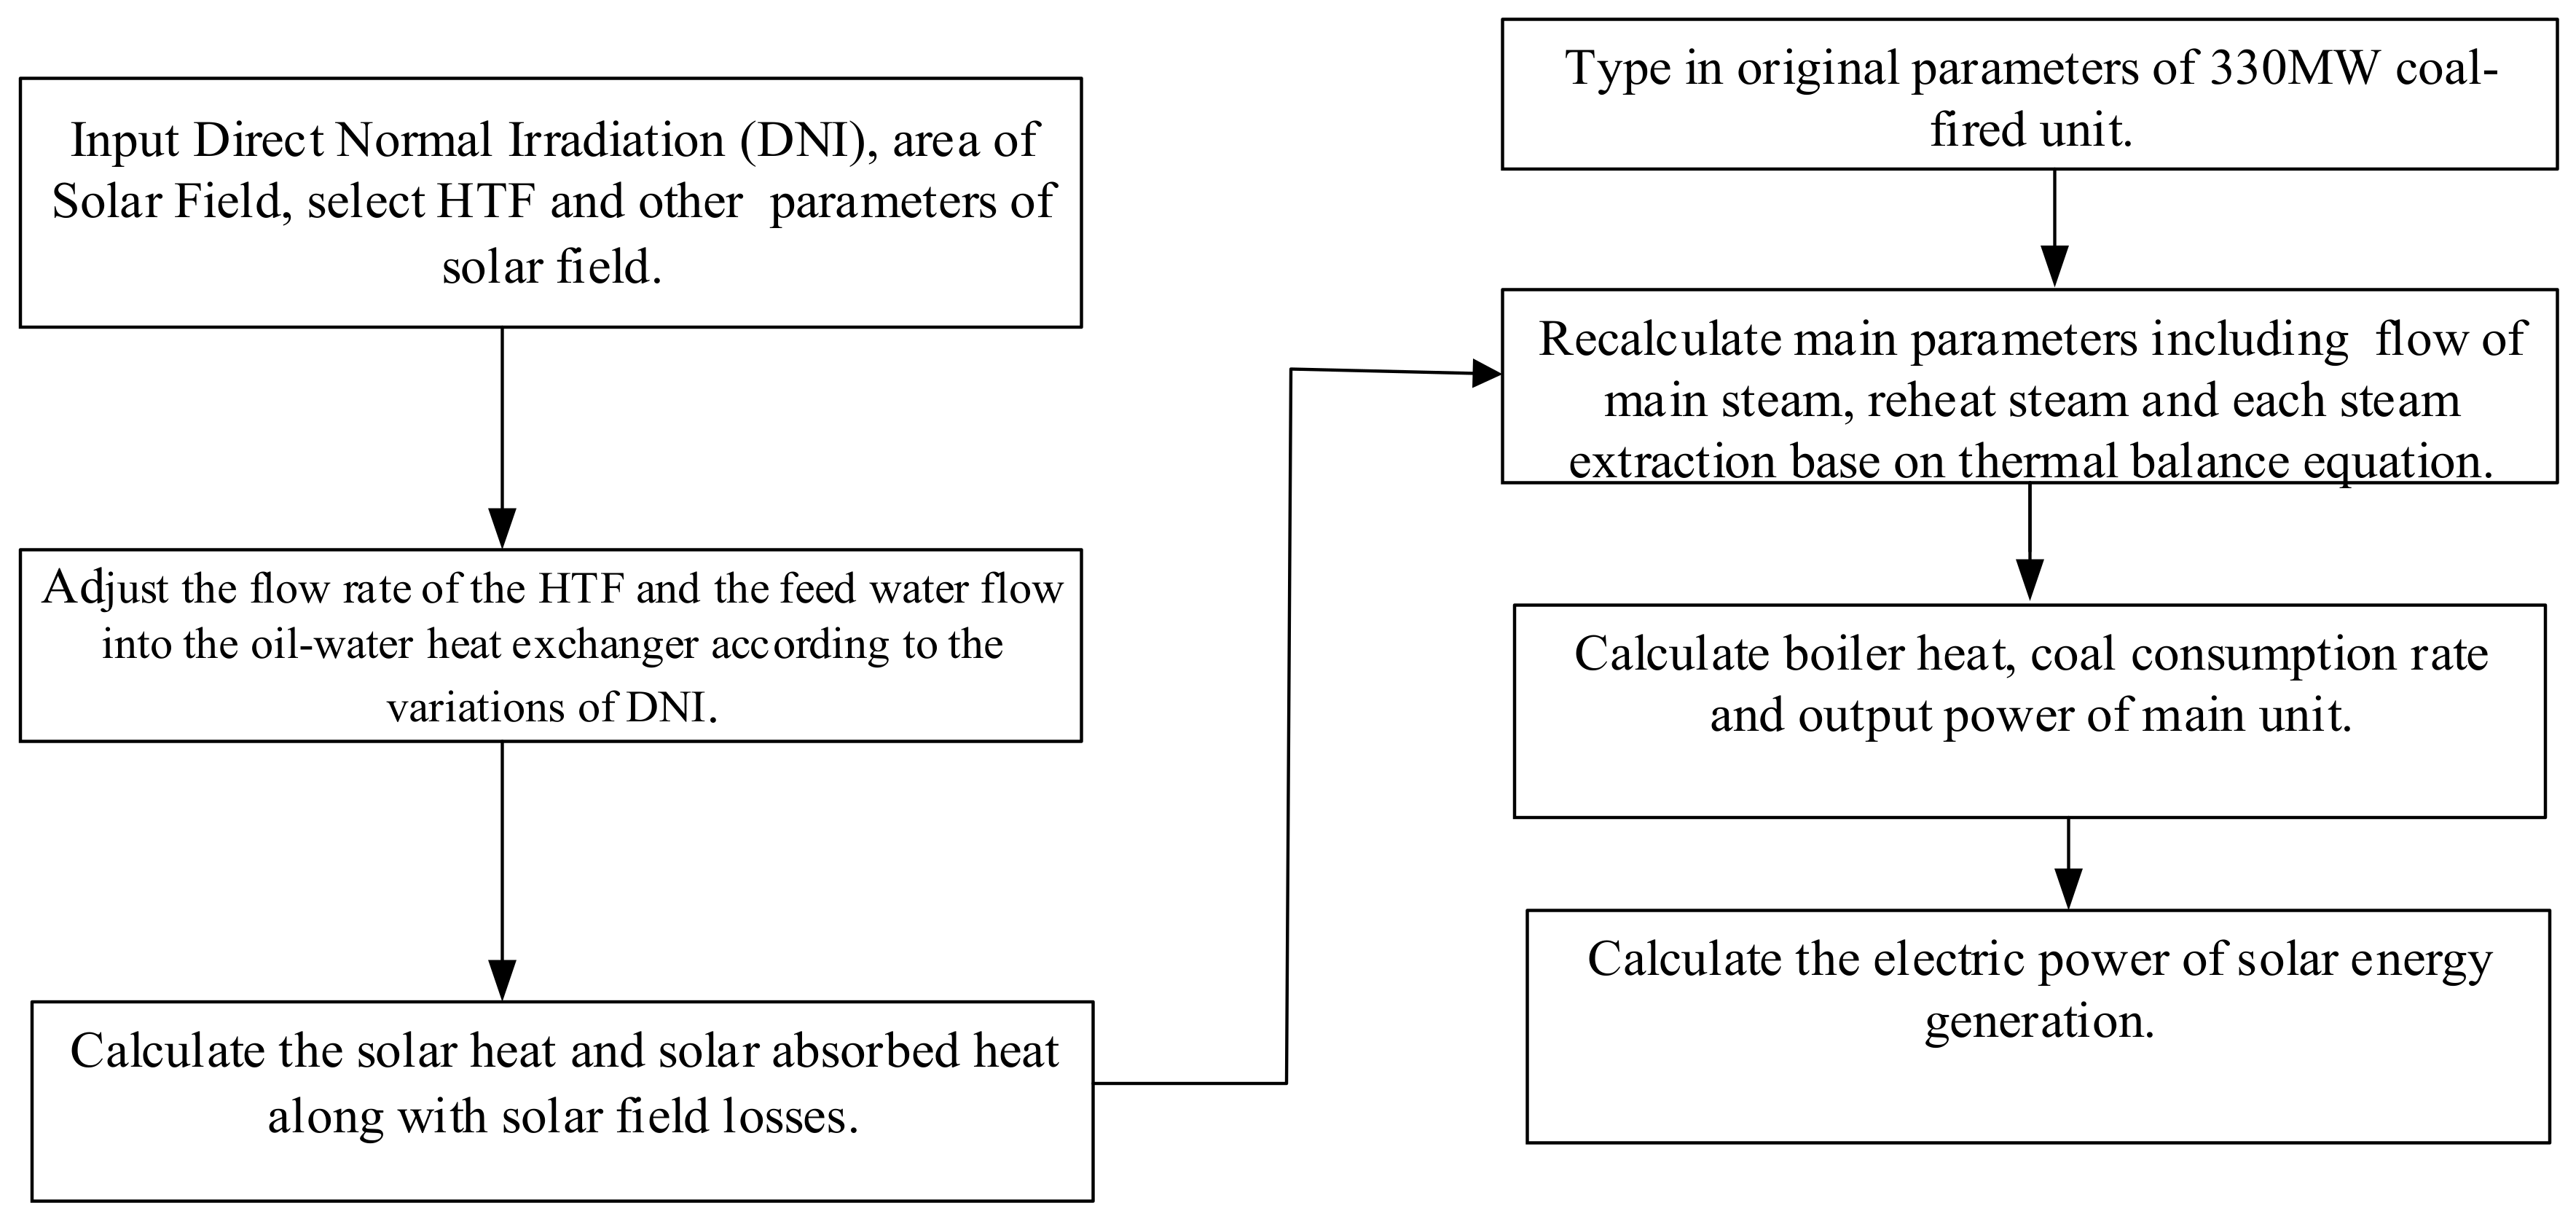
The logic flow for a simulation program to carry out the analysis is shown in Figure 2.
4. Case Study
4.1. General Description
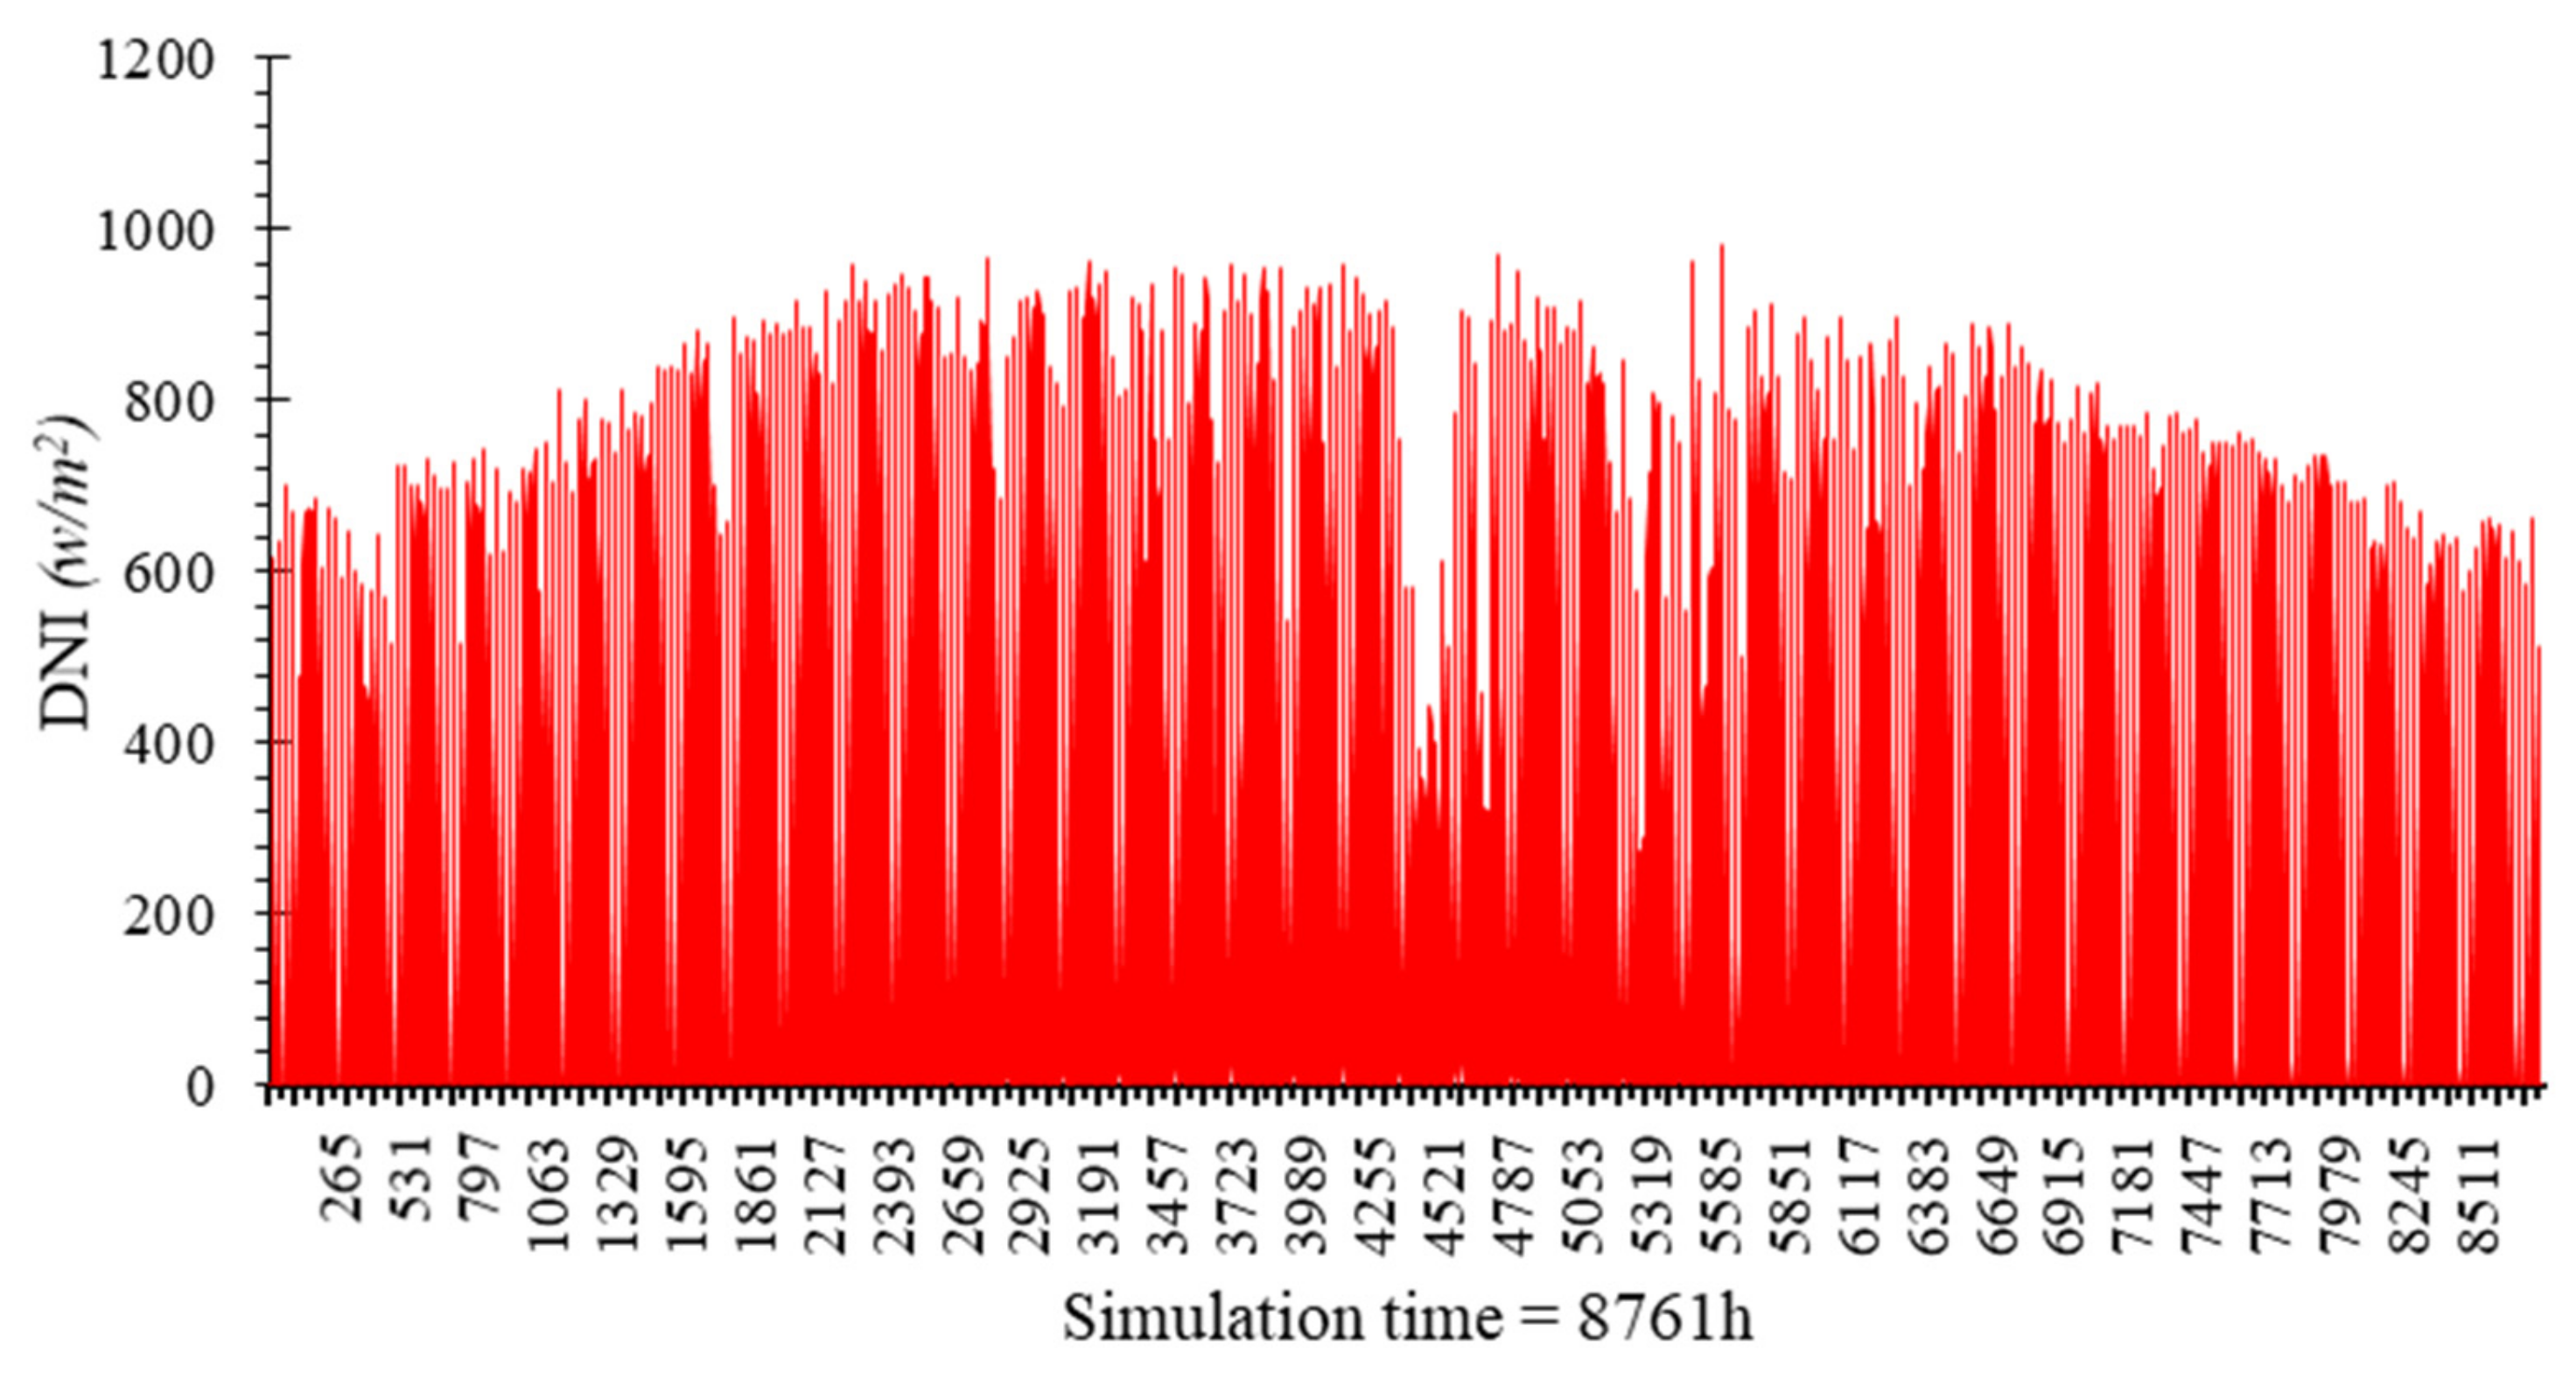
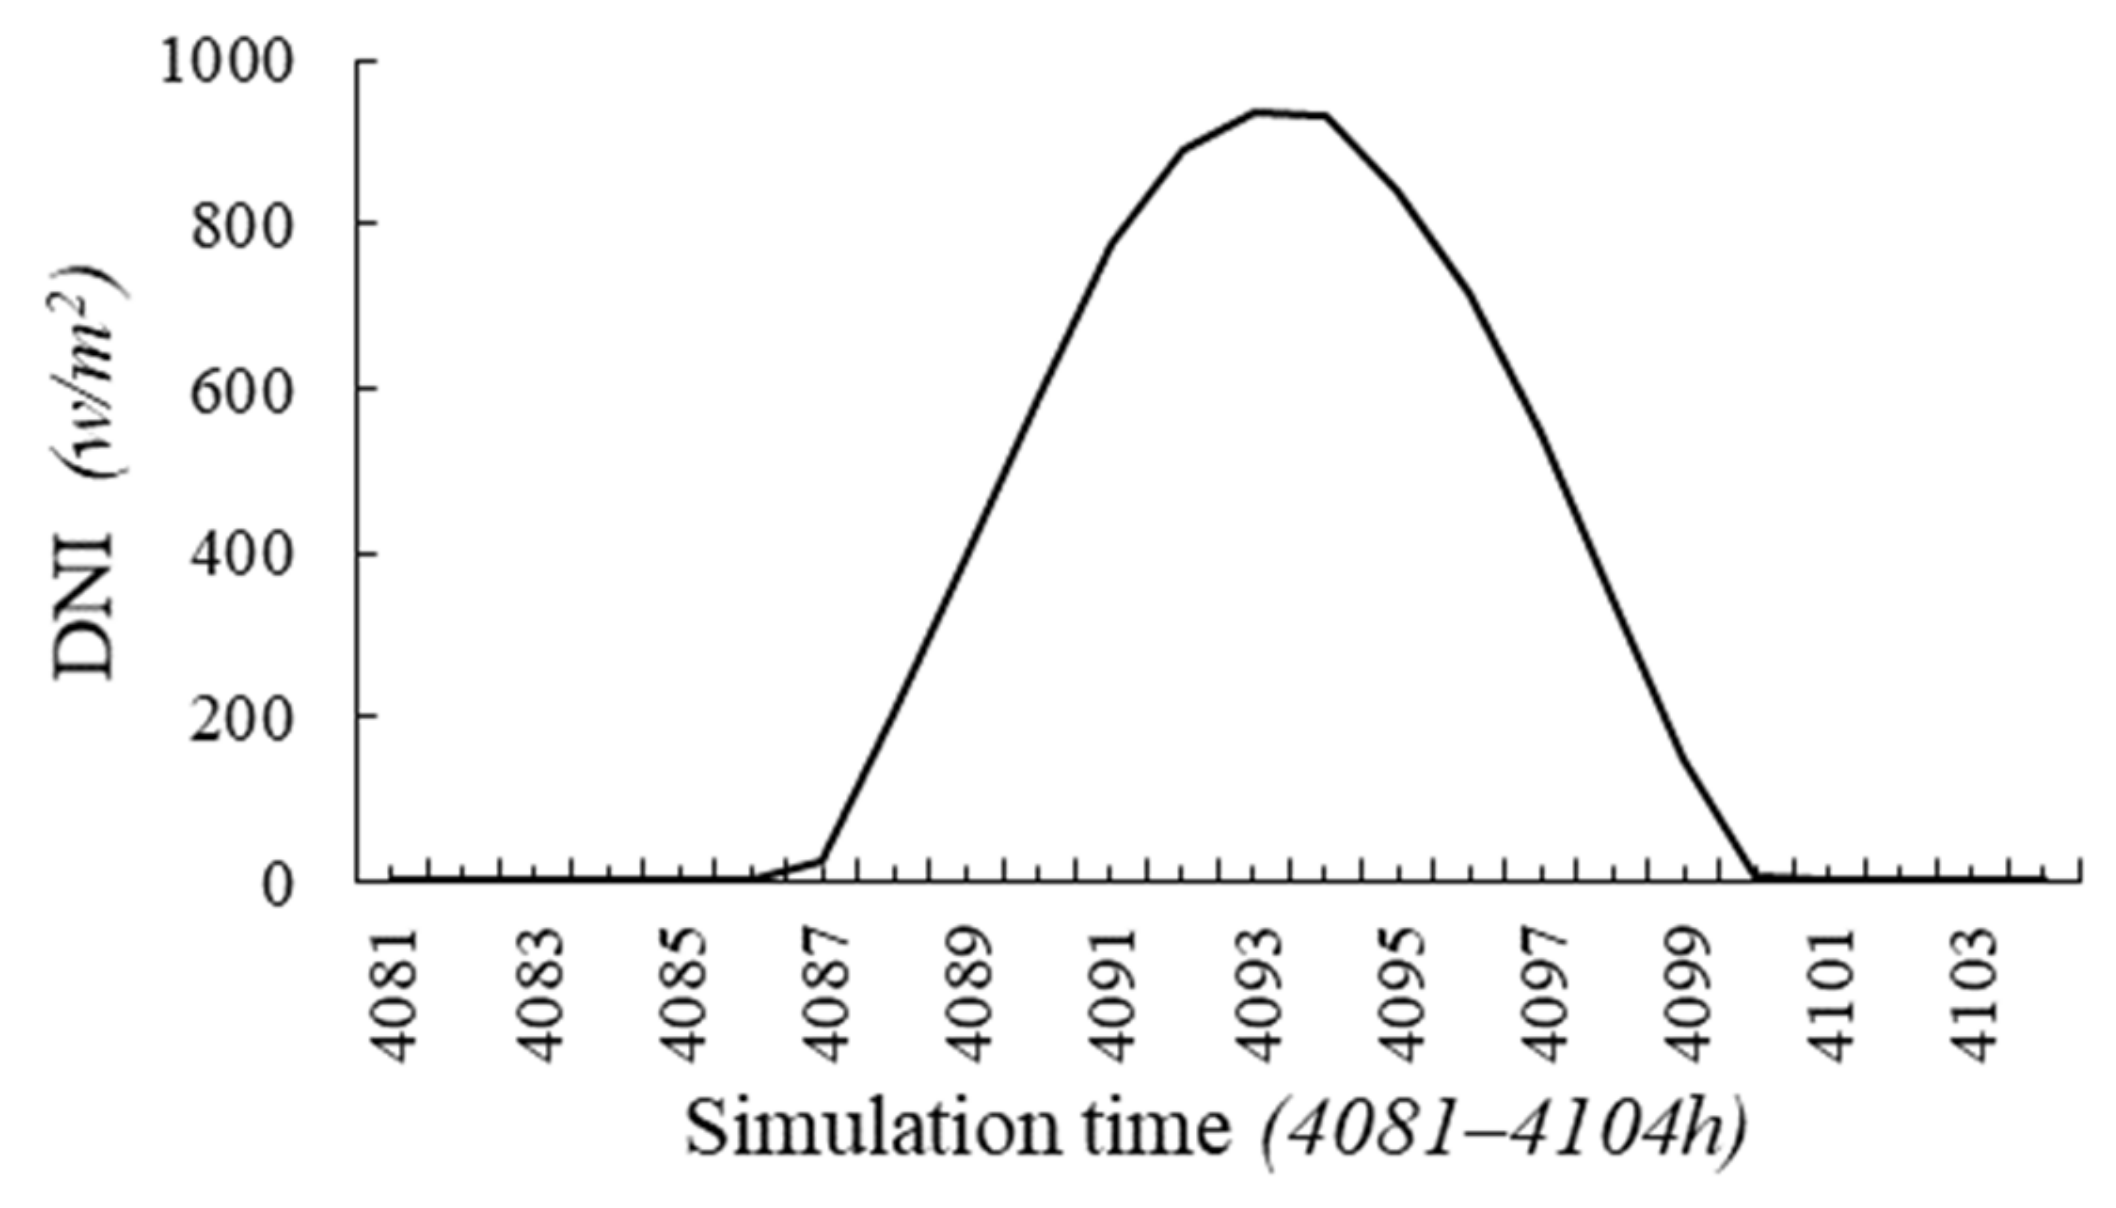
Solar energy aided 330 MW coal-fired power plant shown in Figure 1, based in Thar, Pakistan is selected as a case study. Thar, Pakistan (24.88°, 70.24°) is rich in solar energy resources [33]. For validation of coal-fired unit, used in this analysis, a comparison between simulated results with the design data is carried out as shown in Table 1. Figure 3 shows yearly DNI data and Figure 4 shows ambient temperature distribution over a year in Thar, Pakistan. Figure 5 shows the DNI distribution of the summer solstice in Thar, Pakistan. At the design load, the heat and mass balance sheet of this coal-fired power plant is shown in Figure 6. Low-grade lignite coal is used in this power plant as shown in Table 2. The off-design dynamic performances of the solar aided 330 MW coal-fired power plant at the design load, 75% load, and 50% load are deeply analyzed.
4.2. Solar Field Description
Three solar collector fields are analyzed. The solar field model’s simulation results are verified with test results by Dudley [34]. The solar field comprises solar collectors, one pump that circulates the oil in the field, one heat exchanger that transfers the solar heat from the thermal oil to the boiler feedwater heater as shown in Figure 7. Table 3 shows the main parameters of the solar collector field. In this case study, at design load conditions, feedwater is heated by solar energy from 175 °C to 279 °C. DNI data used in solar field is shown in Figure 5.
4.3. Off-Design Dynamic Thermodynamic Performance Analysis
On a typical day, the dynamic characteristics of the solar aided coal-fired power plant operating at fuel-saving mode under design load, 75% design load, and 50% design load, are analyzed.
DNI is varying every time in a year, as the required aperture area for the solar aided power generation depends on the DNI. Therefore, it is important to check the system performance at different solar field areas. In this study, three solar collector fields with different gross aperture areas (90,000 m2, 60,000 m2, and 30,000 m2) are selected to check the system performance. To design the control system, it is necessary to analyze the variations of system parameters at off load conditions and at various solar field areas [13,35]. The solar energy is integrated with the HP feedwater section in 330 MW coal-fired power plant as shown in Figure 1. DNI is not stable over the day, which affects the whole system parameters. In this paper, the following parameters are analyzed over a typical day.
4.3.1. Variation of the Thermal Oil Mass Flow Rate
The mass flow rate of the thermal oil directly affects the heat transfer process between the thermal oil and the boiler feedwater. With the same solar radiation, if the thermal oil flow rate increases, then the outlet temperature of the thermal oil will be decreased, which will directly affect the outlet feed water temperature. For a certain turbine load, the boiler feedwater temperature is constant. DNI is varying each time in a day. Therefore, adjusting the mass flow rate of the thermal oil is the basic way to control and adjust the outlet feed water parameters (temperature) during the operation. In this study, to get the stable temperature of the feed water at a certain load, the outlet temperature of the thermal oil at design point is taken as a constant 350 °C and the inlet temperature is 220 °C as shown in Figure 8. Figure 9 shows variations of the thermal oil mass flow rate at different aperture areas of 90,000 m2, 60,000 m2, and 30,000 m2 under different turbine loads. The results show that, as DNI increases, the thermal oil flow rate increases, the effective heat from the solar energy is also increased and as the load decreases, the thermal oil flow rate decreases. Also, as the aperture area decreases, the thermal oil flow rate decreases. Variations in the mass flow rates of HTF and water heated by solar energy must be considered, to observe the internal consumption of the solar feed water heating system [30].
4.3.2. Variation of the Mass Flow Rate of the Feed Water Heated by the Solar Energy
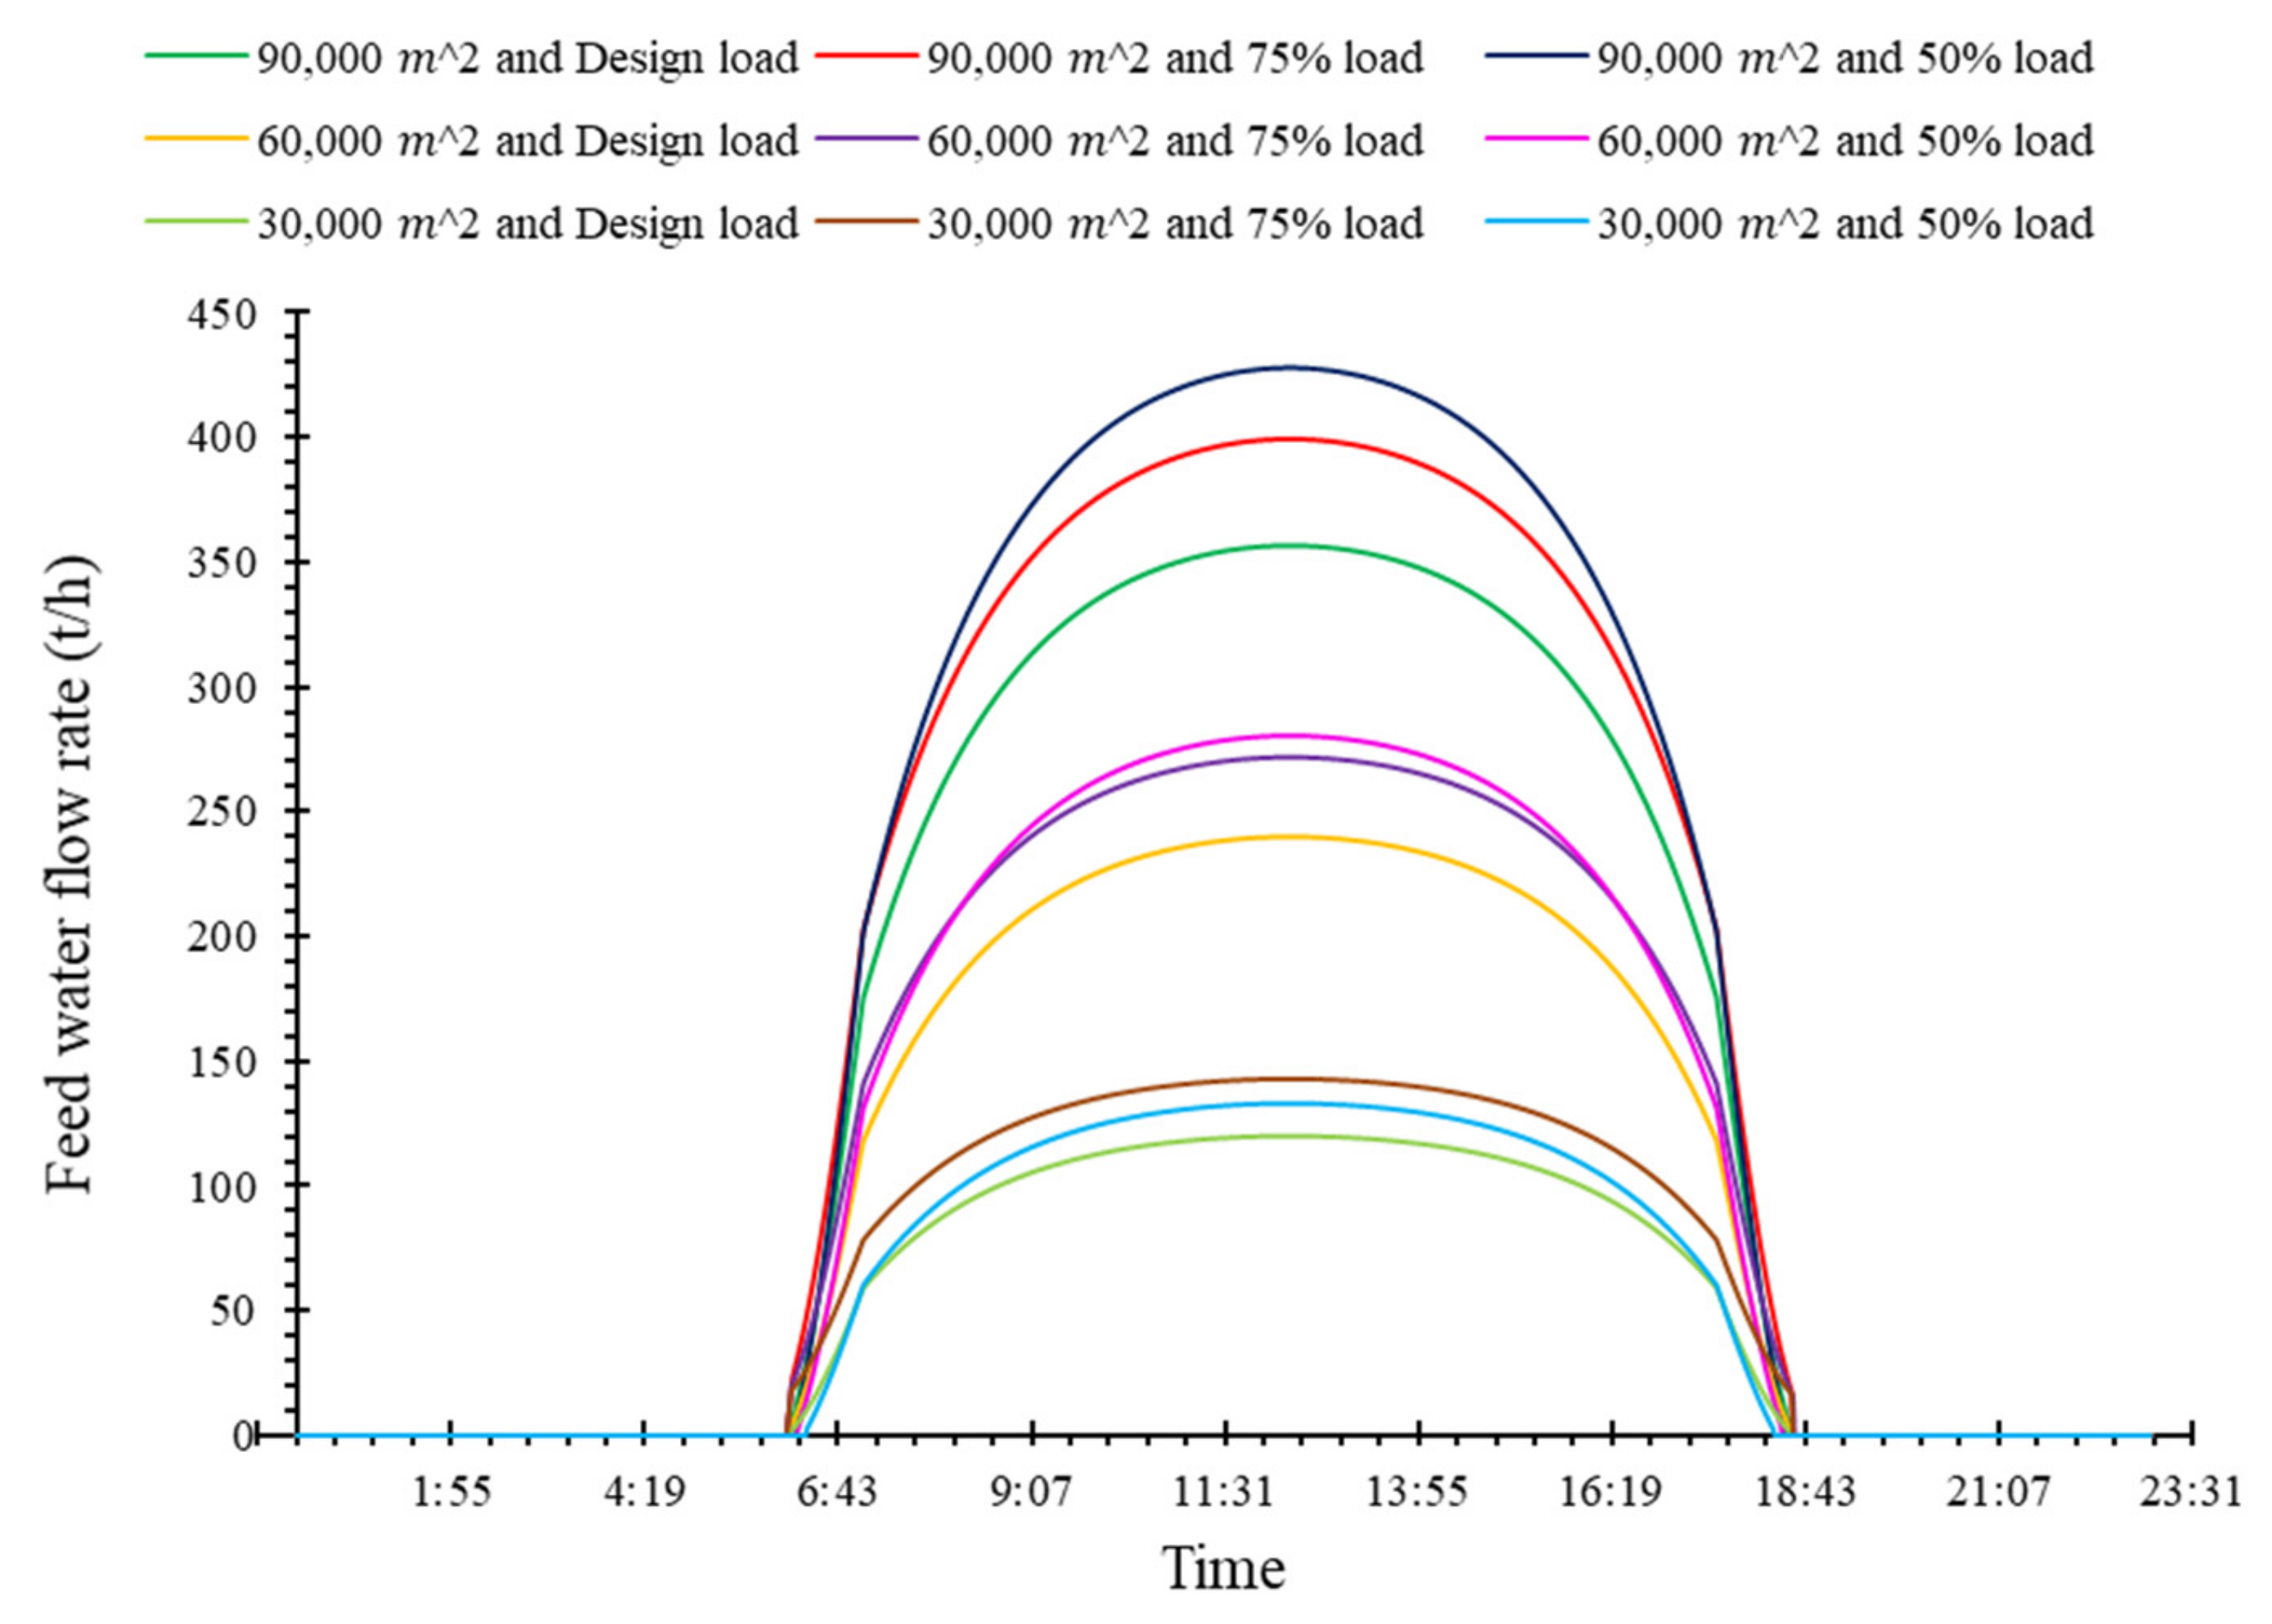
As discussed above, the mass flow rate of the feedwater is a convenient adjusting parameter for controlling other parameters, and as the mass flow rate increases the temperature decreases. For a specific turbine load, the temperature of the feedwater entering the boiler is constant [20]. In this study, the outlet temperature of the feed water from the oil/water heat exchanger is set as a constant. At the design load, the boiler feedwater temperature is 276.9 °C, 257.9 °C at 75% load, and 236.3 °C at 50% load. In this section, the mass flow rate variations of the feed water heated by the solar energy are analyzed over a typical day as shown in Figure 10.
It is observed that as DNI increases, the mass flow rate of the feed water heated by the solar energy also increases. It is because of getting a good match of the set value of the feedwater temperature, the heat absorbed by the feedwater from the solar energy also increases with the increase of DNI.
Furthermore, it is also observed that at lower collector field areas the mass flow rate of the feedwater heated by the solar energy at 50% load is higher than that of 75% load. In addition, under 75% load, the mass flow rate of the feed water heated by the solar energy is higher than that of the design load because at lower loads the outlet temperature of the feed water from the oil/water heat exchanger is also lower than that at higher loads. The mass flow rate of the feedwater increases until to get the desired set value of temperature. As the aperture area decreases, the solar effective heat is also decreased so at lower load a large mass flow rate is required [35].
4.3.3. Variation of the STEAM extraction Mass Flow Rate
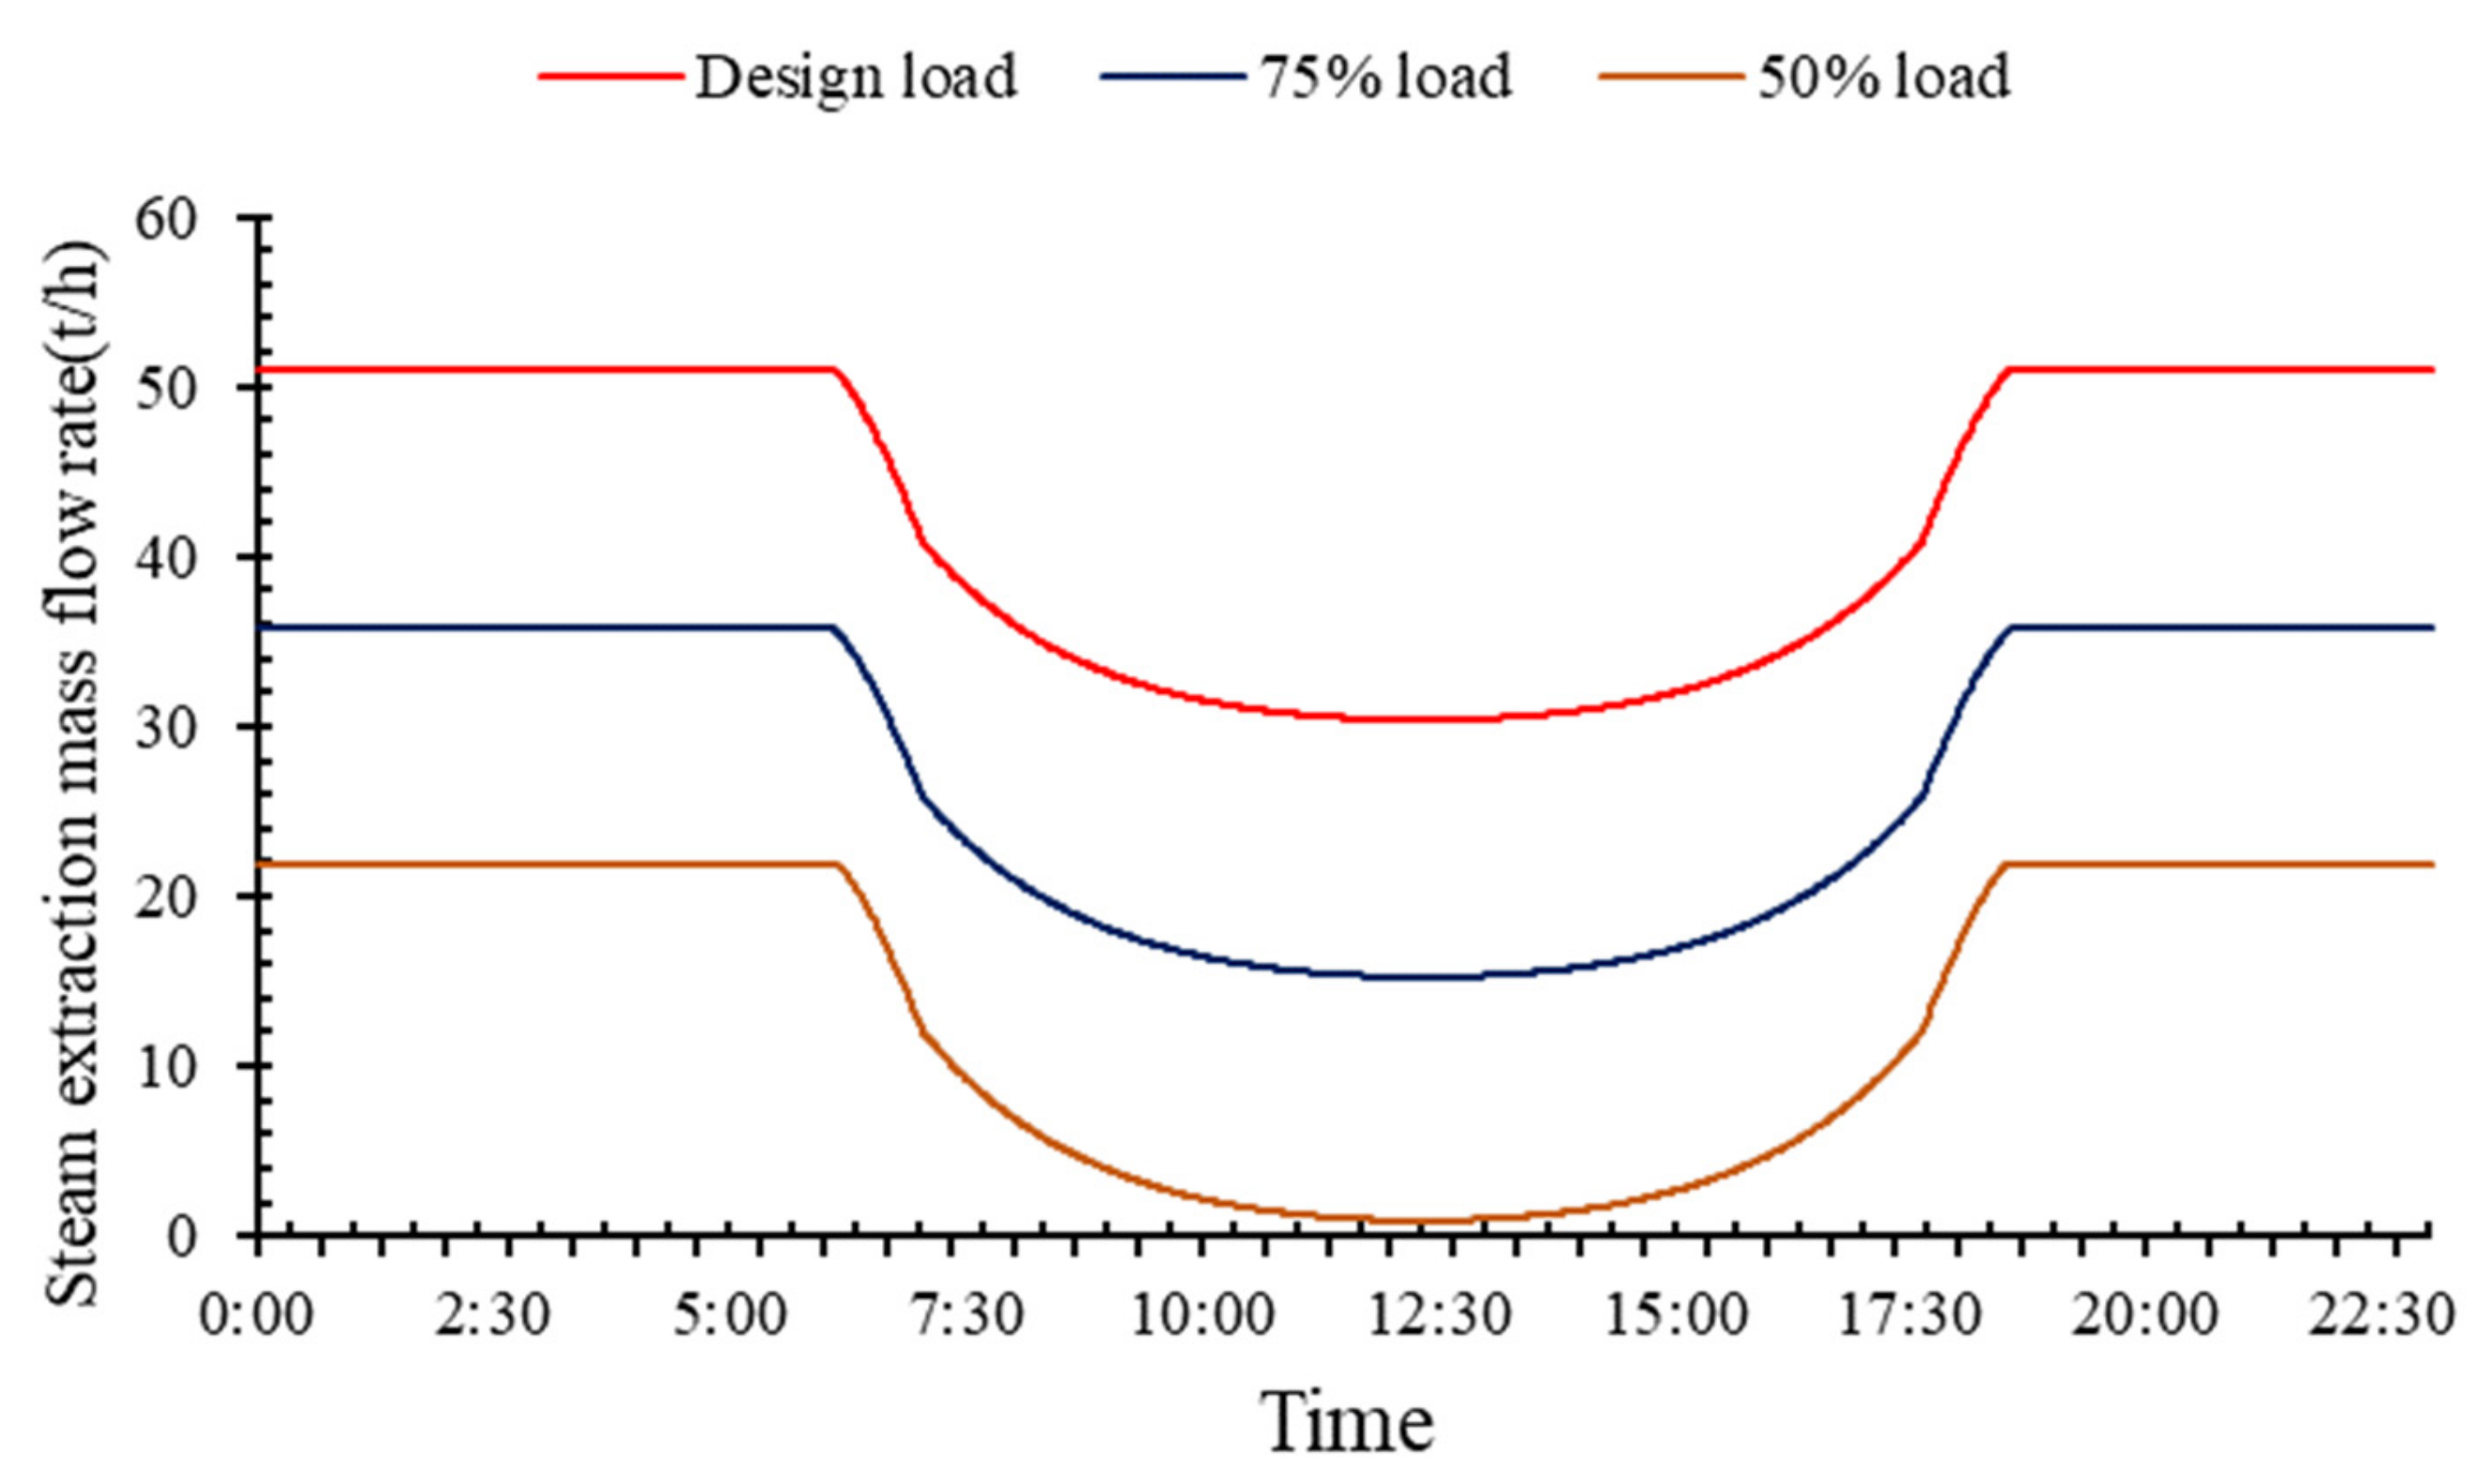
In this section, the steam extraction mass flow rates of FWH#01, FWH#02, and FWH#03 are analyzed over a day as shown in Figure 11, Figure 12 and Figure 13.
As in a conventional power plant at lower load conditions, the heat absorbed by the feed water is also lower as compared with that at higher load conditions, because at lower load conditions, the lower feedwater temperature is required at the inlet of the boiler. It is observed that as DNI increases, the steam extraction mass flow rate is decreased.
At design load and 90,000 m2, 60,000 m2 and 30,000 m2 collector field area, steam extraction (01, 02, and 03) rates are reduced up to 40%, 27%, and 14% respectively. Furthermore, at lower load conditions the steam extraction mass flow rate is lower than that at higher load conditions. For example, at 50% turbine load, the steam extraction mass flow rate is lower than that of 75% load, and at 75% load, the steam extraction mass flow rate is lower than that of the design load. At 90,000 m2 and 50% load the steam extraction mass rate is almost close to zero and also at lower load conditions, the solar effective heat is a little more than that of higher load conditions. However, as the aperture area decreases, the steam extraction mass flow rate increases because less solar effective heat is added to the boiler feedwater by the solar energy.
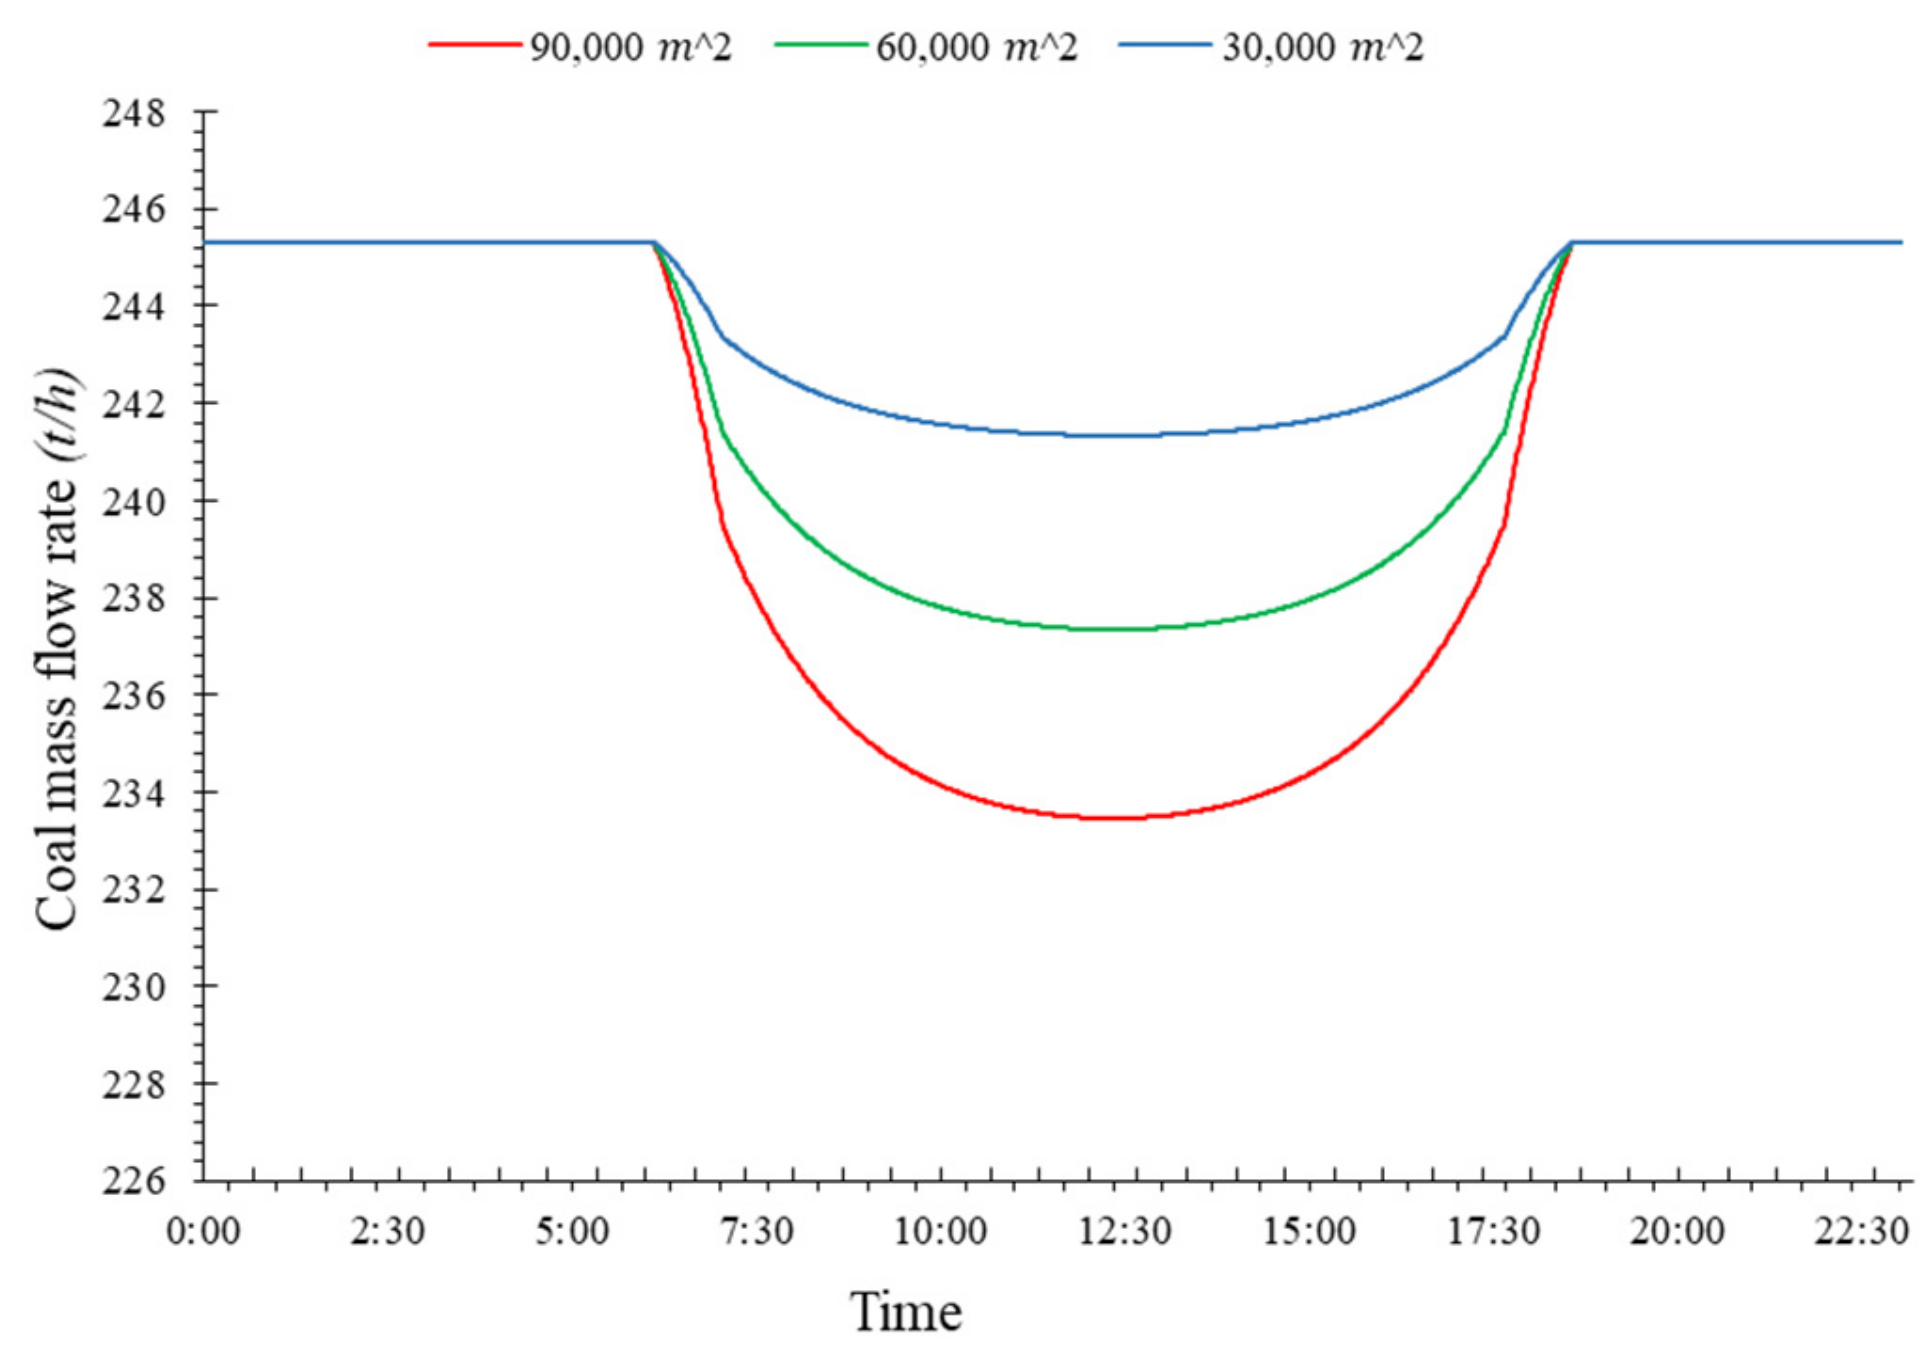
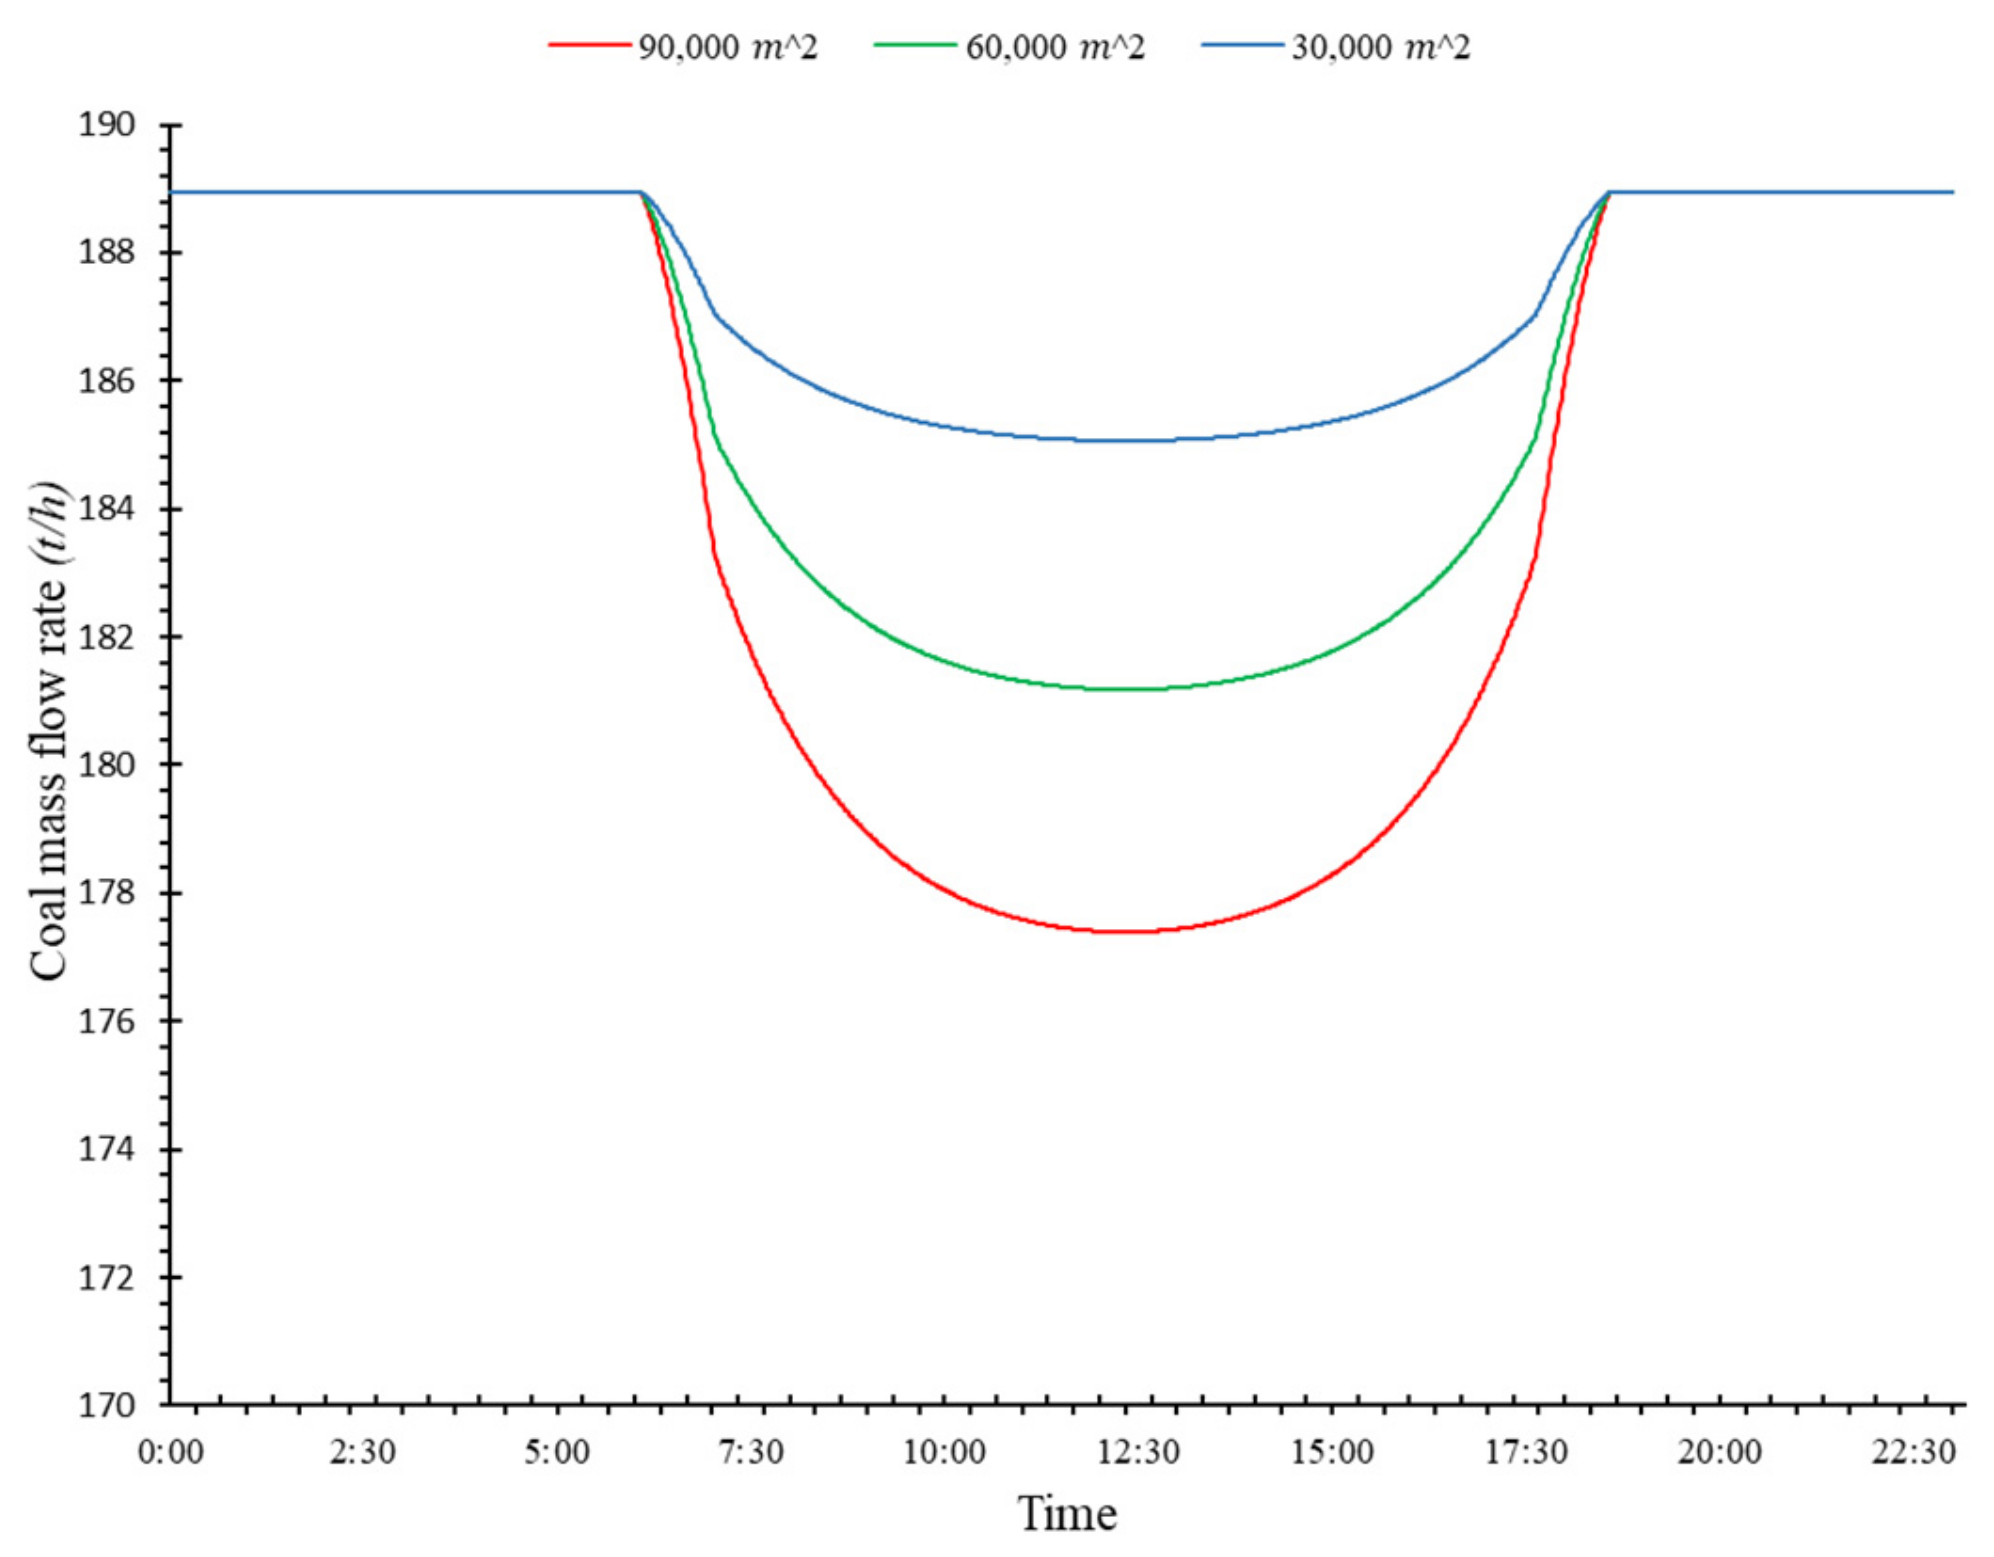
4.3.4. Variation of Coal Consumption Mass Flowrate and Coal Saving per Day
In this section, variations of coal mass flowrate over a day at constant load and different aperture areas and the fuel-saved at a typical day are analyzed as shown in Figure 14, Figure 15 and Figure 16, and Table 4, respectively. It is observed that as DNI increases, coal consumption is decreased. It is observed that a maximum 5% coal saved. As shown in Figure 14, at the design load and 90,000 m2, 60,000 m2 and 30,000 m2 aperture areas the maximum coal consumptions decrease at peak sun hours from 245.238 t/h to 233.46 t/h, from 245.238 t/h to 237.344 t/h and from 245.238 t/h to 241.338 t/h, respectively. As shown in Figure 15, at 75% load from 188 t/h to 177.394 t/h, from 188 t/h to 181.178 t/h and from 188 t/h to 185.064, respectively, and at 50% load from 128 t/h to 117.48 t/h, from 128.829 t/h to 121.07 t/h and from 128.829 t/h to 124.887 t/h as shown in Figure 16, respectively.
4.3.5. Variation of the Plant Thermal Efficiency
As shown in Equation (7) the plant thermal efficiency depends on the net power output, the LHV of coal which is constant, and the mass flow rate of coal. So here, the variations of the plant thermal efficiency depend on the coal consumption rate. In this section, the plant thermal efficiency variations are observed over a day as shown in Figure 17, Figure 18 and Figure 19. It is observed that as DNI increases the plant thermal efficiency also increases because increasing the DNI reduces the coal consumption rate. Furthermore, as the load decreases, the plant thermal efficiency also decreases, but at 90,000 m2 aperture area and 50% turbine load during peak sun hours the plant thermal efficiency is higher than that of 75% turbine load as shown in Figure 18. As at lower load (50%) and higher aperture area more solar effective heat is added in the boiler feedwater by the solar energy and the steam extraction rate reaches up close to zero.
5. Conclusions
In this research, the dynamic performance of solar aided 330 MW coal-fired power plant under fuel-saving mode and at part load conditions with various collector field areas have been analyzed over the full day. Firstly, variation of solar field parameters including HTF (thermal oil) and feed water heated by solar energy are investigated. As DNI increase, the outlet temperature of thermal oil increase, to ensure thermal oil temperature don’t exceed the limit, feedwater started to flow through the solar field and thermal oil through oil/water heat exchanger. It is observed that, at a lower load, the mass flow rate of the thermal oil and the feedwater (heated by solar energy) is more than that of at a higher load.
It is observed that the solar aided coal-fired power plant shows the best result at lower load and large aperture area of the solar field. To maintain thermal oil outlet temperature, all parameters are working at safe ranges. As DNI increases the steam extraction (for FWH#01-03) mass flow rate decreases, at lower loads and higher aperture area, it reaches up to zero at peak sun hours. The behavior of plant thermal efficiency, with variations in turbine load, DNI, and solar collector area are investigated. As a result, the maximum thermal efficiency reaches up to 40%, while the coal consumption rate decreases and the maximum 5% coal would be saved. Obtained results of this study, can provide a valuable reference for the design and operation strategy of the solar aided coal-fired power plants.
Author Contributions
V.K. built all models and calculated results; V.K. and L.D. wrote and revised the manuscript. All authors have read and agreed to the published version of the manuscript.
Funding
This study has been supported by the Science and Technology Projects of State Grid, State Grid Corporation of China (Research on the key technologies of multi-energy complementary distributed energy system).
Institutional Review Board Statement
Not applicable.
Informed Consent Statement
Not applicable.
Conflicts of Interest
The authors declare no conflict of interest.
Nomenclature
| A | Net aperture area (m2) |
| hFWsout | Outlet enthalpy of feed water from oil/water heat exchanger (kJ/kg) |
| hFWsin | Inlet enthalpy of feed water in oil/water heat exchanger (kJ/kg) |
| Incident angle modifier | |
| The mass flow rate of steam at part load (t/h) | |
| The mass flow rate of steam at design load (t/h) | |
| mcoal | The mass flow rate of coal (t/h) |
| mFWSolar | The mass flow rate of feed water going to oil/water heat exchanger (kg/h) |
| Qb | Boiler heat (W) |
| Available solar heat (W) | |
| Solar heat input (W) | |
| Thermal losses of the receivers (W) | |
| Thermal losses of the field piping (W) | |
| Bulk temperature (°C) | |
| difference between the average field temperature and the ambient air temperature (°C) | |
| WT | Total power output (MW) |
| WS | Power generated by the solar energy (MW) |
| Solar effective heat added to feedwater (W) | |
| η | Thermal efficiency of plant |
| ηb | Boiler efficiency (%) |
| Peak optical efficiency (%) | |
| Turbine isentropic efficiency | |
| Reference turbine isentropic efficiency | |
| DNI | Direct normal irradiance (W/m2) |
| LHV | The lower heating value of coal (kJ/kg) |
| HTF | Heat transfer fluid |
| FWH | Feedwater heater |
References
- Mohsin, M.; Kamran, H.W.; Nawaz, M.A.; Hussain, M.S.; Dahri, A.S. Assessing the impact of transition from nonrenewable to renewable energy consumption on economic growth-environmental nexus from developing Asian economies. J. Environ. Manag. 2021, 284. [Google Scholar] [CrossRef] [PubMed]
- Ahmadi, M.H.; Ghazvini, M.; Sadeghzadeh, M.; Nazari, M.A.; Kumar, R.; Naeimi, A.; Ming, T. Solar power technology for electricity generation: A critical review. Energy Sci. Eng. 2018, 6, 340–361. [Google Scholar] [CrossRef] [Green Version]
- Zhai, R.; Li, C.; Chen, Y.; Yang, Y.; Patchigolla, K.; Oakey, J.E. Life cycle assessment of solar aided coal-fired power system with and without heat storage. Energy Convers. Manag. 2016, 111, 453–465. [Google Scholar] [CrossRef]
- Li, J.; Xin, Y.; Hu, B.; Zeng, K.; Wu, Z.; Fan, S.; Li, Y.; Chen, Y.; Wang, S.; Wang, J.; et al. Safety and thermal efficiency performance assessment of solar aided coal-fired power plant based on turbine steam double reheat. Energy 2021, 226, 120277. [Google Scholar] [CrossRef]
- Li, C.; Zhai, R. Exergy and thermo-economic analyses and performance comparison of different solar aided coal-fired power systems. Energy Convers. Manag. 2021, 229, 113758. [Google Scholar] [CrossRef]
- Zhai, R.; Liu, H.; Li, C.; Zhao, M.; Yang, Y. Analysis of a solar-aided coal-fired power generation system based on thermo-economic structural theory. Energy 2016, 102, 375–387. [Google Scholar] [CrossRef]
- Zoschak, R.J.; Wu, S.F. Studies of the direct input of solar energy to a fossil-fueled central station steam power plant. Sol. Energy 1975, 17, 297–305. [Google Scholar] [CrossRef]
- Pai, B. Augmentation of thermal power stations with solar energy. Sadhana 1991, 16, 59–74. [Google Scholar] [CrossRef]
- Ying, Y.; Hu, E.J. Thermodynamic advantages of using solar energy in the regenerative Rankine power plant. Appl. Therm. Eng. 1999, 19, 1173–1180. [Google Scholar] [CrossRef]
- Gupta, M.K.; Kaushik, S.C. Exergetic utilization of solar energy for feed water preheating in a conventional thermal power plant. Int. J. Energy Res. 2009, 33, 593–604. [Google Scholar] [CrossRef]
- You, Y.; Hu, E.J. A medium-temperature solar thermal power system and its efficiency optimisation. Appl. Therm. Eng. 2002, 22, 357–364. [Google Scholar]
- Hu, E.; Yang, Y.; Nishimura, A.; Yilmaz, F.; Kouzani, A. Solar thermal aided power generation. Appl. Energy 2010, 87, 2881–2885. [Google Scholar] [CrossRef]
- Pierce, W.; Gauché, P.; von Backström, T.; Brent, A.C.; Tadros, A. A comparison of solar aided power generation (SAPG) and stand-alone concentrating solar power (CSP): A South African case study. Appl. Therm. Eng. 2013, 61, 657–662. [Google Scholar] [CrossRef]
- Popov, D. An option for solar thermal repowering of fossil fuel fired power plants. Sol. Energy 2011, 85, 344–349. [Google Scholar] [CrossRef]
- Yang, Y.; Yan, Q.; Zhai, R.; Kouzani, A.; Hu, E. An efficient way to use medium-or-low temperature solar heat for power generation–integration into conventional power plant. Appl. Therm. Eng. 2011, 31, 157–162. [Google Scholar] [CrossRef]
- Zhu, Y.; Zhai, R.; Qi, J.; Yang, Y.; Reyes-Belmonte, M.A.; Romero, M.; Yan, Q. Annual performance of solar tower aided coal-fired power generation system. Energy 2017, 119, 662–674. [Google Scholar] [CrossRef]
- Li, C.; Yang, Z.; Zhai, R.; Yang, Y.; Patchigolla, K.; Oakey, J.E. Off-design thermodynamic performances of a solar tower aided coal-fired power plant for different solar multiples with thermal energy storage. Energy 2018, 163, 956–968. [Google Scholar] [CrossRef]
- Duan, L.; Yu, X.; Jia, S.; Wang, B.; Zhang, J. Performance analysis of a tower solar collector-aided coal-fired power generation system. Energy. Sci. Eng. 2017, 5, 38–50. [Google Scholar] [CrossRef]
- Zhu, Y.; Zhai, R.; Yang, Y.; Reyes-Belmonte, M.A. Techno-Economic Analysis of Solar Tower Aided Coal-Fired Power Generation System. Energies 2017, 10, 1392. [Google Scholar] [CrossRef]
- Peng, S.; Hong, H.; Wang, Y.; Wang, Z.; Jin, H. Off-design thermodynamic performances on typical days of a 330 MW solar aided coal-fired power plant in China. Appl. Energy 2014, 130, 500–509. [Google Scholar] [CrossRef]
- Bakos, G.C.; Tsechelidou, C. Solar aided power generation of a 300 MW lignite fired power plant combined with line-focus parabolic trough collectors field. Renew. Energy 2013, 60, 540–547. [Google Scholar] [CrossRef]
- Suresh, M.V.J.J.; Reddy, K.S.; Kolar, A.K. 4-E (Energy, Exergy, Environment, and Economic) analysis of solar thermal aided coal-fired power plants. Energy. Sustain. Dev. 2010, 14, 267–279. [Google Scholar] [CrossRef]
- Mehrpooya, M.; Taromi, M.; Ghorbani, B. Thermo-economic assessment and retrofitting of an existing electrical power plant with solar energy under different operational modes and part load conditions. Energy. Rep. 2019, 5, 1137–1150. [Google Scholar] [CrossRef]
- Rashid, K.; Safdarnejad, S.M.; Ellingwood, K.; Powell, K.M. Techno-economic evaluation of different hybridization schemes for a solar thermal/gas power plant. Energy 2019, 181, 91–106. [Google Scholar] [CrossRef]
- Habib, M.A.; Said, S.A.M.; Al-Zaharna, I. Thermodynamic optimization of reheat regenerative thermal-power plants. Appl. Energy 1999, 63, 17–34. [Google Scholar] [CrossRef]
- EBSILON Professional 14.00. STEAG Energy Services. Available online: http://www.steag-energyservices.com/ (accessed on 24 March 2021).
- Wagner, P.H.; Wittmann, M. Influence of Different Operation Strategies on Transient Solar Thermal Power Plant Simulation Models with Molten Salt as Heat Transfer Fluid. Energy Procedia 2014, 49, 1652–1663. [Google Scholar] [CrossRef] [Green Version]
- Alobaid, F.; Mertens, N.; Starkloff, R.; Lanz, T.; Heinze, C.; Epple, B. Progress in dynamic simulation of thermal power plants. Prog. Energy Combust. Sci. 2017, 59, 79–162. [Google Scholar] [CrossRef]
- Reiner, P.; Tobias, L.; Tobias, H. EbsSolar—A solar library for EBSILON®Professional. In Proceedings of the SolarPACES 2009 Conference, Berlin, Germany, 15–18 September 2009. [Google Scholar]
- Zhang, N.; Hou, H.; Yu, G.; Hu, E.; Duan, L.; Zhao, J. Simulated performance analysis of a solar aided power generation plant in fuel saving operation mode. Energy 2019, 166, 918–928. [Google Scholar] [CrossRef]
- Patnode, A.M. Simulation and Performance Evaluation of Parabolic Trough Solar Power Plants. Master’s Thesis, University of Wisconsin, Madison, WI, USA, 2006. [Google Scholar]
- Bartlett, R.L. Steam Turbine Performance and Economics; McGraw-Hill: New York, NY, USA, 1958; pp. 70–109. [Google Scholar]
- Lohana, K.; Raza, A.; Mirjat, N.; Shaikh, S.; Khatri, S.; Shabbir, W. Techno-Economic Feasibility Analysis of Concentrated Solar Thermal Power Plants as Dispatchable Renewable Energy Resource of Pakistan: A case study of Tharparkar. JEEIT Int. J. Electr. Eng. Inf. Technol. 2021, 4, 35–40. [Google Scholar]
- Dudley, V.E.; Kolb, G.J.; Mahoney, A.R.; Mancini, T.R.; Matthews, C.W.; Sloan, M.; Kearney, D. Test Results: SEGS LS-2 Solar Collector; A technical report; Sandia National Laboratories: Albuquerque, NM, USA, 1994. [Google Scholar] [CrossRef]
- Huang, C.; Hou, H.; Hu, E.; Liang, M.; Yang, Y. Impact of power station capacities and sizes of solar field on the performance of solar aided power generation. Energy 2017, 139, 667–679. [Google Scholar] [CrossRef]
Figure 1.
Schematic diagram of a solar aided coal-fired power plant.

Figure 2.
Logic flow for a SAPG system performance analysis.

Figure 3.
DNI distribution over a year in Thar, Pakistan (W/m2).

Figure 4.
Ambient temperature distribution over a year in Thar, Pakistan.

Figure 5.
DNI distribution of the summer solstice in Thar, Pakistan (W/m2).

Figure 6.
Schematic heat and mass balance diagram of a 330 MW coal-fired power plant.

Figure 7.
Schematic diagram of the solar field.

Figure 8.
Variation of thermal oil inlet and outlet temperature at design point.

Figure 9.
Thermal oil mass flow rate at 90,000 m2, 60,000 m2 and 30,000 m2 collector field area.

Figure 10.
Mass flow rate of feed water heated by solar energy at 90,000 m2, 60,000 m2, and 30,000 m2 collector field area.
Figure 10.
Mass flow rate of feed water heated by solar energy at 90,000 m2, 60,000 m2, and 30,000 m2 collector field area.

Figure 11.
The mass flow rate of steam extraction-01 at 90,000 m2 aperture area.

Figure 12.
The mass flow rate of steam extraction-02 at 90,000 m2 aperture area.

Figure 13.
The mass flow rate of steam extraction-03 at 90,000 m2 aperture area.

Figure 14.
Coal mass flow rate at design load and different aperture area.

Figure 15.
Coal mass flow rate at 75% load and different aperture area.

Figure 16.
Coal mass flow rate at 50% load and different aperture area.

Figure 17.
Plant thermal efficiency at 90,000 m2 aperture area.

Figure 18.
Plant thermal efficiency at 60,000 m2 aperture area.

Figure 19.
Plant thermal efficiency at 30,000 m2 aperture area.


Table 1.
The comparison between the original design and simulation values.
| Parameters | Unit | Design Value | Simulation Value | Relative Error (%) |
|---|---|---|---|---|
| turbine output power | MW | 330.5 | 330.62 | 0.036 |
| main steam flow rate | t/h | 1017.1 | 1017.23 | 0.012 |
| main steam temperature | °C | 538 | 538.25 | 0.046 |
| main steam pressure | MPa | 16.67 | 16.681 | 0.065 |
| reheat steam flow rate | t/h | 882.412 | 882.5 | 0.0099 |
| reheat steam temperature | °C | 538.1 | 538.21 | 0.02 |
| reheat steam pressure | MPa | 3.504 | 3.62 | 3.22 |
| boiler feedwater temperature | °C | 279.4 | 276.9 | 0.9 |
| coal consumption rate | t/h | 244 | 245.238 | 0.5 |
Table 2.
Coal quality is used in the boiler on a dry basis.
| Constituent | Unit | Values (Lower-Moisture) |
|---|---|---|
| Carbon, AR | % | 37.77 |
| Hydrogen, AR | % | 1.91 |
| Oxygen, AR | % | 8.35 |
| Nitrogen, AR | % | 0.25 |
| Sulfur, AR | % | 0.72 |
| Ash, AR | % | 7.0 |
| Moisture, AR | % | 44 |
| LHV | MJ/kg | 12.771 |
Table 3.
Solar field parameters.
| Parameter | Unit | Values |
|---|---|---|
| Collector field area | m2 | 90,000, 60,000, 30,000 |
| Number of collectors | - | 110, 74, 37 |
| Collector length Gross aperture width | m m | 150 5.76 |
| The optical active portion of the aperture | - | 0.9461 |
| Row spacing | m | 17.28 |
| Peak optical efficiency The inlet temperature HTF | % °C | 65 [34] 220 |
| The outlet temperature HTF | °C | 350 |
Table 4.
Coal saving per day.
| Area | Unit | Design Load | 75% Load | 50% Load |
|---|---|---|---|---|
| 90,000 m2 | kg/day | 118,757 | 115,658 | 112,724 |
| 60,000 m2 | kg/day | 79,890 | 77,777 | 77,353 |
| 30,000 m2 | kg/day | 39,944 | 38,873 | 38,289 |
Publisher’s Note: MDPI stays neutral with regard to jurisdictional claims in published maps and institutional affiliations. |
© 2021 by the authors. Licensee MDPI, Basel, Switzerland. This article is an open access article distributed under the terms and conditions of the Creative Commons Attribution (CC BY) license (https://creativecommons.org/licenses/by/4.0/).
Share and Cite
MDPI and ACS Style
Kumar, V.; Duan, L. Off-Design Dynamic Performance Analysis of a Solar Aided Coal-Fired Power Plant. Energies 2021, 14, 2950. https://0-doi-org.brum.beds.ac.uk/10.3390/en14102950
AMA Style
Kumar V, Duan L. Off-Design Dynamic Performance Analysis of a Solar Aided Coal-Fired Power Plant. Energies. 2021; 14(10):2950. https://0-doi-org.brum.beds.ac.uk/10.3390/en14102950
Chicago/Turabian StyleKumar, Vinod, and Liqiang Duan. 2021. "Off-Design Dynamic Performance Analysis of a Solar Aided Coal-Fired Power Plant" Energies 14, no. 10: 2950. https://0-doi-org.brum.beds.ac.uk/10.3390/en14102950
Note that from the first issue of 2016, this journal uses article numbers instead of page numbers. See further details here.