
An IoT-Based Smart Building Solution for Indoor Environment Management and Occupants Prediction


1
Department of Electrical and Electronic Engineering, University of Cagliari, 09123 Cagliari, Italy
2
National Inter-University Consortium for Telecommunications, University of Cagliari, 09123 Cagliari, Italy
3
Department of Computer Science and Engineering, University of Bologna, 40126 Bologna, Italy
*
Author to whom correspondence should be addressed.
Energies 2021, 14(10), 2959; https://0-doi-org.brum.beds.ac.uk/10.3390/en14102959
Submission received: 19 April 2021
/
Revised: 13 May 2021
/
Accepted: 17 May 2021
/
Published: 20 May 2021
Abstract
:Smart buildings use Internet of Things (IoT) sensors for monitoring indoor environmental parameters, such as temperature, humidity, luminosity, and air quality. Due to the huge amount of data generated by these sensors, data analytics and machine learning techniques are needed to extract useful and interesting insights, which provide the input for the building optimization in terms of energy-saving, occupants’ health and comfort. In this paper, we propose an IoT-based smart building (SB) solution for indoor environment management, which aims to provide the following main functionalities: monitoring of the room environmental parameters; detection of the number of occupants in the room; a cloud platform where virtual entities collect the data acquired by the sensors and virtual super entities perform data analysis tasks using machine learning algorithms; a control dashboard for the management and control of the building. With our prototype, we collected data for 10 days, and we built two prediction models: a classification model that predicts the number of occupants based on the monitored environmental parameters (average accuracy of 99.5%), and a regression model that predicts the total volatile organic compound (TVOC) values based on the environmental parameters and the number of occupants (Pearson correlation coefficient of 0.939).
1. Introduction
It is a matter of fact that around 40% of the energy use worldwide is consumed by buildings to provide building occupants with healthy and comfortable indoor environments to live and work in, as they spend more than 90% of their time indoors [1]. For this reason, in recent years, there has been a significant increase in the development of smart building (SB) control systems, which aim to connect the monitored environment variables (e.g., temperature, humidity, luminosity, and air quality) with building management systems (e.g., heating, ventilation, and air-conditioning (HVAC) system, lighting system) to optimize the indoor environmental state of the building [2,3]. However, these systems also need to know building occupancy information, as this has a fundamental role in determining efficient control decisions. The occupancy presence information, in fact, is very important for several reasons [4]: (i) air conditioning: the number of occupants (as well as their preferences) determines the operation time and temperature setting of HVAC systems; (ii) air quality: due to the COVID-19 pandemic, there is now more than ever the need to monitor the indoor air quality and to provide a healthy environment that protects occupants from being infected; (iii) lighting: occupancy information regulates the operation time and the intensity of indoor lighting systems; (iv) security: the information regarding the presence and distribution of people in buildings is vital for security management systems, such as in case of emergency evacuation.
Thus, the monitoring of the occupancy presence information enables the SB solutions to save energy and provide a healthy environment. Energy consumption is, in fact, strictly dependent on the number of occupants and their behavior [5]. Energy savings can range from 10% to 40% when HVAC systems are controlled based on occupancy information [6,7,8], whereas lighting systems can potentially save up to 75% [9]. On the other hand, a healthy environment depends on the air quality, which is typically estimated using CO sensors and volatile organic compound (VOC) sensors. These sensors measure the concentrations of CO and of gaseous material in the built environment, respectively. A frequent air exchange rate is then needed to keep the optimal level of air quality in the environment, which also helps to reduce the COVID-19 infection risk in the building [10]. Although increasing the fresh air flow rate would result in higher HVAC energy consumption, a compromise must be found by the SB system to provide an environment that considers both the health and the comfort of the building occupants.
SB solutions rely on a combination of well-established and emerging information and communication technologies (ICT), such as wireless networks, Internet of Things (IoT) and cloud computing. The IoT is a network of physical objects uniquely addressable that exchange data based on standard communication protocols [11]. With IoT-based solutions, different kinds of sensors can be used to measure the needed indoor parameters of the building, such as the aforementioned temperature, luminosity, occupancy, and energy consumption [12]. The collected information is then transmitted, typically by means of wireless networks, towards cloud software platforms, which play a vital role in the exchange, storage and dissemination of data across a heterogeneous plethora of different protocols. Due to the huge amount of data generated by the SB sensors, data analytics and machine learning (ML) techniques are needed to extract useful and interesting insights into user context and building health and can be used to design SB management [13]. Finally, cloud platforms offer a variety of different building applications, such as occupants’ health and comfort, entertainment, energy efficiency and safety [14].
Although many SB systems are proposed in the literature, the majority of these proposals are based on vertical solutions that do not foster adequate interoperability between systems as well as a dynamic integration of different hardware devices to contribute to the SB management logic. Therefore, in order to cope with the aforementioned building objectives and to overcome the drawbacks of existing solutions, in this paper, we design a full-stack IoT-based horizontal solution, which considers all the levels of the IoT architecture, from the hardware devices to the cloud platform, with the final objective of providing SB applications that support the building management so as to provide the occupants with a healthy and comfortable environment. Differently from the SB solutions presented in the literature, our proposed system is easily expandable with different kinds of hardware devices (e.g., sensors, cameras, low-cost electronic boards), which can cooperate in the logic of the system thanks to virtualizations, able to socialize with each other and to guarantee flexibility, trustworthiness and privacy [15]. Thus, the proposed platform enables the interoperability among different sensors and provides greater flexibility thanks to its capability of implementing modular services aimed at specific objectives. Furthermore, these services support the implementation of data aggregation and data analysis operations that can run ML algorithms to analyze the data acquired by the building sensors and extract information useful for building management.
In this paper, as a practical use-case, we particularly focus on the investigation of the relationship between the indoor environmental state of the building and the building occupancy information. Specifically, the proposed IoT-based SB solution aims to provide the following main functionalities:
- Permits the dynamic utilization and management of low-cost hardware devices (e.g., sensors and electronic boards), which sense and collect the building parameters. In this case, we equipped a Raspberry Pi 3 with a camera and several environmental sensors, i.e., temperature, humidity, luminosity, and air quality.
- Monitors the building occupancy information. To this, we implemented a light neural network for object detection in the Raspberry, which counts the number of room occupants.
- Implements a cloud platform where virtual entities collect the data acquired by the sensors and modular virtual super entities perform data analysis tasks using ML algorithms. These functionalities enable the analysis of the collected data and the implementation of an ML-based service that predicts the presence of occupants based on the monitored environmental parameters.
- Presents a control dashboard for the management and control of the building environment.
The paper is structured as follows. Section 2 discusses the major related works in this area. In Section 3, we describe the proposed smart building system, whereas Section 4 presents the data collection process. In Section 5, we provide experimental results to present the potentialities of the ML-based data analysis module of the proposed SB system. Finally, Section 6 concludes the paper.
2. Related Work
With the explosion of IoT solutions and applications, there has been a rapid evolution of home automation applications with a progressive increase in the size of automated environments, going from the living room to the apartment, passing through entire buildings and ending up in the broader scenario of smart cities.
For more than two decades, the word “smart buildings” has been used to describe the idea of building networking systems and infrastructure, as well as energy efficiency. Today, the smart building concept extends the past concept of energy-efficient PC controlled system by adding subsystems for managing and controlling renewable energy sources, house appliances and energy consumption using most often a wireless communication technology [12]. IoT offers new forms of services to all in order to enhance daily life. Since the devices interact with others, work independently, and report measurements and data, it becomes smarter. “Big Data” is a term used to characterize the massive volumes of data collected by all of these interconnected machines (BD). IoT-Big Data is the most common form of BD. In the following, the most relevant smart building solutions will be shown and how the research explored the use of machine learning tools in this application scenario.
2.1. Smart Devices and Software Platforms for SB
Smart buildings can communicate with both their internal devices and appliances as well as their surroundings thanks to information and communication technologies. They will also react to grid conditions and interact with other systems, resulting in active microgrids. In general, the smart building consists of: sensors that monitor conditions and send alerts if anything changes; actuators that act physically; controllers based on user-set scheduled rules; the central unit allows the system’s devices to be programmed; a user interface with the system. Building automation is made up of sensors, actuators, controls, a core unit, and interfaces with network architecture. Energy storage and limited renewable energy sources are used in the smart energy house, in addition to the previously listed elements. An SB is thus the convergence of a broad variety of systems and facilities into a single framework, including systems for energy storage, surveillance systems for the environment, access control systems, safety, control of lighting, telecommunications, office automation, indoor localization, maintenance systems and expert systems [12].
Dong et al. [3] present a systematic review regarding the influence of indoor sensors in managing optimal energy-saving, thermal comfort, visual comfort, and indoor air quality in the built environment. A framework for IoT environments is described by Choubey et al. [16], which is based on localized data processing and decision making. Efficient management is provided by this framework for the local sensor network. The proposed master unit makes a collection of data from the network of the installed sensors that were located in various places within and around the house and intelligently identifies the dependencies among them. Furthermore, with the aim of extracting knowledge locally, the sensors are turned on in real-time in order to minimize the redundancy in usage and power consumption. Lilis et al. [17] discuss the advantages and disadvantages of a completely IoT powered and controllable intelligent building over well-established and legacy automation systems are fairly and transparently assessed. This paper presents an interoperable intelligent building architecture for the construction of innovative building management schemes using existing automation tools and new developments. Moreno et al. [18] proposed a building energy-saving approach with the aim of generating statistical models of building energy usage. Furthermore, in order to validate the suggested solution, the authors used a reference building for which they have one year of coherent data. Finally, the writers report energy-saving measures and control strategies for the home. Moreno et al. [19] describe an indoor localization scheme for a smart home. Various facilities are offered to the building’s community in this building, such as alternatives to energy use problems. The authors also present a mechanism that uses radio frequency detection and infrared data to provide solutions to localization requirements. Finally, the results of the calculation are extremely precise when it comes to user position data. As a result, they provide a low-cost approach for atmospheric adaptation based on human activity.
For a building to be “smart”, it is important that all devices and systems in the building communicate and exchange data securely with each other and with the occupants’ smartphones, tablets and wearables. Software platforms play a vital role in the exchange, storage and dissemination of information across a heterogeneous plethora of different protocols. The goal of many SB stakeholders is to develop open-source software platforms to make the data exchange process between devices from different manufacturers easier. Therefore, users will not have to worry about compatibility issues in the future when using electrical and electronic devices from different manufacturers in the home. Furthermore, the software platform can also offer a variety of different building services such as entertainment, energy efficiency and safety [14].
Residents may use Indigo Domotics [20] to build a do-it-yourself framework for SB. Indigo home automation software modules enable residents to monitor the building’s lights, sensors, thermostats, and appliances using a variety of INSTEON, Z-Wave, and X10 systems. Indigo allows users to access their equipment remotely from a smartphone or a web browser. Users may collect text messages or e-mails about incidents, such as door opening/closing, power outage, and so on. SmartThings [21] is a platform that brings together hardware, sensors, and software apps. Sensors gather background data that are used to guide the reasoning and behavior taken by the system. The sprinkler in the yard, for example, will feel rain and switch off to conserve water. Sensors, mobile cameras, and hubs are included in the SmartThings pack. The SmartThing hub, which links sensors, building equipment, and the cloud, is part of that system. It works with a variety of networking protocols, including Zigbee, Z-Wave, and Wi-Fi. SmartThings also works with other sensors and systems, including thermostats, temperature sensors, and motion sensors. Microsoft’s HomeOS [22] platform can be installed on a PC. It is an open platform that is not restricted to Windows-based computers. Installing applications for various automation purposes, such as taking an image from a door camera and sending it to the resident when the doorbell rings, is possible with the HomeOS platform. HomeOS is usually installed on a device that serves as a home hub. HomeOS makes use of Datalog-based access control to simplify smart home security and protocol-independent services to provide developers simple access to devices. The Lab of Things (LoT) [23] is an SB experimental framework for connected devices. The platform, in conjunction with HomeOS, is intended to make it easier to design applications for IoT-based intelligent services, such as healthcare and energy management. LoT provides a platform that includes functions like remote control and upgrading of system, as well as logging data obtained from various devices to cloud storage. It enables data exchange and collection, code sharing, sensor connection to the software platform, and user interaction with HomeOS. OpenHAB [24] is an open-source development platform for integrating diverse technologies in SB using a middleware approach. In the SB scenario, the OpenHAB platform supports a wide range of networking technologies and devices. Due to the lack of a standard protocol that requires multiple devices to communicate with the building automation system, reliance on a specific vendor has become a challenge. The OpenHAB platform’s key aim is to use a community-based approach to incorporate new devices and software into an SB framework. For collaboration between various communication technologies and computers, OpenHAB employs an OSGi-based modular framework. There are plenty of supported technologies, such as EnOcean, KNX, Z-Wave and others, that are supported through special bindings [25]. Eclipse Smarthome [26] is an SB framework that works on heterogeneous ecosystems like smart buildings and assisted environmental living. This platform takes a number of current communication protocols into account. Eclipse SmartHome is a framework for abstraction and translation that allows collaboration across device and protocol boundaries. It includes a number of useful plugins, protocols, and specifications for SB applications. The framework is compatible with a variety of embedded devices, including the BeagleBone Black, Intel Edison, and Raspberry Pi. Eclipse SmartHome extensions are compliant with a variety of vendors’ implementations. This means the code created for a particular use can be conveniently ported to consumer platforms.
As shown above, there is an exhaustive state-of-the-art on vertical solutions in the SB scenario accompanied by several commercial solutions. The major problem of these platforms is that this verticality does not allow adequate interoperability between systems, while many mobile sensors owned by users, such as wearables and smartphones, cannot be easily and dynamically integrated into the SB management logic. Moreover, the fact that objects brought by visitors or building dwellers can be dynamically integrated into the sensor network raises issues relating to the reliability and privacy of the information produced. To address these issues, the proposed solution uses a Social Internet of Things architecture based on virtualization of aggregated devices and is described in detail in Section 3.
2.2. ML Tools for SB
The huge amount of data generated by sensors, wearables and other IoT technologies provides insights into user context and building health and can be used to design SB management. This background information is needed to extract useful and interesting insights for various stakeholders. When the volume of data is very high, developing predictive models using traditional approaches does not provide accurate information and we need newly developed tools from Big Data. In the case of Big Data, ML is a powerful tool that facilitates the process of extracting and understanding the huge amount of data that has been collected from the different sources around us. ML algorithms apply a recognition model to new data after learning from a series of observed data examples. ML makes it relatively easy to develop advanced software systems without much human involvement. They are applicable to many real-life problems in SB environments. ML algorithms can be used to make predictions based on data models. In this way, the computer is able to learn from the input data without being explicitly programmed [27].
ML techniques have been widely used to develop intelligent systems capable of detecting and reacting to changes in the context of SBs [28]. Primarily, ML falls into four categories based on the different types of learning activities: supervised learning, unsupervised learning, semi-supervised learning, and reinforcement learning (RL) algorithms. Altun et al. [29] made a comparative study on approaches to classifying human activity under supervision using inertial and magnetic sensors worn on the body. Delgado et al. [30] proposed an algorithm based on decision trees to extrapolate the most frequent activities of human behavior and the temporal correlation of these activities in order to rapidly predict human behavior. An indoor localization approach is discussed by Parnandi et al. [31], which is based on naive Bayes classification and dynamic time warping. The authors exploited the sensors present in smartphones to determine the building in which the user has entered and the activities that the user is carrying out inside of the building. Bayes naive classifiers have been applied with appreciable results for the recognition of human activity [32,33]. Fu et al. [34] make use of a support vector machine (SVM) to predict the electricity loads of public buildings that have electricity metering systems. Nguyen et al. [35] proposed a real-time human tracking system using SVM to predict and recognize human movement based on images input from a network of cameras. An SVM model to predict when people might be present in the home using the data provided by motion sensors in each room was developed by Petersen et al. [36]. Fleury et al. [37] presented a study for automatic recognition of daily activities in a smart home based on SVM. They collected data from various sensors such as infrared occupancy sensors, door contacts, temperature and hygrometry sensors, and microphones.
Deep learning (DL) includes a category of ML methods that are based on artificial neural networks (ANNs). A deep neural network (DNN) is an ANN with multiple layers between the input and output layers, which is widely used to perform challenging tasks, such as time series forecasting and pattern recognition. Zhao et al. [38] proposed an SVM and recurrent neural network (RNN)-based approach to determine a building occupancy pattern through information on temperature and heat source for energy efficiency consumption purposes. A hybrid approach is presented by Bourobou et al. [39], which is based on ANN and K-pattern clustering to identify and predict user activities in smart environments. Badlani and Bhanot [40] developed a smart home system for energy efficiency by applying RNN-based pattern recognition to determine patterns of human behavior. Other researchers have applied ANN to offer context-based services. Ciabattoni et al. [41] proposed a home energy management system using ANN to predict the energy production of the photovoltaic system and household consumption. Ordóñez and Roggen [42] suggested a DL algorithm for human activity detection that is appropriate for multimodal wearable sensors, such as accelerometers, gyroscopes, and magnetic field sensors. The DL algorithm is built on convolutional neural networks (CNNs) and RNNs. An acceleration-based method of recognizing human activity by using CNNs is discussed by Chen and Xue [43], whereas a CNN-based system is presented by Ronao and Cho [44] as an automatic feature extractor and classifier for the recognition of human activities using the accelerometer and gyroscope of a smartphone. An IoT framework is implemented by Hitimana et al. [45] to capture indoor environmental parameters, i.e., temperature, humidity, lighting conditions, CO, and occupancy. Occupant detection is estimated through a passive infrared proximity sensor (motion sensor). The authors developed a method to predict room occupancy using a long short-term memory (LSTM) DL algorithm that uses the measured indoor parameters as the known variables.
The aforementioned DNN-based methods, thanks to their deep architecture, can reach exact forecasts at the expense of a high computational cost. Thus, these networks require to be executed on high-quality hardware to maintain good performance during the training phase and the inferring phase. Saha et al. [13] analyzed the various prediction models and neural networks of the state-of-the-art for the building occupancy prediction. Different approaches are evaluated using a three-level scale (i.e., low, medium and high) in terms of data requirement, cost/time to deploy, model flexibility, robustness and existing applications. From the paper results, even if many applications adopt the DNNs, the deploying cost and time as well as the data requirement obtained the highest evaluation for the DNNs because their structure is complicated and needs a large amount of data and a long training session for achieving excellent results. For these reasons, in this paper, we adopted medium-cost computational models (i.e., the bagged tree and the Gaussian process regression) to predict the occupancy state of the room and the TVOC based on the monitored environmental parameters. This approach enabled us to train the models on a medium-performance hardware, with a dataset collected in 10 days, obtaining the occupancy and TVOC prediction results in real-time with good accuracy. Moreover, the advantage of these models is that, once trained, they can be executed even on low-cost hardware, such as the Raspberry.
3. Smart Building System
The proposed smart building (SB) system has been developed with the objective of providing the following main functionalities:
- Autonomous measurement and monitoring of the room environmental parameters, namely, temperature, humidity, luminosity, total volatile organic compound (TVOC), and equivalent carbon dioxide (eCO).
- Autonomous and automatic detection and count of the number of people (occupants) inside the monitored rooms.
- Control dashboard for the management of the building.
- Data analytics and statistics regarding the environmental parameters of the monitored building rooms.
- ML-based models for the prediction of the number of occupants and of the TVOC concentration in the room.
The architecture of the proposed SB system is shown in Figure 1, and it is based on the Lysis architecture [46] as the IoT environment since it provides several advantages, such as high scalability due to the exploitation of the social IoT paradigm, high flexibility, and easy upgradability thanks to the complete virtualization of the physical devices. The architecture is divided into four levels: the Hardware level includes the physical devices that acquire the data from the real world, whereas the Virtualization, Aggregation and Application levels regard the software platform and services that are developed in the cloud and allow for processing, managing and visualizing the data.
In the following, we provide a detailed description of each level of the architecture.
3.1. Hardware Level
The Hardware level includes all sensors and devices that acquire information within the room as well as the concentrators that collect and transmit the data to the upper levels. In particular, the following physical devices belong to the Hardware level:
- Temperature and humidity sensor: measures the temperature and humidity values in the room. We used the DHT11 sensor, which can measure the temperature and the humidity within the range (0 C, 50 C) ± 2 C and (20%, 90%) ± 5%, respectively.
- Luminosity sensor: measures the ambient light of the room. We used the VEML7700 sensor, which measures the ambient lighting in lux. The sensor has 16-bit dynamic range for ambient light detection from 0 lux to about 120 klux with resolution down to 0.0036 lx/ct.
- Air quality sensor: measures the air quality of the room. We used the CCS811 sensor, which measures the total volatile organic compound (TVOC) concentration and the equivalent carbon dioxide reading (eCO) concentration.
- Obstacle sensor: detects the presence of any obstacle in front of the sensor. We used an infrared (IR) obstacle avoidance sensor, which has a built-in IR transmitter and IR receiver that sends out IR energy and looks for reflected IR energy to detect the presence of any obstacle in front of the sensor within the range (2, 40) cm. It is used to detect when the window is open/closed.
- Camera: takes photos of the room, which are processed to count the number of people in the room. We used the Logitech C920 HD Pro webcam, which provides high-resolution images needed by the people counting algorithm.
- Concentrator: collects the data acquired by all sensors and the camera, which is then transmitted to the upper level using the Wi-Fi interface. We used the Raspberry Pi 3 Model B. The sensors are connected using the I2C interface, whereas the camera uses the USB port. The people counting algorithm is run by the Raspberry, which processes the photos taken by the camera to count the number of people in the room.
The sensors and the Raspberry Pi were bought from the adafruit online store (https://www.adafruit.com/) whereas the camera was bought from the Logitech online store (https://www.logitech.com).
3.2. Virtualization Level
At the Virtualization level, a social virtual object (SVO) room is created, which virtualizes the monitored room. A dedicated SVO can be created for each different room of the building to be monitored. An SVO is an autonomous web service that acts as a virtualization of the physical device with which it interfaces directly with REST APIs. The SVO represents the device with all its features and functionalities. In this case, the SVO Room receives (periodically) from the Concentrator (Raspberry) in the monitored room the information regarding: number of people in the room, sensors’ measurements (temperature, humidity, luminosity, TVOC, eCO, state of the window (open/closed)), and timestamp. The SVO stores these data and makes them available to the upper levels.
The Virtualization level fully implements the Social IoT (SIoT) paradigm through device virtualization [47]. Indeed, the fact that the SVOs can create social relationships allows the creation of a distributed system based on a social network that can be explored through the social connections between the various SVOs. These relationships can then be exploited to search for data for statistical analysis regarding the monitored rooms. For example, all SVOs belonging to the same building can create a social relationship (friendship), which can be exploited by the upper levels to access the SVOs data to compute aggregate statistics. Furthermore, the utilization of the virtual counterparts allows the implementation of the majority of the logic outside of the physical devices, which helps to save on the energy consumption of the battery. It also allows for an easier integration of other elements in the architecture, which are therefore able to connect through other social relationships and immediately usable by the upper levels thanks to the hardware abstraction. Moreover, all SVOs expose uniform APIs to the upper levels, which permit modifying the application that uses their data or adding new ones without having to change the software on the devices.
3.3. Aggregation Level
At the Aggregation level, super entities called micro engines (MEs) are implemented, which are a composition of more than one SVO. The ME has the capability of inheriting and increasing the functionalities and capabilities of the SVOs of which it is composed. Furthermore, ML algorithms can be implemented in MEs to perform data aggregation and data processing operations on the SVOs’ data. An example of operation that can be performed by MEs is the provision of statistical analysis of aggregated data collected by SVOs regarding the measured sensors’ data within different rooms of the building. This information may concern, for example, the average and extreme (minimum and maximum) values of temperature, humidity, luminosity and air quality collected during the day; the relationship between the air quality and the number of people in the room; the air quality variation when the window is open/closed, etc. The analysis of these data can be utilized to monitor the ambient quality within the room. In Section 5, we present a practical example of the potentialities of the data analysis ME.
3.4. Application Level
Finally, at the Application level, the management platform supports the control dashboard for the management of the SB system. The management platform includes all back-end services needed to manage the data collected by the lower layers, e.g., the database, whereas the control dashboard acts as the front-end application for administrators for managing the SB service and monitoring the room environmental parameters in real-time.
The control dashboard has been implemented adopting Google Cloud as the hosting service, which gives robustness and efficiency, and Python as the programming language for easier and faster implementation. The dashboard menu includes three main views, which have been implemented using Jinja2, JavaScript, HTML and CSS to connect the back-end to the front-end and to display the data. The dashboard follows the rules given by the model view control (MVC) pattern.
The three main views are the following:
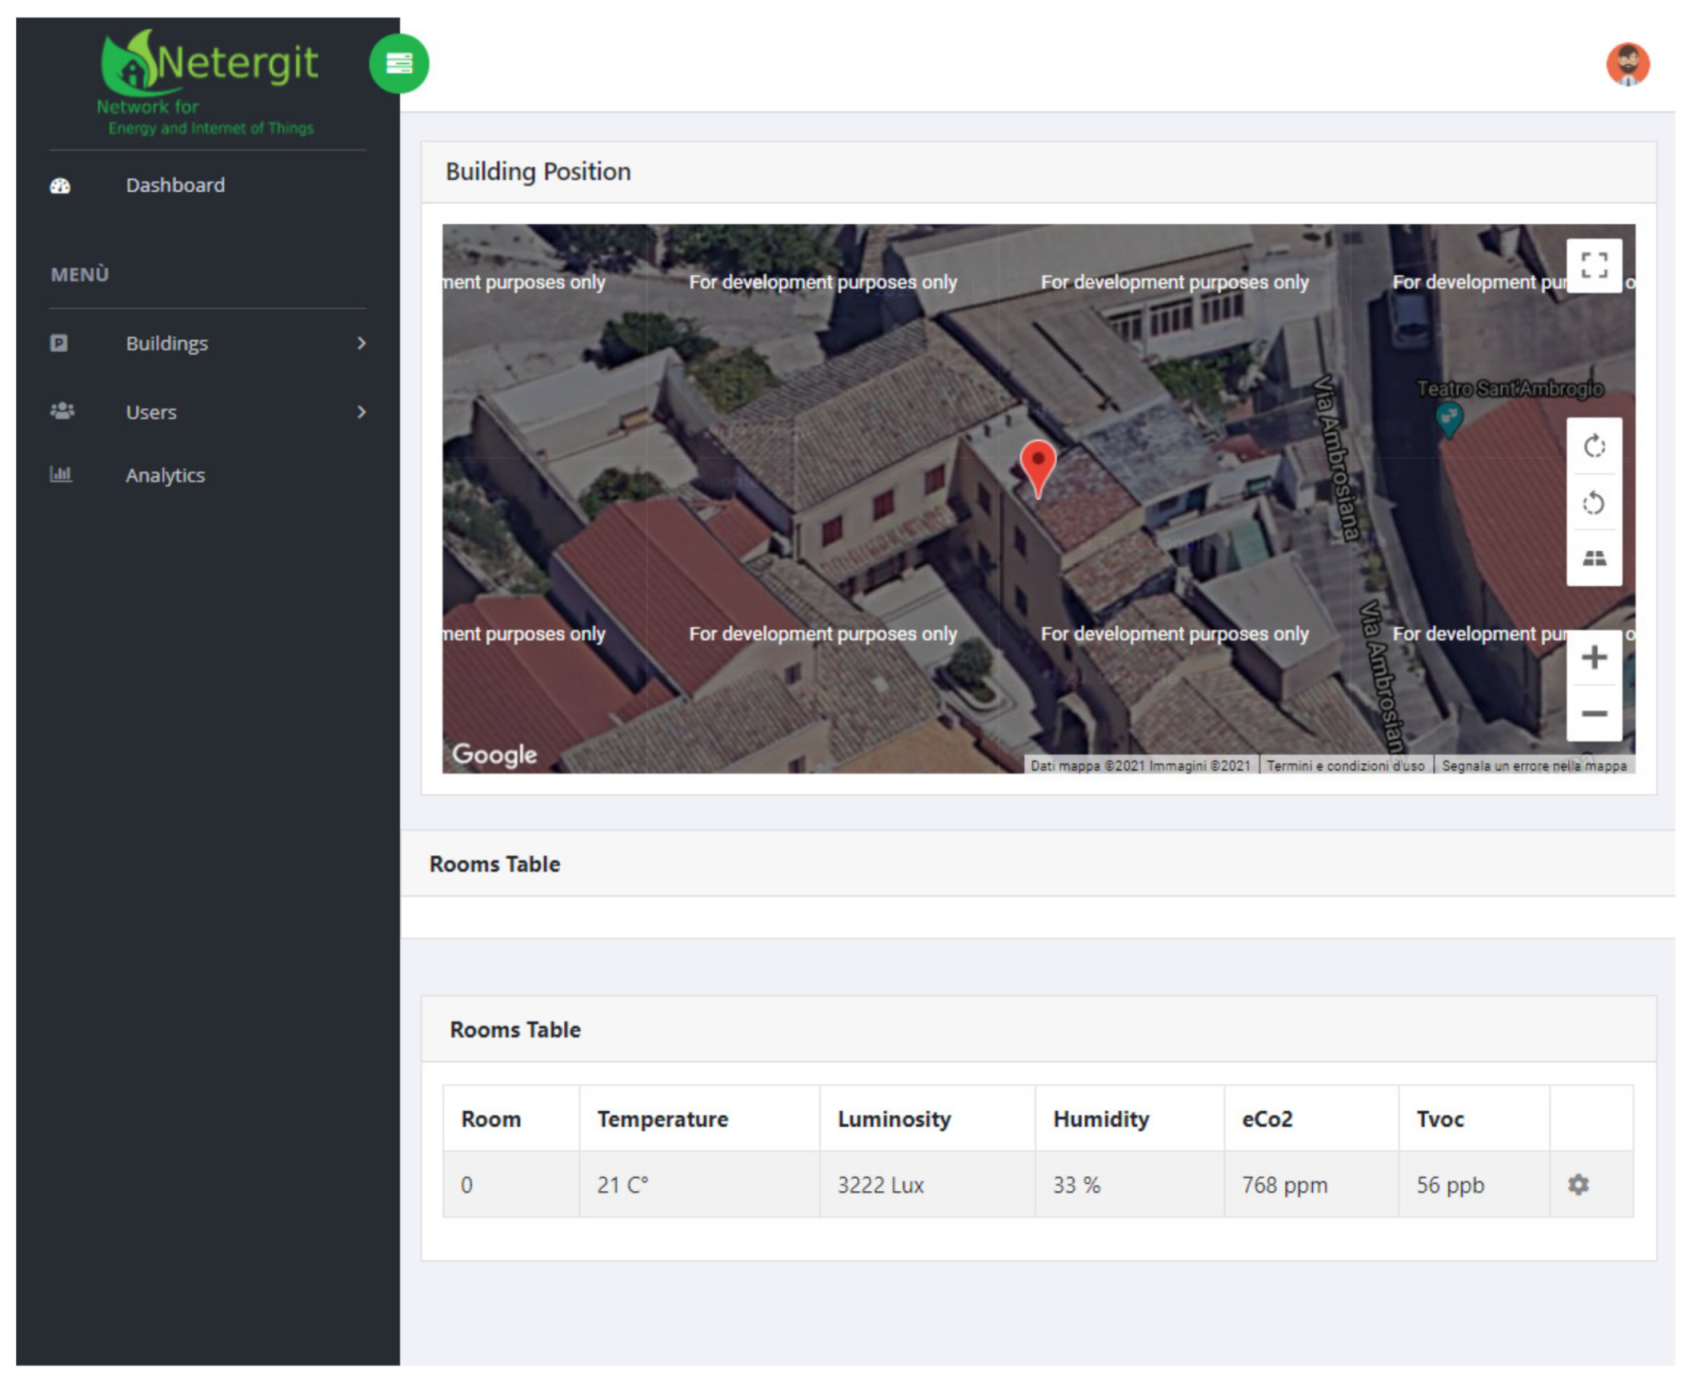
- Buildings: it shows the building card information of the monitored buildings. As an example, Figure 2 shows the building “Simone House”. Opening the building card, the administrator can check the rooms’ environmental parameters inside the building and manage them. The position of the building is also displayed in a map at the top of the view, whereas at the bottom, the table with the monitored environmental parameters is shown. Figure 3 illustrates an example of the monitored room. The sidebar’s building tab includes a sub-menu composed of the “Building Management” tab and the “Add Building” tab.
- Users: it shows the list of all users registered to the SB service. This section allows the administrators to add and manage the users.
- Analytics: it shows the analytics of the monitored rooms inside the building.
4. Data Collection
In this section, we describe the data collection process. A Raspberry Pi 3 Model B was equipped with the camera (Logitech C920 HD Pro), the obstacle sensor and the considered indoor environmental sensors, namely, temperature and humidity (DHT11), luminosity (VEML7700), eCO and TVOC (CCS811). The Raspberry was set to collect each 15 min the sensors’ measurements and the photo taken by the camera. The photo was analyzed to detect the number of people in the room. The number of occupants, together with the sensors’ readings, were then sent through the Wi-Fi connection to the cloud platform and, in particular, to the SVO Room.
The data collection lasted for 10 days. The total number of collected data samples was 960. Each sample contains the following data: timestamp, number of occupants, temperature, humidity, luminosity, TVOC, eCO and state of the window (open/closed). After preprocessing, some samples were removed because some data were corrupted and some sensor readings failed. The final dataset included 788 samples. The maximum number of contemporaneous occupants in the room during the data collection period was 5.
The camera was placed in a strategic position to capture the presence of people in the room. We implemented in the Raspberry the Yolo v4 tiny model [48], which is a light neural network for object detection. This model was used by Bouian et al [49] for pedestrian detection in a crowded environment, obtaining a mean precision value of 68.4%. Since the room environment is much less complex than the street, we decided to apply this model for analyzing the room photos captured by the camera with the aim of counting the number of occupants. To verify the reliability of this model, one of the authors was present in the monitored room during the data collection period to check whether the number of occupants detected by the model was correct. It resulted that the model detected correctly the number of occupants 100% of the time.
5. Data Analysis ME
The data collected by the SVO Room can be accessed by the data analysis ME, which provides the means to conduct statistical analysis on the data as well as to build ML-based algorithms. We present the results of the analysis of variance (ANOVA) in Section 5.1, and we propose a TVOC prediction model and a room occupancy prediction model in Section 5.2.
5.1. ANOVA
ANOVA was used to analyze the differences among means of different populations of data related to the same observation. In this case, the objective is to investigate the existence of significant differences among the collected distribution of observed parameters. In particular, we first computed the one-way ANOVA between the set of observed parameters (number of occupants, window status, and time) and the measured indoor environmental parameters (TVOC, eCO, temperature, humidity, and luminosity). Table 1 shows the one-way ANOVA results in terms of F-statistic and p-value. We have not reported in this table the results for the luminosity because for this parameter, the null hypothesis was always satisfied. This means that time, number of occupants and window state have no correlation with the luminosity in the room.
The means of the time and all the environmental parameters are significantly different (), which means that these parameters vary during the day. The means of the window state and all the environmental parameters are significantly different (), which means that the fact that the window is open or closed has a relevant impact on the monitored environmental parameters. This dependency is stronger than that observed between the time and the environmental parameters, since the F-statistic values computed for the window state are greater. Finally, the means of the number of occupants and three out of four environmental parameters are significantly different (). The humidity is the only parameter whose means are not significantly different. This means that the number of occupants in the room influences a relevant change in the values of temperature, eCO and TVOC in the room, whereas the humidity is not affected by the presence of a different number of people in the room.
Moreover, we computed the n-way ANOVA, where n is the number of independent variables, by considering the impact of the combination of the number of occupants with the window state on the environmental parameters. The n-way ANOVA results are shown in Table 2 and confirm the results obtained with the one-way ANOVA. Indeed, the means of the combination number of occupants, window state and all the environmental parameters are significantly different (), which means that these parameters are influenced by both the number of occupants in the room and the fact that the window is open or closed.
5.2. Prediction Models
In the proposed SB system, we used a camera to count the number of occupants in the room. However, the utilization of the camera may not preserve the privacy of the people if the image acquisition process is not adequately designed and implemented (risk of the man in the middle attack). For this reason, we built a classification model to predict the number of occupants based on the values of the monitored environmental parameters, i.e., temperature, eCO, window state, luminosity, and TVOC. We have not considered the humidity as from the ANOVA, it resulted that this parameter is not correlated with the number of occupants in the room. The classification model was built training a bagged tree model using the 5-fold cross-validation with a 70%/30% training/validation combination. The model reached an average accuracy of 99.5%, as well as a specificity of 99% and a precision of 99%. The accuracy of predicting a precise number of occupants in the room is provided in Table 3.
Furthermore, we built a model to predict the TVOC concentration, which is demonstrated to have a strong negative influence on human health. Indeed, Manisalidis et al. [50] described the severe conditions that high values of TVOC can provide to humans, such as irritation, dryness, weak inflammatory irritation in the eyes, nose, airways and skin. Living in the current pandemic period, these are typical symptoms of COVID-19. Therefore, the monitoring of the TVOC values inside the room is very important to avoid occupants that feel symptoms related to the COVID-19 virus as well as to preserve the occupants’ health.
For these reasons, we built a Gaussian process regression (GPR1) model to predict the TVOC values based on the values of the following parameters: temperature, humidity, luminosity, window state and number of occupants. The GPR1 model was trained using the 5-fold cross-validation with a 70%/30% training/validation combination. The model achieved a root mean square error (RMSE) value of 290 and a Pearson correlation coefficient (PCC) of 0.939. The correlation value is very good, which means that the predicted data are very well correlated with the sensor data. However, the RMSE value is quite high, which does not allow predicting the precise value of the TVOC. However, this was expected because the TVOC values are quite variable along the collected data, with the following statistics: average 1200 g/m; standard deviation 830.34 g/m; minimum 0 g/m; maximum 6259 g/m. Figure 6 shows the comparison between the TVOC data acquired by the sensor and the TVOC predicted by the proposed model. It can be seen from this picture that most of the errors that provide a high RMSE are related to TVOC values lower than 2000 g/m. However, the prediction model is able to predict the TVOC peaks, which are the most important pieces of information for the occupants’ health. Indeed, a threshold of 2500 g/m is typically indicative of a TVOC concentration that starts to be dangerous for human health. For example, there are 30 TVOC concentrations, in the collected observations, that are greater than the risky threshold, and the model correctly predicted these concentrations over the threshold 28 times out of 30 with an error of 0.067%. The proposed model could thus be used to trigger an alarm when the predicted TVCO value becomes greater than the aforementioned threshold.
6. Conclusions
In this paper, we have presented our IoT-based SB solution for indoor environment management, which we have implemented by considering all levels of the IoT infrastructure, from the hardware devices to the cloud platform, passing for the middleware. A Raspberry Pi 3 Model B was equipped with the camera, the obstacle sensor and the considered indoor environmental sensors, namely, temperature and humidity, luminosity, eCO and TVOC. The Raspberry was set to collect the sensors’ measurements and the photo taken by the camera each 15 min. Furthermore, a light neural network was implemented in the Raspberry to detect the number of people in the room from the photos taken by the camera.
With our prototype, we collected data for 10 days, and we built two prediction models: a classification model that predicts the number of occupants based on the monitored environmental parameters (average accuracy of 99.5%) and a regression model that predicts the total volatile organic compound (TVOC) values based on the environmental parameters and the number of occupants (Pearson correlation coefficient of 0.939). Both the adopted models, i.e., the bagged tree and the Gaussian process regression, respectively, achieved good prediction performance, although they require medium-performance hardware to be trained and executed. Moreover, once trained, these models can be executed even on low-cost hardware, such as the Raspberry, which may suggest backup solutions in case of network connection failures to implement local alarms in case of predicted environmental issues (e.g., high values of TVOC in the room).
Finally, we would like to highlight that the building objective considered in this study (i.e., investigate the correlation between occupancy information and environmental parameters with the aim to define an occupancy prediction model) is just one of the building objectives that could be tackled with our SB solution. Indeed, the modularity of the cloud platform permits, for example, to integrate the information regarding the energy consumption of the building appliances by solely creating a virtual entity for each of the appliances to be monitored. In addition, at the data analysis level, the relationship between the energy consumption and the other monitored building parameters could be investigated to reveal further insights aimed at improving the building efficiency.
In future works, we aim to collect more data and to investigate further correlations between environmental parameters and occupants’ presence and behaviors so as to implement novel control and management algorithms aimed at improving the building optimization for the occupants’ health and comfort. Moreover, we aim to focus on further SB objectives, such as the optimization of energy consumption and the provision of a safe environment.
Author Contributions
Conceptualization, A.F., S.P., and R.G.; Methodology, A.F., S.P. and R.G.; Software, R.G. and S.P.; Validation, A.F. and S.P.; Formal Analysis, S.P.; Investigation, S.P.; Data Curation, S.P. and R.G.; Writing—Original Draft Preparation, A.F., S.P., and R.G.; Writing—Review & Editing, A.F., S.P., and R.G.; Visualization, A.F. and S.P.; Supervision, L.A.; Project Administration, L.A.; Funding Acquisition, L.A. All authors have read and agreed to the published version of the manuscript.
Funding
This work has been partially funded by the Italian Ministry for the Economic Development (MISE), under the framework “Asse II del programma di supporto tecnologie emergenti (FSC 2014–2020)”, project Monifive and by the Italian Ministry of University and Research (MIUR), within the Smart Cities framework (Project Netergit, ID: PON04a200490).
Conflicts of Interest
The authors declare no conflict of interest.
References
- D’Oca, S.; Hong, T.; Langevin, J. The human dimensions of energy use in buildings: A review. Renew. Sustain. Energy Rev. 2018, 81, 731–742. [Google Scholar] [CrossRef] [Green Version]
- Aguilar, J.; Garcès-Jimènez, A.; Gallego-Salvador, N.; De Mesa, J.A.G.; Gomez-Pulido, J.M.; Garcìa-Tejedor, À.J. Autonomic Management Architecture for Multi-HVAC Systems in Smart Buildings. IEEE Access 2019, 7, 123402–123415. [Google Scholar] [CrossRef]
- Dong, B.; Prakash, V.; Feng, F.; O’Neill, Z. A review of smart building sensing system for better indoor environment control. Energy Build. 2019, 199, 29–46. [Google Scholar] [CrossRef]
- Chen, Z.; Jiang, C.; Xie, L. Building occupancy estimation and detection: A review. Energy Build. 2018, 169, 260–270. [Google Scholar] [CrossRef]
- Hong, T.; Yan, D.; D’Oca, S.; Fei Chen, C. Ten questions concerning occupant behavior in buildings: The big picture. Build. Environ. 2017, 114, 518–530. [Google Scholar] [CrossRef] [Green Version]
- Agarwal, Y.; Balaji, B.; Gupta, R.; Lyles, J.; Wei, M.; Weng, T. Occupancy-Driven Energy Management for Smart Building Automation. In Proceedings of the 2nd ACM Workshop on Embedded Sensing Systems for Energy-Efficiency in Building, Zurich, Switzerland, 2 November 2010. [Google Scholar] [CrossRef]
- Yang, Z.; Becerik-Gerber, B. The coupled effects of personalized occupancy profile based HVAC schedules and room reassignment on building energy use. Energy Build. 2014, 78, 113–122. [Google Scholar] [CrossRef]
- Wang, F.; Feng, Q.; Chen, Z.; Zhao, Q.; Cheng, Z.; Zou, J.; Zhang, Y.; Mai, J.; Li, Y.; Reeve, H. Predictive control of indoor environment using occupant number detected by video data and CO2 concentration. Energy Build. 2017, 145, 155–162. [Google Scholar] [CrossRef]
- Leephakpreeda, T. Adaptive Occupancy-based Lighting Control via Grey Prediction. Build. Environ. 2005, 40, 881–886. [Google Scholar] [CrossRef]
- Mokhtari, R.; Jahangir, M.H. The effect of occupant distribution on energy consumption and COVID-19 infection in buildings: A case study of university building. Build. Environ. 2021, 190, 107561. [Google Scholar] [CrossRef]
- Atzori, L.; Iera, A.; Morabito, G. The Internet of Things: A survey. Comput. Netw. 2010, 54, 2787–2805. [Google Scholar] [CrossRef]
- Verma, A.; Prakash, S.; Srivastava, V.; Kumar, A.; Mukhopadhyay, S.C. Sensing, Controlling, and IoT Infrastructure in Smart Building: A Review. IEEE Sens. J. 2019, 19, 9036–9046. [Google Scholar] [CrossRef]
- Saha, H.; Florita, A.R.; Henze, G.P.; Sarkar, S. Occupancy sensing in buildings: A review of data analytics approaches. Energy Build. 2019, 188–189, 278–285. [Google Scholar] [CrossRef]
- Qolomany, B.; Al-Fuqaha, A.; Gupta, A.; Benhaddou, D.; Alwajidi, S.; Qadir, J.; Fong, A.C. Leveraging machine learning and big data for smart buildings: A comprehensive survey. IEEE Access 2019, 7, 90316–90356. [Google Scholar] [CrossRef]
- Atzori, L.; Iera, A.; Morabito, G. SIoT: Giving a Social Structure to the Internet of Things. IEEE Commun. Lett. 2011, 15, 1193–1195. [Google Scholar] [CrossRef]
- Choubey, P.K.; Pateria, S.; Saxena, A.; SB, V.P.C.; Jha, K.K.; PM, S.B. Power efficient, bandwidth optimized and fault tolerant sensor management for IOT in Smart Home. In Proceedings of the 2015 IEEE International Advance Computing Conference (IACC), Banglore, India, 12–13 June 2015; IEEE: New York, NY, USA, 2015; pp. 366–370. [Google Scholar]
- Lilis, G.; Conus, G.; Asadi, N.; Kayal, M. Towards the next generation of intelligent building: An assessment study of current automation and future IoT based systems with a proposal for transitional design. Sustain. Cities Soc. 2017, 28, 473–481. [Google Scholar] [CrossRef]
- Moreno, M.V.; Dufour, L.; Skarmeta, A.F.; Jara, A.J.; Genoud, D.; Ladevie, B.; Bezian, J.J. Big data: The key to energy efficiency in smart buildings. Soft Comput. 2016, 20, 1749–1762. [Google Scholar] [CrossRef] [Green Version]
- Moreno, V.; Zamora, M.A.; Skarmeta, A.F. A low-cost indoor localization system for energy sustainability in smart buildings. IEEE Sens. J. 2016, 16, 3246–3262. [Google Scholar] [CrossRef]
- Indigo. Indigo Domotics. Available online: https://www.indigodomo.com (accessed on 1 April 2021).
- SmartThings. SmartThings Platform. Available online: https://www.smartthings.com/ (accessed on 1 April 2021).
- Dixon, C.; Mahajan, R.; Agarwal, S.; Brush, A.; Lee, B.; Saroiu, S.; Bahl, P. An operating system for the home. In Proceedings of the 9th USENIX Symposium on Networked Systems Design and Implementation (NSDI 12), San Jose, CA, USA, 25–27 April 2012; pp. 337–352. [Google Scholar]
- Brush, A.B.; Filippov, E.; Huang, D.; Jung, J.; Mahajan, R.; Martinez, F.; Mazhar, K.; Phanishayee, A.; Samuel, A.; Scott, J.; et al. Lab of things: A platform for conducting studies with connected devices in multiple homes. In Proceedings of the 2013 ACM conference on Pervasive and Ubiquitous Computing Adjunct Publication, Zurich, Switzerland, 8–12 September 2013; pp. 35–38. [Google Scholar]
- OpenHab. OpenHab Platform. Available online: https://www.openhab.org/ (accessed on 1 April 2021).
- Smirek, L.; Zimmermann, G.; Ziegler, D. Towards Universally Usable Smart Homes – How Can MyUI, URC and openHAB Contribute to an Adaptive User Interface Platform? In Proceedings of the 7th International Conference on Advances in Human-Oriented and Personalized Mechanisms, Technologies, and Services, Nice, France, 12–16 October 2014; pp. 29–38. [Google Scholar]
- Smirek, L.; Zimmermann, G.; Beigl, M. Just a smart home or your smart home—A framework for personalized user interfaces based on eclipse smart home and universal remote console. Procedia Comput. Sci. 2016, 98, 107–116. [Google Scholar] [CrossRef] [Green Version]
- Fleury, A.; Noury, N.; Vacher, M. Introducing knowledge in the process of supervised classification of activities of Daily Living in Health Smart Homes. In Proceedings of the 12th IEEE International Conference on e-Health Networking, Applications and Services, Lyon, France, 1–3 July 2010; IEEE: New York, NY, USA, 2010; pp. 322–329. [Google Scholar]
- Belaidouni, S.; Miraoui, M. Machine learning technologies in smart spaces. In Proceedings of the 10th International Conference on Mobile Ubiquitous Computing, Systems, Services and Technologies, Venice, Italy, 9–13 October 2016; pp. 52–55. [Google Scholar]
- Altun, K.; Barshan, B.; Tunçel, O. Comparative study on classifying human activities with miniature inertial and magnetic sensors. Pattern Recognit. 2010, 43, 3605–3620. [Google Scholar] [CrossRef]
- Delgado, M.; Ros, M.; Vila, M.A. Correct behavior identification system in a tagged world. Expert Syst. Appl. 2009, 36, 9899–9906. [Google Scholar] [CrossRef]
- Parnandi, A.; Le, K.; Vaghela, P.; Kolli, A.; Dantu, K.; Poduri, S.; Sukhatme, G.S. Coarse in-building localization with smartphones. In International Conference on Mobile Computing, Applications, and Services; Springer: Berlin, Germany, 2009; pp. 343–354. [Google Scholar]
- Brdiczka, O.; Reignier, P.; Crowley, J.L. Detecting individual activities from video in a smart home. In International Conference on Knowledge-Based and Intelligent Information and Engineering Systems; Springer: Berlin, Germany, 2007; pp. 363–370. [Google Scholar]
- van Kasteren, T.; Krose, B. Bayesian activity recognition in residence for elders. In Proceedings of the 3rd IET International Conference on Intelligent Environments, Ulm, Germany, 24–25 September 2007; pp. 209–212. [Google Scholar]
- Fu, Y.; Li, Z.; Zhang, H.; Xu, P. Using support vector machine to predict next day electricity load of public buildings with sub-metering devices. Procedia Eng. 2015, 121, 1016–1022. [Google Scholar] [CrossRef] [Green Version]
- Nguyen, Q.C.; Shin, D.; Shin, D.; Kim, J. Real-time human tracker based on location and motion recognition of user for smart home. In Proceedings of the 2009 Third International Conference on Multimedia and Ubiquitous Engineering, Qingdao, China, 4–6 June 2009; IEEE: New York, NY, USA, 2009; pp. 243–250. [Google Scholar]
- Petersen, J.; Larimer, N.; Kaye, J.A.; Pavel, M.; Hayes, T.L. SVM to detect the presence of visitors in a smart home environment. In Proceedings of the 2012 Annual International Conference of the IEEE Engineering in Medicine and Biology Society, San Diego, CA, USA, 28 August–1 September 2012; IEEE: New York, NY, USA, 2012; pp. 5850–5853. [Google Scholar]
- Fleury, A.; Vacher, M.; Noury, N. SVM-based multimodal classification of activities of daily living in health smart homes: Sensors, algorithms, and first experimental results. IEEE Trans. Inf. Technol. Biomed. 2009, 14, 274–283. [Google Scholar] [CrossRef] [PubMed] [Green Version]
- Zhao, H.; Hua, Q.; Chen, H.B.; Ye, Y.; Wang, H.; Tan, S.X.D.; Tlelo-Cuautle, E. Thermal-sensor-based occupancy detection for smart buildings using machine-learning methods. ACM Trans. Des. Autom. Electron. Syst. 2018, 23, 1–21. [Google Scholar] [CrossRef]
- Bourobou, S.T.M.; Yoo, Y. User activity recognition in smart homes using pattern clustering applied to temporal ANN algorithm. Sensors 2015, 15, 11953–11971. [Google Scholar] [CrossRef] [PubMed] [Green Version]
- Badlani, A.; Bhanot, S. Smart home system design based on artificial neural networks. In Proceedings of the World Congress on Engineering and Computer Science, San Francisco, CA, USA, 19–21 October 2011; Volume 1, pp. 146–164. [Google Scholar]
- Ciabattoni, L.; Ippoliti, G.; Benini, A.; Longhi, S.; Pirro, M. Design of a home energy management system by online neural networks. IFAC Proc. Vol. 2013, 46, 677–682. [Google Scholar] [CrossRef]
- Ordóñez, F.J.; Roggen, D. Deep convolutional and lstm recurrent neural networks for multimodal wearable activity recognition. Sensors 2016, 16, 115. [Google Scholar] [CrossRef] [Green Version]
- Chen, Y.; Xue, Y. A deep learning approach to human activity recognition based on single accelerometer. In Proceedings of the 2015 IEEE International Conference on Systems, Man, and Cybernetics, Hong Kong, China, 9–12 October 2015; IEEE: New York, NY, USA, 2015; pp. 1488–1492. [Google Scholar]
- Ronao, C.A.; Cho, S.B. Human activity recognition with smartphone sensors using deep learning neural networks. Expert Syst. Appl. 2016, 59, 235–244. [Google Scholar] [CrossRef]
- Hitimana, E.; Bajpai, G.; Musabe, R.; Sibomana, L.; Kayalvizhi, J. Implementation of IoT Framework with Data Analysis Using Deep Learning Methods for Occupancy Prediction in a Building. Future Internet 2021, 13, 67. [Google Scholar] [CrossRef]
- Girau, R.; Martis, S.; Atzori, L. Lysis: A platform for IoT distributed applications over socially connected objects. IEEE Internet Things J. 2016, 4, 40–51. [Google Scholar] [CrossRef]
- Atzori, L.; Iera, A.; Morabito, G.; Nitti, M. The Social Internet of Things (SIoT)—When social networks meet the Internet of Things: Concept, architecture and network characterization. Comput. Netw. 2012, 56, 3594–3608. [Google Scholar] [CrossRef]
- Bochkovskiy, A.; Wang, C.Y.; Liao, H.Y.M. YOLOv4: Optimal Speed and Accuracy of Object Detection. arXiv 2020, arXiv:2004.10934. [Google Scholar]
- Boyuan, W.; Muqing, W. Study on Pedestrian Detection Based on an Improved YOLOv4 Algorithm. In Proceedings of the 2020 IEEE 6th International Conference on Computer and Communications (ICCC), Chengdu, China, 11–14 December 2020; pp. 1198–1202. [Google Scholar] [CrossRef]
- Manisalidis, I.; Stavropoulou, E.; Stavropoulos, A.; Bezirtzoglou, E. Environmental and Health Impacts of Air Pollution: A Review. Front. Public Health 2020, 8. [Google Scholar] [CrossRef] [PubMed] [Green Version]
Figure 1.
Reference architecture of the proposed smart building system.

Figure 2.
Control dashboard: list of monitored buildings.

Figure 3.
Control dashboard: details of the Simone House.

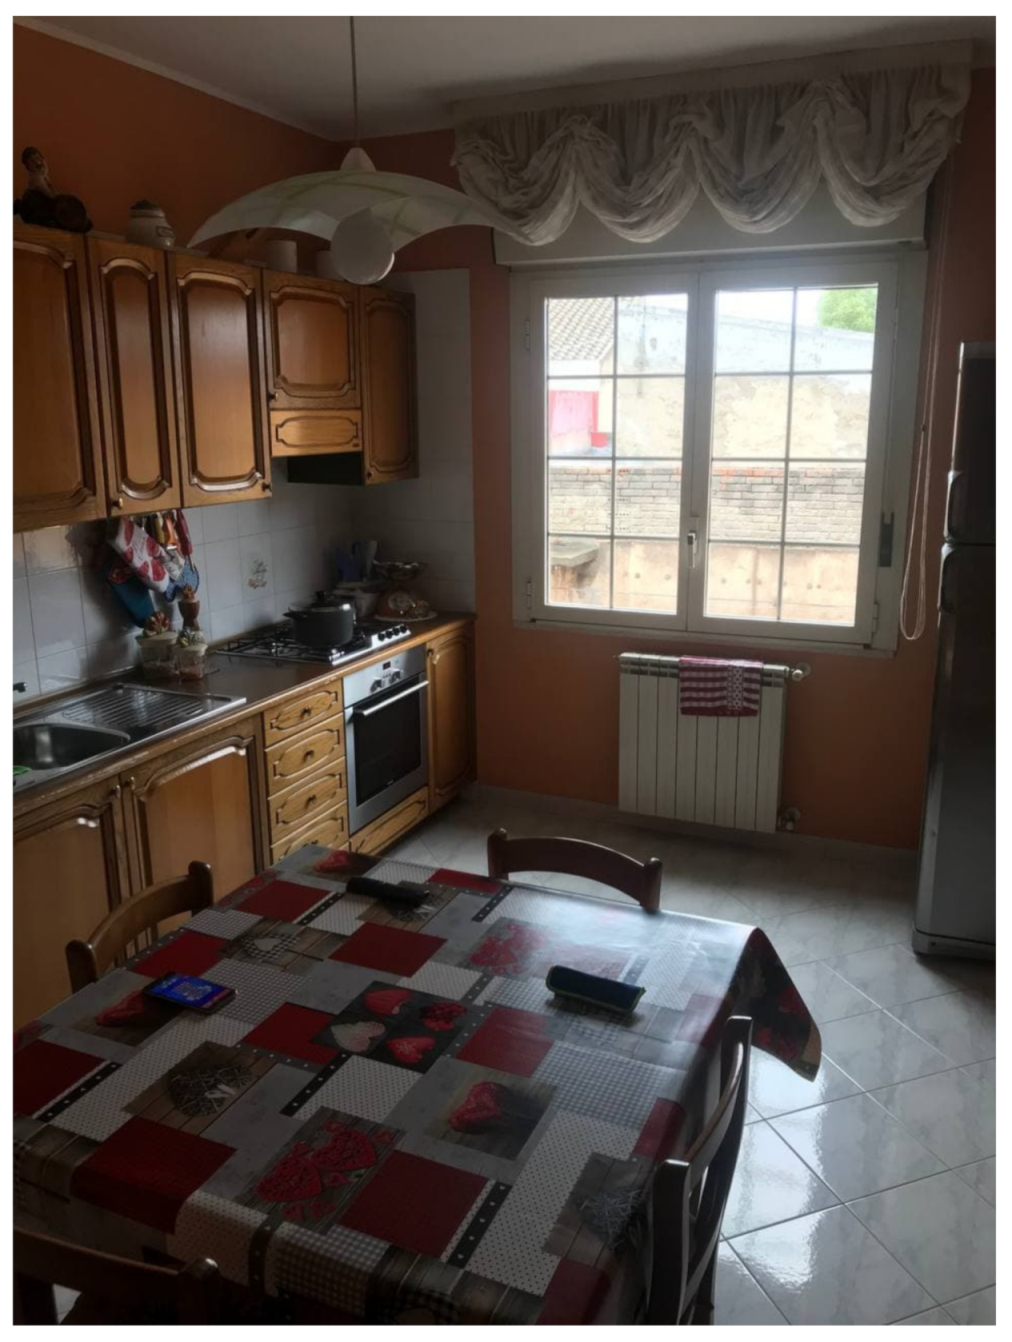
Figure 4.
Room where the experiment was conducted.

Figure 5.
Sensors, camera and Raspberry that acquired information within the room.

Figure 6.
Comparison between the TVOC data acquired by the sensor and the TVOC predicted by the proposed prediction model.
Figure 6.
Comparison between the TVOC data acquired by the sensor and the TVOC predicted by the proposed prediction model.


Table 1.
One-way ANOVA.
| One-Way ANOVA | Time | People | Window | |||
|---|---|---|---|---|---|---|
| F | p | F | p | F | p | |
| Temperature | <0.001 | <0.001 | 19 | <0.001 | ||
| Humidity | <0.001 | >0.001 | 163 | <0.001 | ||
| eCO | <0.001 | <0.001 | 192 | <0.001 | ||
| TVOC | <0.001 | <0.001 | 212 | <0.001 | ||
Table 2.
The n-way ANOVA.
| n-Way ANOVA | People*Window | |
|---|---|---|
| F | p | |
| Temperature | 10 | <0.001 |
| eCO | <0.001 | |
| TVOC | <0.001 | |
Table 3.
Accuracy of the occupants prediction model.
| Number of People | Accuracy |
|---|---|
| 0 | 99.8% |
| 1 | 99.4% |
| 2 | 97.5% |
| 3 | 100% |
| 4 | 100% |
| 5 | 100% |
Publisher’s Note: MDPI stays neutral with regard to jurisdictional claims in published maps and institutional affiliations. |
© 2021 by the authors. Licensee MDPI, Basel, Switzerland. This article is an open access article distributed under the terms and conditions of the Creative Commons Attribution (CC BY) license (https://creativecommons.org/licenses/by/4.0/).
Share and Cite
MDPI and ACS Style
Floris, A.; Porcu, S.; Girau, R.; Atzori, L. An IoT-Based Smart Building Solution for Indoor Environment Management and Occupants Prediction. Energies 2021, 14, 2959. https://0-doi-org.brum.beds.ac.uk/10.3390/en14102959
AMA Style
Floris A, Porcu S, Girau R, Atzori L. An IoT-Based Smart Building Solution for Indoor Environment Management and Occupants Prediction. Energies. 2021; 14(10):2959. https://0-doi-org.brum.beds.ac.uk/10.3390/en14102959
Chicago/Turabian StyleFloris, Alessandro, Simone Porcu, Roberto Girau, and Luigi Atzori. 2021. "An IoT-Based Smart Building Solution for Indoor Environment Management and Occupants Prediction" Energies 14, no. 10: 2959. https://0-doi-org.brum.beds.ac.uk/10.3390/en14102959
Note that from the first issue of 2016, this journal uses article numbers instead of page numbers. See further details here.