Article

A Novel Framework to Study the Role of Ground and Fumed Silica Fillers in Suppressing DC Erosion of Silicone Rubber Outdoor Insulation

1
École de Technologie Supérieure, Montréal, QC H3C 1K3, Canada
2
Metrology Research Center, National Research Council Canada, Ottawa, ON K1A 0R6, Canada
*
Author to whom correspondence should be addressed.
Submission received: 28 April 2021 / Revised: 30 May 2021 / Accepted: 7 June 2021 / Published: 10 June 2021
(This article belongs to the Special Issue Outdoor Insulation and Gas Insulated Switchgears)

Abstract

:
This paper investigates the effect of ground and fumed silica fillers on suppressing DC erosion in silicone rubber. Fumed silica and ground silica fillers are incorporated in silicone rubber at different loading levels and comparatively analyzed in this study. Outcomes of the +DC inclined plane tracking erosion test indicate a better erosion performance for the fumed silica filled composite despite having a lower thermal conductivity compared to the ground silica composite. Results of the simultaneous thermogravimetric and thermal differential analyses are correlated with inclined plane tracking erosion test outcomes suggesting that fumed silica suppresses depolymerization and promotes radical based crosslinking in silicone rubber. This finding is evident as higher residue is obtained with the fumed silica filler despite being filled at a significantly lower loading level compared to ground silica. The surface residue morphology obtained, and the roughness determined for the tested samples of the composites in the dry-arc resistance test indicate the formation of a coherent residue with the fumed silica filled composite. Such coherent residue could act as a barrier to shield the unaffected material underneath the damaged surface during dry-band arcing, thereby preventing progressive erosion. The outcomes of this study suggest a significant role for fumed silica promoting more interactions with silicone rubber to suppress DC erosion compared to ground silica fillers.

1. Introduction

With the rising awareness of the impacts of fossil fuel-based electricity generation on climate change, solutions for integrating renewable energy sources into the existing electric grid infrastructure have been investigated. Utilizing a high voltage direct current (HVDC) transmission system would facilitate such integration by enabling an efficient transmission of electric power over long distances from remote renewable energy sources such as hydro, wind and solar farms to load centers [1,2]. Accordingly, HVDC outdoor insulators should be designed to ensure the reliability of the power transmission system. Silicone rubber’s (SiR) characteristic hydrophobicity makes it highly desirable for use as a housing material in polymeric outdoor insulators. SiR, however, is susceptible to erosion caused by dry-band arcs sustained under heavily polluted conditions. Incorporating silica fillers in composite formulations of SiR was considered for enhancing the thermal conductivity and, in turn, the erosion performance of SiR.
Meyer et al., in [3], highlighted the correlation between the thermal conductivity and the erosion resistance of their silica filled SiR composites. It was concluded that the increase in silica filler loading from 10 to 50 wt% (percent by weight) caused a significant increase in the thermal conductivity, which resulted in lower eroded masses in the inclined plane-tracking and erosion test (IPT). El-Hag et al., in [4], illustrated that adding fumed silica by 10 wt% to SiR would result in a comparable erosion performance with 50 wt% micro silica filled SiR. This observation was attributed to the role of fumed silica in favorably bonding with the silicone rubber matrix. Nazir et al., in [5], reported an improvement in the IPT erosion performance of their hybrid SiR composites containing nano silica and aluminum nitride fillers with an increase in the nano silica loading level. An increase in the composite thermal conductivity was observed with an increased loading of nano silica fillers. Ramirez et al., in [6], explained that the high specific surface area of the fumed silica filler facilitates a better interaction with SiR as a result of the increased concentration of the silanol groups interacting with the siloxane chains of the polymer. Ansorge et al., in [7], highlighted the effect of an additional factor influencing the erosion performance of silica filled SiR that is related to the material curing temperature. It was reported in [7] that the erosion performance of micro silica filled room temperature vulcanized (RTV) SiR showed higher erosion depths under the IPT compared to high consistency silicone rubber. This outcome was attributed to the improved filler-polymer bonding at high temperature curing. Similar findings were reported in [3], highlighting the effect of high temperature curing on the erosion performance of silica filled SiR composites.
Several research studies conclude that the erosion performance of SiR worsens under DC voltage, particularly +DC, compared to AC [8,9]. The dry-band arcing exhibited by the insulators under DC voltage is of higher relative severity compared to that of AC in terms of arc discharge duration and leakage current magnitude [9]. Ghunem et al., in [10], illustrated the effect of increasing silica filler loading and, subsequently, the composite thermal conductivity on delaying the inception of stable eroding DC dry-band arcs in SiR. Comparable magnitudes of the third detail wavelet component of leakage currents were obtained between the SiR composites filled with silica and alumina trihydrate (ATH) at 30 wt%, despite the additional effect of the water of hydration of ATH in suppressing erosion [10]. These findings suggest the presence of erosion suppression mechanisms associated with silica’s interaction with the silicone matrix. Kone et al., in [11], demonstrated the effect of the silica filler size and loading level on the integrity of the silica residue produced under the IPT. The coherency and porosity of such residue could shield the SiR material against progressive erosion under DC dry-band arcing [11]. In an earlier study [12], fumed silica was found to have a significant effect in suppressing DC erosion as compared to nano ATH and sub-micron boron nitride (BN) in SiR composites, despite the comparable thermal conductivities reported for all of the composites. Accordingly, the literature suggests that the role of silica fillers in suppressing the DC erosion in SiR is more than simply improving the composite thermal conductivity.
The literature indicates that the use of silica fillers in SiR composites, with their different particle sizes and loading levels, would improve the erosion performance of the composites as a result of an increase in the thermal conductivity of the composite. Merely using the +DC IPT as a means to rank the erosion performance of such composites without considering any additional analytical tools would overshadow the true role of the silica size in suppressing the DC erosion of SiR. Moreover, this would limit the role of the silica filler in merely improving the composite thermal conductivity. This paper introduces a framework to thoroughly investigate the role of fumed silica and ground silica fillers on suppressing the DC erosion of SiR. The study would enable using a number of analytical tools with outcomes that could be correlated with the IPT outcomes. This study, in turn, could ultimately support the developments in SiR outdoor insulators for their reliable use in the HVDC electric grid.

2. Materials and Methods

Fumed silica and ground silica, whose properties are shown in Table 1, are used as the fillers for this study. Based on the literature, fumed silica was selected due to its high specific surface area facilitating a favorable interaction with silicone at small weight fractions in the composite. Ground silica, on the other hand, can be filled at much higher loading levels to replace a significant portion of the SiR material and, subsequently, reduce the cost of the composite. A two-part RTV SiR is used in the study, where Part A is the main potting compound and Part B is the crosslinking agent. Part A and Part B are maintained at a weight ratio of 10:1, respectively. Weighed portions of the filler are added to Part A and mixed using a ROSS high shear mixer until all of the filler is added to the mixture. Part B is then added and mixed for one minute to be later poured into IPT specimen molds and degassed under a vacuum. The mixture is cured at room temperature for a 24 h time period, followed by thermal treatment at 85 °C for 3 h. An unfilled SiR was also prepared for selected tests in this study.
The +DC IPT is used in this study as part of the electrical analysis to assess the erosion performance of the prepared composites. The test setup is set as per the IEC 60587 standard [13] and modified for +DC testing as per the recommendations in [9]. The test voltage was set at +3.5 kV for a 6 h run time with a contaminant flow rate of 0.3 mL/min and a contaminant conductivity value of 2.5 mS/cm. A digital Mitutoyo 571-200 micrometer with an accuracy of 0.1 mm was used to measure the erosion depth of 10 specimen samples for each composite.
Leakage currents for the tested specimens during the IPT are acquired using a National Instruments NI USB-6356 data acquisition device at a sampling rate of 7 kHz. A sample window is then applied to capture the first 468 samples from each second. The root-mean-square value (RMS) of the leakage current is computed and stored as a single value for the 468 acquired samples at every second. Computing the RMS value for every second of the test run would suffice for representing the change in the leakage current values during the test and would provide a practical approach for acquiring the data with smaller storage requirements instead of saving the entire current waveform of 468 samples per second. Following the analytical approach presented in an earlier study [12], a statistical boxplot method is used to observe the distribution of the RMS leakage current values acquired during the IPT in 20 min time intervals. This statistical analysis allows one to observe the evolution of the dry-band arc from the intermittent state to the stable severe state, which is reflected in the changing distribution of the RMS leakage current values between consecutive time intervals in the boxplot. An increase in the dry-band arcing stability and severity is reflected in a reduction in the non-conducting periods of the leakage current. This corresponds to a transition from the initial intermittent state of the dry-band arc, which is characterized by a large number of nonconducting periods and frequent RMS leakage current values below 1 mA. Figure 1 shows the +DC IPT test setup used in the study [10].
The dry-arc resistance test is used in this study as a method to produce a controlled and quick heat ablation through the sample thickness rather than progressive erosion on the surface, as is the case with the IPT. The test will enable the fast production of tested composites whose surface residue could be analyzed for drawing preliminary conclusions regarding the role of the filler on defining the surface residue characteristics that could be observed using microscopy. The test setup is set as per the ASTM D 495 [14] standard, which utilizes tungsten electrodes to generate low current arcs under high voltages on the tested composites. The arc is generated in current steps that define the current magnitude and the duty cycles of the rms AC voltage applied, as per the schedule set in [14] and with each current step lasting for one minute. For this study, only the first 4 current steps of the 7 steps in [14] are used in the dry-arc resistance test; i.e. total test run of 4 min. Detailed description of the on and off duration of the current in these 4 current steps are described in details in [14]. The first 3 current steps of the test (denoted here as cycles 1 to 3) are analogous to an intermittent state of the dry-band arc. The degree of intermittency decreases as test goes from the first current step (cycle 1) to the third (cycle 3). The fourth current step (cycle 4), on the other hand, is analogous to the stable eroding state of the dry-band arc without intermittency. All the current steps used have a constant current magnitude of 10mA. Modifying the existing test setup to generate a DC dry-band arc could impair the proper functionality of the power electronics of the setup controlling the duty cycles. Figure 2 shows the dry-arc resistance test setup.
Simultaneous thermogravimetric–differential thermal analysis (TGA–DTA) was performed on the prepared composites under nitrogen (N2) and air atmospheres to understand the thermal decomposition characteristics of the composites. The heating rate was set at 25 °C/min for a temperature span from 80 to 800 °C. Thermal conductivity measurements for the prepared composites were acquired using a thermal conductivity analyzer instrument as per the ASTM D7984 standards [15], which enables the acquisition of measurements in short test times without the use of a vacuum chamber. These measurements are necessary to understand the relationship between the composite thermal conductivity and the erosion performance of the composites.
Surface residue on post tested specimens of the +DC IPT, dry-arc resistance test and TGA are analyzed using two various methods. The surface morphology of the samples is observed using scanning electron microscopy (SEM) on 20 nm gold sputter coated surfaces and a laser confocal microscope. Surface roughness analysis on the samples is performed using a Keyence VR-5000 optical microscope. Quantitative representation of the surface roughness is performed by means of the average roughness parameter, Ra, whose computation details can be found in [16]. All of the aforementioned tools serve to observe the effect of the filler on the residue characteristics of the composite in terms of coherency and roughness.

3. Results and Discussion

3.1. Erosion Performance

Figure 3 shows the +DC IPT outcomes of the study. The results preliminarily indicate a better erosion performance of the FS07 filled composite compared to that of GS10. Figure 3a shows a higher average erosion depth obtained for the GS10 filled samples compared to the FS07 filled samples. Figure 3b further illustrates the inferior erosion performance of the GS10 filled composite through images of the post tested specimen, indicating larger eroded areas with the composite compared to those filled with FS07. It is important to note that the better erosion performance of the FS07 filled SiR does not necessarily conclude a superior erosion performance for the composite as compared to the GS10 filled SiR. The outcomes simply show that the FS07 filled SiR had a better or comparable erosion performance to the GS10 filled SiR, despite being filled at one sixth of the filler loading level of the GS10 filled SiR. This highlights a significant role for fumed silica in suppressing erosion and potentially facilitates its use as a co-filler with ground silica in practical formulations of SiR composites of high filler loadings that could be used in industry.
Table 2 shows the measured thermal conductivity of the prepared composites. The thermal conductivity values acquired were consistent with those found in [3,4]. The increase in the weight fraction of the GS10 and FS07 fillers in the composite leads to a significant increase in the composite thermal conductivity [3]. It is important to note that despite having twice the thermal conductivity of the FS07 filled SiR, the GS10 filled SiR showed inferior erosion performance, which suggests that that the thermal conductivity is not the main governing factor in suppressing the erosion of SiR under DC voltage. In an earlier study [12], it was found that the favorable interaction of fumed silica with the SiR matrix was more decisive in determining the erosion performance of SiR under the +DC IPT than the improvement of the composite thermal conductivity using BN fillers. The difference in DC and AC erosion in silica filled SiR was thoroughly investigated and discussed in studies such as [11] and is not the subject of this work. Rather, this study presents a practical framework for highlighting the prominent role of the fumed silica-silicone interactions on suppressing the DC erosion of SiR. According to Hshieh in [17], the silica-ash layer formed during the combustion of silicones produces a barrier effect that shields the silicone material against the influx of heat, preventing further combustion of the material. Accordingly, the presented framework aims to highlight the role of the silica filler size and its interaction with SiR in promoting the formation of a coherent residue with a barrier shielding effect that enhances the erosion performance of SiR, as shown in the outcomes of Figure 3.
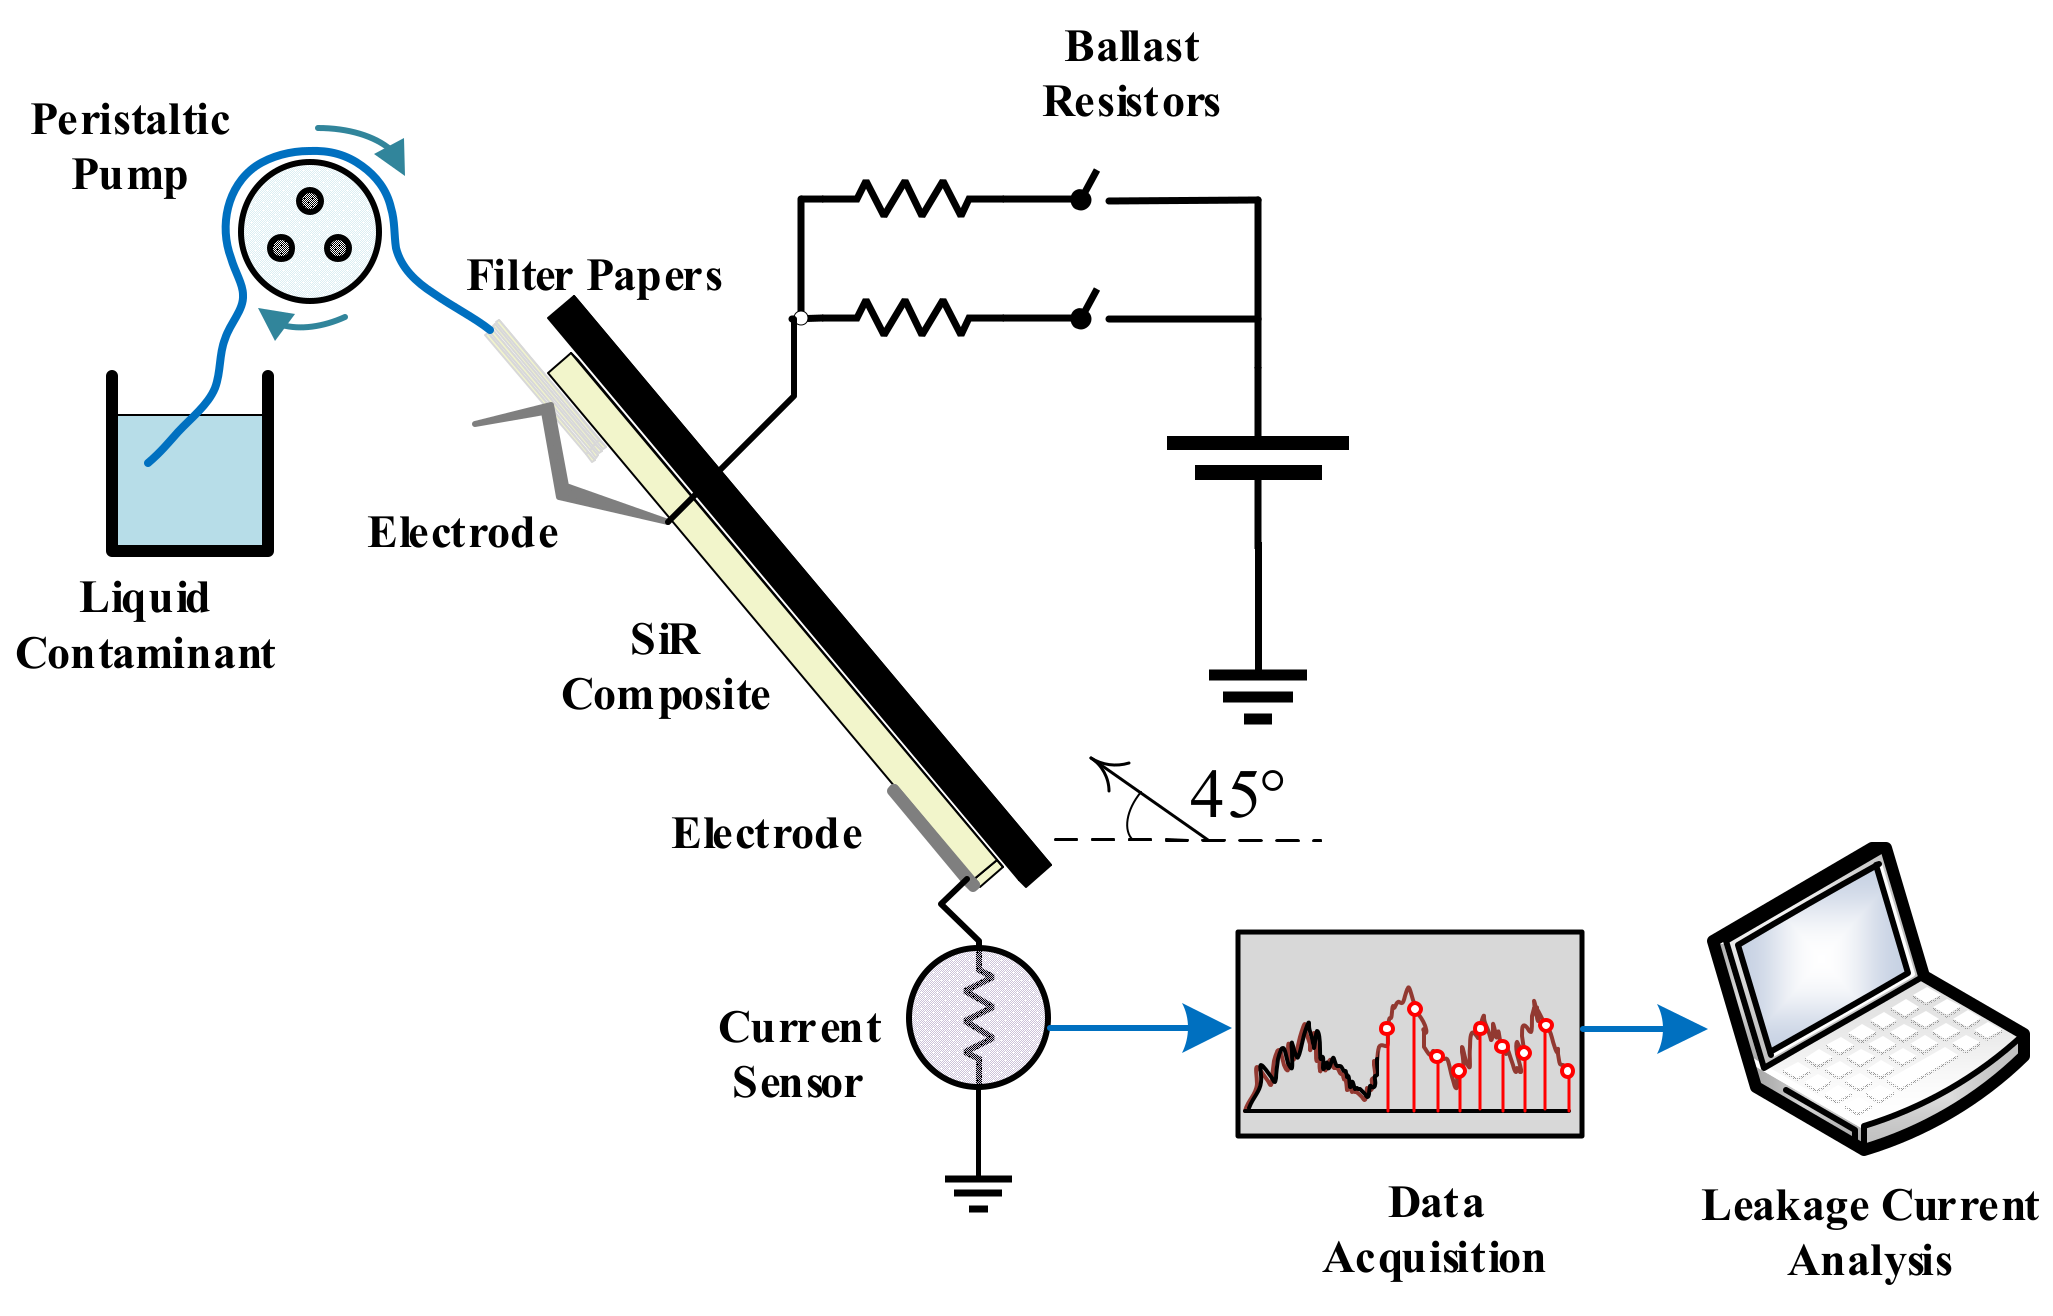
A statistical boxplot representation of the RMS leakage current of the composites during the +DC IPT is illustrated. Figure 4 shows the RMS leakage current waveform obtained for one of the GS10 filled SiR composites and its corresponding boxplot analysis. The boxplot shows the leakage current distribution for the first 3 h of the test, which was comprised of 12 20-min time intervals. Each bar shown in the boxplot represents the value distribution of the RMS leakage current values acquired during that time interval of the test. For example, the bar in the third time interval represents the RMS leakage current values acquired from minute 60 to minute 80 of the IPT. The bar width in the boxplot represents the distribution of the leakage current values during any given time interval. The top and bottom of the bar and the circled marker represent the 75th and 25th percentile and the median value of the RMS leakage current during that time interval, respectively. In Figure 4, the DC dry-band arc is shown to develop through two distinct stages in terms of arc stability and severity. The reduction in the bar width is an indication of the changing nature of the dry-band arc, from intermittent to stable with less nonconducting periods. As illustrated in [10,12], the initial stage of the dry-band arc is intermittent with inconsiderable erosion noted on the composite surface. The subsequent stage, however, is stable with reduced nonarcing periods leading to severe erosion of the composite. The inception of the stable dry-band arc stage was suggested to be dependent on the rate of formation of surface residue promoted with thermo-oxidation at temperatures just below 200 °C by Si-C bond scission, as illustrated in the Andrinov mechanism [18]. This residue would reduce the rate of evaporation of the liquid contaminant in the IPT, leading to the development of a stable dry-band arc [10].
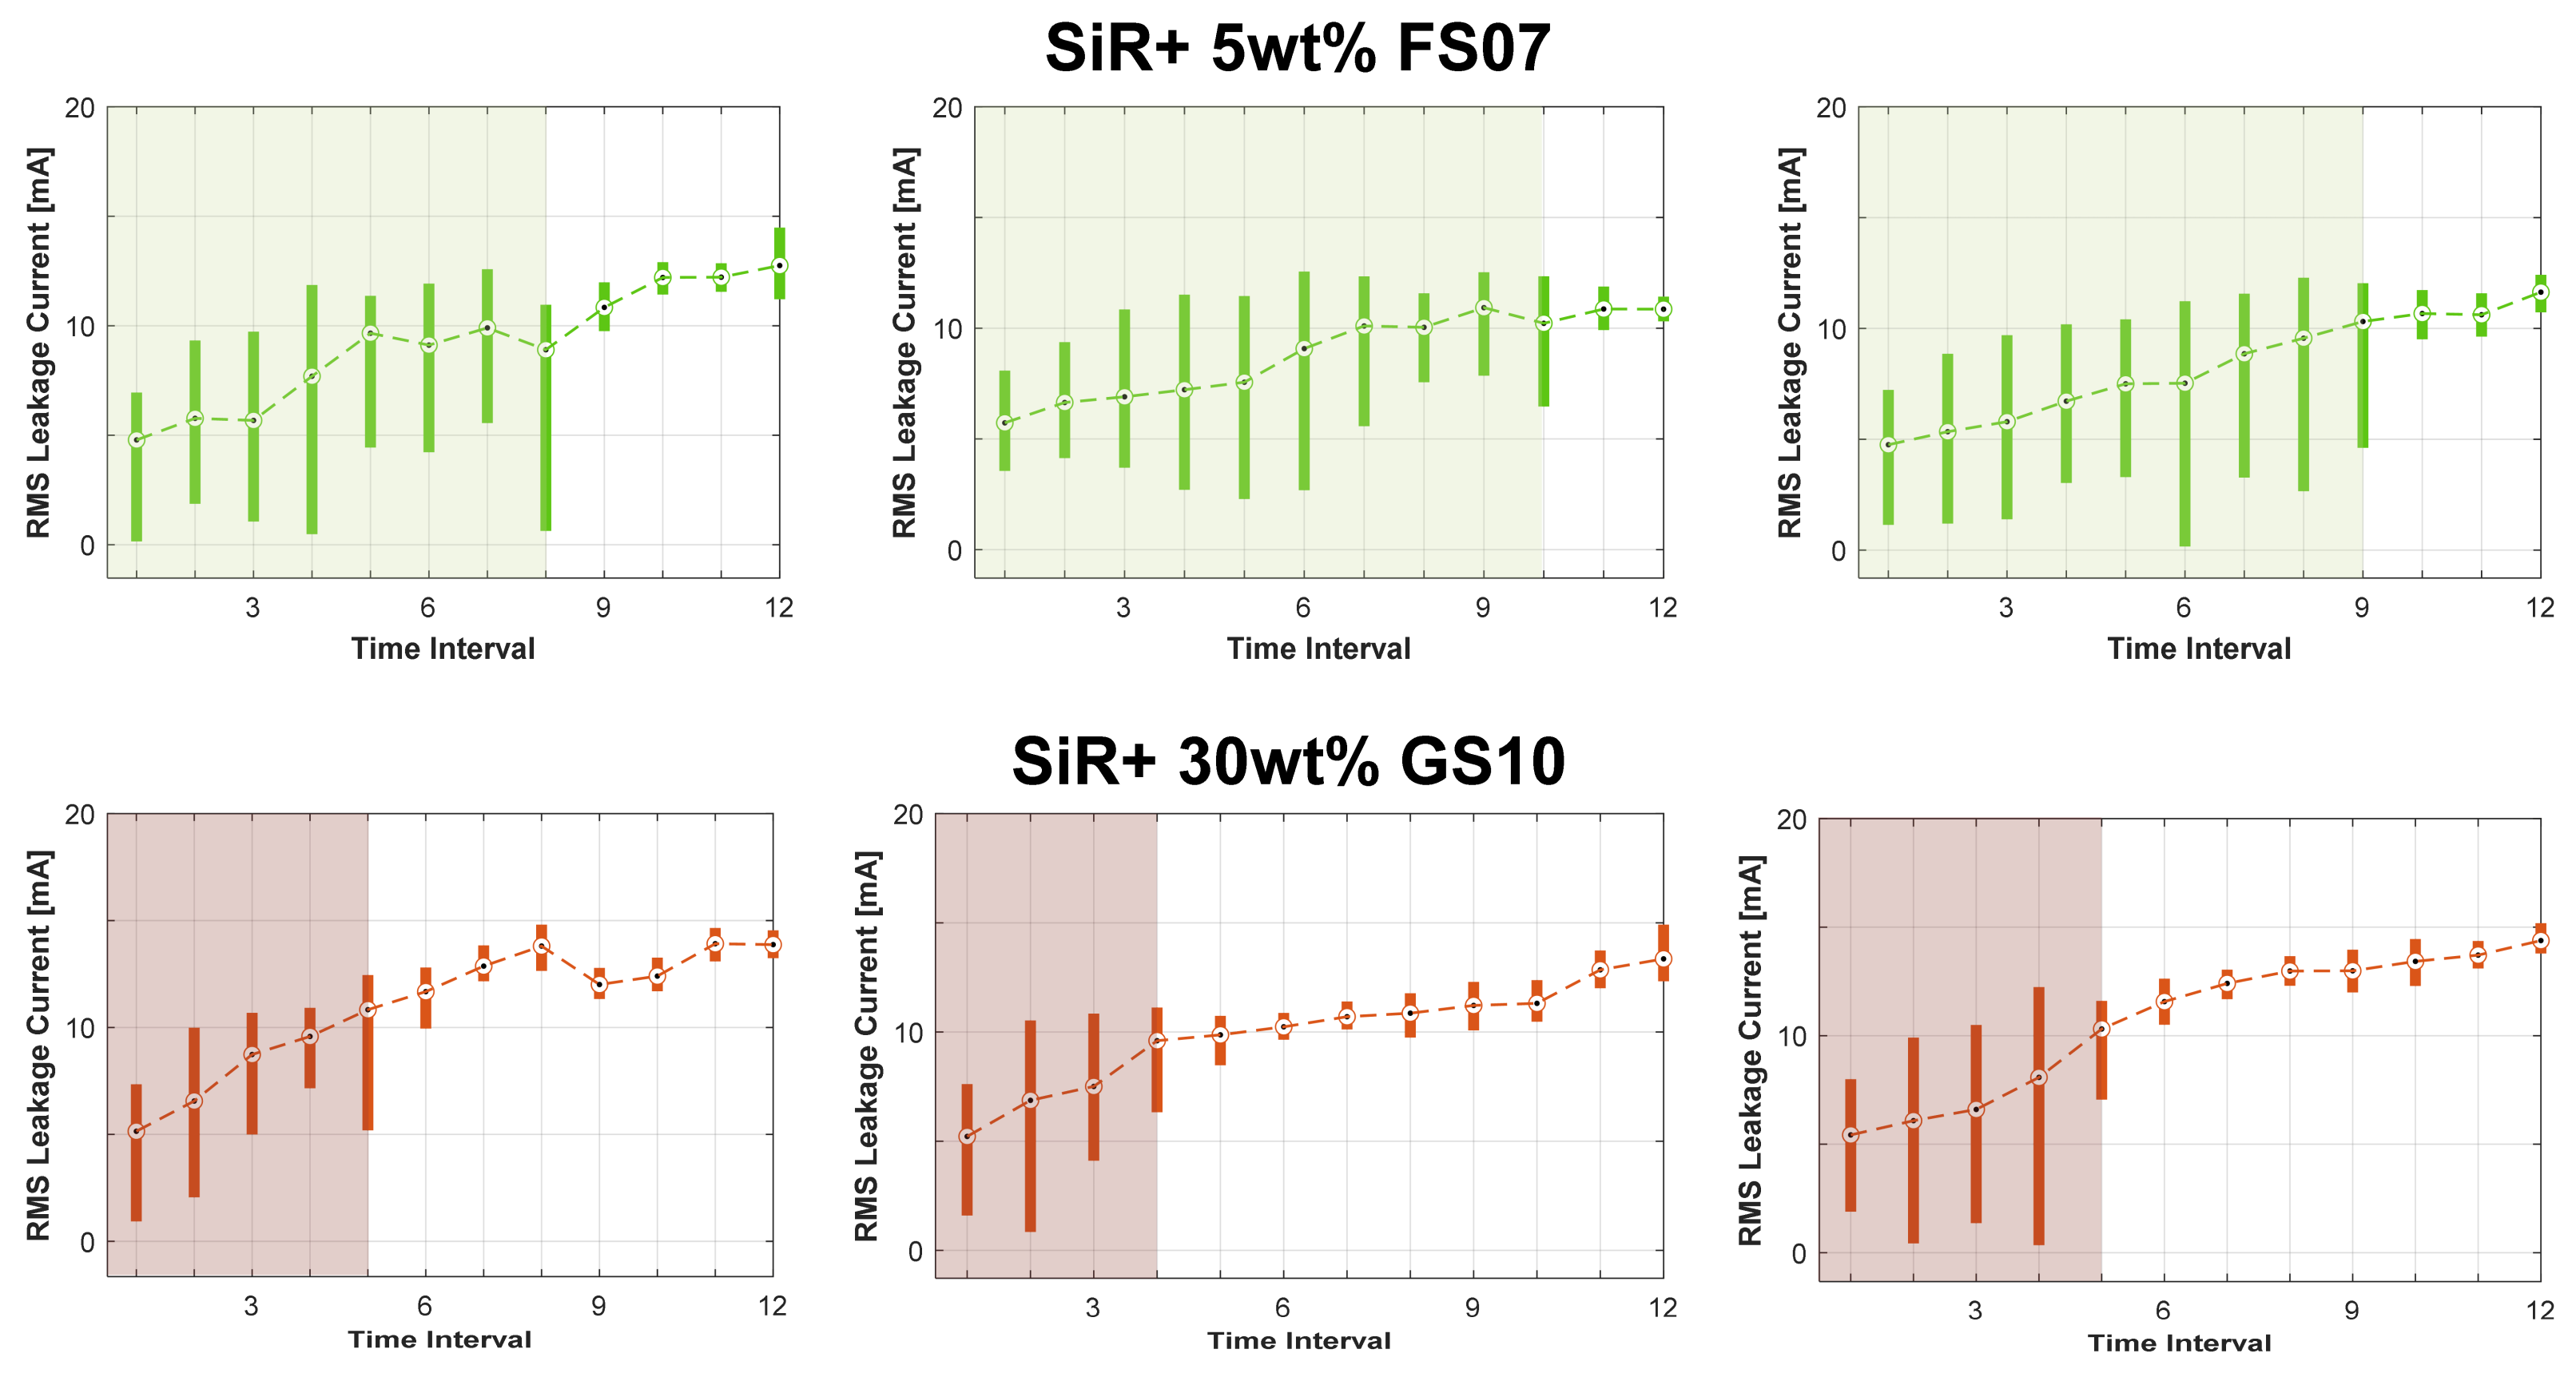
Figure 5 shows the statistical boxplots for a number of tested composites. The results indicate a faster inception of a stable eroding dry-band arc for the GS10 filled SiR compared to that of FS07 by 40–60 min (about 20% of the total testing duration). Similar outcomes were found in [12] for fumed silica filled composites against BN filled composites, which were attributed to the favorable interaction of fumed silica with SiR and a possible delay in the formation of the early surface residue by thermo-oxidation of the silicone volatiles.

3.2. Thermogravimetric–Differential Thermal Analysis

Figure 6 shows the TGA–DTA outcomes of the study. The TGA plot shown in Figure 6a is conducted for the prepared silica composites and the unfilled SiR. All of the composites and the unfilled SiR begin depolymerization at 400 °C, which, according to Camino et al. in [19], represents the scission of the Si-O bonds in SiR to produce cyclic oligomer volatiles. The rapid depolymerization of the unfilled SiR eventually leaves a low remnant residue of about 14.5 wt%. The TGA plot illustrated in [4] showed similar low remnant residues, while other studies [20,21] have shown the complete depolymerization of an unfilled SiR at the end of a TGA test. This variation could be attributed to a number of issues, such as the difference in suppliers and material preparation methods. For this study, 14.5 wt% was considered as the additional residue, possibly fused or crosslinked residue, produced for an unfilled SiR under TGA in an N2 atmosphere. Beyond 400 °C, the FS07 composite decomposes at a slightly higher rate than that of GS10, which is still considered comparable despite having a much lower filler loading.
Figure 6b shows the DTGA plot for both of the composites under an N2 atmosphere. The DTGA plot suggests the presence of multiple decomposition peaks, with the second one starting at temperatures higher than 500 °C. Camino et al., in [19], reported a radical-based crosslinking mechanism involving the homolytic scission of Si-CH3 bonds in SiR, which competes with depolymerization during the second decomposition stage at elevated temperatures. At the onset of the 500 °C temperature, the decomposition rate of the FS07 filled composite becomes lower than that of the GS10 filled composite, as observed in the shaded region of the DTGA plot in Figure 6b. This observation may suggest the influence of FS07 on suppressing depolymerization and promoting radical based crosslinking, despite being filled in SiR at one sixth of the filler loading level of the GS10 composite. In other words, the DTGA peaks appearing more distinctively with FS07 as compared to the GS10 filled SiR suggest interactions between fumed silica and the SiR matrix to promote radical-based crosslinking to a greater extent as compared to the interactions between ground silica and SiR. The rate of SiR depolymerization was found to be subject to the mobility and flexibility of the SiR siloxane chains, as indicated by Delebecq et al. in [22] and Hamadani et al. in [23]. It was reported in [6] that the high silanol group concentration on the fumed silica’s surface favorably interacts with the siloxane chains of SiR. Accordingly, this interaction could suppress the depolymerization and volatilization of SiR, as explained in [
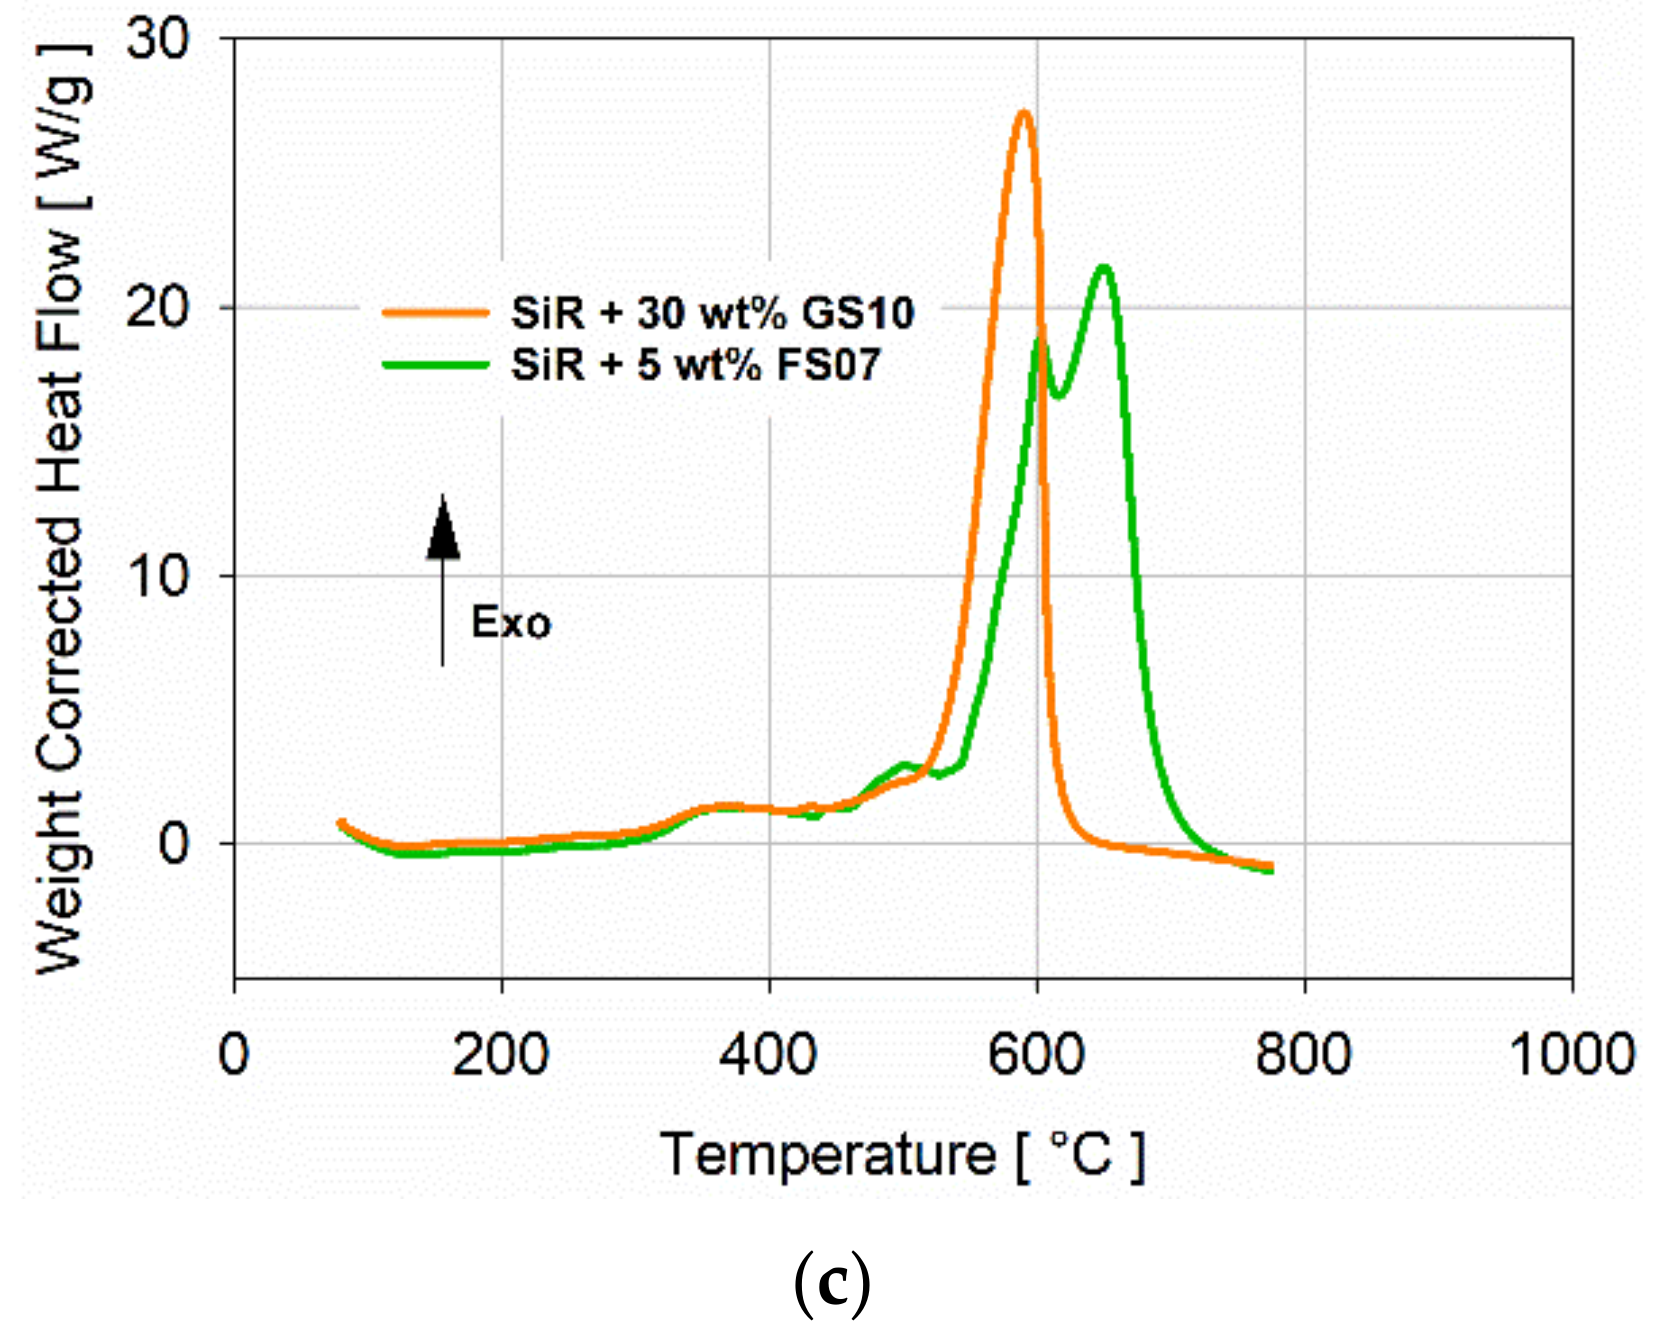
23]. To further support this conclusion, the DTA of both composites was conducted in an air atmosphere. The DTA plot shown in Figure 6c indicates the exothermic peaks obtained for both composites, which represent the combustion of the volatile SiR oligomers produced in depolymerization. Clearly, the suppressed depolymerization of the FS07 filled SiR leads to a lower exothermic peak compared to that of GS10.
The final wt% of TGA remnant residues (RTGA) obtained for both composites was found to be comparable, with the GS10 filled SiR having a slightly higher remnant residue by a difference of only 1.8%, despite being loaded at six times the filler loading of the FS07 filled SiR. This further indicates the role of FS07 in suppressing SiR depolymerization and promoting radical-based crosslinking. To clarify this quantitively, based on the computation illustrated in [4,11], the final assumed residue Rasm if the composite polymer and filler components independently decompose without interaction is calculated as follows:
Rasm = (14.5% × WSiR) + Wfiller
where WSiR and Wfiller are the weight fractions of the SiR and the filler in the composite, respectively. As mentioned earlier, the 14.5% represents the undecomposed portion of SiR that was found in the TGA plot of Figure 6a. The additional residue Radd obtained, which accounts for the role of the filler interaction with the SiR polymer, is calculated as follows:
Radd = RTGA − Rasm
Table 3 shows the calculated additional residue for each composite. Clearly, the additional residue obtained for the FS07 filled SiR, 52.6%, is much higher than that of GS10, 33%, by a factor of 1.6. This difference in the additional residue differentiates between the effect of each filler and its interaction with SiR on suppressing depolymerization and promoting crosslinking. The higher additional residue for the FS07 filled SiR could indicate a better suppression of depolymerization and a higher degree of crosslinking exhibited by the composite during TGA.
Figure 7 shows an SEM image of the obtained TGA residues for both of the composites. The GS10 filled SiR TGA residue surface was observed to be of a coarser nature in comparison to the FS07 filled SiR TGA residue. This could in part be a result of the higher particle size of GS10, as shown in the image, or a result of the lower crosslinking and higher volatilization leading to a more porous residue compared to that of the FS07 filled SiR. The FS07 filled SiR, on the other hand, appears to promote a coherent residue with radical-based crosslinking. The weakness of the GS10 filled SiR residue can be certainly observed in terms of the propagating surface fractures shown in Figure 7, which are not present in the FS07 filled SiR residue, indicating coherency in the residue characteristics of the latter. The coherency of the residue was proposed to have a barrier shielding effect on the SiR material against the progressive erosion of silica filled SiR composites under DC voltage [11]. These observations shown in the TGA plots and residues could be correlated with the erosion performance of the composites illustrated earlier, indicating the role of the FS07 filler and its interaction with SiR in promoting a more coherent residue, which, in turn, suppresses the progressive erosion of SiR and enhances the erosion performance of SiR.

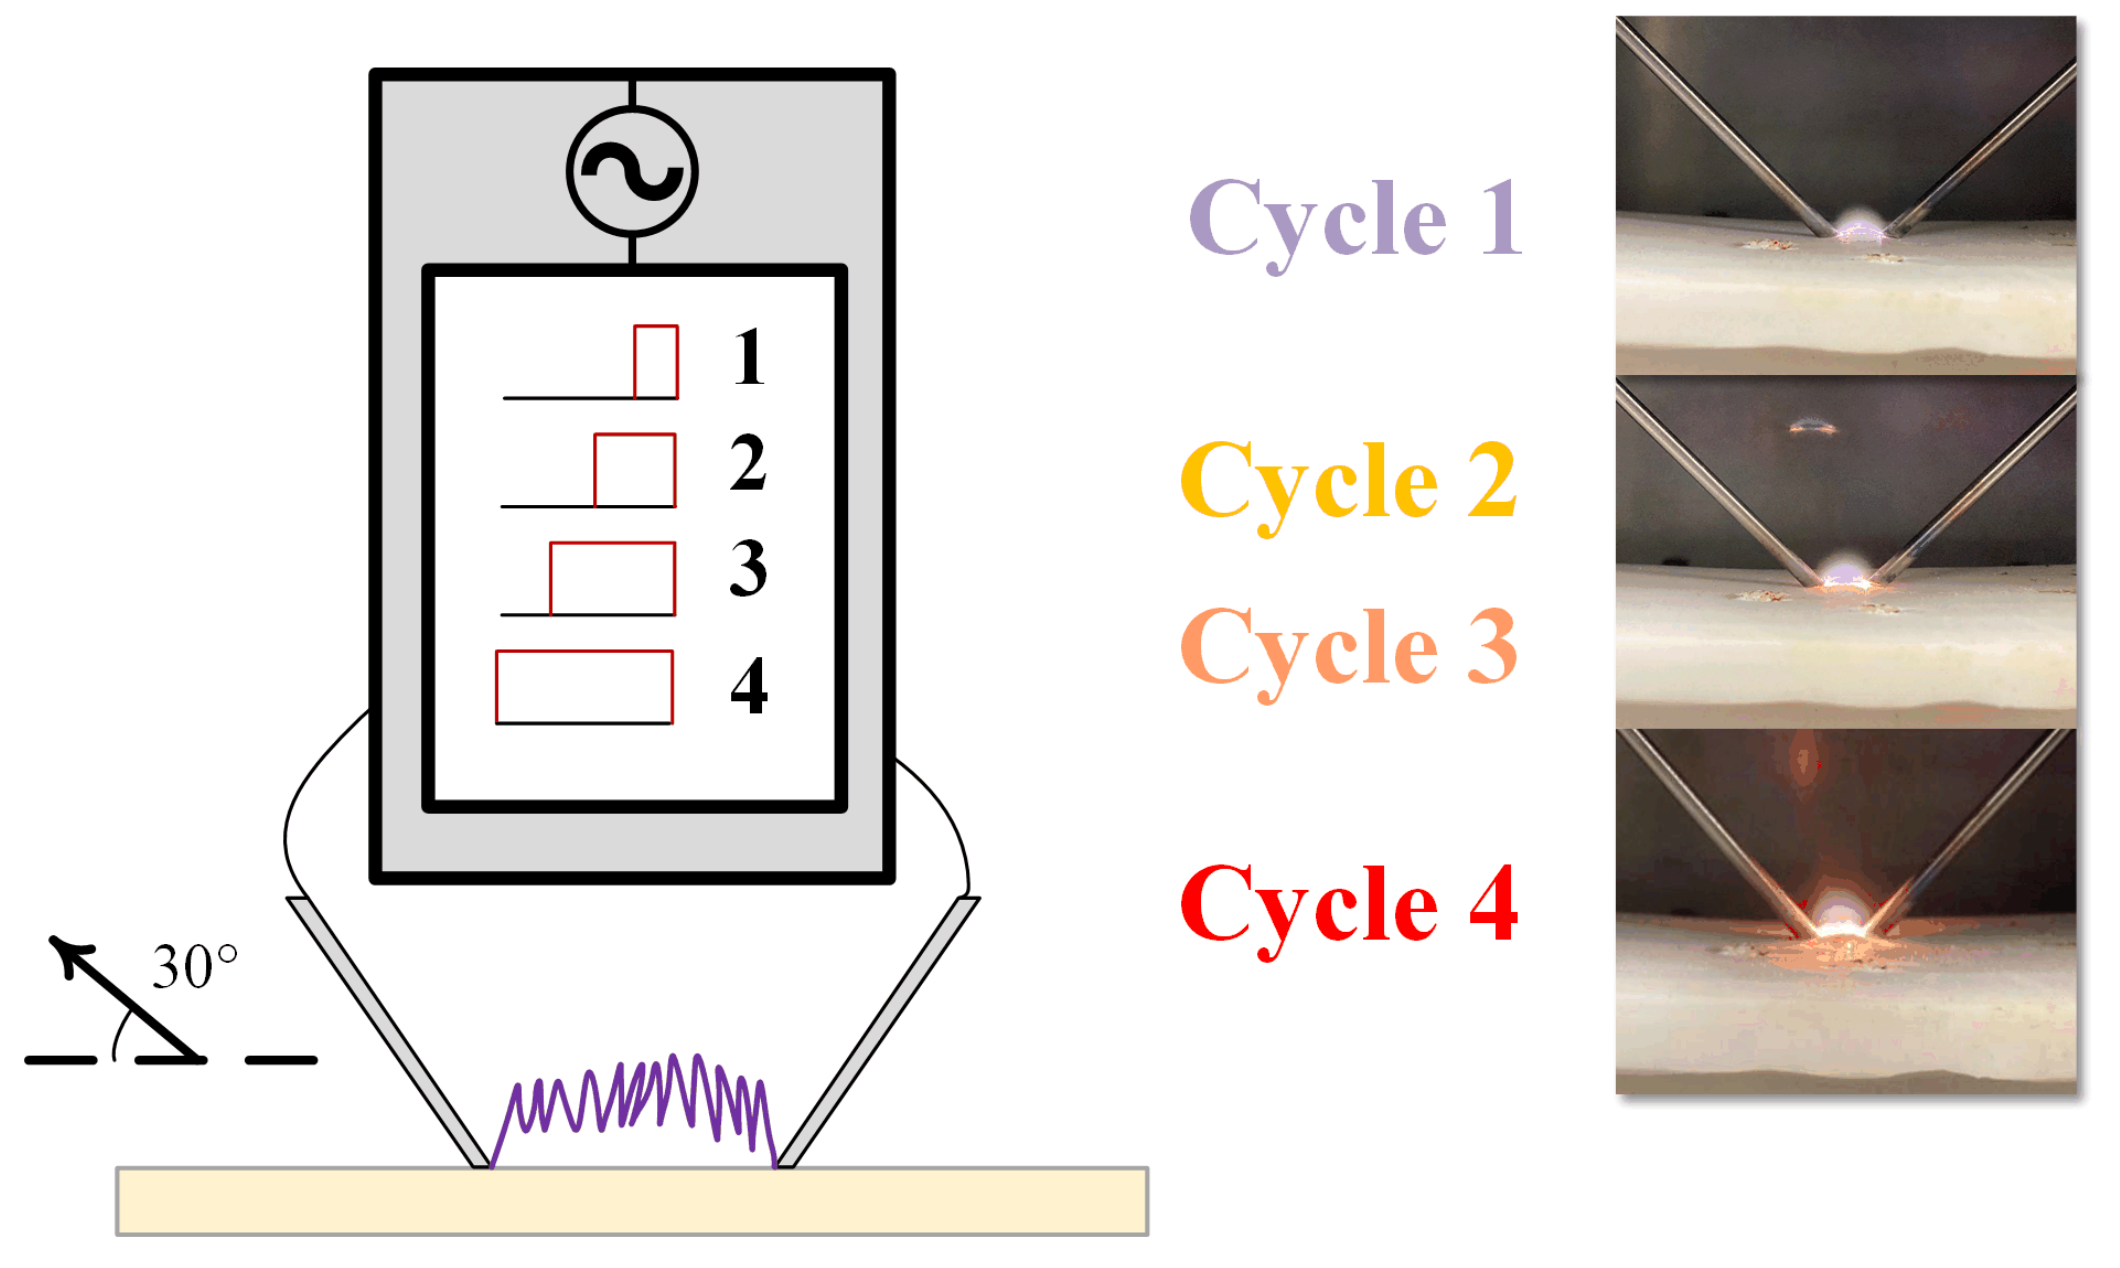
3.3. Residue Morphology Using the Dry-Arc Resistance Test

The formation of high additional residue with SiR composites could improve the erosion performance of SiR composites as a result of the formation of a coherent residue that shields the composite against an influx of heat from dry-band arcing. To better investigate this possible correlation, the dry-arc resistance test is utilized as a fast and controllable test for preparing eroded samples of the composites whose residues can be observed. 
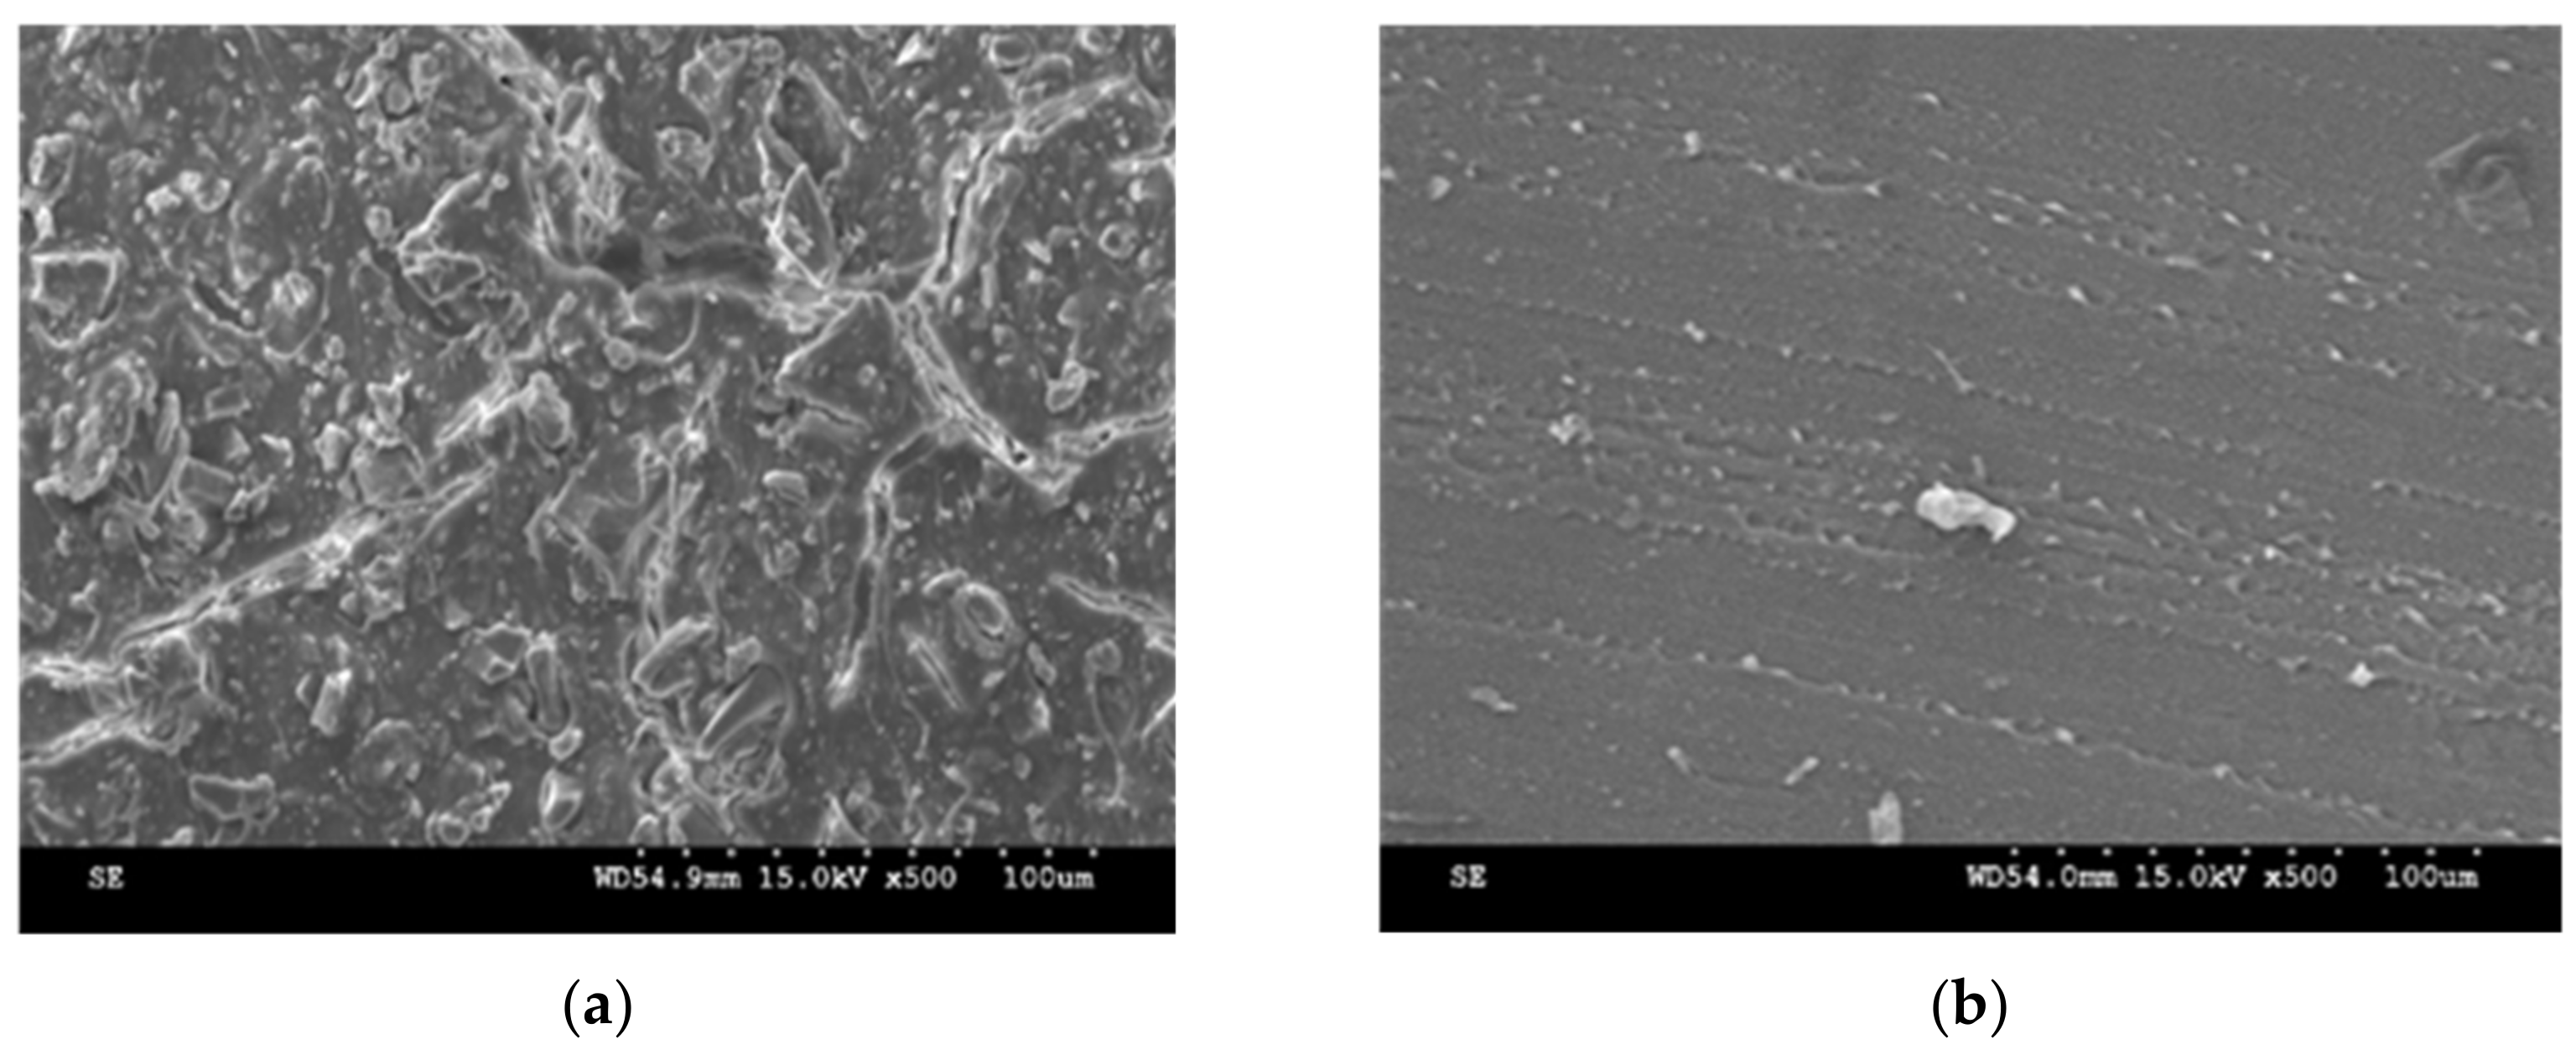
Figure 8 shows the microscopic images obtained for the eroded pits of the post-tested silica composites of the dry-arc resistance test. Figure 8a,b clearly shows that the residue obtained from the FS07 filled SiR is more coherent, with less cracks and surface splitting compared to the GS10 filled SiR residue, which is seemingly rougher with porous surfaces. This observation is also confirmed by the SEM images shown in Figure 8c,d. Through SEM, Nazir et al., in [24], reported similar observations with corona-aged SiR composites showing less cracks with nano silica filled SiR compared to micro silica. The integrity of the residue could be attributed to the role of the radical-based crosslinking promoted by FS07 interacting with SiR, leading to a more stable residue with coherency characteristics similar to that shown in the TGA residue of Figure 7. These observations could explain the better erosion performance obtained for the FS07 filled SiR, as shown in Figure 3.
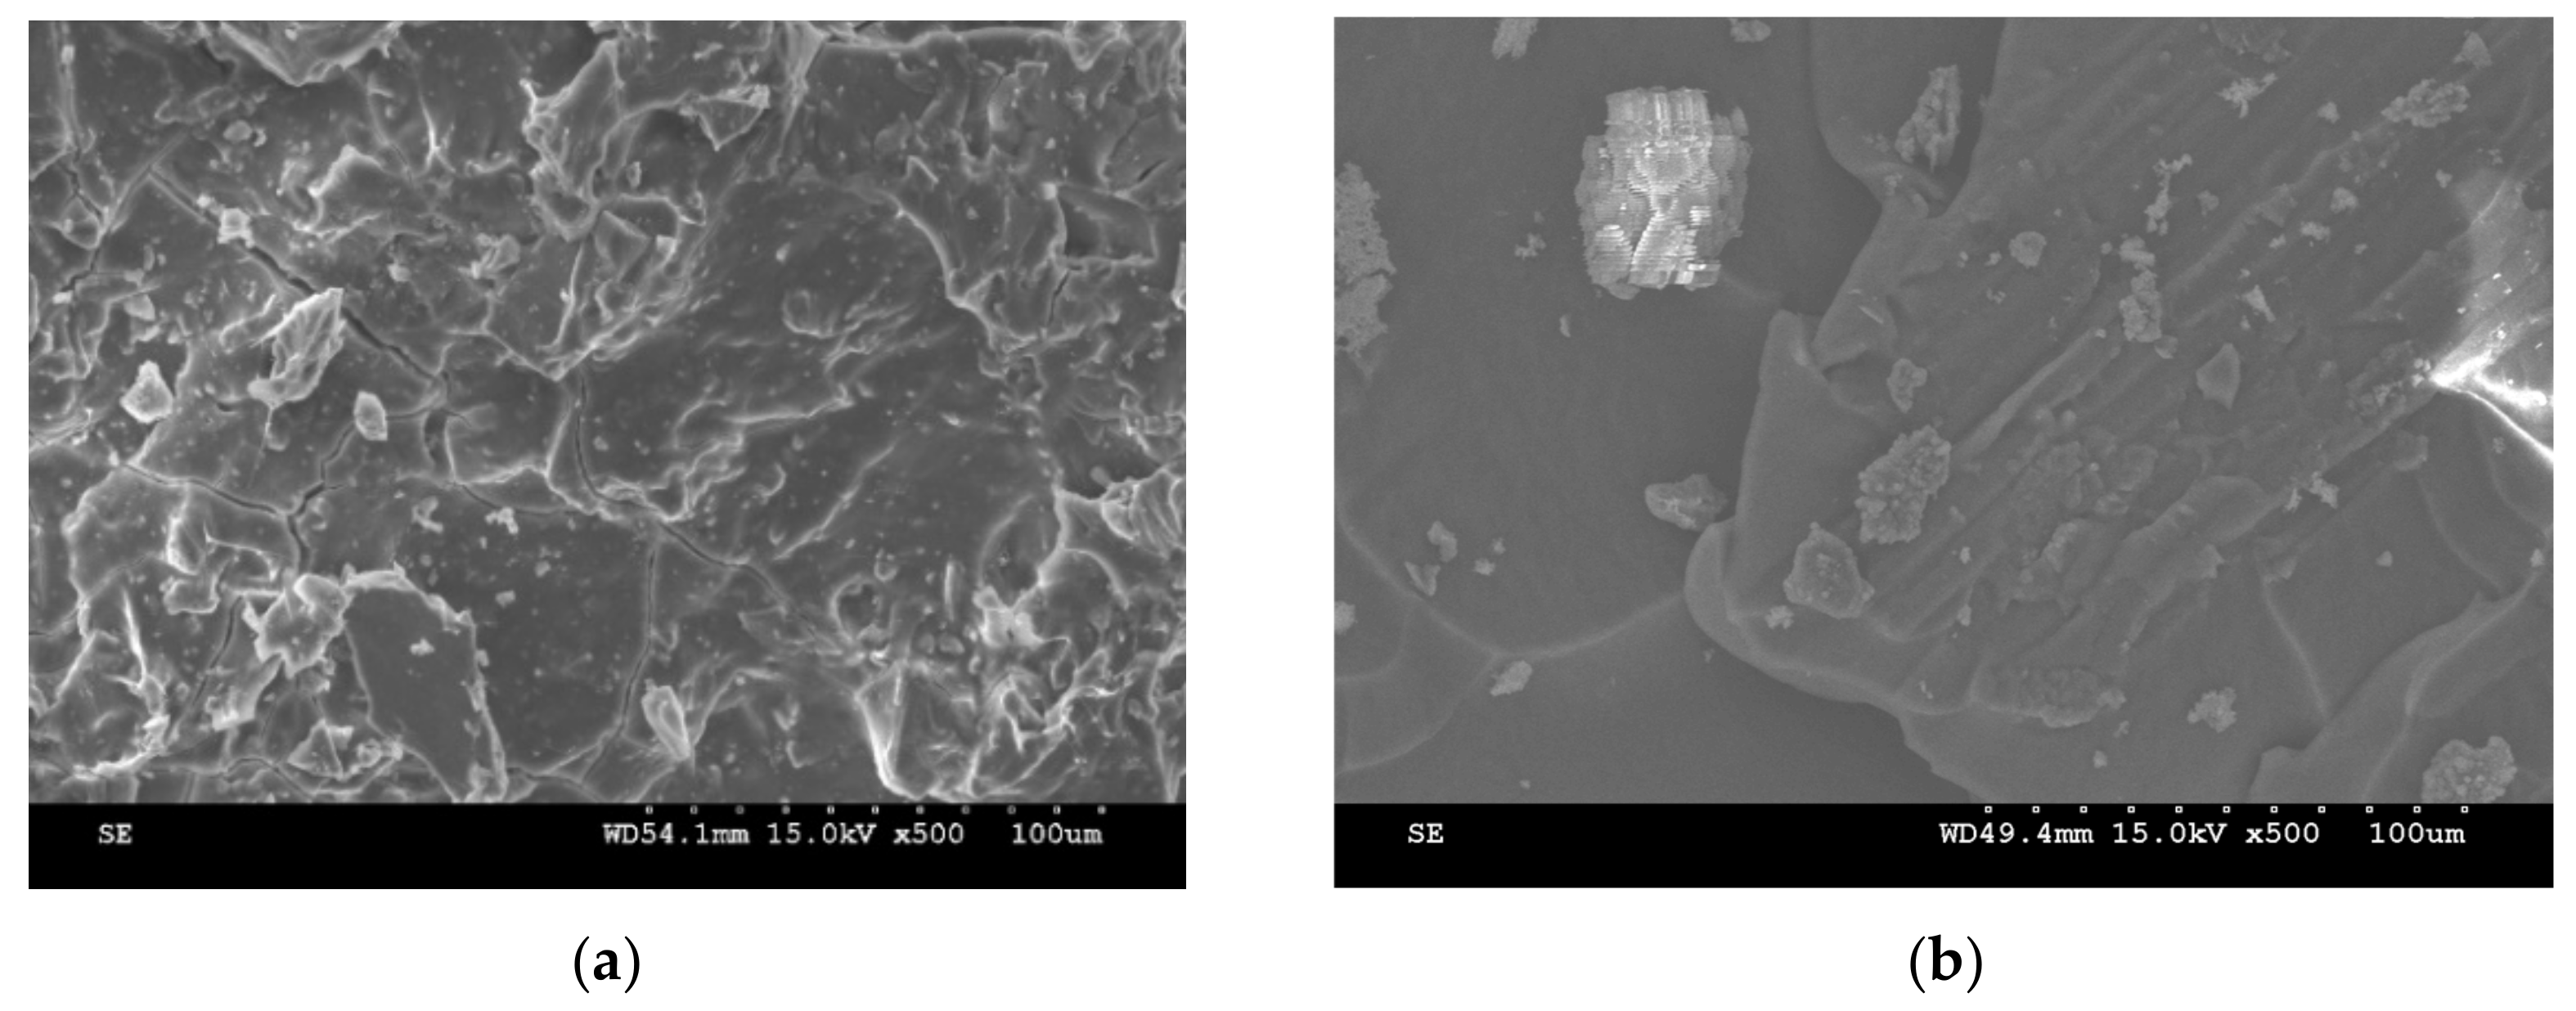
To further validate the applicability of using the dry-arc test for observing the residue morphology of eroded composites, SEM was used to observe the eroded residue of the post IPT tested composites for comparison against those obtained under the dry-arc resistance test. Figure 9 shows the images obtained using SEM for the IPT tested composites. As can be seen in Figure 9, the surface morphology of both of the composites under the IPT are similar to their counterparts in the dry-arc resistance test in terms of roughness and coherency. This similarity further justifies the use of the dry-arc test as part of this mechanistic study. Though the experimental conditions involved in both of the tests are completely different, such as the absence of a wet contaminant in the dry-arc resistance test, the interest of this study is to observe the heat ablation effect of the arc on the composites and analyze the eroded residue characteristics accordingly. Creating this joule heating effect using either test does not necessarily dictate that similar testing methods or experimental conditions are to be followed. With this understanding, the dry-arc resistance test is advantageous in terms of the higher degree of controllability obtained with stimulating fast SiR erosion as a result of sustaining the arc at one fixed location above the sample during the test. The difference between the testing conditions of the tests has no effect on changing the residue characteristics of the composites, as can be seen in Figure 9, which further justifies the use of the dry-arc resistance test.
Though the formation of coherent residue could enhance the erosion performance of the silica filled SiR composites, Delebecq et al., in [21], did explain that the carbon content of the residue could increase with increased SiR crosslinking. This increase in carbon content, however, would not significantly impact the composite during the IPT to cause a tracking failure, as explained in [11]. According to Kumagai et al., in [25], the analysis of the residue formed as a result of dry-band arcing in RTV SiR was found to contain 1 wt% of elemental carbon, which was considered insignificant for tracking. A simple demonstration of this would be achieved by testing the composites using the dry-arc resistance test for 10 s during the 1st current step of the test in cycle 1. Figure 10 shows the surface residue obtained for both composites after 10 s of the test in cycle 1 with equal electrode spacing. The FS07 filled composite shows a tendency to form a slightly higher burnt residue, possibly containing carbon, during the test compared to the GS10 filled composite. Still, however, the difference is insignificant, which is in line with [11,25].

3.4. Surface Roughness of Eroded Composites

Analyzing the surface roughness of eroded silica filled SiR composites could further elaborate on the role of silica fillers in the DC erosion performance of SiR composites. The two elements that are associated with the roughness analysis are waviness and average roughness. Waviness describes the texture of the overall surface profile along a defined displacement axis, while average roughness describes the short-wavelength (high frequency) variations superimposed on the waviness along the same displacement axis [16]. Figure 11 shows the 3D topography and corresponding waviness profiles for the silica filled samples eroded using a dry-arc test. Clearly, the waviness of the FS07 filled SiR composite indicates a smoother surface with lower variations in the peak heights and valley depths within different segments of the profile. It is important to highlight that the erosion depth of the fumed silica filled SiR composite was found to be of higher value compared to that of the ground silica filled composite in the dry-arc resistance test, as shown in Figure 11c,d. This contrasts the +DC IPT outcomes of this study, which have been highlighted in Figure 3a. This implies that the use of the dry-arc resistance test in its standard testing conditions to assess the erosion performance of the composites in terms of erosion depth would not suffice. Rather, further modification of the testing conditions of the dry-arc resistance test are required to produce erosion depth ranking outcomes similar to those of the IPT for these specific composites. As mentioned earlier, the dry-arc resistance test is only used for the purpose of producing controlled arcing for post-testing residue analysis and not as means to rank the erosion performance of the composites in terms of the erosion depths. Using the dry-arc test in its standard form as a means to compare the erosion performance of the composites could work if both of the composites had equivalent filler loadings. An example of this would be in using the dry-arc resistance setup to test the erosion performance of a 30 wt% GS10 filled SiR against a 5 wt% FS07 + a 25 wt% GS10 filled SiR or a 10 wt% FS07 + a 20 wt% GS10 filled SiR composites.
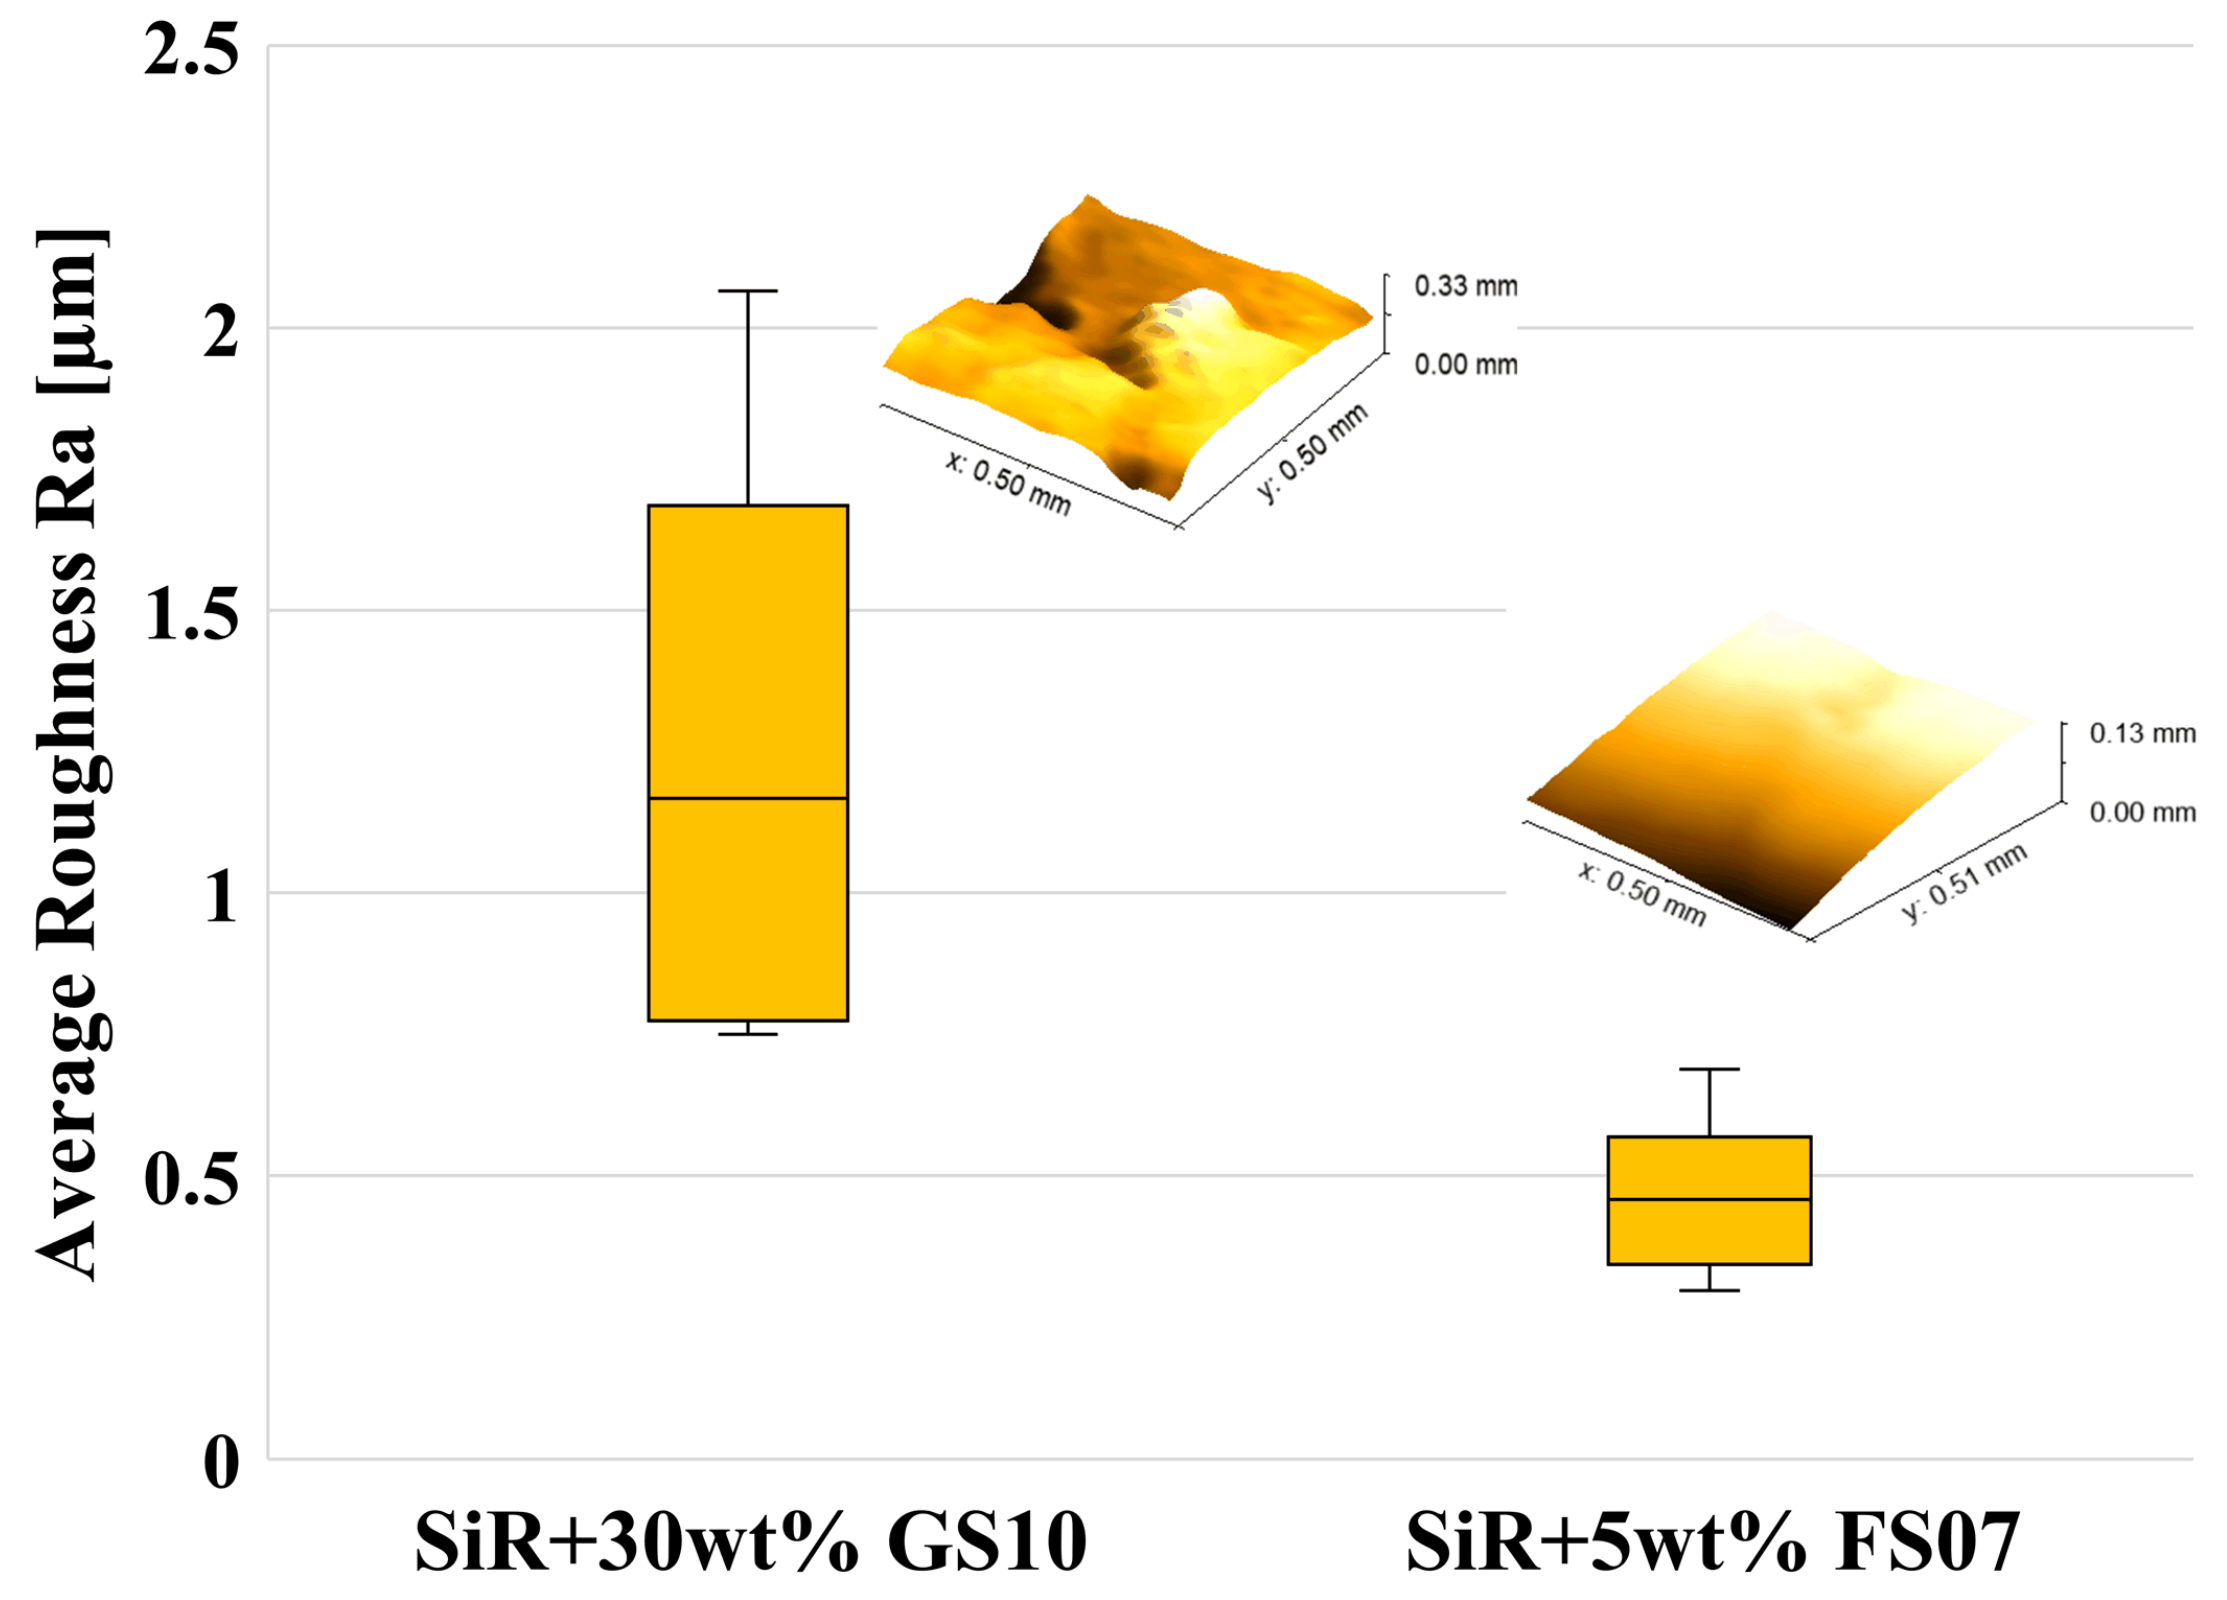
Figure 12 shows the statistical boxplot for the average roughness value distribution, Ra, of the sampled areas shown in the plot. A total of 10 profile lines were taken for each sampled area. Accordingly, each boxplot shows the median, 25th and 75th percentile and the minimum and maximum values for Ra within the 10 profiles. The wider variation and higher median value of Ra for the GS10 filled composite indicates a rough profile within small segments of the composites, which could indicate a higher degree of surface porosity compared to the FS07 filled SiR composite.
Based on Figure 11 and Figure 12, the GS10 filled composite surface residue is of higher roughness with the overall surface waviness and within the smaller segments of the surface. Surface roughness could significantly impact the erosion performance of the composite due to a number of reasons. Under the salt-fog test, Deng et al., in [26], explained that rough SiR surfaces with large filler particle sizes tend to cause a higher impairment of the hydrophobicity retention properties of SiR. In their study, leakage currents developed at higher magnitudes with SiR composites having small filler particle sizes and less surface roughness. On the other hand, Kozako et al., in [27], illustrated that the addition of nano silica to their SiR composites did not have much of an influence on changing the hydrophobic properties of SiR, despite a slight increase in the surface roughness with respect to the unfilled SiR. Moreover, it is possible that the rough surface texture of the residue at early stages of the IPT could interrupt the smooth flow of liquid contaminant during the test, leading to more localized dry-band arcs being formed on the insulator surface as a result of liquid contaminant being trapped within small, eroded pits.

4. Conclusions

The presented paper illustrated the role of fumed silica and ground silica fillers in suppressing the DC erosion of SiR through a novel framework. The erosion performance outcomes suggest that fumed silica and its interaction with SiR were effective in promoting the formation of a coherent shielding residue, which resulted in suppressing the DC erosion of SiR. This was found despite the higher composite thermal conductivity of the ground silica filled composite, which further supports the influence of the filler’s interface interactions over enhancements in the thermal conductivity on suppressing DC erosion. Simultaneous TGA–DTA analysis shows the significant influence of fumed silica in suppressing depolymerization and promoting radical-based crosslinking at high temperatures in SiR as a result of its favorable interaction with the siloxane chains of the polymer tethering their flexibility and mobility during depolymerization. This results in the formation of a much higher additional residue with the fumed silica filled composite, despite being filled at one sixth of the loading level of the ground silica filled composite. The formation of a higher additional residue could result in a higher carbon content, which still would not be enough to promote a tracking failure during the IPT. The microscopy conducted on the eroded composites from the dry-arc resistance test shows coherency and low surface fracture in the residue of the fumed silica filled composite. This could also explain the better erosion performance of the composite as a result of the shielding effect of the coherent residue preventing progressive erosion. Moreover, the surface morphology outcomes of the dry-arc tested composites are consistent with those of the IPT, which validates the use of the dry-arc test as part of this framework. The surface roughness outcomes show a rougher surface waviness and higher values of Ra for the ground silica filled composite, which could further indicate the weakness and porosity of the residue, leading to an inferior performance under the IPT. The overall conclusion of the study suggests a significant role for the silica filler size in suppressing the erosion of SiR under DC voltage as a result of its influence on the eroded residue characteristics.

Author Contributions

Conceptualization, A.Y.A., R.A.G. and E.D.; methodology, A.Y.A., R.A.G. and E.D.; software, A.Y.A.; validation, R.A.G. and E.D.; formal analysis, A.Y.A., R.A.G. and E.D.; investigation, A.Y.A.; resources, R.A.G. and E.D.; data curation, A.Y.A.; writing—original draft preparation, A.Y.A.; writing—review and editing, A.Y.A., R.A.G. and E.D.; visualization, A.Y.A.; supervision, R.A.G. and E.D.; project administration, R.A.G. and E.D.; funding acquisition, R.A.G. All authors have read and agreed to the published version of the manuscript.

Funding

The authors of the paper would like to thank the Natural Sciences and Engineering Research of Canada (NSERC) and the National Research Council Canada (NRC) for their financial support.

Acknowledgments

The authors would like to thank Souheil-Antoine Tahan, Simon Laflamme, Mohammad Saadati and Joel Grignon for providing the permission, technical help and advice needed to complete the microscopic part of this study.

Conflicts of Interest

The authors declare no conflict of interest.

References

  1. Sun, J.; Li, M.; Zhang, Z.; Xu, T.; He, J.; Wang, H.; Li, G.; Rensselaer Polytechnic Institute; State Grid Corporation of China; China Electric Power Research Institute. Renewable energy transmission by HVDC across the continent: System challenges and opportunities. CSEE J. Power Energy Syst. 2017, 3, 353–364. [Google Scholar] [CrossRef]
  2. Fleeman, J.A.; Gutman, R.; Heyeck, M.; Bahrman, M.; Normark, B. EHV AC and HVDC transmission working together to integrate renewable power. In Proceedings of the 2009 CIGRE/IEEE PES Joint Symposium Integration of Wide-Scale Renewable Resources into the Power Delivery System, Calgary, AB, Canada, 29–31 July 2009; p. 1. [Google Scholar]
  3. Meyer, L.; Jayaram, S.; Cherney, E.A. Thermal conductivity of filled silicone rubber and its relationship to erosion resistance in the inclined plane test. IEEE Trans. Dielectr. Electr. Insul. 2004, 11, 620–630. [Google Scholar] [CrossRef]
  4. El-Hag, A.H.; Simon, L.C.; Jayaram, S.H.; Cherney, E.A. Erosion resistance of nano-filled silicone rubber. IEEE Trans. Dielectr. Electr. Insul. 2006, 13, 122–128. [Google Scholar] [CrossRef]
  5. Nazir, M.T.; Phung, B.T.; Yu, S.; Zhang, Y.; Li, S. Tracking, erosion and thermal distribution of micro-AlN+ nano-SiO2 co-filled silicone rubber for high-voltage outdoor insulation. High Volt. 2018, 3, 289–294. [Google Scholar] [CrossRef]
  6. Ramirez, I.; Jarayam, S.; Cherney, E.A. Performance of silicone rubber nanocomposites in salt-fog, inclined plane, and laser ablation tests. IEEE Trans. Dielectr. Electr. Insul. 2010, 17, 206–213. [Google Scholar] [CrossRef]
  7. Ansorge, S.; Schmuck, F.; Papailiou, K.O. Improved silicone rubbers for the use as housing material in composite insulators. IEEE Trans. Dielectr. Electr. Insul. 2012, 19, 209–217. [Google Scholar] [CrossRef]
  8. Bruce, G.P.; Rowland, S.M.; Krivda, A. Performance of silicone rubber in DC inclined plane tracking tests. IEEE Trans. Dielectr. Electr. Insul. 2010, 17, 521–532. [Google Scholar] [CrossRef]
  9. Cherney, E.A.; Gorur, R.S.; Krivda, A.; Jayaram, S.H.; Rowland, S.M.; Li, S.; Marzinotto, M.; Ghunem, R.A.; Ramirez, I. DC inclined-plane tracking and erosion test of insulating materials. IEEE Trans. Dielectr. Electr. Insul. 2015, 22, 211–217. [Google Scholar] [CrossRef]
  10. Ghunem, R.A.; Jayaram, S.H.; Cherney, E.A. Suppression of silicone rubber erosion by alumina trihydrate and silica fillers from dry-band arcing under DC. IEEE Trans. Dielectr. Electr. Insul. 2015, 22, 14–20. [Google Scholar] [CrossRef]
  11. Koné, D.; Ghunem, R.A.; Cissé, L.; Hadjadj, Y.; El-Hag, A.H. Effect of residue formed during the AC and DC dry-band arcing on silicone rubber filled with natural silica. IEEE Trans. Dielectr. Electr. Insul. 2019, 26, 1620–1626. [Google Scholar] [CrossRef]
  12. Alqudsi, A.; Ghunem, R.; David, E. Analyzing the Role of Filler Interface on the Erosion Performance of Filled RTV Silicone Rubber under DC Dry-band Arcing. IEEE Trans. Dielectr. Electr. Insul. (accepted; in press).
  13. IEC 60587. Electrical Insulating Materials Used Under Severe Ambient Conditions—Test Methods for Evaluating Resistance to Tracking and Erosion; IEC: Geneva, Switzerland, 2007. [Google Scholar]
  14. ASTM D 495-14. Standard Test Method for High-Voltage, Low-Current, Dry Arc Resistance of Solid Electrical Insulation; ASTM: West Conshohocken, PA, USA, 2018. [Google Scholar]
  15. ASTM D7984-16. Standard Test Method for Measurement of Thermal Effusivity of Fabrics Using a Modified Transient Plane Source (MTPS) Instrument; ASTM: West Conshohocken, PA, USA, 2016. [Google Scholar]
  16. ASME B46.1. Surface Texture (Surface Roughness, Waviness, and Lay); ASME: New York, NY, USA, 2019. [Google Scholar]
  17. Hshieh, F.-Y. Shielding effects of silica-ash layer on the combustion of silicones and their possible applications on the fire retardancy of organic polymers. Fire Mater. 1998, 22, 69–76. [Google Scholar] [CrossRef]
  18. Timpe, D.C., Jr. Silicone Rubber Flame Resistance. In Proceedings of the Hose Manufacturer Conference, Cleveland, OH, USA, 11–12 June 2007. [Google Scholar]
  19. Camino, G.; Lomakin, S.M.; Lageard, M. Thermal polydimethylsiloxane degradation. Part 2. The degradation mechanisms. Polymer 2002, 43, 2011–2015. [Google Scholar] [CrossRef]
  20. Camino, G.; Lomakin, S.M.; Lazzari, M. Polydimethylsiloxane thermal degradation. Part 1. Kinetic aspects. Polymer 2001, 42, 2395–2402. [Google Scholar] [CrossRef]
  21. Hermansson, A.; Hjertberg, T.; Sultan, B.-A. The flame retardant mechanism of polyolefins modified with chalk and silicone elastomer. Fire Mater. 2003, 27, 51–70. [Google Scholar] [CrossRef]
  22. Delebecq, E.; Hamdani-Devarennes, S.; Raeke, J.; Cuesta, J.-M.L.; Ganachaud, F. High Residue Contents Indebted by Platinum and Silica Synergistic Action During the Pyrolysis of Silicone Formulations. ACS Appl. Mater. Interfaces 2011, 3, 869–880. [Google Scholar] [CrossRef] [PubMed]
  23. Hamdani, S.; Longuet, C.; Perrin, D.; Lopez-Cuesta, J.; Ganachaud, F. Flame retardancy of silicone-based materials. Polym. Degrad. Stabil. 2009, 94, 465–495. [Google Scholar] [CrossRef]
  24. Nazir, M.T.; Phung, B.T.; Hoffman, M. Performance of silicone rubber composites with SiO2 micro/nano-filler under AC corona discharge. IEEE Trans. Dielectr. Electr. Insul. 2016, 23, 2804–2815. [Google Scholar] [CrossRef]
  25. Kumagai, S.; Wang, X.; Yoshimura, N. Solid residue formation of RTV silicone rubber due to dry-band arcing and thermal decomposition. IEEE Trans. Dielectr. Electr. Insul. 1998, 5, 281–289. [Google Scholar] [CrossRef]
  26. Deng, H.; Hackam, R.; Cherney, E.A. Role of the size of particles of alumina trihydrate filler on the life of RTV silicone rubber coating. IEEE Trans. Power Deliv. 1995, 10, 1012–1024. [Google Scholar] [CrossRef]
  27. Kozako, M.; Higashikoji, M.; Tominaga, T.; Hikita, M.; Ueta, G.; Okabe, S.; Tanaka, T. Fabrication of silicone rubber nanocomposites and quantitative evaluation of dispersion state of nanofillers. IEEE Trans. Dielectr. Electr. Insul. 2012, 19, 1760–1767. [Google Scholar] [CrossRef]
Figure 1. +DC inclined plane-tracking and erosion test (IPT) setup with the leakage current acquisition system.
Energies 14 03449 g001
Figure 2. Dry-arc resistance test with images of the test during the 4 cycles of operation.
Energies 14 03449 g002
Figure 3. (a) +DC IPT erosion depth outcomes for the tested composites. (b) Images of the post tested +DC IPT composite specimens.
Energies 14 03449 g003
Figure 4. (a) Root-mean-square (RMS) leakage current for a GS10 filled silicone rubber (SiR) sample during the +DC IPT and (b) corresponding statistical boxplot representation for the first 12 20-min time intervals, first 240 min, of the test.
Energies 14 03449 g004
Figure 5. Statistical boxplot outcomes for selected samples of the +DC IPT tested composites during the first 12 20-min time intervals of the test.
Energies 14 03449 g005
Figure 6. (a) Thermogravimetric analysis (TGA) for the prepared composites and the unfilled SiR in an N2 atmosphere. (b) Corresponding differential thermogravimetric analysis (DTGA) plot for the silica filled composites. (c) DTA for the prepared composites in an air atmosphere.
Energies 14 03449 g006aEnergies 14 03449 g006b
Figure 7. (a) Scanning electron microscopy (SEM) images for the TGA residue for the SiR + 30 wt% GS10 and (b) TGA residue for the SiR + 5 wt% FS07 under an N2 atmosphere.
Energies 14 03449 g007
Figure 8. Microscopic images of dry-arc resistance post-tested samples at a magnification of 50 for (a) SiR + 10 wt% GS10 and (b) SiR + 5 wt% FS07 composites, and SEM imaging at a magnification of 15 k for (c) the SiR + 30 wt% GS10 and (d) SiR + 5 wt% FS07 composites.
Energies 14 03449 g008
Figure 9. SEM imaging at a magnification of 15 k for (a) the SiR + 30 wt% GS10 and (b) SiR + 5 wt% FS07 composites tested using the +DC IPT.
Energies 14 03449 g009
Figure 10. Surface residue of (a) the SiR + 30 wt% GS10 and (b) SiR + 5 wt%FS07 composites tested using the dry-arc resistance test for the first 10 s of cycle 1.
Energies 14 03449 g010
Figure 11. Three-dimensional topography of the (a) the SiR + 30 wt% GS10 and (b) SiR + 5 wt% FS07 composites tested using the dry-arc resistance test. Corresponding waviness profiles for (c) SiR + 30 wt% GS10 and (d) SiR + 5 wt% FS07 composites.
Energies 14 03449 g011
Figure 12. Statistical boxplot representation of 10 values of Ra for the sampled areas shown for each composite. The center bar represents the median value, the top and bottom box edges represent the 25th and 75th percentile values, respectively, while the top and bottom markers represent the minimum and maximum values of Ra, respectively.
Energies 14 03449 g012
Table 1. Filler properties and prepared composites.
Filler TypeSupplierFiller CodeParticle Size (µm)Specific Surface Area (m2/g)Specific GravityComposite Formulation
Fumed silicaSigma AldrichFS077 × 10−33902.3SiR + 5 wt% FS07
Ground silicaUS SilicaGS1010.5 1NA 22.65SiR + 30 wt% GS10
1 Median particle size. 2 Not applicable for micro-sized fillers.
Table 2. Thermal conductivity measurements (k) of the composites based on the 15 acquired measurements of each composite with a precision of ±1%.
CompositeMinimum k
( W / m · K )
Maximum k
( W / m · K )
Average k
( W / m · K )
SiR + 5 wt% FS070.1690.2050.188
SiR + 30 wt% GS100.4000.4300.409
Table 3. Calculation of the additional residue Radd of the composites.
CompositeWSiR (%)Wfiller (%)RTGA (%)Rasm (%)Radd (%)
SiR + 5 wt% FS0795571.418.852.6
SiR + 30 wt% GS10703073.240.233
Publisher’s Note: MDPI stays neutral with regard to jurisdictional claims in published maps and institutional affiliations.

