
The Use of Hierarchical Agglomeration Methods in Assessing the Polish Energy Market


Faculty of Mining, Safety Engineering and Industrial Automation, Silesian University of Technology, 44-100 Gliwice, Poland
*
Author to whom correspondence should be addressed.
Energies 2021, 14(13), 3958; https://0-doi-org.brum.beds.ac.uk/10.3390/en14133958
Submission received: 16 April 2021
/
Revised: 25 June 2021
/
Accepted: 25 June 2021
/
Published: 1 July 2021
(This article belongs to the Special Issue Managing Energy Sector Enterprises: Challenges, Methods and Research Trends)
Abstract
:Energy markets play an important role in achieving sustainable development goals. The sector of energy has a huge impact on the environment, hence changes in it are the highest priority in the European Union. The process of shaping and developing the internal energy market plays an important role in improving the security of supply of energy resources for the entire union. It requires a number of political negotiations, strategic decisions regarding energy liberalization, in particular, the electricity and gas sectors, as well as the adoption of sectoral legislation. The aim of the conducted research is to estimate the level of development of energy markets in the EU countries and to indicate the position of Poland in comparison to other countries. The research was performed in several stages. The first phase consisted of selecting appropriate diagnostic variables that comprehensively describe energy markets in countries belonging to the European Union. The next stage was collecting data, subjecting them to standardization, and then, based on the agglomeration algorithm, the process of dividing into groups of similar countries was carried out. The research results can be used as guidelines for legal regulations being prepared in the energy sectors of all member states, which can be used for selected clusters comprising similar countries in terms of the development of energy markets.
1. Introduction
Forecasts by the International Energy Agency indicate that by 2040, global electricity demand will increase by 45% to 67%, driven mainly by China, India, and Southeast Asia. In addition, between 60% and 80% of primary energy will still come from fossil fuels. Coal consumption is expected to grow with rising demand in Asia, driven by electrification and economic development [1]. The European Union is and will continue to import energy resources and goods to a large extent from countries where strict emission limits and environmental standards do not apply. In 2018, the cost of importing fossil fuels to the EU amounted to EUR 400 billion, or 2.5% of the EU’s GDP. The largest share of imports is crude oil, followed by gas and coal [2].
The basic world resources of energy to produce electricity are fossil fuels, namely crude oil, different types of coal, and natural gas. Their dominant role in the market of energy raw materials, according to forecasts, will persist for a minimum of the next two decades. In the year 2012, crude oil accounted for 33% of global consumption, followed by coal fuels accounting for 30%, and natural gas accounting for 24%. By contrast, nuclear energy accounted for only 4%, and renewable energy 9% of global consumption [3]. The structure of the use of energy sources in Europe is a bit different than the global structure.
In the year 2020, the share of solid fuels in the EU amounted to 11% of the whole energy consumption across the EU. Liquid fuels amounted to 37%, and respectively gas 32%, nuclear energy 12%, and renewable energy 8% [4].
For the last few years, the share of renewable energy sources (RES) has increased significantly and started to compete with coal, oil, gas, and nuclear energy [5,6]. Forecasts for 2030 and scenarios for the development of energy sectors indicate a further continuation of the upward trend in the use of renewable sources in the energy sector [7,8,9]. Nuclear energy is still very controversial because of all its hazards and risks, mentioning only the nuclear accidents and radioactive waste management [10]. European directives and climate and energy policy until 2030 are primarily aimed at decarbonization activities and the development of a low-carbon economy [11]. These actions should finally result in a significant reduction of the importance of low-quality coal in the economy [12]. The influence of all these regulations on energy and fuel sectors is very challenging, both for the mining industry and the energy companies [13]. Strategies for deep decarbonization of energy systems at the EU cities level are currently being implemented to achieve zero-emission scenarios by 2050 [14].
The situation of Poland in the field of ongoing energy transformation is extremely difficult because in the national energy system, 80% of all electricity is generated from hard coal and lignite, which is a unique situation among member states and requires a continuous process of restructuring of the Polish industry in order to adapt to integrated competitive conditions of energy markets [15,16,17,18]. The detailed analyses dealing with the energy situation in Poland, the process of restructuring the hard coal sector towards adaptation to environmental requirements, CSR reporting, and the current financial situation can be found in several publications [19,20,21]. The strategy of reducing fossil fuels induced significant energy dependence, especially in oil and gas. This led to the next summit of the European Union and the development of regulations regarding energy consumption and the percentage of renewable energy sources in the energy mixes [22].
Member states of the EU are significantly diversified not only in terms of energy resource use but also in energy mix structure and energy generation technologies applied in each country. Due to these factors, the creation of a direct comparative analysis that could present the progress of countries in the pursuit of energy transformation seems to be a very complex problem [23]. This research attempts to relatively estimate the levels of development of energy markets in EU countries and to indicate Poland’s position as compared to other countries.
2. Literature Review
The energy markets of the European Union countries are undergoing a process of continuous transformation in an effort to achieve long-term ecological goals in the field of climate protection against the effects of warming. The member states have been undertaking a number of activities in many areas, primarily related to energy, which has the greatest impact on greenhouse gas emissions into the atmosphere. The main directions of actions are focused on maintaining the growing trend in the use of renewable sources in energy balances and continuous internal integration of energy markets in order to achieve a sustainable energy sector within the EU. The EU energy policy sets out five main lines of action aimed at achieving a sustainable level of energy, which are to: diversify Europe’s sources of energy, ensuring energy security through solidarity and cooperation between EU countries, ensure the functioning of a fully integrated internal energy market, enabling the free flow of energy through the EU through adequate infrastructure and without technical or regulatory barriers, improve energy efficiency and reduce dependence on energy imports, cut emissions, and drive jobs and growth, decarbonize the economy and move towards a low-carbon economy, in line with the Paris Agreement, and promote research in low-carbon and clean energy technologies, and prioritize research and innovation to drive the energy transition and improve competitiveness [24].
The production of primary energy using fossil fuels such as hard coal, lignite, oil, natural gas, and recently also nuclear energy has been declining, and this results in a situation where the EU is more and more dependent on the imports of primary energy carriers as well as the secondary derivative products to meet their needs, although after the global economic and financial crisis, this situation has stabilized [25]. In 2017, the energy exports by EU-28 countries exceeded their imports by 948 Mtoe. Germany, Italy, France, and Spain accounted for the largest importers of energy in absolute numbers. In 2007, Denmark was the only country among the EU member states that was a net energy exporter. However, in 2013, the Danish import of energy outstripped the export, and this trend was continued over the next four years, up to 2017. Thus, all 28 EU countries have become net energy importers since 2013 [26]. In 2017, the largest net importers considering the number of citizens were Luxembourg, Malta, and Belgium [27]. Since nuclear, fossil fuel power plants have a maximum efficiency of approximately 40%, 60% of energy from fossil fuels is converted into heat during the production of electrical energy. Subsequently, it is directly emitted into the atmosphere and water reservoirs such as lakes, rivers, and seas. That is why most of the energy from these fuels is lost. Unfortunately, there is not currently any technically more efficient and effective way to produce electricity [28]. Thus, the European Union’s priority is to take all possible actions to achieve a visible increase in the efficiency of the use of all available energy sources.
The European Union’s drive to create a single internal energy market is very complex and has been going on for many years, but there are still technical and regulatory barriers. The transformation of energy markets will most probably take place in the form of a transitional stage, which may lead initially to the emergence of several regional markets bringing together countries with a similar level of economic development and with certain similarities in their energy systems, and finally to the complete integration of the market into a single internal market of the European Union. The main challenge for energy markets is the reduction of coal use in electricity production. Countries with hard coal and lignite deposits face the problem of maintaining a stable level of profitability of mining enterprises, which optimize the level of extraction based on the reduction of variable costs [29]. In turn, energy companies are exposed to a negative impact on financial performance as well as on current liquidity ratios due to high levels of taxation [30]. Energy policy assumes that the use of renewable energy sources is one of the fundamental elements of sustainable development in Poland. The main challenge in the area of renewable sources’ development in the country is the availability (accessibility, reliability) of energy from renewable sources (RES), which depends both on climatic conditions and the level of technological development. The highest energy potential in Poland is shown by biomass (e.g., energy crops, firewood, forest waste) and biogas (agricultural waste, sewage), as well as wind energy (onshore and offshore) and hydropower [31]. The growth in the use of renewable sources should increase energy independence and should have a positive impact on the development of the local economy, e.g., through the use of local energy resources. The more diversified the production technology, the more incentives for local businesses and companies. The production of energy from RES often takes place in dispersed units, thanks to which many Polish regions, especially agricultural ones, can gain economically, which is closely related to the financing support mechanisms introduced in Poland [32]. Security of supply is another challenge for the energy market, including Poland, where there is the greatest reduction of coal consumption in the energy balance. In order to secure supplies on the domestic energy market, a power market was introduced, which means a change in the architecture of the energy market from a commodity market to a dual-commodity market. This means that not only the generated electricity will be subject to purchase–sell transactions, but also the net power available, i.e., the readiness to supply energy to the grid. As a result, a profound transformation is taking place in the technical and technological field, in the form of a connection in smart metering between the generating unit and the operator, which is a prerequisite for regular trading on the energy market. The development of smart metering is a fundamental aspect of the energy market share. The technology area is very important due to the projected share of the demand side in the capacity market and the development of electricity storage technologies in the medium term by renewable energy sources. Increasing the controllability of renewable sources, such as wind or photovoltaic farms, allows for a greater share of the above-mentioned units in capacity auctions in future years [33].
3. Materials and Methods
The member states of the European Union are significantly diversified in terms of the energy sources used, and therefore the process of transformation of energy markets into a single internal market is a very complex and long-term process. Energy markets can be characterized on the basis of many diagnostic variables. The first aim of the research was to select available and standardized data for all member states that describe energy markets. Another objective of the research conducted was to simulate the potential division of all countries into groups of countries similar to each other in terms of energy markets. This research problem was solved using comparative multivariate analysis and was carried out in StatSoft Statistica statistical software. On the basis of nine standardized variables in the scope [0–1], the level of development of the Polish energy market was assessed against the background of the other member states. The analysis used the agglomeration procedure, the result of which was the division of countries into clusters of similar countries. The research process was divided into four main stages, which included the process of variable standardization, initial identification of the similarity of objects, and division into groups of similar countries. The results of the research, which resulted in identified clusters of European Union member states similar to each other in terms of selected variables describing energy markets, are an important original and innovative achievement, which could potentially constitute a model for the creation of so-called regional energy markets in the phase of transitional integration.
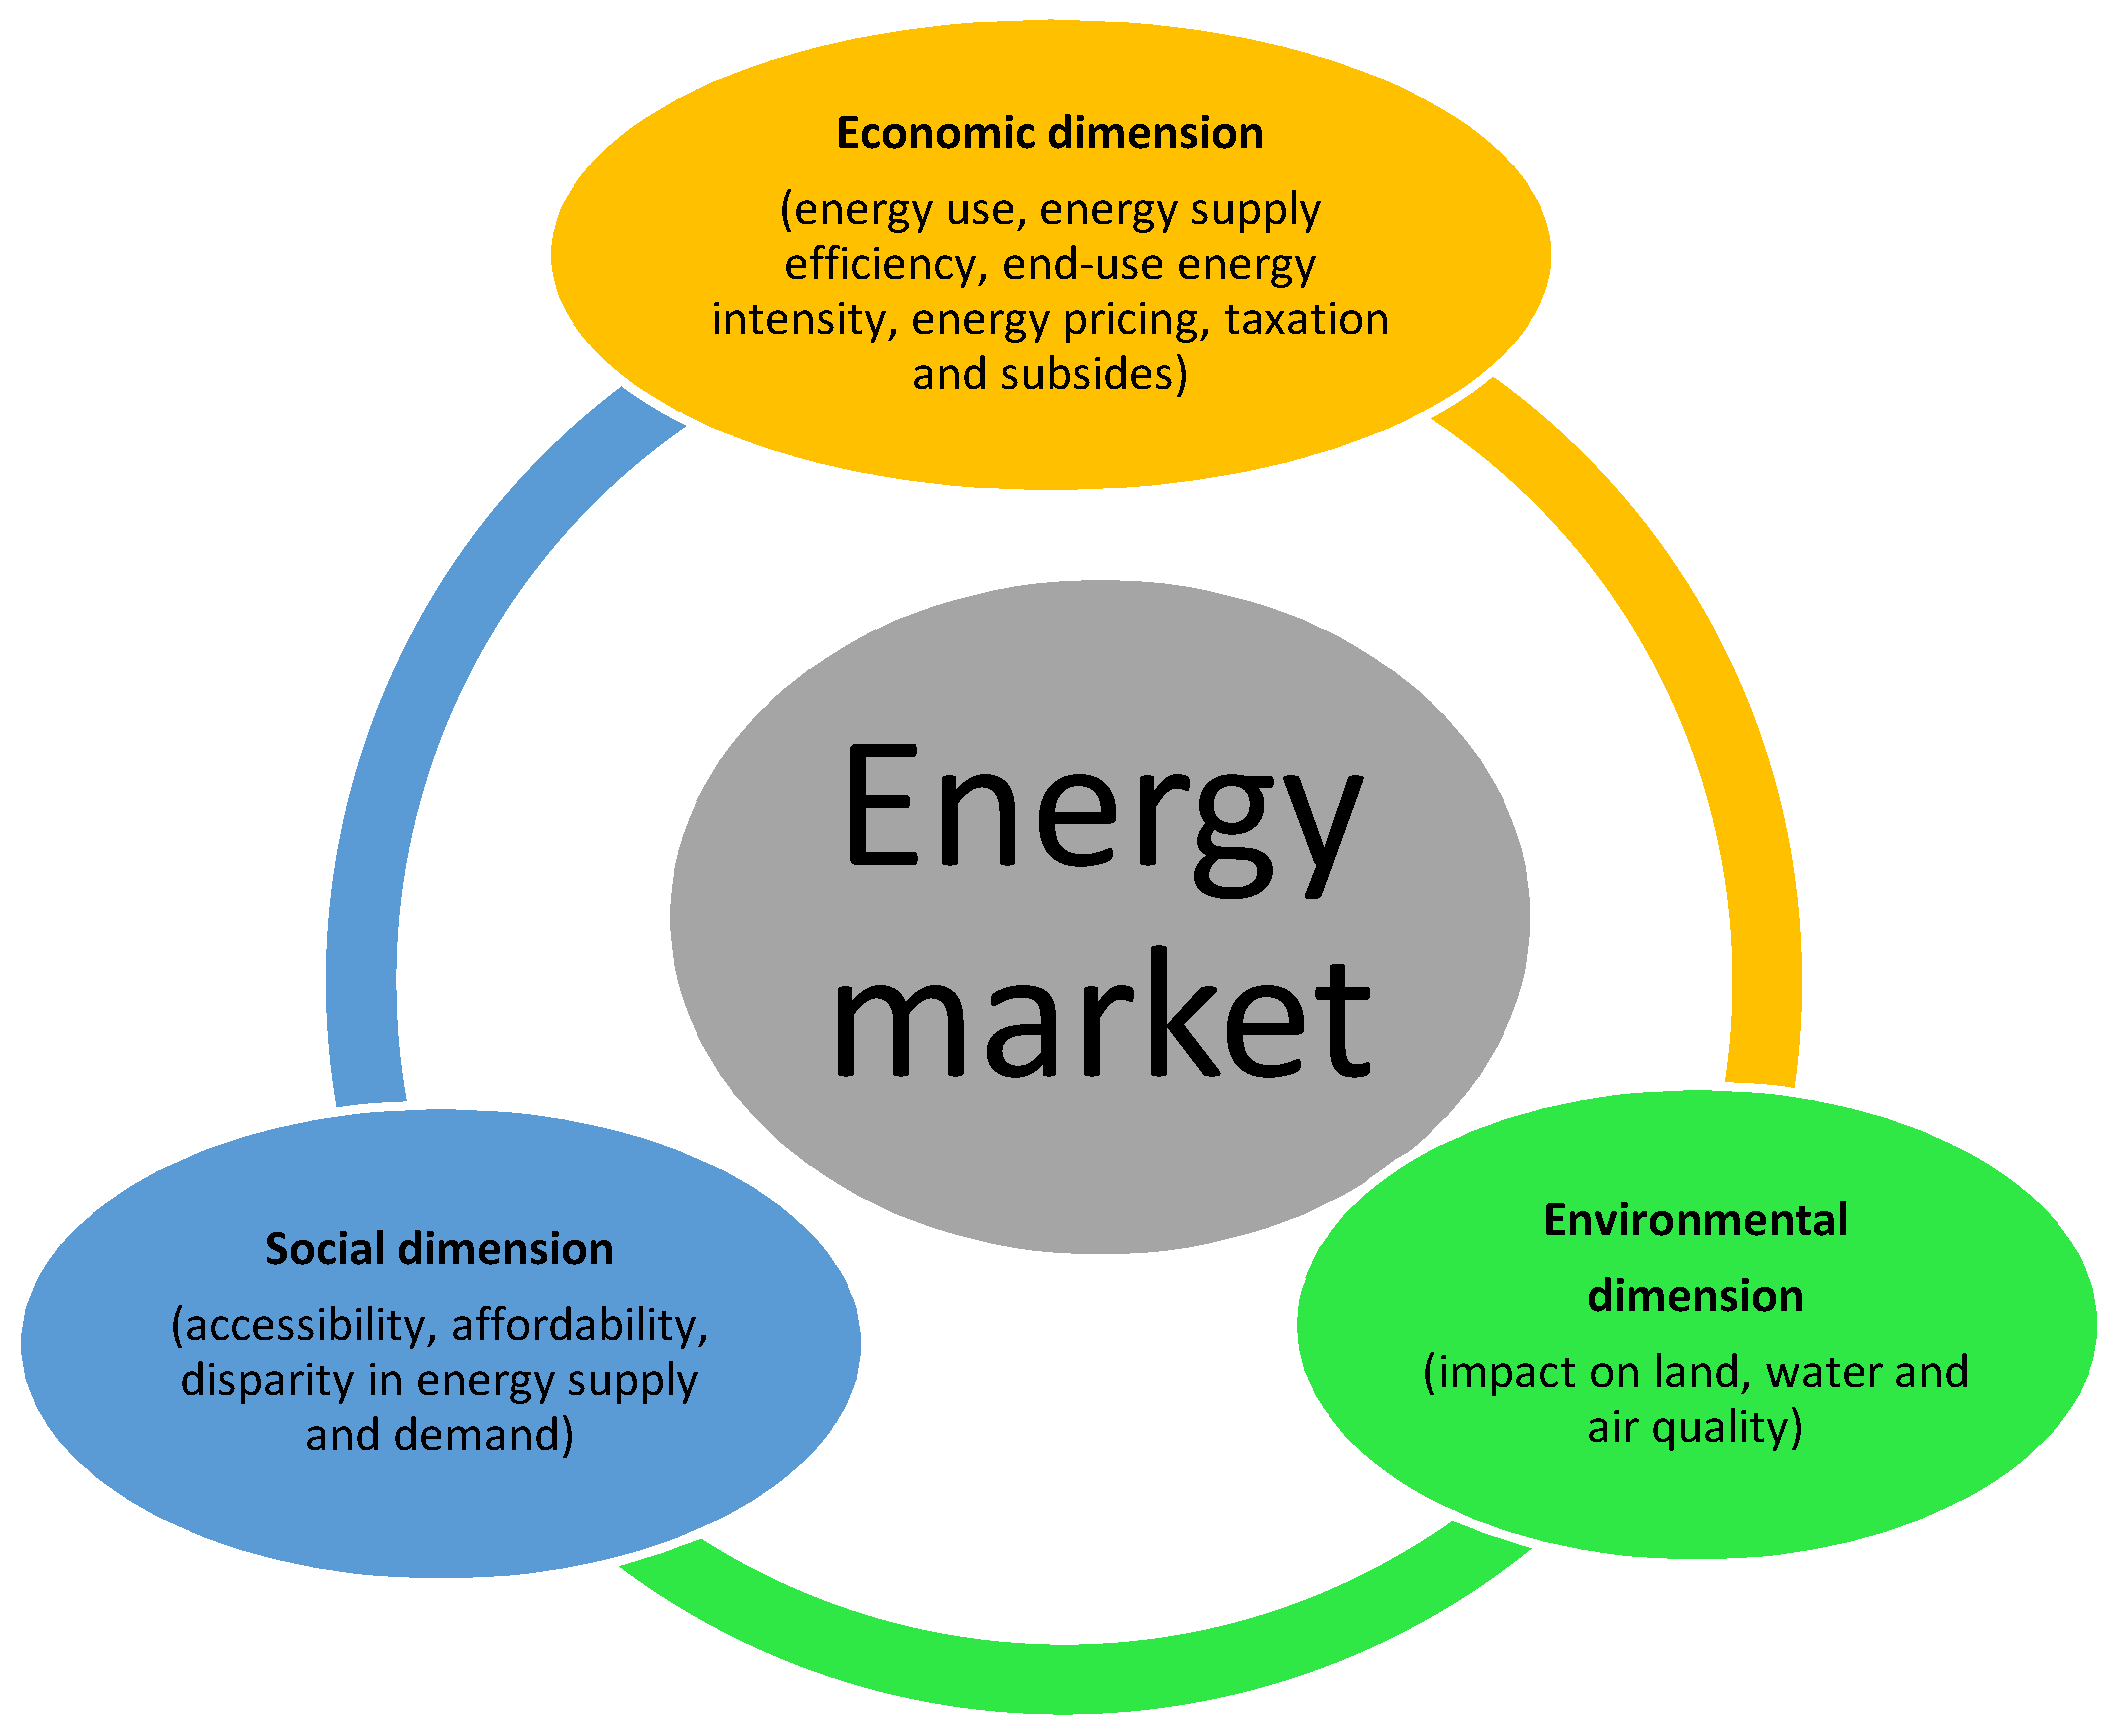
Due to the fact that EU countries are very diversified, the process of structural changes and energy transformation will take a different time up to the situation in each country. The structure of the use of energy resources in EU countries is very different. Germany is the largest energy producer in the EU, its production amounts to 19.68% of the total energy produced in the entire European Union. The energy production of France is 17.64%, and the UK 10.62%. The next countries produce as much as Italy 8.77%, Spain 8.74%, Poland 4.99%, and Sweden 4.82%. These indicated countries are responsible for the production of 75.25% of all energy in the EU [34]. The situation of Poland is unfavorable compared to the main energy producers. The main problem is that solid fuels are the largest part of the energy mix on an EU scale, which in the era of decarbonization significantly complicates the achievement of ecological goals [35,36,37]. The whole transformation of the energy market is dependent on the financial situation of all energy producers (mainly coal companies in Poland) and energy producers whose activities are currently exposed to high financial risk [38,39]. All the changes of the Polish energy system result principally from the need to integrate energy markets in the EU. Changes in the energy system are a long-term process and require financial outlays [40], which is a problem for Poland due to the EU directive that does not allow for public help for those hard coal mines which are currently unprofitable. It has been a threat to the energy safety of Poland as the power plants as well as the heating plants could possibly lose their coal suppliers [41]. Hard coal producers’ difficulties result primarily from the specifics of the mining process, which, unfortunately, is not flexible in relation to market demand in terms of specific coal sorting [42]. Despite the difficult conditions of the energy system in Poland, there are structural changes towards meeting the adopted environmental requirements. That is why the Polish national energy policy is focused on the security of energy supplies. Moreover, the competitive cost, minimal impact on the environment, and the increase of energy efficiency are taken into consideration. In order to measure the progress of countries in the transformation of energy systems towards sustainable energy, the energy intensity indicator is most often used. This indicator is calculated as a ratio between gross available energy and the GDP, and the ratio is stated in kilograms of oil equivalent (kgoe) per one thousand euro. The ratio for this indicator should fall if the economy uses the energy more efficiently and the GDP stands constant [43]. Based on the data presented in the Eurostat, it can be seen that in the Polish economy since 2000, there have been significant changes in the energy intensity indicator. As compared to selected member states, Poland has reduced the energy intensity of the economy by 37% compared to that in 2000. This level is even twice as high as in other countries, such as: Germany, which recorded a decrease by 22%, France recorded a decrease by 17%, and Spain recorded a decrease by 20%. However, these differences may be due to the diversity in purchasing power. The same market and non-market goods and services may have different prices in each country (e.g., the purchasing power in Poland is higher because of the value of the euro that is much above the EU average). Differences in the energy consumption of Poland and the EU at the physical level (e.g., energy consumption to produce a ton of a product) are much smaller. The characteristics of energy markets seem to be a standard multidimensional issue. Each country can be described by a set of several variables. The energy sector has a huge impact on many areas of society’s life, including the economic, ecological, and social spheres (Figure 1).
Access to affordable electricity is key to improving social well-being. It enables the development of society and contributes to the alleviation of poverty by increasing the standard of living of the society. Highly developed countries depend on reliable energy supplies, which is a prerequisite for all economic sectors, such as industry, transport, trade, and agriculture. Energy supply affects jobs, productivity, and development. The level of energy prices is the key to efficient energy supply and use. Energy prices and related subsidies and taxes can encourage energy efficiency and improve conditions for the availability of energy. The production, distribution, and use of energy place pressure on the environment. The level of negative environmental impact depends primarily on how energy is produced and used, that is, on the energy balances of countries, the structure of energy systems and related regulatory activities in the energy sector, and price structures [44].
An original set of 41 indicators for sustainable energy development is presented by the International Atomic Energy Agency (IAEA). Indicators for sustainable energy development (ISED) can be classified, among others, into the following groups: indicators on energy resources, the efficiency of their use, environmental pollution during the exploitation of raw materials and energy production technologies, economic indicators, accessibility to energy for society, and energy dependence [45]. The availability of data for testing was analyzed on the basis of 41 indicators. Finally, nine variables were selected. The Eurostat database was the source for the available data which were collected and transformed to the level required in the research.
The basic definition of an indicator is determined as a measure expressing the level of a given phenomenon, presented in relative form, which is recommended, or absolute form. The indicator is a function of one or several attributes to specify the position of the object (e.g., country, province, etc.) in relation to other objects by comparing their values. Diagnostic variables should meet the following criteria:
- -
- Universality, which means similar significance in individual countries.
- -
- Measurability of indicators, i.e., their numerical representation.
- -
- Availability of obtaining relevant data.
- -
- Quality, understood as a guarantee that the data are not subject to material errors.
- -
- Accidental, which can be ensured using reliable sources of information.
- -
- Interpretability of variables [46].
The diagnostic variables presented in the study meet all of the above requirements. Therefore, nine key diagnostic variables which characterize the energy sector of the member states were collected (from the Eurostat database) for the purpose of this study. The diagnostic variables are as follows:
- -
- Consumption of electric energy which is generated from renewables per capita (TWH per person).
- -
- Consumption of hard coal (million ton per person).
- -
- Emissions of greenhouse gas per capita.
- -
- Available for final consumption (Gigawatt-hour per person).
- -
- Final energy consumption (thousand ton of oil equivalent (TOE) per person).
- -
- Petroleum available for final consumption (Gigawatt-hour).
- -
- Natural gas (Terajoule gross calorific value—GCV) per person.
- -
- Energy intensity of GDP (kilograms of oil equivalent (KGOE) per thousand euro).
- -
- Import dependency (%) [47].
On the basis of the above-mentioned variables, a relative assessment was performed to show the level of development of the Polish energy market in relation to the other member states. The study evaluated 26 EU countries, where Cyprus and Malta were omitted due to the relatively negligible share in electricity production. Then, the process of variable agglomeration was carried out, which allowed the separation of relatively similar clusters. Statistical calculations and analyses were developed using the Statsoft Statistics program.
4. Research Methods and Results
The agglomeration method was used in the research. The research process was carried out in four main stages [48,49]:
- Standardization of diagnostic variables.
- Preliminary identification of the similarity of objects.
- Division into groups of similar countries using the agglomeration procedure.
- Characterization of energy balances of identified groups of homogeneous countries.
The conducted research is aimed at estimating the relative level of development of energy markets in the EU countries with the identification of groups of similar countries, which may constitute the basis for administrative decisions to create regional internal markets in the process of energy integration of the European Union countries.
The agglomerative approach, which belongs to hierarchical clustering methods, is independent of the adopted measure of object homogeneity or distance measure. This is a method that can be used to group objects of any type. This approach generates a nested cluster hierarchy and allows for flexible choice of a set of clusters. Although, theoretically different ways of calculating distance (single, complete, average linkage, the centroid method, or the Ward’s method) can provide slightly different results. The research process was carried out according to the following stages.
1. Standardization of diagnostic variables
The raw data taken from the Eurostat database for 9 examined diagnostic variables were expressed in various measurement units, such as TWH per person, million tons per person, Gigawatt-hour, Gigawatt-hour per person, thousand tons of oil equivalent (TOE) per person, etc. The aim of the first stage of the research was to make the data comparable. Diagnostic variables have been subjected to the normalization process according to the Formulas (1) and (2) [50].
Transformation formula for stimulants:
Transformation formula for de-stimulants:
where:
xij is the value of the diagnostic variable,
zij is the normalized value of xij.
In the first stage of the research, the identified diagnostic variables were standardized. For this purpose, the nature of each variable was determined, i.e., it was assessed whether large values of the variable have a beneficial effect on the level of development of energy markets, in which case, these variables were classified as stimulants, or whether low values were conducive to the level of development, and thus these variables were qualified as de-stimulants. The results of the division are presented in Table 1.
2. The stage of preliminary identification of the similarity of objects
In the next stage, a pictorial graph was used for preliminary identification of the similarity of the objects. The pictorial graph presents the data after standardization for successive countries. Each arm represents the value from 0 to 1 for the following variables, clockwise from Z1 to Z9 (Figure 2). The use of a pictorial chart in the research in the initial phase made it possible to obtain a relatively systematic system of observations for various countries in terms of energy markets. The results of the analyses of such a general scheme make it possible to initially check the affiliation of specific observations, i.e., the countries under study, to a specific system or the duplication of similar countries.
As presented on the star chart, for example, Sweden and Finland are the most similar to each other, but Luxembourg is an outlier among other member countries. Another group of similarities can be identified for the following countries: Romania, Latvia, Slovenia, Lithuania, Greece, Hungary, and Croatia. The next group are the UK, France, Italy, Portugal, Spain and Estonia, Bulgaria, Poland, Slovakia, and Czechia. The next group of graphically similar countries are: Austria, Denmark, Ireland, Germany, The Netherlands, and Belgium. Graphical interpretation of data is a preliminary stage to the agglomeration procedure.
3. Division into groups of similar countries using the agglomeration procedure
At this stage of the research, hierarchical agglomeration methods were used to determine the so-called tree hierarchy of objects in the set. The result of the analysis is a dendrogram created in the process of step-by-step agglomeration (or grouping in sets) of operational taxonomic units, i.e., the studied countries. At the beginning of the analysis, it is assumed that each object is a separate subgroup and, based on the smallest Euclidean distance, the objects are put into subgroups in the next agglomeration step. Based on theoretical properties and simulations tests, the Ward method was chosen for the agglomeration, and the efficiency of detecting the real data structure is about 40% better than other methods, e.g., (the furthest neighborhood). If by dst we denote the minimum distance that at a given stage of the agglomeration indicates that the subgroups s and t should be merged, the distance of the newly created subgroups (with the number r) from all other clusters is calculated according to the formula:
The number of points in currently considered clusters is denoted by ni, nt, and ns.
The result of an agglomeration procedure with respect to the level of development of the energy market was created in a dendrogram. The results of the agglomeration procedure for 2018 are presented in Figure 3.
As a result of the agglomeration process (Figure 3), six clusters have been identified. They consist of countries which have a similar level of development of energy systems:
- The first cluster: Finland and Sweden.
- The second cluster: Luxembourg.
- The third cluster: France, Latvia, Romania, Slovenia, the UK.
- The fourth cluster: Croatia, Greece, Hungary, Italy, Lithuania, Portugal, Spain.
- The fifth cluster: Bulgaria, Czechia, Estonia, Poland, Slovakia.
- The sixth cluster: Austria, Belgium, Denmark, Germany, Ireland, The Netherlands.
- The stages of the agglomeration process are presented in Figure 4.
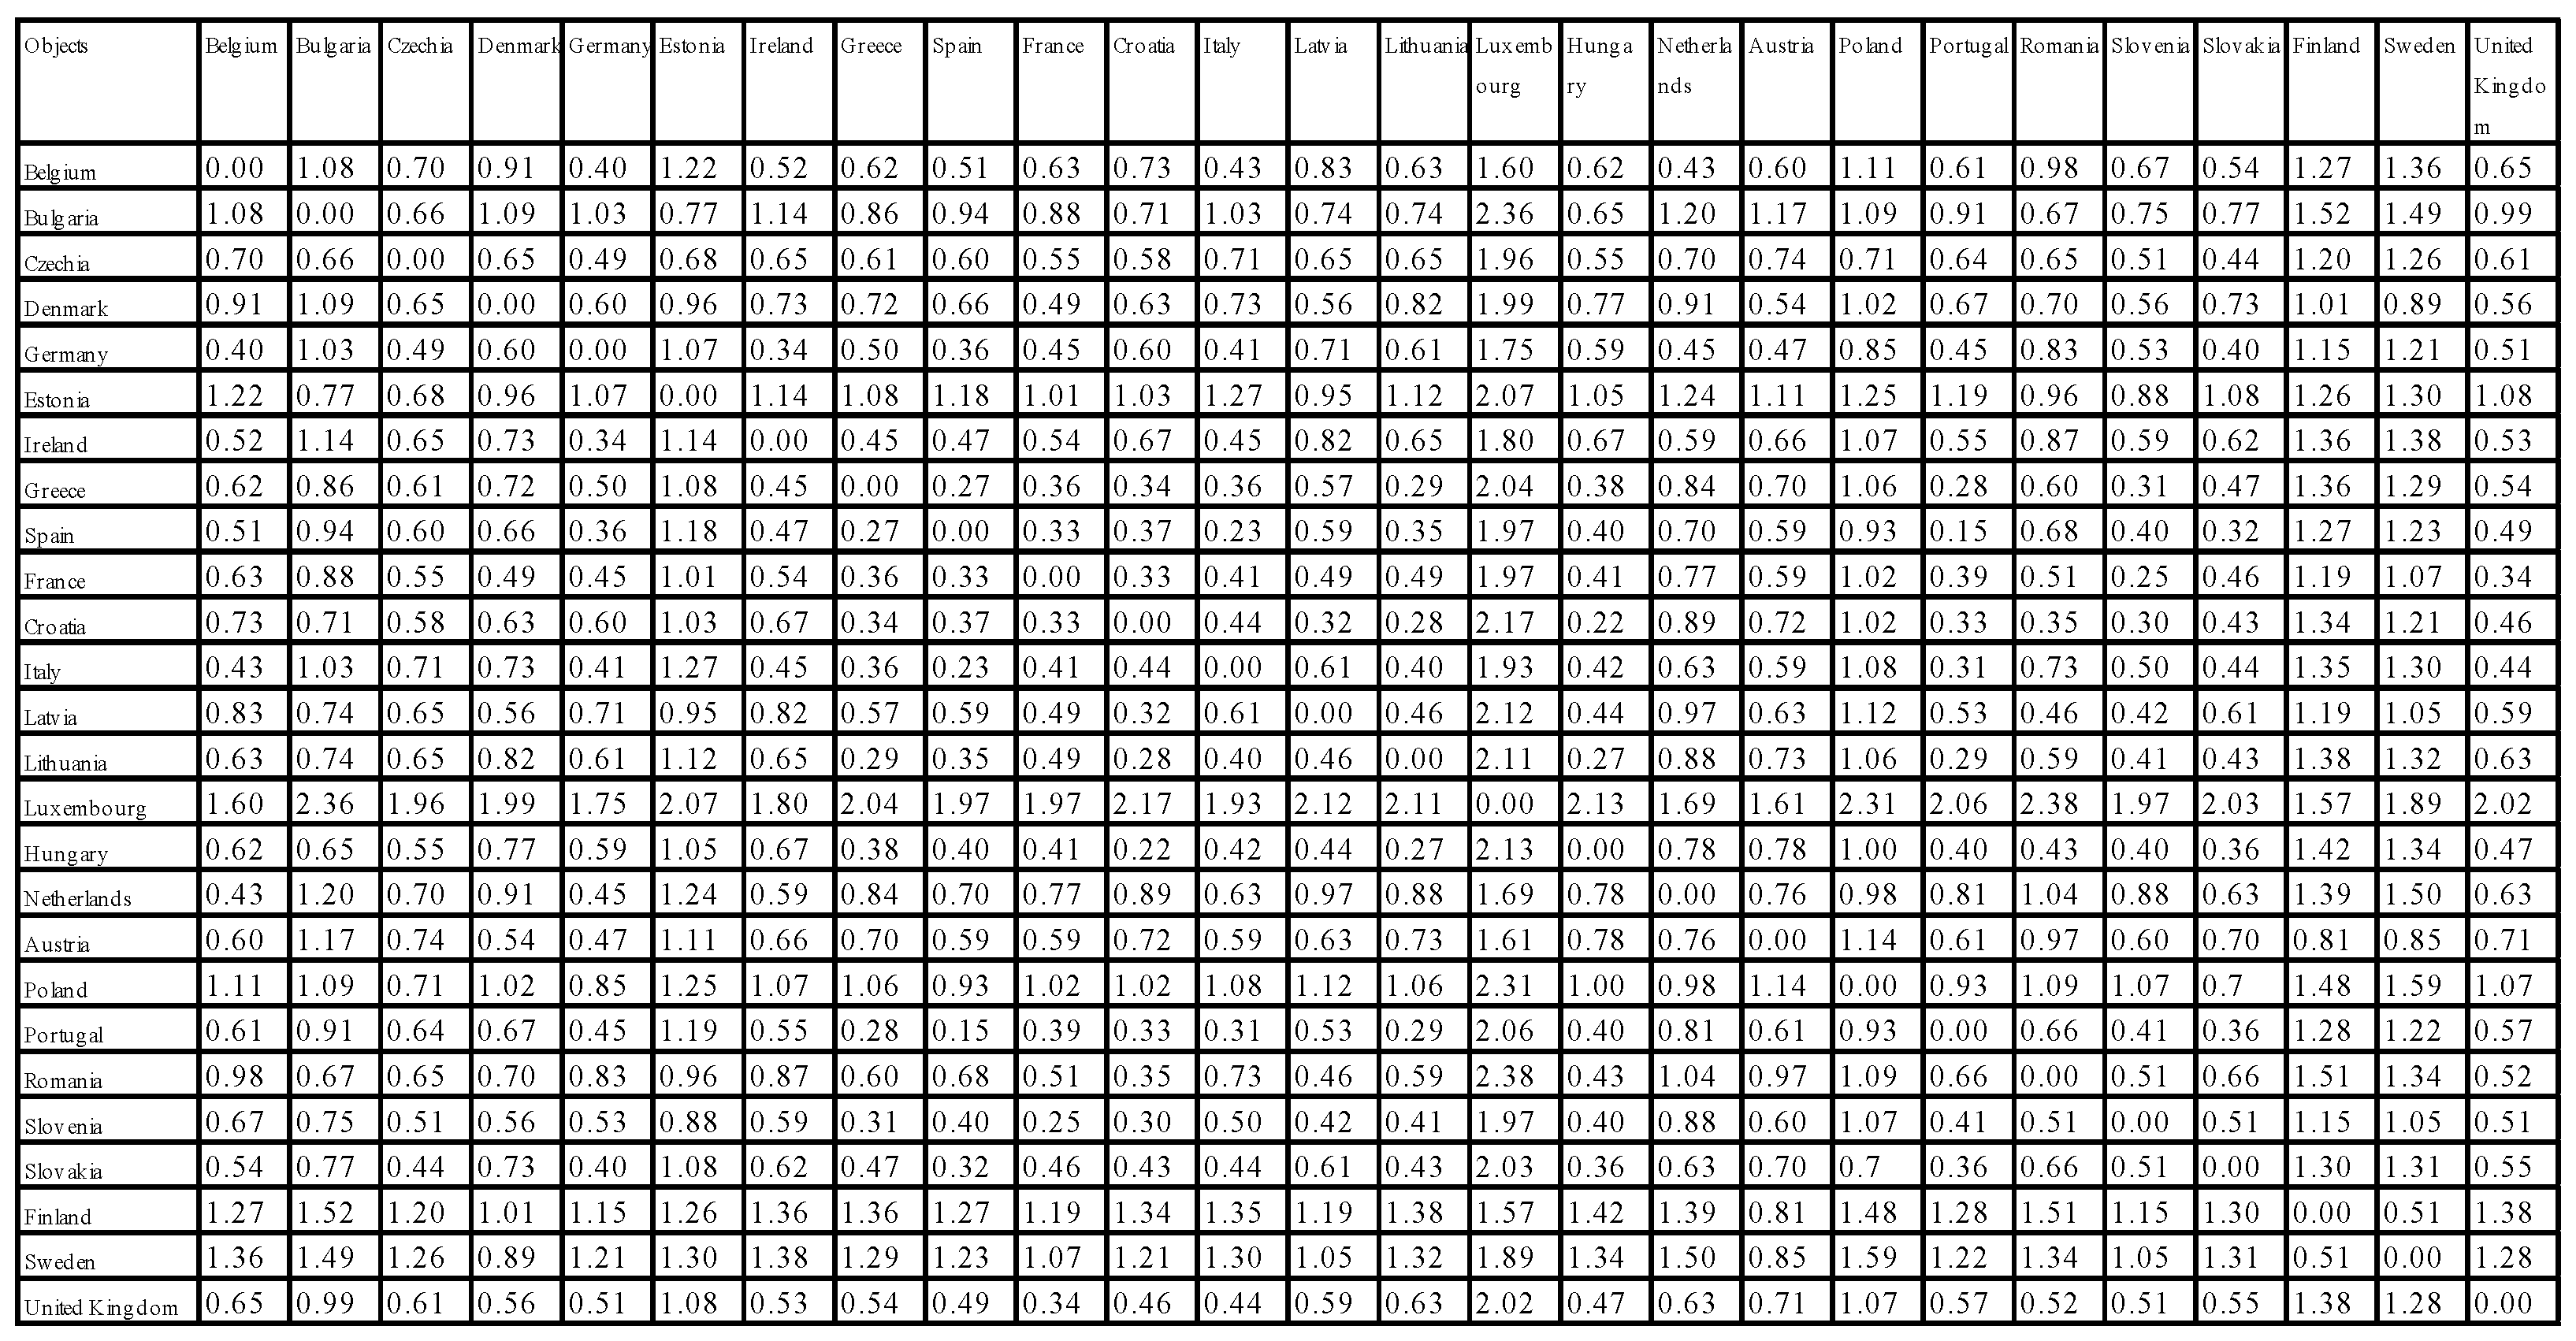
Figure 4 shows the data of the agglomeration process. The first column presents the Euclidean distance values of the objects in order from smallest to greatest value and the result of the subsequent grouping steps. Clusters of the countries the most similar to each other were created in the beginning, e.g., Spain and Portugal (Euclidean distance 0.1473928), Croatia and Hungary (Euclidean distance 0.2232429), France and Slovenia (Euclidean distance 0.2451022), Greece and Lithuania (Euclidean distance 0.2925292), and Poland, Slovakia, and Czechia (Euclidean distance 0.7978403). Next, the first smallest clusters were joined with subsequent countries into larger groups depending on the measure of similarity, which was a measure of Euclidean distance. The Euclidean distance matrix is presented in Figure 5.
Figure 6 shows binding distances relative to the binding stages. This graph shows the distance between the combined/connected groups at each step. As shown, the distances needed to connect the two groups slowly increase up to the 25th step, where there was a very significant increase in the distance (almost two-fold). On the basis of Figure 6, it can be seen that the decision to cut the dendrogram at the segment of the agglomeration distance [1.1; 1.3] was justified.
The values of means and standard deviations for standardized data for each member state are presented in Table 2.
Interpretation of the average values confirms the division made using the agglomeration method. Luxembourg has the highest average values, followed by Sweden and Finland, while Poland has the lowest average value.
4. Characteristics of energy balances of identified groups of homogeneous countries
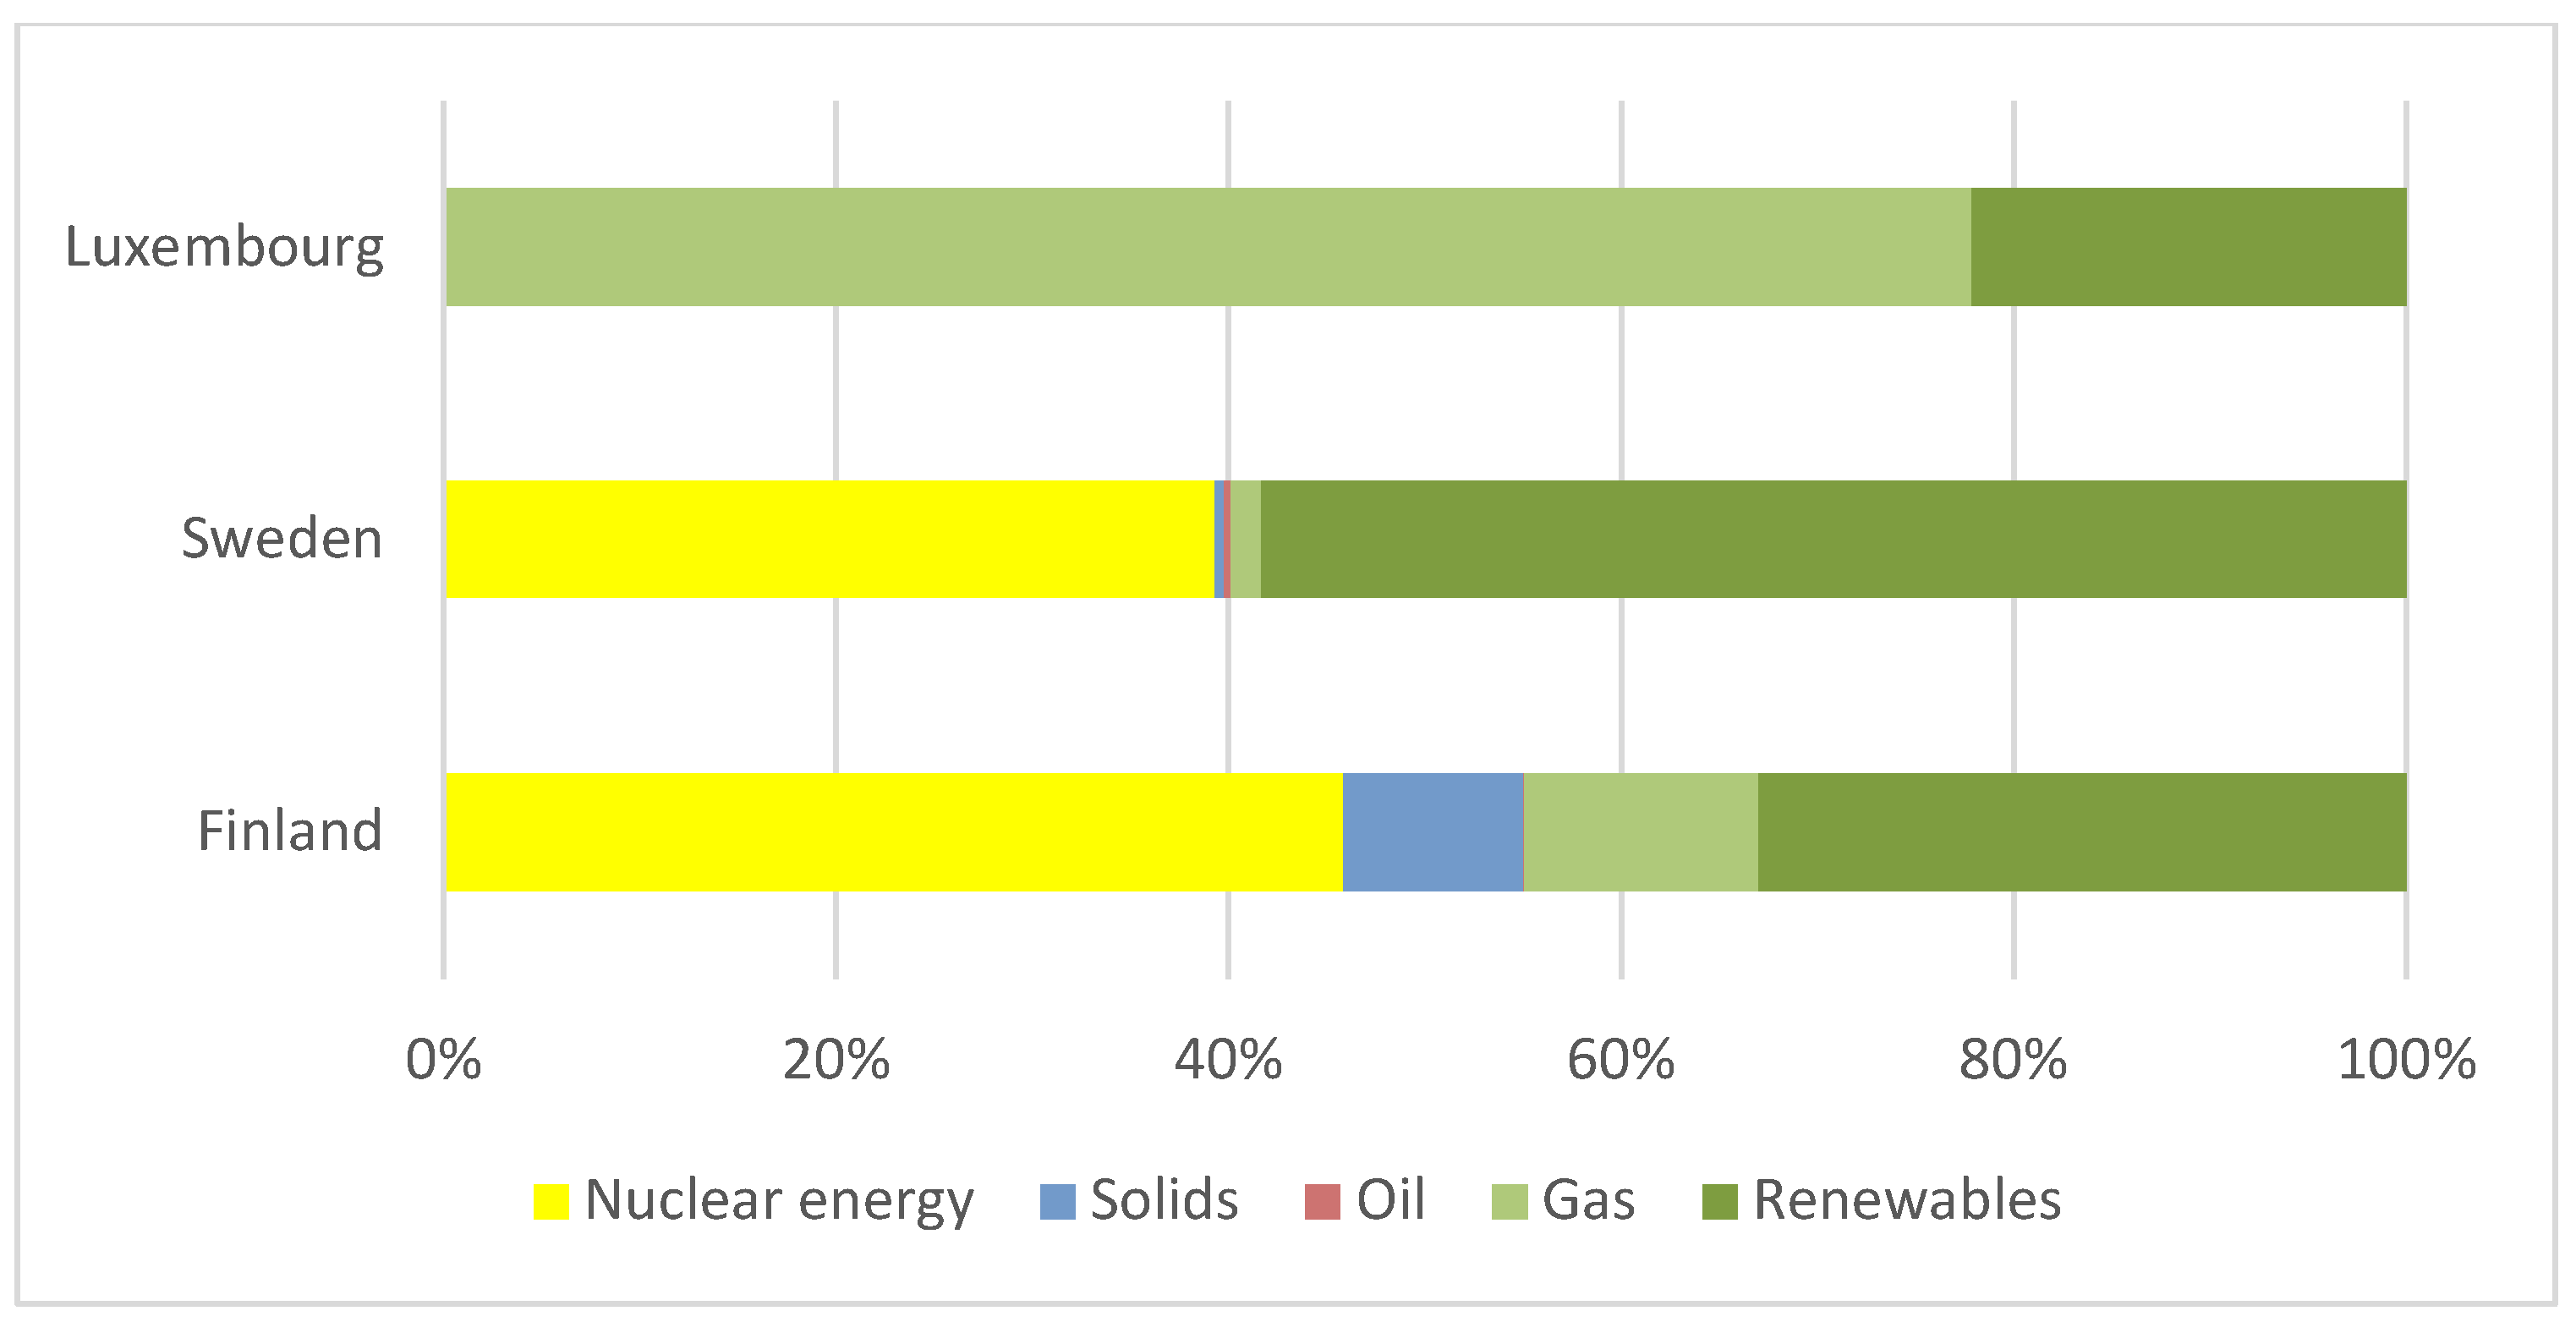
The most crucial factors that appeared in the identified clusters were: the location of the country, the climate, the cooperation in a region, the electrical power systems, which are linked to the similar structure of the energy mix, and also the use of renewable sources of energy. The characteristics of energy mixes having great influence on the level of development of energy markets are shown in the charts for the six selected clusters of similar countries (Figure 7, Figure 8, Figure 9, Figure 10 and Figure 11).
The first cluster presents the production of energy from renewable sources at the highest level on an EU scale. In the energy mix, Finland has a slightly higher GHG emissions per capita than Sweden, as well as a higher energy intensity ratio, because the consumption of solid fuels constitutes 9%.
Luxembourg comprises a single cluster. In comparison to other member states, it has the uppermost level of electricity consumption per capita. The GHG emissions per capita and the levels of energy dependence are also the highest.
The third cluster (Figure 8) has a similar level of GHG emissions per capita, where all countries have reached levels below the EU average, which should be assessed positively. The level of consumption of electric energy per capita is also below the EU average in all countries. There is a relatively low level of energy dependence, from 50% in Slovenia to 24% in Romania.
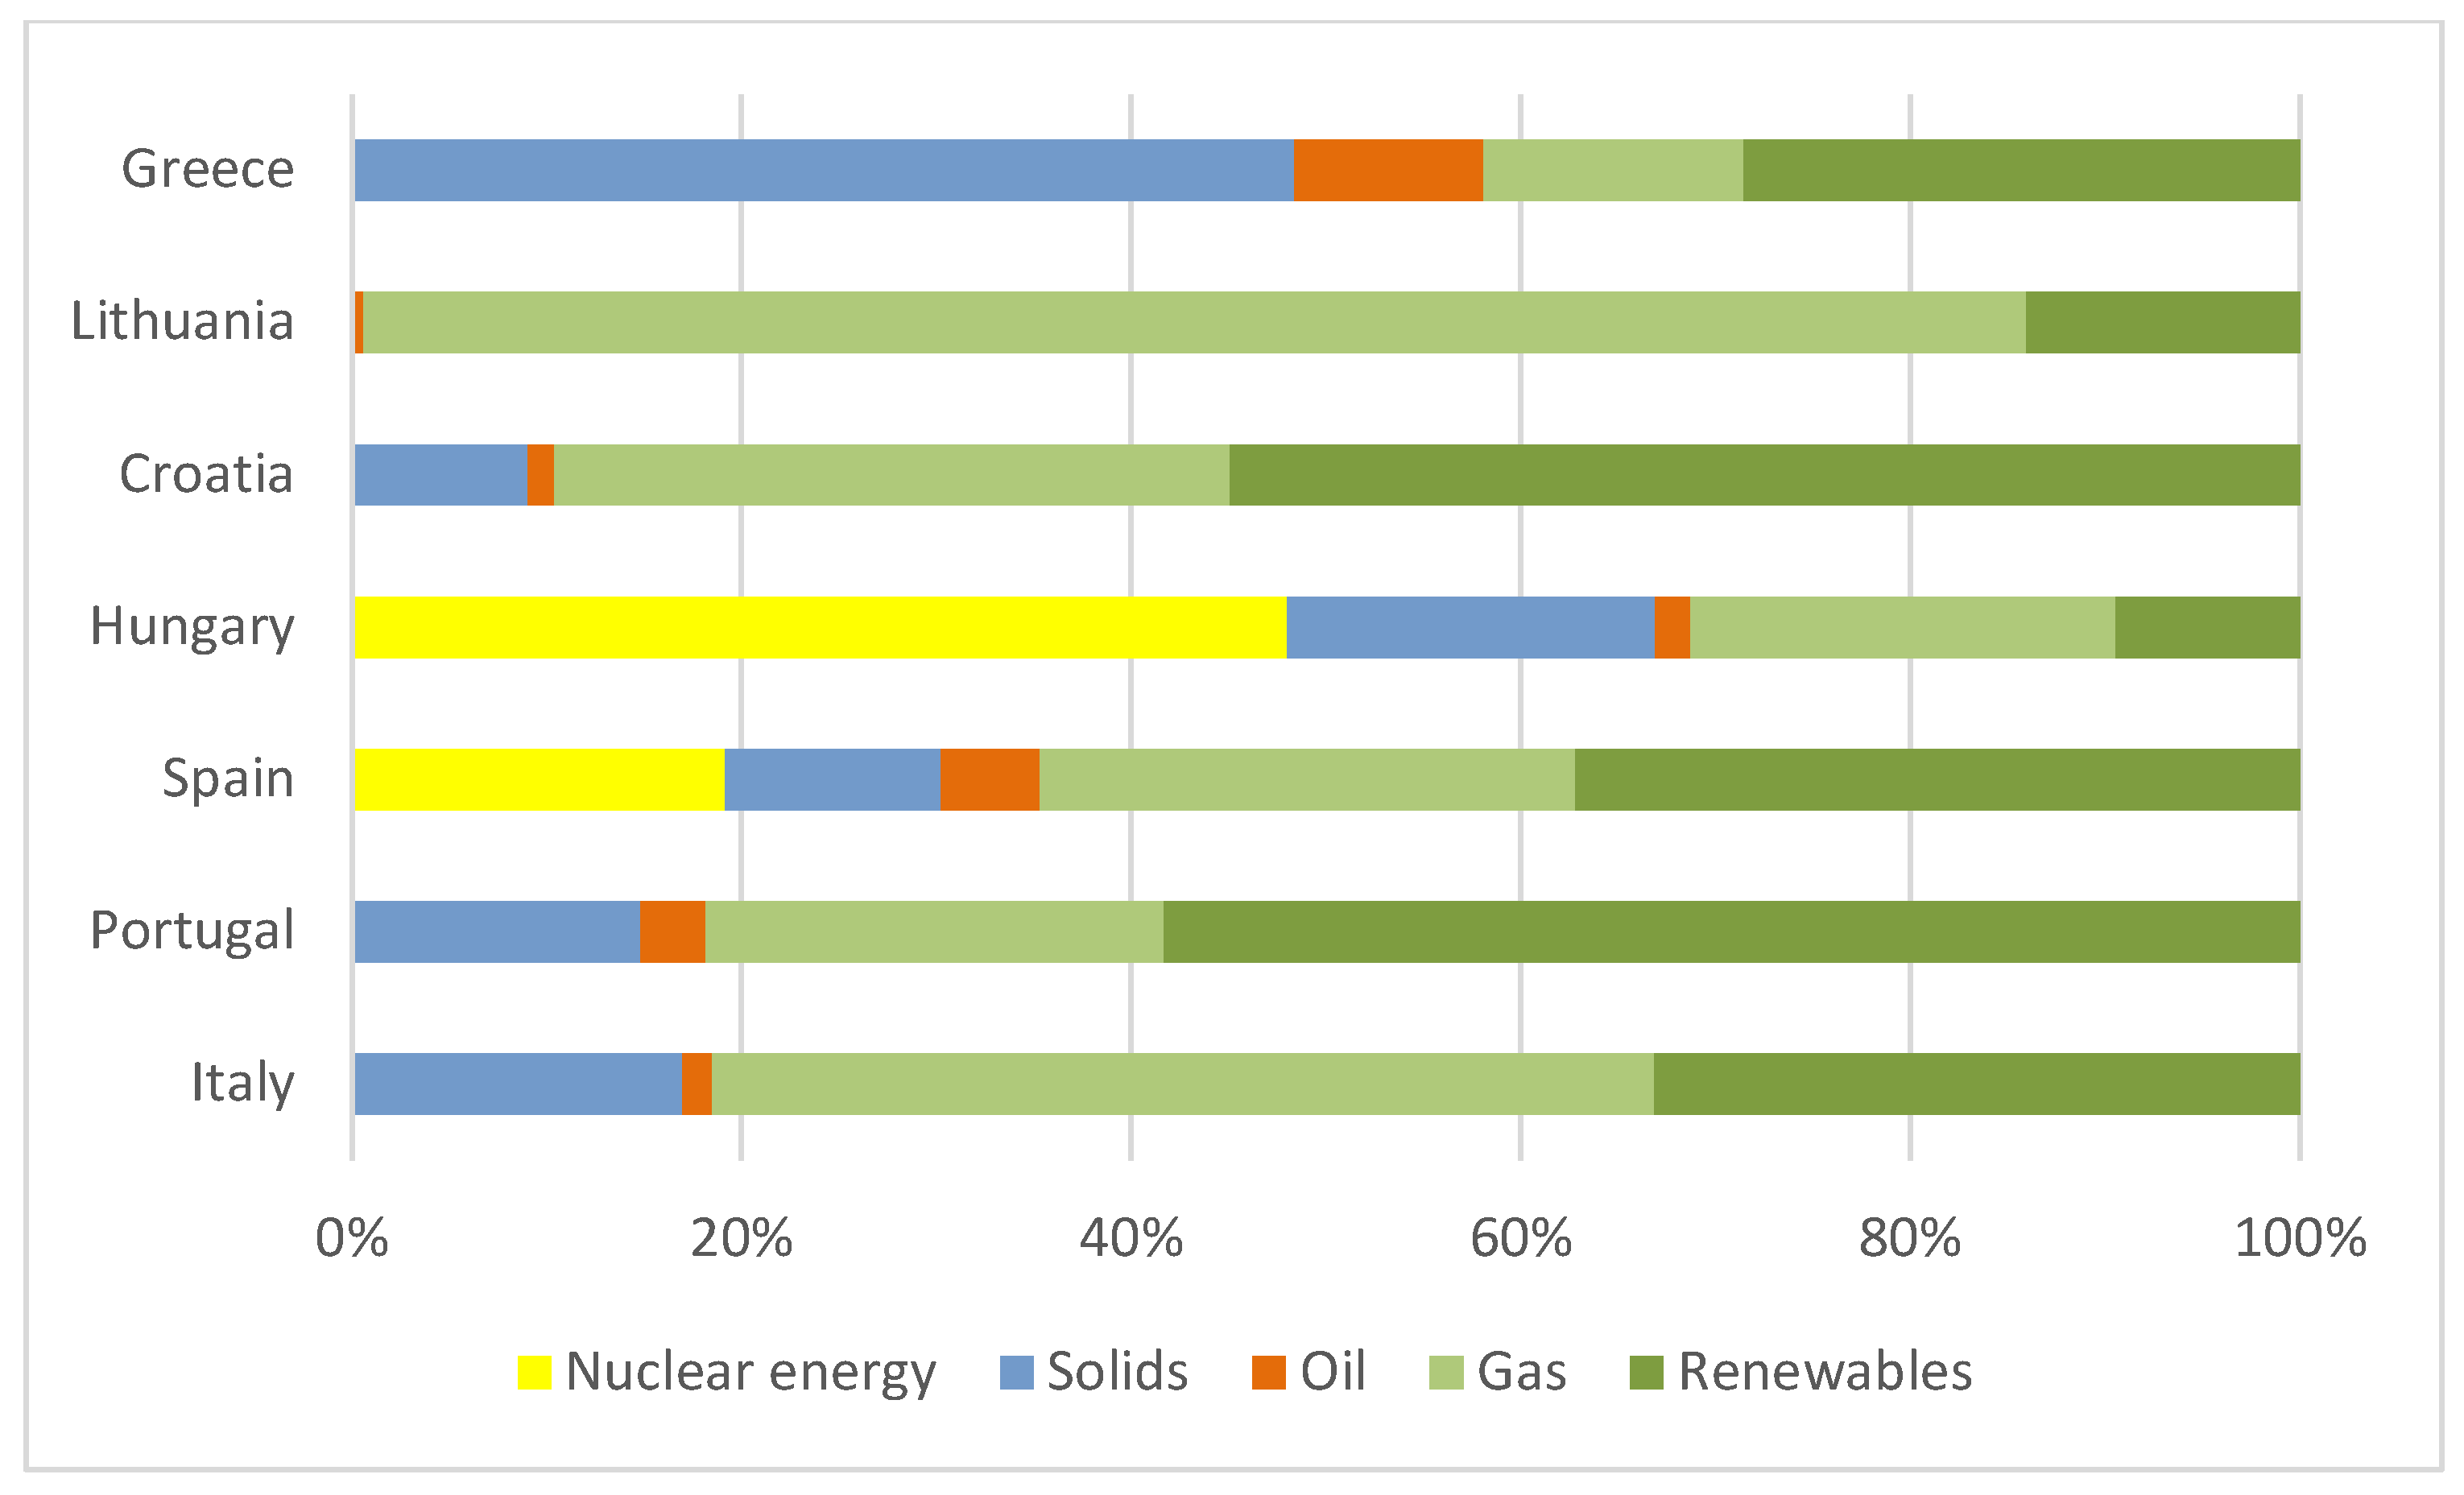
The countries grouped in the fourth cluster (Figure 9) are characterized by a high level of energy dependence, from 52% for Croatia and 58% for Hungary to above 70% for all other countries in this cluster. In this cluster, the input of solid fuels in electricity production is significantly higher than in the first and the second clusters.
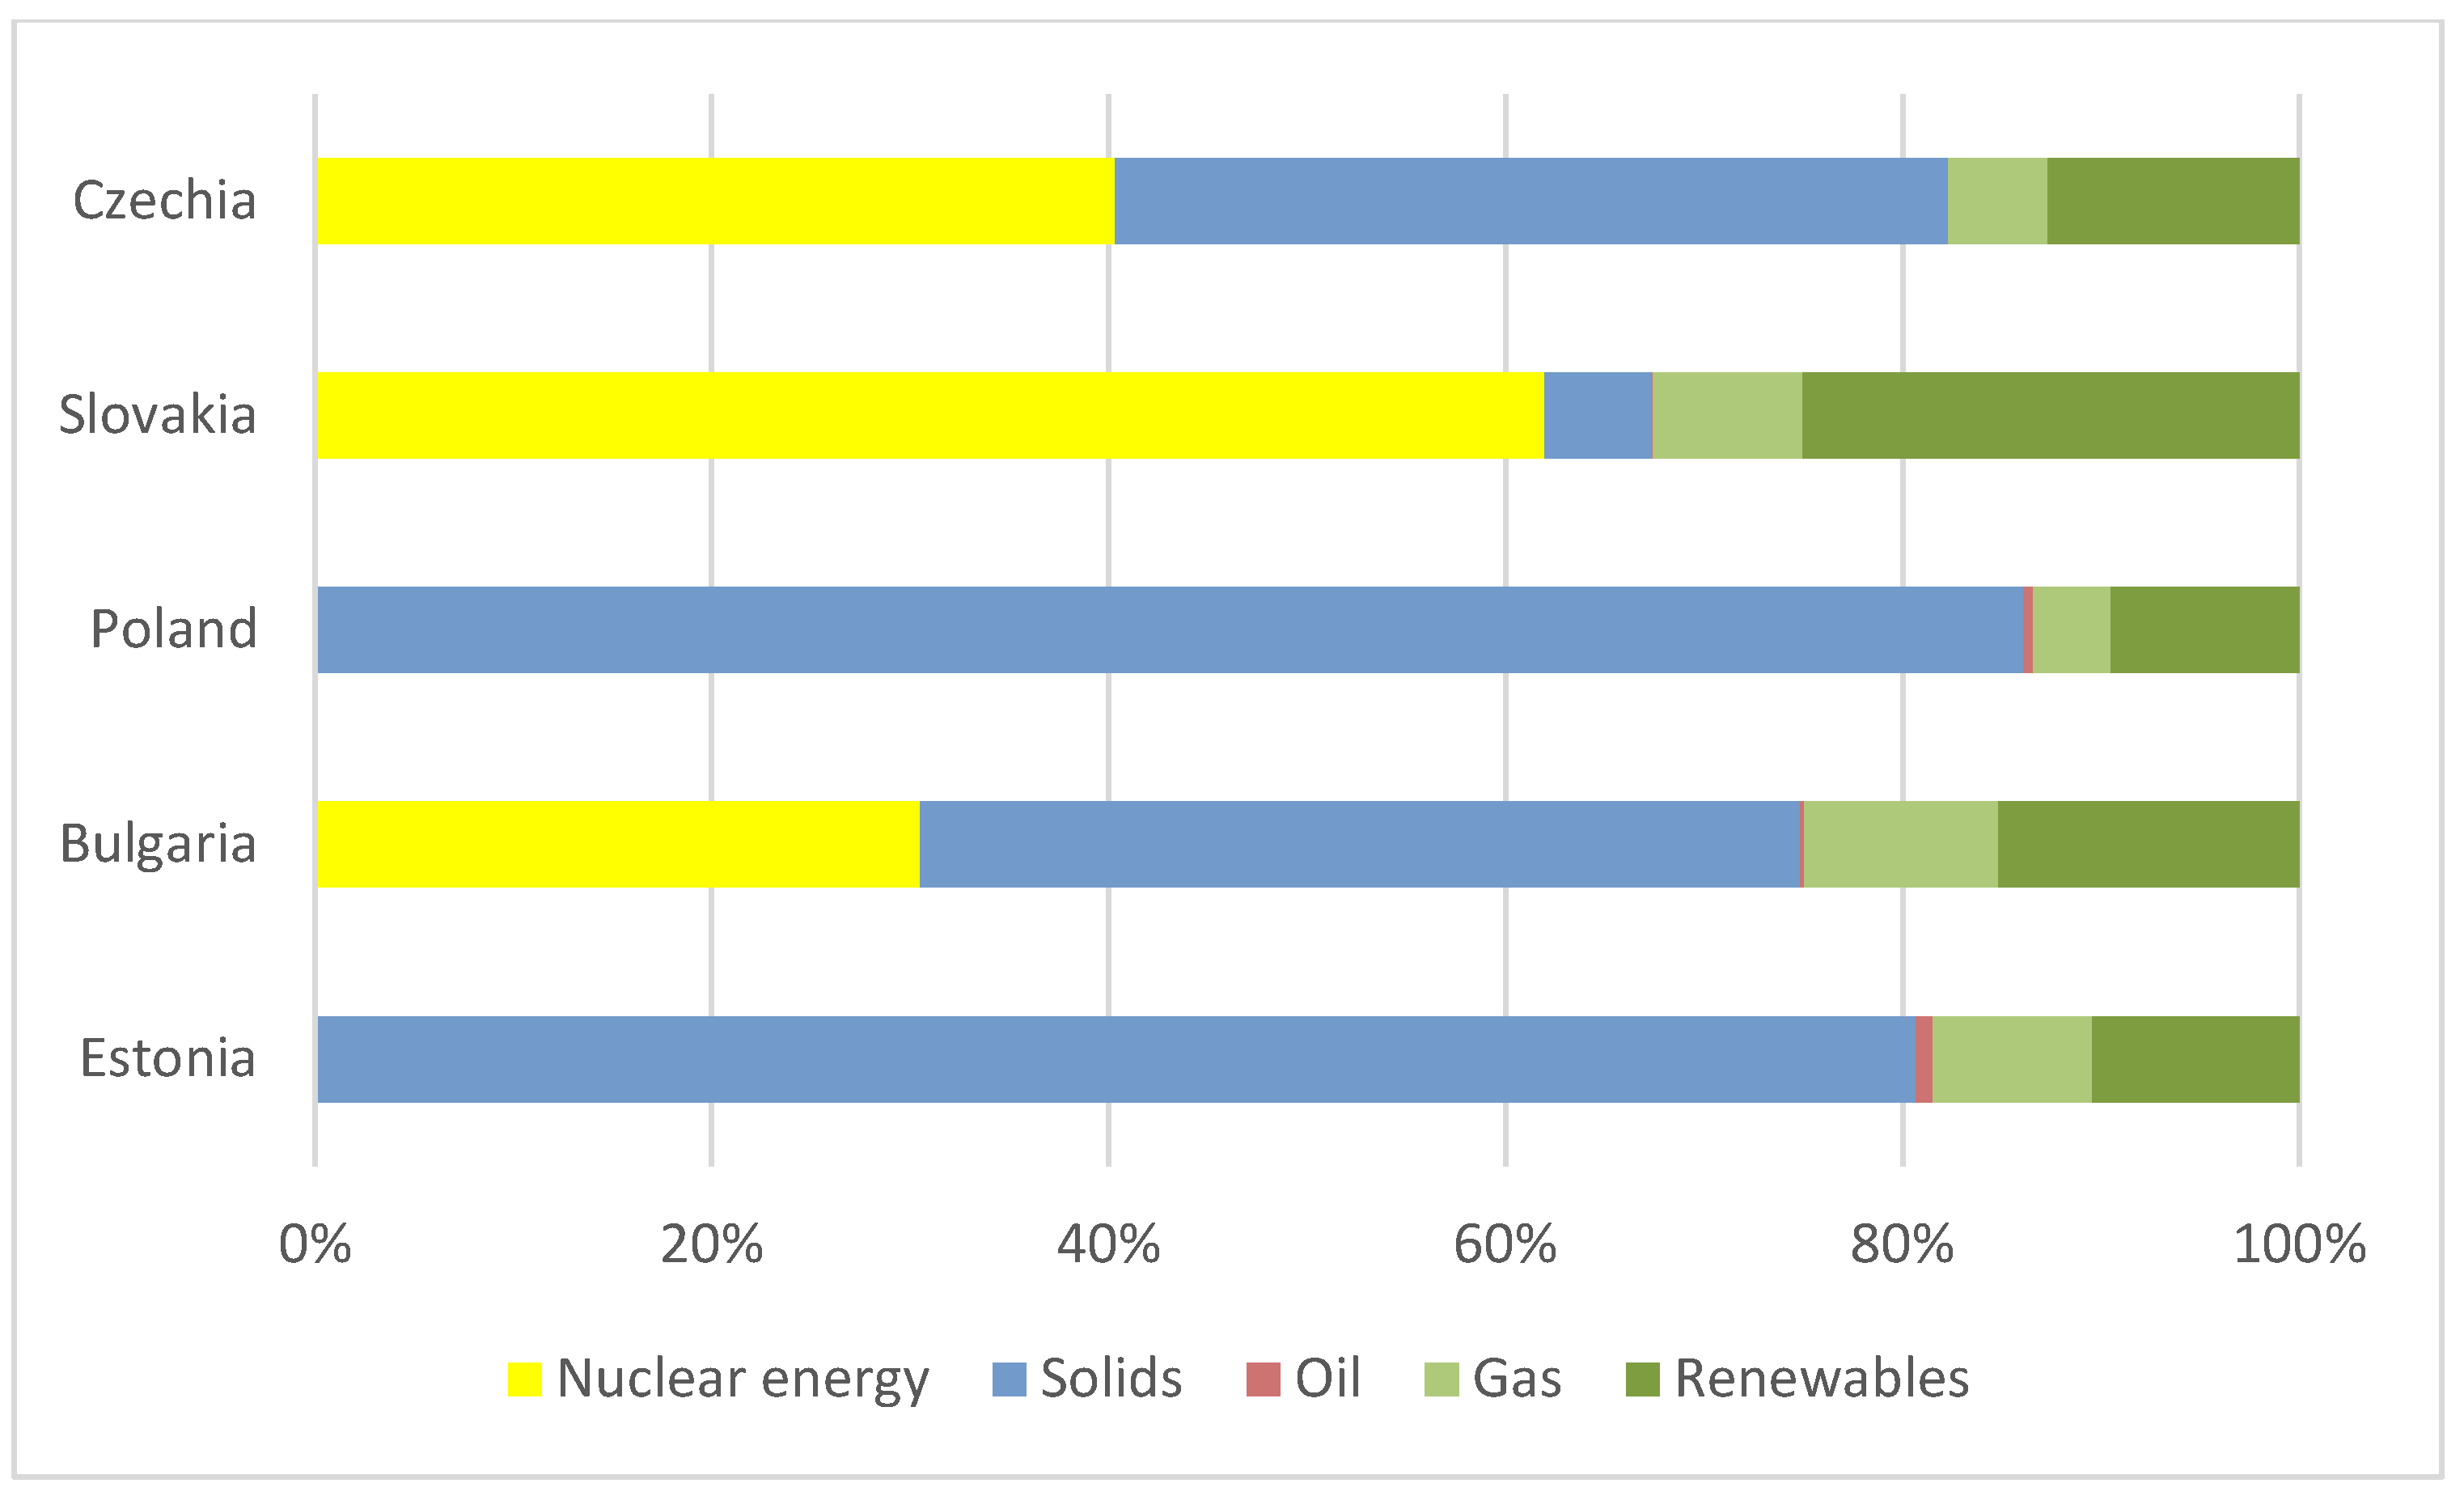
The fifth cluster (Figure 10) contains countries where the level of GHG emissions per capita is close to the average and exceeds what should be interpreted as an undesirable phenomenon. Consumption of energy coming from the renewable sources per capita in this cluster is one of the lowest in the EU. There are low levels of energy dependence, at less than 1% for Estonia, 36% for Bulgaria and Czechia, and 44% for Poland (except for Slovenia, at 63%, the highest in this cluster).
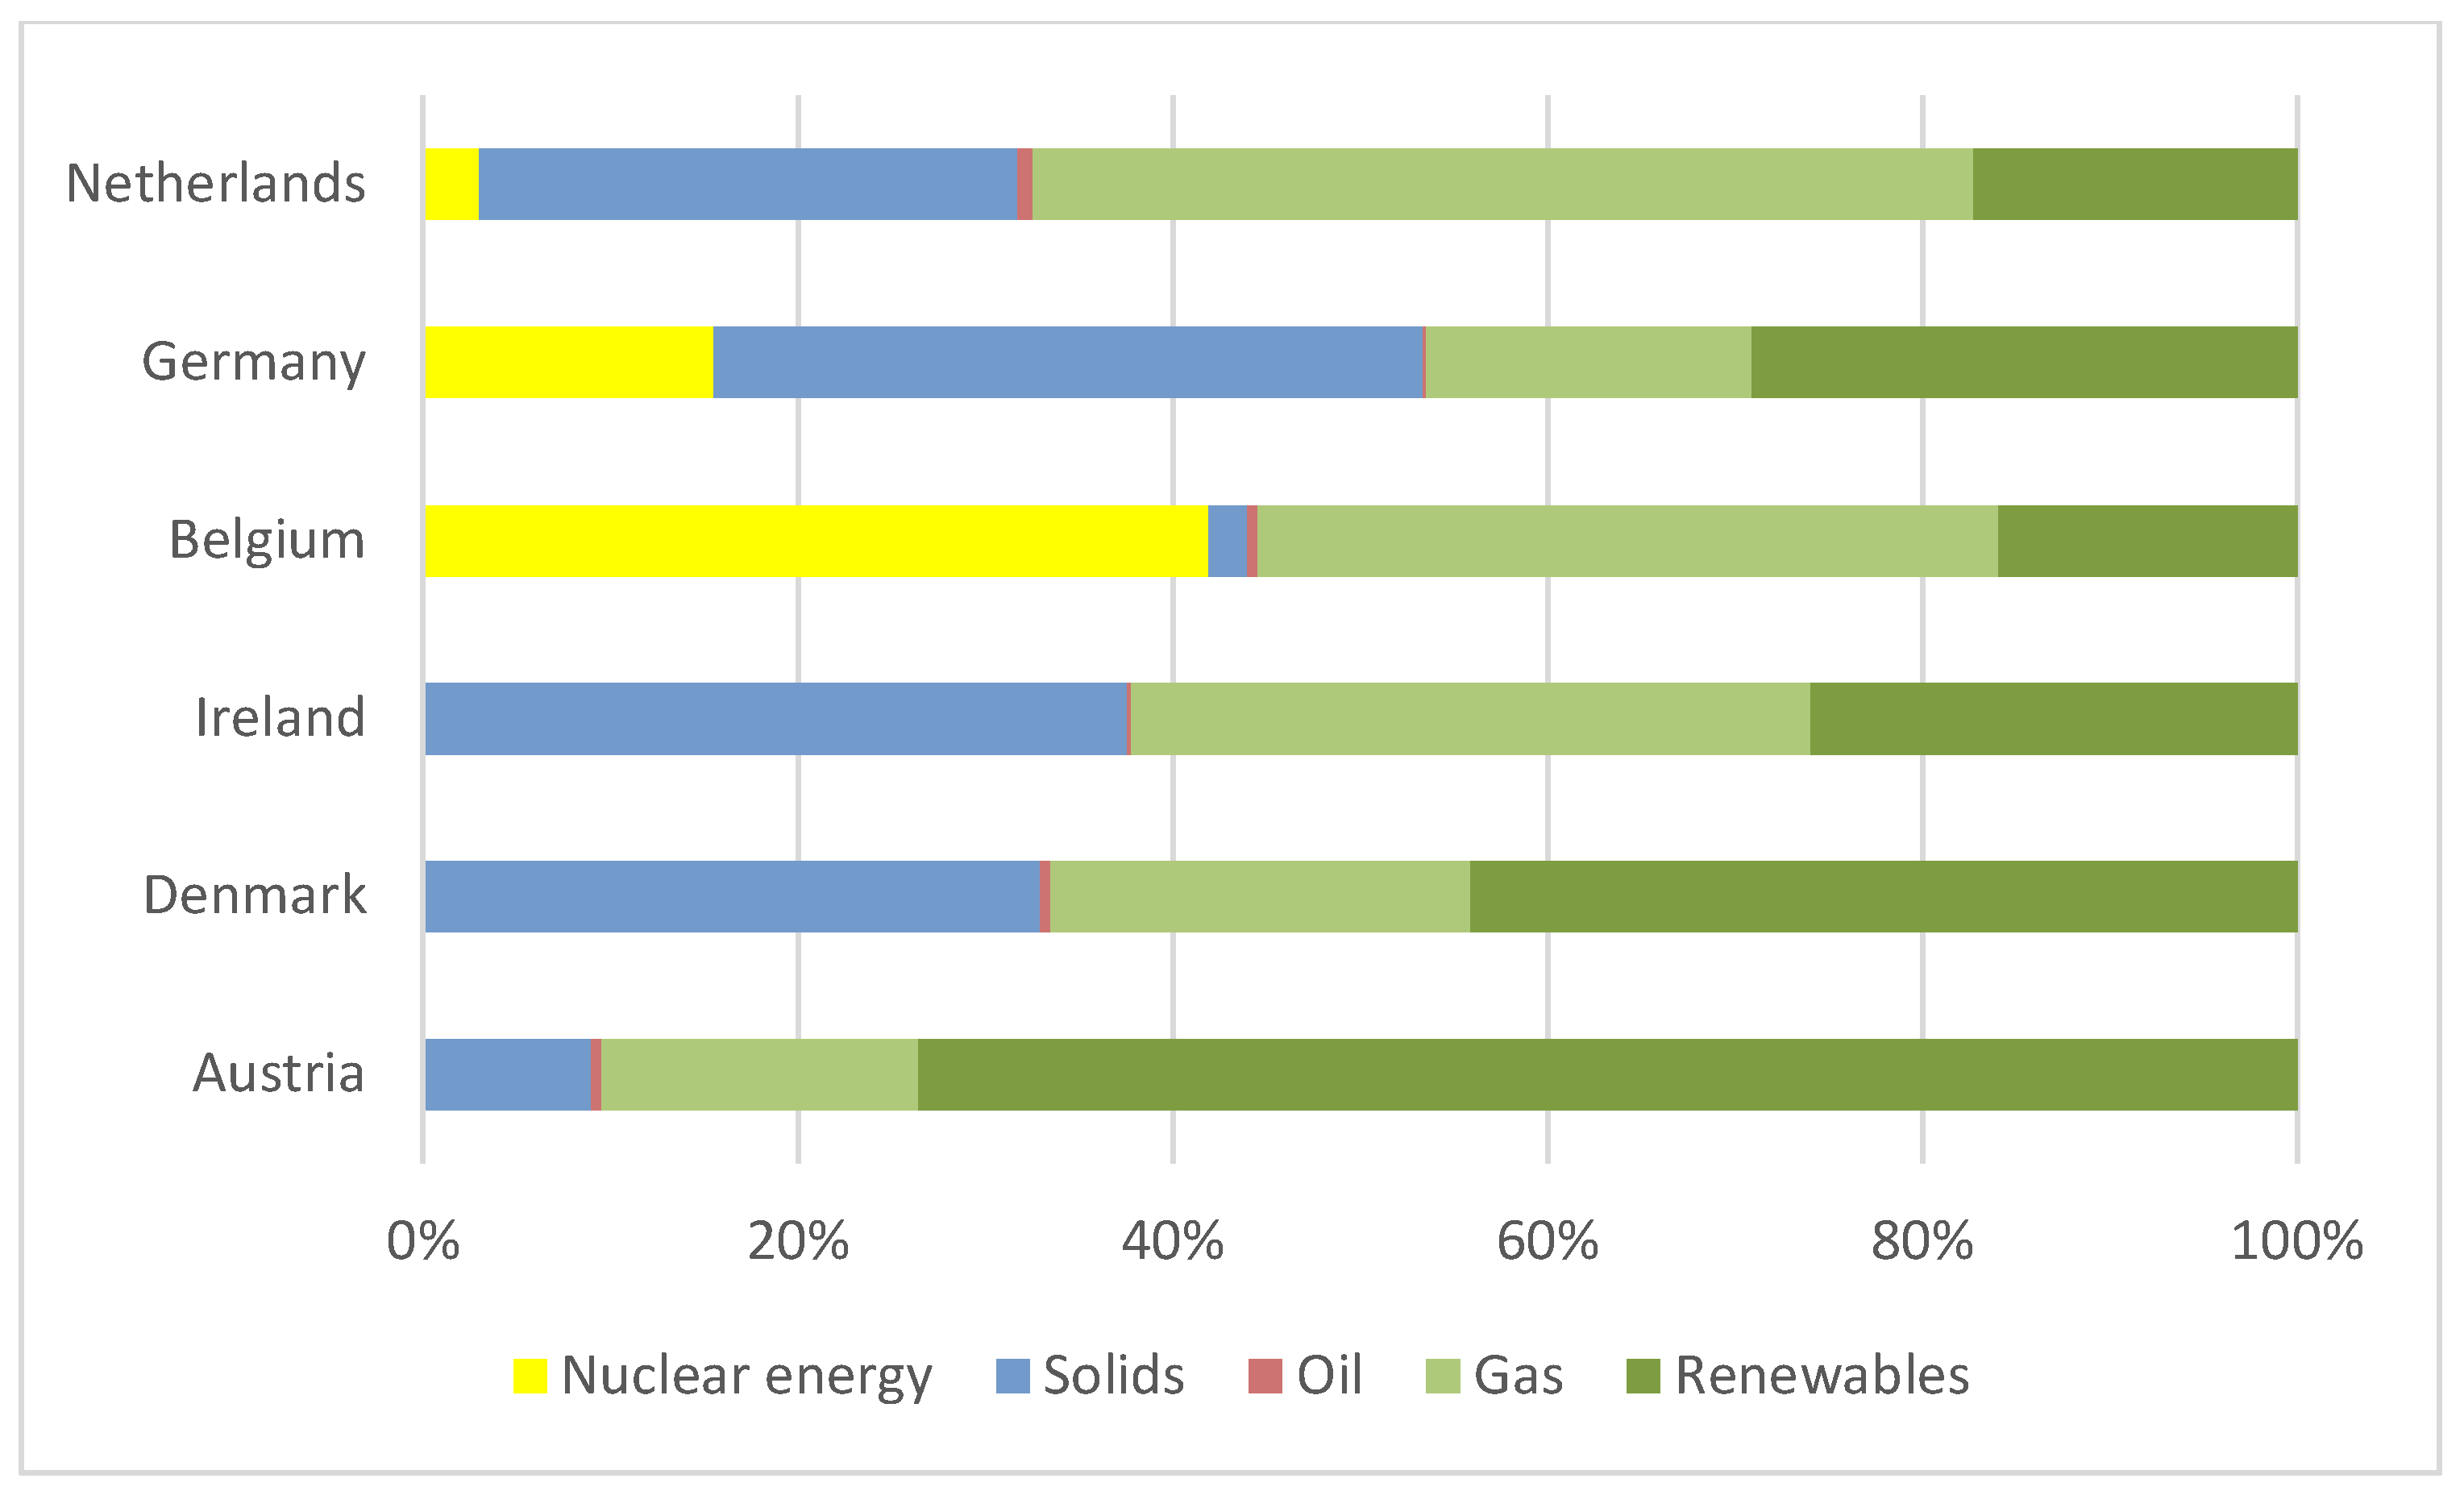
The sixth cluster (Figure 11) contains countries where the level of energy intensity is the lowest, which should be interpreted positively. The consumption of energy from renewable sources is high.
5. Discussion
The paper presented the results of research on the identification of groups of similar countries in terms of the level of development of energy markets within the European Union. The research process was carried out in four main stages, such as:
- Standardization of diagnostic variables.
- Preliminary identification of the similarity of objects.
- Division into groups of similar countries using the agglomeration procedure.
- Characterization of energy balances of identified groups of homogeneous countries.
The result of the first stage was the identification of 4 stimulants and 5 de-stimulants among the diagnostic variables, the values of which were standardized in accordance with Formulas (1) and (2). As a result, it was possible to present the data in a uniform range of values from 0 to 1 in the pictorial graph presented in Figure 2, which shows, in a graphic form, similar countries and provides a useful tool for data interpretation. In the next stage, 6 groups of similar countries were identified in terms of the development of energy markets. The results of this stage are discussed in detail in Figure 3, Figure 4, Figure 5 and Figure 6 and in Table 2. Figure 3 shows the values of the agglomeration distance (Euclidean distance) on the horizontal axis, at which the process of agglomeration of objects into groups takes place. Figure 4 shows the distance values for each relationship, from the lowest value of 0.1473928, which makes up the first group of the most similar countries, namely Spain and Portugal, to the value of 4.004498, which includes all 26 examined objects. As a result of this analysis, it can be seen how diversified the member states are in terms of the diagnostic variables Z1 to Z9 characterizing the level of development of energy markets.
Another study [51] also presents an assessment of the level of development of energy markets. The research was carried out for 2004. Based on the agglomeration method, three main groups of similar countries were selected. The first group consists of Central and East European countries: Latvia, Poland, Hungary, Slovakia, Czechia, Lithuania, Estonia, Romania, and Bulgaria. The second group are the Mediterranean basin countries: Slovenia, Portugal, Greece, Malta, and Cyprus. The third group comprises of Luxembourg, Italy, France, Sweden, Spain, The Netherlands, Great Britain, Belgium, Denmark, Ireland, Germany, and Austria. Thus, important factors turned out to be geographic location and climate, regional cooperation, interconnected power systems, and a similar structure of the use of renewable energy sources.
In another study [52], the division into groups of similar countries was made according to the structure and volume of energy production from renewable sources. The k-means algorithm, which belongs to the group of non-hierarchical agglomeration methods, was used for the analysis. The results of the analysis show different divisions into 4 groups of similar countries, demonstrating at the same time the wide potential of using agglomeration methods in statistical research.
In subsequent studies, an analysis of energy markets was carried out in which the Technique for Order of Preference by Similarity to Ideal Solution (TOPSIS) was used. Reference [53] uses the coefficient of variation method (CV) as an objective method for determining the weights of eight input indicators. In the long term, it has been shown that there are differences between the best- and worst-rated countries, mainly in CO2 emissions, energy imports, and total consumption of renewable energy sources. Reference [54] uses TOPSIS to assess the progress of Poland towards a green economy. In this analysis, studies were conducted for individual regions of Poland, which showed systematic progress in the area of green economy in each region.
The results of the research indicate the high potential of the presented model solutions to be useful in economic practice. The participation of member states in the identified potential regional markets could provide an impulse for these countries to increasingly use the most efficient energy technologies capable of competing in the combined market of several countries. It should be noted, however, that the presented methods of multivariate analysis are just one of many possible mathematical models that can be applied, but show high potential for practical usefulness in order to model, among other things, an optimal energy balance for a group of similar countries that would constitute regionally integrated energy markets. The diagnostic variables selected for this study were mainly determined by the availability of data on the Eurostat website, but it should be pointed out that the number of potential diagnostic variables could be increased by other available and standardized measured values for all member states. The results of the research contained the process of evolution of the common energy market in the European Union countries, with particular emphasis on the current internal energy market directives. The final result of the research showed a potential model of the division of EU countries according to the researched variables characterizing energy markets. The selected homogeneous clusters of energy markets can serve as an example of a practicable division into regional energy markets, which in the future will undergo further transformation towards integration into a single internal energy market in the European Union.
6. Conclusions
The assessment of Poland’s energy system is a significant research problem, especially in the process of energy transformation of countries within the European Union. This issue is a scientific problem in which it is possible to use multidimensional analysis, which as a result allows the creation of groups of similar countries in the structure of energy production and from the point of view of other parameters included in the analysis. The obtained research data provide a synthetic and legible division into countries subdivided to each other in relation to the features characterizing the energy market. The grouping results presented in the research were determined by the grouping method and the type of distance, and constitute one of many possible result options. As a result of the agglomeration process using the Ward method and Euclidean distance, six clusters of similar countries were identified with respect to the level of development of energy systems: the first cluster: Finland and Sweden, the second cluster: Luxembourg, the third cluster: France, Latvia, Romania, Slovenia, and the UK, the fourth cluster: Croatia, Greece, Hungary, Italy, Lithuania, Portugal, and Spain, the fifth cluster: Bulgaria, Czechia, Estonia, Poland, and Slovakia, and the sixth cluster: Austria, Belgium, Denmark, Germany, Ireland, and The Netherlands.
The obtained results can provide the basis for further and more detailed research, analysis, and simulations. The main limitation of the research conducted is the presentation of one of the many possible statistical tools to assess the sustainable development of energy markets. The analyses can be deepened, among others, by using methods of linear object ordering, non-hierarchical agglomerations, or principal component analyses. Agglomeration methods are popular and useful methods for object comparisons that can be described by many variables, hence their wide range of practical use. The results of the accomplished analyses show the serious diversity of member states in terms of energy markets. It means that the energy transformation process is so complex that the pace of change should be varied with regard to individual countries. Furthermore, the energy markets have a great influence on the economic situation in these countries. This paper shows that all member countries are significantly diversified in terms of energy, since they use different energy resources in their energy mix structure and technologies for generation of energy and the availability of these technologies is different. The adopted challenges of the European Union countries to achieve climate neutrality by 2050 are undoubtedly a strategic challenge for energy markets. The diversity of countries in terms of the level of energy development shown in the research will require active changes in energy systems, in particular in the least developed countries, where we observe the greatest negative effects of energy systems on the environment. The identified differentiation may be a significant problem in the pursuit of climate neutrality, and according to the authors, active efforts are necessary to eliminate these heterogeneities in terms of the studied variables. That is why it is a complex issue to create a direct comparative analysis of the progress of countries in the pursuit of the energy transformation.
Author Contributions
Conceptualization and methodology, A.B.; Original draft preparation and writing, A.B.; Data curation, A.M.; Analysis of data in the software, A.B.; Investigation, A.B. and A.M.; Project administration, A.B.; Resources, A.M.; Formal analysis, A.M. and A.B.; Visualization, A.M.; Review—writing and editing, A.M. All authors have read and agreed to the published version of the manuscript.
Funding
Research results presented in this paper are an element of the statutory research 06/030/RG3/0054.
Institutional Review Board Statement
Not applicable.
Informed Consent Statement
Not applicable.
Conflicts of Interest
The authors declare no conflict of interest.
References
- IEA. 2019. Available online: https://iea.blob.core.windows.net/assets/98909c1b-aabc-4797-9926-35307b418cdb/WEO2019-free.pdf (accessed on 1 July 2020).
- EAR. Euracoal Annual Report. 2018. Available online: https://euracoal.eu/library/annual-reports/ (accessed on 5 May 2020).
- Dreyer, I.; Stang, G. Energy Moves and Power Shifts EU Foreign Policy and Global Energy Security. ISSUE European Union Institute for Security Studies 2014 Reports 18. Available online: http://www.iss.europa.eu/uploads/media/Report_18.pdf (accessed on 5 May 2020).
- EET. European Energy and Transport—Trends to 2030 (EET). 2007. Available online: https://ec.europa.eu/energy/sites/ener/files/documents/trends_to_2030_update_2007.pdf (accessed on 10 July 2020).
- Bluszcz, A. The emissivity and energy intensity in EU countries—Consequences for the Polish economy. In Proceedings of the Energy and Clean Technologies. Recycling, air Pollution and Climate Change, Sofia, Bulgaria, 1–7 July 2018; Volume 18, pp. 631–638. [Google Scholar]
- Bluszcz, A. European Economies in terms of energy dependence. Qual. Quan. 2017, 51, 1531–1548. [Google Scholar] [CrossRef] [Green Version]
- Manowska, A. Analysis and forecasting of the primary energy consumption in Poland using deep learning. Miner. Eng. 2020, 21, 217–222. [Google Scholar] [CrossRef]
- Manowska, A. Using the LSTM network to forecast the demand for electricity in Poland. Appl. Sci. 2020, 10, 8455. [Google Scholar] [CrossRef]
- Manowska, A. Using the LSTM network to forecast the demand for hard coal. Min. Res. Manag. 2020, 36, 33–48. [Google Scholar]
- Prăvălie, R.; Bandoc, G. Nuclear energy: Between global electricity demand, worldwide decarbonisation imperativeness, and planetary environmental implications. J. Environ. Manag. 2018, 209, 81–92. [Google Scholar] [CrossRef] [PubMed]
- European Parliament. Available online: https://www.europarl.europa.eu/factsheets/en/sheet/68/energypolicy-general-principles (accessed on 1 July 2020).
- European Commission. Available online: https://ec.europa.eu/info/sites/default/files/european-green-deal-communication_en.pdf (accessed on 20 July 2020).
- Manowska, A. An Analysis of Coal Products Sales with Reference to Environmental Regulations of the European Union. Energy and Fuels; Cracow University of Technology, Institute of Thermal Power Engineering: Cracow, Poland, 2018. Available online: http://www.konferencja-eip.agh.edu.pl/wp-content/uploads/2018/12/EiP-2018-BoA-18-09.pdf (accessed on 1 July 2020).
- Arabzadeh, V.; Mikkola, J.; Jasiūnas, J.; Lund, P.D. Deep decarbonization of urban energy systems through renewable energy and sector-coupling flexibility strategies. J. Environ. Manag. 2020, 260, 110090. [Google Scholar] [CrossRef]
- Sierpińska, M.; Bąk, P. Financial structure of mining sector companies during an economic slowdown. Arch. Min. Sci. 2020, 57, 1089–1100. [Google Scholar]
- Rybak, A.; Rybak, A. Possible strategies for hard coal mining in Poland as a result of production function analysis. Resour. Policy 2016, 50, 27–33. [Google Scholar] [CrossRef]
- Manowska, A.; Tobór-Osadnik, K.; Wyganowska, M. Economic and social aspects of restructuring Polish coal mining: Focusing on Poland and the EU. Resour. Policy 2017, 52, 192–200. [Google Scholar] [CrossRef]
- Jonek-Kowalska, I. Challenges for long-term industry restructuring in the Upper Silesian Basin. What has Polish coal mining achieved and failed from a twenty—Year perspective? Resour. Policy 2015, 44, 135–149. [Google Scholar] [CrossRef] [Green Version]
- Hąbek, P.; Wolniak, R. Assessing the quality of corporate social responsibility reports; the case of reporting practices in selected European Union member states. Qual. Quan. 2016, 50, 399–420. [Google Scholar] [CrossRef] [Green Version]
- Grabowska, S. Improvement of the heat treatment process in the industry 4.0 context. METAL 2018. In Proceedings of the 27th International Conference on Metallurgy and Materials, Brno, Ostrava, Czech Republic, 23–25 May 2018; pp. 1985–1990. [Google Scholar]
- Brzychczy, E. An overview of data mining and process mining applications in underground mining. Min. Eng. 2019, 21, 301–314. [Google Scholar]
- Manowska, A. Forecast to determine a development strategy for the mining sector, Conference proceedings. In Ecology, Economics, Education and Legislation, Environmental Economics; STEF92 Technology: Sofia, Bulgaria, 2018; Volume 18, pp. 967–974. [Google Scholar]
- Bluszcz, A. Multidimensional comparative analysis as a tool for assessing the level of development of energy markets in selected European countries. In World Multidisciplinary Earth Sciences Symposium WMESS, IOP Conference Series: Earth and Environmental Science; Institute of Physics Prague: Bristol, Czech Republic, 2020. [Google Scholar]
- European Commission. Energy Strategy. Available online: https://ec.europa.eu/energy/topics/energy-strategy/energy-union_en (accessed on 12 May 2021).
- European Commission. Available online: https://ec.europa.eu/eurostat/statistics-explained/index.php?title=Energy_production_and_imports&oldid=498607 (accessed on 10 May 2020).
- European Commission europa.eu. Available online: https://ec.europa.eu/eurostat/statistics-explained/index.php?title=Energy_production_and_imports#The_EU_and_its_Member_States_are_all_net_importers_of_energy (accessed on 10 July 2020).
- Eurostat. Energy, Transport and Environment Statistics. 2019. Available online: https://ec.europa.eu/eurostat/documents/3217494/10165279/KS-DK-19-001-EN-N.pdf/76651a29-b817-eed4-f9f2-92bf692e1ed9 (accessed on 1 May 2020).
- Manowska, A.; Nowrot, A. The importance of heat emission caused by global energy production in terms of climate impact. Energies 2019, 12, 3069. [Google Scholar] [CrossRef] [Green Version]
- Batrancea, I.; Batrancea, L.; Nichita, A.; Gaban, L.; Masca, E.; Morar, I.-D.; Fatacean, G.; Moscviciov, A. An econometric approach on production, costs and profit in Romanian coal mining enterprises. Econ. Res. 2019, 32, 1019–1036. [Google Scholar] [CrossRef] [Green Version]
- Batrancea, L. An econometric approach regarding the impact of fiscal pressure on equilibrium: Evidence from electricity, gas and oil companies listed on the New York Stock Exchange. Mathematics 2021, 9, 630. [Google Scholar] [CrossRef]
- Polish Ministy of Economy. Energy Policy of Poland until 2030. In Appendix to Resolution No. 202/2009 of the Council of Ministers of 10 November 2009; Polish Ministry of Economy: Warsaw, Poland, 2009. (In Polish) [Google Scholar]
- Paska, J.; Surma, T.; Terlikowski, P.; Zagrajek, K. Electricity generation from renewable energy sources in Poland as a part of commitment to the Polish and EU energy policy. Energies 2020, 13, 4261. [Google Scholar] [CrossRef]
- Tucki, K.; Orynycz, O.; Wasiak, A.; Świć, A.; Dybaś, W. Capacity market implementation in Poland: Analysis of a survey on consequences for the electricity market and for energy management. Energies 2019, 12, 839. [Google Scholar] [CrossRef] [Green Version]
- Bluszcz, A.; Manowska, A. Differentiation of the level of sustainable development of energy markets in the European Union countries. Energies 2020, 13, 4882. [Google Scholar] [CrossRef]
- Ranosz, R. Analysis of the structure and cost of capital in mining enterprises. Min. Res. Manag. 2017, 33, 77–91. [Google Scholar] [CrossRef] [Green Version]
- Bluszcz, A.; Ranosz, R. The use of multidimensional exploration techniques to assess the similarity level of development of energy markets. Min. Eng. 2020, 21, 199–204. [Google Scholar] [CrossRef]
- Ranosz, R.; Bluszcz, A.; Kowal, D. Conditions for the innovation activities of energy sector enterprises shown on the example of mining companies. Min. Eng. 2020, 21, 249–256. [Google Scholar] [CrossRef]
- Jonek-Kowalska, I. Efficiency of Enterprise Risk Management (ERM) systems. Comparative analysis in the fuel sector and energy sector on the basis of Central-European companies listed on the Warsaw Stock Exchange. Resour. Policy. 2019, 62, 405–415. [Google Scholar] [CrossRef]
- Jonek-Kowalska, I.; Nawrocki, T. Holistic fuzzy evaluation of operational risk in polish mining enterprises in a long-term and sectoral research perspective. Resour. Policy 2019, 63, 101464. [Google Scholar] [CrossRef]
- Gawlik, L. The Polish power industry in energy transformation process. Min. Econ. 2018, 31, 229–237. [Google Scholar] [CrossRef] [Green Version]
- Bąk, P. Production planning in a mining enterprise—Selected problems and solutions. Miner. Resour. Manag. 2018, 2, 97–114. [Google Scholar]
- Jonek-Kowalska, I. Long-term Analysis of the Effects of Production Management in Coal Mining in Poland. Energies 2019, 12, 3146. [Google Scholar] [CrossRef] [Green Version]
- European Commission. Available online: https://ec.europa.eu/eurostat/statistics-explained/index.php?title=Archive:Consumption_of_energy&oldid=297143 (accessed on 5 July 2020).
- IAEA; UNDESA. Energy Indicators for Sustainable Development Guidelines and Methodologies. International Atomic Energy Agency, United Nations Department of Economic and Social Affairs, International Energy Agency, Eurostat And European Environment Agency. Available online: https://www-pub.iaea.org/MTCD/Publications/PDF/Pub1222_web.pdf (accessed on 1 July 2020).
- Energy Indicators for Sustainable Development. 2007. Report (IAEA, UNDESA). International Atomic Energy Agency United Nations Department of Economic and Social Affairs. Available online: https://www.un.org/esa/sustdev/publications/energy_indicators/full_report.pdf (accessed on 10 July 2020).
- Zeliaś, A. Statistical Methods; Polish Economic Publishing House: Warsaw, Poland, 2000. [Google Scholar]
- Eurostat. Available online: https://ec.europa.eu/eurostat/web/main/data/database (accessed on 8 July 2020).
- Giudici, P. Applied Data Mining. Statistical Methods for Business and Industry; John Wiley & Sons: Hoboken, NJ, USA, 2003. [Google Scholar]
- Kijewska, A.; Bluszcz, A. Analysis of greenhouse gas emissions in the European Union with the use of agglomeration algorithm. J. Sustain. Min. 2016, 15, 133–142. [Google Scholar] [CrossRef]
- Wiszniewska, E. Taxonomic Analysis of the Level of Sustainable Development of Voivodships in Poland. In Taxonomy 15. Data Classification and Analysis—Theory and Applications; Jajuga, K., Walesiak, M., Eds.; Scientific Publishing House of the Wroclaw University of Economics: Wroclaw, Poland, 2008; pp. 372–373. [Google Scholar]
- Zawada, M. Assessment of the level of development of the power market of the European Union Countries. Acta Univ. Lodz. Folia Oeconomica. 2008, p. 224. Available online: https://dspace.uni.lodz.pl/xmlui/handle/11089/7651 (accessed on 10 July 2020).
- Brodny, J.; Tutak, M. Analyzing Similarities between the European Union Countries in Terms of the Structure and Volume of Energy Production from Renewable Energy Sources. Energies 2020, 13, 913. [Google Scholar] [CrossRef] [Green Version]
- Vavrek, R.; Chovancová, J. Energy Performance of the European Union Countries in Terms of Reaching the European Energy Union Objectives. Energies 2020, 13, 5317. [Google Scholar] [CrossRef]
- Godlewska, J.; Sidorczuk-Pietraszko, E. Taxonomic Assessment of Transition to the Green Economy in Polish Regions. Sustainability 2018, 11, 5098. [Google Scholar] [CrossRef] [Green Version]
Figure 1.
Inter-relationship among sustainability dimensions of the energy sector. Source (own elaboration).
Figure 1.
Inter-relationship among sustainability dimensions of the energy sector. Source (own elaboration).

Figure 2.
Star-type chart for EU countries accessed according to nine diagnostic variables for 2018. Source (own elaboration).
Figure 2.
Star-type chart for EU countries accessed according to nine diagnostic variables for 2018. Source (own elaboration).

Figure 3.
Tree diagram with the Ward method and Euclidean distance in the agglomeration procedure. Source: (own elaboration).
Figure 3.
Tree diagram with the Ward method and Euclidean distance in the agglomeration procedure. Source: (own elaboration).

Figure 4.
The agglomeration process using the Ward method and Euclidean distance. Source: (own elaboration).
Figure 4.
The agglomeration process using the Ward method and Euclidean distance. Source: (own elaboration).

Figure 5.
Euclidean distance matrix for 2018. Source: (own elaboration).

Figure 6.
Binding distances relative to the binding stages. Source: (own elaboration).

Figure 7.
Structure of energy mixes for the first and second clusters. Source (own elaboration).

Figure 8.
Structure of energy mixes for the third cluster. Source (own elaboration).

Figure 9.
Structure of energy mixes for the fourth cluster. Source (own elaboration).

Figure 10.
Structure of energy mixes for the fifth cluster. Source (own elaboration).

Figure 11.
Structure of energy mixes for the sixth cluster. Source (own elaboration).


Table 1.
Division of variables into stimulants and de-stimulants.
| Diagnostic Variable | |
|---|---|
| Stimulant | Z1 Consumption of electric energy generated from renewables per capita (TWH/person) |
| Stimulant | Z2 Available for final consumption Gigawatt-hour per person |
| Stimulant | Z3 Final energy consumption (thousand tons of oil equivalent (TOE) per person) |
| Stimulant | Z4 Natural gas (Terajoule gross calorific value—GCV) per person |
| Destimulant | Z5 Petroleum available for final consumption (Gigawatt-hour) |
| Destimulant | Z6 Hard coal consumption (million tons/person) |
| Destimulant | Z7 Greenhouse gas emissions per capita |
| Destimulant | Z8 Energy intensity of GDP (kilograms of oil equivalent (KGOE) per thousand euro) |
| Destimulant | Z9 Import dependency (%) |
Source (own elaboration).
Table 2.
Mean values and standard deviations for standardized data for 2018.
| Country | Mean | Standard Deviation |
|---|---|---|
| Belgium | 0.466373 | 0.288582 |
| Bulgaria | 0.387010 | 0.411141 |
| Czechia | 0.418670 | 0.265748 |
| Denmark | 0.554492 | 0.320087 |
| Germany | 0.456487 | 0.269452 |
| Estonia | 0.448298 | 0.358672 |
| Ireland | 0.459846 | 0.360181 |
| Greece | 0.440732 | 0.390229 |
| Spain | 0.450832 | 0.351335 |
| France | 0.502718 | 0.343357 |
| Croatia | 0.482695 | 0.393525 |
| Italy | 0.489524 | 0.373376 |
| Latvia | 0.534449 | 0.361366 |
| Lithuania | 0.443052 | 0.392193 |
| Luxembourg | 0.601617 | 0.465924 |
| Hungary | 0.463999 | 0.383142 |
| Netherlands | 0.475886 | 0.298702 |
| Austria | 0.537511 | 0.239156 |
| Poland | 0.318956 | 0.337439 |
| Portugal | 0.445184 | 0.369395 |
| Romania | 0.503111 | 0.450142 |
| Slovenia | 0.480489 | 0.340311 |
| Slovakia | 0.419106 | 0.311825 |
| Finland | 0.541035 | 0.264131 |
| Sweden | 0.612124 | 0.353504 |
| UK | 0.540394 | 0.372134 |
Source: (own elaboration).
Publisher’s Note: MDPI stays neutral with regard to jurisdictional claims in published maps and institutional affiliations. |
© 2021 by the authors. Licensee MDPI, Basel, Switzerland. This article is an open access article distributed under the terms and conditions of the Creative Commons Attribution (CC BY) license (https://creativecommons.org/licenses/by/4.0/).
Share and Cite
MDPI and ACS Style
Bluszcz, A.; Manowska, A. The Use of Hierarchical Agglomeration Methods in Assessing the Polish Energy Market. Energies 2021, 14, 3958. https://0-doi-org.brum.beds.ac.uk/10.3390/en14133958
AMA Style
Bluszcz A, Manowska A. The Use of Hierarchical Agglomeration Methods in Assessing the Polish Energy Market. Energies. 2021; 14(13):3958. https://0-doi-org.brum.beds.ac.uk/10.3390/en14133958
Chicago/Turabian StyleBluszcz, Anna, and Anna Manowska. 2021. "The Use of Hierarchical Agglomeration Methods in Assessing the Polish Energy Market" Energies 14, no. 13: 3958. https://0-doi-org.brum.beds.ac.uk/10.3390/en14133958
Note that from the first issue of 2016, this journal uses article numbers instead of page numbers. See further details here.