Article

Numerical Simulation of a Novel Dual Layered Phase Change Material Brick Wall for Human Comfort in Hot and Cold Climatic Conditions

1
Department of Mechatronics and Bio-Medical Engineering, Faculty of Engineering, Air University, Islamabad 44000, Pakistan
2
Department of Civil, Structural and Environmental Engineering, School of Engineering, Trinity College, D02 PN40 Dublin, Ireland
*
Authors to whom correspondence should be addressed.
Submission received: 12 April 2021 / Revised: 27 June 2021 / Accepted: 1 July 2021 / Published: 4 July 2021
(This article belongs to the Special Issue Phase Change Materials for Thermal Energy Storage Applications)

Abstract

:
Phase change materials (PCMs) have a large number of applications for thermal energy storage (TES) and temperature reduction in buildings due to their thermal characteristics and latent heat storage capabilities. The thermal mass of typical brick walls can be substantially increased using a suitable PCM primarily based on phase change temperature and heat of fusion for different weather conditions in summer and winter. This study proposed a novel dual-layer PCM configuration for brick walls to maintain human comfort for hot and cold climatic conditions in Islamabad, Pakistan. Numerical simulations were performed using Ansys Fluent for dual PCMs layered within a brick wall for June and January with melting temperatures of 29 °C and 13 °C. This study examined and discussed the charging and discharging cycles of PCMs over an extended period (one month) to establish whether the efficacy of PCMs is hindered due to difficulties in discharging. The results show that the combined use of both PCMs stated above provides better human comfort with reduced energy requirements in Islamabad throughout the year than using a single PCM (29 °C) for summer or winter (13 °C) alone.

1. Introduction

Building construction and operations use 36% of global energy consumption and produce 39% of global CO2 emissions; both former and latter account for the largest share. Space heating, water heating, and cooking are the primary energy use, whereas space cooling is one of the fastest-growing demands in buildings [1]. Phase change materials (PCMs) are potentially used for heat storage and release and in a vast range of applications such as commercial buildings [2], solar PV [3], and free cooling [4]. As they utilize heat to change their phase, for example, solid–liquid or vice versa, their melting or solidification is constant. Thus, it provides a promising opportunity for heat storage or release, as required based on diurnal temperature variations. Heating and cooling shares of total energy use in buildings are quite diverse worldwide, with the highest in commercial buildings of developing countries, 73% in Centrally Planned Asia and 64% in South Asia [5].
Alternate approaches to enhance thermal inertia of typical building materials are required, such as thermal energy storage solutions using phase change materials (PCMs). Various studies have been performed for determining the phase change behavior and temperature control in building applications [6,7,8]. The use of passive techniques, i.e., PCM with typical construction material, is a widely accepted solution to reduce energy consumption in residential or office buildings [9,10,11]. The main criteria for the selection of PCM in a particular application are its melting temperature and heat of fusion [12,13,14].
Al-Yasiri and Szabo [15] presented a comprehensive analysis of the integration of PCMs in building walls and their potential for future use in the built environment. Louanate et al. [16] presented the study of using dual PCMs in buildings using EnergyPlus software for the Mediterranean climatic region. Arici et al. [17] numerically investigated the effect of PCM integrated into building the wall for its position, thickness, and melting range for climatic conditions of Turkey.
Frazzica et al. [18] evaluated the thermal response of a composite based on mortar with PCMs experimentally and then used results to validate the numerical model. Ye et al. [19] numerically investigated the PCM panel effectiveness with different melting temperature simulated for a standard room. Zhu et al. [20] numerically evaluated the thermal response of PCM in lightweight buildings under Tianjin climate and investigated the effect of PCM location in the wall, roof, and floor. Meng et al. [21] numerically investigated the effect of inclination angle on PCM thermal behavior. Rostami [22] conducted a numerical study to investigate the convective heat transfer characteristics of microencapsulated PCM. Navarro et al. [23] presented a thorough review on integration of passive systems for thermal energy storage applications in buildings.
This paper examines the incorporation of dual-layered PCMs for a South Asian climate. The dual-layered PCM has different melting temperatures, one at a higher melting temperature 29 °C suitable for summer and the other at a relatively low temperature 13 °C for winter in Pakistan. In this case, PCM choice is different in each external environment, while the building structure remains the same throughout the year. CFD simulations for each scenario were conducted with no PCM, then with single, and finally, with dual-layered PCM configurations. A detailed comparison of indoor temperatures is presented in the Section 4.
From the literature review, the authors found that little work has been presented so far for the cases dealing with the application of dual-layered PCMs and particularly for South Asian climates. The current study focused on this unique application of dual-layered PCMs and conducted a thorough evaluation using CFD simulations. Diurnal temperature variations, including solar radiation effects for the entire months of June and January, were successfully modeled and analyzed using Ansys Fluent for a typical construction wall. The suitability of PCMs, based on their phase change temperature, was assessed for their application in the summer and winter months for the subtropical climate of Islamabad, Pakistan. In existing studies analyzing dual-layered PCMs applications, it is observed that the two PCMs used generally have minor differences in their melting temperatures. This limits their application for tropical weather conditions mainly. This study covered the considerably higher temperature difference between dual-layered PCMs to be applied (29 °C and 13 °C).
Additionally, a combination of organic and inorganic PCMs was evaluated to get benefit from their different thermophysical characteristics. Moreover, the study convincingly established that using dual PCMs throughout the year is appropriate for application in buildings to meet the occupants’ thermal comfort during different weather conditions. Furthermore, lab-scale experimental testing was also undertaken to evaluate the thermal response of two layers of PCM integrated with concrete. It underwent a charging and discharging cycle for 24 h and validated the results with the CFD methodology used for simulations throughout this study. The simulation study validated by these experimental results examined and discussed the charging and discharging cycles of PCMs over an extended period (one month) to establish whether the efficacy of PCMs is hindered due to difficulties in discharging.

2. Mathematical Modelling

The typical construction in Pakistan consists of brick masonry housing, and it comprises 62.38% of the total built environment. This kind of construction ranges from single-story buildings in rural areas to three-story houses in urban areas such as Islamabad, considered for this study. The building materials used for the construction of walls are bricks with mud mortar or cement sand mortar. The load-bearing walls, on average, are of 0.3429 m thickness, though these walls can be thinner around 0.2286 m, especially in the case of a light roof [24].
A model was developed in Fluent to simulate this construction type. The brick wall (illustrated in Figure 1) was modeled with a unique integrated arrangement of PCMs suitable for the climate in Islamabad, Pakistan. Summer temperatures generally soar above 40 °C, while in winter, they reach below 0 °C. For thermal comfort requirements, PCMs can provide a solution suited to the ambient temperatures of Islamabad. A 2D model was developed of a typical wall thickness of dimensions 0.22 m × 0.22 m. Figure 1 represents the schematic of the proposed innovative brick wall with different PCM types and insulation.
The first baseline brick configuration was modeled without EPS and PCMs, having all regions shown in Figure 1 as a brick region. Thermophysical properties of selected materials are summarized in Table 1 [25,26].
Figure 2 shows the ambient temperature profile of Islamabad for the months of January and June, respectively, which are used as an input for the simulation.
The highest temperature in June is 42 °C with an average of 30 °C, and the lowest temperature in January is 1 °C with an average of 10 °C. The distinct variation of summer and winter months highlights the need for buildings to have thermal mass such that they can provide thermal comfort for the occupants throughout the year.
Figure 3 shows the solar flux data for January and June. The solar radiation flux peaks on the 10th day with 690 W/m2 and an average of 125.7 W/m2 for June. Similarly, the peak flux 531 W/m2 is obtained on the 27th day with an average value of 62.6 W/m2 for January. Solar air temperature (SAT), based on the ambient temperature and solar intensity data presented in Figure 2 and Figure 3, respectively, is defined as below: [27]
T s = T o + α q s h o
where
Ts = solar air temperature (°C)
To = ambient temperature (°C)
qs = solar intensity (W/m2)
α = absorption coefficient of brick
ho = heat transfer coefficient (W/m2K)
The absorption coefficient of brick is 0.55, and the heat transfer coefficient for ambient air is taken as 17 (W/m2K) for outdoor conditions to calculate the solar radiation effects.
Figure 4 shows the time-dependent variations of the solar-radiation-based temperature profile. This temperature profile is used as the inlet boundary condition in all simulation cases.

2.1. Model Assumptions

While conducting the simulations, some assumptions were applied and are listed below:
(a)
Thermal conductivity is constant for brick and EPS.
(b)
Interface resistance at different junctions of materials is negligible.
(c)
One-dimensional conductive heat transfer is considered.

2.2. Boundary Conditions

In the model geometry described in Figure 1, the left side of the wall is referred to as the inlet, with the right side of the wall as the outlet. For the inlet, the time-dependent monthly temperature profiles shown in Figure 4 are input to Fluent software. The outlet boundary condition is set to simulate indoor conditions, with natural convection for air with a heat transfer coefficient h = 14 W/m2K and ambient temperature of 20 °C. The heat transfer coefficient is selected within the range of free convection coefficient 2.5–25 W/m2K as stated in the literature [28]. The top and bottom surfaces are considered adiabatic with no heat flux.

2.3. Governing Equations and Numerical Schemes

Three-dimensional transient energy Equation (1) was used to model the pure brick/EPS behavior, and a porosity-based 3D transient energy equation was used for calculating the PCM-based layer enthalpy (2) [29]:
ρ c p T t = · ( k T )
where
ρ = density (kg/m3)
c p = specific heat capacity (J/kg K)
k = thermal conductivity (W/mK)
T = temperature (K)
ρ H t = · ( k T )
H = PCM enthalpy (J/kg)
The enthalpy is obtained by the sum of sensible enthalpy h and latent heat Δ H given by Equation (3) below:
H = h + Δ H
where
h = h r e f + T r e f T c p d T
Δ H = β L
h r e f = PCM enthalpy (J/kg) at reference temperature T r e f (K)
β = liquid fraction 0   ( s o l i d ) β 1   ( l i q u i d )
L = latent heat of PCM (J/kg)
A second-order upwind discretization scheme for energy and SIMPLE pressure velocity coupling was used. The numerical solutions are conducted using a reasonably large time-step size and high-quality mesh with an adequate number of cells to reduce the computational effort. Details of a mesh and time independence study conducted for the simulation are given in Table 2 and Table 3 below:
The variation in the average value of T6 was taken as the selection criterion. This was done as T6 was one of the main variables of interest in this study. Based on the data in Table 2, the mesh size of 18,597 nodes was selected as no significant change in the average value of T6 was noted. Further, a time-step independence study was conducted for the selected mesh.
Based on Table 3 data, the time step of 60 was selected as the change in the average value of T6 for a time-step increased to 60 s from 1 s was negligible. However, the change in the average value of T6 for the time-step increase to 120 s was more significant.

3. Model Validation

The thermal model of the present study was validated with the experimental data of Fujii and Yano (1996) [30] and the simulation results of Wang et al. (2015) [27].
The geometry used by Fujii and Yano consisted of a 300 mm square base with 8 mm of PCM encapsulated within 3.5 mm walls, as shown in Figure 5. This was submerged in a heat bath maintained at 60 °C to provide even heating. A 2D mesh consisting of 845 × 296 quadrilateral elements was generated for numerical simulations after a mesh sensitivity analysis. The time-step independence study established a 10 s time step. A uniformly spaced mesh in both horizontal and vertical directions was used. Numerical simulations were done using Fluent laminar (viscous) governing equations alongside the energy equation and the solidification and melting equations. Several published works used PCM laminar flow for numerical simulations [31,32]. Moreover, laminar flow modeling has been validated with experimental data. Fluent uses the enthalpy-porosity method and treats the PCM as a mushy (porous) zone, and it calculates the extent of melting as the liquid fraction of each cell during each iteration. The liquid fraction β is the liquid-to-solid volumetric ratio of the PCM. The value β is 1 when PCM is in a completely liquid phase and β is 0 in a fully solid phase. When β is in-between 0 and 1, then both liquid and solid phases of the PCM are present.
The heating process was modeled as 1D heat in-flow from the top and bottom surfaces using heat transfer coefficient (14 W/m2-K) and constant surrounding temperature of 60 °C. The solution was initialized with PCM initial interior temperatures set at 18 °C and a negligible flow velocity of 10−6 m/s. The side walls were considered adiabatic. The simulations were deemed to be converged once all scaled residual values became less than 10−6 for all solution parameters. The PCM used was CaCl2 · 6H2O, with thermophysical properties as detailed in Table 4.
The simulations were conducted for a total elapsed time of 150 min, the melting phase initiated after approximately 10 min of heating, and the PCM completely liquefied after 77 min. The results of this study shown in Figure 6 are in reasonable agreement with the experimental results of Fujii and Yano and the simulation results of Wang et al.
The liquid fraction values calculated during the PCM phase change process in the validation are shown in Figure 7. The liquid fraction at various time slots is depicted in each vertical block. The first block shows the melt state of the PCM, 8 min after the start of the heating, while the last block depicts the state of the PCM block as it attains a complete liquid phase close to 80 min after the start of the heating.
For further validation of the simulation model selected for this study, the authors undertook lab-scale experimental testing of commercially available PCM RT28HC integrating it with concrete. A dual set of 10 mm thick PCM RT28HC panels with a 450 mm × 300 mm cross-section was experimentally tested. The experimental conditions were then modeled using the simulation scheme selected by the authors for this study. The simulation results show good agreement with experimental data. The sample geometry details with temperature sensor locations (T1–T5) and schematic layout are given in Figure 8 below. The bottom of the sample was exposed to a hot plate, the top surface was cooled through ambient air convection, and all sides were insulated to incorporate adiabatic conditions on sidewalls.
The test comprised distinct heating and cooling phases over 24 h. A comparison of experimental results with CFD results is shown in Figure 9.
The PCM velocity profile due to gravitational effects in the melted phase is depicted in Figure 10. The velocity magnitudes are found to be negligible (of the order of 10−16 m/s). This establishes that no convective heat transfer occurs due to the flow of PCM, and the dominant mode of heat transfer remains conduction alone.
After validating the numerical scheme for this study, different configurations were modeled in Figure 11a–d. The configurations included:
(a)
A baseline case of pure brick (no PCM);
(b)
An EPS layer sandwiched between two layers of PCM A29;
(c)
An EPS layer sandwiched between two layers of PCM S13;
(d)
An EPS layer sandwiched between one layer of PCM A29 and one layer of PCM S13.

4. Results and Discussions

Detailed analysis was conducted for configurations with and without PCM to investigate their heat storage potential in different climatic conditions.

4.1. Thermal Analysis of Different Configurations

Time-dependent flow and heat transfer simulations were conducted for different configurations shown in Figure 11a–d. Figure 12 shows the temperature probe locations at distinct points in the geometry. T1 is the temperature at location 1, the input temperature profile (ambient), while T2 to T5 are internal temperatures, and T6 is the output (indoor) temperature. TPCM-A and TPCM-B are the temperatures of the PCM interiors located at positions A and B.
The whole geometry is modeled as a brick region (Figure 11a), with simulations conducted for June and January. Figure 13 and Figure 14 show the temperature distribution for these months, respectively. For June, the highest solar air temperature recorded in a day is 62.3 °C, while for January, the minimum temperature dips close to 1 °C. Moreover, the average temperatures for these months are 35 °C and 12.1 °C, respectively. In both cases, the indoor temperature distribution obtained shows the maximum temperatures of 26.3 °C in June and 23.1 °C in January.
Furthermore, average indoor temperatures are 22.8 °C and 18.6 °C, respectively, for these months. These indoor temperature fluctuations are directly related to the thermal mass or heat capacity of building materials that store heat before conducting to the lower temperature zone. From a thermal comfort point of view, it is desirable to achieve higher thermal mass to limit air-conditioning and heating loads and move toward green energy solutions [33].
The integration of PCMs within conventional wall configurations increases their thermal mass and reduces indoor temperatures. Experimental studies conducted by Sunliang et al. [34] found a temperature reduction of 2 °C while using the PCM-based wall when compared to a wall without PCM.

4.2. Thermal Analysis of PCM-Based Configuration

For seeing the effects of PCMs for both summer and winter months, simulations were carried out for the cases outlined in Figure 11. Temperature distributions and liquid fraction plots were used to analyze integrating PCM layers in brick walls for different weather conditions.
Figure 11b represents a design with 5 mm PCM thickness introduced in the base brick model on each side separated by the insulation layer of 10 mm. PCM A-29 was selected for analysis of thermal effects in summer. The temperature and liquid fraction are presented in Figure 15 and Figure 16, respectively. The indoor temperature remained lower than for the configuration without PCM, and the diurnal temperature variation was stable and, on some days, almost constant. This indicates the ability of PCM to store excessive heat in the daytime and release it at night when the average outdoor temperature remained close to 25 °C. The introduction of PCM layers kept the indoor temperatures stable at an average of 21.6 °C during June. The effectiveness of PCM is even more evident if temperature data are analyzed in conjunction with the liquid fractions shown in Figure 16.
The LF-A and LF-B are the liquid fractions of the PCM layers at position A and position B, respectively. Their distinct behavior is primarily due to their location in the wall, which can be characterized as front and rear end with reference to outdoor temperature loading. For the first 17 days, liquid fraction LF-A of the layer containing PCM A-29 shows continuous charging and discharging in line with daily outdoor temperature variation. At the same time, the LF-B representing the same PCM but positioned after the insulation remains discharged chiefly. The PCM A-29 layer at position B achieves partial phase change on days 13, 19, 20, and 25. The average indoor temperature for the period remained close to 21.6 °C. From the 12th day onward to day 27, the outdoor solar air temperature rises to above 60 °C on several days. During this period, the PCM layer does not discharge completely, while the PCM layer at position B starts to get partially charged on these hotter days. The charging of the PCM layer at position B allows the indoor temperature not to rise much above 23 °C, even when the PCM layer at position A does not get discharged overnight. The indoor temperature during the entire June thus remains stable at an average value of 21.6 °C. Even on days when the solar air temperature peaks above 60 °C, the tandem layers of the PCM can maintain excellent indoor thermal comfort. At the end of June, days 26–30, the indoor temperature was quite stable at 21 °C, attributed to the relatively lower thermal loads and phase change effect of selected materials. PCM A-29 average charged state depicted by LF-A and LF-B is 71% and 2%, respectively, during June. When both PCMs are charged, they have a considerable effect on the indoor temperature of the building envelope and can reduce energy consumption for cooling indoors to meet thermal comfort requirements. It can, therefore, be concluded that for summer season outdoor temperature loads, the choice of integrating PCM-A29 is suitable.
In configuration Figure 11c, PCM S-13 was used, and its layers were placed at position A (before) and position B (after) the insulation. Figure 17 and Figure 18 show that the outdoor January solar air temperature rises to 36.2 °C, with both PCM layers remaining charged for a longer duration due to their low melting temperature (13 °C). The outdoor temperature profiles in Figure 17 indicate three distinct regions of almost constant temperature profiles from day 3 to 16, 17 to 21, and 24 to 30. In contrast, to complete brick configuration, the configuration with PCM, under the same thermal loading, shows higher indoor temperatures, indicating better thermal comfort. From a thermal comfort standpoint, this 2 °C difference induced by employing PCM is significant to reduce the heating load for the building occupants. The liquid fractions LF-A and LF-B in Figure 18 show the PCM charged and discharged state for January. The PCM at position A, being exposed to outdoor thermal loading, first exhibits more significant daily fluctuations for the liquid fraction than LF-B, which remains charged throughout the month in response to outdoor diurnal temperature variation. PCM S-13’s average liquid fraction LF-A and LF-B is 58% and 100%, respectively, in contrast to summer PCM A-29 due to its low melting temperature. Solid–liquid phase change for these PCMs is in line with the outdoor temperature loading of January, and PCM S-13 was found to be suitable for temperature loading in winter.
Figure 11d illustrates the novel dual PCM-based configuration with PCM-A29 and PCM S-13 positioned before and after the insulation layer, respectively. The indoor temperature (T6) for both summer (June) and winter (January) months are presented in Figure 19 and Figure 20, respectively, whereas PCM A29-A29, PCM S-13-S13, and PCM A29-S13 are referred to as AA, BB, and AB, respectively.
The results show that AB configuration outperforms both AA and BB configurations. During June (summer), the AB configuration keeps the indoor temperature at an average value of 20.7 °C. The AB configuration also maintains a very stable indoor temperature with a variation of ±0.4 °C. While the configuration AA maintained an average indoor temperature of 21.6 °C, with a varied range of +1.5 °C and −1.0 °C during June.
During January (winter), the AB configuration again performs better than both configurations AA and BB. During January (winter), the AB configuration keeps the indoor temperature at an average value of 19.7 °C. In winter, the AB configuration also maintains a very stable indoor temperature, with a variation of only ±0.4 °C. Meanwhile, the configuration BB maintained an average indoor temperature of 19.2 °C, with a varied range of +3.9 °C and −1.0 °C during January.
Thus, the AB configuration keeps cooler indoor temperatures in summer during the daytime and a warmer night indoor temperature in winter. Hence, it maintains excellent thermal comfort in both summer and winter. Therefore, single PCM configurations provide energy savings during summer only (AA) or winter only (BB). The AB configuration provides higher energy conservation in summer as well as in winter, compared to the single PCM applications.

5. Conclusions

The effectiveness of dual PCM application to increase the thermal mass of construction materials was investigated using numerical modeling techniques using Fluent software. Based on the current study, the following conclusions are presented:
  • The suitability of PCM is based primarily on its phase change temperature and associated heat of fusion.
  • The most suitable configuration for both summer and winter is the dual PCM configuration.
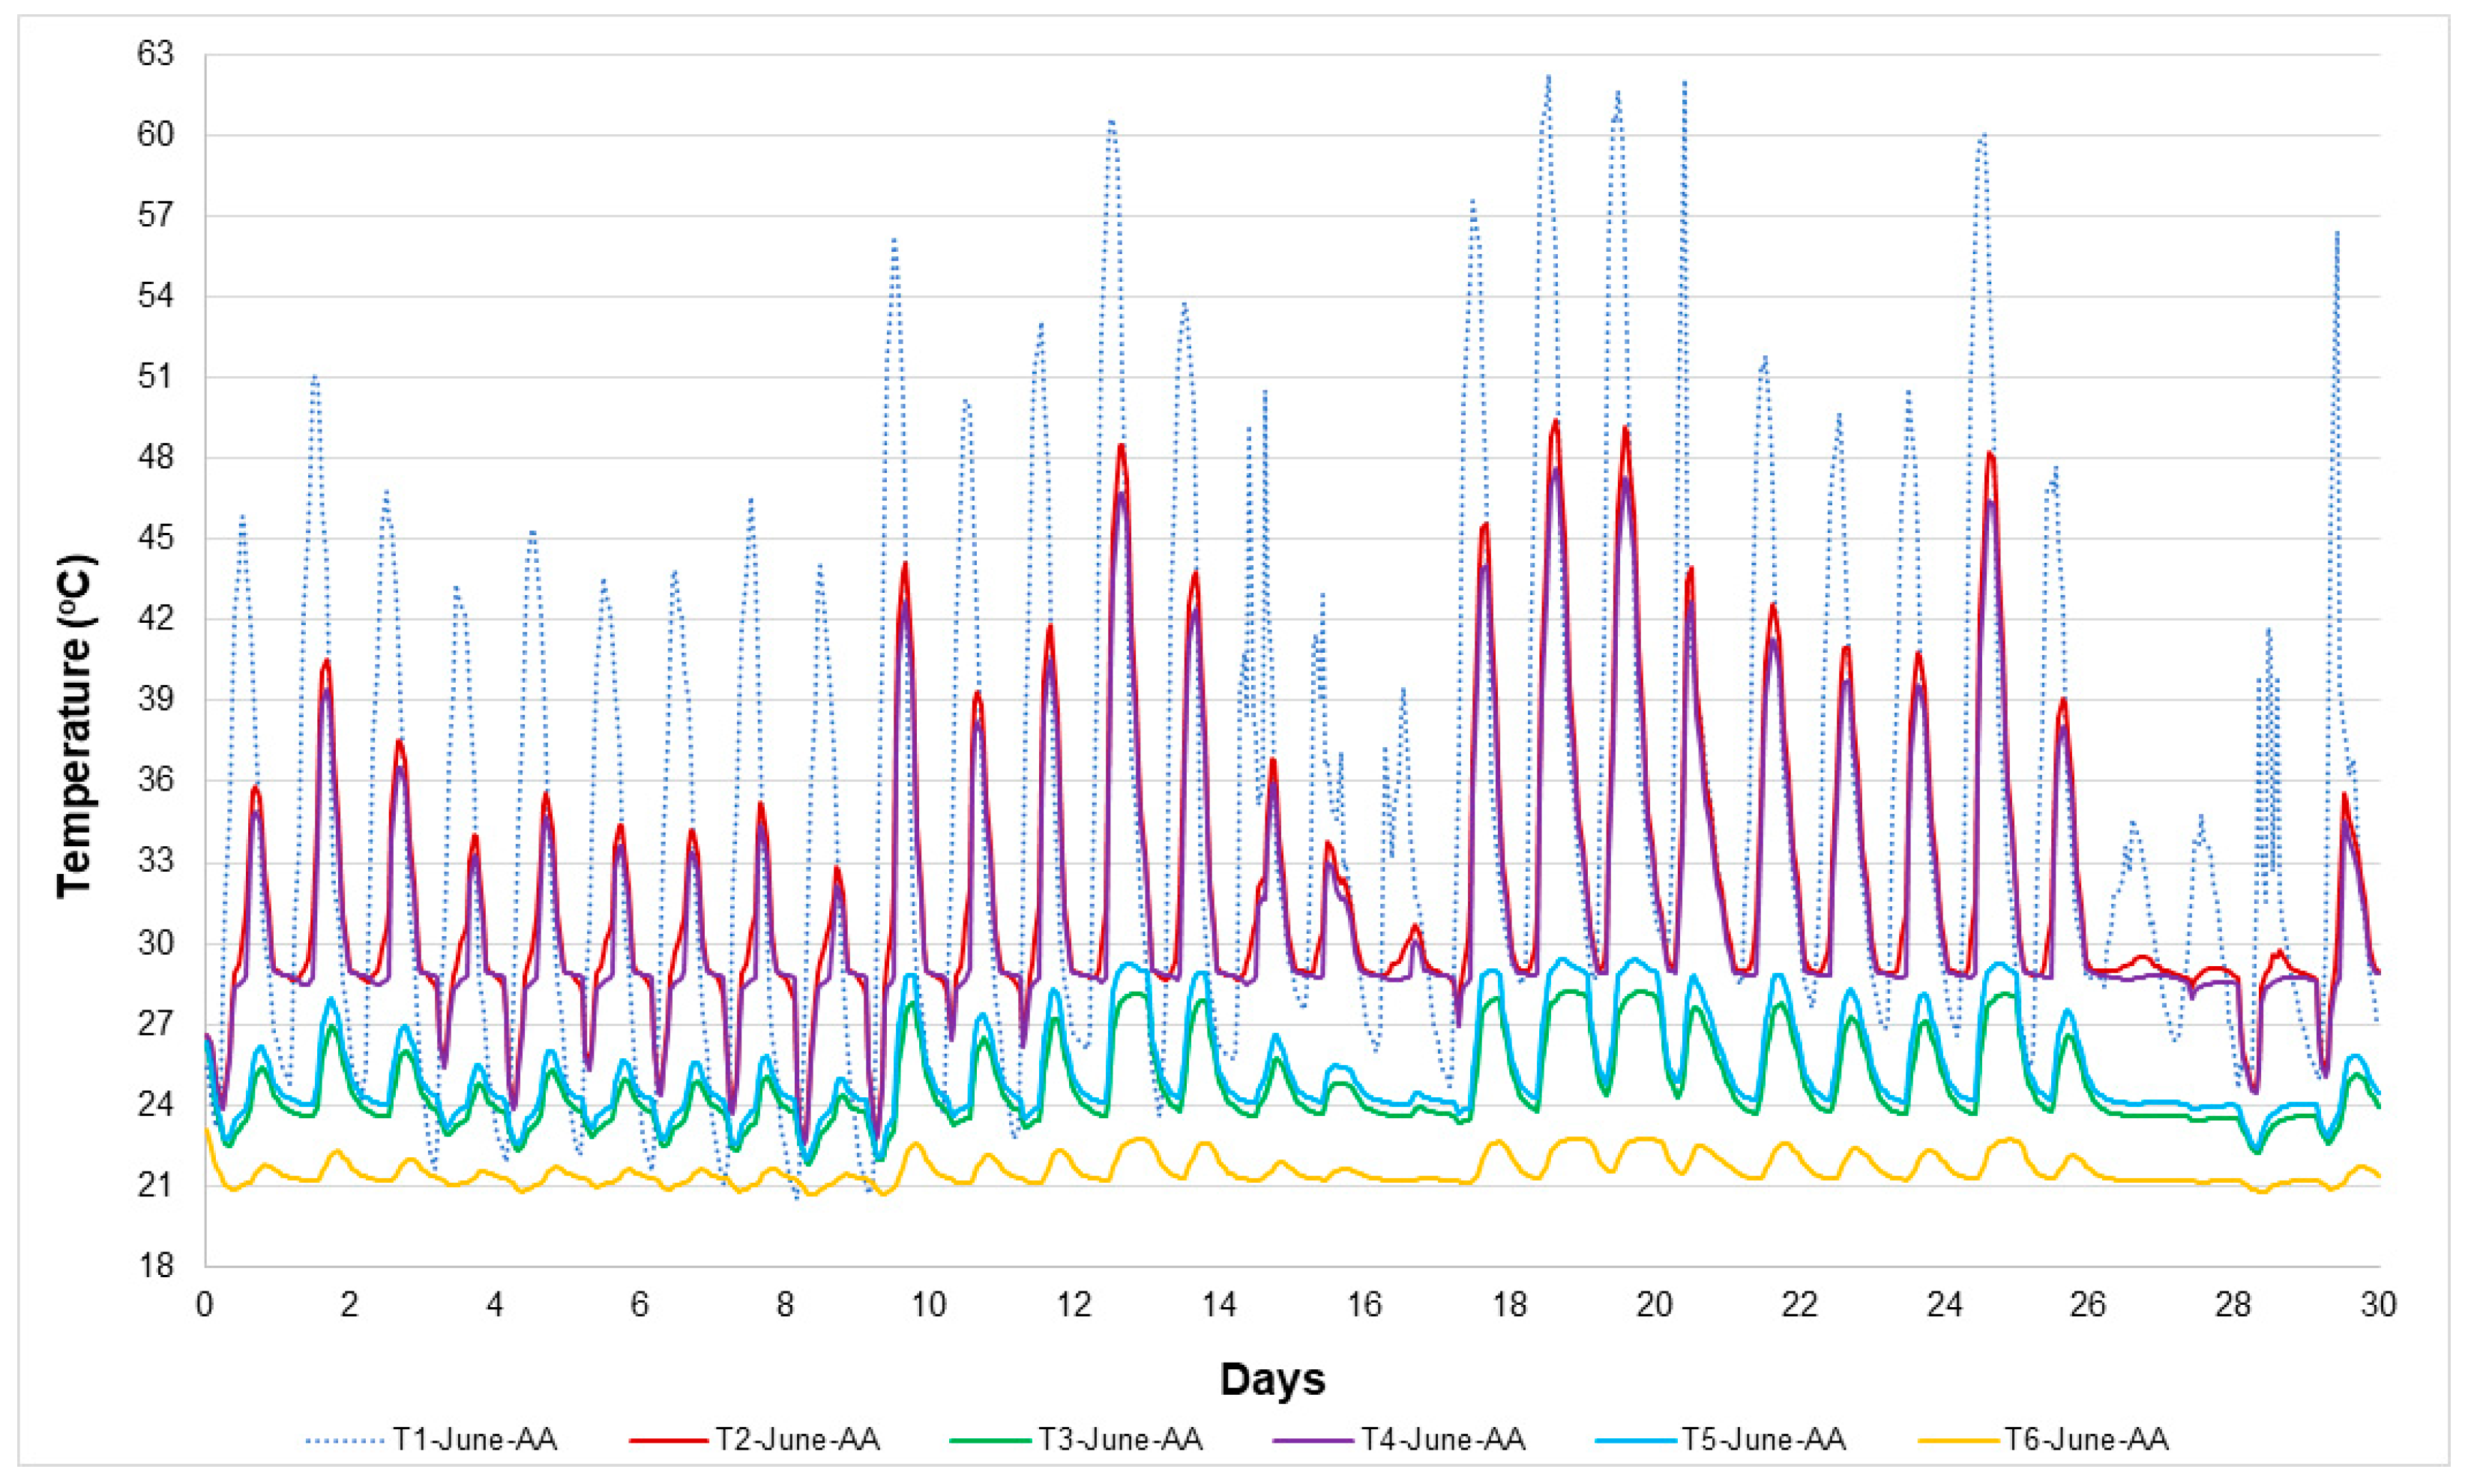
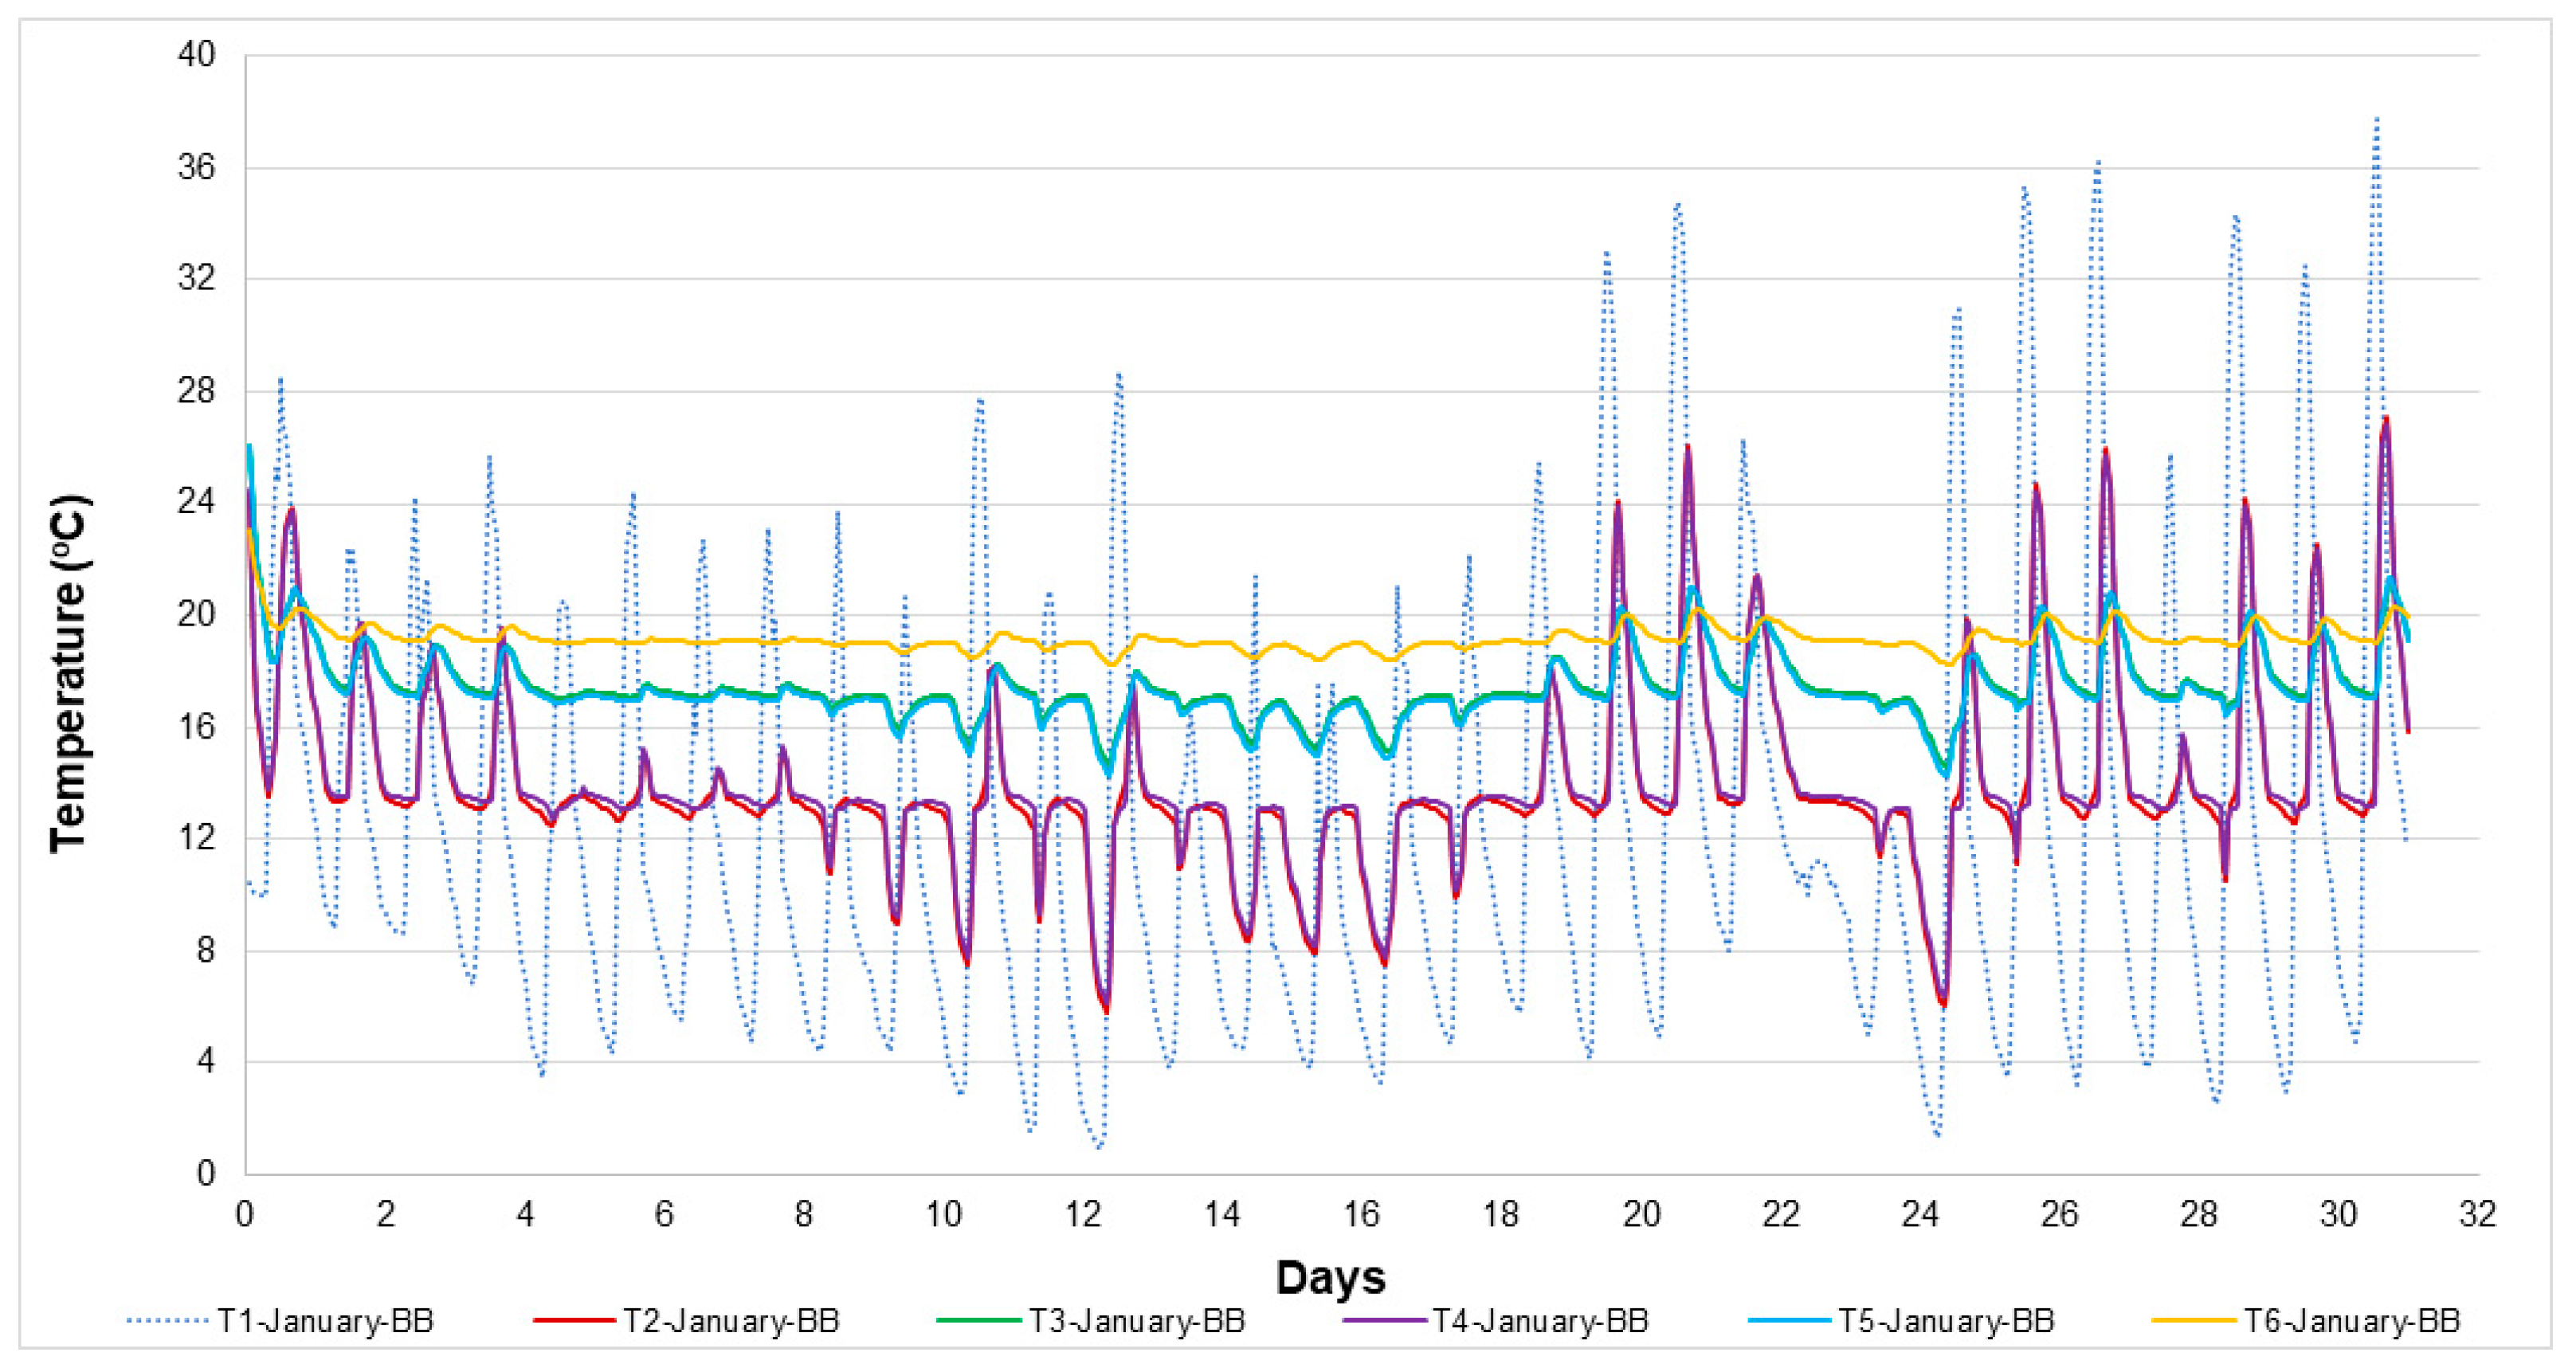
  • Average indoor temperatures with and without PCMs for June are 21.6 °C and 35 °C, while for January are 20.7 °C and 12.1 °C, respectively.
  • Melt fraction for June with two PCM A29 layers is 71% and 2%, and for January, the melt fraction of the two PCM S13 layers is 58% and 100%.
  • One of the main concerns in the application of PCMs has been the efficacy of PCMs over more extended periods as the improper application may restrict the charging–discharging of the PCMs after a few repeated cycles.
  • The current study results establish consistent charging and discharging of at least one of the applied PCM layers over a longer timeframe (one month period) both in summer and winter in the selected PCM configurations.
  • Continuous charging–discharging is established as one of the main reasons for the dual PCM application performing better around the year.
  • The dual PCM configuration with PCM A-29 at position A and PCM S-13 at position B consistently provides better thermal comfort during both summer and winter seasons. The dual PCM configuration maintains a very stable indoor temperature range of ±0.4 °C in both seasons.
  • Therefore, in light of the above, the novel dual configuration is more viable as the heating and cooling requirements change throughout the year based on the different weather conditions. Single PCM deployment fails to cater to winter and summer seasons, especially in regions such as Islamabad, where the solar air temperature during the year can vary from highs above 60 °C to lows close to 0 °C. However, the dual PCM deployment provides substantial energy savings throughout the year, as it caters to both high- and low-temperature ranges.
  • Islamabad has more cooling degree days (CDDs) than heating degree days (HDDs); thus, placing PCM A29 on the outdoor side and PCM S13 on the indoor degree side is recommended for this application.
  • In the future, different thicknesses and locations of PCMs may be investigated to enhance the parametric analysis based on the unique concept of hybrid PCMs. It is also recommended that experimental testing of dual PCM configurations be carried out. The authors feel that a knowledge gap exists in long-duration 3D simulations and ventilation condition simulations using CFD tools.

Author Contributions

Conceptualization, S.R.S. and A.U.R.; methodology, S.R.S., S.J.M. and A.U.R.; software, S.R.S. and A.U.R.; validation, S.R.S., S.J.M. and A.U.R.; formal analysis, S.R.S. and Z.K.; investigation, S.R.S. and A.U.R.; resources, S.R.S. and Z.K.; data curation, A.U.R.; writing—original draft preparation, S.R.S. and A.U.R.; writing—review and editing, S.J.M. and Z.K.; visualization, S.R.S. and A.U.R.; supervision, S.R.S., S.J.M. and Z.K.; project administration, S.R.S., S.J.M. and Z.K. All authors have read and agreed to the published version of the manuscript.

Funding

This research received no external funding.

Institutional Review Board Statement

Not applicable.

Informed Consent Statement

Not applicable.

Data Availability Statement

Not applicable.

Acknowledgments

The authors would like to acknowledge the support provided by Department of Mechatronics and Biomedical Engineering, Air University Islamabad and the Technical Staff in the Department of Civil, Structural and Environmental Engineering, Trinity College Dublin which facilitated the completion of this research work even during the COVID-19 crisis as well as insights from the H2020 IDEAS project (815271).

Conflicts of Interest

The authors declare no conflict of interest.

Nomenclature

PCMphase change material
TESthermal energy storage
CO2carbon dioxide
CFDcomputational fluid dynamics
EPSexpanded polystyrene
ρ density (kg/m3)
c p specific heat capacity (J/kg-K)
k thermal conductivity (W/m-K)
T temperature (°C)
H PCM enthalpy (J/kg)
h sensible enthalpy (J/kg)
Δ H latent heat (J/kg)
h r e f PCM enthalpy (J/kg) at reference temperature
T r e f reference temperature (°C)
β liquid fraction
L latent heat of PCM (J/kg)
SIMPLEsemi-implicit method
1Done-dimensional
2Dtwo-dimensional
CaCl2 · 6H2Ocalcium chloride hexahydrate
minsminutes
LFliquid fraction
CDDcooling degree days
HDDheating degree days

References

  1. IEA; UNEP. 2019 Global Status Report for Buildings and Construction; Global Alliance for Buildings and Construction: Paris, France, 2019; Volume 224, ISBN 9789280737684. [Google Scholar]
  2. Cabeza, L.F.; Castellón, C.; Nogués, M.; Medrano, M.; Leppers, R.; Zubillaga, O. Use of Microencapsulated PCM in Concrete Walls for Energy Savings. Energy Build. 2007, 39, 113–119. [Google Scholar] [CrossRef]
  3. Hasan, A.; McCormack, S.J.; Huang, M.J.; Norton, B. Evaluation of Phase Change Materials for Thermal Regulation Enhancement of Building Integrated Photovoltaics. Sol. Energy 2010, 84, 1601–1612. [Google Scholar] [CrossRef] [Green Version]
  4. Nada, S.A.; Alshaer, W.G.; Saleh, R.M. Experimental Investigation of PCM Transient Performance in Free Cooling of the Fresh Air of Air Conditioning Systems. J. Build. Eng. 2020, 29, 101153. [Google Scholar] [CrossRef]
  5. Ürge-Vorsatz, D.; Cabeza, L.F.; Serrano, S.; Barreneche, C.; Petrichenko, K. Heating and Cooling Energy Trends and Drivers in Buildings. Renew. Sustain. Energy Rev. 2015, 41, 85–98. [Google Scholar] [CrossRef] [Green Version]
  6. Castell, A.; Martorell, I.; Medrano, M.; Pérez, G.; Cabeza, L.F. Experimental Study of Using PCM in Brick Constructive Solutions for Passive Cooling. Energy Build. 2010, 42, 534–540. [Google Scholar] [CrossRef]
  7. De Gracia, A.; Oró, E.; Farid, M.M.; Cabeza, L.F. Thermal Analysis of Including Phase Change Material in a Domestic Hot Water Cylinder. Appl. Therm. Eng. 2011, 31, 3938–3945. [Google Scholar] [CrossRef] [Green Version]
  8. Hamada, Y.; Fukai, J. Latent Heat Thermal Energy Storage Tanks for Space Heating of Buildings: Comparison between Calculations and Experiments. Energy Convers. Manag. 2005, 46, 3221–3235. [Google Scholar] [CrossRef]
  9. Silva, T.; Vicente, R.; Soares, N.; Ferreira, V. Experimental Testing and Numerical Modelling of Masonry Wall Solution with PCM Incorporation: A Passive Construction Solution. Energy Build. 2012, 49, 235–245. [Google Scholar] [CrossRef]
  10. Saffari, M.; de Gracia, A.; Ushak, S.; Cabeza, L.F. Economic Impact of Integrating PCM as Passive System in Buildings Using Fanger Comfort Model. Energy Build. 2016, 112, 159–172. [Google Scholar] [CrossRef] [Green Version]
  11. Kalnæs, S.E.; Jelle, B.P. Phase Change Materials and Products for Building Applications: A State-of-the-Art Review and Future Research Opportunities. Energy Build. 2015, 94, 150–176. [Google Scholar] [CrossRef] [Green Version]
  12. Zsembinszki, G.; Fernández, A.G.; Cabeza, L.F. Selection of the Appropriate Phase Change Material for Two Innovative Compact Energy Storage Systems in Residential Buildings. Appl. Sci. 2020, 10, 2116. [Google Scholar] [CrossRef] [Green Version]
  13. Hasan, A.; McCormack, S.J.; Huang, M.J.; Norton, B. Characterization of Phase Change Materials for Thermal Control of Photovoltaics Using Differential Scanning Calorimetry and Temperature History Method. Energy Convers. Manag. 2014, 81, 322–329. [Google Scholar] [CrossRef]
  14. Cabeza, L.F.; Castell, A.; Barreneche, C.; de Gracia, A.; Fernández, A.I. Materials Used as PCM in Thermal Energy Storage in Buildings: A Review. Renew. Sustain. Energy Rev. 2011, 15, 1675–1695. [Google Scholar] [CrossRef]
  15. Al-Yasiri, Q.; Szabó, M. Incorporation of Phase Change Materials into Building Envelope for Thermal Comfort and Energy Saving: A Comprehensive Analysis. J. Build. Eng. 2021, 36, 102122. [Google Scholar] [CrossRef]
  16. Louanate, A.; Otmani, R.E.; Kandoussi, K.; Boutaous, M. Dynamic Modeling and Performance Assessment of Single and Double Phase Change Material Layer–Integrated Buildings in Mediterranean Climate Zone. J. Build. Phys. 2021, 44, 461–478. [Google Scholar] [CrossRef]
  17. Arıcı, M.; Bilgin, F.; Nižetić, S.; Karabay, H. PCM Integrated to External Building Walls: An Optimization Study on Maximum Activation of Latent Heat. Appl. Therm. Eng. 2020, 165, 114560. [Google Scholar] [CrossRef]
  18. Frazzica, A.; Brancato, V.; Palomba, V.; la Rosa, D.; Grungo, F.; Calabrese, L.; Proverbio, E. Thermal Performance of Hybrid Cement Mortar-PCMs for Warm Climates Application. Sol. Energy Mater. Sol. Cells 2019, 193, 270–280. [Google Scholar] [CrossRef]
  19. Ye, R.; Huang, R.; Fang, X.; Zhang, Z. Simulative Optimization on Energy Saving Performance of Phase Change Panels with Different Phase Transition Temperatures. Sustain. Cities Soc. 2020, 52, 101833. [Google Scholar] [CrossRef]
  20. Zhu, L.; Yang, Y.; Chen, S.; Sun, Y. Numerical Study on the Thermal Performance of Lightweight Temporary Building Integrated with Phase Change Materials. Appl. Therm. Eng. 2018, 138, 35–47. [Google Scholar] [CrossRef]
  21. Meng, X.; Liu, S.; Zou, J.; Liu, F.; Wang, J. Inclination Angles on the Thermal Behavior of Phase-Change Material (PCM) in a Cavity Filled with Copper Foam Partly. Case Stud. Therm. Eng. 2021, 25, 100944. [Google Scholar] [CrossRef]
  22. Rostami, J. Convective Heat Transfer by Micro-Encapsulated PCM in a Mini-Duct. Int. J. Therm. Sci. 2021, 161, 106737. [Google Scholar] [CrossRef]
  23. Navarro, L.; de Gracia, A.; Niall, D.; Castell, A.; Browne, M.; McCormack, S.J.; Griffiths, P.; Cabeza, L.F. Thermal Energy Storage in Building Integrated Thermal Systems: A Review. Part 2. Integration as Passive System. Renew. Energy 2016, 85, 1334–1356. [Google Scholar] [CrossRef] [Green Version]
  24. Lodi, S.H.; Sangi, A.J.; Abdullah, A. Housing Report Brick Masonry Construction in Pakistan; World Housing Encyclopedia, 2013; Available online: http://www.world-housing.net/wp-content/uploads/2013/12/WHE-report173_letter.pdf (accessed on 3 July 2021).
  25. Kant, K.; Shukla, A.; Sharma, A. Heat Transfer Studies of Building Brick Containing Phase Change Materials. Sol. Energy 2017, 155, 1233–1242. [Google Scholar] [CrossRef]
  26. PCM Products Ltd. PlusICE® PCM. Available online: https://www.pcmproducts.net/files/PlusICE Range 2021-1.pdf (accessed on 3 July 2021).
  27. Wang, Q.; Wu, R.; Wu, Y.; Zhao, C.Y. Parametric Analysis of Using PCM Walls for Heating Loads Reduction. Energy Build. 2018, 172, 328–336. [Google Scholar] [CrossRef]
  28. Kosky, P.; Balmer, R.; Keat, W.; Wise, G. Exploring Engineering, 5th ed.; An Introduction to Engineering and Design; Academic Press: Cambridge, MA, USA, 2020; ISBN 9780128150740. [Google Scholar]
  29. Fluent, A. Ansys Fluent Theory Guide; ANSYS Inc.: Canonsburg, PA, USA, 2013; Volume 15317, pp. 724–746. [Google Scholar]
  30. Fujii, I.; Yano, N. A consideration on phase change behavior of latent heat storage material. In Proceedings of the Society of Heating, Air-Conditioning and Sanitary Engineers of Japan, 1996. (In Japanese). [Google Scholar]
  31. Alawadhi, E.M. Thermal Analysis of Transient Laminar Flow Past an In-Line Cylinders Array Containing Phase Change Material. Proc. Inst. Mech. Eng. Part A J. Power Energy 2009, 223, 349–360. [Google Scholar] [CrossRef]
  32. Ravi, G.; Alvarado, J.L.; Marsh, C.; Kessler, D.A. Laminar Flow Forced Convection Heat Transfer Behavior of a Phase Change Material Fluid in Finned Tubes. Numer. Heat Transf. A Appl. 2009, 55, 721–738. [Google Scholar] [CrossRef]
  33. Sharaf, F. The Impact of Thermal Mass on Building Energy Consumption: A Case Study in Al Mafraq City in Jordan. Cogent Eng. 2020, 7, 1804092. [Google Scholar] [CrossRef]
  34. Cao, S.; Gustavsen, A.; Uvsløkk, S.; Jelle, B. The Effect of Wall-Integrated Phase Change Material Panels on the Indoor Air and Wall Temperature–Hot-box Experiments. In Proceedings of the Renewable Energy Conference, Trondheim, Norway, 7–8 June 2010. [Google Scholar]
Figure 1. Brick wall with PCM location and insulation EPS.
Energies 14 04032 g001
Figure 2. Temperature data for Islamabad for months of June and January.
Energies 14 04032 g002
Figure 3. Solar radiation intensity data for Islamabad for months of June and January.
Energies 14 04032 g003
Figure 4. Solar air temperature for months of June and January.
Energies 14 04032 g004
Figure 5. Geometry used for validation study [30].
Energies 14 04032 g005
Figure 6. Validation results—simulation vs. experimental.
Energies 14 04032 g006
Figure 7. Liquid fraction development versus time.
Energies 14 04032 g007
Figure 8. Schematic diagram of temperature sensor locations and experiment layout.
Energies 14 04032 g008
Figure 9. Experimental vs. simulation temperature profiles with different heat transfer coefficients ranging from 5 W/m2K to 25 W/m2K.
Energies 14 04032 g009
Figure 10. Velocity profiles at different locations within PCM.
Energies 14 04032 g010
Figure 11. Representation of scheme of modeling from (ad).
Energies 14 04032 g011
Figure 12. Temperature probes (T1–T6, TPCM-A, TPCM-B) at different zones for all configurations.
Energies 14 04032 g012
Figure 13. Temperature distribution for the month of June (baseline case—no PCM). Case (a).
Energies 14 04032 g013
Figure 14. Temperature distribution for the month of January (baseline case—no PCM). Case (a).
Energies 14 04032 g014
Figure 15. Temperature distribution for the month of June (PCM A29-A29). Case (b).
Energies 14 04032 g015
Figure 16. Liquid fraction for the month of June (PCM A29-A29). Case (b).
Energies 14 04032 g016
Figure 17. Temperature distribution for the month of January (PCM S13-S13). Case (c).
Energies 14 04032 g017
Figure 18. Liquid fraction for the month of January (PCM S13-S13). Case (c).
Energies 14 04032 g018
Figure 19. Comparison of indoor temperature for the month of June (PCM A29-A29, PCM S13-S13, PCM A29-S13). Case (d).
Energies 14 04032 g019
Figure 20. Comparison of indoor temperature for the month of January (PCM A29-A29, PCM S13-S13, PCM A29-S13). Case (d).
Energies 14 04032 g020
Table 1. Thermophysical properties of materials used in the simulation.
MaterialDensity (kg/m3)Heat Capacity (J/kg.K)Thermal Conductivity (W/m-K)Melting Temperature (°C)Heat of Fusion (kJ/kg)
Brick16008400.7----
EPS2213000.036----
PCM A-2981022200.1829225
PCM S-13151519000.4313150
Table 2. Data for mesh independence based on value of T6 (indoor temperature).
Mesh Size (Nodes)Average T6 (°C)
49,99229.078
18,59729.076
799229.078
Table 3. Data for time independence based on value of T6 (indoor temperature).
Time Step (Seconds)Average T6 (°C)
121.5375
6021.5392
12021.5441
Table 4. Thermophysical properties of CaCl2 · 6H2O.
Density (kg/m3)Specific Heat (J/kg−K)Thermal Conductivity (W/m−K)Viscosity (kg/m−s)Pure Solvent Melting Heat (J/kg)Solidus Temperature (K)Liquidus Temperature (K)
171014001.090.00785187,000302302.9
Publisher’s Note: MDPI stays neutral with regard to jurisdictional claims in published maps and institutional affiliations.

