
Thermogravimetric and Kinetic Analysis of High-Temperature Thermal Conversion of Pine Wood Sawdust under CO2/Ar

 ,
,
Abstract
:
1. Introduction
2. Materials and Methods
2.1. Materials
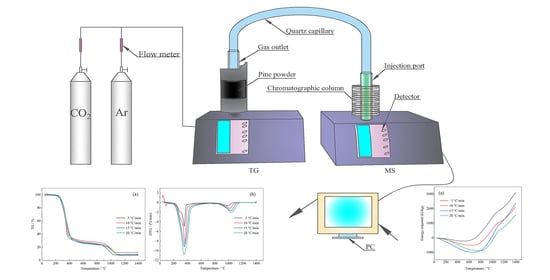
2.2. TGA-MS
2.3. Kinetic Analysis
2.4. Determination of Mechanism Function
3. Results and Discussion
3.1. Effects of the Heating Rate on Gasification of Pine Wood Sawdust
3.2. Analysis of Gaseous Products
3.3. Estimation of Activation Energy by Iso-Conversional Models
3.4. Determination of Mechanism Function and Pre-Exponential Factor
3.4.1. Determination of Mechanism Function
3.4.2. Determination of Pre-Exponential Factor
3.5. Energy Required for the Gasification
4. Conclusions
Author Contributions
Funding
Institutional Review Board Statement
Informed Consent Statement
Data Availability Statement
Conflicts of Interest
References
- Ghodake, G.S.; Shinde, S.K.; Kadam, A.A.; Saratale, R.G.; Saratale, G.D.; Kumar, M.; Palem, R.R.; Al-Shwaiman, H.A.; Elgorban, A.M.; Syed, A.; et al. Review on biomass feedstocks, pyrolysis mechanism and physicochemical properties of biochar: State-of-the-art framework to speed up vision of circular bioeconomy. J. Clean. Prod. 2021, 297, 126645. [Google Scholar] [CrossRef]
- Brown, R. Biochar production technology. In Biochar for Environmental Management; Routledge: London, UK, 2012; pp. 159–178. [Google Scholar]
- Erol, M.; Haykiri-Acma, H.; Küçükbayrak, S. Calorific value estimation of biomass from their proximate analyses data. Renew. Energy 2010, 35, 170–173. [Google Scholar] [CrossRef]
- Chen, W.-H.; Lin, B.-J.; Huang, M.-Y.; Chang, J.-S. Thermochemical conversion of microalgal biomass into biofuels: A review. Bioresour. Technol. 2015, 184, 314–327. [Google Scholar] [CrossRef] [PubMed]
- Di Blasi, C. Modeling chemical and physical processes of wood and biomass pyrolysis. Prog. Energy Combust. Sci. 2008, 34, 47–90. [Google Scholar] [CrossRef]
- Yassin, L.; Lettieri, P.; Simons, S.J.; Germanà, A. Techno-economic performance of energy-from-waste fluidized bed combustion and gasification processes in the UK context. Chem. Eng. J. 2009, 146, 315–327. [Google Scholar] [CrossRef]
- Gao, N.; Śliz, M.; Quan, C.; Bieniek, A.; Magdziarz, A. Biomass CO2 gasification with CaO looping for syngas production in a fixed-bed reactor. Renew. Energy 2021, 167, 652–661. [Google Scholar] [CrossRef]
- Sansaniwal, S.K.; Rosen, M.A.; Tyagi, S.K. Global challenges in the sustainable development of biomass gasification: An overview. Renew. Sustain. Energy Rev. 2017, 80, 23–43. [Google Scholar] [CrossRef]
- Kandasamy, J.; Gökalp, I. Pyrolysis, combustion, and steam gasification of various types of scrap tires for energy recovery. Energy Fuels 2014, 29, 346–354. [Google Scholar] [CrossRef]
- Benedetti, V.; Patuzzi, F.; Baratieri, M. Characterization of char from biomass gasification and its similarities with activated carbon in adsorption applications. Appl. Energy 2018, 227, 92–99. [Google Scholar] [CrossRef]
- Lv, P.; Xiong, Z.; Chang, J.; Wu, C.; Chen, Y.; Zhu, J. An experimental study on biomass air–steam gasification in a fluidized bed. Bioresour. Technol. 2004, 95, 95–101. [Google Scholar] [CrossRef]
- Van Huynh, C.; Kong, S.-C. Performance characteristics of a pilot-scale biomass gasifier using oxygen-enriched air and steam. Fuel 2013, 103, 987–996. [Google Scholar] [CrossRef]
- Donatelli, A.; Iovane, P.; Molino, A. High energy syngas production by waste tyres steam gasification in a rotary kiln pilot plant. Experimental and numerical investigations. Fuel 2010, 89, 2721–2728. [Google Scholar] [CrossRef]
- Wang, D.; Du, C.; Feng, D.; Li, Y.; Zhang, Y.; Zhao, Y.; Zhao, G. The thermal swelling properties of plant chemical alcohol waste liquid. Energies 2019, 12, 4184. [Google Scholar] [CrossRef] [Green Version]
- Lundgren, J.; Ekbom, T.; Hulteberg, C.; Larsson, M.; Grip, C.-E.; Nilsson, L.; Tunå, P. Methanol production from steel-work off-gases and biomass based synthesis gas. Appl. Energy 2013, 112, 431–439. [Google Scholar] [CrossRef] [Green Version]
- Kim, Y.-D.; Yang, C.-W.; Kim, B.-J.; Moon, J.-H.; Jeong, J.-Y.; Jeong, S.-H.; Lee, S.-H.; Kim, J.-H.; Seo, M.-W.; Lee, S.-B. Fischer–tropsch diesel production and evaluation as alternative automotive fuel in pilot-scale integrated biomass-to-liquid process. Appl. Energy 2016, 180, 301–312. [Google Scholar] [CrossRef]
- Kraussler, M.; Binder, M.; Schindler, P.; Hofbauer, H. Hydrogen production within a polygeneration concept based on dual fluidized bed biomass steam gasification. Biomass Bioenergy 2018, 111, 320–329. [Google Scholar] [CrossRef]
- Baluk, P.; Fuxe, J.; Hashizume, H.; Romano, T.; Lashnits, E.; Butz, S.; Vestweber, D.; Corada, M.; Molendini, C.; Dejana, E. Functionally specialized junctions between endothelial cells of lymphatic vessels. J. Exp. Med. 2007, 204, 2349–2362. [Google Scholar] [CrossRef] [PubMed]
- Kim, Y.D.; Yang, C.W.; Kim, B.J.; Kim, K.S.; Lee, J.W.; Moon, J.H.; Yang, W.; Tae, U.Y.; Do Lee, U. Air-blown gasification of woody biomass in a bubbling fluidized bed gasifier. Appl. Energy 2013, 112, 414–420. [Google Scholar] [CrossRef]
- Zhou, J.; Chen, Q.; Zhao, H.; Cao, X.; Mei, Q.; Luo, Z.; Cen, K. Biomass-oxygen gasification in a high-temperature entrained-flow gasifier. Biotechnol. Adv. 2009, 27, 606–611. [Google Scholar] [CrossRef]
- Umeki, K.; Yamamoto, K.; Namioka, T.; Yoshikawa, K. High temperature steam-only gasification of woody biomass. Appl. Energy 2010, 87, 791–798. [Google Scholar] [CrossRef]
- Nagy, G.; Dobó, Z. Experimental investigation of fixed-bed pyrolysis and steam gasification of food waste blended with woody biomass. Biomass Bioenergy 2020, 139, 105580. [Google Scholar] [CrossRef]
- Cao, Y.; Bai, Y.; Du, J. Air-steam gasification of biomass based on a multi-composition multi-step kinetic model: A clean strategy for hydrogen-enriched syngas production. Sci. Total Environ. 2021, 753, 141690. [Google Scholar] [CrossRef] [PubMed]
- Huang, Z.; Zhang, Y.; Fu, J.; Yu, L.; Chen, M.; Liu, S.; He, F.; Chen, D.; Wei, G.; Zhao, K. Chemical looping gasification of biomass char using iron ore as an oxygen carrier. Int. J. Hydrog. Energy 2016, 41, 17871–17883. [Google Scholar] [CrossRef]
- Xie, J.; Zhou, J.; Zhang, H.; Liu, Z.; Tao, X.; Wang, B.; Jiang, X.; Ni, H. Utilization of waste heat gas in a converter flue for CO generation by coal injection. Energy Fuels 2017, 31, 12407–12416. [Google Scholar] [CrossRef]
- Zhou, J.-a.; Jiang, X.-k.; Xie, J.-b.; Zhang, H.; Li, L.; Wang, B.; Ni, H.-w. Thermodynamic analysis of improvement of converter gas by injecting pulverized coal into vaporization cooling flue. J. Iron Steel Res. Int. 2018, 25, 65–71. [Google Scholar] [CrossRef]
- Zhou, J.; Qi, D.; Li, X. One Safe and Efficient Recovery Method for Converter Gas. Patent of China ZL201010151908.4, 17 August 2011. [Google Scholar]
- Skodras, G.; Grammelis, P.; Basinas, P. Pyrolysis and combustion behaviour of coal–MBM blends. Bioresour. Technol. 2007, 98, 1–8. [Google Scholar] [CrossRef] [PubMed]
- Wang, C.; Wang, F.; Yang, Q.; Liang, R. Thermogravimetric studies of the behavior of wheat straw with added coal during combustion. Biomass Bioenergy 2009, 33, 50–56. [Google Scholar] [CrossRef]
- Wang, X.; Hu, M.; Hu, W.; Chen, Z.; Liu, S.; Hu, Z.; Xiao, B. Thermogravimetric kinetic study of agricultural residue biomass pyrolysis based on combined kinetics. Bioresour. Technol. 2016, 219, 510–520. [Google Scholar] [CrossRef] [PubMed]
- Damartzis, T.; Vamvuka, D.; Sfakiotakis, S.; Zabaniotou, A. Thermal degradation studies and kinetic modeling of cardoon (cynara cardunculus) pyrolysis using thermogravimetric analysis (TGA). Bioresour. Technol. 2011, 102, 6230–6238. [Google Scholar] [CrossRef]
- Nakanishi, M.; Ogi, T.; Fukuda, Y. Thermogravimetric analysis in steam and oxygen with gas chromatograph mass spectrometry for basic study of biomass gasification. J. Therm. Anal. Calorim. 2010, 101, 391–396. [Google Scholar] [CrossRef]
- Haykiri-Acma, H.; Yaman, S.; Kucukbayrak, S. Gasification of biomass chars in steam–nitrogen mixture. Energy Convers. Manag. 2006, 47, 1004–1013. [Google Scholar] [CrossRef]
- Cheng, G.; He, P.-W.; Xiao, B.; Hu, Z.-Q.; Liu, S.-M.; Zhang, L.-G.; Cai, L. Gasification of biomass micron fuel with oxygen-enriched air: Thermogravimetric analysis and gasification in a cyclone furnace. Energy 2012, 43, 329–333. [Google Scholar] [CrossRef]
- Figueira, C.E.; Moreira Jr, P.F.; Giudici, R. Thermogravimetric analysis of the gasification of microalgae chlorella vulgaris. Bioresour. Technol. 2015, 198, 717–724. [Google Scholar] [CrossRef] [PubMed]
- Huang, J.; Zhang, J.; Liu, J.; Xie, W.; Kuo, J.; Chang, K.; Buyukada, M.; Evrendilek, F.; Sun, S. Thermal conversion behaviors and products of spent mushroom substrate in CO2 and N2 atmospheres: Kinetic, thermodynamic, TG and Py-GC/MS analyses. J. Anal. Appl. Pyrolysis 2019, 139, 177–186. [Google Scholar] [CrossRef]
- Vyazovkin, S.; Burnham, A.K.; Criado, J.M.; Pérez-Maqueda, L.A.; Popescu, C.; Sbirrazzuoli, N. Ictac kinetics committee recommendations for performing kinetic computations on thermal analysis data. Thermochim. Acta 2011, 520, 1–19. [Google Scholar] [CrossRef]
- Šimon, P. Isoconversional methods. J. Therm. Anal. Calorim. 2004, 76, 123. [Google Scholar] [CrossRef]
- Sbirrazzuoli, N.; Vincent, L.; Mija, A.; Guigo, N. Integral, differential and advanced isoconversional methods: Complex mechanisms and isothermal predicted conversion–time curves. Chemom. Intell. Lab. Syst. 2009, 96, 219–226. [Google Scholar] [CrossRef]
- Flynn, J.H.; Wall, L.A. General treatment of the thermogravimetry of polymers. J. Res. Natl. Bur. Stand Sect. A Phys. Chem. 1966, 70, 487–523. [Google Scholar] [CrossRef] [PubMed]
- Ozawa, T. A new method of analyzing thermogravimetric data. Bull. Chem. Soc. Jpn. 1965, 38, 1881–1886. [Google Scholar] [CrossRef] [Green Version]
- Doyle, C. Estimating isothermal life from thermogravimetric data. J. Appl. Polym. Sci. 1962, 6, 639–642. [Google Scholar] [CrossRef]
- Kissinger, H.E. Reaction kinetics in differential thermal analysis. Anal. Chem. 1957, 29, 1702–1706. [Google Scholar] [CrossRef]
- Akahira, T.; Sunose, T. Method of determining activation deterioration constant of electrical insulating materials. Res. Rep. Chiba Inst. Technol. 1971, 16, 22–31. [Google Scholar]
- Ceylan, S. Kinetic analysis on the non-isothermal degradation of plum stone waste by thermogravimetric analysis and integral master-plots method. Waste Manag. Res. 2015, 33, 345–352. [Google Scholar] [CrossRef] [PubMed]
- Park, H.C.; Choi, H.S.; Kwak, Y.-H. Numerical study of heat transfer characteristics of char from waste tire pyrolysis. J. Mater. Cycles Waste Manag. 2017, 19, 1077–1084. [Google Scholar] [CrossRef]
- Choi, G.-G.; Jung, S.-H.; Oh, S.-J.; Kim, J.-S. Total utilization of waste tire rubber through pyrolysis to obtain oils and CO2 activation of pyrolysis char. Fuel Process. Technol. 2014, 123, 57–64. [Google Scholar] [CrossRef]
- González, J.F.; Encinar, J.M.; Canito, J.L.; Rodríguez, J.J. Pyrolysis of automobile tyre waste. Influence of operating variables and kinetics study. J. Anal. Appl. Pyrolysis 2001, 58, 667–683. [Google Scholar] [CrossRef]
- Xiang, Y.L.; Lin, Q.; Cai, L.; Guan, Y.; Lu, J.; Liu, W. Study of the effect mechanism of municipal solid waste gasification conditions on the production of H2 and CO using modelling technique. J. Environ. Manag. 2019, 230, 301–310. [Google Scholar] [CrossRef]
- Cai, J.-m.; Bi, L.-s. Kinetic analysis of wheat straw pyrolysis using isoconversional methods. J. Therm. Anal. Calorim. 2009, 98, 325–330. [Google Scholar] [CrossRef]
- Özsin, G.; Pütün, A.E. Kinetics and evolved gas analysis for pyrolysis of food processing wastes using TGA/MS/FTIR. Waste Manag. 2017, 64, 315–326. [Google Scholar] [CrossRef]
- Kok, M.V.; Özgür, E. Thermal analysis and kinetics of biomass samples. Fuel Process. Technol. 2013, 106, 739–743. [Google Scholar] [CrossRef]
- Gu, X.; Liu, C.; Jiang, X.; Ma, X.; Li, L.; Cheng, K.; Li, Z. Thermal behavior and kinetics of the pyrolysis of the raw/steam exploded poplar wood sawdust. J. Anal. Appl. Pyrolysis 2014, 106, 177–186. [Google Scholar] [CrossRef]
- Duan, Y.; Li, J.; Yang, X.; Hu, L.; Wang, Z.; Liu, Y.; Wang, C. Kinetic analysis on the non-isothermal dehydration by integral master-plots method and TG–FTIR study of zinc acetate dihydrate. J. Anal. Appl. Pyrolysis 2008, 83, 1–6. [Google Scholar] [CrossRef]
- Malika, A.; Jacques, N.; Fatima, B.; Mohammed, A. Pyrolysis investigation of food wastes by TG-MS-DSC technique. Biomass Convers. Biorefinery 2016, 6, 161–172. [Google Scholar] [CrossRef]
- He, F.; Yi, W.; Bai, X. Investigation on caloric requirement of biomass pyrolysis using TG–DSC analyzer. Energy Convers. Manag. 2006, 47, 2461–2469. [Google Scholar] [CrossRef]


| Ultimate Analysis (wt/%) | Proximate Analysis (wt/%) | |||||||
|---|---|---|---|---|---|---|---|---|
| C | H | N | S | O (Diff.) | Moisture | Volatile Matte | Ash | Fixed Carbon |
| 44.54 | 5.36 | 0.41 | 0.06 | 47.78 | 4.52 | 78.46 | 1.85 | 15.17 |
| Conversion | KAS | FWO | ||
|---|---|---|---|---|
| E (kJ/mol) | R2 | E (kJ/mol) | R2 | |
| 0.15 | 163.03 | 0.9996 | 172.31 | 0.9997 |
| 0.2 | 164.43 | 0.9987 | 173.67 | 0.9989 |
| 0.25 | 176.19 | 0.9963 | 176.98 | 0.9971 |
| 0.3 | 168.42 | 0.9959 | 177.54 | 0.9966 |
| 0.35 | 171.28 | 0.9971 | 180.29 | 0.9976 |
| 0.4 | 177.69 | 0.9992 | 186.43 | 0.9994 |
| 0.45 | 182.91 | 0.9979 | 191.42 | 0.9983 |
| 0.5 | 186.25 | 0.9958 | 194.65 | 0.9966 |
| 0.55 | 192.14 | 0.9982 | 200.28 | 0.9985 |
| 0.6 | 196.81 | 0.9981 | 204.77 | 0.9985 |
| 0.65 | 188.89 | 0.9996 | 197.26 | 0.9996 |
| 0.7 | 187.56 | 0.9987 | 196.08 | 0.9989 |
| 0.75 | 186.175 | 0.9991 | 194.76 | 0.9993 |
| 0.8 | 181.31 | 0.9892 | 190.17 | 0.9911 |
| 0.85 | 190.51 | 0.9878 | 191.06 | 0.9928 |
| average | 180.91 | 188.52 | ||
| Code | Mechanism | f(α) | g(α) |
|---|---|---|---|
| 1 | One dimensional diffusion | 1/(2α) | α2 |
| 2 | Two dimensional diffusion (Valensi) | [−ln (1 − α)]−1 | α + (1 − α) ln (1 − α) |
| 3 | Three dimensional diffusion (G-B) | 3/2 [(1 − α) −1/3 − 1]−1 | (1 − 2/3α) − (1 − α) 2/3 |
| 4 | Three dimensional diffusion (Jander) | 3/2 (1 − α)2/3 [1 − (1 − α)1/3]−1 | [1 − (1 − α)1/3]2 |
| 5 | Three dimensional diffusion (Opposite Jander) | 3/2 (1 + α)2/3 [(1 + α)1/3 − 1]−1 | [(1 + α)1/3 − 1]2 |
| 6 | Three dimensional diffusion (Z-L-T) | 3/2 (1 − α)4/3 [(1 − α)−1/3 − 1]−1 | [(1 − α)−1/3 − 1]2 |
| 7 | First-order | 1 − α | −ln(1 − α) |
| 8 | Avrami-Erofeev | 3/2 (1 − α) [−ln(1 − α)]1/3 | [−ln(1 − α)]2/3 |
| 9 | Avrami-Erofeev | 2 (1 − α) [1 − ln(1 − α)]1/2 | [−ln(1 − α)]1/2 |
| 10 | Avrami-Erofeev | 3 (1 − α) [1 − ln(1 − α)]2/3 | [−ln(1 − α)]1/3 |
| 11 | Avrami-Erofeev | 4 (1 − α) [1 − ln(1 − α)]3/4 | [−ln(1 − α)]1/4 |
| 12 | Contracting cylinder | 2 (1 − α)1/2 | 1 − (1 − α)1/2 |
| 13 | Contracting sphere | 3 (1 − α)2/3 | 1 − (1 − α)1/3 |
| 14 | Power law | 1 | α |
| 15 | Power law | 2α1/2 | α1/2 |
| 16 | Power law | 3α2/3 | α1/3 |
| 17 | Power law | 4α3/4 | α1/4 |
| 18 | Chemical reaction (second level) | (1 − α)2 | (1 − α)−1 − 1 |
| 19 | Chemical reaction (2/3 level) | 2 (1 − α)3/2 | (1 − α)−1/2 |
| Heating Rate (°C/min) | Temperature (°C) | Energy Required (kJ/kg) |
|---|---|---|
| 5 | 25–250 | 277.84 |
| 250–420 | 319.83 | |
| 887–1012 | 2146.80 | |
| 10 | 25–250 | 525.14 (CO2)/498.62(Ar) |
| 250–420 | 587.68 (CO2)/591.99(Ar) | |
| 935–1030 | 1545.69 | |
| 15 | 25–250 | 1099.23 |
| 250–420 | 1053.01 | |
| 932–1078 | 3038.24 | |
| 20 | 25–250 | 534.41 |
| 250–420 | 958.96 | |
| 934–1075 | 2553.39 |
Publisher’s Note: MDPI stays neutral with regard to jurisdictional claims in published maps and institutional affiliations. |
© 2021 by the authors. Licensee MDPI, Basel, Switzerland. This article is an open access article distributed under the terms and conditions of the Creative Commons Attribution (CC BY) license (https://creativecommons.org/licenses/by/4.0/).
Share and Cite
Wang, B.; Li, Y.; Zhou, J.; Wang, Y.; Tao, X.; Zhang, X.; Song, W. Thermogravimetric and Kinetic Analysis of High-Temperature Thermal Conversion of Pine Wood Sawdust under CO2/Ar. Energies 2021, 14, 5328. https://0-doi-org.brum.beds.ac.uk/10.3390/en14175328
Wang B, Li Y, Zhou J, Wang Y, Tao X, Zhang X, Song W. Thermogravimetric and Kinetic Analysis of High-Temperature Thermal Conversion of Pine Wood Sawdust under CO2/Ar. Energies. 2021; 14(17):5328. https://0-doi-org.brum.beds.ac.uk/10.3390/en14175328
Chicago/Turabian StyleWang, Bao, Yujie Li, Jianan Zhou, Yi Wang, Xun Tao, Xiang Zhang, and Weiming Song. 2021. "Thermogravimetric and Kinetic Analysis of High-Temperature Thermal Conversion of Pine Wood Sawdust under CO2/Ar" Energies 14, no. 17: 5328. https://0-doi-org.brum.beds.ac.uk/10.3390/en14175328