
Toxic Effect of Ammonium Nitrogen on the Nitrification Process and Acclimatisation of Nitrifying Bacteria to High Concentrations of NH4-N in Wastewater

 , , , , ,
Abstract
:1. Introduction
2. Materials and Methods
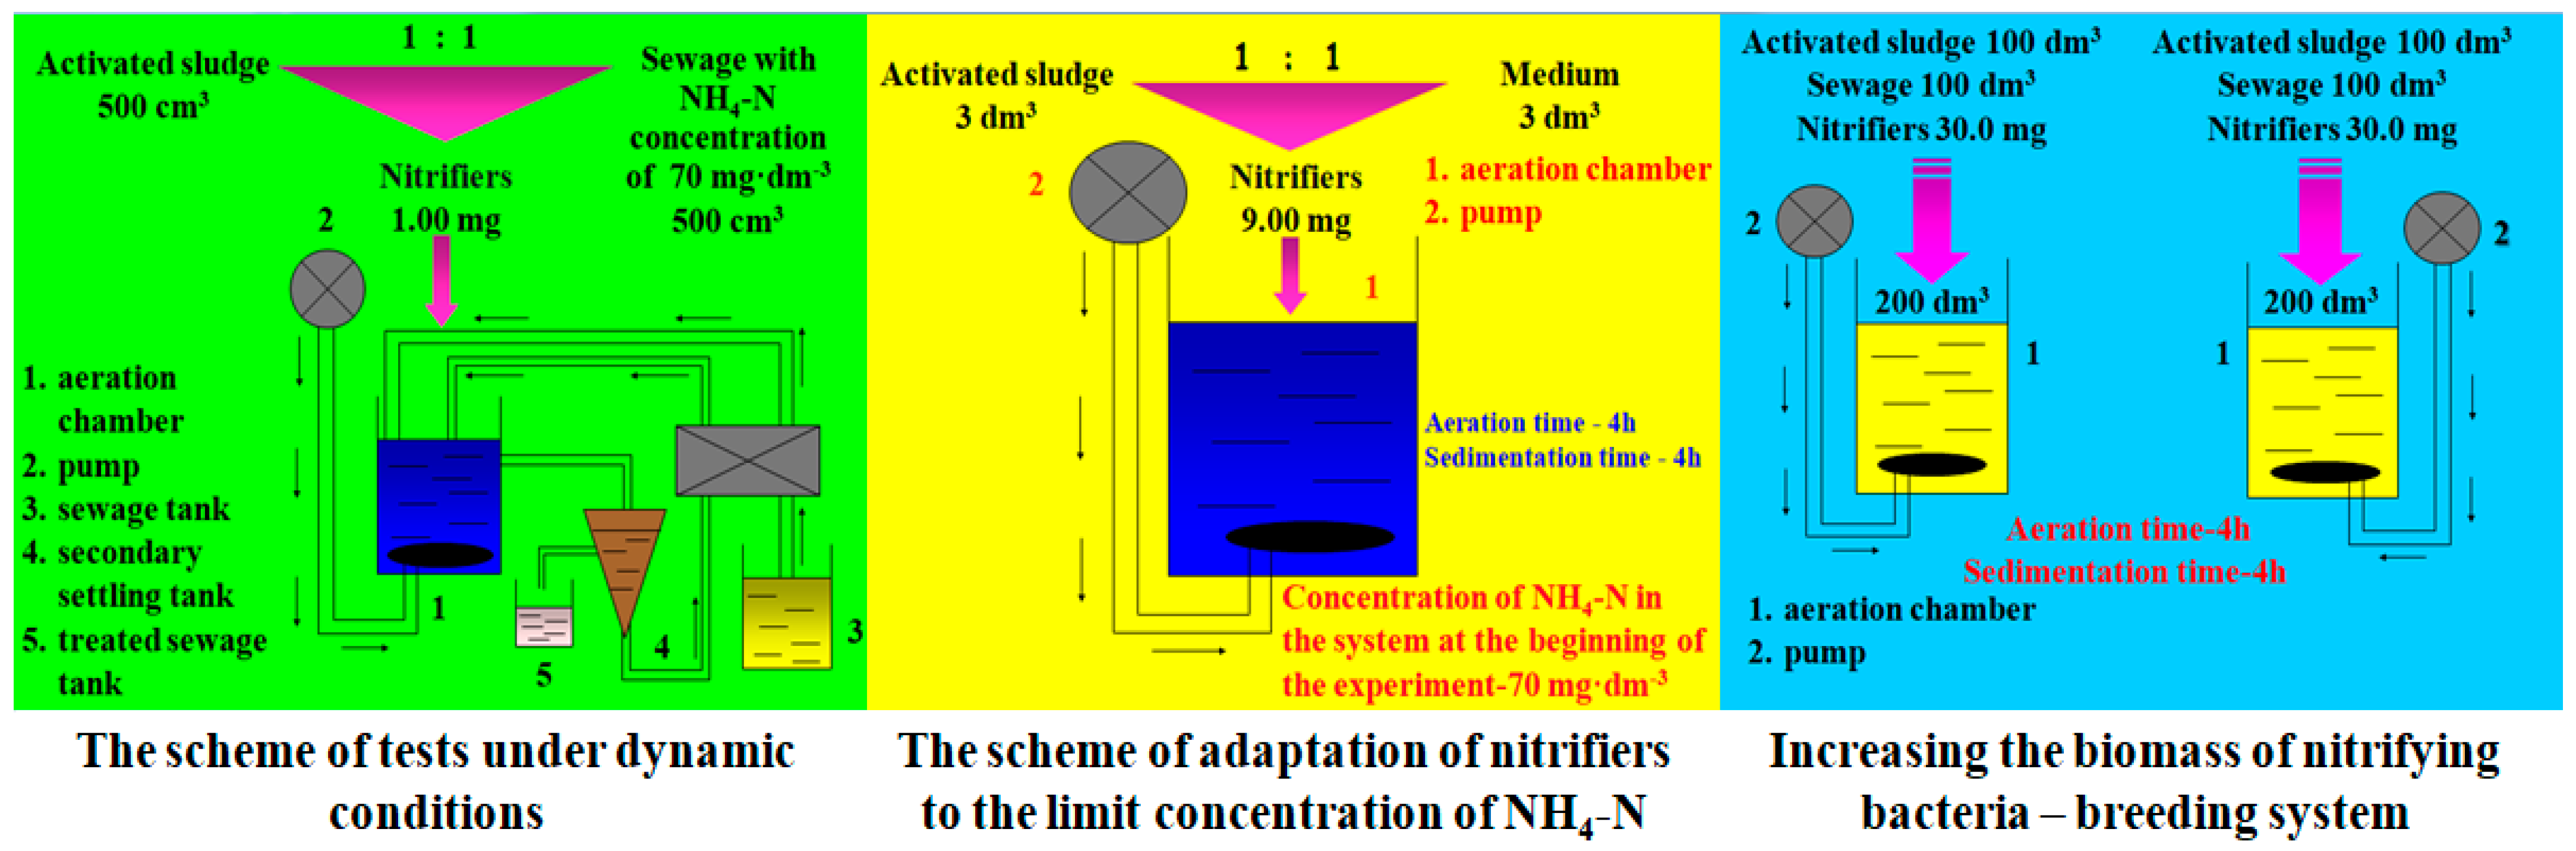
2.1. Determination of the Limiting Concentration of Ammonium Nitrogen Which Inhibits Nitrification—Laboratory Tests
- Static system with aeration
- Dynamic system operating under continuous supply conditions based on wastewater flowing to biological treatment.
2.2. Acclimatisation of Nitrifiers to the Limit Concentration of NH4-N
2.3. Isolation of Cultures of Nitrifying Bacteria
- K2HPO4
- 2HPO4—0.5 g
- K2HPO4
- (NH4)2SO4—0.5 g
- K2HPO4
- phenol red—0.5 g
- K2HPO4
- MgSO4·7H2O—0.05 g
- K2HPO4
- CaCl2·2H2O—0.02 g
- K2HPO4
- NaCl—0.02 g
- K2HPO4
- Na2MoO4·2H2O—2.4 μg
- K2HPO4
- microelements—1 cm3
- ZnSO4
- sub>4·7H2O—1.1 g
- ZnSO4
- FeSO4·7H2O—0.5 g
- ZnSO4
- EDTA—0.25 g
- ZnSO4
- MnSO4·7H2O—0.154 g
- ZnSO4
- CuSO4·5H2O—0.04 g
- ZnSO4
- Co(NO3)2·6H2O—0.025 g
- ZnSO4
- Na2B4O7·10H2O—0.018 g, the whole was made up of water to 100 cm3.
- KHCO3
- sub>3—1.5 g
- KHCO3
- KH2PO4—0.5 g
- KHCO3
- K2HPO4—0.5 g
- KHCO3
- KNO2—0.3 g
- KHCO3
- MgSO4·7H2O—0.2 g
- KHCO3
- NaCl—0.2 g
- KHCO3
- CaCl2·2H2O—0.01 g
- KHCO3
- FeSO4·7H2O—0.01 g.
2.4. Analytical Methods
- pH—determined using a UF 100-01 UniFETTM pH meter.
- DO—was determined using a MYCOM/COM 141 S-1A00 ELMETRON oxygen meter. This probe consists of two electrodes, an electrolyte layer surrounding the electrodes and an oxygen-permeable membrane that separates the electrodes and electrolyte from the test sample. The determination consisted in measuring the intensity of the current as a result of the reduction in oxygen particles on the cathode. Dissolved oxygen concentration was measured continuously and the result was given in mg·dm−3.
- MLVSS—the concentration of activated sludge biomass was determined by the weight method. For this purpose, 250 cm3 of a well-mixed sample was filtered through a medium, balanced filter paper, and then the material was dried to constant weight at 105 °C. The amount of total suspended solids was calculated according to the formula:
- X—biomass concentration, mg·dm−3
- m1—weight of the weighing bottle and the dried filter, mg
- m2—weight of the weighing bottle with filter and activated sludge, mg
- V—volume of the sample taken for testing, cm3
- COD—determined by the bichromate method. For this purpose, the number of milligrams of potassium dichromate was determined, converted into milligrams of oxygen used for the oxidation of organic compounds and some inorganic compounds present in the analyzed wastewater. The oxidation process was carried out in sulfuric acid in the presence of silver sulfate as a catalyst. The results were calculated according to the formula:
- V—the volume of the wastewater sample, cm3
- V1—volume of ferrous ammonium sulphate solution used for titration of the test sample, cm3
- V2—the volume of the ferrous ammonium sulphate solution used for the titration of the control sample, cm3
- n—normality of the ferrous ammonium sulphate solution
- 8—the conversion factor of the result into milligrams of oxygen
- f—factor of ferrous ammonium sulphate solution
- The concentration of NH4-N, NO2-N, NO3-N—was determined by the colorimetric method on the CADAS 30S spectrophotometer by Dr Lange, using appropriate cuvette tests.The following tests were used to determine the concentration of NH4-N: LCK-302 (with a measuring range of 47.00–130.00 mg·dm−3), LCK-303 (with a measuring range of 2.00–47.00 mg·dm−3) and LCK-304 (with a measuring range of 0.015–2.00 mg·dm−3). The concentration of NO2-N was determined based on the LCK-341 test (with a measuring range of 0.015–0.60 mg·dm−3). As in many test series, nitrite nitrogen was present in trace amounts and its concentration was beyond the detection range of the CADAS 30S spectrophotometer, on most Tables, this parameter was omitted. The LCK-339 tests (with a measuring range of 0.23–13.50 mg·dm−3) and LCK-340 (with a measuring range of 5.00–35.00 mg·dm−3) were used to determine the concentration of NO3-N.
- The specific rate of nitrification was determined on the basis of changes in NH4-N concentration, according to the formula:
- X—specific rate of nitrification, mg·gh−1
- NH4-N—concentration of ammonium nitrogen, mg·dm−3
- t—time of the initial (t1) and final (t2) measurement, h
- MLVSS—concentration of activated sludge biomass used for research, g·dm−3.
2.5. Statistical Analysis
3. Results
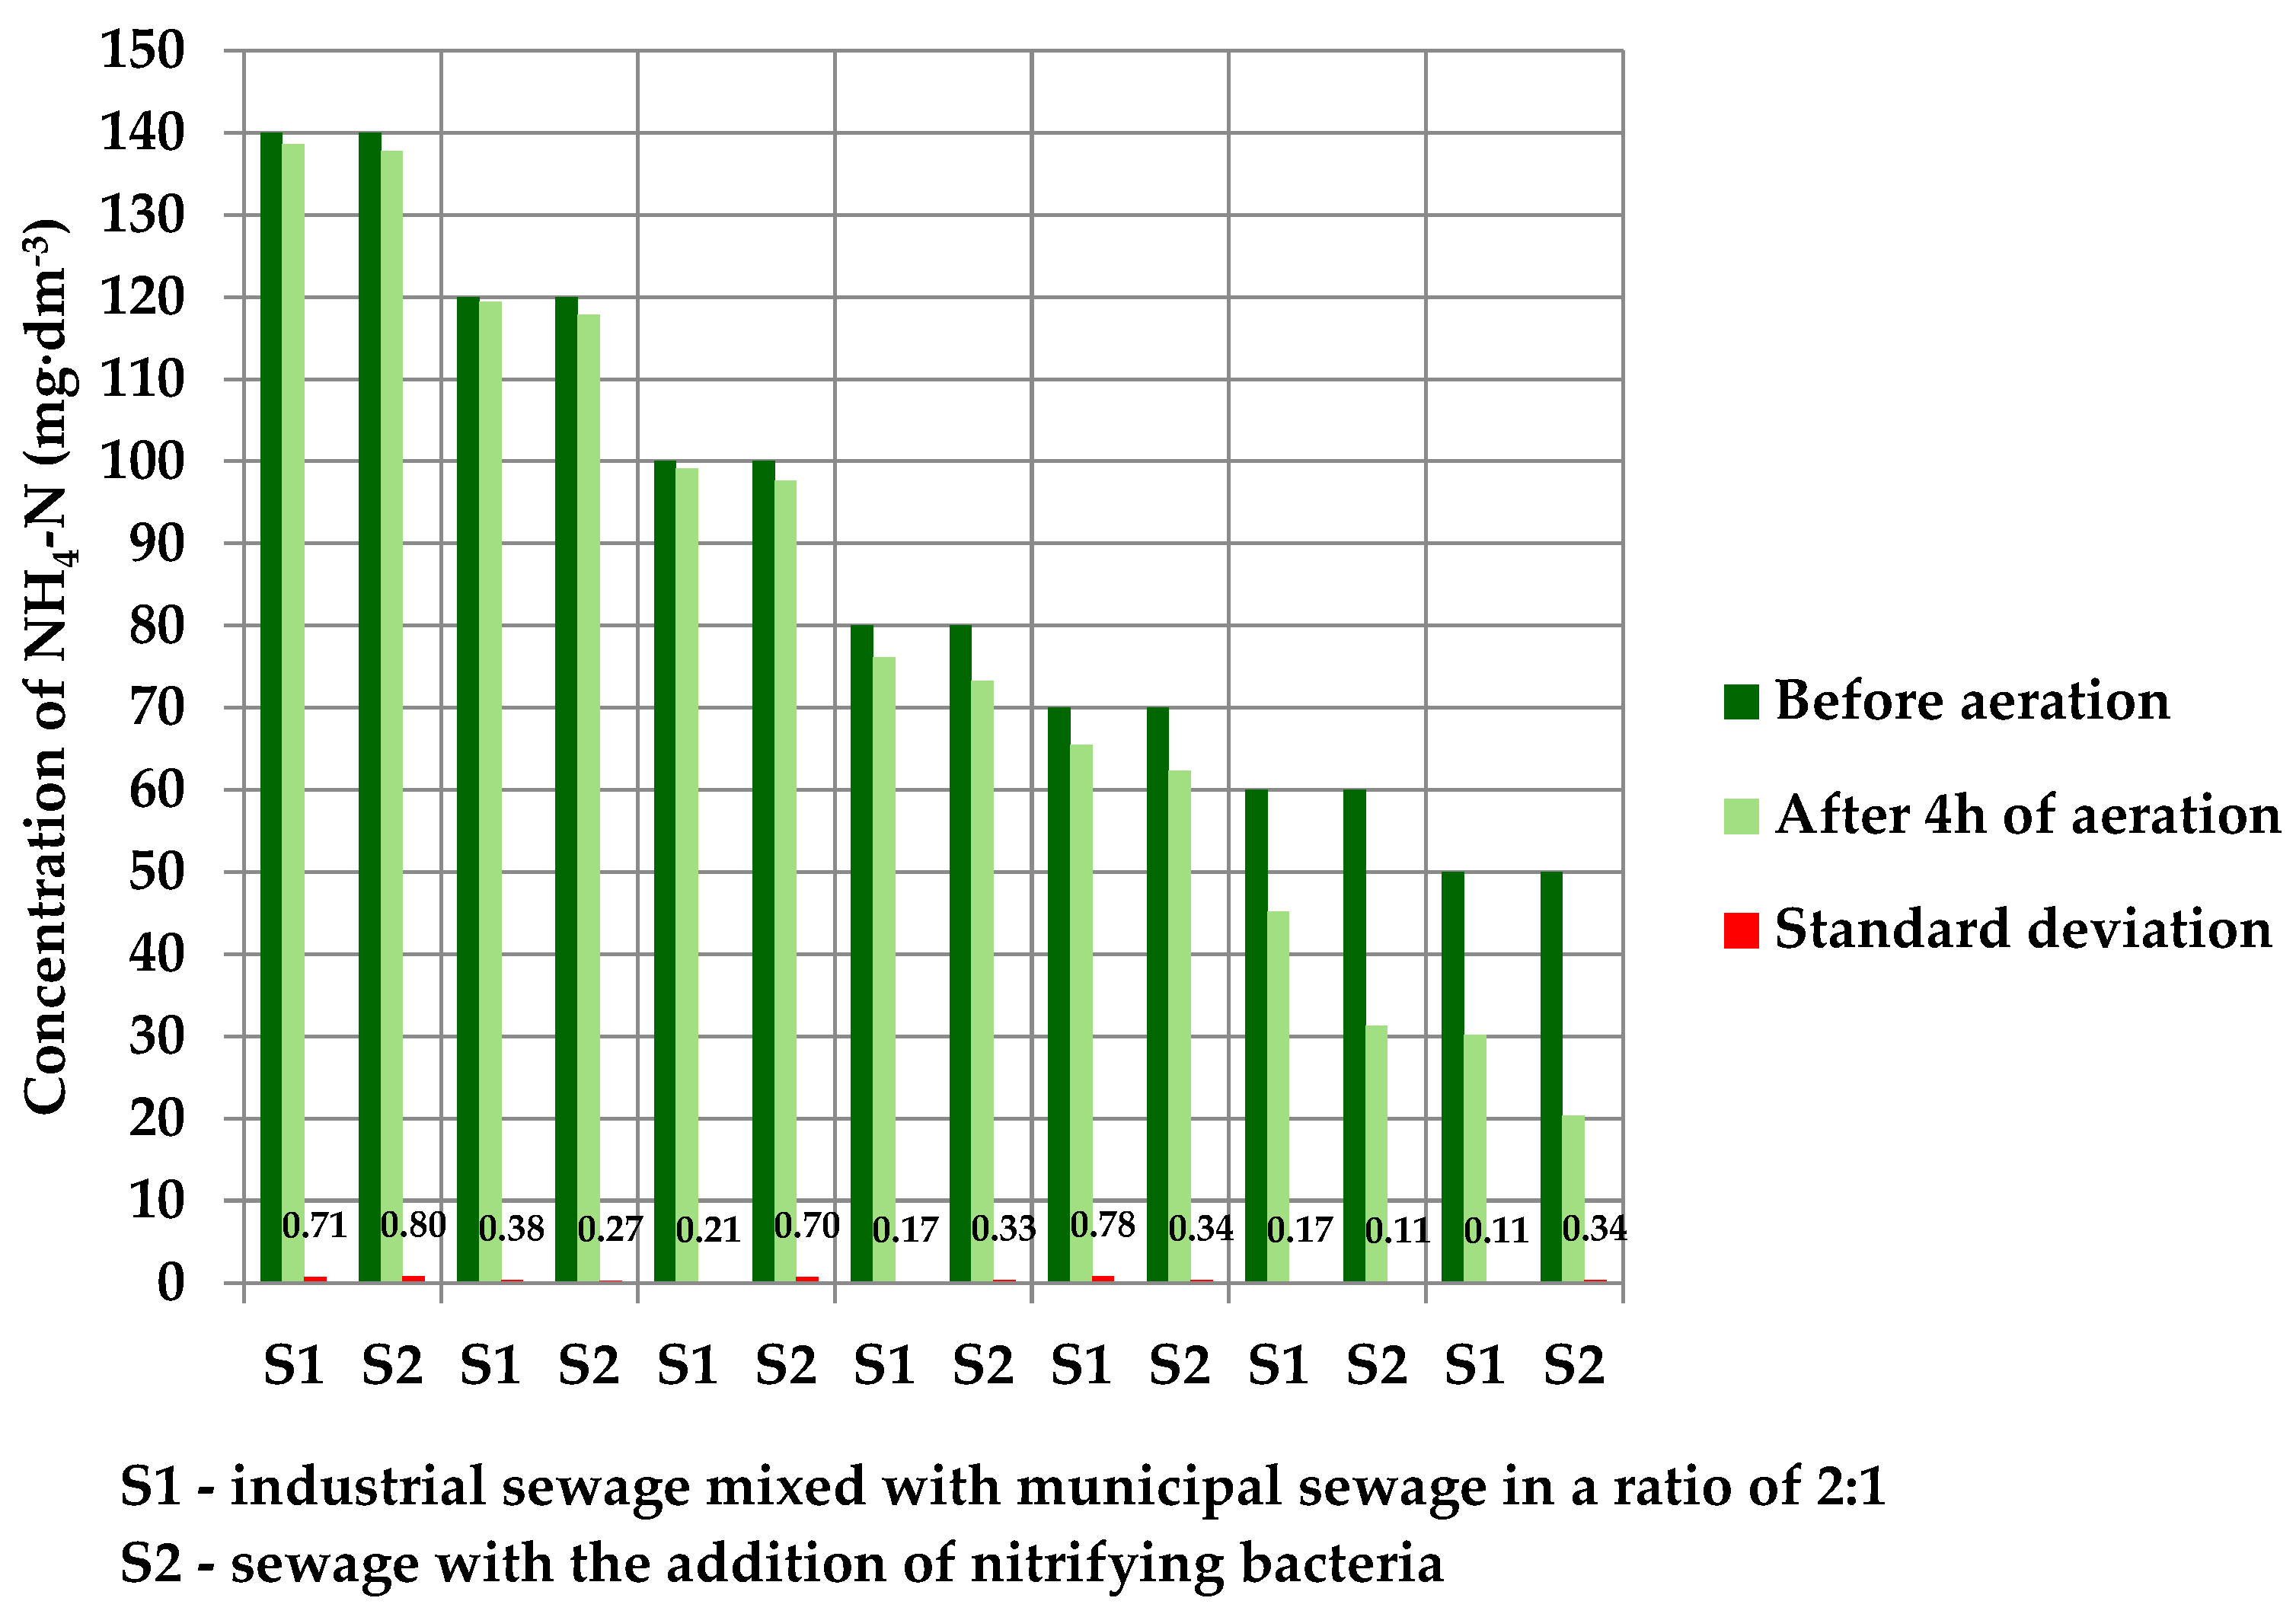
3.1. Determination of the Limit Concentration of Ammonium Nitrogen
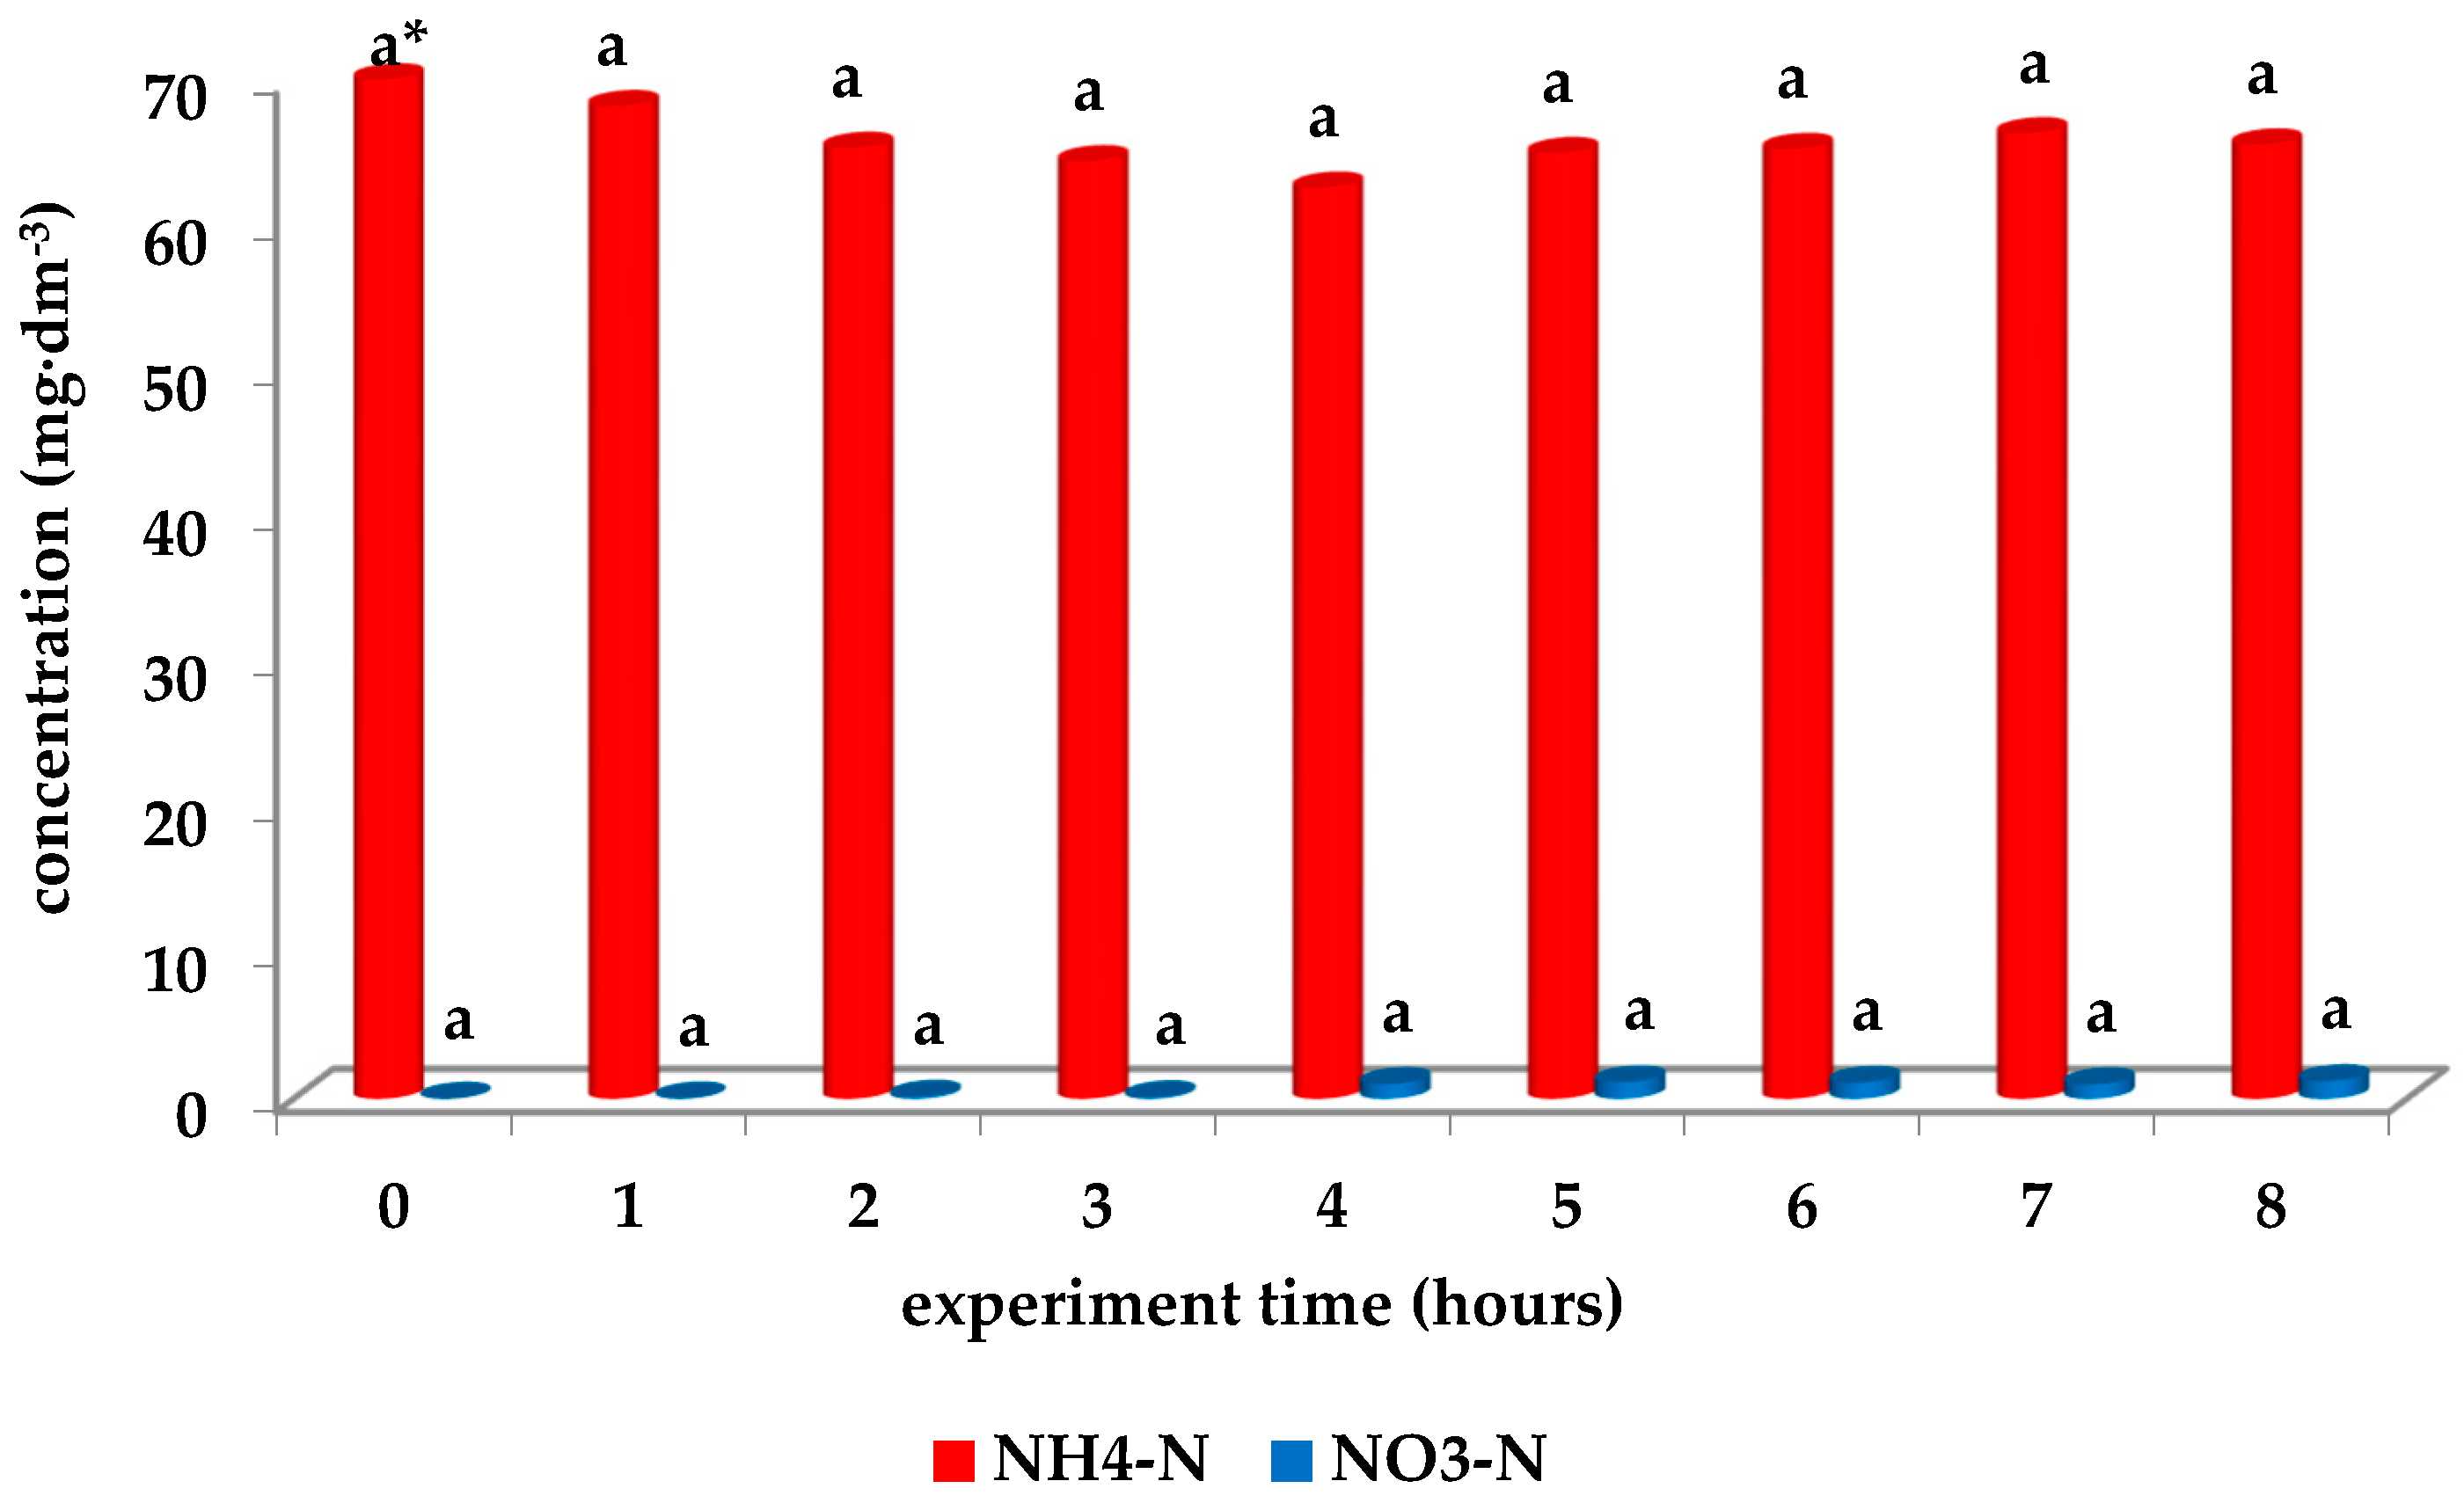
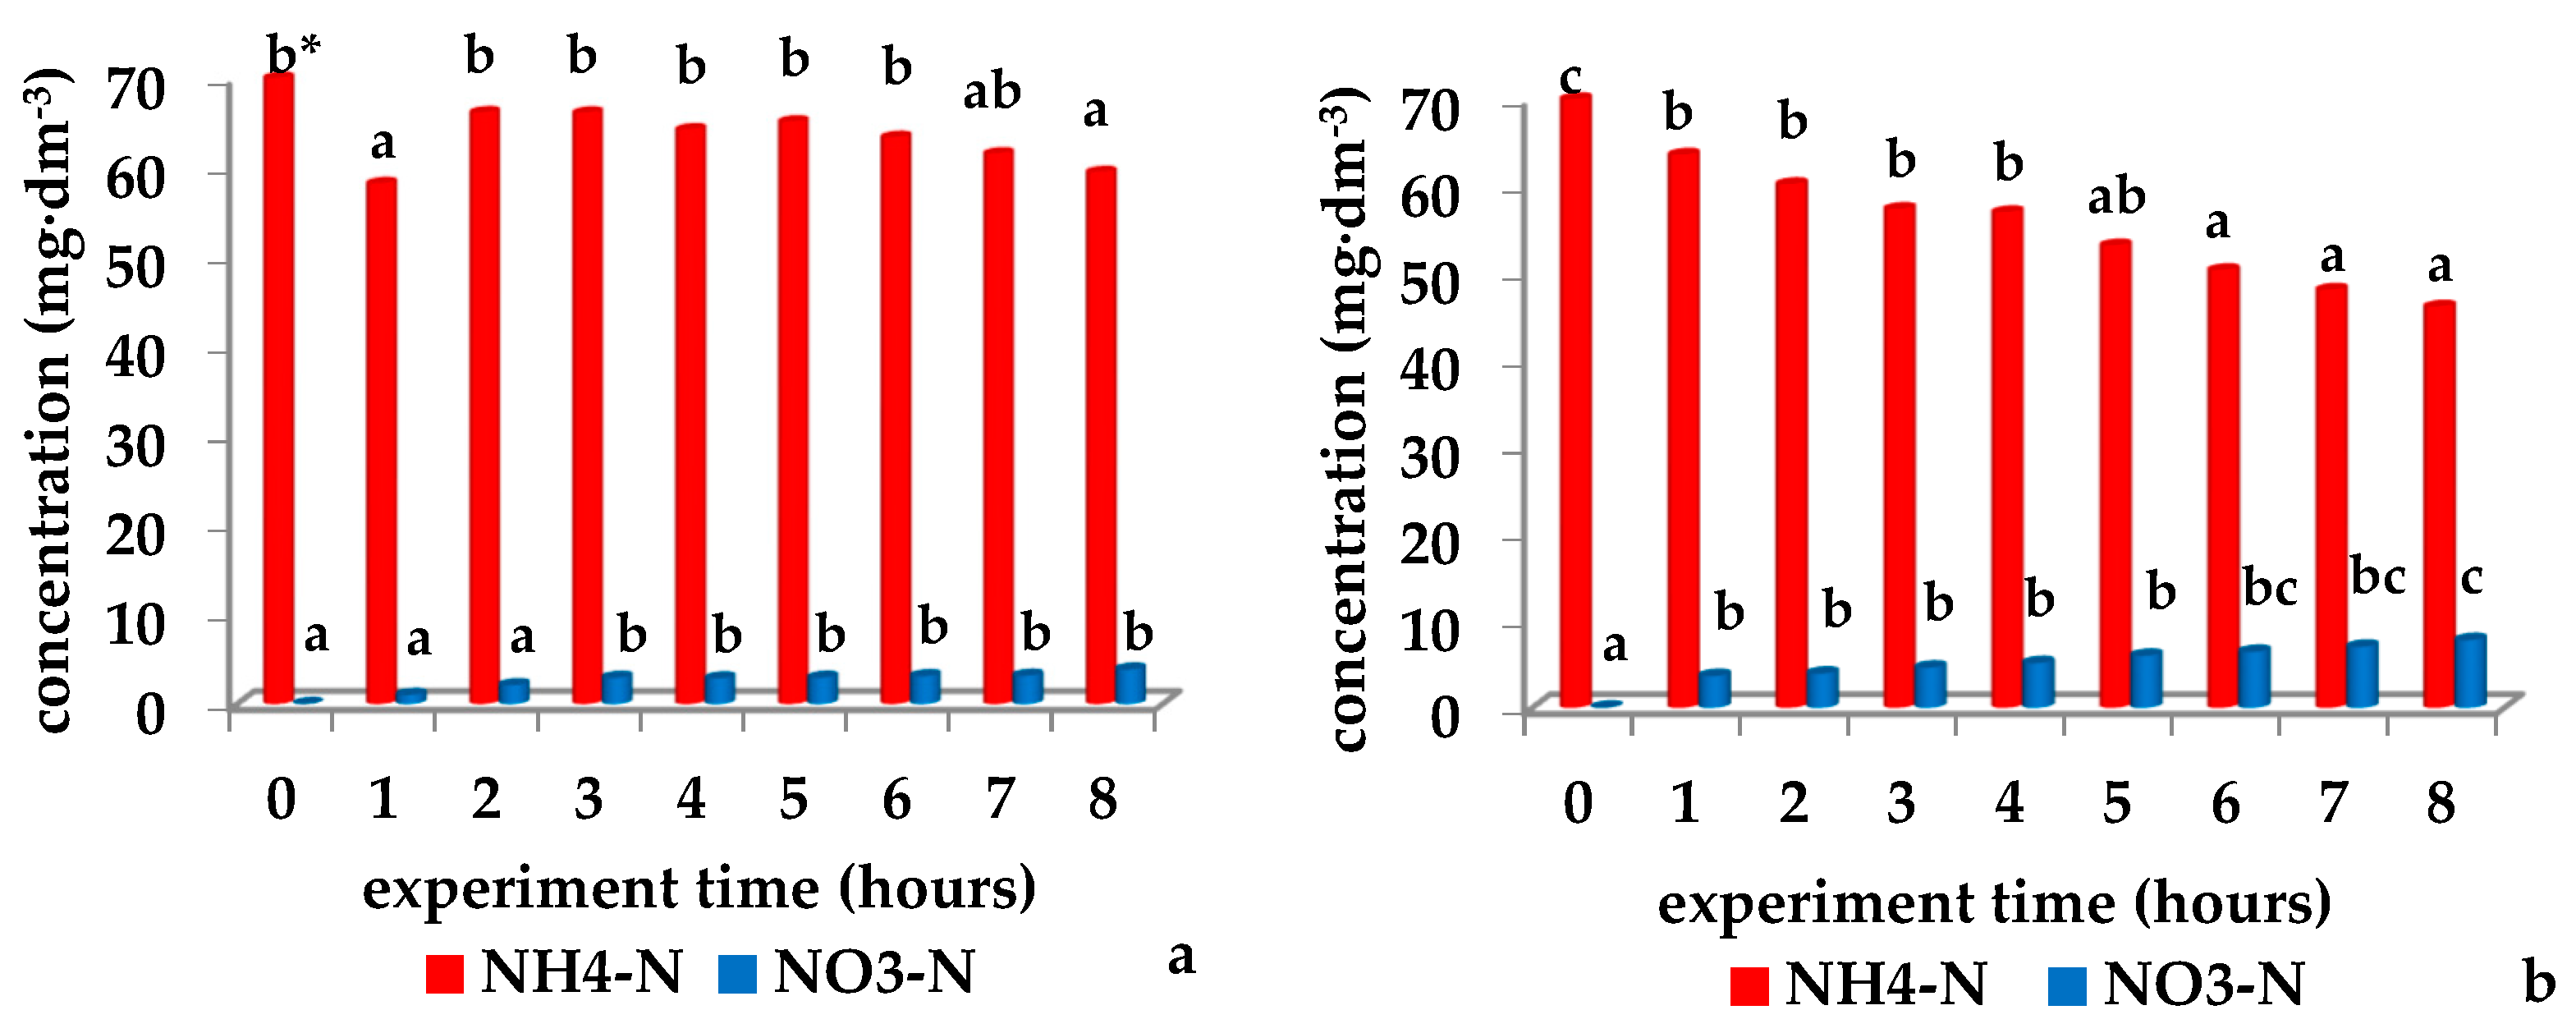
3.2. Acclimatisation of Nitrifying Bacteria to the Limit Concentration of Ammonium Nitrogen
4. Discussion
5. Conclusions
- The limit concentration of ammonium nitrogen at which the nitrification process is inhibited at the Municipal and Industrial Sewage Treatment Plant in Oświęcim is 70 mg·dm−3.
- Ammonium nitrogen at the concentration of 100 mg·dm−3, 120 mg·dm−3 and 140 mg·dm−3 inhibits both the first and the second phase of nitrification in the tested system.
- The cultures of nitrifying bacteria added to the dynamic system do not colonize activated sludge during the 8-h aeration time and are removed from the system together with the treated sewage.
- In the WWTP, the inoculation of the aeration chamber with cultures of nitrifying bacteria gives effect only after the previous four-day acclimatisation of the activated sludge and significantly shortens the waiting time for the effective process of NH4-N oxidation during periods of nitrification disappearance.
- Acclimated activated sludge, added to the aeration chamber in the form of inoculum in periods unfavourable for nitrifiers, allows increasing the degree of TAN oxidation in treated sewage by approx. 35.0%.
- The nitrification process was achieved with the tested strategies, which is good in the WWTP point-of-view. With such is possible to apply the subsequent denitrification process.
Author Contributions
Funding
Institutional Review Board Statement
Informed Consent Statement
Data Availability Statement
Conflicts of Interest
References
- Anthonisen, A.C.; Loehr, R.C.; Prakasam, T.B.S.; Srinath, E.G. Inhibition of Nitrification by Ammonia and Nitrous Acid. J. Water Pollut. Control Fed. 1976, 5, 835–852. [Google Scholar]
- McCarty, P.L. What is the Best Biological Process for Nitrogen Removal: When and Why? Environ. Sci. Technol. 2018, 52, 3835–3841. [Google Scholar] [CrossRef] [Green Version]
- Zhu, G.; Peng, Y.; Li, B.; Guo, J.; Yang, Q.; Wang, S. Biological Removal of Nitrogen from Wastewater. In Reviews of Environmental Contamination and Toxicology; Whitacre, D.M., Ed.; Springer: New York, NY, USA, 2008; Volume 192, pp. 159–195. [Google Scholar]
- Bawiec, A. Efficiency of nitrogen and phosphorus compounds removal in hydroponic wastewater treatment plant. Environ. Technol. 2019, 40, 2062–2072. [Google Scholar] [CrossRef] [PubMed]
- Hu, H.; Ma, S.; Zhang, X.; Ren, H. Characteristics of dissolved organic nitrogen in effluent from a biological nitrogen removal process using sludge alkaline fermentation liquid as an external carbon source. Water Res. 2020, 176, 115741. [Google Scholar] [CrossRef] [PubMed]
- Jóźwiakowski, K.; Bugajski, P.; Kurek, K.; Nunes de Carvalho, M.F.; Araújo Almeida, M.A.; Siwiec, T.; Borowski, G.; Czekała, W.; Dach, J.; Gajewska, M. The efficiency and technological reliability of biogenic compounds removal during long-term operation of a one-stage subsurface horizontal flow constructed wetland. Sep. Purif. Technol. 2018, 202, 216–226. [Google Scholar] [CrossRef]
- Jucherski, A.; Walczowski, A.; Bugajski, P.; Jóźwiakowski, K. Technological reliability of domestic wastewater purification in a small Sequencing Batch Biofilm Reactor (SBBR). Sep. Purif. Technol. 2019, 224, 340–347. [Google Scholar] [CrossRef]
- Micek, A.; Jóźwiakowski, K.; Marzec, M.; Listosz, A.; Malik, A. Efficiency of Pollution Removal in Preliminary Settling Tanks of Household Wastewater Treatment Plants in the Roztocze National Park. J. Ecol. Eng. 2020, 21, 9–18. [Google Scholar] [CrossRef]
- Mucha, Z.; Mikosz, J. Technological characteristics of reject waters from aerobic sludge stabilization in small and medium-sized wastewater treatment plants with biological nutrient removal. Int. J. Energy Environ. Eng. 2020, 12, 69–76. [Google Scholar] [CrossRef]
- Nguyen, P.Y.; Carvalho, G.; Reis, A.C.; Nunes, O.C.; Reis, M.A.M.; Oehmen, A. Impact of biogenic substrates on sulfamethoxazole biodegradation kinetics by Achromobacter denitrificans strain PR1. Biodegradation 2017, 28, 205–217. [Google Scholar] [CrossRef]
- Peng, Y.; Zhu, G. Biological nitrogen removal with nitrification and denitrification via nitrite pathway. Appl. Microbiol. Biotechnol. 2006, 73, 15–26. [Google Scholar] [CrossRef]
- Szeląg, B.; Gawdzik, J. Assessment of the Effect of Wastewater Quantity and Quality, and Sludge Parameters on Predictive Abilities of Non-Linear Models for Activated Sludge Settleability Predictions. Pol. J. Environ. Stud. 2017, 26, 315–322. [Google Scholar] [CrossRef]
- Shen, S.; Li, X.; Cheng, F.; Zha, X.; Lu, X. Review: Recent developments of substrates for nitrogenand phosphorus removal in CWs treating municipal wastewater. Environ. Sci. Poll. Res. 2020, 27, 29837–29855. [Google Scholar] [CrossRef] [PubMed]
- Yan, C.; Wang, M.; Ma, T.; Yang, S.; Kong, M.; Shen, J.; Yang, L.; Gao, Y. Study on the experimental performance by electrolysis-integrated ecological floating bed for nitrogen and phosphorus removal in eutrophic water. Sci. Rep. 2020, 10, 7619. [Google Scholar] [CrossRef] [PubMed]
- Ajibade, F.O.; Wang, H.C.; Guadie, A.; Ajibade, T.F.; Fang, Y.K.; Sharif, H.M.A.; Liu, W.Z.; Wang, A.J. Total nitrogen removal in biochar amended non-aerated vertical flow constructed wetlands for secondary wastewater effluent with low C/N ratio: Microbial community structure and dissolved organic carbon release conditions. Bioresour. Technol. 2021, 322, 124430. [Google Scholar] [CrossRef]
- Liu, X.; Huang, M.; Bao, S.; Tang, W.; Fang, T. Nitrate removal from low carbon-to-nitrogen ratio wastewater by combining iron-based chemical reduction and autotrophic denitrification. Bioresour. Technol. 2020, 301, 122731. [Google Scholar] [CrossRef]
- Koren, D.W.; Gould, W.D.; Bédard, P. Biological removal of ammonia and nitrate from simulated mine and mill effluents. Hydrometallurgy 2020, 56, 127–144. [Google Scholar] [CrossRef]
- Racz, L.A.; Datta, T.; Goel, R. Effect of organic carbon on ammonia oxidizing bacteria in a mixed culture. Bioresour. Technol. 2010, 101, 6454–6460. [Google Scholar] [CrossRef]
- Wang, Y.; Singh, R.P.; Geng, C.; Fu, D. Carbon-to-nitrogen ratio influence on the performanceof bioretention for wastewater treatment. Environ. Sci. Poll. Res. 2020, 27, 17652–17660. [Google Scholar] [CrossRef]
- Shoupeng, D.; Yanyan, Z.; Zheng, S. Heterotrophic nitrifying bacteria in wastewater biological nitrogen removal systems: A review. Crit. Rev. Environ. Sci. Technol. 2021. [Google Scholar] [CrossRef]
- Su, M.H.; Azwar, E.; Yang, Y.F.; Sonne, C.; Yek, P.N.Y.; Liew, R.K.; Cheng, C.K.; Show, P.L.; Lam, S.S. Simultaneous removal of toxic ammonia and lettuce cultivation in aquaponic system using microwave pyrolysis biochor. J. Hazard. Mater. 2020, 396, 122610. [Google Scholar] [CrossRef]
- Wu, Z.; Zhu, W.; Liu, Y.; Peng, P.; Li, X.; Zhou, X.; Xu, J. An integrated three-dimensional electrochemical system for efficient treatment of coking wastewater rich in ammonia nitrogen. Chemosphere 2020, 246, 125703. [Google Scholar] [CrossRef] [PubMed]
- Xiang, S.; Liu, Y.; Zhang, G.; Ruan, R.; Wang, Y.; Wu, X.; Zheng, H.; Zhang, Q.; Cao, L. New progress of ammonia recovery during ammonia nitrogen removal from various wastewaters. World J. Microbiol. Biotechnol. 2020, 36, 144. [Google Scholar] [CrossRef] [PubMed]
- Xu, N.; Liao, M.; Liang, Y.; Guo, J.; Zhang, Y.; Xie, X.; Fan, Q.; Zhu, Y. Biological nitrogen removal capability and pathways analysis of a novel low C/N ratio heterotrophic nitrifying and aerobic denitrifying bacterium (Bacillus thuringiensis strain WXN-23). Environ. Res. 2021, 195, 110797. [Google Scholar] [CrossRef] [PubMed]
- Albright, M.B.N.; Timalsina, B.; Martiny, J.B.H.; Dubnar, J. Comparative Genomics of Nitrogen Cycling Pathways in Bacteria and Archaea. Microb. Ecol. 2019, 77, 597–606. [Google Scholar] [CrossRef]
- Ding, F.; Liang, D.; Wu, Y.; Li, D.; Bian, W.; Li, J. Effect of C/N on partial nitrification in an MBBR at low temperature. Environ. Sci. Water Res. Technol. 2020, 6, 3391–3399. [Google Scholar] [CrossRef]
- Massoompour, A.R.; Borghei, S.M.; Raie, M. Enhancement of biological nitrogen removal performance using novel carriers based on the recycling of waste materials. Water Res. 2020, 170, 115340. [Google Scholar] [CrossRef]
- Rahimi, S.; Modin, O.; Mijakovic, I. Technologies for biological removal and recovery of nitrogen from wastewater. Biotechnol. Advanc. 2020, 43, 107570. [Google Scholar] [CrossRef]
- Wang, J.; Wang, Y.; Bai, J.; Liu, Z.; Song, X.; Yan, D.; Abiyu, A.; Zhao, Z.; Yan, D. High efficiency of inorganic nitrogen removal by integrating biofilm-electrode with constructed wetland: Autotrophic denitrifying bacteria analysis. Bioresour. Technol. 2017, 227, 7–14. [Google Scholar] [CrossRef]
- Chistiakova, T.; Mattsson, P.; Carlsson, B.; Wigren, T. Nonlinear system identification of the dissolved oxygen to effluent ammonia dynamics in an activated sludge process. IFAC-Pap. 2017, 50, 3917–3922. [Google Scholar] [CrossRef]
- Tao, C.; Hamouda, M.A. Steady-state modeling and evaluation of partial nitrification-anammox (PNA) for moving bed biofilm reactor and integrated fixed-film activated sludge processes treating municipal wastewater. J. Water Process Eng. 2019, 31, 100854. [Google Scholar] [CrossRef]
- Bishoff, D.; AlSayed, A.; Fergala, A.; Eldyasti, A. Redirecting methane for a novel biological nitrogen removal process using methanotrophic mixed culture in a sequential batch reaktor. Chem. Eng. J. 2021, 404, 126487. [Google Scholar] [CrossRef]
- Cao, Q.; Li, X.; Jiang, H.; Wu, H.; Xie, Z.; Zhang, X.; Li, N.; Huang, X.; Li, Z.; Liu, X.; et al. Ammonia removal through combined methane oxidation and nitrification-denitrification and the interactions among functional microorganisms. Water Res. 2021, 188, 116555. [Google Scholar] [CrossRef]
- Cao, Y.; Zhang, C.; Rong, H.; Zheng, G.; Zhao, L. The effect of dissolved oxygen concentration (DO) on oxygen diffusion and bacterial community structure in moving bed sequencing batch reactor (MBSBR). Water Res. 2017, 108, 86–94. [Google Scholar] [CrossRef] [PubMed]
- Chen, Y.; Lan, S.; Wang, L.; Dong, S.; Zhou, H.; Tan, Z.; Li, X. A review: Driving factors and regulation strategies of microbial community structure and dynamics in wastewater treatment systems. Chemosphere 2017, 174, 173–182. [Google Scholar] [CrossRef] [PubMed]
- Zhang, X.; Zheng, S.; Wang, R. Effect of dissolved oxygen concentration (microaerobic and aerobic) on community structure and activity of culturable heterotrophic nitrifying bacteria in activated sludge. Chem. Ecol. 2020, 36, 953–966. [Google Scholar] [CrossRef]
- Ding, J.; Gao, Q.; Wang, Y.; Zhao, G.; Wang, K.; Jiang, J.; Li, J.; Zhao, Q. Simulation and prediction of electrooxidation removal of ammonia and its application in industrial wastewater effluent. Water Environ. Res. 2020, 93, 51–60. [Google Scholar] [CrossRef] [PubMed]
- Guo, X.; Li, B.; Zhao, R.; Zhang, J.; Lin, L.; Zhang, G.; Li, R.; Liu, J.; Li, P.; Li, Y.; et al. Performance and bacterial community of moving bed biofilm reactors with various biocarriers treating primary wastewater effluent with a low organic strength and low C/N ratio. Bioresour. Technol. 2019, 287, 121424. [Google Scholar] [CrossRef] [PubMed]
- Wang, X.; Chen, Z.; Shen, J.; Zhao, X.; Kang, J. Impact of carbon to nitrogen ratio on the performance of aerobic granular reactor and microbial population dynamics during aerobic sludge granulation. Bioresour. Technol. 2019, 271, 258–265. [Google Scholar] [CrossRef] [PubMed]
- Ariff, I.F.M. Application of Inhibition Model to Prevent Nitrification Upset in Petrochemical Wastewater Treatment Plant. In Lecture Notes in Civil Engineering, Proceedings of the International Conference on Civil, Offshore and Environmental Engineering, Kuching, Malaysia, 13–15 June 2020; Mohammed, B.S., Shafiq, N., Rahman, M., Kutty, S., Mohamad, H., Balogun, A.L., Eds.; Springer: Singapore, 2021; Volume 132, pp. 281–304. [Google Scholar]
- Vasiliadou, I.A.; Molina, R.; Martinez, F.; Melero, J.A.; Stathopoulou, P.M.; Tsiamis, G. Toxicity assessment of pharmaceutical compounds on mixed culture from activated sludge using respirometric technique: The role of microbial community structure. Sci. Total Environ. 2018, 630, 809–819. [Google Scholar] [CrossRef]
- Wang, F.; Xu, S.; Liu, L.; Wang, S.; Ji, M. One-stage partial nitrification and anammox process in a sequencing batch biofilm reactor: Start-up, nitrogen removal performance and bacterial community dynamics in response to temperature. Sci. Total Environ. 2021, 772, 145529. [Google Scholar] [CrossRef] [PubMed]
- Jaramillo, F.; Orchard, M.; Muñoz, C.; Zamorano, M.; Antileo, C. Advanced strategies to improve nitrification process in sequencing batch reactors—A review. J. Environ. Manag. 2018, 218, 154–164. [Google Scholar] [CrossRef]
- Quoc, B.N.; Wei, S.; Armenta, M.; Bucher, R.; Sukapanpotharam, P.; Stahl, D.A.; Stensel, H.D.; Winkler, M.K.H. Aerobic granular sludge: Impact of size distribution on nitrification capa city. Water Res. 2021, 188, 116445. [Google Scholar] [CrossRef] [PubMed]
- Wang, Z.; Zheng, M.; Xue, Y.; Xia, J.; Zhong, H.; Ni, G.; Liu, Y.; Yuan, Z.; Hu, S. Free ammonia shock treatment eliminates nitrite-oxidizing bacterial activity for mainstream biofilm nitritation process. Chem. Eng. J. 2020, 393, 124682. [Google Scholar] [CrossRef]
- Atlas, R.M.; Parks, L.C. Hand book of Microbiological Media, 2nd ed.; CRC Press INC.: Boca Raton, FL, USA, 1997; pp. 258–316. [Google Scholar]
- Wang, J.; Gong, B.; Wang, Y.; Wen, Y.; Zhou, J.; He, Q. The potential multiple mechanisms and microbial communities in simultaneous nitrification and denitrification process treating high carbon and nitrogen concentration saline wastewater. Bioresour. Technol. 2017, 243, 708–715. [Google Scholar] [CrossRef] [PubMed]
- Zeng, D.; Miao, J.; Wu, G.; Zhan, X. Nitrogen removal, microbial community and electron transport in an integrated nitrification and denitrification system for ammonium-rich wastewater treatment. Internat. Biodet. Biodeg. 2018, 133, 202–209. [Google Scholar] [CrossRef]
- Skoyles, A.; Chaganti, S.R.; Mundle, S.O.C.; Weisener, C.G. Nitrification kinetics and microbial community dynamics of attached biofilm in wastewater treatment. Water Sci. Technol. 2020, 81, 891–905. [Google Scholar] [CrossRef]
- Li, X.; Lu, M.Y.; Huang, Y.; Yuan, Y.; Yuan, Y. Influence of seasonal temperature change on autotrophic nitrogen removal for mature landfill leachate treatment with high-ammonia by partial nitrification-Anammox process. J. Environ. Sci. 2021, 102, 291–300. [Google Scholar] [CrossRef]
- Hosseinlou, D. Determination of design loading rates for simultaneous anaerobic oxidation/partial nitrification–denitrification process and application in treating dairy industry effluent. J. Environ. Chem. Eng. 2021, 9, 105176. [Google Scholar] [CrossRef]
- Palmer, S.; Noone, G.; Hoyland, G. A review of physical relationships between form and function in wastewater biotreatment and a new theory relating activated sludge and biofilm systems behaviour. Water Environ. J. Prom. Sust. Sol. 2021, 35, 148–157. [Google Scholar]
- Van den Broeck, R.M.R.; Van Impe, J.F.M.; Smets, I.Y.M. Assessment of activated sludge stability in lab-scale experiments. J. Biotechnol. 2009, 141, 147–154. [Google Scholar] [CrossRef] [PubMed]
- Yang, Q.; Yang, T.; Shi, Y.; Xin, Y.; Zhang, L.; Gu, Z.; Li, Y.; Ding, Z.; Shi, G. The nitrogen removal characterization of a cold-adapted bacterium: Bacillus simplex H-b. Bioresour. Technol. 2020, 323, 124554. [Google Scholar] [CrossRef] [PubMed]


| Technological Parameter | Value |
|---|---|
| pH | 7.0–7.6 |
| DO (mg O2·dm−3) | 2–3 |
| Aeration time (h) | 4–5 |
| MLVSS (mg·dm−3) | 3500–4000 |
| Recirculation (% in relation to the incoming sewage) | 95 |
| Dry mass of activated sludge (%) | 1.64 |
| COD (mg O2·dm−3) | 251–393 |
| BOD5 (mg O2·dm−3) | 150–280 |
| Conical Flasks Content | Flask Number | |||||||||||||
|---|---|---|---|---|---|---|---|---|---|---|---|---|---|---|
| 1 | 2 | 3 | 4 | 5 | 6 | 7 | 8 | 9 | 10 | 11 | 12 | 13 | 14 | |
| Activated sludge (cm3) | 125 | 125 | 125 | 125 | 125 | 125 | 125 | 125 | 125 | 125 | 125 | 125 | 125 | 125 |
| NH4-N 140.00 mg·dm−3 | 125 | 125 | - | - | - | - | - | - | - | - | - | - | - | - |
| NH4-N 120.00 mg·dm−3 | - | - | 125 | 125 | - | - | - | - | - | - | - | - | - | - |
| NH4-N 100.00 mg·dm−3 | - | - | - | - | 125 | 125 | - | - | - | - | - | - | - | - |
| NH4-N 80.00 mg·dm−3 | - | - | - | - | - | - | 125 | 125 | - | - | - | - | - | - |
| NH4-N 70.00 mg·dm−3 | - | - | - | - | - | - | - | - | 125 | 125 | - | - | - | - |
| NH4-N 60.00 mg·dm−3 | - | - | - | - | - | - | - | - | - | - | 125 | 125 | - | - |
| NH4-N 50.00 mg·dm−3 | - | - | - | - | - | - | - | - | - | - | - | - | 125 | 125 |
| Nitrifiers (mg) | - | 0.25 | - | 0.25 | - | 0.25 | - | 0.25 | - | 0.25 | - | 0.25 | - | 0.25 |
| Total volume (cm3) | 250 | 250 | 250 | 250 | 250 | 250 | 250 | 250 | 250 | 250 | 250 | 250 | 250 | 250 |
| Sample 3 | Concentration of NH4-N (mg·dm−3) | Concentration of NO2-N (mg·dm−3) | Concentration of NO3-N (mg·dm−3) | |||||
|---|---|---|---|---|---|---|---|---|
| before Aeration | after 4 h of Aeration | Removal NH4-N (%) | before Aeration | after 4 h of Aeration | before Aeration | after 4 h of Aeration | Increase in NO3-N Production Due to Added Nitrifying Cultures (mg·dm−3) | |
| sewage 1 | 140.00 | 138.64b * | 0.97 | 0.00 | 0.012a | 0.00 | 0.32a | |
| sewage 2 | 140.00 | 137.78b | 1.59 | 0.00 | 0.017a | 0.00 | 0.56a | 0.24 |
| sewage 1 | 120.00 | 119.39b | 0.50 | 0.00 | 0.010a | 0.00 | 0.36a | |
| sewage 2 | 120.00 | 117.83b | 1.80 | 0.00 | 0.021a | 0.00 | 0.71a | 0.35 |
| sewage 1 | 100.00 | 99.11b | 0.89 | 0.00 | 0.013a | 0.00 | 0.68a | |
| sewage 2 | 100.00 | 97.63b | 2.37 | 0.00 | 0.018a | 0.00 | 0.96a | 0.28 |
| sewage 1 | 80.00 | 76.16b | 4.80 | 0.00 | 1.260a | 0.00 | 0.86a | |
| sewage 2 | 80.00 | 73.26b | 8.40 | 0.00 | 3.780a | 0.00 | 1.13a | 0.27 |
| sewage 1 | 70.00 | 65.50b | 6.40 | 0.00 | 1.730a | 0.00 | 0.99a | |
| sewage 2 | 70.00 | 62.30b | 11.00 | 0.00 | 4.260a | 0.00 | 1.28a | 0.29 |
| sewage 1 | 60.00 | 45.19b | 24.68 | 0.00 | 0.063a | 0.00 | 4.29a | |
| sewage 2 | 60.00 | 31.24a | 47.03 | 0.00 | 0.017a | 0.00 | 9.36a | 5.07 |
| sewage 1 | 50.00 | 30.11b | 39.78 | 0.00 | 0.071a | 0.00 | 15.90a | |
| sewage 2 | 50.00 | 20.29a | 59.42 | 0.00 | 0.000a | 0.00 | 21.65a | 5.75 |
| Experiment Time (h) | Concentration (mg·dm−3) 1 | |||
|---|---|---|---|---|
| NH4-N | Removal NH4-N (%) | NO3-N | Increase in NO3-N Production (mg·dm−3) | |
| 0 | 70.00a * | - | 0.00a | - |
| 1 | 68.72a | 1.83 | 0.01a | - |
| 2 | 65.24a | 6.80 | 0.12a | 0.11 |
| 3 | 64.12a | 8.40 | 0.06a | 0.50 |
| 4 | 62.76a | 10.34 | 1.02a | 1.01 |
| 5 | 64.24a | 8.23 | 1.01a | 1.00 |
| 6 | 65.18a | 6.89 | 0.93a | 0.92 |
| 7 | 67.23a | 3.96 | 1.11a | 1.10 |
| 8 | 65.74a | 6.09 | 1.13a | 1.12 |
| Experiment Time (h) | Concentration (mg·dm−3) 1 | |||
|---|---|---|---|---|
| NH4-N | Removal NH4-N (%) | NO3-N | Increase in NO3-N Production (mg·dm−3) | |
| 0 | 60.00b * | - | 0.00a | - |
| 1 | 43.12a | 28.13 | 9.48b | - |
| 2 | 48.16a | 19.73 | 10.90b | 1.42 |
| 3 | 52.64ab | 12.27 | 11.92b | 2.44 |
| 4 | 49.46a | 17.57 | 12.63b | 3.15 |
| 5 | 47.20a | 21.33 | 11.51b | 2.03 |
| 6 | 45.13a | 24.78 | 12.14b | 2.66 |
| 7 | 47.23a | 21.28 | 10.09b | 0.61 |
| 8 | 46.11a | 23.15 | 11.29b | 1.81 |
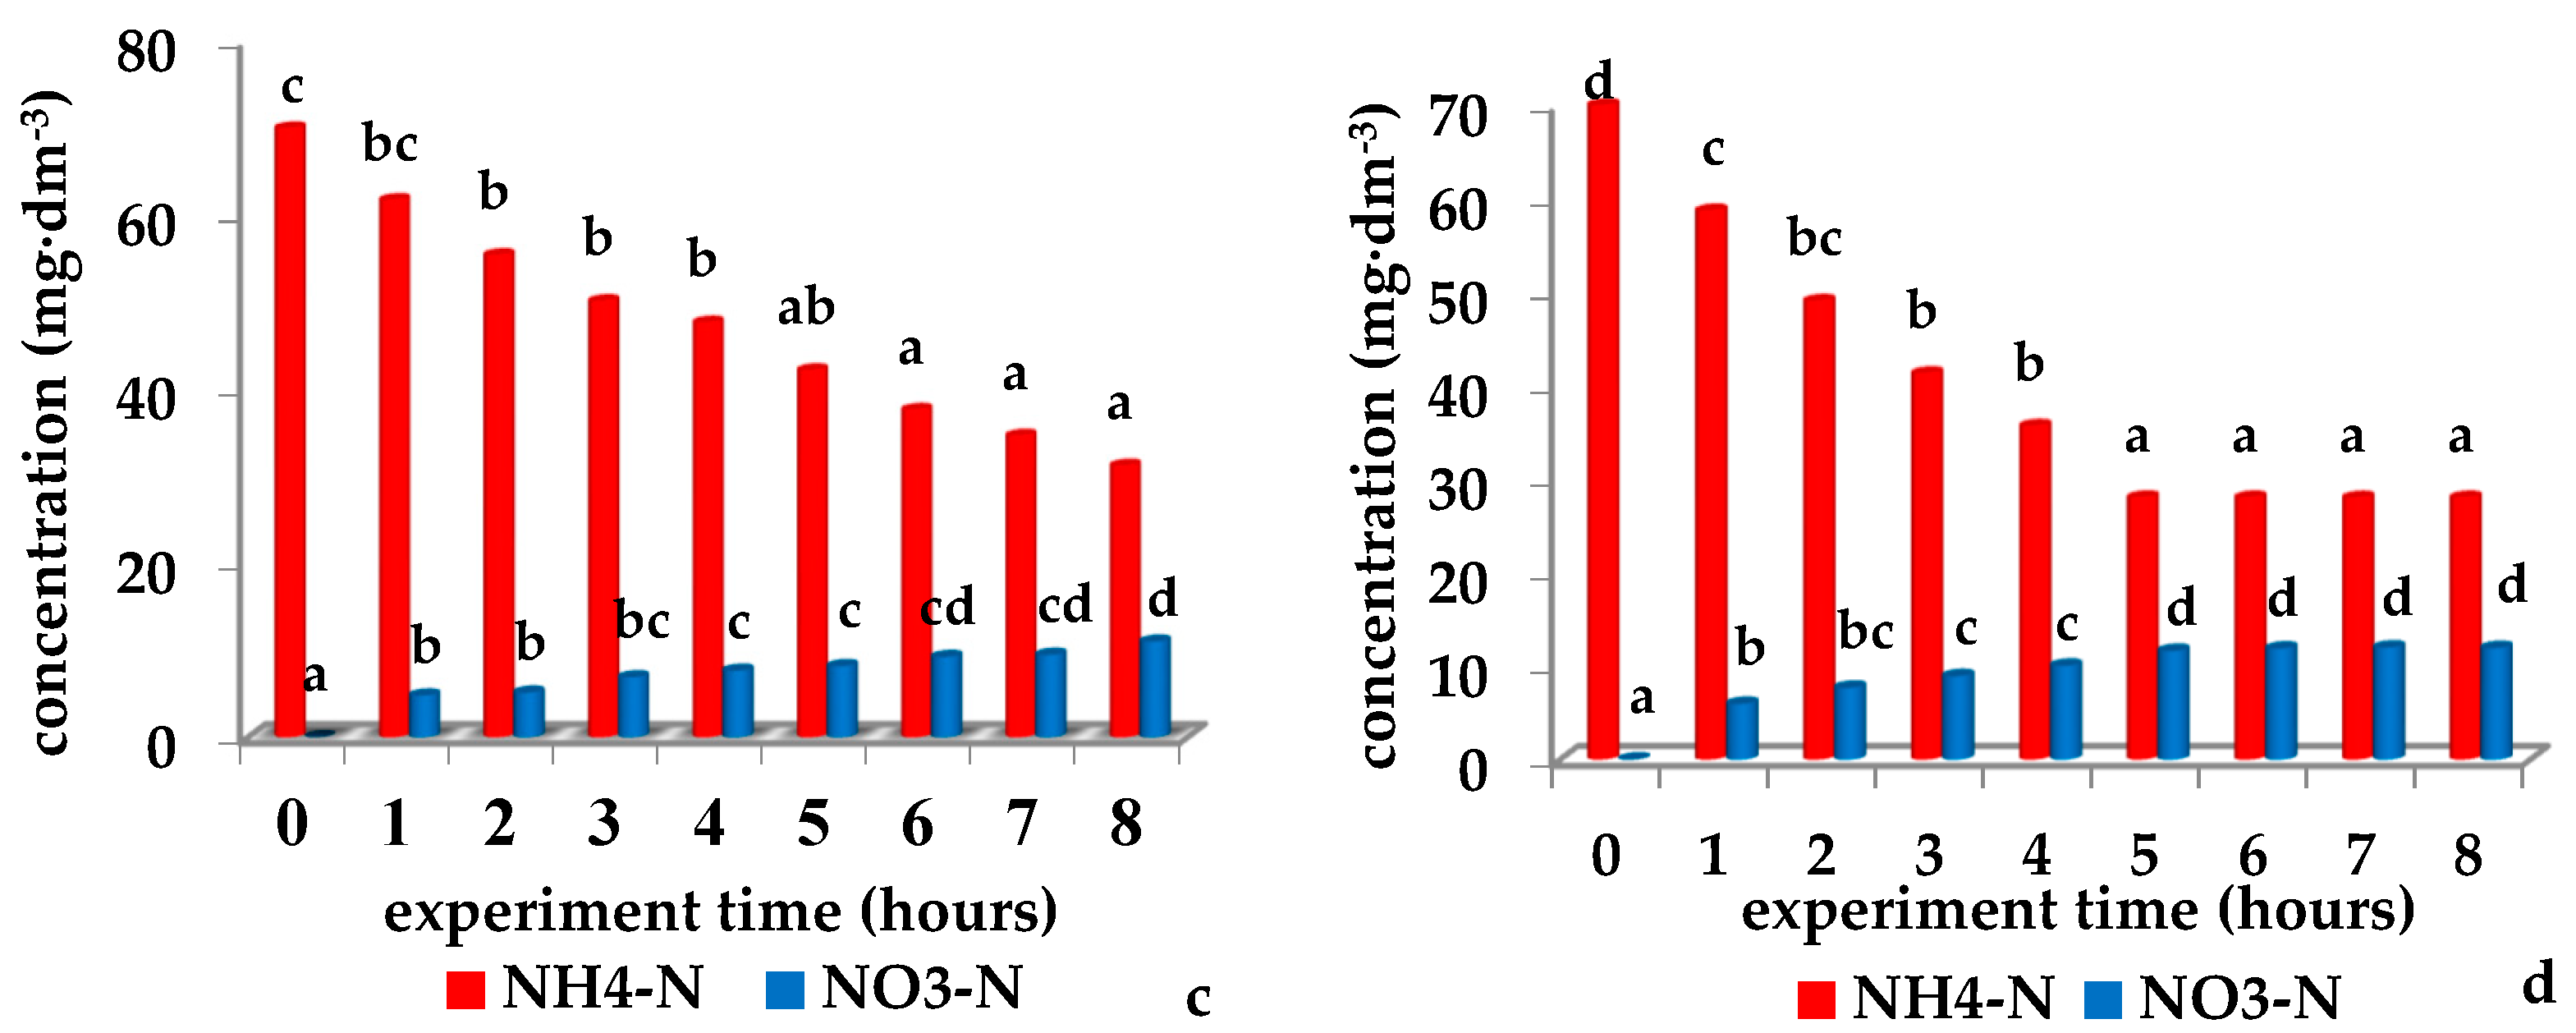
| Experiment Time (h) | Concentration (mg·dm−3) 1 | |||
|---|---|---|---|---|
| NH4-N | Removal NH4-N (%) | NO3-N | Increase in NO3-N Production (mg·dm−3) | |
| 0 | 50.00b * | - | 0.00a | - |
| 1 | 29.83a | 40.34 | 9.65b | - |
| 2 | 36.94a | 26.12 | 12.93b | 3.28 |
| 3 | 39.12ab | 21.76 | 14.06b | 4.41 |
| 4 | 35.79a | 28,42 | 12.11b | 2.46 |
| 5 | 26.11a | 47.78 | 13.62b | 3.97 |
| 6 | 29.16a | 41.68 | 15.91b | 6.26 |
| 7 | 28.14a | 43.74 | 14.26b | 4.61 |
| 8 | 28.95a | 42.10 | 15.08b | 5.43 |
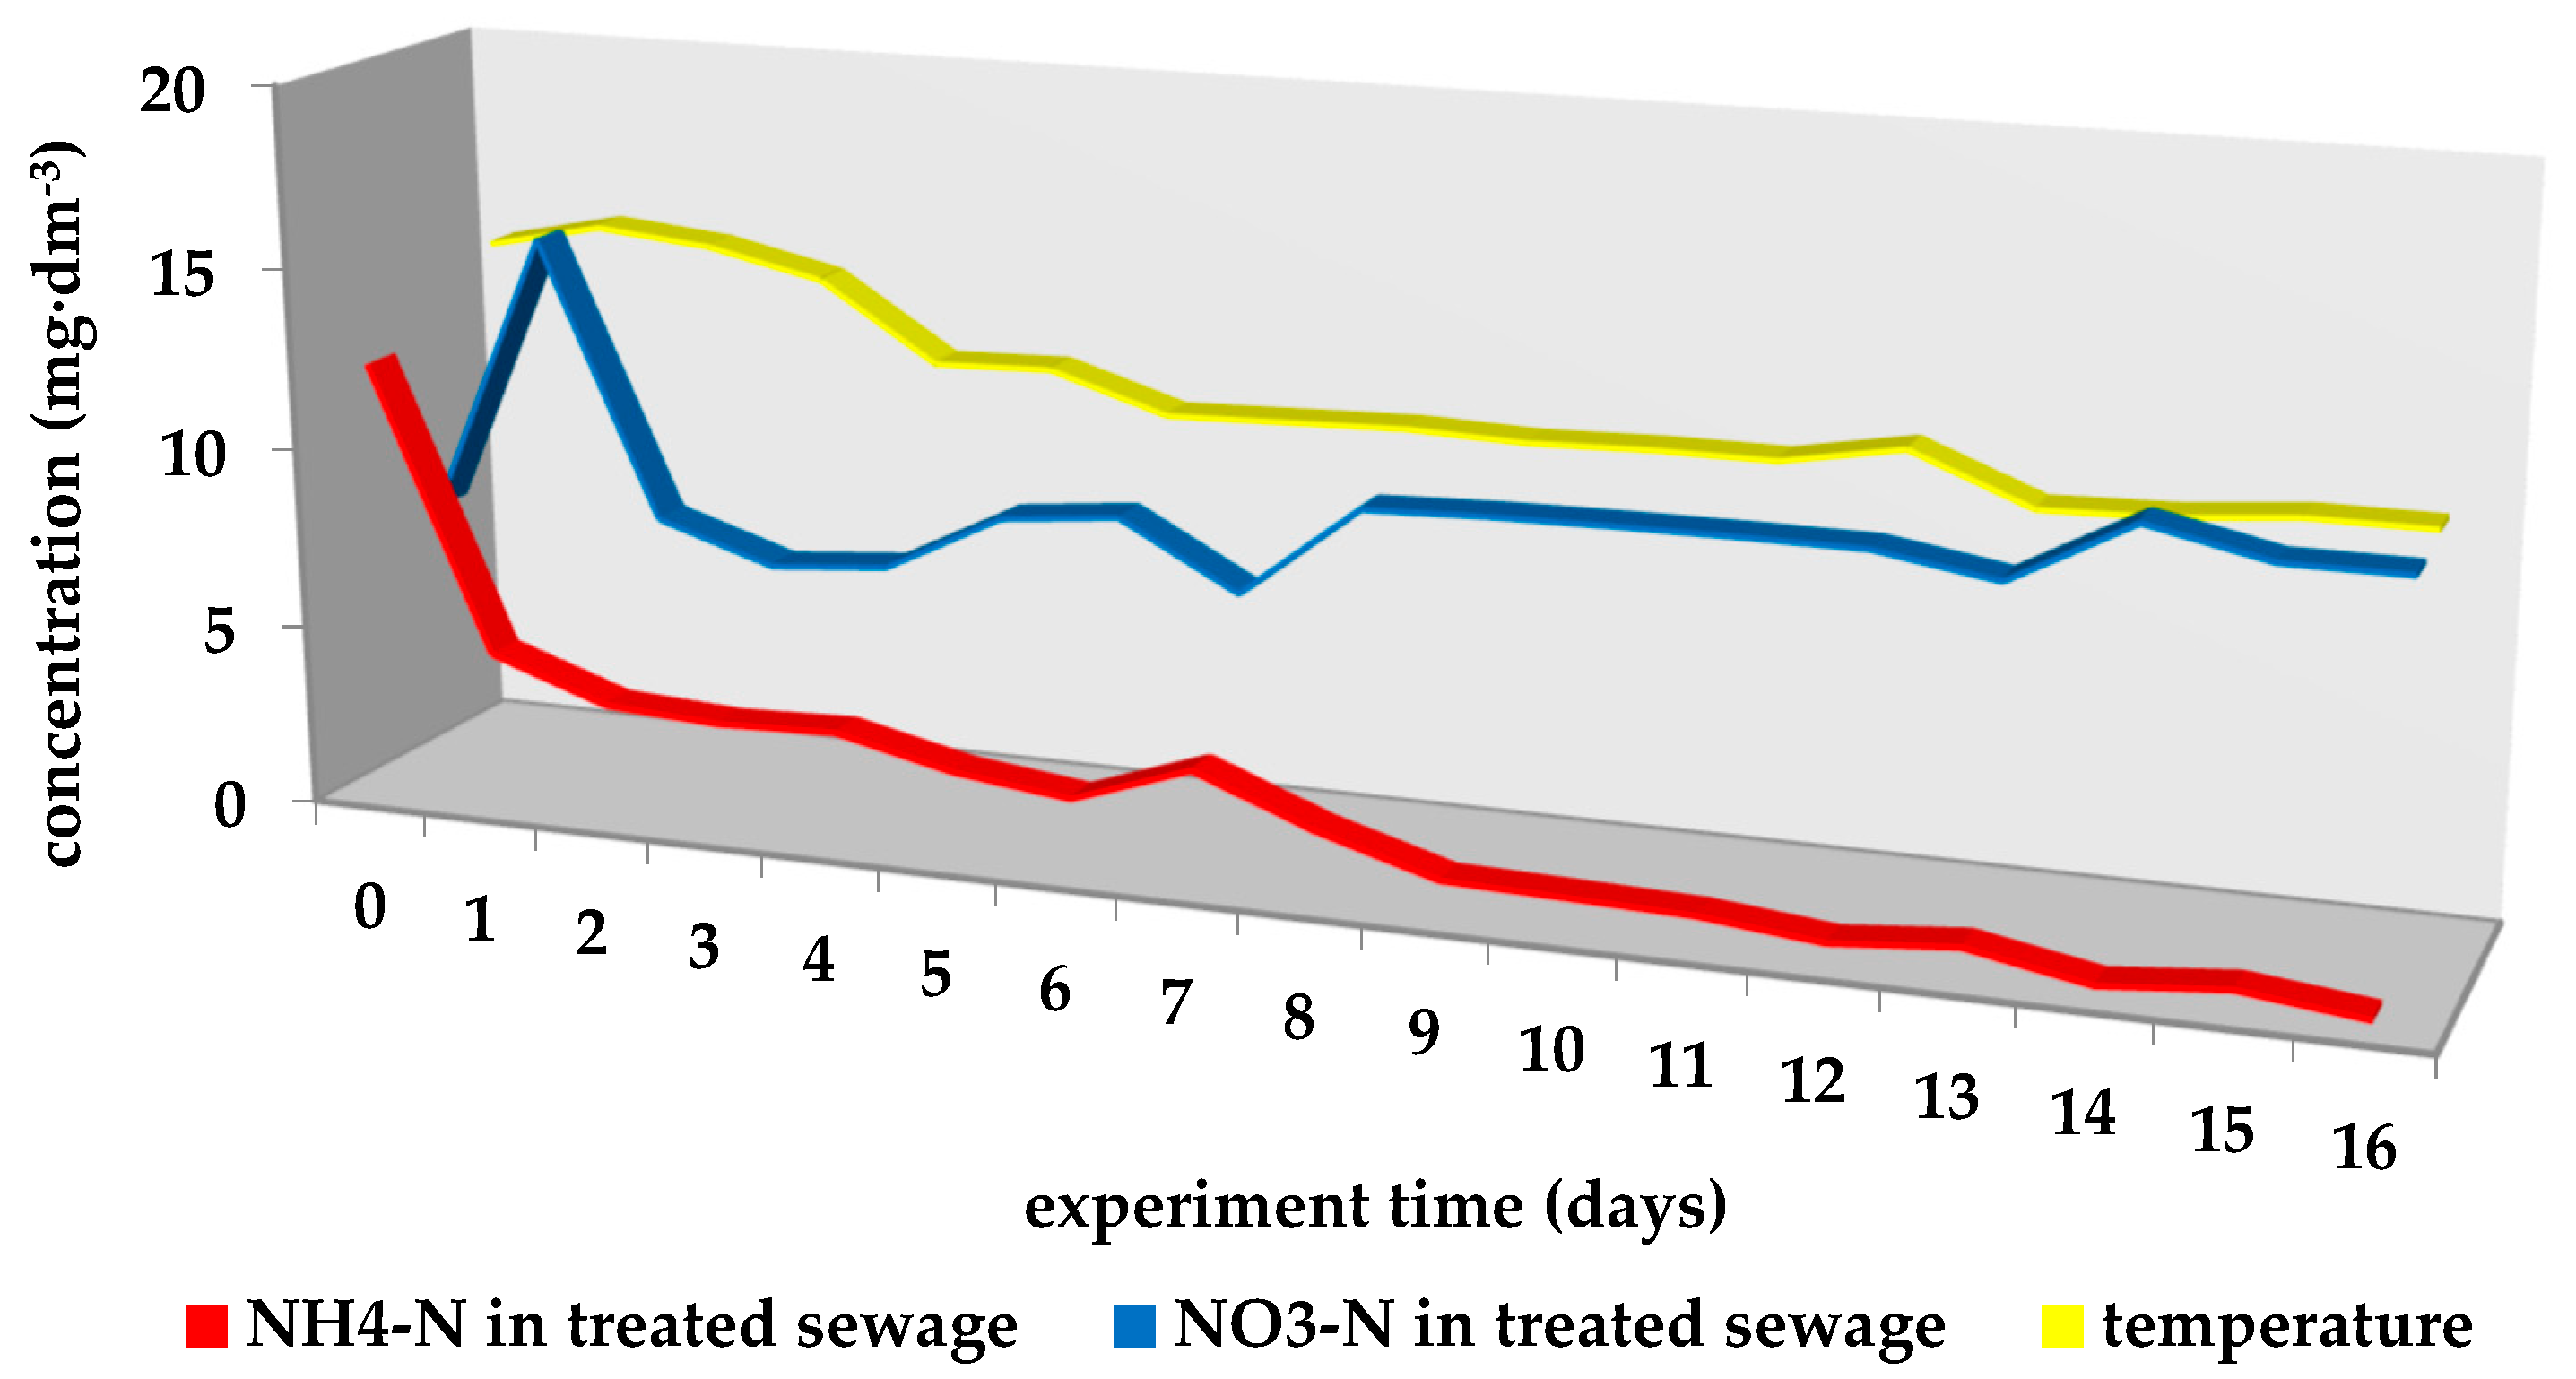
| Experiment Time (Days) | Wastewater Temperature (°C) | Concentration (mg·dm−3) | Concentration (mg·dm−3) | |
|---|---|---|---|---|
| Inflowing Sewage | Treated Sewage | |||
| NH4-N | NH4-N | NO3-N | ||
| 0 | 14.3 | 32.30 | 12.30e * | 7.57a |
| 1 | 15.0 | 32.30 | 4.44d | 15.30d |
| 2 | 14.7 | 32.30 | 3.33c | 7.73a |
| 3 | 14.0 | 34.20 | 3.15bc | 6.70a |
| 4 | 11.9 | 34.20 | 3.27bc | 6.98a |
| 5 | 12.0 | 34.20 | 2.54b | 8.65ab |
| 6 | 11.0 | 27.70 | 2.16b | 8.99b |
| 7 | 11.1 | 27.70 | 3.31c | 7.21a |
| 8 | 11.2 | 37.50 | 2.04b | 9.82b |
| 9 | 11.1 | 37.50 | 1.08a | 9.94b |
| 10 | 11.2 | 37.50 | 1.01a | 9.99b |
| 11 | 11.2 | 31.60 | 0.93a | 10.01b |
| 12 | 11.8 | 31.60 | 0.61a | 10.00b |
| 13 | 10.5 | 31.60 | 0.92a | 9.48b |
| 14 | 10.6 | 28.80 | 0.32a | 11.30 |
| 15 | 10.3 | 28.80 | 0.64a | 10.60c |
| 16 | 10.9 | 28.80 | 0.28a | 10.60bc |
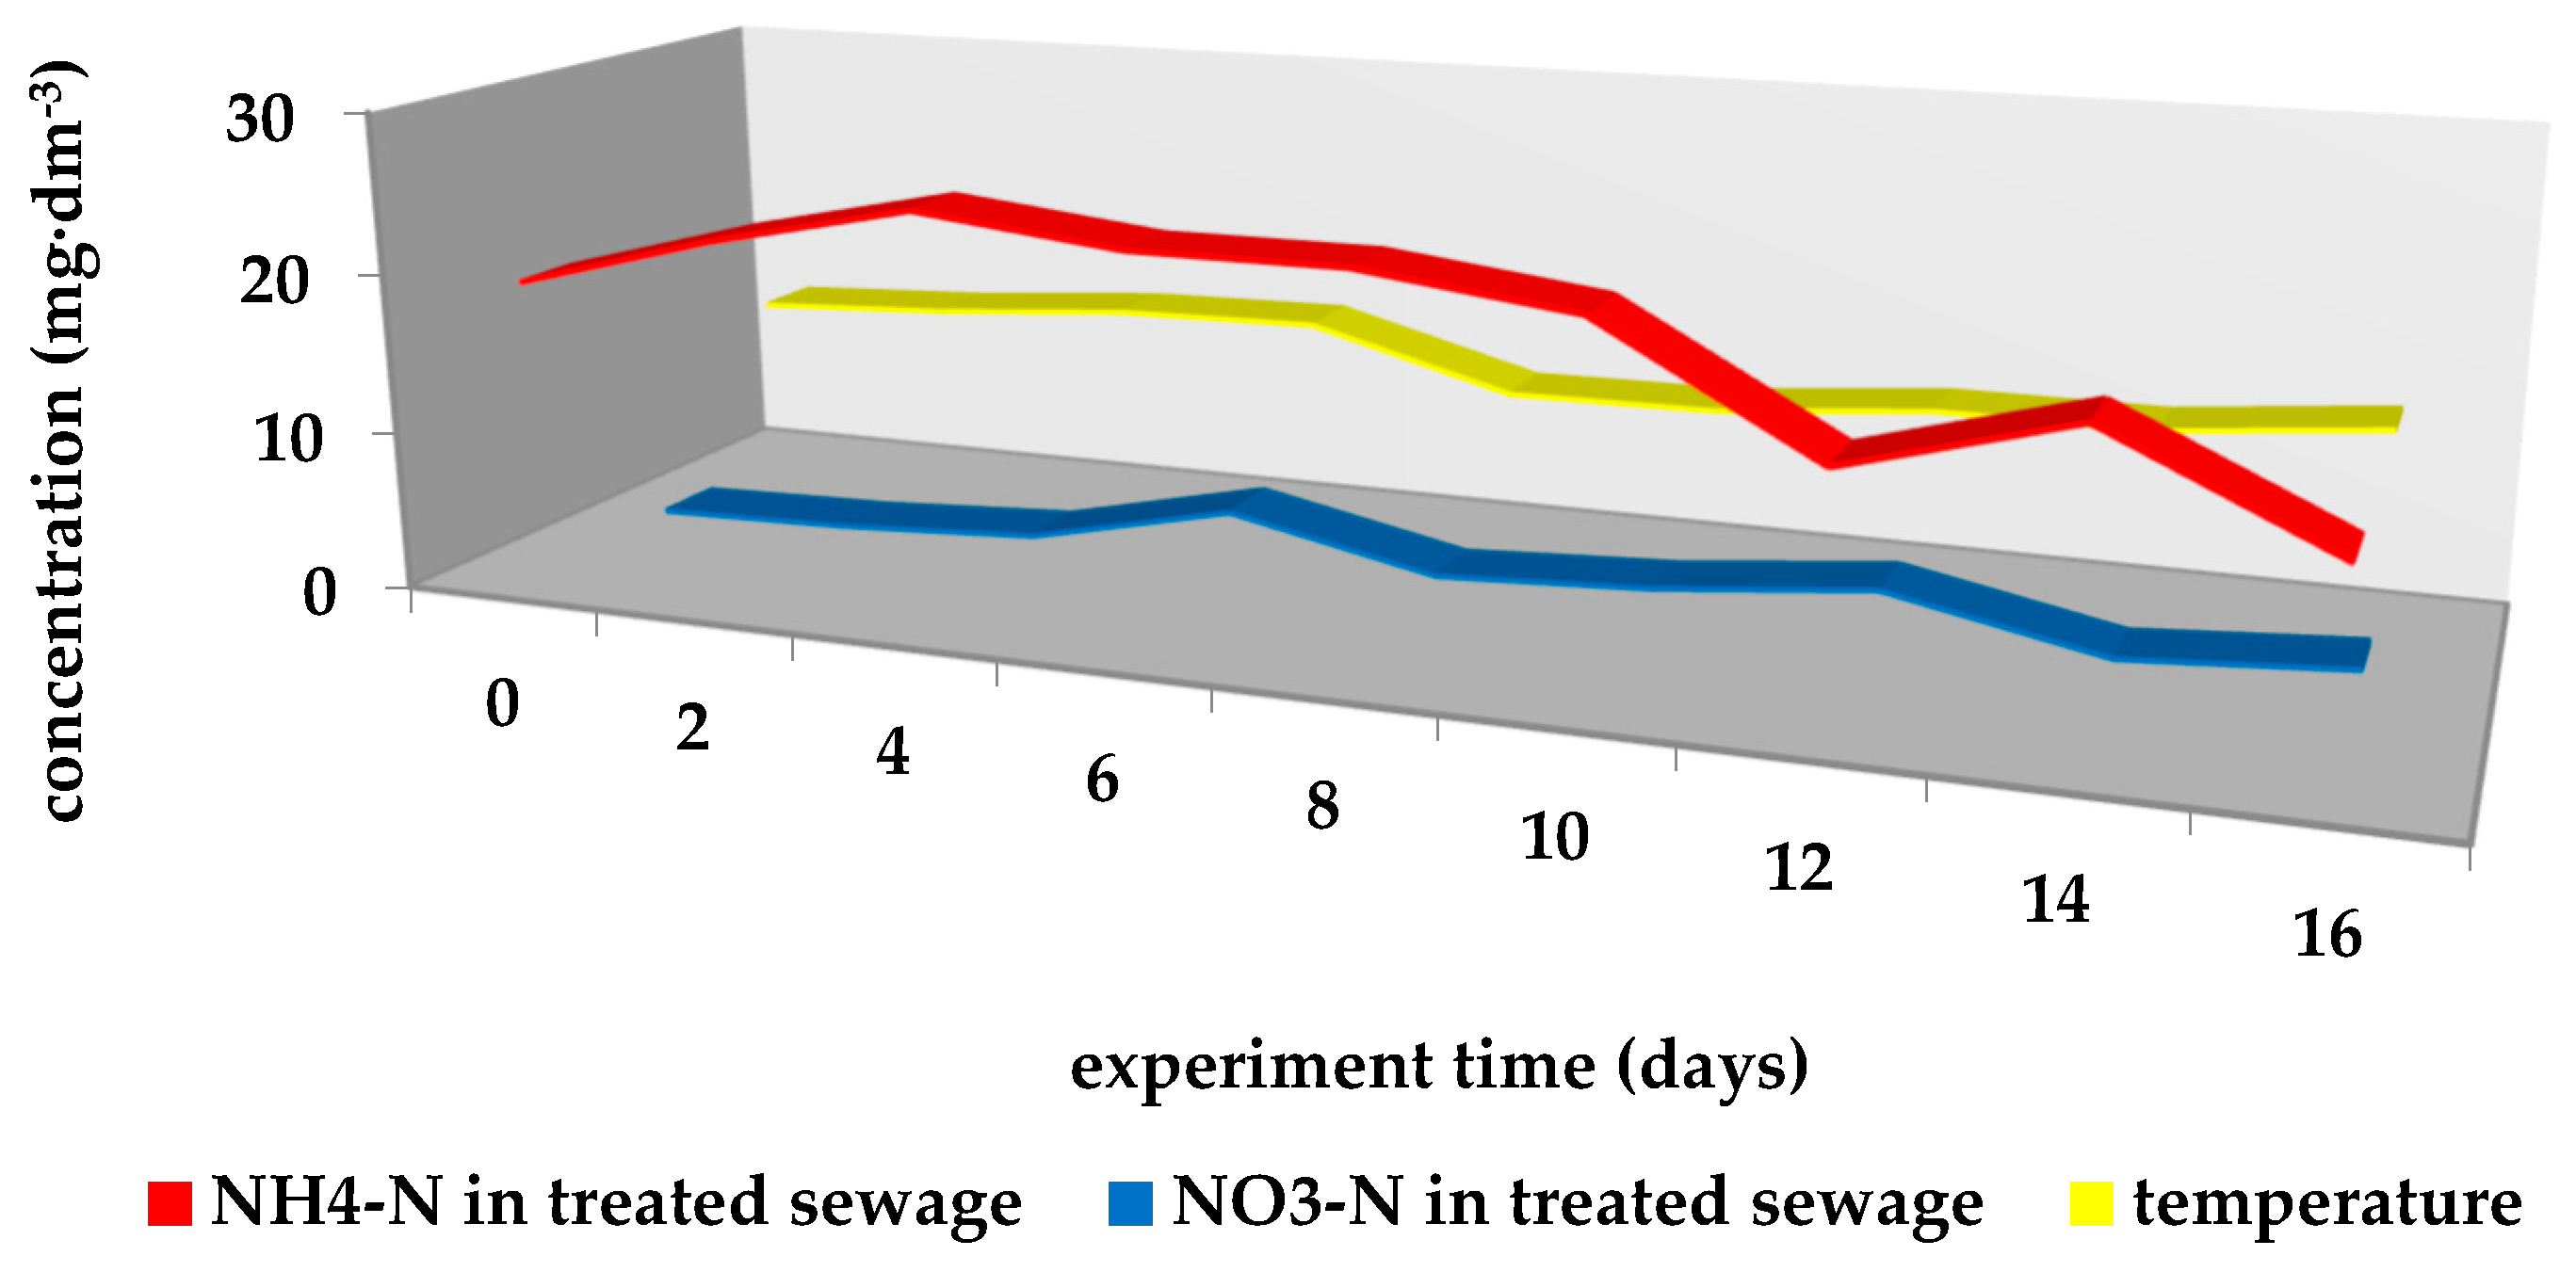
| Experiment Time (days) | Wastewater Temperature (°C) | Concentration (mg·dm−3) | Concentration (mg·dm−3) | |
|---|---|---|---|---|
| Inflowing Sewage | Treated Sewage | |||
| NH4-N | NH4-N | NO3-N | ||
| 0 | 12.0 | 28.90 | 19.20c * | 0.74a |
| 2 | 12.6 | 29.60 | 22.70d | 1.07a |
| 4 | 13.6 | 29.20 | 25.50e | 1.81b |
| 6 | 13.8 | 28.80 | 24.10e | 4.76c |
| 8 | 10.3 | 41.60 | 24.10e | 2.08b |
| 10 | 10.4 | 28.80 | 22.50d | 2.77b |
| 12 | 11.6 | 26.30 | 15.20b | 4.17c |
| 14 | 11.6 | 23.90 | 18.90c | 1.57a |
| 16 | 12.9 | 33.80 | 12.74a | 2.53b |
Publisher’s Note: MDPI stays neutral with regard to jurisdictional claims in published maps and institutional affiliations. |
© 2021 by the authors. Licensee MDPI, Basel, Switzerland. This article is an open access article distributed under the terms and conditions of the Creative Commons Attribution (CC BY) license (https://creativecommons.org/licenses/by/4.0/).
Share and Cite
Paśmionka, I.B.; Bulski, K.; Herbut, P.; Boligłowa, E.; Vieira, F.M.C.; Bonassa, G.; Bortoli, M.; Prá, M.C.d. Toxic Effect of Ammonium Nitrogen on the Nitrification Process and Acclimatisation of Nitrifying Bacteria to High Concentrations of NH4-N in Wastewater. Energies 2021, 14, 5329. https://0-doi-org.brum.beds.ac.uk/10.3390/en14175329
Paśmionka IB, Bulski K, Herbut P, Boligłowa E, Vieira FMC, Bonassa G, Bortoli M, Prá MCd. Toxic Effect of Ammonium Nitrogen on the Nitrification Process and Acclimatisation of Nitrifying Bacteria to High Concentrations of NH4-N in Wastewater. Energies. 2021; 14(17):5329. https://0-doi-org.brum.beds.ac.uk/10.3390/en14175329
Chicago/Turabian StylePaśmionka, Iwona Beata, Karol Bulski, Piotr Herbut, Elżbieta Boligłowa, Frederico Márcio C. Vieira, Gabriela Bonassa, Marcelo Bortoli, and Marina Celant de Prá. 2021. "Toxic Effect of Ammonium Nitrogen on the Nitrification Process and Acclimatisation of Nitrifying Bacteria to High Concentrations of NH4-N in Wastewater" Energies 14, no. 17: 5329. https://0-doi-org.brum.beds.ac.uk/10.3390/en14175329