1. Introduction
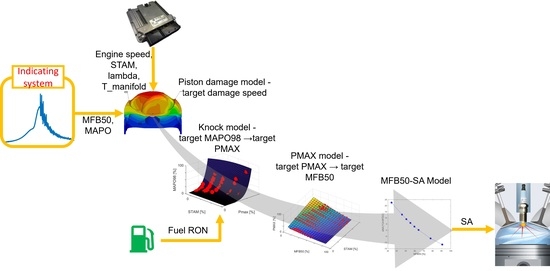
In this paper, the combustion controller described in the Part 1 is further developed and validated. Such controller can be considered as a significant step in combustion management, because of the definition of a target value of Maximum Amplitude of Pressure Oscillations (MAPO) deriving from the estimation of the piston damage admissible in a certain amount of time and the model-based open-loop chain, that allows to accurately manage the combustion phase cycle-by-cycle even under transient conditions. In this way, the knock intensity threshold is defined as a tangible piston damage index and, outside the range of the knock-limited engine operating conditions, the control algorithm keeps the combustion phase close to the maximum efficiency value, integrating knock and combustion control in a single algorithm.
With the knock control strategy described in this work, the authors are proposing a solution for the following issues that characterize standard knock control strategies:
The definition of a threshold for the statistical knock indexes that are defined independently from the consequences induced by knocking events
The implementation of closed-loop controllers that are unsuitable to control an extremely variable engine parameter, such as a high knock intensity percentile, especially when the engine is operated under fast transient conditions.
In the Part 1 of the whole activity a robust and accurate open-loop controller is developed and validated, and the main implemented models are described, including the control-oriented piston damage model [
1] and the analytical knock model [
2]. Other important models introduced in the open-loop controller are the analytical maximum in-cylinder pressure (Pmax) and 50% of mass of fuel burned (MFB50) ones, described by the authors in [
3]. Knock and Pmax models are further validated in this work through the comparison of the model coefficients calibrated for two different Spark Ignition (SI) engines. Moreover, the reversed analytical knock model and the MFB50 ones are further developed implementing two adaptive strategies to automatically learn the fuel RON of vehicle tank and the parabolic relationship between MFB50 and Spark Advance (SA) for a certain engine point. Indeed, such quantities were calibrated and kept fixed with the previous open-loop controller. The self-learning strategies developed by the authors guarantee an always up-to-date fuel RON value and MFB50-SA functions. Nevertheless, such algorithms need the cycle-by-cycle value of knock intensity (instantaneous MAPO) and combustion phase (instantaneous MFB50), such as the closed-loop chain, that reacts only when the damage speed overcomes a safety threshold. Indeed, as discussed in the Part 1, a pure open-loop controller cannot include the effects of unpredictable events, such as the engine or exhaust system aging or extreme environmental conditions, on the calculation of cyclic MAPO and MFB50. For such reason, the adaptive strategies and a protective Proportional Integral (PI) controller are introduced in this paper. Hence, the proposed control strategy needs an on-board system for the knock intensity and the combustion phase estimation.
Nowadays, the need of an on-board indicating system or a solution for the calculation of both the knock intensity and the combustion phase indexes has not been considered as a restrictive limitation. Indeed, recent anti-pollution policies are forcing the engine manufacturers to develop new solutions to control innovative combustion processes, such as the latest applications of Low Temperature Combustion and those that involve novel types of fuel [
4,
5,
6]. Such systems are often affected by poor combustion stability and the risk of both knock or misfire imposes the in-cylinder pressure sensing. Several solutions are available in literature. For instance, the accelerometer is considered as a viable solution not only for knock intensity estimation, but also for the MFB50 calculation [
7,
8]. The ionization current is a valid and robust technology for the in-cylinder pressure signal estimation [
9]. A third method is that based on the acoustic emissions that can be measured with microphones [
10,
11,
12]. Finally, some low-cost force transducers have been developed for the in-cylinder pressure sensing. Using piezoelectric materials, the forces acting on the engine head may be partially related to the pressure of the gases inside the cylinder. Thus, instrumenting the head stud bolt [
13] or using a piezoelectric spark plug washer and acquiring at high frequency the electric output signal, the in-cylinder pressure variation can be estimated. Alma Automotive recently developed a piezoelectric spark plug washer that achieved very promising results [
14].
These considerations about the in-cylinder pressure sensing techniques for the on-board applications legitimize the development of accurate and reliable combustion control strategies based on the availability of some combustion indexes, that until a few years ago were available only at the test bench. Moreover, some cheap and reliable piezoelectric sensors for the on-board installation are coming to the market, even if main features of these technologies will be published once they are patented.
With the knock control strategy proposed in this work, the authors are thus proposing a solution for both issues listed above:
The target value of the MAPO percentile derives from the piston damage admissible in a certain amount of time (i.e., a target piston damage speed) and this means it is defined according with the concrete relationship between knock intensity and the induced damage. The Pmax and MFB50 model convert that value into a target combustion angular phase
The open loop chain allows to achieve the target MFB50 calculating the SA needed just before each cycle. The controller is thought to be cycle-resolved, and this makes such algorithm suitable to accurately manage the combustion phase cycle-by-cycle even under transient conditions.
As mentioned above, outside the engine knock-limited operating field, the MFB50 model continues to calculate the SA that keeps the combustion phase close to the target value. This condition can be easily identified by calibrating a saturation value equal to the Maximum Brake Torque (MBT) combustion phase. When the target MFB50 (the value that guarantees the target piston damage speed) is lower than such calibrated value, the MBT combustion phase becomes the current target. Moreover, the adaptive strategies update the coefficients of knock and MFB50 models, using measured combustion indexes. The novelty of this work is thus the development and validation of adaptive strategies for the real-time updating of the fuel RON and the analytical relationship between MFB50 and ΔSA.
In the first part of this paper, the experimental setup and the database used for the controller calibration and validation are described. The complete combustion controller is described in detail, showing the models’ mathematical reformulations needed for their coupling with the self-learning strategies. The controller is then implemented in a Rapid Control Prototyping (RCP) device, and it is validated online at the engine test bench. Tests are specifically designed to demonstrate the robustness and the accuracy of the novel adaptive strategies.
2. Experimental Setup
The model calibration is carried out both on an 8-cylinder and a 4-cylinder Gasoline Direct Injection (GDI), Turbo-Charged (TC) production engine, equipped with a piezoelectric pressure transducer for each cylinder. While the former is a high-performance engine, the latter is equipping a standard passenger car. The comparison of the calibrated coefficients for both engines confirms the robustness of the described modeling approach for the definition of accurate and reliable control-oriented combustion models. The controller validation is instead performed on the 8-cylinder engine only, for which the controller was developed. Such engine is the same considered in the Part 1 of this work, and the complete combustion controller is finally implemented on an RCP machine connected to the Engine Control Unit (ECU) of the 8-cylinder engine. On the other hand, the 4-cylinder engine is used to further validate the knock and Pmax models, but it is not used as an application for the damage model and the complete combustion controller. A description of the variables and the time needed to recalibrate such models for a different engine is provided in the Part 1 of this activity, but all the models included in the control strategy can be ported even on the 4-cylinder engine without modifying their formulation. The main characteristics of the 8-cylinder and the 4-cylinder engine are reported in
Table 1 and
Table 2, respectively, while the layout of the development network used to test the complete controller via RCP is shown in
Figure 1. The combustion chamber layout of both engines has a center-mounted spark plug and a side-mounted in-chamber fuel injector. The indicating system is composed of CHAMPION charge amplifiers and OBI-M2 indicating system, both provided by Alma Automotive S.r.l. (Bologna, Italy), that are used for the signal conditioning and the data acquisition, respectively. Such system records the in-cylinder pressure signals at 200 kHz. The calculation of the MFB50, Indicated Mean Effective Pressure (IMEP) and Pmax combustion indexes uses the low-pass filtered pressure trace, while the same signal is windowed and band-pass filtered (the specific cut-off frequencies and the angular window cannot be disclosed for confidentiality reasons) to calculate MAPO. As in the previous paper (Part 1), the nomenclature “MAPO” indicates cyclic value of such index, while, if it refers to a percentile value, it is always specified or it appears as “MAPO98” (for the 98th percentile).
As mentioned above, the combustion controller is tested on a Real Time (RT) machine for RCP application that communicates with the ECU and the indicating system via the Controller Area Network (CAN) communication protocol. For each cylinder, the controller calculates SA corrections with respect to the mapped value for any engine operating point, and it receives the main parameters (such as the engine speed, load, target lambda, etc.) and the combustion indexes from the ECU and OBI-M2 system, respectively.
As for the open-loop combustion controller, the tests are specifically designed to verify the reliability and the accuracy of the novel adaptive strategies. Two different types of fuel (with different RON) and different spark advance maps are alternated to stress and validate the specific self-learning algorithms.
3. Adaptive Strategies
The model-based algorithm converts target damage speed into the MFB50 target through the implementation of the analytical knock and Pmax models. The calibrated analytical MFB50 model calculates the ΔSA to reach the target combustion phase. The analytical knock model [
2] includes the influence of the fuel RON for the accurate estimation of the engine knock tendency. In the pure open-loop controller described in the first part of this activity, the fuel RON is manually set by the operator at the test cell. Moreover, the same MFB50 and knock model are used to provide the cyclic values of MAPO and the combustion phase to the control strategy.
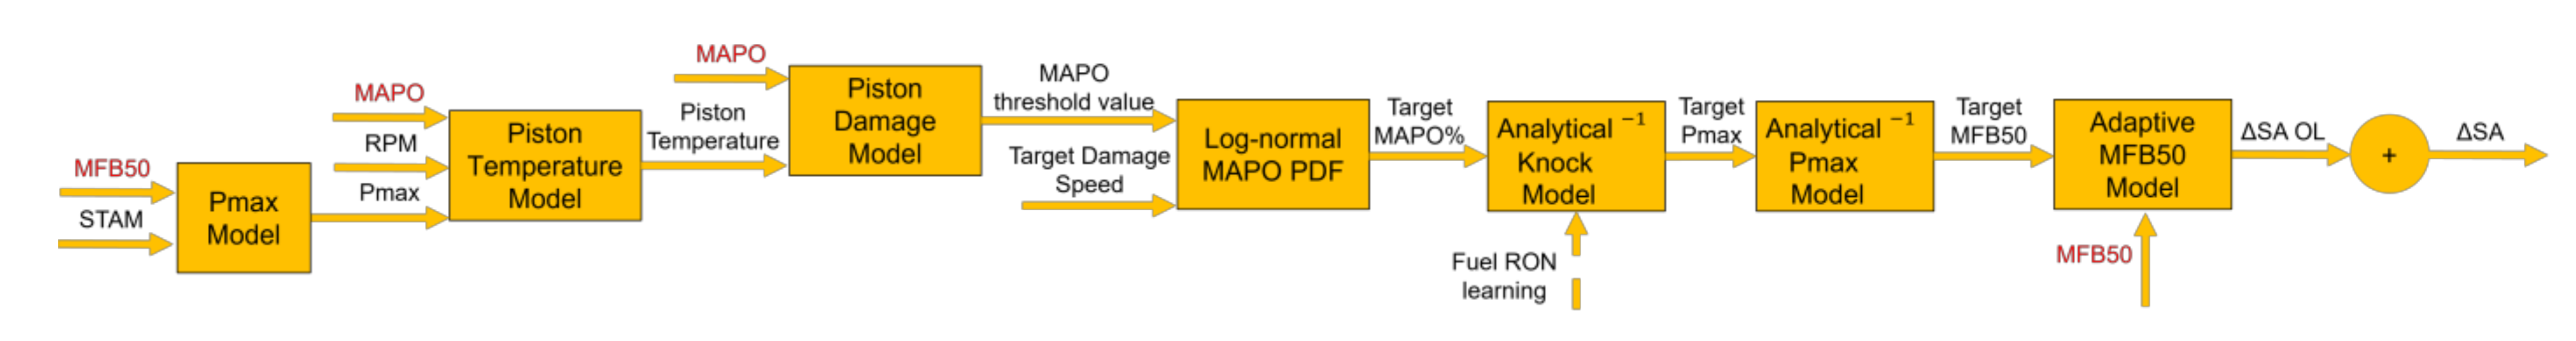
Considering the availability of an on-board system for the MAPO and MFB50 estimation, the previous algorithm can be modified replacing the MFB50 and knock models with the measured indexes to automatically learn the fuel RON and update the mathematical relationship between the MFB50 and the ΔSA, for each operating condition. The pure open-loop scheme evolves into that shown in
Figure 2: the text in red highlights the indexes that come from the on-board indicating system and that, during this activity, are provided by OBI-M2. Such block scheme anticipates the resulting open-loop chain, defining the focus of this work (i.e., self-learning strategies and the PI controller). The engine load is expressed as the Stoichiometric Trapped Air Mass (STAM).
The piston temperature [
15,
16] and the damage models [
17,
18] are discussed in detail in the previous works of the authors, and in the Part 1 of the present work. Instead, the Part 2 focuses on the development and the validation of the self-learning strategies. In this section the analytical knock intensity, Pmax and MFB50 model are briefly described, highlighting those features that have been further developed for implementing the adaptive algorithms. Moreover, the reliability of the analytical approach is demonstrated by collecting the equation coefficients that result from the calibration for two different engines. The novel algorithms are implemented in the final controller, to account for variables that can change during the vehicle use and that cannot be predicted during the calibration process, such as the fuel quality. The analytical formulation of main models is the key feature that allows to directly update some model parameters by solving a simple equation, deduced by reversing the model function. In this way, the adaptive strategies were easily implemented in the control algorithm.
3.1. Analytical Knock Model Validation and Fuel RON Learning Strategy
The analytical knock model is used to convert the target MAPO98 into the corresponding mean Pmax [
2]. The choice of 98th percentile is arbitrary. However, it represents a good compromise between the numerical stability and the faithful representation of the highest instantaneous MAPO values.
Figure 3 shows the surfaces that derive from the model equation for the reference operating conditions for both the engines (
Figure 3a for the 8-cylinder engine and
Figure 3b for the 4-cylinder engine), while
Table 3 shows the numerical values of the model coefficients.
The final formulation presented in the previous paper is reported by Equation (1), that shows the analytical equation of the model for a standard GDI, TC engine:
where:
is the MAPO percentile that has to be calculated
STAM is the Stoichiometric Trapped Air Mass, which is equal to the trapped air mass (TAM) per cycle per cylinder when the mixture is stoichiometric or rich, and the ratio between TAM and lambda when the mixture is lean
a, b, c, and d are the four calibration parameters of the model that allow to define the MAPO98 for the reference conditions (reference lambda value and air temperature in the intake manifold);
represents the reference lambda value, with which the model coefficients (a, b, c, and d) have been calibrated. In this case it is equal to 1;
is the current lambda value;
is the lambda multiplier, the calibratable coefficient that converts the lambda numerical difference into a ΔPmax;
is the current air temperature in the intake manifold;
is the reference temperature in the intake manifold. In this case it is equal to 40 °C;
is the intake air temperature multiplier, a calibratable coefficient that converts the temperature numerical difference in a ΔPmax;
RONref is the reference fuel RON value, used during tests that generates the database with which the parameters a, b, c and d are identified;
RONfuel is the RON number of the current fuel;
RONm is the fuel RON multiplier, the calibratable coefficient that converts the RON numerical difference in a ΔPmax, as well as the ;
ESm is the Engine Speed Multiplier, and it includes the effect of the combustion noise as a function of the engine speed (RPM)
As described by the authors in detail in [
2], the effects on the knock intensity of the mixture enrichment, the cooling of the intake air temperature and the increasing fuel RON are modeled as an additive contribution to the Pmax value. The result can be seen as a mere translation of MAPO98 curve along the Pmax axis (
Figure 3). In other words, for fixed engine speed, load, and fuel, when the mixture is enriched, the intake air temperature is lower than the reference or the fuel RON is higher than the reference and the same Pmax is achieved with a lower MAPO98 value.
Equation (2) shows how to convert a target MAPO98 into a Pmax value and it is thus implemented in the block that includes the reversed analytical knock model:
In which MAPO98
tgt is the target value of MAPO98 determined by converting the target piston damage and the MAPO threshold into a MAPO PDF, and Pmax
tgt is the corresponding Pmax value, for any given operating condition. As discussed in Part 1, the target MAPO98 does not derive from a statistical calculation, but it is applied just as an index for the conversion of the MAPO threshold into a proper input for the reversed analytical knock model, that is used to convert the latter into a target Pmax value. The algebraic step that allows to achieve the desired model without requiring a new calibration process of the model parameters (
a,
b,
c,
d, ESm and so on) is a demonstration of the possibilities that derive from the analytical approach proposed by the authors. This means that once the main model parameters are determined, the analytical approach allows to use the model regardless of what are the independent variables and the output of the function. The native formulation of knock model provides the value of MAPO98 as the output [
2], while the implementation of the same model in the presented controller needs to have the Pmax as the dependent variable. If a map-based approach would have been used, a new calibration process would have been needed, when the relationship between STAM, Pmax and MAPO98 is reversed. Instead, the Equation (2) can be directly reversed and used to calculate one of the independent variables as the output of the model. Indeed, when the main independent variables of the knock model are stored, RON
fuel coefficient can be directly calculated by solving Equation (2).
The engine operating range is discretized into a speed-load grid, and all the points (defined as a combination of speed and load) are numbered. In this way, variables needed to univocally identify an engine operating condition are halved, due to the possibility to indicate the corresponding point number. The fuel RON self-learning algorithm is not applied to all the engine points. Indeed, data are stored only for the operating conditions characterized by the highest load values (the threshold is defined in terms of Pmax), hence avoiding the risk of assessing the fuel RON by including the combustion noise only. The self-learning algorithm can be summarized in the following steps.
MAPO index offset by the engine speed contribution (RPM*ESm) is stored in a 2-D matrix whose rows identify the enumerated engine point, and columns are the elements of a buffer (in this case 40) that is updated every cycle, following a First-In-First-Out logic. For each matrix row (i.e., engine point), it is then possible to calculate the MAPO98 net of engine speed effect (calculated with the term RPM*ESm). Thus, MAPO98
net for each row indicates the percentile value for any given operating conditions (given engine speed and load). Equation (3) defines MAPO98
net:
The Pmax index is offset by lambda and the intake air temperature contributions (
) and stored in a 1-D column vector, in which each row represents the engine point. In this case the mean value is considered, and each vector element is updated by computing the weighted average between the stored value and the new one and by giving a higher weight to the old number (such as a first order low-pass filter). After each cycle, the vector is updated and it contains the mean Pmax value for each engine point net of lambda and the intake air temperature contribution, indicated as Pmax
net:
The STAM values are stored in a column vector by applying the same method used for the Pmax ones. The RON
fuel parameter can be then calculated with Equation (5):
Pmaxnet, MAPO98net and STAM are upper marked to highlight that they are vector quantities. The calculated fuel RON is determined by solving a linear system of equations and the system degree is equal to the number of engine points. This means that the fuel RON value results as the best value for all the considered operating conditions characterized by high loads. It is important to highlight that the matrix of MAPO and the vector of Pmax contain the values for each engine point with which the operating field has been discretized. The index of each row represents an engine point number that identifies a couple of fixed engine speed and load (that are always the same) and this is the reason why the values contained in each row of the vector or matrix change slowly and typically only when fuel quality varies. The execution frequency of the fuel RON learning algorithm can be decided by the engine manufacturer: RONfuel parameter can be updated every cycle, every n cycles, once per vehicle use, and so on. The solution of Equation (5) does not introduce any kind of delay and this feature makes it particularly suitable for the real-time execution. Only the calculation of MAPO98 and the moving average applied to update the Pmax vector introduce a filtering of the measured indexes. The moving average of Pmax for each engine point is applied to remove cycle-to-cycle variation effects. The calculation of the fuel RON helps to update such value in a very fast way, and this feature is important to calculate the proper Pmax target values when the intake air temperature or the fuel is changing rapidly (for instance when the vehicle tank is empty, and the type of gasoline used to refill it is different from the previous one).
The fuel RON value is then used by the reversed knock model, which converts the target MAPO98 into the corresponding Pmax value.
Figure 4 shows the open-loop controller with all the inputs needed by the fuel RON learning strategy.
3.2. Analytical Pmax Model Validation
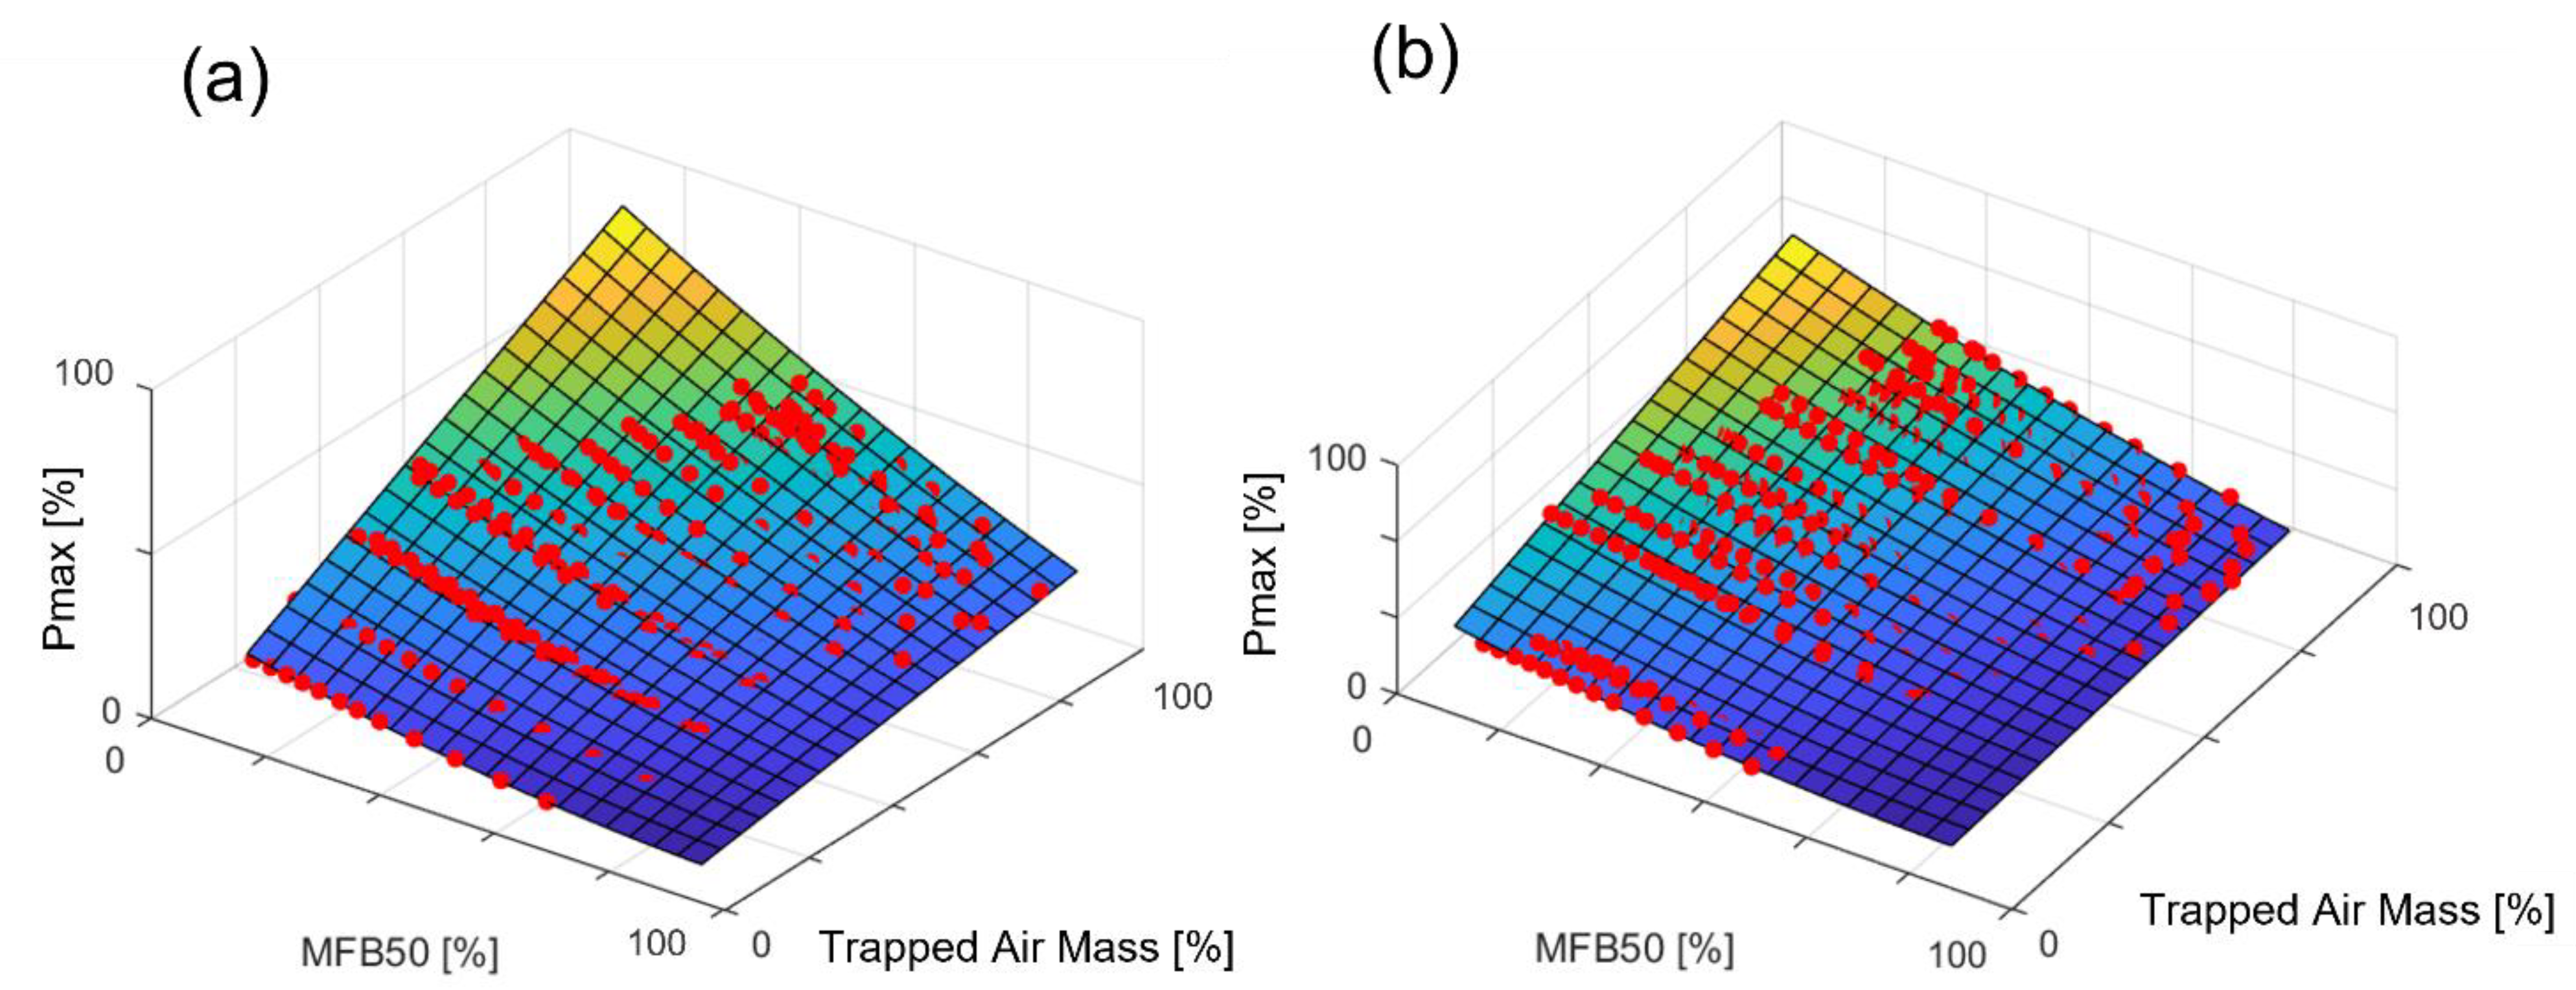
As for the knock model, the simple analytical formulation of the Pmax model is applied to the 4-cylinder engine, to demonstrate the reliability of the proposed approach, despite its very simple formulation. Additionally, in this case, the calibrated coefficients are very similar for both engines.
Figure 5 shows the trends of model equation on the MFB50-STAM domain and
Table 4 collects the numerical values of the Pmax model coefficients for the 8-cylinder and the 4-cylinder engine.
As shown in
Figure 4, the implementation of the reversed Pmax model in the open-loop chain of combustion controller allows the determination of the target combustion phase that achieves either target damage speed, or the best efficiency.
3.3. Adaptive Combustion Model
The final output of the open-loop chain is the ΔSA (with respect to the mapped values) that achieves the target MFB50. The MFB50 model analytically defines the relationship between the actuated spark timing and the combustion phase [
3].
Figure 6 represents the block scheme of the controller open-loop chain, including the adaptive MFB50 model. The dotted line (the fuel RON learning strategy) represents the algorithm described above.
Such model is compatible with the adaptive strategy that updates the parabolic relationship between MFB50 and corresponding spark timing, for any given engine speed and load. For each engine point (fixed speed and load), the relationship between the mean MFB50 and the actuated SA is characterized by a parabolic trend, which can be described with a second order polynomial. Such trend derives from a variable MFB50 sensitivity to the SA: the higher the MFB50, the lower the curve slope.
Figure 7 shows an example of what has been asserted, collecting data for a spark sweep recorded for given engine speed and load. SA is reported as the difference with the calibrated value (ΔSA) and MFB50 is normalized with respect to the maximum value.
Thus, for each engine point (defined as a couple of the engine speed and load) a second order polynomial can be calculated. Equation (6) defines the kind of equation used to fit the ΔSA on the MFB50 axis, for each engine point:
where
A,
B and
C are the equation parameters.
The mean MFB50 values are stored in a 2-D matrix, where rows represent the numbered engine point, and the columns are the ΔSA steps, equally distributed between positive and negative values. A unitary spark advance step corresponds to a certain number of crank angle (CA) degrees. Limitations on ΔSA are typically imposed by maximum and minimum spark timing that can be actuated by the ECU. For instance, if the controller can communicate a ΔSA step within the range ±20 (which in turn corresponds to a certain range of CA degrees), the 2-D matrix has 41 columns. Each value in the matrix is updated by computing the weighted average between the MFB50 stored value and the new one that works as a moving average. Initial values of the 2-D matrix are defined with the MFB50 model executed offline. For every execution time-step, the stored MFB50 value for current operating condition is updated with the more recent MFB50, through the moving average operator. For each matrix row, a parabolic equation can be determined by fitting the stored values with respect to the fixed ΔSA vector that determines the number of matrix columns. The identification process of the optimal values of the function parameters for the current engine point can be performed with the combustion frequency, by applying the least squares method, for the equation degree equal to 2 [
19]. Considering the example described above, in which the admissible ΔSA steps go from −20 to +20, the 2-D matrix has 41 columns and the associated system of
m (in this case 41) equations of degree
n (with
m >
n) can be defined. The least squared method allows to directly determine the coefficients vector of
n + 1 elements that guarantee the optimal approximation of the available data. Even in this case, the choice of the least squared method allows to perform a direct calculation of polynomial coefficients, and it instantaneously updates the parabolic relationship between the combustion phase and the spark advance. Nevertheless, differently from the fuel RON learning strategy that uses the 98th percentile of MAPO, a moving average (a low-pass filter) is applied to neglect the cycle-to-cycle variation (CCV, that normally affects combustion indexes).
For every engine cycle, the MFB50 matrix is updated including the logged MFB50 for the current engine operating conditions (speed, load, and ΔSA), and the parabolic equation is directly calculated to accurately determine the ΔSA that achieves the target MFB50. Thus, the controller layout in
Figure 8 includes data the adaptive algorithm needs as input.
The methodology with which the vector and the matrix of combustion index and the engine load (STAM) are updated depends on the discretization of the engine speed-load operating field. On one hand, if the breakpoints of such grid are sufficiently dense, the algorithm can assign to a certain operating condition the closest engine point, rounding the speed and load with respect to the breakpoints resolution. On the other hand, once the breakpoints of the engine speed-load grid are not so dense, the weighted update of the four breakpoints between which the generic operating condition falls is performed. In other words, combustion indexes stored in the four breakpoints (two engine speed and two engine loads) that include the current operating conditions are updated by distributing the logged number on each of such breakpoints, by defining a weight that is inversely proportional to the distance between the current operating condition and each discretized engine point. Both strategies were tested during the development process of the described combustion controller, but the first solution (based on the updating of the closest breakpoint value, with respect to the current condition) was finally adopted. Indeed, a sufficiently dense discretization of the engine speed-load operating field was reached, due to a numerical optimization process of stored data for adaptive strategies that allowed to minimize the impact of matrices and vectors on the volatile memory of the RCP device. Such solution was preferred for the lower computational power needed, due to the simpler algorithm and because the performance of both solutions was practically the same for the considered grid that discretizes engine operating field.
4. Combustion Controller Validation
Differently from the pure open-loop controller described in the Part 1, piston damage is calculated using the measured MAPO as input, instead of the calculated cyclic value with the analytical knock model. Thus, a closed-loop chain based on a Proportional Integral (PI) controller is implemented for a component-protection objective. Indeed, PI controller reacts only when the instantaneous damage speed exceeds of a certain value the target (with a gain scheduling approach) and an additional integral contribution is added once a safety threshold that corresponds to a very high knock intensity level is crossed. This is because the aim is of controlling combustion phase entirely with the model-based open-loop chain in normal conditions and allowing the PI controller intervention only to the spark retardation when needed. The PI reacts with a typical sawtooth behavior that has been accurately calibrated to have a response fast enough to avoid the knock intensity remaining abundantly lower than the target.
Figure 9 shows the complete combustion controller scheme. The text in red identifies inputs that come from the on-board in-cylinder pressure sensing system (MAPO and MFB50 for each combustion and for each cylinder). Excluding the adaptive algorithms described above, the open-loop strategy is identical to the one presented in Part 1. As highlighted in the previous paper, all the algebraic steps implemented in such scheme are direct calculations, and there are no operators that could induce delays in the algorithm.
The combustion indexes are published once per cycle, while the combustion controller code is executed at 1 kHz to be faster that the engine cycle on the whole engine operating range. A complete controller is implemented for each cylinder, except for the fuel RON learning algorithm which is averaged between cylinders. While the open-loop chain uses instantaneous engine operating parameters (speed, load, lambda), the actuated ΔSA, and the MFB50 and MAPO recorded during the current cycle to calculate ΔSA for the following cycle, the adaption algorithms and the closed-loop chain receive the same data after the combustion. In other words, the open-loop calculations are performed before the engine cycle for which target damage speed is defined. On the contrary, the adaption algorithms and the PI controller are executed after the engine cycle for which the ΔSA is determined.
The engine at the test bench is operated with the speed and load profiles recorded during real vehicle maneuvers. The tested profiles consist of complete track laps, with both very steep transients and semi steady-state conditions. In this way, the controller is stressed with realistic engine speed and load profiles, and the results demonstrate the high reliability of the proposed tool. Moreover, some tests are carried out with a positively offset SA map, in order to validate the performance and the robustness of the self-learning algorithm that updates the mean MFB50 values and the ΔSA-MFB50 functions. The fuel RON is also changed during a portion of these tests, and the reliability of knock model is then demonstrated.
5. Results and Discussion
The main objective of the tests is to validate the algorithms developed above.
Figure 10 displays a portion of the engine speed and pedal profiles tested during the validation procedure, normalized with respect to the maximum values of the engine operating range. The entire engine operating range is thus covered. The detailed results are shown only for cylinder 1, for a more concise and clearer representation. All the following figures were obtained by plotting data recorded with the RCP and the indicating system. The RCP system provides those variables that are received by the ECU and that are calculated by the controller, while OBI-M2 allows having all the combustion indexes, such as the instantaneous and the mean MFB50, Pmax, MAPO and MAPO98.
Figure 11 shows the MFB50, the Pmax, the final ΔSA and the closed-loop contribution (ΔSA CL), MAPO and its 98th percentile, and the damage speed. All the quantities reported in
Figure 11 are normalized with respect to the maximum value of y-scale chosen to include all the recorded values. Instead, the values of ΔSA are reported as °CA. For this test, the matrices and the vectors included in the adaption algorithms contain initial calibrated values. As anticipated in Part 1, both the MAPO98 and the mean MFB50 shown in
Figure 11 are calculated by the indicating system with a buffer of 200 cyclic values. However, such values do not have a role in the open-loop algorithm. They are just evaluated to be compared with the corresponding target value. This means that, excluding moving averages of adaptive strategies used to filter the CCV, there is not any kind of filter in the open-loop calculation chain to avoid the introduction of a delay with respect to the current combustion indexes (MFB50 and MAPO provided by the indicating system). The filtered MFB50 is always on the target, except when the PI controller reacts. This condition can be easily identified when ΔSA calculated by closed-loop is negative. As for the pure open-loop controller, the target MFB50 is defined as the value that achieves a given damage speed value, saturated at the MBT. The MBT value is the lowest MFB50 targeted by the controller. Due to the actuated SA that is generally higher than the calibrated value (as observable in the third plot of
Figure 11 that reports the actuated ΔSA, ΔSA Act.), the engine operating field for which the MBT can be reached is wider than that resulting from the standard calibration. This is due to the higher MAPO that is considered as admissible (especially beyond a certain value of STAM). As for the pure open-loop controller, the most important consequence of the application of the proposed controller is a significant increase of the combustion efficiency, that can be spent with an increase of the maximum torque or a reduction of the fuel consumption. The Pmax reaches the corresponding target values only when the target MFB50 is higher than the MBT. At the same time, during such portions of the test, the MAPO98 oscillates around its target value and the average damage speed is close to the corresponding target value. The average damage speed shown in the last graph of
Figure 11 is calculated as the cumulative damage (evaluated in bars) divided for the whole engine life (evaluated in seconds), and for this reason it varies slowly. Even if the controller manages the instantaneous damage speed, the mean value evaluated in such way is the most meaningful index, because it represents the average damage speed on the entire engine life and it is used to estimate the cumulative piston damage at the end of the test period. The results demonstrate that even the adaptive MFB50 model is reliable and allows to directly calculate the ΔSA needed to reach the target MFB50. As visible in the third graph of
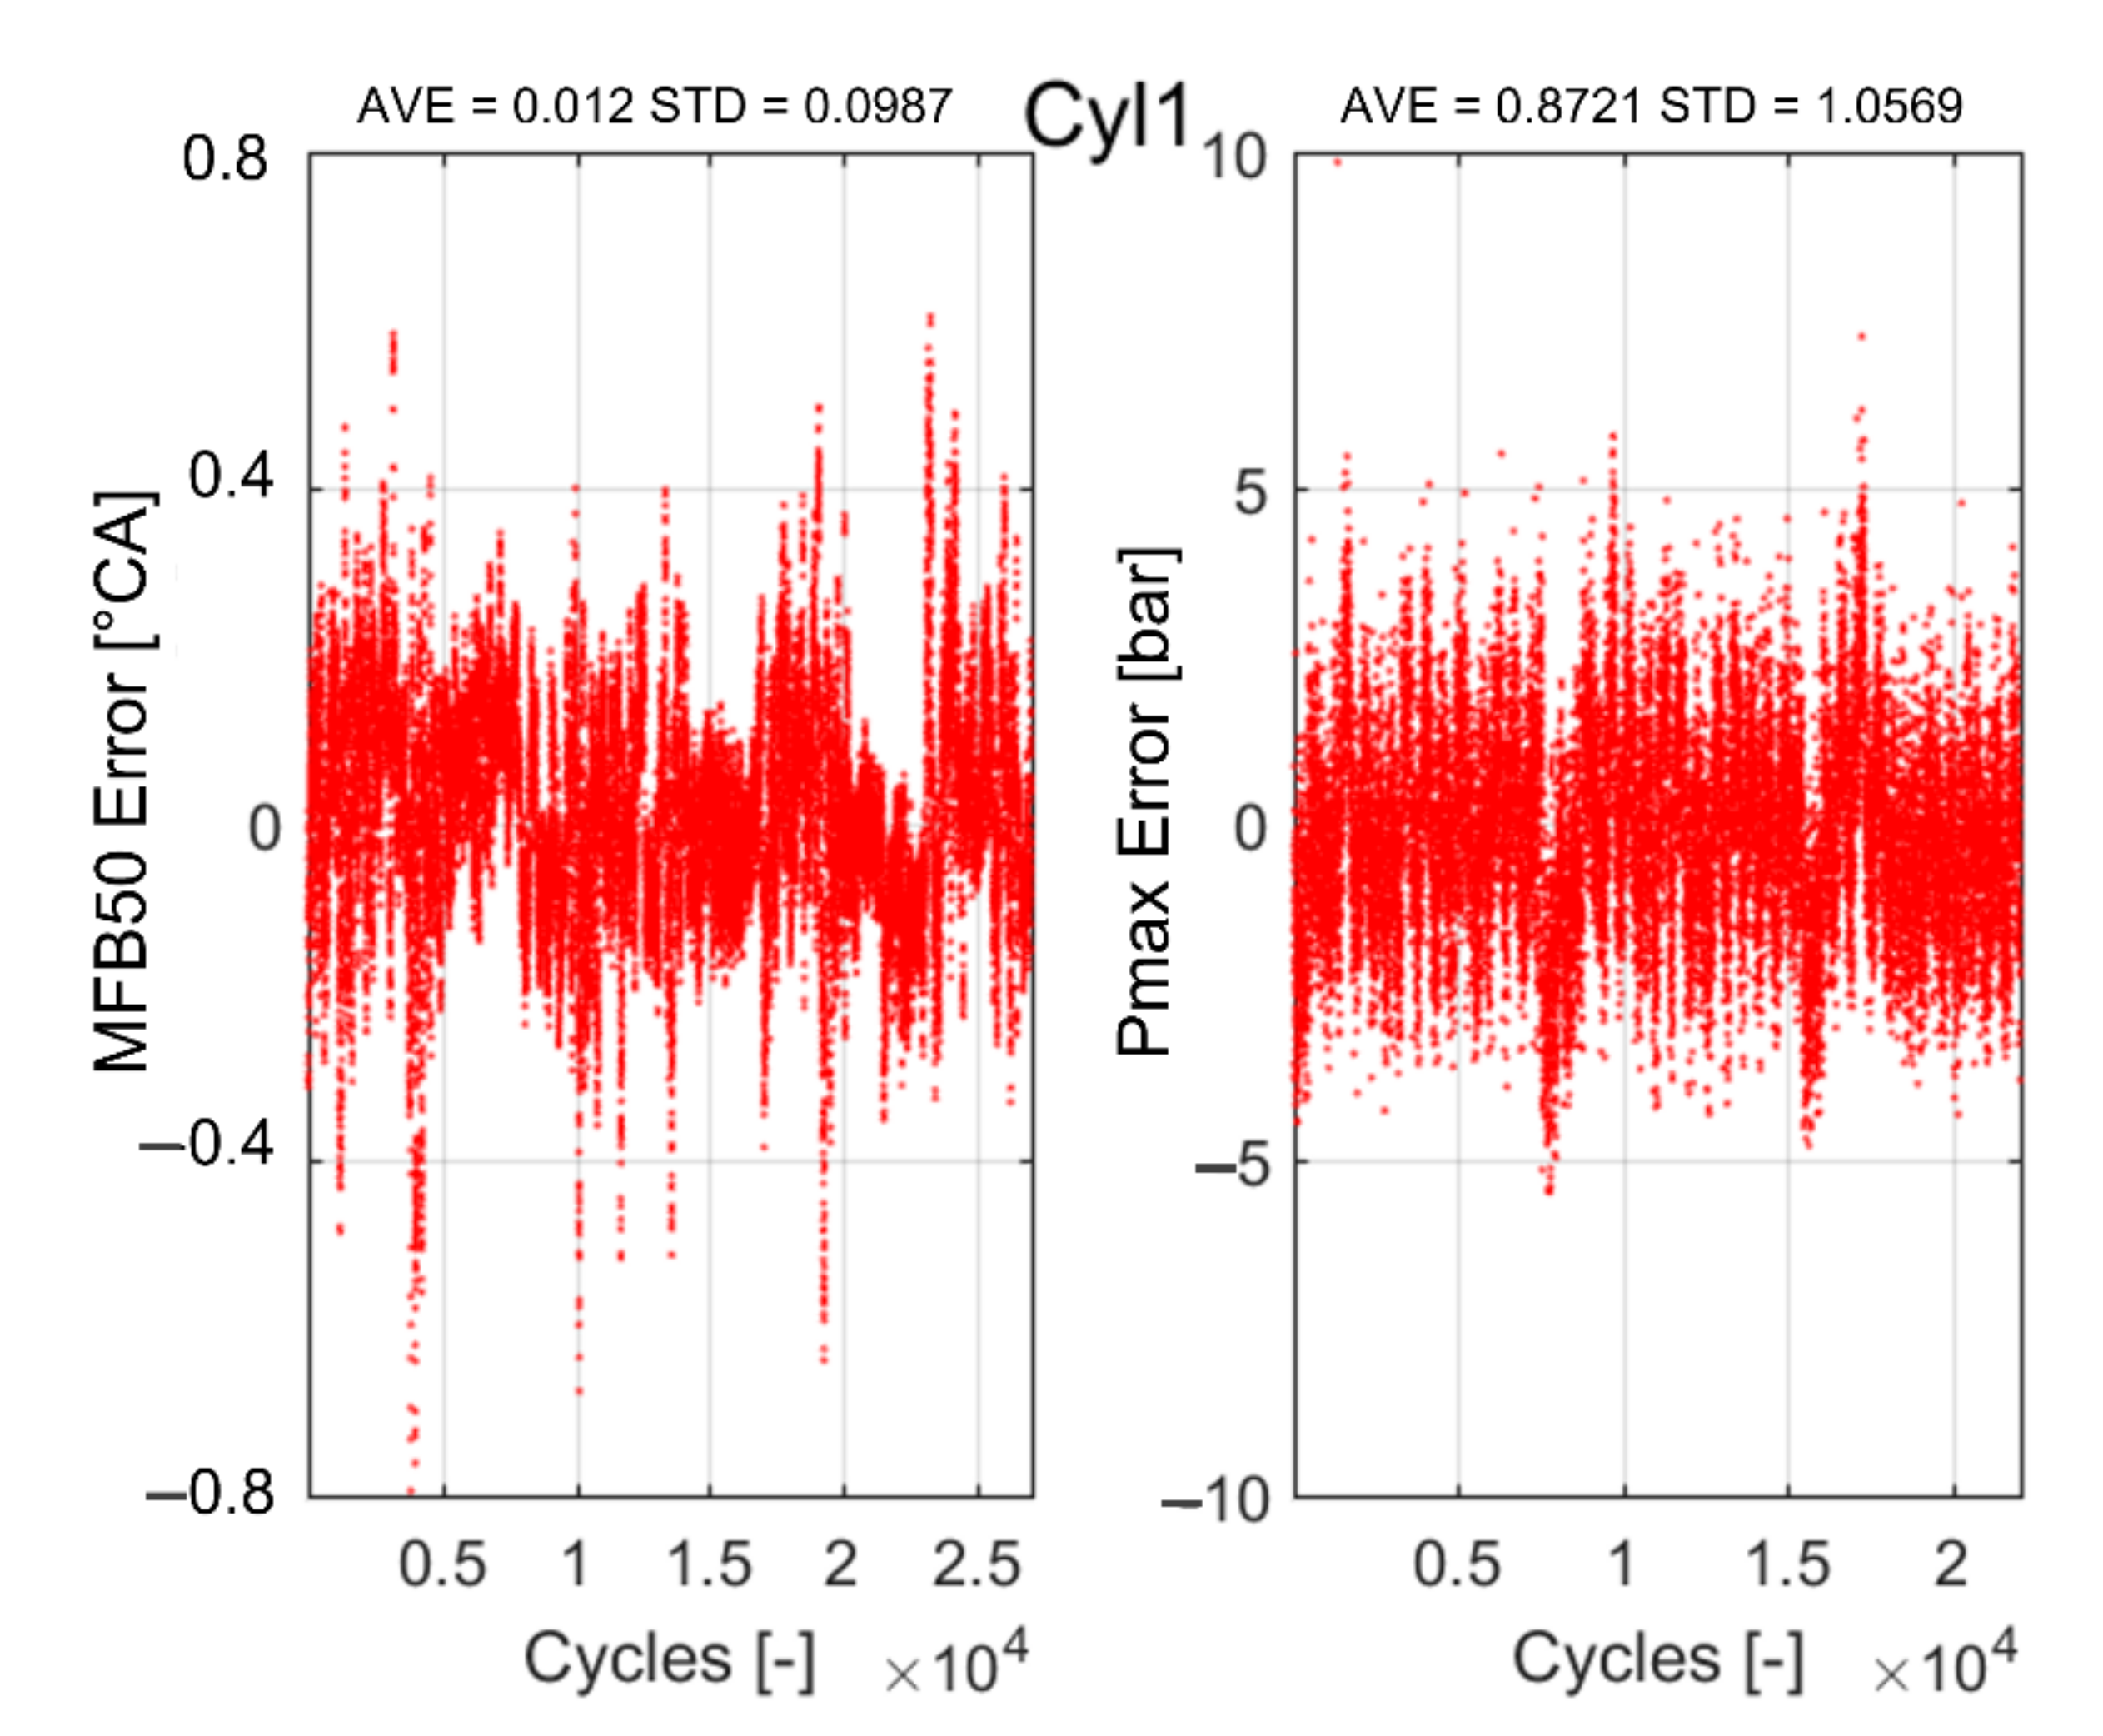
Figure 11, the PI controllers react only with small SA corrections (lower than 2 °CA) when the instantaneous damage speed exceeds a certain threshold value. Moreover, the calculated cyclic Pmax is very close to the experimental data, and this confirms the accuracy and robustness of the proposed analytical model. A more quantitative evaluation of the controller accuracy is reported in
Figure 12, that shows the error between the MFB50 and the Pmax, and the corresponding target values, for the analyzed test. The statistical indexes (the mean value and the standard deviation) are reported for each plot. On the one hand, the error between the target and the filtered MFB50 has to be evaluated excluding engine cycles in which PI controller reacts and consequently the MFB50 cannot be close to the target value. On the other hand, all the engine cycles in which the target MFB50 is saturated to the MBT have to be excluded too, because the target Pmax cannot be achieved. However, since the objective of this work is to develop a combustion controller that manages the combustion phase on the entire engine operating field, the error between MFB50 and the corresponding target value is evaluated on the whole test, and not only for the knock-limited operating conditions. The error is mainly included within the range ±0.4 °CA and ±5 bar for the MFB50 and the Pmax, respectively. These values, together with the achievement of the damage speed target, is an extremely relevant result. Nevertheless, it is important to mention that the average damage speed is close to target value already at the beginning of the test and this is because the engine speed and pedal profiles shown by
Figure 10 are reproduced several times in a row. In this way, the controller can reach the target damage speed value.
Figure 13 shows the calculated fuel RON value, that is practically constant during the test. In this case, standard RON 95 fuel is used. The statistical indexes values are reported in the title of the figure. As discussed above, the fuel RON value is calculated only when the Pmax exceeds a calibrated threshold, to ensure excluding the engine points in which knock does not occur. For such reason, during some portions of the test, calculated fuel RON assumes constant values.
Both the adaptive strategies are validated with specific tests. The algorithm for the ΔSA-MFB50 relationship self-learning is validated by applying an offset to the whole spark advance map, so that the parabolic function that defines the combustion phase with respect to the SA correction needs to be updated. In this way, the condition that leads to save the incorrect MFB50 values (for instance due to a broken sensor) is reproduced. In this case, the test was carried out on a stationary engine operating point, by forcing a spark timing correction on the SA map. Thus, it is possible to quantify the time needed to update the stored MFB50 values and calculate the correct parabolic function.
Figure 14 displays the results in terms of MFB50 and ΔSA for the cylinder 1. A vertical dashed line indicates the moment in which the offset is applied onto the spark timing map. The adaptive strategy can recognize and calculate the new ΔSA-MFB50 parabolic function by updating the value saved in the MFB50 matrix. The error returns close to 0 in 7 s, and this kind of test demonstrates the robustness of such algorithm. The implementation of an additional closed-loop contribution to the control the MFB50 on the target value is not needed as it would introduce an additional error, especially under transient operating conditions. Moreover, in this case, the close-loop chain based on the damage speed does not react, as expected, because the SA map is modified with more retarded values, for a not knock-limited engine point.
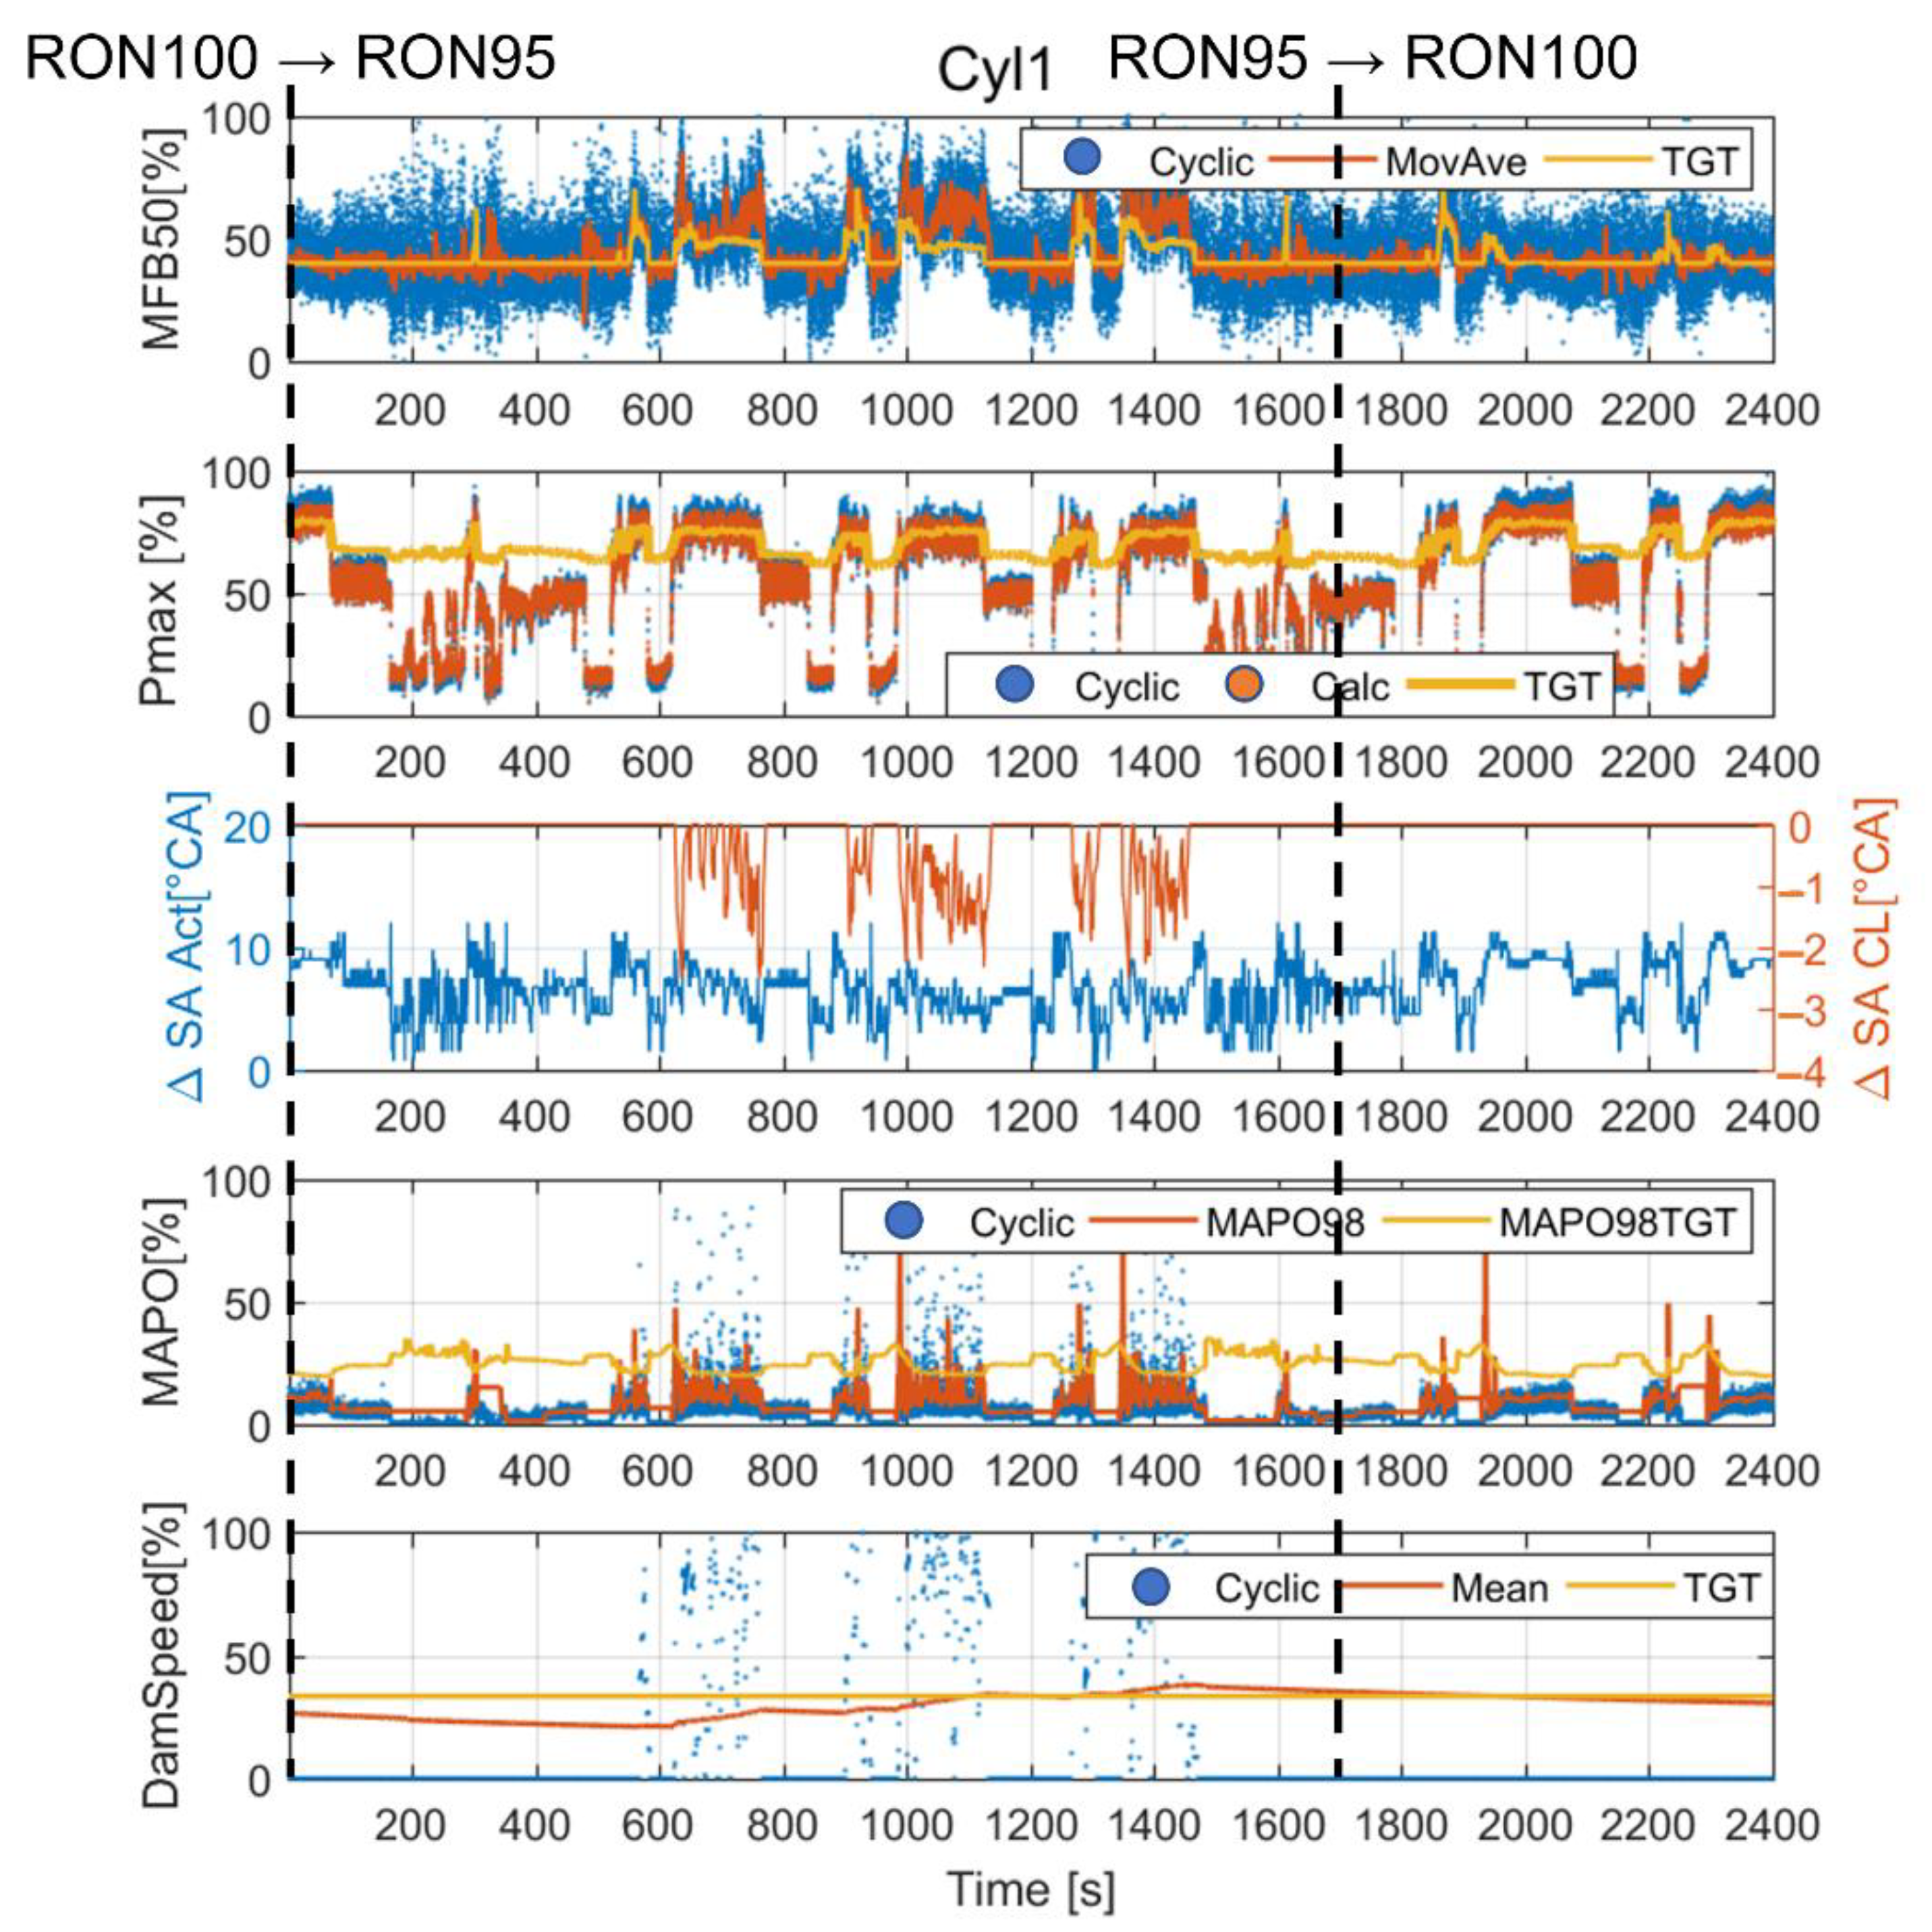
Lastly, the fuel RON learning algorithm is validated. A long test was carried out at the bench by reproducing the same engine speed and load profiles shown in
Figure 10 and switching between two different types of fuel coming from two tanks that supply the engine test bench fuel line (with RON95 and RON100 gasoline, respectively). The switches between fuel lines are performed during the test. Even in this case, the results demonstrate the high reliability of the proposed control strategy.
Figure 15 shows the trend of the calculated fuel RON value during the test. The vertical dashed lines indicate the moments in which the fuel quality is switched. As mentioned above, the RONfuel coefficient update is performed when the Pmax exceeds a calibrated threshold, and therefore the displayed value is constant during some portions of the test. The calculated RON clearly follows the nominal fuel octane number.
Figure 16 shows the trend of the main combustion indexes, the spark timing corrections, and the damage speed, for the cylinder 1. The fuel RON adaption algorithm allows to properly account for the effects of the fuel quality and calculate the maximum in-cylinder pressure that ensures the target MAPO98 value for the current type of fuel, on the entire engine operating range. The average damage speed remains very close to the target, as well as the MFB50 and the Pmax, when the closed-loop contribution is null and target combustion phase is not saturated to the MBT value, respectively. It can be noted that the PI controller reacts especially when the fuel RON is overestimated (for instance during the learning transient), but such corrections are null when RON value is correctly evaluated or underestimated, as expected. This is a further confirmation of the robustness of the open-loop chain, that makes the feedback controller actions very limited.
Figure 17 shows the error between the target and the moving average of the cyclic MFB50 and Pmax.
The validation tests demonstrate the high accuracy of the model-based open-loop controller, and the reliability of the implemented adaptive strategies under real on-vehicle operating conditions.
6. Conclusions and Future Works
In this work, the innovative model-based combustion control system described in the Part 1 was further extended and validated. In this work the algorithm was developed considering the availability of an on-board indicating system that provides a knock intensity and a combustion phase index (MAPO and MFB50, respectively). The novel adaption algorithms based on the analytical formulation of the knock and the MFB50 models are now implemented in the controller, for the live adaption of fuel RON, and the relationship between the combustion phase and ΔSA. In this way, the fuel RON and the coefficients of the analytical MFB50 model that in the first version of the controller were manually set by the user during the calibration process, are now estimated automatically and continuously updated. The final controller is then implemented in an RCP system. The proposed controller needs MAPO and MFB50 indexes, that can be obtained by the on-board systems for the in-cylinder pressure signal estimation, such as the accelerometers, the ionization currents or the piezoelectric components for engine head that can sense the forces induced by the combustion process. Nevertheless, the tests shown in this section are carried out with an engine equipped with standard piezoelectric transducers and the combustion indexes are calculated with a commercial indicating system.
The analytical knock model was calibrated for both an 8- and 4-cylinder engine to demonstrate the robustness and the general validity of the analytical approach. However, the final controller was developed and calibrated for the 8-cylinder engine. The main benefits of the simple analytical formulation were shown, explaining how the proposed approach allows to directly implement an algorithm for the calculation of the fuel RON value. The analytical Pmax and MFB50 models were briefly retrieved and the implementation of the adaptive strategy for the ΔSA-MFB50 parabolic function update was discussed. The matrices that contain stored data needed for the self-learning algorithm were numerically optimized to minimize their impact on the volatile memory of RCP system, and to make the controller suitable for the following implementation in the production ECU. The validation tests were performed by reproducing at the bench the engine speed and load profiles logged during the real vehicle use on track, to validate combustion controller also under very fast transient conditions. Moreover, specific tests were performed to validate the adaption algorithms, by reproducing at the test bench some real conditions, such as a wrongly calibrated MFB50 matrix (it was simulated by offsetting the SA map of a certain value) and a fast fuel quality switch (for example a fuel tank refill with a different fuel).
The results demonstrate both the high accuracy of the complete open-loop chain, and the reliability of the self-learning algorithms. The errors between the target and the experimental indexes were low and this further confirms that the novel approach to the combustion control can be considered as a viable and robust innovation in the knock control. The resulting error was mainly included within the range ±0.4 °CA and ±5 bar for MFB50 and Pmax, respectively. These values, together with the achievement of the damage speed target, can be considered as a relevant result.
This combustion controller will be further validated with the use of a production-oriented, on-board-compatible indicating system that can provide MAPO and MFB50 indexes. Moreover, it will be further developed with an exhaust gas temperature model to manage even the lambda target and it will be finally implemented in a prototyping ECU for the on-vehicle tests. Modern ECUs are characterized by high computational power and their main limitation is related to the number of analog and digital channels, rather than the CPU power. Even if the computational effort strongly depends on the type of the RT machine used to perform tests, the authors confirm the proposed controller is suitable for the implementation in a production ECU.


 ,
, 


