
Aging Behavior of Lithium Titanate Battery under High-Rate Discharging Cycle

1
Institute of Electrical Engineering, Chinese Academy of Sciences, Beijing 100190, China
2
University of Chinese Academy of Sciences, Beijing 100039, China
3
Key Laboratory of Power Electronics and Electric Drive, Beijing 100190, China
*
Author to whom correspondence should be addressed.
Energies 2021, 14(17), 5482; https://0-doi-org.brum.beds.ac.uk/10.3390/en14175482
Submission received: 2 August 2021
/
Revised: 21 August 2021
/
Accepted: 23 August 2021
/
Published: 2 September 2021
(This article belongs to the Collection State of the Art Electric Vehicle Technology in China)
Abstract
:The high-rate discharging performance of a lithium titanate battery is one of its main properties. In conditions that require ultra-high-rate discharging, a lithium titanate battery can be discharged continuously at a current of 50 C (50 times of its maximum capacity) or higher. In this paper, we take cylindrical steel shell lithium titanate cells as the research object and perform aging cycles at 66 C on these cells. The ultra-high-rate discharging cycles cause a rapid high-power capacity fading while the available capacity at normal current rate is not affected. The capacity at 66 C decreases to 80% of initial value in 10 cycles. This paper also analyzes the aging process of a lithium titanate battery at high-rate discharging with incremental capacity (IC) analysis, and presents the aging behavior of lithium titanate battery qualitatively, which is inconsistent with existing research. We attribute the aging mechanism of ultra-high-rate discharging cycles to the decrease of ionic mobility and increase of polarization resistance. Mechanical damage is observed in the CT scan of an aged cell, which we presume to be the result of rapid strain of cathode material.
1. Introduction
The power performance, or discharging current rate, is an important property of lithium-ion batteries. Current rate is a multiple of maximum capacity of a battery, in order to describe its charging or discharging speed. The vehicle batteries demand to be discharged at a rate of 10 C or higher. High power supplies are also required in frequency regulation of smart grids (SG) and sparkers used in seismic exploration. The ordinary power supplies supported by the public grid can hardly satisfy wilderness work. In this case, a series high voltage battery pack can be a solution of constant, short-time, off-grid high-power output [1].
The lithium titanium oxide (LTO), usually Li4Ti5O12, is considered to be one of the most promising anode materials for lithium-ion batteries used in vehicles, energy storage systems, and other high-power applications due to its obvious advantages in high-rate discharging ability, cycle life [2], safety, and stability in high and low temperatures [3], compared with graphite anodes [4]. The LTO battery designed for high power application can be discharged at a rate of 50 C or higher.
The state of health (SOH) of lithium-ion batteries will decline during its lifetime, which damages their discharging ability and safety. To monitor the SOH of batteries in real time, the battery managing system (BMS) is used to measure parameters of batteries and produce estimations of SOH. These estimations of SOH are usually used as the input of the aging model of batteries to estimate their remaining useful lives (RUL), which are highly related to SOH in most cases.
The SOH of lithium-ion batteries has not been defined explicitly. In most cases, the main concern is the available capacity of batteries, which generates a reasonable measurement of SOH presented by percentage. A normal standard of SOH is that a battery is considered inappropriate to be continually used and should be replaced when its available capacity decreases to 80% of its initial capacity [5]. The aging process of lithium-ion batteries also brings resistance increase, which also affects the available capacity and discharging platform voltage of the batteries.
The lithium-ion battery is a complex system, of which the aging process has multiple dependent mechanisms, including accelerating side reactions such as SEI growth [6] caused by high temperature [7], lithium plating and lithium dendrites caused by low temperature [8], and irreversible structural change of electrodes caused by overcharge or discharge and high current. For L333/C cells, overcharge is considered to cause more damage than over-discharge, due to the different crystal structure stabilities of L333 material in the delithiation state and in the lithiation state [9]. The overcharge aging also causes gas elevation [10], an increase of resistance [11], and Joule heat [12]. Other side reactions such as copper substrate dissolution [13] and electrolyte decomposition [14] are also reported. Meanwhile, the calendar aging continues to happen throughout the life of lithium-ion batteries, which indicates that the battery continues aging when it is not used. These aging mechanisms work simultaneously, which makes it a difficult work to analyze the aging process of lithium-ion batteries. In general, there are two main mechanisms of lithium-ion battery aging: loss of active material (LAM), and loss of lithium inventory (LLI) [15].
The methods of estimating SOH of lithium-ion batteries can be sorted into two types, model-based and data-driven-based. The former includes electrochemical model-based methods [16,17,18] and equivalent circuit model-based methods. The model-based methods tend to use a Kalman filter [16], extended Kalman filter [17], or particle filter [18] to estimate parameters of the model. The latter usually collects a health indicator (HI) from charging curves [19], incremental capacity analysis [20], or differential voltage analysis [21] and then builds a connection between HI and SOH through artificial neural networks [22], a support vector machine (SVM) [23], support vector regression [24], relevance vector machine (RVM) [25], etc.
The studies about the aging process and SOH estimation of lithium-ion batteries mainly focus on batteries with a graphite anode. The potential of a lithium titanate anode is higher than a graphite anode. The lithium titanate battery does not have an SEI film formed or lithium plating. The lithium titanate anode also has zero-strain property. Consequently, the aging mechanisms of lithium titanate batteries have obvious differences versus graphite anode batteries. The aging process of lithium titanate batteries is still an area with few research, which mainly focuses on low current rate. Through low current rate (2 C) cycles at 55 °C, the lithium titanate battery has an aging process with two stages [26], which is considered to be caused by different fading speeds of anode and cathode material. Hall et al. [27] assumed that the main aging mechanisms of lithium titanate batteries at room temperature is due to the fading of cathode material. According to a study by Liu S et al. [28],s the depth of discharge (DOD) is the main cause of capacity decrease in discharging cycles from 5 C to 10 C. In 10 C cycles, the lithium titanate batteries have a slower fading process because of the lower DOD. A study by Tao et al. [29] performed aging cycles at 4 C of charging and discharging current on LTO cells with LiCoO2 cathodes and used electrochemical impedance spectroscopy to build an equivalent circuit model, which shows that the capacity fade is mainly caused by an increase of interfacial resistance and decrease of the cathode capacity.
Our paper mainly includes the following work:
- Aging cycles at ultra-high-rate current (66 C) are performed on two LTO cells;
- Use incremental capacity analysis to find the mechanisms of LTO cells aging at high-rate current;
- Verify that the Peukert equation is effective for high-rate discharging in a certain current range;
- Perform CT scan of aged cells and observe possible mechanical damage.
2. Materials and Methods
2.1. Experiment Conditions
The three lithium titanate cells used in the experiments are shown in Figure 1. These cells, with lithium manganate cathodes, are designed to discharge at 50 C. The capacity of these cells is 18 Ah and the voltage ranges from 1.5 to 2.8 V. The cycle life of these cells at normal discharging condition is considered to be over 20,000 cycles.
The experiments in this paper are performed with a 12-channel, 17011 type battery test bench manufactured by Chroma Technology, which has a current range of −100 A to 100 A and a voltage range of 0–5 V. The voltage accuracy is ±0.02%, reading +0.02% full scale, and the current accuracy is ±0.05% full scale. All the experiments are performed at a room temperature of 25 °C.
2.2. Experiment Methods
This paper mentions the following four experiments:
- Aging cycle experiment:Charge the cells with constant current of 1 C (18 A) to 2.8 V, and then turn into a constant voltage step until the current decreases to 0.05 C or lower. Rest for 30 minutes, and then discharge the cell at 66 C (1200 A) to 1.5 V. Rest for 3 hours to eliminate the polarization caused by high-rate discharging;
- Capacity calibrating experiment:Charge the cells as described in the aging cycle experiment, and then rest for 30 minutes. Discharge the cells with constant current to 1.5 V, and then rest for 3 hours, and start over with a different discharging current rate. In a capacity calibrating experiment, the discharging current will be 0.5 C, 1 C, 5 C, 10 C, 20 C, 30 C, 40 C, 50 C, 60 C, and 66 C;
- Charging response experiment:Charge the cells as described in the aging cycle experiment, and then rest for 30 minutes. Discharge the cells with a constant current of 0.5 C (9 A) to 1.5 V. The SOC is considered to be 0%. Charge the cells with a constant current to 2.8 V from 0% SOC, and then start over with a different charging current. The charging current used in this experiment will be 1/3 C, 0.5 C, 2/3 C, 5/6 C, 1 C, 1.5 C, and 2 C to obtain the charging response at different charging current rates;
- Charging response experiment at different SOC:Charge the cells as described in the aging cycle experiment, and then rest for 30 minutes. Discharge the cells to 10–90% SOC at 1 C every 10% SOC. Charge the cells at 1 C to 2.8 V from different SOC.
This paper involves the 3 same cells. We performed 50 aging cycles on Cell #1. A capacity calibrating experiment and a charging response experiment were performed before and after aging cycles. For cell #2, we performed a capacity calibrating experiment and a charging response experiment every 10 aging cycles to monitor the fading SOH more precisely. Cell #3 was used for the charging response experiment at different SOC.
3. Results
3.1. Aging Cycle Experiments
Figure 2 shows the discharging curves and capacity discharged of cell #1 during 50 aging cycles at 66 C. It can be identified that the available capacity at this discharging current rate faded rapidly and smoothly. The available capacity faded to 80% of initial value after 10 cycles. Meanwhile, the discharging curves tended to shake randomly, which might have been due to the electrode damage caused by ultra-high-rate discharging.
Figure 3 shows the discharging curves at 10–66 C of cell #1 before and after 50 aging cycles. The platform voltage and available capacity of cell #1 at all discharging current rates faded by different level. In high-rate (20 C or higher) discharging experiments, the capacity and platform voltage had a more notable decrease. The discharging curves also tended to shake at a high current rate.
The experiments with cell #1 had an over-speed aging process and lacked measurements during aging cycles. Thus, we performed a capacity calibrating experiment and a charging response experiment on cell #2 every 10 aging cycles to ensure the discharging performance during aging process was monitored.
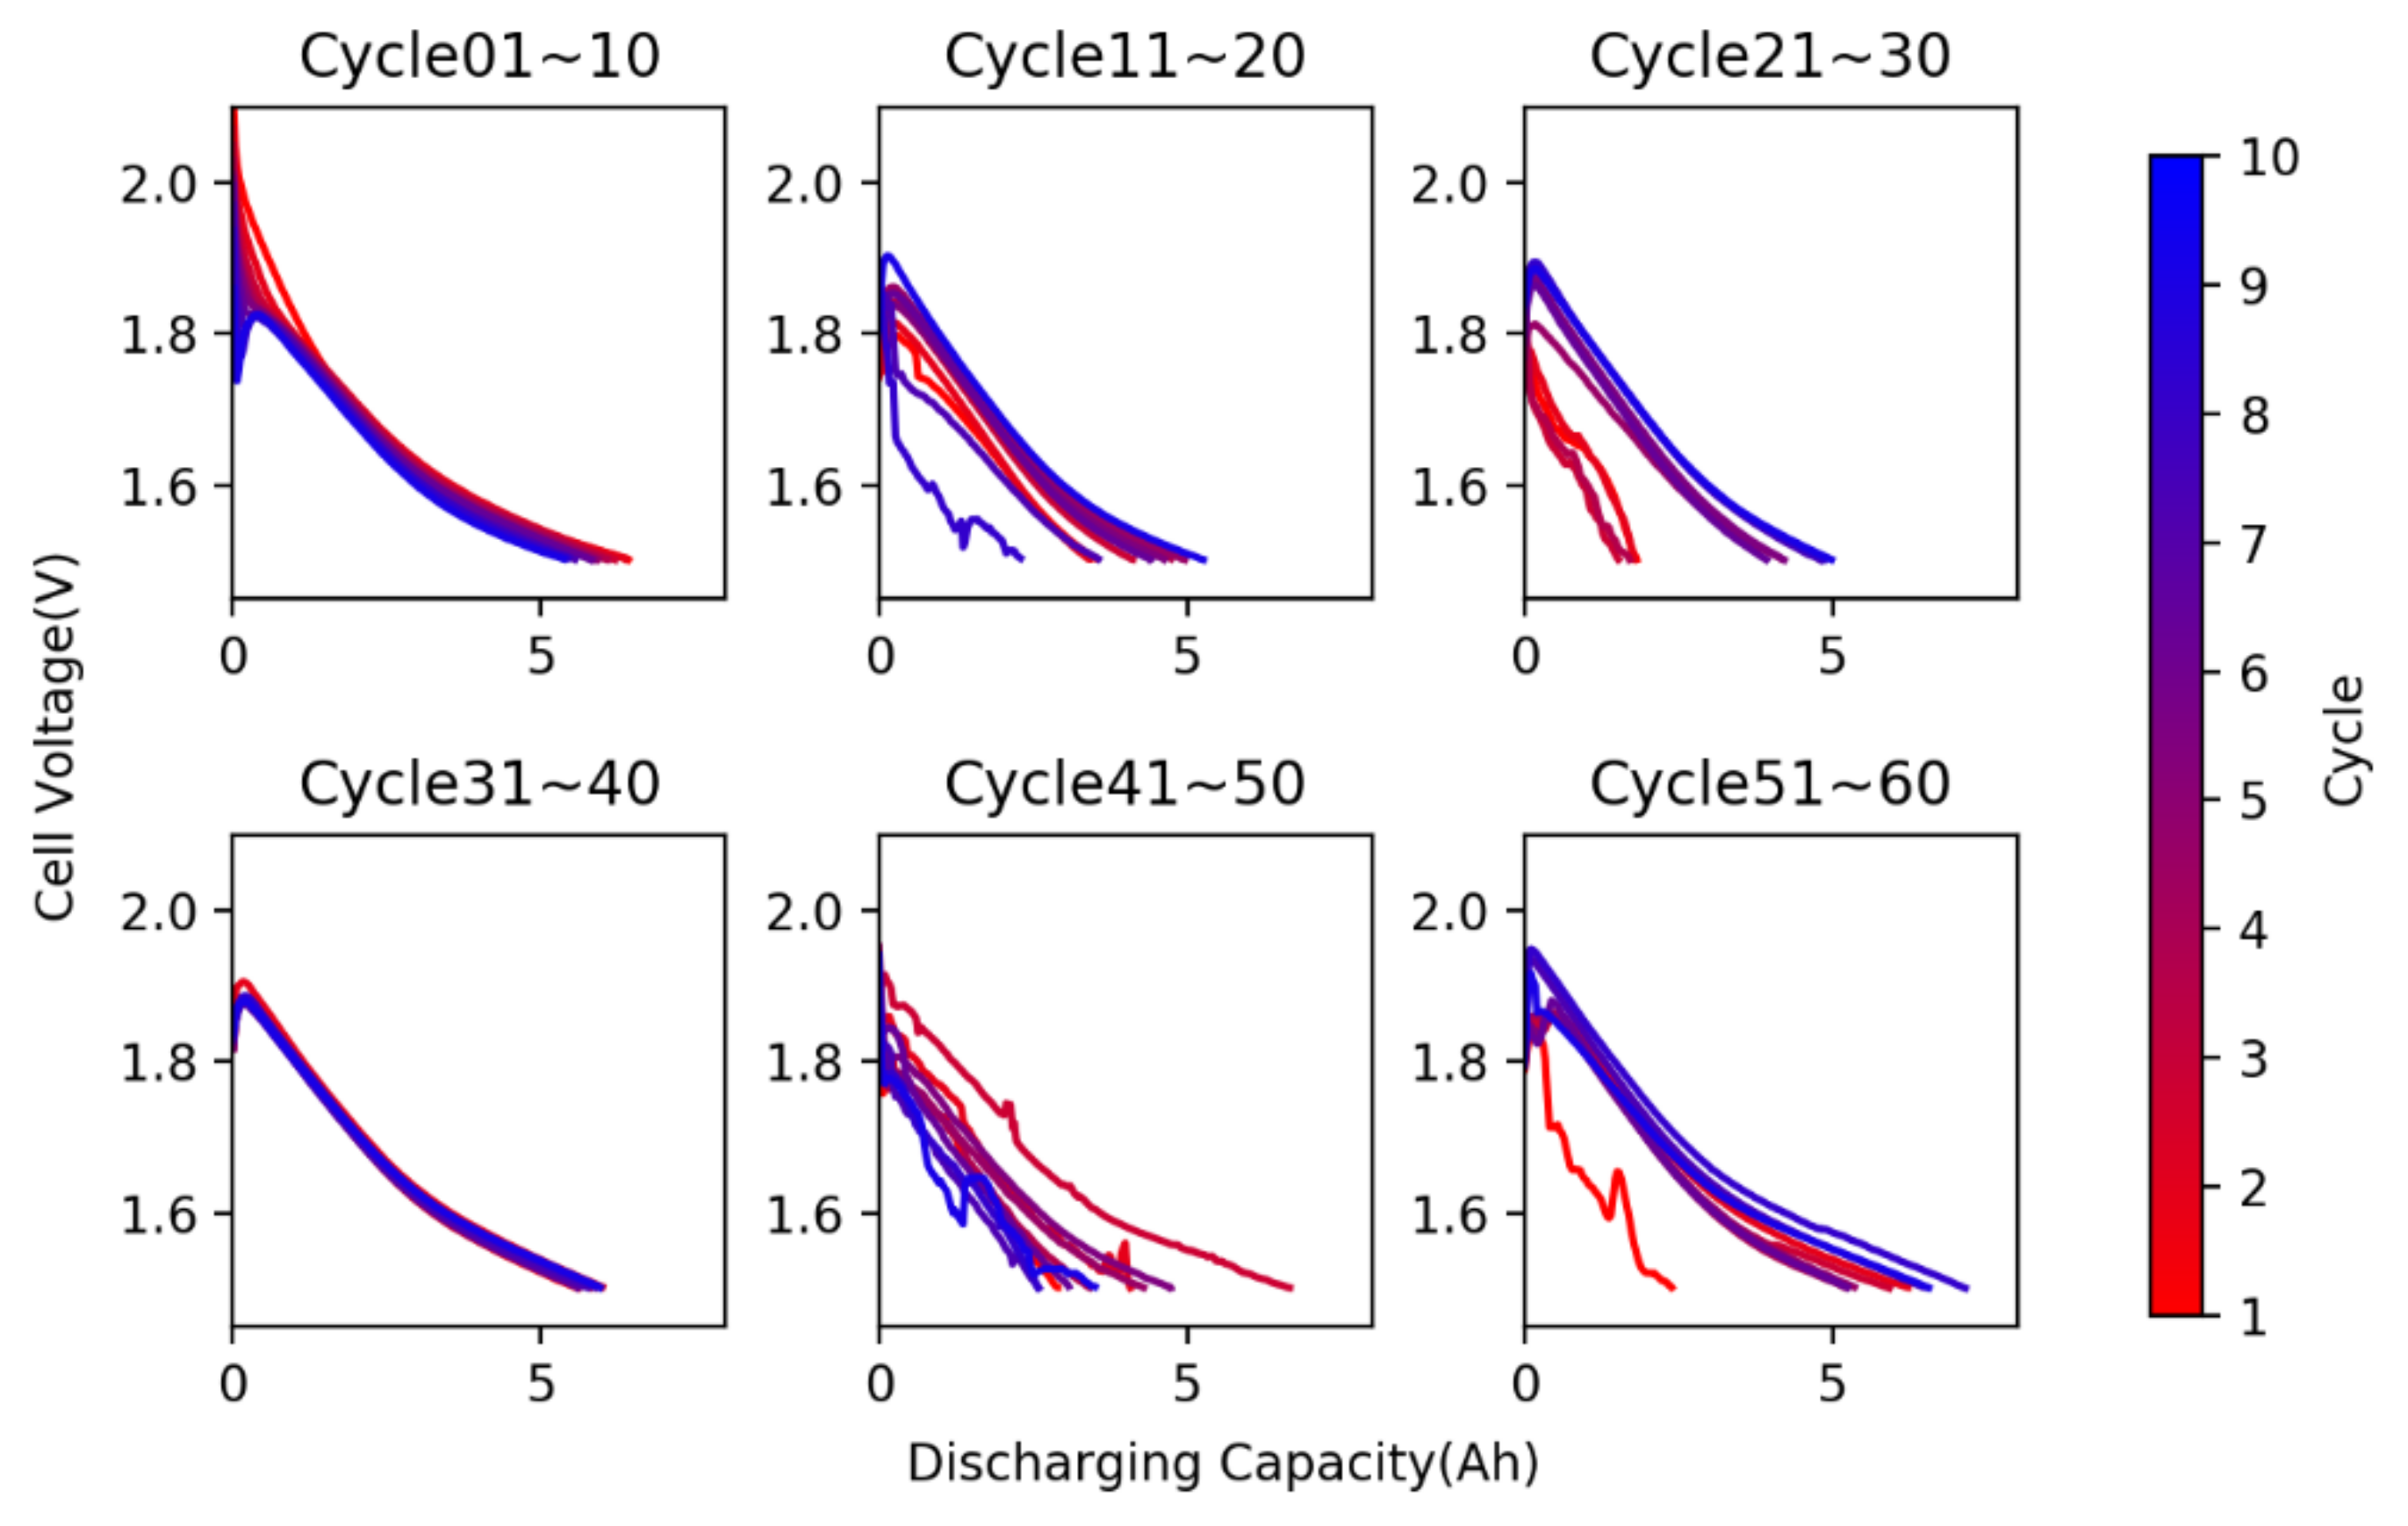
Figure 4 shows the discharging curves and available capacity of cell #2 during 60 aging cycles at 66 C. Compared with cell #1, cell #2 had a more complex aging process. The discharging curves of cell #2 also shook randomly. We sketched all 10 discharging curves separately as shown in Figure 5.
As we can see, the available capacity of cell #2 faded in general. However, in each 10 aging cycles (which were performed continuously), the available capacity and form of discharging curves undulated. Considering that the capacity calibrating experiment and charging response experiment both need 40–50 hours, the self-recovery may arise on cell #2, which can lead to a more complex aging process.
Figure 6 shows the discharging curves of the capacity calibrating experiment during aging cycles. It is clear that the available capacity of cell #2 at low current rate (1 C or lower) hardly faded during the aging cycles at 66 C. The form of discharging curves at low current rate did not vary either. For discharging at middle current rate (5 C to 10 C), the available capacity decreased, but the discharging curves remained normal. For the high current rate (20 C to 40 C), the available capacity faded, the platform voltage decreased, and the discharging curves started to shake. For the ultra-high current rate (50 C or higher), the available capacity faded rapidly, and the deterioration and shaking of discharging curves was notable. It is shown that the fading and damage caused in the high-rate cycles mainly performed in the high-rate discharging process. The low-rate discharging was hardly affected. Therefore, the SOH may not be able to be estimated with an ordinary method or normal measurement.
3.2. Effect on Available Capacity by Discharging Current Rate
The relation between discharging current and capacity of cells are usually expressed with the Peukert Equation [30]:
Ikt = Cp
This empirical formula tends to describe the constant loss in the discharging process. In most cases, as the discharging current increases, the increase of resistance and loss of active material will decrease the available capacity. The parameter k is dimensionless, known as the Peukert constant. For a perfect running cell, k should be 1. The higher k represents a larger loss in discharging process.
A study by Doerffel et al. [30] shows that the study of Peukert constant should be performed at constant current and temperature. For lithium-ion batteries, the Peukert constant is usually 1.03 [31].
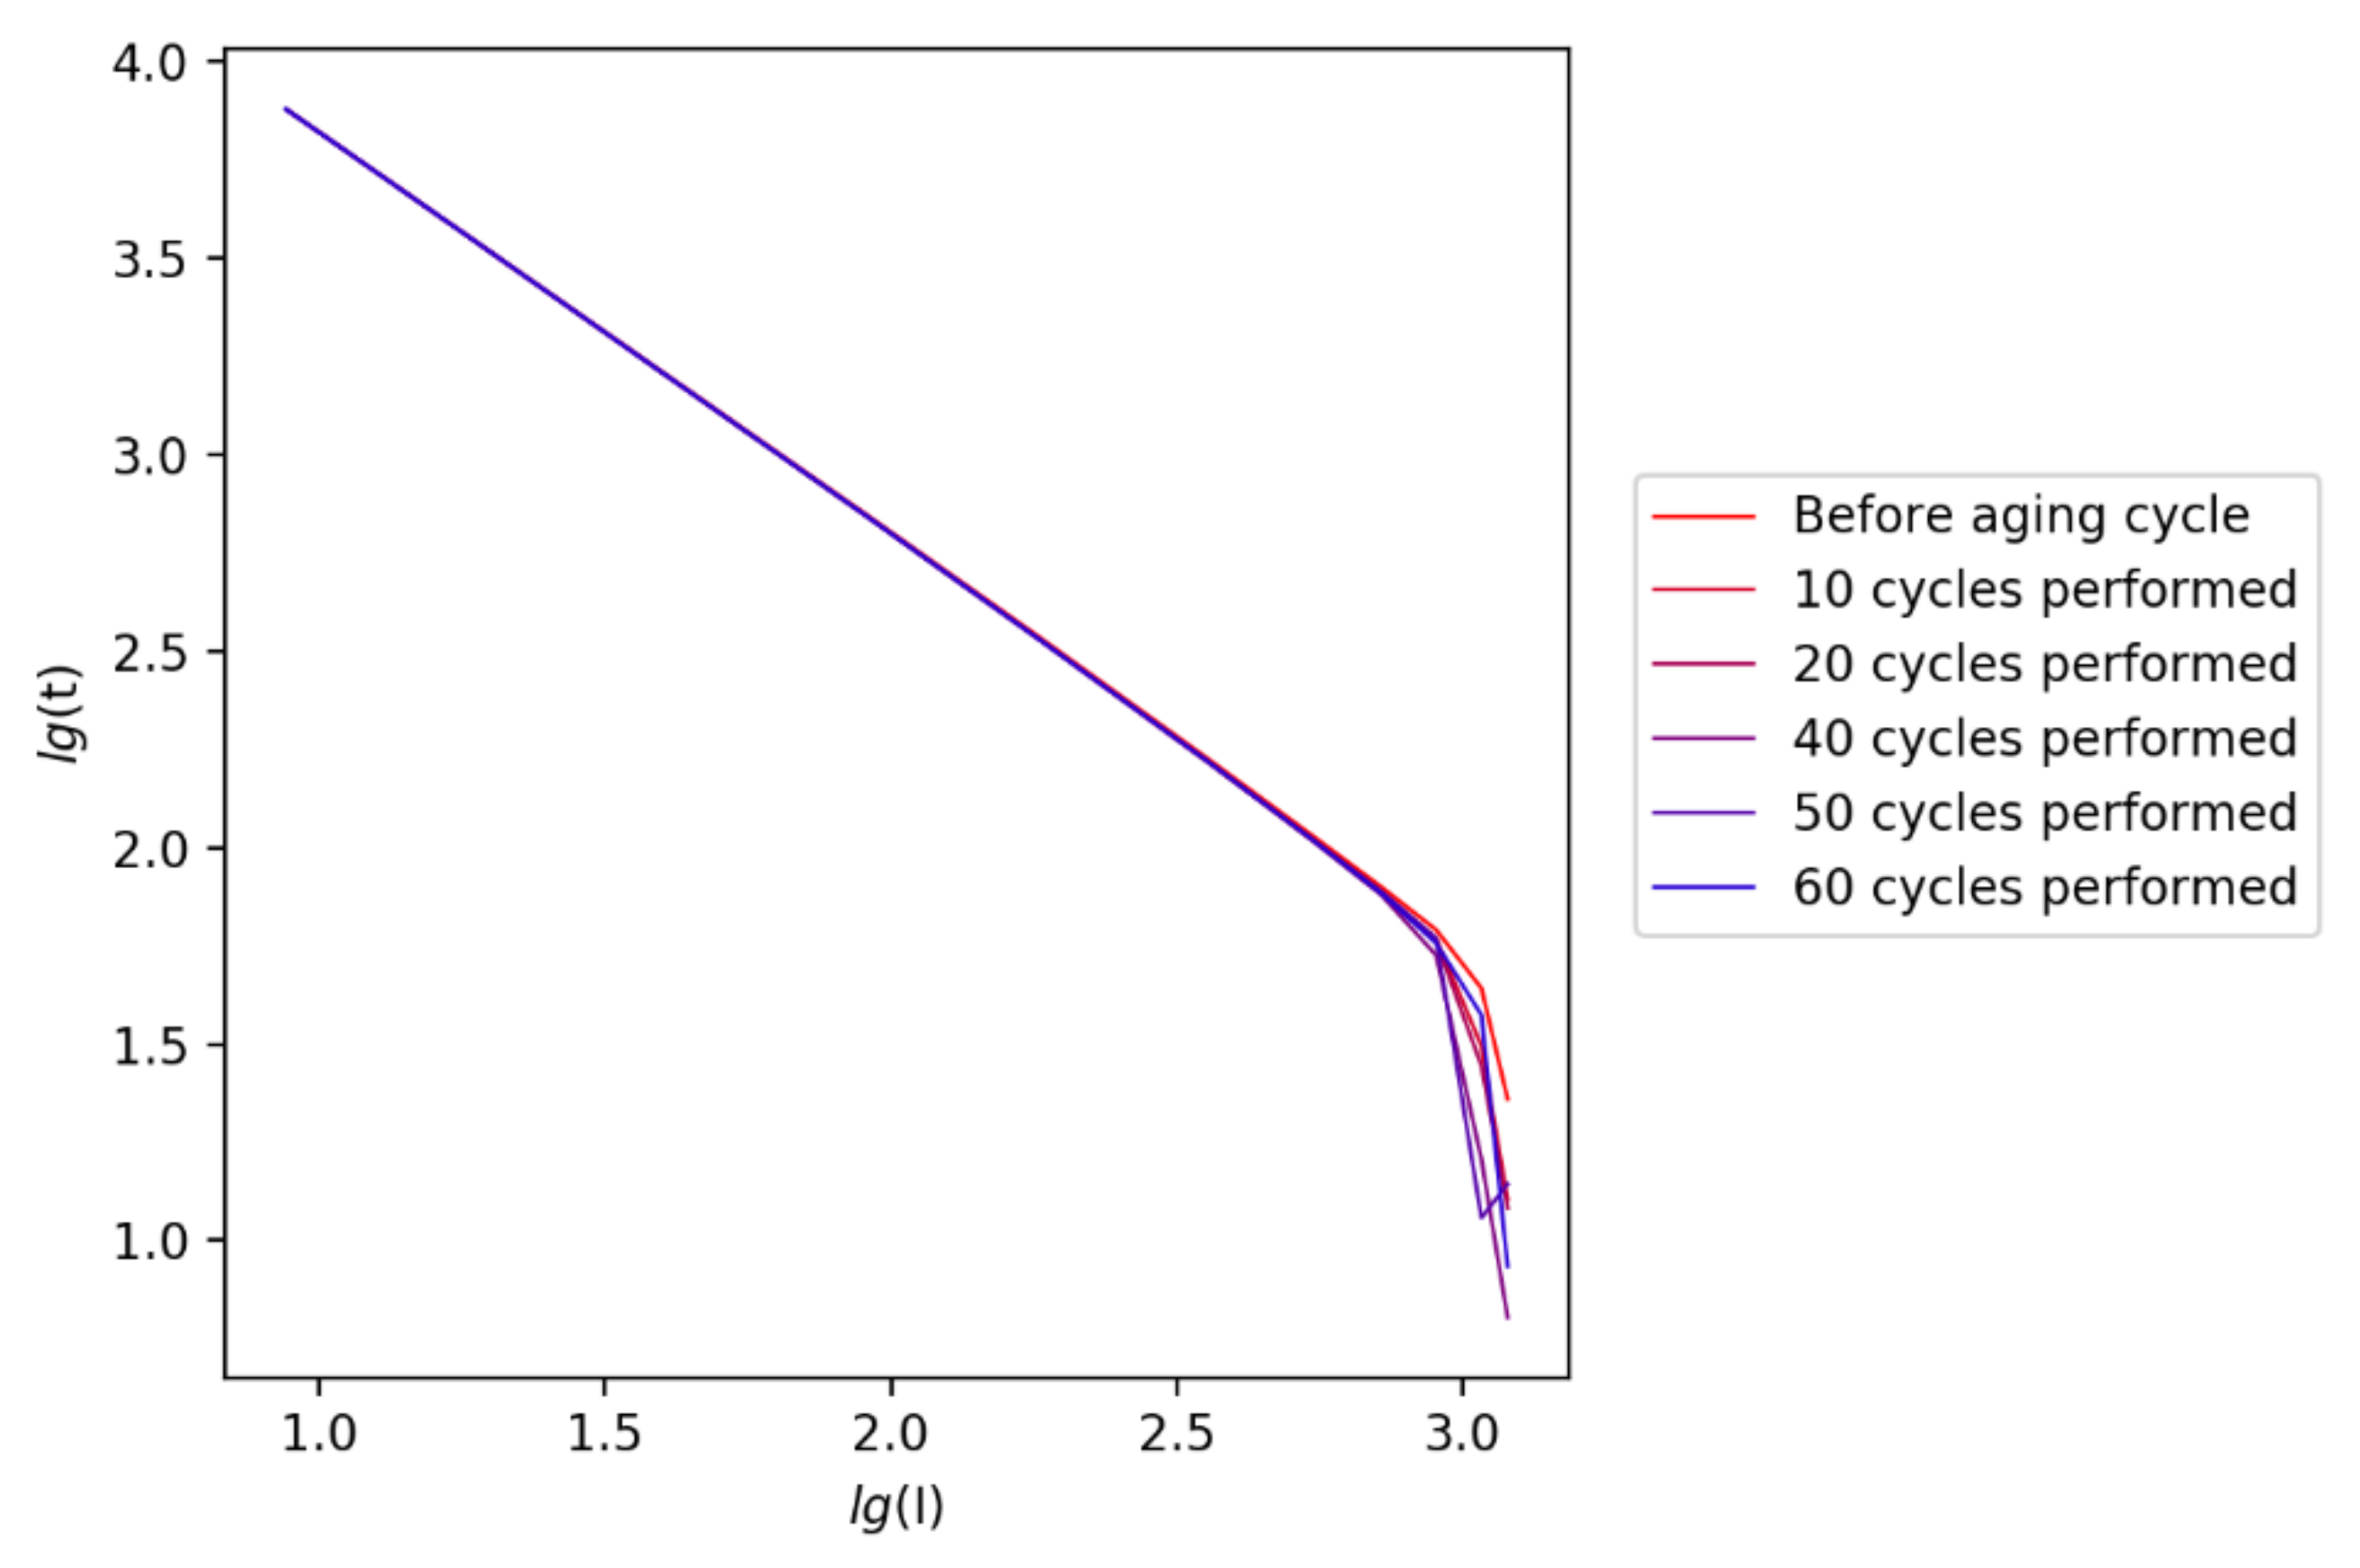
We can transform the Peukert equation into its logarithm form, which can be fitted with the least squares method:
k × lgI + lgt = lgCp
This form shows that there is a linear relation between the logarithm of discharging current and the logarithm of discharging time. Figure 7 shows this relation of cell #2, using the data from capacity calibrating experiments during aging cycles.
It can be easily found that the relation remains linear at comparatively lower current rates (under 60 C). When the discharging current rate approaches 60 C or higher, the linearity disappears. The discharging process over 60 C is beyond the discharging limit of this type of cell and can be destructive. To obtain a long-term estimation of SOH, calculating the available capacity at high-rate discharging condition will be a considerable method.
After removing the discharging process at 60 C or higher, we obtain the Peukert constants during the aging cycles of cell #2, as shown in Table 1:
It can be seen that, though the discharging process over 60 C does not follow the Peukert equation, the tendency of the Peukert constant during aging cycles basically fits the available capacity at this current rate, which makes the estimation of available capacity with the Peukert constant practicable in lithium titanate battery applications.
3.3. Incremental Capacity Analysis
Incremental capacity analysis (ICA) is a widely-used, non-destructive method to analyze SOH of lithium-ion batteries. IC is calculated by differentiating the change in cell capacity to the change in voltage for a sufficient short time interval:
IC(V) = dQ/dV
Many features of IC curves related to aging mechanisms can be identified and tracked easily, e.g., peak location [32], peak height [33], and integrated peak area [34], in order to describe the internal state of batteries. The non-destructive feature of ICA makes it a popular choice for many BMSs. Meanwhile, it is easier to obtain stable voltage-capacity data in the charging process than in the discharging process, in practice. The peaks of IC curves represent the locations of phase equilibria of electrode material [35]. For lithium titanate batteries, the LTO anode is basically in the two-phase transformation (Li4Ti5O12/Li7Ti5O12) during the extraction or insertion of lithium ions, located at a voltage plateau of approximately 1.562 V vs. Li/Li+ [36]. The LTO anode provides a reference potential for the cathode reaction. As shown in Figure 8, the potential of an LTO anode hardly changes until approaching a higher SOC. At the end of charging, the potential of the LTO anode decreases rapidly, which leads to a rapid increase of cell voltage. Normally, the LTO material is considered to stay unchanged after aging cycles [37]. As a result, the IC curve of LTO cells is mainly determined by the cathode reaction.
The producer of cells used in our work claimed that the cathode material is lithium manganate. As shown in this section, the IC curves of our cell have two peaks at about 2.5 and 2.6 V, which infers that the cathode has two phases at 4 and 4.1 V. We can presume that the cathode material is LixMn2O4, which has a potential plateau at 4.110 V for 0.27 < x < 0.60, and a potential plateau at 3.94 V for 0.60 < x < 1, vs. Li/Li+ [38]. The potential of LixMn2O4 is also shown in Figure 8.
To generate an IC curve from a discharging curve, we need to set a fixed dV, which is the voltage interval between two sampling points. An undersized interval will lead to a less smooth IC curve, while an oversized interval will lead to loss of information. In this paper, the voltage interval is fixed to 30 mV.
Figure 9 shows the IC curves of cell #1 during aging cycles at a charging current rate of 1 C. It can be easily found that the right peaks of IC curves move upward and the left peaks move to lower right, and then disappear after more aging cycles are performed. As mentioned before, the aging process of cell #1 was fast and smooth, which caused the charging in the aging cycles to begin from a different SOC. To avoid the effect of starting SOC, we performed a charging response experiment starting from a different SOC on cell #1 as described in 1.2 (4). The result is shown in Figure 10:
For a lithium titanate cell at a certain SOH, the starting SOC has an enormous influence on the form of IC curves, especially on the left peak. However, the right peak of cell #3 did not move upward, as cell #1. We presume that the influence of starting SOC is that when the cell is not fully discharged, the phase transition of cathode material is incomplete. The cathode stayed halfway in section I, which brings a lower left peak. As shown in Figure 10, the IC curves starting from 70% or higher SOC tend to have lower right peaks, which infers that at this SOC, the cathode material stayed in section II. Conversely, when being discharged at an ultra-high current, the speed of Li-ion migration is lower than demand, which leads to a strong polarization. We can presume that during our high-rate aging cycles, more cathode material of cell #1 participates in discharging, but tends to have a more incomplete phase transition and stay in section II. This speculation can explain that the available capacity faded in aging cycles, while the right peaks of IC curves moved upward. We can also notice that the highest peaks in Figure 9 (cycles by the end) have similar height within Figure 10, which also proves that at the end of aging cycles of cell #1, most of the cathode material participates in the reaction. This speculation also infers that the decrease of ionic mobility is the main mechanism of cell #1 aging, which will force more cathode material to react in the discharging process.
To avoid the influence of starting SOC, cell #2 will be discharged to 1.5 V with small constant current (0.5 C) to guarantee equal starting SOC. The IC curves of cell #2 (every 10 aging cycles) are shown in Figure 11:
Figure 11 shows that the IC curves at low current rate (1C or lower) barely changed during aging cycles. At a higher current rate, IC curves tend to move rightward. The IC curves at 2 C are drawn separately in Figure 12:
It can be found that the peak location of IC curves at 2 C move rightward by about 20 mV at most, while the peak height does not change. Generally, the change of peak height represents the loss of active material, and the movement of peak location represents the increase of resistance [27]. The available capacity at low current of cells #1 and #2 did not fade through high-rate aging cycles, which shows that LAM hardly contributes to high-rate capacity decreasing. This experiment shows an opposite result to the research of Han et al. [27], which claims that in the aging experiment of a lithium titanate battery at a discharging current rate of 2 C, the peak height decreased obviously while the peak location did not change, which infers that LAM, rather than resistance increase, is the main cause of LTO battery aging in cycles at normal current.
As mentioned before, we presume that the increasing polarization is the main reason of capacity fading of cell #1. We can nor formulate a hypothesis that the ultra-high rate discharging process causes the deterioration of ionic mobility, which retains more Li-ion in the electrolyte and leads to a greater concentration polarization. In the view of the equivalent circuit model, the polarization resistance grows higher, which makes the voltage of cells drop to cut the voltage rapidly and decreases the available capacity of high-rate discharging. This can also explain that the capacity of low-rate discharging does not fade.
3.4. CT Scan on Cells
To clarify the electrode damage and the mechanisms of discharging curves shaking during ultra-high-rate discharging, we used a CT scan to create inner images of cell #2 (60 cycles at 66 C) and cell #3 (no aging cycle). The scan was performed by the Institute of Industry Technology, Guangzhou & Chinese Academy of Science (GZIIT). The CT images show that cell #2 has an obvious gap near the cathode electrode, which is not observed in cell #3. The area of gap is about 52.97 × 1125.28 μm2. Figure 13 shows the images of the CT scan.
The LTO material is known as a type of zero-strain material, thus we deduce that the mechanical damage is because of cathode strain. Mechanical damage of brittle cathode material caused by small strains in Li-ion batteries has been reported, such as in layered LiCoO2 [39], LiNiO2 [40], spinel LiMn2O4 [41], and LiFePO4 [42]. The work by Ö. Ö. Çapraz et al. [43] shows that LiMn2O4 material has reversible strain of about 0.5% in the charging and discharging process. We presume that the over-speed strain that happened in the ultra-high-rate discharging caused internal mechanical damage, which would affect the speed of Li-ion migration. The shaking observed in ultra-high-rate discharging curves should be a result of electric charge lacking at the electrodes. The unstable electric charge supply makes the electrodes unable to keep voltage smooth and leads to random shaking. It is also possible that the ultra-high current caused a partial short circuit and led to electrolyte decomposition, which would generate gas and create similar mechanical damage. However, we have no idea about the electrolyte used in these cells, thus we cannot clarify this assumption.
4. Conclusion and Future Work
In this study, the aging process and charging response of a lithium titanate battery in ultra-high rate discharging cycles was investigated. During the consecutive 50 aging cycles, the available capacity at the corresponding discharging current rate of cell #1 faded to 80% of initial value at the 10th cycle, to 68% of the initial value at last. The discharging curves at the high current rate shook randomly, which also contributed to the decrease of available capacity. The capacity fading and deterioration of discharging curves are hardly, or completely not observed in normal rate discharging.
In the experiments with cell #2, the aging process tended to be complex and unsmooth. The available capacity at 66 C faded to 41% of initial value at most. As cell #1, the fading and shaking was not observed in normal rate discharging. The platform voltage in high-rate discharging also decreased to 86.9% of initial value, which happened at 50 C.
From the charging response experiments of cell #1, we recognize an uprising right peak in IC curve and attribute it to the increase of polarization. We presume that it is due to the deterioration of ionic mobility. The IC curves of cell #1 also show that with the aging cycles being performed, more cathode material participated in the reaction, but tended to have a more incomplete phase transition, which is the main reason of available capacity fading. The high-rate charging response experiments (1 C or higher) of cell #2 shows an obvious movement of peak location, while the height of peaks remained unchanged. This result shows that the increase of polarization resistance, rather than LAM, is the main mechanism of LTO batteries aging in ultra-high-rate discharging cycles. Meanwhile, we believe that at the start of aging cycles, only part of the cathode material participates in the reaction, which limits the available capacity. Therefore, improving the uniformity of electrode coating is a way to obtain better high-power performance for LTO cells.
The CT scan of cells showed a gap in the cell after 60 ultra-high-rate aging cycles. We presume that the gap infers mechanical damage due to the rapid strain of cathode material. The mechanical damage may be responsible for the shaking observed in high-rate discharging curves.
Our future work will be based on 2 Ah cells with the same electrode material. We will reduce the discharging rate to 50 C in order to make the aging process slow and smooth. We will perform capacity calibrating experiment, charging response experiment, and electrochemical impedance spectroscopy during the aging cycles to have a full view of evolving parameters of LTO cells. The final purpose of our study about ultra-high-rate discharging is to build a SOH estimating model of high-power batteries and a certain method to pick cells with better high-power ability. We want to avoid the high-power discharging in the estimating and picking process, since every ultra-high-rate discharging will do harm to the SOH.
Author Contributions
Conceptualization and validation, C.W. and Z.L.; resources, Y.S.; writing—review and editing, Y.G., supervision, P.Y. All authors read and agreed to the published version of the manuscript.
Funding
This research received no external funding.
Data Availability Statement
Data available on request due to restrictions e.g., privacy or ethical.
Conflicts of Interest
The authors declare no conflict of interest. The funders had no role in the design of the study; in the collection, analyses, or interpretation of data; in the writing of the manuscript, or in the decision to publish the results.
References
- Tan, Q.; Gao, Y.H.; Liu, K.; Han, J.; Sun, Y.H.; Yan, P. Research on current control method of high-voltage and constant current charging power supply based on battery packs connected in series. Adv. Technol. Electr. Eng. Energy 2020, 39, 48–55. [Google Scholar]
- Takami, N.; Inagaki, H.; Tatebayashi, Y.; Saruwatari, H.; Honda, K.; Egusa, S. High-power and long-life lithium-ion batteries using lithium titanium oxide anode for automotive and stationary power applications. J. Power Sources 2013, 244, 469–475. [Google Scholar] [CrossRef]
- Belharouak, I.; Koenig, G.M., Jr.; Amine, K. Electrochemistry and safety of Li4Ti5O12 and graphite anodes paired with LiMn2O4 for hybrid electric vehicle Li-ion battery applications. J. Power Sources 2011, 196, 10344–10350. [Google Scholar] [CrossRef]
- Scrosati, B.; Garche, J. Lithium batteries: Status, prospects and future. J. Power Sources 2010, 195, 2419–2430. [Google Scholar] [CrossRef]
- Duong, T.Q. USABC and PNGV test procedures. J. Power Sources 2000, 89, 244–248. [Google Scholar] [CrossRef]
- Barré, A.; Deguilhem, B.; Grolleau, S.; Gérard, M.; Suard, F.; Riu, D. A review on lithium-ion battery ageing mechanisms and estimations for automotive applications. J. Power Sources 2013, 241, 680–689. [Google Scholar] [CrossRef] [Green Version]
- Amine, K.; Liu, J.; Belharouak, I. High-temperature storage and cycling of C-LiFePO4/graphite Li-ion cells. Electrochem. Commun. 2005, 7, 669–673. [Google Scholar] [CrossRef]
- Jaguemont, J.; Boulon, L.; Dubé, Y. A comprehensive review of lithium-ion batteries used in hybrid and electric vehicles at cold temperatures. Appl. Energy 2016, 164, 99–114. [Google Scholar] [CrossRef]
- Qian, K.; Li, Y.; He, Y.B.; Liu, D.; Zheng, Y.; Luo, D.; Li, B.; Kang, F. Abuse tolerance behavior of layered oxide-based Li-ion battery during overcharge and over-discharge. RSC Adv. 2016, 6, 76897–76904. [Google Scholar] [CrossRef]
- Ohsaki, T.; Kishi, T.; Kuboki, T.; Takami, N.; Shimura, N.; Sato, Y.; Sekino, M.; Satoh, A. Overcharge reaction of lithium-ion batteries. J. Power Sources 2005, 146, 97–100. [Google Scholar] [CrossRef]
- Zheng, H.; Sun, Q.; Liu, G.; Song, X.; Battaglia, V.S. Correlation between dissolution behavior and electrochemical cycling performance for LiNi1/3Co1/3Mn1/3O2-based cells. J. Power Sources 2012, 207, 134–140. [Google Scholar] [CrossRef]
- He, Y.B.; Ning, F.; Yang, Q.H.; Song, Q.S.; Li, B.; Su, F.; Du, H.; Tang, Z.Y.; Kang, F. Structural and thermal stabilities of layered Li (Ni1/3Co1/3Mn1/3) O2 materials in 18650 high power batteries. J. Power Sources 2011, 196, 10322–10327. [Google Scholar] [CrossRef]
- Zhao, M.; Kariuki, S.; Dewald, H.D.; Lemke, F.R.; Staniewicz, R.J.; Plichta, E.J.; Marsh, R.A. Electrochemical Stability of Copper in Lithium-Ion Battery Electrolytes. J. Electrochem. Soc. 2000, 147, 2874. [Google Scholar] [CrossRef]
- Arora, P.; White, R.E.; Doyle, M. Capacity fade mechanisms and side reactions in lithium-ion batteries. J. Electrochem. Soc. 1998, 145, 3647. [Google Scholar] [CrossRef] [Green Version]
- Vetter, J.; Novák, P.; Wagner, M.R.; Veit, C.; Möller, K.C.; Besenhard, J.O.; Winter, M.; Wohlfahrt-Mehrens, M.; Vogler, C.; Hammouche, A. Ageing mechanisms in lithium-ion batteries. J. Power Sources 2005, 147, 269–281. [Google Scholar] [CrossRef]
- Smith, K.A.; Rahn, C.D.; Wang, C.Y. Model-based electrochemical estimation and constraint management for pulse operation of lithium ion batteries. IEEE Trans. Control. Syst. Technol. 2009, 18, 654–663. [Google Scholar] [CrossRef]
- Di Domenico, D.; Stefanopoulou, A.; Fiengo, G. Lithium-ion battery state of charge and critical surface charge estimation using an electrochemical model-based extended Kalman filter. J. Dyn. Syst. Meas. Control 2010, 132, 11. [Google Scholar] [CrossRef]
- Bartlett, A.; Marcicki, J.; Onori, S.; Rizzoni, G.; Yang, X.G.; Miller, T. Electrochemical model-based state of charge and capacity estimation for a composite electrode lithium-ion battery. IEEE Trans. Control Syst. Technol. 2015, 24, 384–399. [Google Scholar] [CrossRef]
- Hu, C.; Jain, G.; Schmidt, C.; Strief, C.; Sullivan, M. Online estimation of lithium-ion battery capacity using sparse Bayesian learning. J. Power Sources 2015, 289, 105–113. [Google Scholar] [CrossRef]
- Li, X.; Jiang, J.; Chen, D.; Zhang, Y.; Zhang, C. A capacity model based on charging process for state of health estimation of lithium ion batteries. Appl. Energy 2016, 177, 537–543. [Google Scholar] [CrossRef]
- Wang, L.; Pan, C.; Liu, L.; Cheng, Y.; Zhao, X. On-board state of health estimation of LiFePO4 battery pack through differential voltage analysis. Appl. Energy 2016, 168, 465–472. [Google Scholar] [CrossRef]
- Zhang, Y.; Xiong, R.; He, H.; Pecht, M.G. Long short-term memory recurrent neural network for remaining useful life prediction of lithium-ion batteries. IEEE Trans. Veh. Technol. 2018, 67, 5695–5705. [Google Scholar] [CrossRef]
- Nuhic, A.; Terzimehic, T.; Soczka-Guth, T.; Buchholz, M.; Dietmayer, K. Health diagnosis and remaining useful life prognostics of lithium-ion batteries using data-driven methods. J. Power Sources 2013, 239, 680–688. [Google Scholar] [CrossRef]
- Patil, M.A.; Tagade, P.; Hariharan, K.S.; Kolake, S.M.; Song, T.; Yeo, T.; Doo, S. A novel multistage Support Vector Machine based approach for Li ion battery remaining useful life estimation. Appl. Energy 2015, 159, 285–297. [Google Scholar] [CrossRef]
- Liu, D.; Zhou, J.; Liao, H.; Peng., Y.; Peng, X. A health indicator extraction and optimization framework for lithium-ion battery degradation modeling and prognostics. IEEE Trans. Syst. Man Cybern. Syst. 2015, 45, 915–928. [Google Scholar]
- Han, X.; Ouyang, M.; Lu, L.; Li, J. Cycle life of commercial lithium-ion batteries with lithium titanium oxide anodes in electric vehicles. Energies 2014, 7, 4895–4909. [Google Scholar] [CrossRef] [Green Version]
- Hall, F.; Touzri, J.; Wußler, S.; Buqa, H.; Bessler, W.G. Experimental investigation of the thermal and cycling behavior of a lithium titanate-based lithium-ion pouch cell. J. Energy Storage 2018, 17, 109–117. [Google Scholar] [CrossRef]
- Liu, S.; Winter, M.; Lewerenz, M.; Becker, J.; Sauer, D.U.; Ma, Z.; Jiang, J. Analysis of cyclic aging performance of commercial Li4Ti5O12-based batteries at room temperature. Energy 2019, 173, 1041–1053. [Google Scholar] [CrossRef]
- Hang, T.; Mukoyama, D.; Nara, H.; Takami, N.; Momma, T.; Osaka, T. Electrochemical impedance spectroscopy analysis for lithium-ion battery using Li4Ti5O12 anode. J. Power Sources 2013, 222, 442–447. [Google Scholar] [CrossRef]
- Doerffel, D.; Sharkh, S.A. A critical review of using the Peukert equation for determining the remaining capacity of lead-acid and lithium-ion batteries. J. Power Sources 2006, 155, 395–400. [Google Scholar] [CrossRef]
- Deng, Z.; Yang, L.; Cai, Y.; Deng, H.; Sun, L. Online available capacity prediction and state of charge estimation based on advanced data-driven algorithms for lithium iron phosphate battery. Energy 2016, 112, 469–480. [Google Scholar] [CrossRef]
- Weng, C.; Cui, Y.; Sun, J.; Peng, H. On-board state of health monitoring of lithium-ion batteries using incremental capacity analysis with support vector regression. J. Power Sources 2013, 235, 36–44. [Google Scholar] [CrossRef]
- Li, Y.; Abdel-Monem, M.; Gopalakrishnan, R.; Berecibar, M.; Nanini-Maury, E.; Omar, N.; Bossche, P.; Mierlo, J.V. A quick on-line state of health estimation method for Li-ion battery with incremental capacity curves processed by Gaussian filter. J. Power Sources 2018, 373, 40–53. [Google Scholar] [CrossRef]
- Tang, X.; Zou, C.; Yao, K.; Chen, G.; Liu, B.; He, Z.; Gao, F. A fast estimation algorithm for lithium-ion battery state of health. J. Power Sources 2018, 396, 453–458. [Google Scholar] [CrossRef]
- Dubarry, M.; Liaw, B.Y.; Chen, M.S.; Chyan, S.S.; Han, K.C.; Sie, W.T.; Wu, S.H. Identifying battery aging mechanisms in large format Li ion cells. J. Power Sources 2011, 196, 3420–3425. [Google Scholar] [CrossRef]
- Colbow, K.M.; Dahn, J.R.; Haering, R.R. Structure and electrochemistry of the spinel oxides LiTi2O4 and Li43Ti53O4. J. Power Sources 1989, 26, 397–402. [Google Scholar] [CrossRef]
- Yu, Z.; Zhang, X.; Yang, G.; Liu, J.; Wang, J.; Wang, R.; Zhang, J. High rate capability and long-term cyclability of Li4Ti4. 9V0. 1O12 as anode material in lithium ion battery. Electrochim. Acta 2011, 56, 8611–8617. [Google Scholar] [CrossRef]
- Ohzuku, T.; Kitagawa, M.; Hirai, T. Electrochemistry of Manganese Dioxide in Lithium Nonaqueous Cell: III. X-Ray Diffractional Study on the Reduction of Spinel-Related Manganese Dioxide. J. Electrochem. Soc. 1990, 137, 769. [Google Scholar] [CrossRef]
- Wang, H.; Jang, Y.I.; Huang, B.; Sadoway, D.R.; Chiang, Y.M. TEM study of electrochemical cycling-induced damage and disorder in LiCoO2 cathodes for rechargeable lithium batteries. J. Electrochem. Soc. 1999, 146, 473. [Google Scholar] [CrossRef]
- Dokko, K.; Nishizawa, M.; Horikoshi, S.; Itoh, T.; Mohamedi, M.; Uchida, I. In Situ Observation of LiNiO2 Single-Particle Fracture during Li-Ion Extraction and Insertion. Electrochem. Solid State Lett. 2000, 3, 125. [Google Scholar] [CrossRef]
- Zhang, Z.; Chen, Z.; Wang, G.; Ren, H.; Pan, M.; Xiao, L.; Wu, K.; Zhao, L.; Yang, J.; Wu, Q.; et al. Dual-doping to suppress cracking in spinel LiMn2O4: A joint theoretical and experimental study. Phys. Chem. Chem. Phys. 2016, 18, 6893–6900. [Google Scholar] [CrossRef] [PubMed]
- Wang, D.; Wu, X.; Wang, Z.; Chen, L. Cracking causing cyclic instability of LiFePO4 cathode material. J. Power Sources 2005, 140, 125–128. [Google Scholar] [CrossRef]
- Çapraz, Ö.Ö.; Rajput, S.; White, S.; Sottos, N.R. Strain evolution in lithium manganese oxide electrodes. Exp. Mech. 2018, 58, 561–571. [Google Scholar] [CrossRef]
Figure 1.
The lithium titanate cell used in this work.

Figure 2.
The discharging curves and capacity fading process of cell #1.

Figure 3.
The discharging curves at different current rates before and after cycles of cell #1.

Figure 4.
The discharging curves and capacity fading process of cell #2.

Figure 5.
The discharging curves of cell #2 during aging cycles.

Figure 6.
The discharging curves at different current rates during aging cycles of cell #2.

Figure 7.
The Peukert constant of cell #2 during aging cycles.

Figure 8.
Schematics of potential of LTO and LixMn2O4 material.

Figure 9.
The IC curves of cell #1 during aging cycles.

Figure 10.
The IC curves of lithium titanate battery at different SOC.

Figure 11.
The IC curves of cell #2 at different charging current rate during aging cycles.

Figure 12.
The IC curves of cell No.2 at 2C during aging cycles.

Figure 13.
The CT images of cells; (a, b) Cell no. 3; (c, d) cell no. 2.


Table 1.
The Peukert constant of cell no. 2 during aging cycles.
| Cycles | Peukert constant | R-square |
|---|---|---|
| Before cycles | 1.0344 | 0.9999 |
| After 10 cycles | 1.0426 | 0.9997 |
| After 20 cycles | 1.0448 | 0.9996 |
| After 40 cycles | 1.0523 | 0.9999 |
| After 50 cycles | 1.0419 | 0.9998 |
| After 60 cycles | 1.0451 | 0.9996 |
Publisher’s Note: MDPI stays neutral with regard to jurisdictional claims in published maps and institutional affiliations. |
© 2021 by the authors. Licensee MDPI, Basel, Switzerland. This article is an open access article distributed under the terms and conditions of the Creative Commons Attribution (CC BY) license (https://creativecommons.org/licenses/by/4.0/).
Share and Cite
MDPI and ACS Style
Wang, C.; Liu, Z.; Sun, Y.; Gao, Y.; Yan, P. Aging Behavior of Lithium Titanate Battery under High-Rate Discharging Cycle. Energies 2021, 14, 5482. https://0-doi-org.brum.beds.ac.uk/10.3390/en14175482
AMA Style
Wang C, Liu Z, Sun Y, Gao Y, Yan P. Aging Behavior of Lithium Titanate Battery under High-Rate Discharging Cycle. Energies. 2021; 14(17):5482. https://0-doi-org.brum.beds.ac.uk/10.3390/en14175482
Chicago/Turabian StyleWang, Chu, Zehui Liu, Yaohong Sun, Yinghui Gao, and Ping Yan. 2021. "Aging Behavior of Lithium Titanate Battery under High-Rate Discharging Cycle" Energies 14, no. 17: 5482. https://0-doi-org.brum.beds.ac.uk/10.3390/en14175482
Note that from the first issue of 2016, this journal uses article numbers instead of page numbers. See further details here.