
Value Proposition of Different Methods for Utilisation of Sugarcane Wastes


1
Wide Bay Water, Fraser Coast Regional Council, Urangan 4655, Australia
2
Department of Physics, Federal University of Campina Grande, Campina Grande 58429-900, Brazil
3
National Institute of Fundamental Studies, Kandy 20000, Sri Lanka
4
Centre for Crop Health, School of Civil Engineering and Surveying, University of Southern Queensland, Toowoomba 4350, Australia
*
Author to whom correspondence should be addressed.
Energies 2021, 14(17), 5483; https://0-doi-org.brum.beds.ac.uk/10.3390/en14175483
Submission received: 22 July 2021
/
Revised: 29 August 2021
/
Accepted: 29 August 2021
/
Published: 2 September 2021
(This article belongs to the Topic Actions for Bioenergy and Biofuels: A Sustainable Shift)
Abstract
:There are four main waste products produced during the harvesting and milling process of sugarcane: cane trash, molasses, bagasse and mill mud–boiler ash mixture. This study investigates the value proposition of different techniques currently not being adopted by the industry in the utilisation of these wastes. The study addresses the technical challenges and the environmental impact associated with these wastes and comes up with some recommendations based on the recent findings in the literature. All the biomass wastes such as bagasse, trash (tops) and trash (leaves) have shown great potential in generating higher revenue by converting them to renewable energy than burning them (wet or dry). However, the energy content in the products from all the utilisation methods is less than the energy content of the raw product. This study has found that the most profitable and challenging choice is producing ethanol or ethanol/biogas from these wastes. The authors recommend conducting more research in this field in order to help the sugar industry to compete in the international market.
1. Introduction
One of the greatest challenges of the 21st century is to meet the global energy demand while maintaining environmental sustainability. The possible decline in fuel supply, together with the detrimental release of greenhouse gases, has led to an urgent need to identify sources of renewable fuel/energy. The Australian government was expecting to achieve a renewable energy target of 10% of total energy production by 2020 [1,2]. However, Australia has yet to reach 2% renewable energy production. Likewise, India had similar renewable targets to achieve by 2020 [3]. To achieve this target, biofuel was identified to play a major role [2]. However, the use of food crops for biofuel production has been widely criticised because the demand for food is still increasing, and the need will be increased by a further 50% by the middle of the century [4]. Thus, there is an urgent need to develop more sustainable alternative biofuel feedstocks that do not impact global food production [5]. These challenges represent the key drivers for this article.
Sugarcane is identified as a main target in Australia for biofuel production. Other annual crops such as maize, sorghum and wheat have also been identified as potential candidates for biofuel production in Australia because these crops are widely grown. Sugarcane bagasse, a byproduct after sugar extraction, remains in large quantities and is used to generate electricity for the sugar factory operation by burning wet bagasse. Bagasse is the fibrous residue, which is left over after crushing and extraction of the plant juice. In Australia, the amount of bagasse produced each year just from sugarcane is around 10 million tons [6]. The net theoretical calorific value produced from wet bagasse is around 7588 kJ/kg. Currently, bagasse is burned wet in the mills’ boilers [7]. This practice causes a significant loss of energy. About 52% of energy is lost in evaporating the moisture in bagasse. The conversion efficiency of heat to electricity in this process is low; the energy efficiency of a conventional thermal power station is typically 33% to 48% [6]. This means around 52% to 67% of the energy content in the fuel is lost, and this also releases a large quantity of CO2 into the atmosphere.
Australian bagasse fibre mainly consists of 43% and 25% of cellulose and hemicellulose, respectively. The remaining constituents are ashes and waxes. Cellulose and hemicellulose content are around 70%; this makes it a potential candidate for bioethanol production. Bagasse represents a low-cost raw material when compared to wood. Its estimated value at the sugar mills is typically around AUD 40 per dry ton [8]. If energy can be produced from bagasse by converting it to ethanol, additional income can be generated. The solid waste generated from the fermentation is almost 50% of the bagasse, and this can be used as fuel for a boiler to generate steam and electricity.
In Australia, crop residues from maize, sorghum, wheat and other small grain crops are largely used as mulch after harvesting. For example, the harvest index of modern grain crops falls within the range of 0.4 to 0.6, which is the ratio of harvestable yield to biomass ratio [9,10]. On this basis, the remaining agricultural waste, except waste from cereal crops, accounts for nearly 250 million metric tons of lignocellulose biomass globally. This can be used for bioethanol production, and this can further facilitate the production of a large amount of energy needed globally. Another advantage of using crop biomass for bioethanol is the low lignin content compared to perennial trees and higher cellulose to hemicellulose ratio [11].
The structure of lignocellulosic biomass is determined by the cell wall structure. Understanding biomass composition between different species and genotypes will provide important insights into potential bioethanol production efficiency. For example, the relative carbohydrate and lignin ratio plays an important role in the deconstruction of plant cell walls [12]. A detailed understanding of carbohydrate composition, protein concentration and also macro and micronutrient concentrations are essential for promoting microbial growth, fermentation and fermentation efficiency.
Converting lignocellulose to fermentable monosaccharides is a technical challenge. This process is hindered by many physio-chemical, structural and compositional factors [13]. Various pre-treatment techniques, such as steam explosion, alkaline, diluted and concentrated acid and ammonia are introduced to overcome these difficulties [14]. It was suggested that one or more of these pre-treatments might be required prior to enzymatic hydrolysis to make the cellulose more accessible to the enzymes [1].
Australia ranks third after Brazil and Thailand in supplying raw sugar. Queensland produces approximately 95 per cent of the sugar in Australia, and the remaining five per cent is produced by New South Wales. There are approximately 4000 cane farming businesses supplying 24 mills. Seven milling companies own the milling industry. Around 75 per cent of this industry is currently foreign-owned [15,16].
In 2012/13, QSL’s Discretionary Pool returned AUD 438.55 per ton of sugar. A total of just over 30.5 million tons of sugarcane was crushed during the 2013 season with an average cane yield of 83 tons per hectare, resulting in more than 4 million tons of sugar being produced [15,16]. Table 1 shows the total production of sugar and byproducts from the sugar mills in Australia.
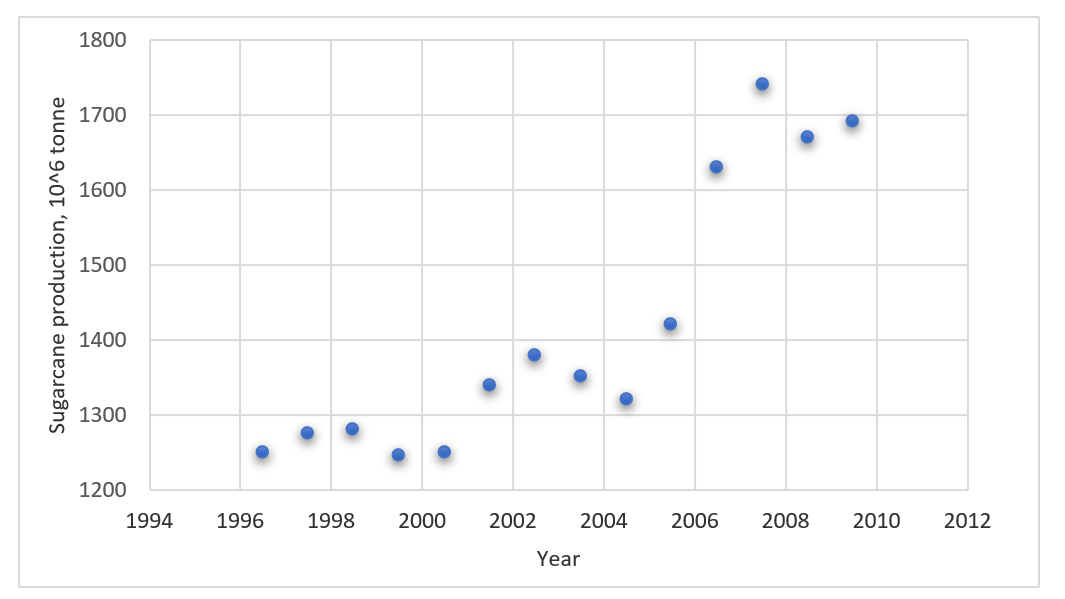
Around 660 kg of solid residues are produced for each milled ton of cane (wet basis) processed. The energy content of the residues from this industry could mean about 85 million tons of oil equivalent [17]. Figure 1 shows the trend of sugarcane production in the world from 1997 to 2010. It shows a sharp increase in the production of sugar cane after 2006. In 2010, the world’s sugarcane agro-industry processed more than 1685 × 106 tons of sugarcane. Currently, Brazil is the world’s leader among the sugarcane-producing countries. In 2019, the total production of sugarcane raised to 2016 million tons; Australia produces 1.7% of the world’s production [18].
Around 80 per cent of the sugar produced in Australia is exported. Australian major competitors are mainly from Asian Countries, especially Thailand. Thailand exports to Indonesia, Japan, South Korea and China. Countries such as South Korea, Japan and Indonesia import approximately 75 per cent of their sugar from Australia [15,16]. This study aimed to explore the feasibility of a variety of methods in the utilisation of the wastes from the sugar industry in order to generate other revenue streams to help the industry in Australia compete in the international market. Based on the recent findings in the literature, recommendations were made to either support the approach in some of this literature and/or suggest different ways of utilisation based on the authors’ interpretation. From this study, it was shown that the milling industries in most countries, including Australia, are not in favor of exploring new methods due to a lack of knowledge related to the commercialisation aspects. In this study, a value proposition analysis was carried out to show the economic and environmental benefits of some of the new utilisation techniques suggested. This study showed, despite the technical issues with some of these methods, the potential of adopting one or more of these technologies is feasible.
2. Methodology
The approach in this article included setting the question of the research, conducting a targeted search tailored to the question, article screening, critical appraisal, data extraction, examination and carrying out calculations. Different database sources were identified to be used in the review, including scientific trusted websites and reports, and only the literature published in English was considered. All of the literature retrieved were screened for relevance, reliability and relevant subjects (country, scale, crop: sugarcane wastes).
The research question was focused on the quality and quantity of biomass waste produced in sugarcane farming and processing. The data collected were analysed, processed and presented in tables and graphs; this included sugarcane productivity, sugarcane waste byproducts, benefits and/or impacts on the environment. The methods and conversion factors of sugarcane to biofuel and other products were presented and considered in the economic calculation.
The main concept of this article is to show the economic advantage of converting waste biomass solid to products. Despite the fact that most of the data are from Australia, the analysis and calculation can be applied anywhere in the world.
3. Waste Utilisation/Recovery
Several byproducts are produced from the milling of cane stalks: wastewater, trash, molasses, bagasse, mill mud and boiler ash. Bio-dunder is another byproduct produced in mills that process molasses to produce ethanol. The utilisation of these byproducts in Australia has remained the same for decades. Bagasse (wet product) is mainly used to fuel the mill boilers and generate electricity; mill mud or filter mud and ash are mixed and mainly used as soil ameliorants or, to a lesser extent, as plant nutrients not far away from the mill. Molasses is mostly used as food for animals and, recently, ethanol production. Sugarcane trash is mostly leftover in the field, and in some places, it is burned in the field before harvesting [19].
3.1. Bagasse
Bagasse is the expended cane fibre that remains after extracting sugar juice. Bagasse is considered a renewable fuel and can also be used as stock feed. Sugar mills burn bagasse to generate electricity and steam for the operation. The mills actually generate more electricity than their need. In Australia, around 400 GWh was fed to the grid in 2012 [16].
Bagasse generally contains 44–53% moisture, 1–2% soluble solids, 1–5% insoluble solids and the remaining is lignocellulosic fibre. A typical constitutive analysis of Australian bagasse fibre on a dry basis shows around 43% cellulose content, as shown in Table 2. The reported composition of bagasse varies because its composition depends upon the growth conditions of the plant, the plant tissue and the age at harvesting [8].
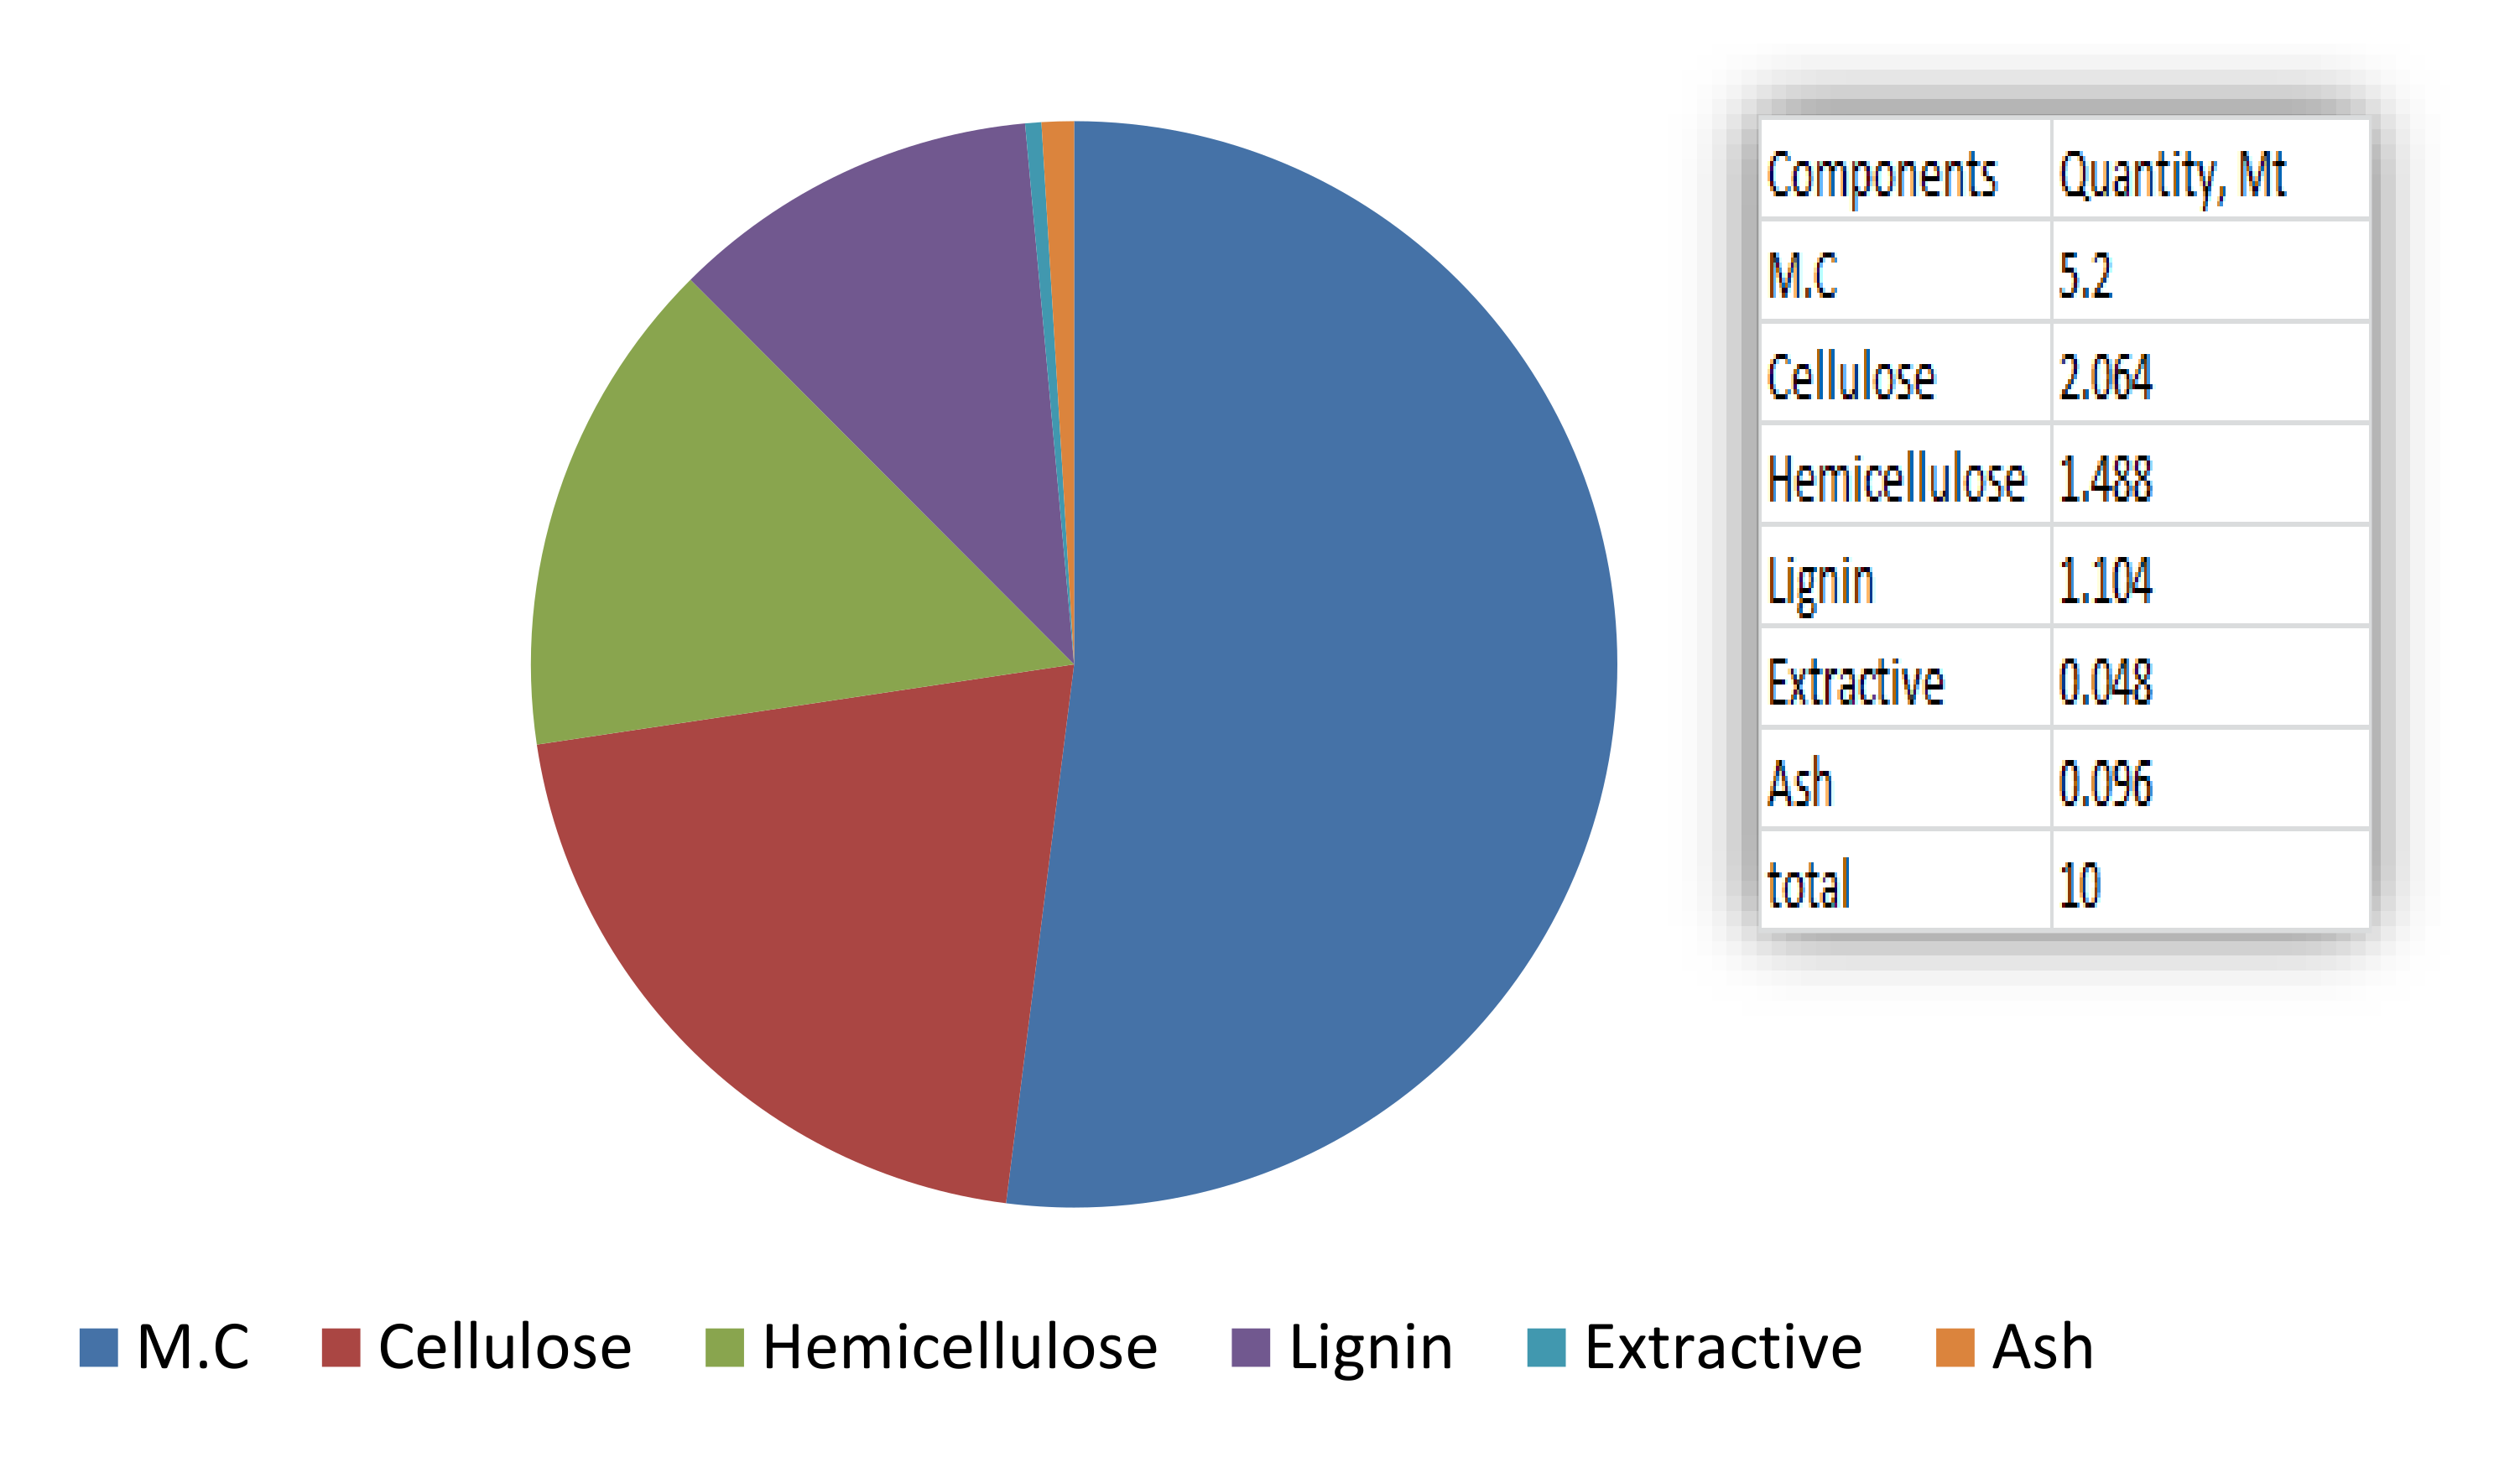
Bagasse after crushing and extraction processes will be in the form of fibres. The lengths of these fibres vary between 1 and 25 mm. Cellulose is surrounded by lignin and hemicellulose. The hemicellulose provides an interpenetrating matrix for the cellulose microfibrils, while lignin is incorporated into the spaces around the fibrillary elements [8]. Based on moisture content of 52% and the quantity produced per hectare, the potential dry biomass available from bagasse in Australia is around 4.8 million tons. The quantity of each component in bagasse is presented in Figure 2.
The practice of using bagasse as a source of renewable energy reduces Australia’s greenhouse gas emissions by over 1.5 million tons annually [16]. Due to the cellulosic nature of the bagasse, there are other methods of utilisation of this byproduct rather than burning it, such as manufacturing of paper pulp and fibreboard, animal feed, manufacturing energy pellets, fermenting to produce ethanol, biogas, butanol or hydrogen and building products.
3.2. Molasses
Molasses is a black syrup that remains after passing the boiled sugar syrup through a centrifugation process. Around 50 per cent of the molasses produced in Australia is exported. The remainder is used in many applications such as stock feed to make industrial alcohol (ethanol), rum and carbon dioxide.
The amount of molasses produced as a byproduct of sugarcane processing is around one million tons. The moisture content and total sugar content of this byproduct are around 23% and 63%, respectively. Molasses composition varies between crushing season months, milling regions and years. The full composition of molasses is presented in Table 3.
Around 670,000 tons of Australian molasses (56% of the whole production) was exported in 1996 at prices less than those achieved selling into the domestic market [21]. Molasses used to feed beef cattle have the lowest price per ton. The prices of molasses is around USD 100/t, compared to whole cottonseed (USD 160/t), cottonseed meal (USD 380/t), urea (USD 520/t) and alkali-treated bagasse (USD 154/t) [20]. Molasses at USD 90/ton equates to (processed) barley at USD 122/ton in the ration as a source of metabolisable energy (ME) and provides a cost advantage when barley exceeds USD 122/tonne, or whole cottonseed (WCS) exceeds USD 143 [21]. In 2019 the price of exported molasses increased to USD 120/ton [22].
3.3. Cane Trash
The plant tops and dry leaves that are left on the field after harvesting are known in the sugarcane industry as sugarcane trash. In the past, farmers used to burn this biomass in the field in order to maintain the cultivation practices of the ratoons. In 1976, a very wet season in North Queensland prompted the re-introduction of green cane harvesting after a gap of more than 30 years. Green cane harvesting is associated with trash blanketing, spreading leaves and other plant residues in a thick layer of mulch over the ground, aiming mainly at the conservation of the soil and water [24].
It was found that the practice of maintaining the post-harvest sugarcane residues on the field has an agronomic benefit plus improved flexibility in harvesting. With the green cane approach, harvesting is still possible without worry about unfavorable weather for burning, such as wet weather and unfavorable wind conditions. Zero tillage often occurs with green cane harvesting, which enhances the movement of farm machinery in wet weather. Moreover, this practice contributes to the protection of soil against erosion, the reduction in variation in the soil temperature (protection from direct radiation), an increase in the biological activity, higher rate of water infiltration (less evapotranspiration), improvement in weed control and increase in the soil carbon stock and nutrients cycling. However, there are also some negative effects associated with this practice. The large amounts of trash left in the field may contribute to the reduction in ratoon sprouting, increased risk of fire, greater incidence of sugarcane pest and disease, and difficulties in mechanised cultivation. Harvesting green costs more because cutting rates are lower (60% to 70%), and losses during harvesting are much higher than for burnt cane. Finally, burning the cane before or the trash after harvesting causes an environmental issue due to the large smoke produced [25,26].
In Brazil, currently, around 85% of sugarcane area is mechanically green harvested, which produces cane trash between 10 to 30 t dry biomass/ha/year [25]. Over 85% of Queensland’s sugarcane is now harvested green. In the Burdekin and in northern New South Wales, the adoption of green harvesting is restricted due to the inability of current machines to harvest large cane plants and two-year crops at commercial rates. In some other districts, this practice is inhibited due to older machinery [26].
There are possibilities of using sugarcane trash as fuel for boilers to cogenerate electricity and in the production of second-generation ethanol. In order to gain the benefit of green harvesting and reduce its disadvantages, the question is how much trash (tops and leaves) can be removed from a sugarcane field that can be used for other purposes [25].
A study by Franco et al. (2013) [25] showed that the tops and dry leaves contain different nutrients and moisture; around 80% of N, P and K are derived from tops. It is important to consider this fact when collecting trash. This study showed that more nutrients would be recycled, and fewer mineral fertilizers might be used for sugarcane production if tops are left in the field. It also predicted that for second-generation ethanol production, the pre-treated dry leaves are superior to the tops. Franco et al. suggested that it is more viable to leave the tops in the field and recover parts of the dry leaves for bio-fuel production.
Analysis of the fresh trash samples showed that 67% of trash is composed of tops (12.8 t/ha), and 33% is dry leaves. The studies with post-harvest residues of sugarcane trash in Brazil and in Australia showed the amounts of trash produced per hectare did not vary [25]. Table 5, Table 6 and Table 7 show the nutrient content, lignocellulosic materials content, and potential amount of trash produced in Australia (both tops and leaves).
4. Products from Sugarcane Wastes
4.1. Ethanol
4.1.1. From Molasses
Bioethanol and biodiesel are the only non-fossil liquid transport fuels currently of significance on a global scale. In 2007, the world production of biofuels exceeded 111 million L/d, which is sufficient to cover 1.5% of total road transport fuel use. Biofuel production is forecast by EIA to grow by about 8.6% annually to approximately 938 million L/d in 2030, increasing to 5.5% of total liquid fuel consumption [6]. Global production of ethanol is expected to increase by 2030 to 132 billion L [27].
Ethanol can be produced from a variety of sugarcane feedstocks, including juice, molasses and crystal sugar. Molasses (final) contains around 50% sugar. Ethanol can be used in several products, including perfume, toiletries, cleaning products and shoe polish, as well as being used as a fuel. In Australia, industrial-grade ethanol is manufactured from final molasses at Sarina by CSR Distilleries Operations Pty Ltd. and at Rocky Point by the ethanol plant attached to Rocky Point Mill. Bundaberg Distillery uses ethanol from fermented molasses to make rum. Bio-dunder is a waste product of the process and is used as a fertilizer on cane farms. Table 8 shows ethanol plants in Australia, the feedstock and the capacity of each plant.
In the fermentation of molasses or sugarcane juice, sucrose is hydrolysed to hexoses (glucose and fructose) which are fermented to ethanol, as shown in Equations (1) and (2) [6].
The most used feedstock to produce ethanol in the cane sugar industry is final molasses. The production of final molasses in Australia is around one million tons per annum.
The updated Gay–Lussac equation for the fermentation of sugars to ethanol is as follows [29]:
- Reaction:
- Molar mass balance (kmol × kg/kmol) 1×180.16 2×46.07 2×44.01
- Mass balance (%) 100.00 51.14 48.86
The maximum theoretical yield of ethanol, based on molar mass balance, is 51.14, and CO2 is 48.86 mass units produced per 100 mass units of dextrose. A series of experiments carried out by Pasteur in 1989 demonstrated that the maximum practical yield could not be more than 48.40 mass units of ethanol per 100 mass units of dextrose. This is because some of the dextroses are consumed in side reactions necessary for ethanol synthesis. There are many products from the side reactions such as glycerol, succinic acid, acetic acid and others. The yields between 88% and 94% are considered good in practice. The distillation efficiency is another factor that should be considered; distillation efficiencies are usually in the order of 98.5% or higher [29].
Table 9 shows the potential of production of ethanol from molasses in Australia, considering the variables involved in the process, such as conversion and distillation efficiencies.
The residue from the fermentation of final molasses can be concentrated and is called CMS (condensed molasses soluble). Using final molasses for ethanol production will affect animal feed, so CMS can be used to provide a substitute for final molasses in some animal feeds [8].
4.1.2. From Bagasse/Trash
Bagasse
Bagasse is lignocellulosic biomass that can be used for biofuel production such as ethanol. Sugarcane bagasse is an economically viable and very promising raw material for bioethanol and biomethane production. Converting cellulose to fermentable monosaccharides is a technical challenge. This process is hindered by many physico-chemical, structural and compositional factors. Pre-treatments are introduced to overcome these difficulties, such as with steam explosion, alkaline, diluted and concentric acid and ammonia. One or some of these pre-treatments may be required prior to enzymatic hydrolysis in order to make the cellulose more accessible by the enzymes [1].
The hydrolysis reactions for cellulose can be described by Equation (3), which results in the production of glucose monomers. However, the hydrolysis of hemicellulose, as shown in Equation (4), produces pentose monomers (five-carbon sugars), xylose and arabinose [8].
As shown in Equations (3) and (4) above, in the hydrolysis reaction of cellulose, the molecular weight increases by 11.1% and for hemicelluloses by 13.6%. Hydrolysis of cellulose is very important for ethanol production. It is glucose, not cellulose, that can be consumed by the fermenting bacteria. Cellulose is very stable under many chemical conditions because it has a crystalline structure due to the dense packing of cellulose chains. Cellulose is not soluble in water, many organic solvents, weak acids and weak bases.
Bagasse contains around 43% cellulose (dry basis) and has a complex structure, and for these reasons, pre-treatment is required. The harsh nature of the pre-treatment processes may lead to the formation of several degradation products, which may reduce hexose and pentose yields. Moreover, these products can be inhibitory to the organisms involved in the fermentation of the sugars to ethanol. These degradation products include furfural, 5-hydroxymethylfurfural, levulinic acid, formic acid, and acetic acid [8].
The crystalline nature of cellulose restricts the achievable theoretical yield of glucose from cellulose hydrolysis. While hemicellulose can only be hydrolysed to pentoses using mild acid, glucose can be fermented at very high efficiencies using conventional fermentation organisms. Fermentation of pentoses by yeasts and other organisms happens at a slow rate. Currently, the focus of research is on improving enzyme and fermentation organism effectiveness and minimising the formation of degradation products.
In Australia, there is in excess of 10 million tons of bagasse potentially available for the manufacture of ethanol. Bagasse represents a low-cost raw material when compared to wood, and its estimated value to the sugar mills is typically around AUD 40 per dry ton. Currently, bagasse is burned to produce steam and electricity [7].
A study by O’Hara (2010) stated that an ethanol yield of around 340 L/t dry fibre could be achieved. This consists of about 260 L/t dry fibre from the cellulose component and 80 L/t dry fibre from the hemicellulose component of the fibre [8]. The potential of ethanol produced from the dry fibre in bagasse is shown in Table 10.
In order to convert the crystalline structure of cellulose to an amorphous form, high temperature and pressure are required (>300 °C and 25 MPa). Generally, there are two methods to hydrolyse cellulose: chemically and enzymatically. The chemical method involves using concentrated strong acids and high temperature and pressure. This method results in toxic byproducts, which will affect the fermentation step and the fermenting bacteria. The enzymatic method is a milder treatment and seems to be much favorable to hydrolyse cellulose.
Table 11 shows the amount of energy produced from bagasse compared to bagasse-based ethanol. The gain can be around 171 million dollars in favour of ethanol production. It is worth mentioning that the number of wet solids leftover from this process is around 0.226 kg/kg wet bagasse, which can be used as boiler fuel. If ethanol is sold for AUD 1/L, then the total revenue from ethanol can be above AUD 171 million.
Trash
Franco et al. (2013) [25] reported that sugarcane trash, both tops and dry leaves, could be pre-treated hydrothermally. Hydrothermal treatment was carried out at 190 °C for 10 min reaction time and 1:10 (m:v) solid–liquid ratio. The pre-treated samples then underwent enzymatic hydrolysis. The percentage and amount of cellulose, hemicellulose and lignin in the trash (dry basis), both the tops and leaves, were estimated and presented in Table 12.
The hydrothermal pre-treatment aims to remove a large fraction of hemicellulose and the partial fraction of lignin. Glucose yields obtained after 72 h interval of enzymatic hydrolysis of trash subjected to hydrothermal pre-treatment are presented in Table 13 and Table 14. These processes considerably increase cellulose conversion to sugars. Based on the conversion of glucose to ethanol of 51.1% as reported by Lavrack (2003) [29], the potential amount of ethanol that can be produced from the trash from both the tops and the leaves is estimated as shown in Table 13 and Table 14.
The net energy gain from the produced ethanol and the solid remains after the fermentation process are estimated in Table 15. In Table 15, the potential energy produced from wet trash burned in the boiler is compared to the energy produced from converting the trash to ethanol. The saving can be around AUD 134,626,192/year; note that this does not include the capital and operation costs for producing ethanol from the trash. As shown in Table 15, the leaves can produce more ethanol compared to the tops, and this supports the suggestion made by Franco et al. (2013) [25] that the tops can be left at the field and the leaves used for alcohol production. If ethanol is sold for AUD 1 then the total revenue from ethanol (162.8 L/t wet tops and leaves) can be around AUD 380 million (tops AUD 158,933,000 and leaves AUD 222,274,000).
4.2. Other Alcohols
4.2.1. ABE—Bagasse/Trash
Butanol, an industrial solvent, can also be produced from renewable resources such as molasses, corn, wheat straw (WS), corn stover/fibre and other agricultural byproducts. Butanol is a superior fuel to ethanol. The fermentation process of butanol produces acetone–butanol–ethanol (ABE) with a typical ratio of 3:6:1 [30].
A batch fermentation experiment run with glucose (59.4 g/L) as a substrate for 72 h produced 21.37 g/L total ABE (0.31 g/L·h). The conversion of glucose to ABE was around 36% (21.37/59.4). When pre-treated wheat straw was used as a substrate, the optimum production of ABE was achieved, the ratio of acetone, butanol and ethanol in the fermentation broth was found to be 3:6:1, around 2.72 g/L acetone, 6.05 g/l butanol and 0.59 g/L ethanol in 50 h [30,31]. While in a study by Qureshi et al. 2008 [31], the productivity of 0.36 g/L·h and 0.77 g/L·h was observed in normal and highly active cultures, respectively. C. beijerinckii P260 was used as a hydrolysate to produce butanol from waste solid in integrated fermentations.
In a study by Jonglertjunya et al. (2013) [32], butanol production from the fermentation of sugarcane bagasse was considered using Clostridium sp. The bagasse was first pre-treated mechanically by a ball mill to reduce its particle size and then by acid hydrolysis at different temperatures. The results showed that 24 h butanol fermentation of sugarcane bagasse hydrolysate by Clostridium beijerinckii (TISTR 1461) provided the highest butanol concentration of 0.27 g/L. The bagasse (dry)-to-solvent ratio used was 1:10. However, ethanol and acetone were observed to be very low (<0.05 g/L).
In another study, Congcong Lu (2011) [33], showed that butanol could be produced from various agricultural bio-wastes using selected mutant strains of C. beijerinckii. Corn fiber, cassava bagasse, wood pulp and sugarcane bagasse were investigated as potential feedstocks for butanol production from ABE fermentation. In batch fermentation, 12.7 g/L and 15.4 g/L ABE were obtained using corn fibre hydrolysate and cassava bagasse hydrolysate, respectively. For wood pulp hydrolysate and sugarcane bagasse hydrolysate, 11.35 g/L and 9.44 g/L ABE, respectively, were produced [33]. By assuming the same conversion rate of the cellulose in the tops, leaves and bagasse, Table 16 and Table 17 show the potential amount of ABE produced and the revenue that can be generated from these wastes.
4.2.2. Furfural—Bagasse/Trash
Furfural is produced from several agricultural wastes such as corncobs, cottonseed hull, oat hull, bran, sawdust, bagasse and rice hull. The most readily available and potentially low-cost raw material for furfural production is bagasse. These biomasses contain the polysaccharide hemicellulose (pentosan); when hemicellulose is heated with sulfuric acid, it undergoes hydrolysis to yield the monosaccharide xylose. Under the same conditions of heat and acid, xylose undergoes dehydration to provide furfural [34].
Polysaccharide hemicellulose is available in many plant materials. It is a polymer of sugars that contains five carbon atoms each. When heated with sulfuric acid, it undergoes hydrolysis to yield sugars, principally xylose. Under the same conditions of heat and acid, xylose and other five-carbon sugars undergo dehydration, losing three water molecules to become furfural: [C5H10O5 → C5H4O2 + 3H2O].
In a study by Uppal et al. (2008) [34], the experiments were carried out to show furfural production from sugarcane bagasse. Bagasse samples were treated with different acids at variable concentrations, solid–liquid ratio of 1:15 at 110 °C and 1.05 kg/cm2 steam pressure for different reaction times of 30, 60 and 90 min. The study showed that 2% H2SO4 and 90 min reaction provided the highest yield. The highest amount of furfural was 14%.
Furfural can be converted to furfural alcohol with flammable hydrogen gas and requires pressure equipment. Based on a study by Wondu Business and Technology Services (WBTS; 2006) [35], around 9.2% furfural and 4.2% acetic acid could be produced from hydrolysis and dehydration of foliage wood (dry basis).
By considering the conversion rate presented by WBTS (2006) [35], Table 18 shows the amount of furfural and acetic acid that can be produced from the hemicellulosic portion of trash and bagasse.
Table 19 shows the revenue that can be made from investing in the production of furfural and acetic acid from these cellulosic byproducts. Note that the capital and operating costs associated with this process are not included.
4.3. Hydrogen—Bagasse/Trash
An investigation by Tanisho et al. (1996) [36], hydrogen production from anaerobic fermentation of sugar showed a conversion efficiency of 2.4 mol H2/mol sugar. The direct fermentation of sugarcane juice for the production of H2 does not seem feasible; it will be a major diversion from sugar or ethanol production. The available energy is around 1/1.35 of that in ethanol, and it comes at a price around 1.3-fold that of producing ethanol [37].
Lignocellulosic materials such as bagasse can be used to produce hydrogen after pre-treatment. There are two pre-treatment methods for sugar extraction from bagasse biomass, and in both methods, Enterobacter aerogenes MTCC 2822 is used: (a) hot water treatment (10% w/v, lasting 2 h,110 °C); the resulting extract contained ~1% sucrose (w/w), while in (b), bagasse is treated by acid hydrolysis (HCl 1N, 80 °C, 2 h) wherein the sugar yield increased to 2.5% (w/w).
Table 20 shows the potential of hydrogen production from generated sugar and the byproducts of sugarcane processing. In the case of bagasse as a substrate, the water extraction route seems to be a better alternative; although sugar recovery is limited to 1% (w/w), the advantage is complete recovery, and the spent bagasse can be reused as fuel or composting. Based on the study by Tanisho et al. (1996) [36], theoretical hydrogen production from sugar can be presented by the following equation.
- Reaction:
- Molar mass balance (kmol × kg/kmol) 1 × 180.16 2.4 × 2
- Mass balance (kg) 180.16 4.8
Table 20 shows the production of 26.6 kg H2 for each ton of sugar; this means a conversion of 2.6% only. Table 21 shows that converting sugar to hydrogen is not a feasible option; the revenue generated from sugar-based hydrogen is only 3.8% of the revenue generated from selling the sugar.
Sugarcane Trash is assumed to have a similar conversion to bagasse in order to estimate the hydrogen production potential for this byproduct. The potential amounts of energy and the revenue from this energy that can be produced from sugar, molasses, bagasse and trash are summarised in Table 21. The table shows the value of the hydrogen produced based on the cost of one GJ of energy from coal.
Based on the price of molasses of USD 100/t, the revenue generated from molasses-based hydrogen is only 7.8% of the molasses value in the market. Both options of producing hydrogen from sugar and molasses are not feasible based on the current conversion ratio and the available technologies in this regard.
Based on the water extraction method for producing hydrogen from the bagasse and trash, Table 21 shows the revenue that can be generated. In these cases, only cellulose was assumed to be consumed in the process.
4.4. Ethanol and Biogas—Bagasse/Trash
Anaerobic digestion (AD) of sugarcane waste is a promising strategy because the digestate could still be used to partially replace mineral fertilizers in addition to the production of biogas. Biogas could be upgraded to biomethane and sold as a new energy produced by the sugarcane plants. However, implementing a large-scale biogas plant using sugarcane waste as a substrate has many challenges. The C:N ratio of bagasse and trash are around 116:1 and 83:1, respectively. This shows a significant lack of nitrogen in these wastes. Moreover, not all the carbon content in these lignocellulosic substrates is available for degradation, such as lignin. In addition, sulfur and phosphorus contents are low. A co-digestion strategy is required to balance the macronutrients of the sugarcane waste and add nitrogen to balance the C:N ratio [40]. The results by Janke et al. (2015) [40] showed that hydrogen peroxide pre-treatment (1 h, 25 °C, 7.35% v/v) provides better results than lime pre-treatment, the total production of methane from the separated liquor and from the enzymatic hydrolysis (3.5 FPU/g, 25 CBU/g) of the solid residue achieved around 49.1 g methane/kg dry bagasse (74.8 L/kg). In addition, this process produced, from the other products (liquor from the enzymatic hydrolysis), around 201.5 g ethanol/kg dry bagasse and 112.7 g recovered lignin. Biochemical potential (BMP) tests were carried out under mesophilic conditions with the addition of a solution of macroelements (source of N, P, Mg, Ca, K), a solution of oligoelements, a solution of bicarbonate (buffer solution) and inoculum from an anaerobic digester.
In Australia, the price of electricity is around 30 cents/kWh for households, and it is around 15–26 cents for large commercial businesses. A biogas project in Australia can generate electricity for large industrial users for 7–10 cents/kWh. Such a project will generate more income from renewable energy certificates (RECs) and savings by recycling the generated heat. For example, a biogas plant that produces 26.5 million m3 of biogas (52% methane) annually will be able to generate 55 million kWh of electricity. This means that each one cubic meter of biogas can generate around 2.1 kWh of electricity worth 21 cents of electricity (10 cents/kWh). With further development in the field of pre-treatment of the substrates fed to the anaerobic digester, biogas yield and quality can be enhanced, and this may lead to higher economic benefit for the biogas plant owners [37].
Based on the price of electricity, the revenue from sugarcane waste can be around AUD 8.1 billion for the bagasse and trash (Table 22).
4.5. Dry Pellets—Bagasse/Trash
Bagasse is the fibrous residue of the cane stalk left after crushing and extraction of the juice. It consists of fibres, water and relatively small quantities of soluble solids—mostly sugar. The average composition of mill-run bagasse is as follows: fibre (including ash) 48%, moisture 50% and soluble solids 2% [41].
The calorific value (CV) of bagasse is provided by the formula [41]:
where; S = soluble solids % bagasse, W = moisture % bagasse, and, A = ash % bagasse,
Net CV = 18 309 − 31.1 S − 207.3 W − 196.1 A (expressed in kJ/kg).
In case of dry material;
If W = 0, S = 2 and A = 3, then the net CV of bone-dry bagasse = 17,659 kJ/kg.
In case of wet material;
If W = 50, S = 2 and A = 1.4 then the net CV of mill run bagasse = 7588 kJ/kg.
The ratio of the energy content of dry to wet bagasse is 2.33. This means that by drying the bagasse, there is a potential to raise the energy produced by 2.3 times for each kilogram burned.
The energy required for evaporating the water from the wet solid can be calculated as follows:
The amount of energy required to evaporate 1 kg of water at a medium drying temperature of 150 °C is;
Q = m [Cwater × (To − Ti) + λ]
Q = 1 kg [4.1868 KJ/(kg water.K) × (150 − 25) °C+ 2260 KJ/kg] = 2783 kJ
Most of this energy, around 80%, can be recovered by a heat exchanger (2226.7 kJ). Table 23 shows the energy required and the potential energy that can be recovered from burning dry bagasse.
The net energy difference between wet bagasse and dry bagasse can be around 14,925,400 GJ which means a saving of AUD 37,859,262, as shown in Table 24.
By using a similar approach for sugarcane trash, the revenue that can be made from burning wet trash can be around AUD 35 million. This can be increased by AUD 5 million when the trash is dried before burning it in the boilers (Table 25). However, these figures do not include the capital and operation costs of collecting, storing and hand selling the trash from the field.
Superheated steam drying may be suitable for drying these wastes as they are non-sensitive materials and save energy. There are many advantages for superheated steam drying that have been reported in the literature, one of these is the ability to recycle the steam through the process [42]. The only energy leaving the system in this case is the extra vapor that has been evaporated from the materials under drying, which saves energy. Dust collection in superheated steam drying is much simpler by passing the excess vapor through condensers [43,44]. Pronyk et al. (2004) [45] illustrated that the use of superheated steam as a drying medium for non-temperature sensitive products could lead to energy savings as high as 50–80% over the use of hot air or flue gases. These savings can be achieved due to higher heat transfer coefficients and the increased drying rates in the constant and falling periods if the steam temperature is above the inversion temperature. Some valuable volatile organic compounds generated from the drying material can be recovered and separated by a condenser [46,47]. Some applications involving steam drying are drying of fuels and biofuels with high moisture contents prior to combustion in a boiler and cattle feed exemplified by sugar beet pulp, lumber, paper pulp, paper and sludge [48].
4.6. Pyrolysis and Gasification—Bagasse/Trash
Pyrolysis and gasification are thermochemical processes where the gases and liquids produced can be used as energy. These processes produce a combination of gases such as methane (CH4), hydrogen (H), carbon monoxide (CO), carbon dioxide (CO2) and light hydrocarbons. Moreover, biochar and tar (bio-oil) are produced. These products have high commercial value and can be produced from the pyrolysis of bagasse. The pyrolysis of sugarcane bagasse occurs in the absence of oxygen and can be accomplished in two ways, with or without carrier gas (nitrogen). The literature emphasises that it is very difficult to perform this process without the use of carrier gas (N2); this occurs because of the formation of soot. Gasification takes place in the presence of oxygen in the form of air, pure oxygen or steam, and it is not therefore necessary to use a carrier gas. The gasification process can be defined as a process of partial combustion because it uses an amount of air less than that required stoichiometrically [49].
A company called Agri-Therm built the first bubbling fluidised bed mobile pyrolysis unit on the market. The cost of the mobile unit is estimated to be AUD 1.5 million, processing 3600 dry tones (20% MC) per year. The biochar produced from bagasse is expected to be of lower technical quality and can be valued at the lower end of the price range (AUD 250 per ton). Energy costs are minimal as the non-condensable gases, and entrained bio-oil from the pyrolysis are used to provide an energy self-sustaining operation [50].
Table 26 shows the results of a study by Figuero et al. (2013) [49]; the percentages of gas, tar and char produced at different reaction temperatures in a pyrolysis reaction. The table shows clearly that the increase in temperature favours the production of gas. Table 27 shows the percentages of gas, tar and char produced at different reaction times in a gasification reaction.
Table 28 and Table 29 show the conversion from mole per cent to weight per cent for the gases produced during the two processes.
Table 30 shows the potential amount of char, tar and gases produced during the pyrolysis and gasification processes for each tonne of wet bagasse.
Table 31 shows the potential energy generated from the gasses produced during the pyrolysis and gasification processes. It is worth mentioning here that the capital and operating costs for these processes are not included in the calculations of the revenues. Based on the revenue generated for each kilogram of dry solid bagasse, the revenue that can be generated from pyrolysis and gasification of cane trash is estimated in Table 32.
4.7. Pulp and Paper—Bagasse/Trash
In Australia, in 2003, an estimated 1.45 million tons of pulp were transformed into paper grades, of which 357,000 tones were imported [7]. Table 33 shows the quantity of bagasse produced in Australia and the potentially available quantity of de-pithed bagasse. The fibre content of the cane is 13%; 35% of the dry bagasse fibre is required to be removed as pith. Assuming 45% pulp yield, then chemical pulp produced from bagasse can be as much as 438,750 tons of pulp per year. The separated solid and pith would be returned to the sugar mill to generate energy [7]. The total gain, assuming no loss in the solid during the process, can be around AUD 777,137,455/year, as shown in Table 34. As the trash (top) is similar to the bagasse, the same pulp production rate of 0.088 kg pulp/kg dry solid is assumed to calculate the potential revenue from trash (tops). As shown in Table 34, the revenue that can be generated from the trash (tops) can be as much as 290 million dollars. The trash (leaves) were not considered for pulp due to its unsuitable structure for this process.
There are several technical challenges related to the manufacturing process of pulp from bagasse [7]; the following are some of these technical issues:
- ▪
- Storage: bagasse is a seasonal byproduct from the milling process; it is produced in huge quantities in a short period of time. Large storage facilities and long storage time is required in order for the pulping process to proceed. Special methods of storage are required as bagasse is prone to biological activity. This may lead to color and fibre degradation, as well as loss of fibre properties;
- ▪
- De-Pithing: bagasse normally contains 30–35% fine, thin walled and low cellulose content cells, which should be removed from the pulping process. These cells are called “Pith Cells”, the presence of such fibres can result in higher consumption of chemicals, poor draining pulp and reduced scattering power in mechanical pulps. An enhanced de-pithing process is required to reduce economic losses;
- ▪
- Silica content: bagasse contains high quantities of silica compared to woody fibre sources such as eucalyptus. Silica is a major issue in the pulping process. The removal, chemical recovery or other reliable methods are required to make the operation practical.
4.8. Product from Sugar—Ethanol
Theoretically, around 48.4% of the sugar can be converted to ethanol. Table 35 shows that converting sugar to ethanol can generate extra revenue of around AUD 974,175,411/year.
5. Sustainability of Sugarcane Production
There are 100 million people on the globe who make a livelihood from the sugarcane industry. The industry needs to overcome significant obstacles to accomplish voluntary sustainability standard (VSS) compliant sugarcane. This includes control pollution and greenhouse gas emission, enhancing producer profitability and providing a healthy, safe environment and respect for the right of the laborers [51].
The European Union imported more than 43 million liters of ethanol produced from Brazilian sugarcane. Brazil produces ethanol from sugar, currently this leading to exploitation and destruction of Amazon and Pantanal native vegetation [52]. This is happening in other countries; for example, Australia is currently working to reverse the impact of nutrient runoff on the Great Barrier Reef, which has been an issue for a long time [26]. Adding to these issues, artificial sugar can threaten this industry and direct its bath to less profitable products of biofuel from sugar.
This article addresses two of the important factors to accomplish sustainability in this industry: enhancing profitability and reducing greenhouse emissions. One way to execute this is by utilising the byproducts (rather than sugar) from this industry, such as bagasse, molasses and cane trash, to produce biofuel and other products that have a higher value. The technology is still progressing to make biofuel from lignocellulosic material economically feasible [53]. Moreover, the use of sugarcane byproducts does not conflict with land use for agricultural products. A small portion of the byproduct biomass can be left on the ground for soil enhancement purposes, and a larger portion can be utilised in the production of biofuel.
6. Recent Development in Sugarcane Industry
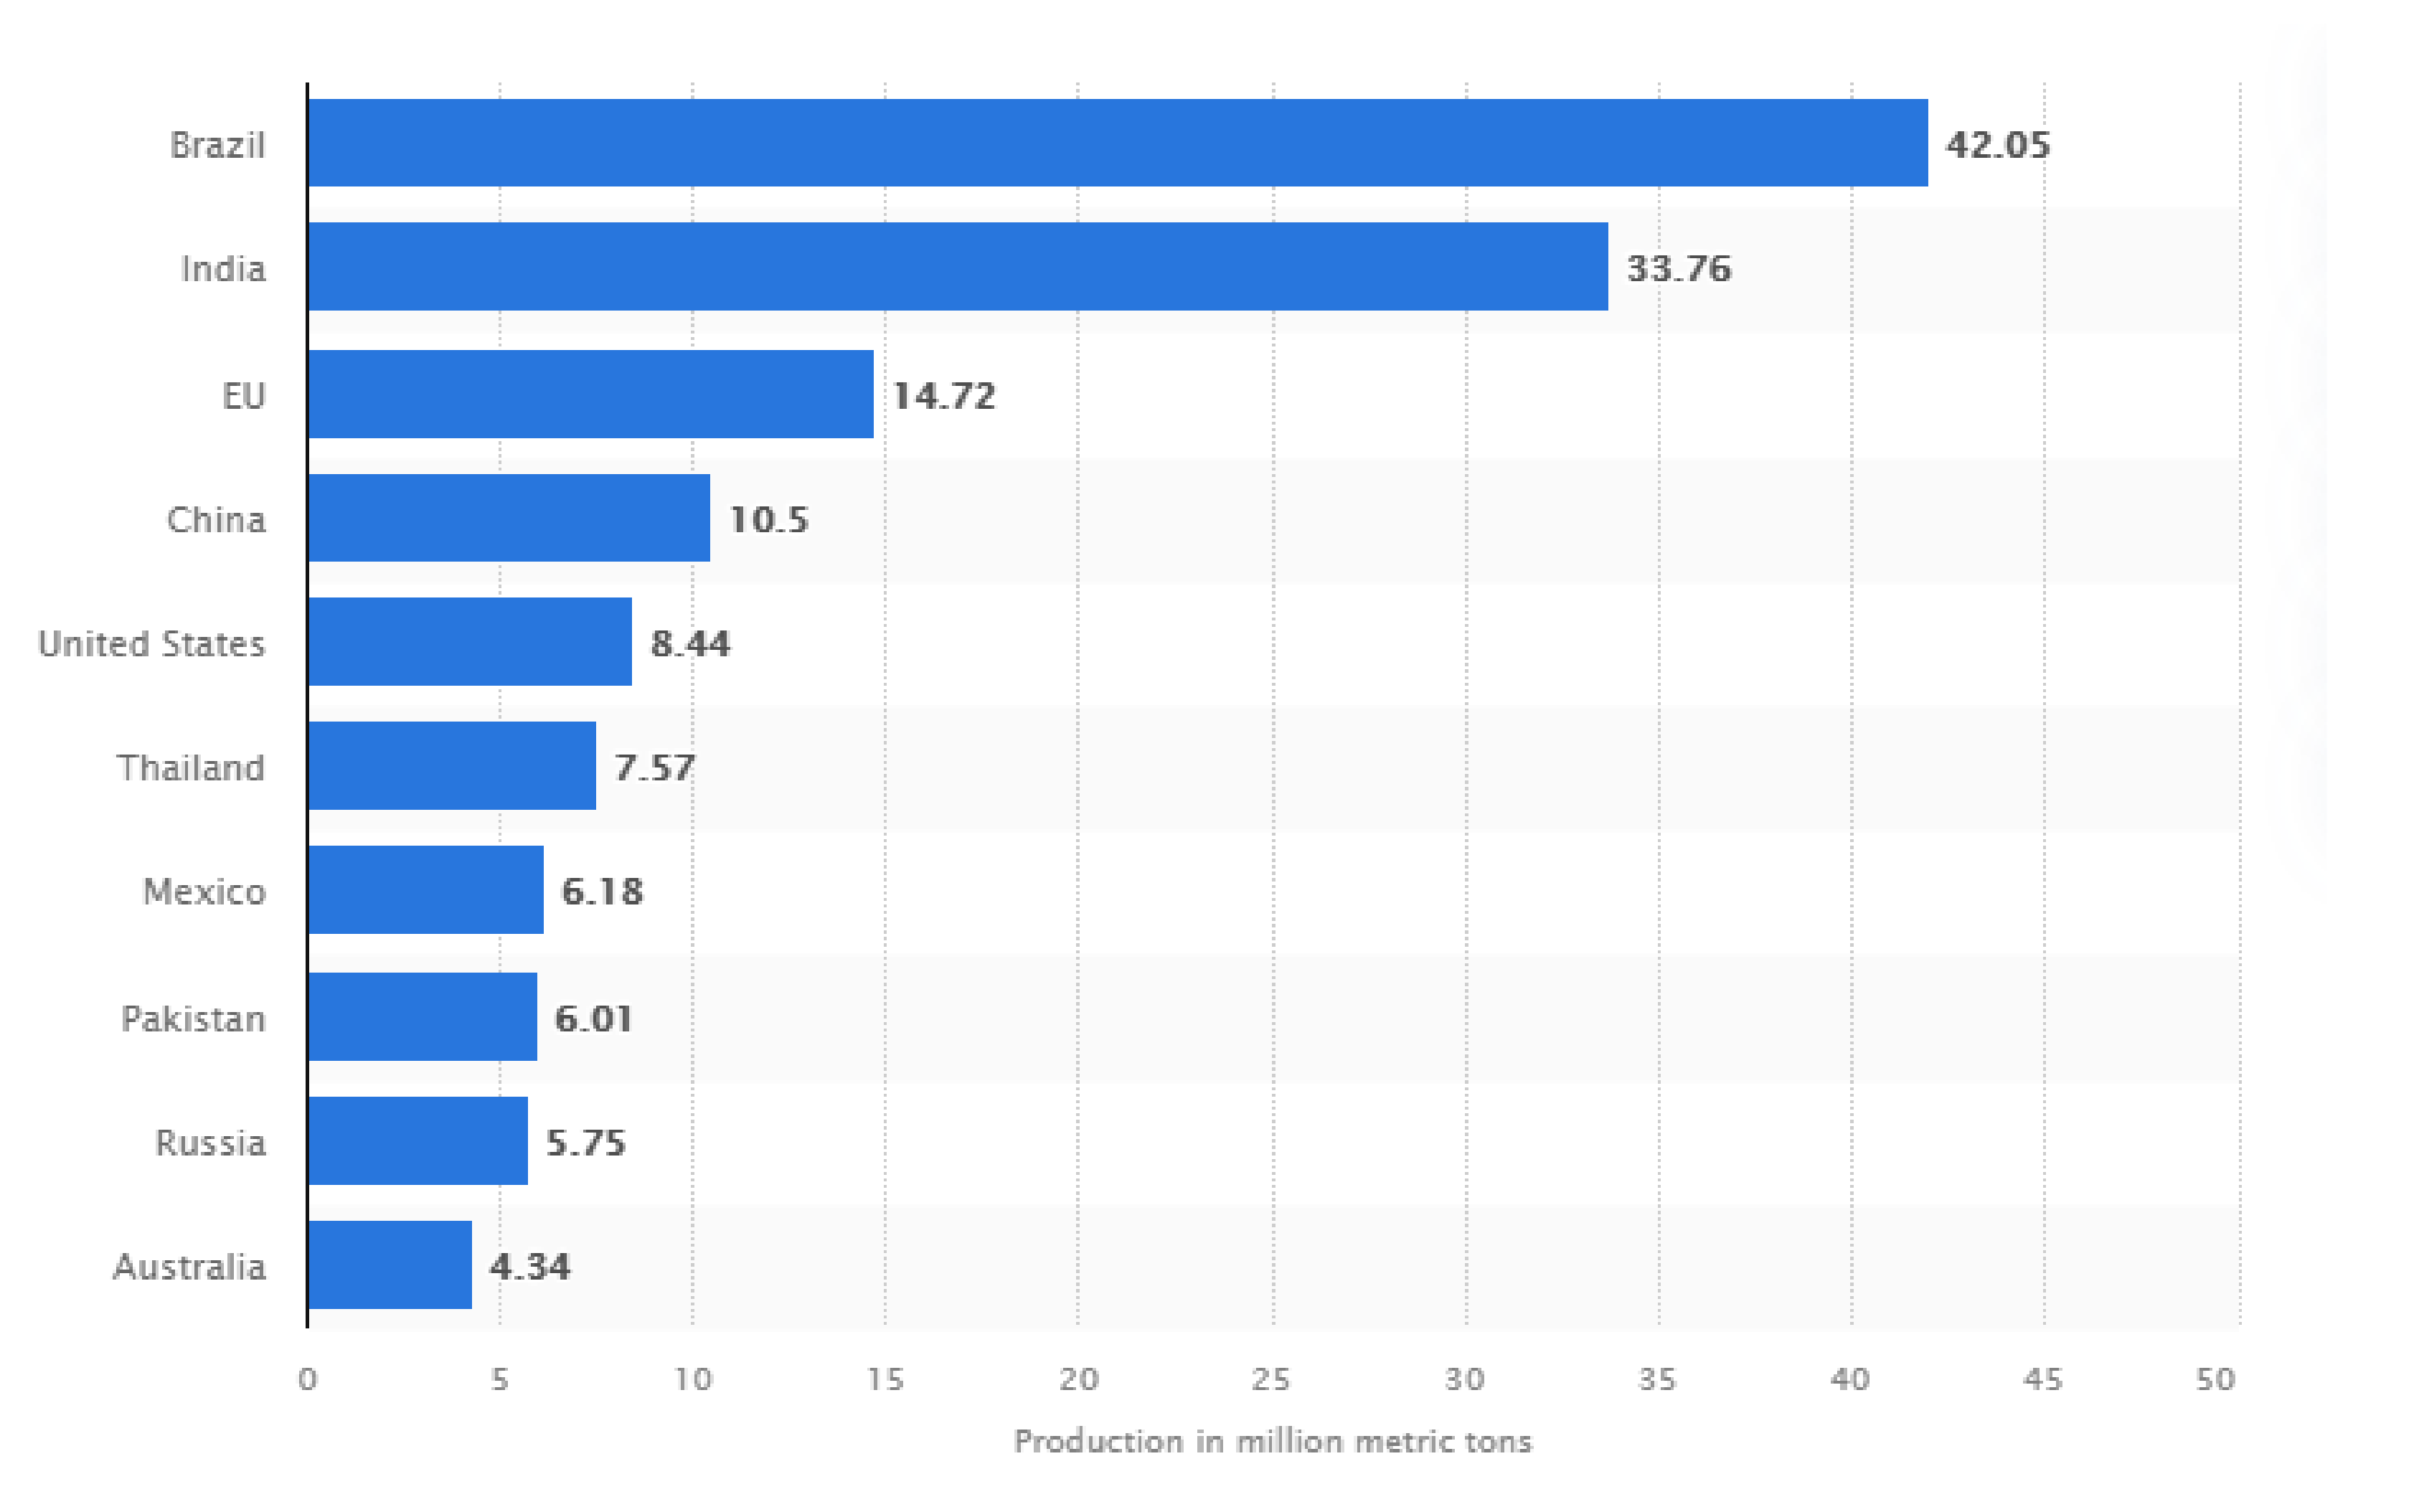
Worldwide sugarcane production in 2020/2021 reached 1,889,268,880 tons produced per year. The largest sugarcane producer in the world is Brazil, with 768,678,382 tons per year. The second highest producer is India, with 348,448,000 tons yearly production. Both countries, Brazil and India, produce 59% of the world’s total. Australia ranks eighth in the world with 34,403,004, and the production increased by around 4 million tons in the last decade [54]. Worldwide sugar production in the 2019–2020 crop year was approximately 166.18 million metric tons. The global sugar production in 2020/2021 was approximately 179 million metric tons [55]. Sugar production worldwide, by leading country, is presented in Figure 3; the figures are in a million metric tons. Based on the sugar production figures, bagasse, trash, molasses and mill mud can be calculated as they represent percentages of the sugar production.
In 2019 the price (in USD) of exported molasses increased to USD 120/ton [22]. Recent prices in 2021 for different energy sources are as following: ethanol USD 0.586/L, coal USD 0.171/kg, natural gas 0.121/m3, and bagasse USD 29–35/dry ton.
Based on Table 1 and the percentages of each of the byproducts produced per tone of sugar, Table 36 shows the expected global byproducts productions in 2020/2021. Following the same method/concept above, an estimation of biofuel production from these byproducts can be derived. By 2030, global ethanol production is expected to increase to 132 billion L. Currently, maize contributes to about 60% of the ethanol produced, sugarcane 25%, wheat 3%, molasses 2% and the remainder from other grains, cassava or sugar beets [27].
In a study by Strain and Akshaya [56], they showed 74 ± 3 g/L of fermentable sugar from pre-treated bagasse, steam-exploded acid bagasse can be achieved, in addition to bioethanol production of 34 ± 2 g/L during a fermentation period of 36 h [56]. The theoretical amount of bioethanol that can be produced from sugar (glucose) is 0.51 g of ethanol per 1 g of glucose. In a recent study, bioethanol production of 82.1 g/L was reported. Sulphite pre-treated momentary pine slurry (25%, w/w) was used as a substrate. Pre-hydrolysis was performed at 50 °C for 24 h and 200 rpm, and this was then followed by fermentation at 28°C or 35 °C using 5 g/L dry inoculums of S. cerevisiae. It is also reported the production of bioethanol was increased from lignocellulosic materials after pre-treatment in feedstocks with 3.5% H2SO4 at 121 °C for 30 min, followed by enzymatic hydrolysis [57].
Currently, wood chips and logging residues represent the largest share of biomass fuels; depending on its composition (ash and moisture contents, and calorific value), its energy content may vary considerably. In general, the moisture content of the wood chips varies from 35% to 45%, which has a calorific value of 18.4 to 19.6 MJ/kg and ash content from 0.5% to 4.5% [58]. Lignocellulosic biomass (trash, bagasse and other agro-residues) generally consists of the combination of lignin (26–31%), hemicellulose (25–32%) and cellulose (41–46%). Methane, hydrogen, ethanol, butanol or other forms of fuels can be generated from lignocellulosic biomass after going through intensive thermal and/or chemical pre-treatments. A renewable supply of bioenergy can then be created by the biological systems [59].
The authors of [60] designed and investigated a system for biomass-based hydrogen production integrated with the organic Rankine cycle. The aim was to predict the performance of the system, under various operating conditions, regarding hydrogen production yield and electricity generation. Different types of biomass such as wood chips, manure and sorghum were compared under the same operating condition. Wood chips demonstrated a maximum hydrogen yield of 11.59 mol/kg. After optimising the system using a genetic algorithm based on the response surface model, a hydrogen yield of 39.31 mol/kg was shown to have achievable [60].
Biogas production in anaerobic digestion can be increased by carrying out the best pre-treatment techniques, trace metal additive and control process conditions such as temperature, pH, C/N and volatile solid percentage. It was reported that thermochemical pre-treatment of bagasse enhanced its anaerobic biodegradation. Moreover, the pre-treatment of biomass with ultrasonic improved biogas production to 71%, the range used was 31–93 W h/L. This has contributed to increasing the solubility of cellulose and hemicelluloses in the feedstock [61].
The recent reporting on pyrolysis yield and product distribution is presented in Table 37. It can be seen that slow pyrolysis targets biochar, fast pyrolysis targets bio-oil, while intermediate pyrolysis targets both [62].
To develop a global-scale biofuel production from organic trash, a biomass trash collection and effective regulatory strategies need to be established. A study in 2021 [59] discussed the advances in the manufacturing of biofuels from agro-residues utilising the novel technologies currently available. It is obvious that the efficiency and yield of biofuel from sugarcane byproducts (or other agro-residues) have not progressed effectively in the last few decades because it is limited by the chemical/biological reaction and the content of the agricultural byproducts. The only progress is in the processes; nowadays, processes to produce biofuel from biomass become more energy-efficient, have less labor required and more efficient in utilising chemicals/enzymes.
Biofuel yield from biomass has limitations; a development of the current technologies is required to ease the pre-treatment process to overcome the limitations and make the concept of biorefinery commercially viable [63]. The transition to bioeconomy can be pursued by either addressing fossil fuel dependence sustainably or showing a human-activity impact on the environment [64].
The European Commission supports the conversion of renewable biomass into value-added products and bioenergy. In October 2018, a new bioeconomy strategy aimed at promoting a sustainable Europe was commenced. However, not much was conducted to analyse the impacts of bioeconomy sectors development [65]. Subsidies bioenergy (biomethane) for usage as vehicle fuel instead of natural gas for the potential reduction in emissions is essential for the development of the bioenergy industry. The subsidies must be accompanied by other development such as the construction and operation of new fueling facilities and the increase in vehicles derived by biomethane [66].
In this study, the aim was to introduce the investors in this field, manufacture second-generation biofuel from agricultural biomass/byproducts, to the limitation of the production. Despite the advance in chemical, thermal and biological technology, these only will contribute to producing the maximum amount of biofuel limited by the chemical/biological reaction and the content of the raw materials. The yield for each of the biofuel discussed in this article is based on the chemical formula of the raw materials.
The investor should account for the capital and operational cost, and carry out the Net Present Value (NPV) calculation to justify any investment. Investing in this field is volatile due to changes in regulation, price of the raw materials and final products.
7. Conclusions and Recommendations
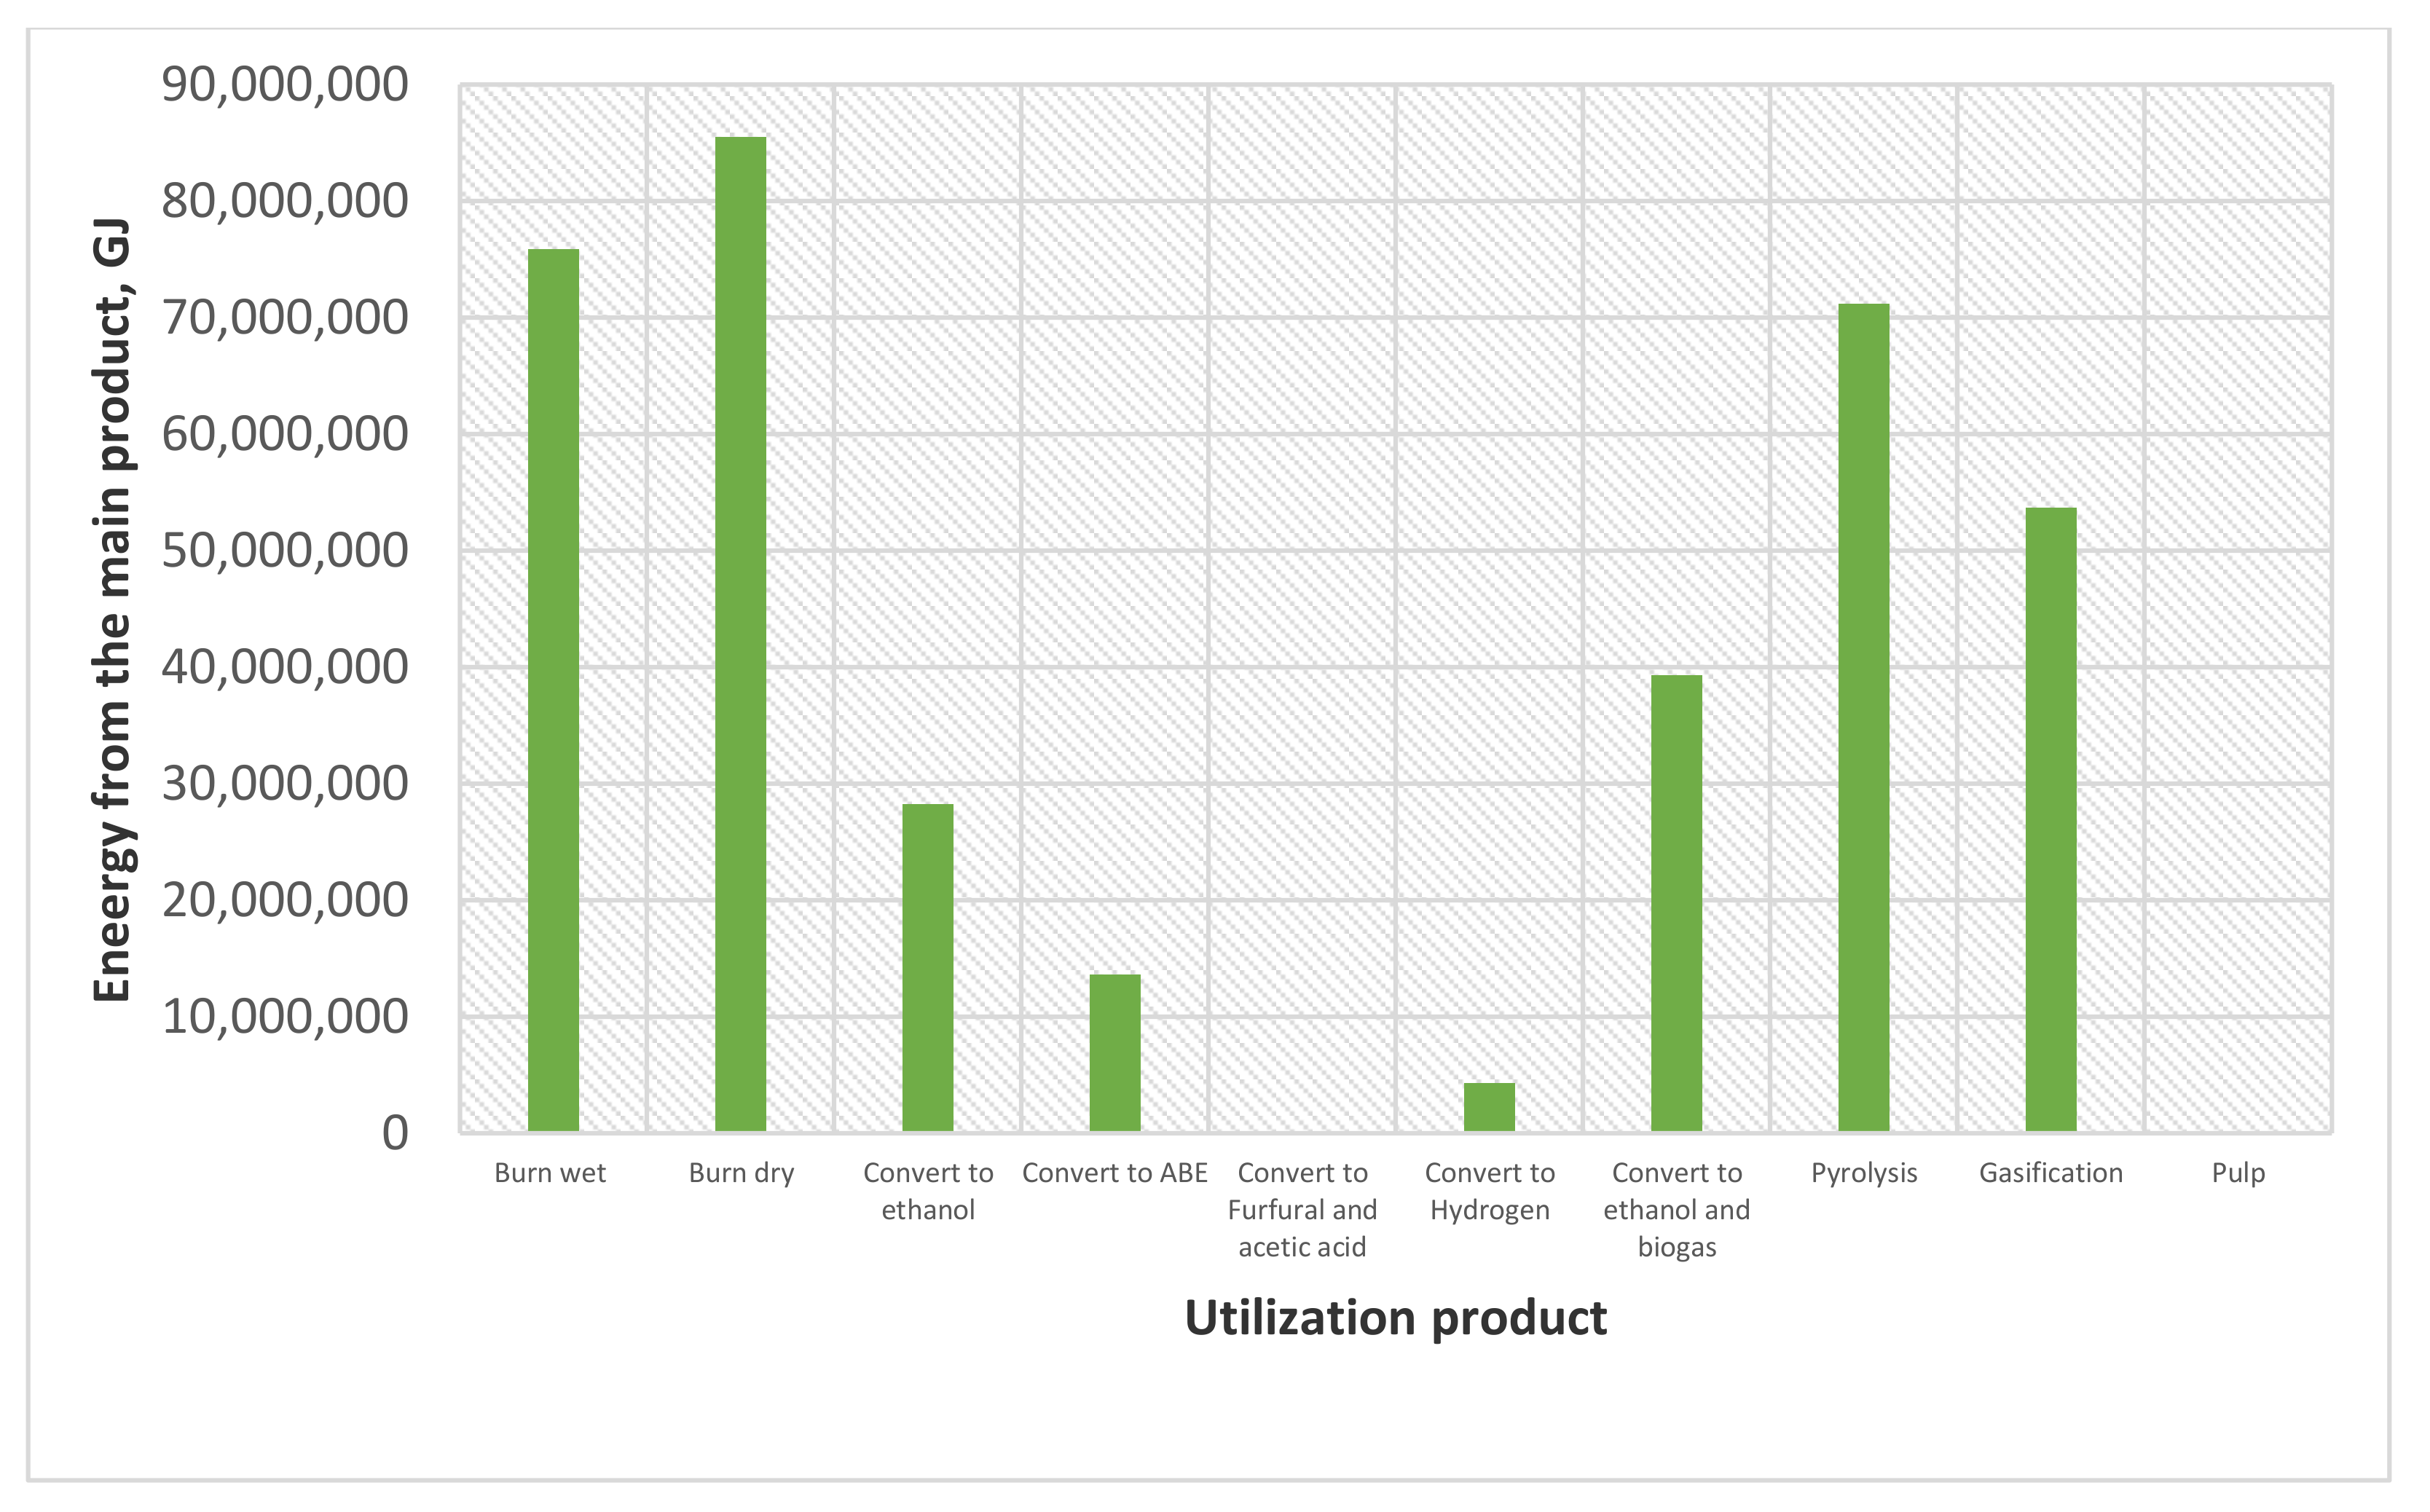
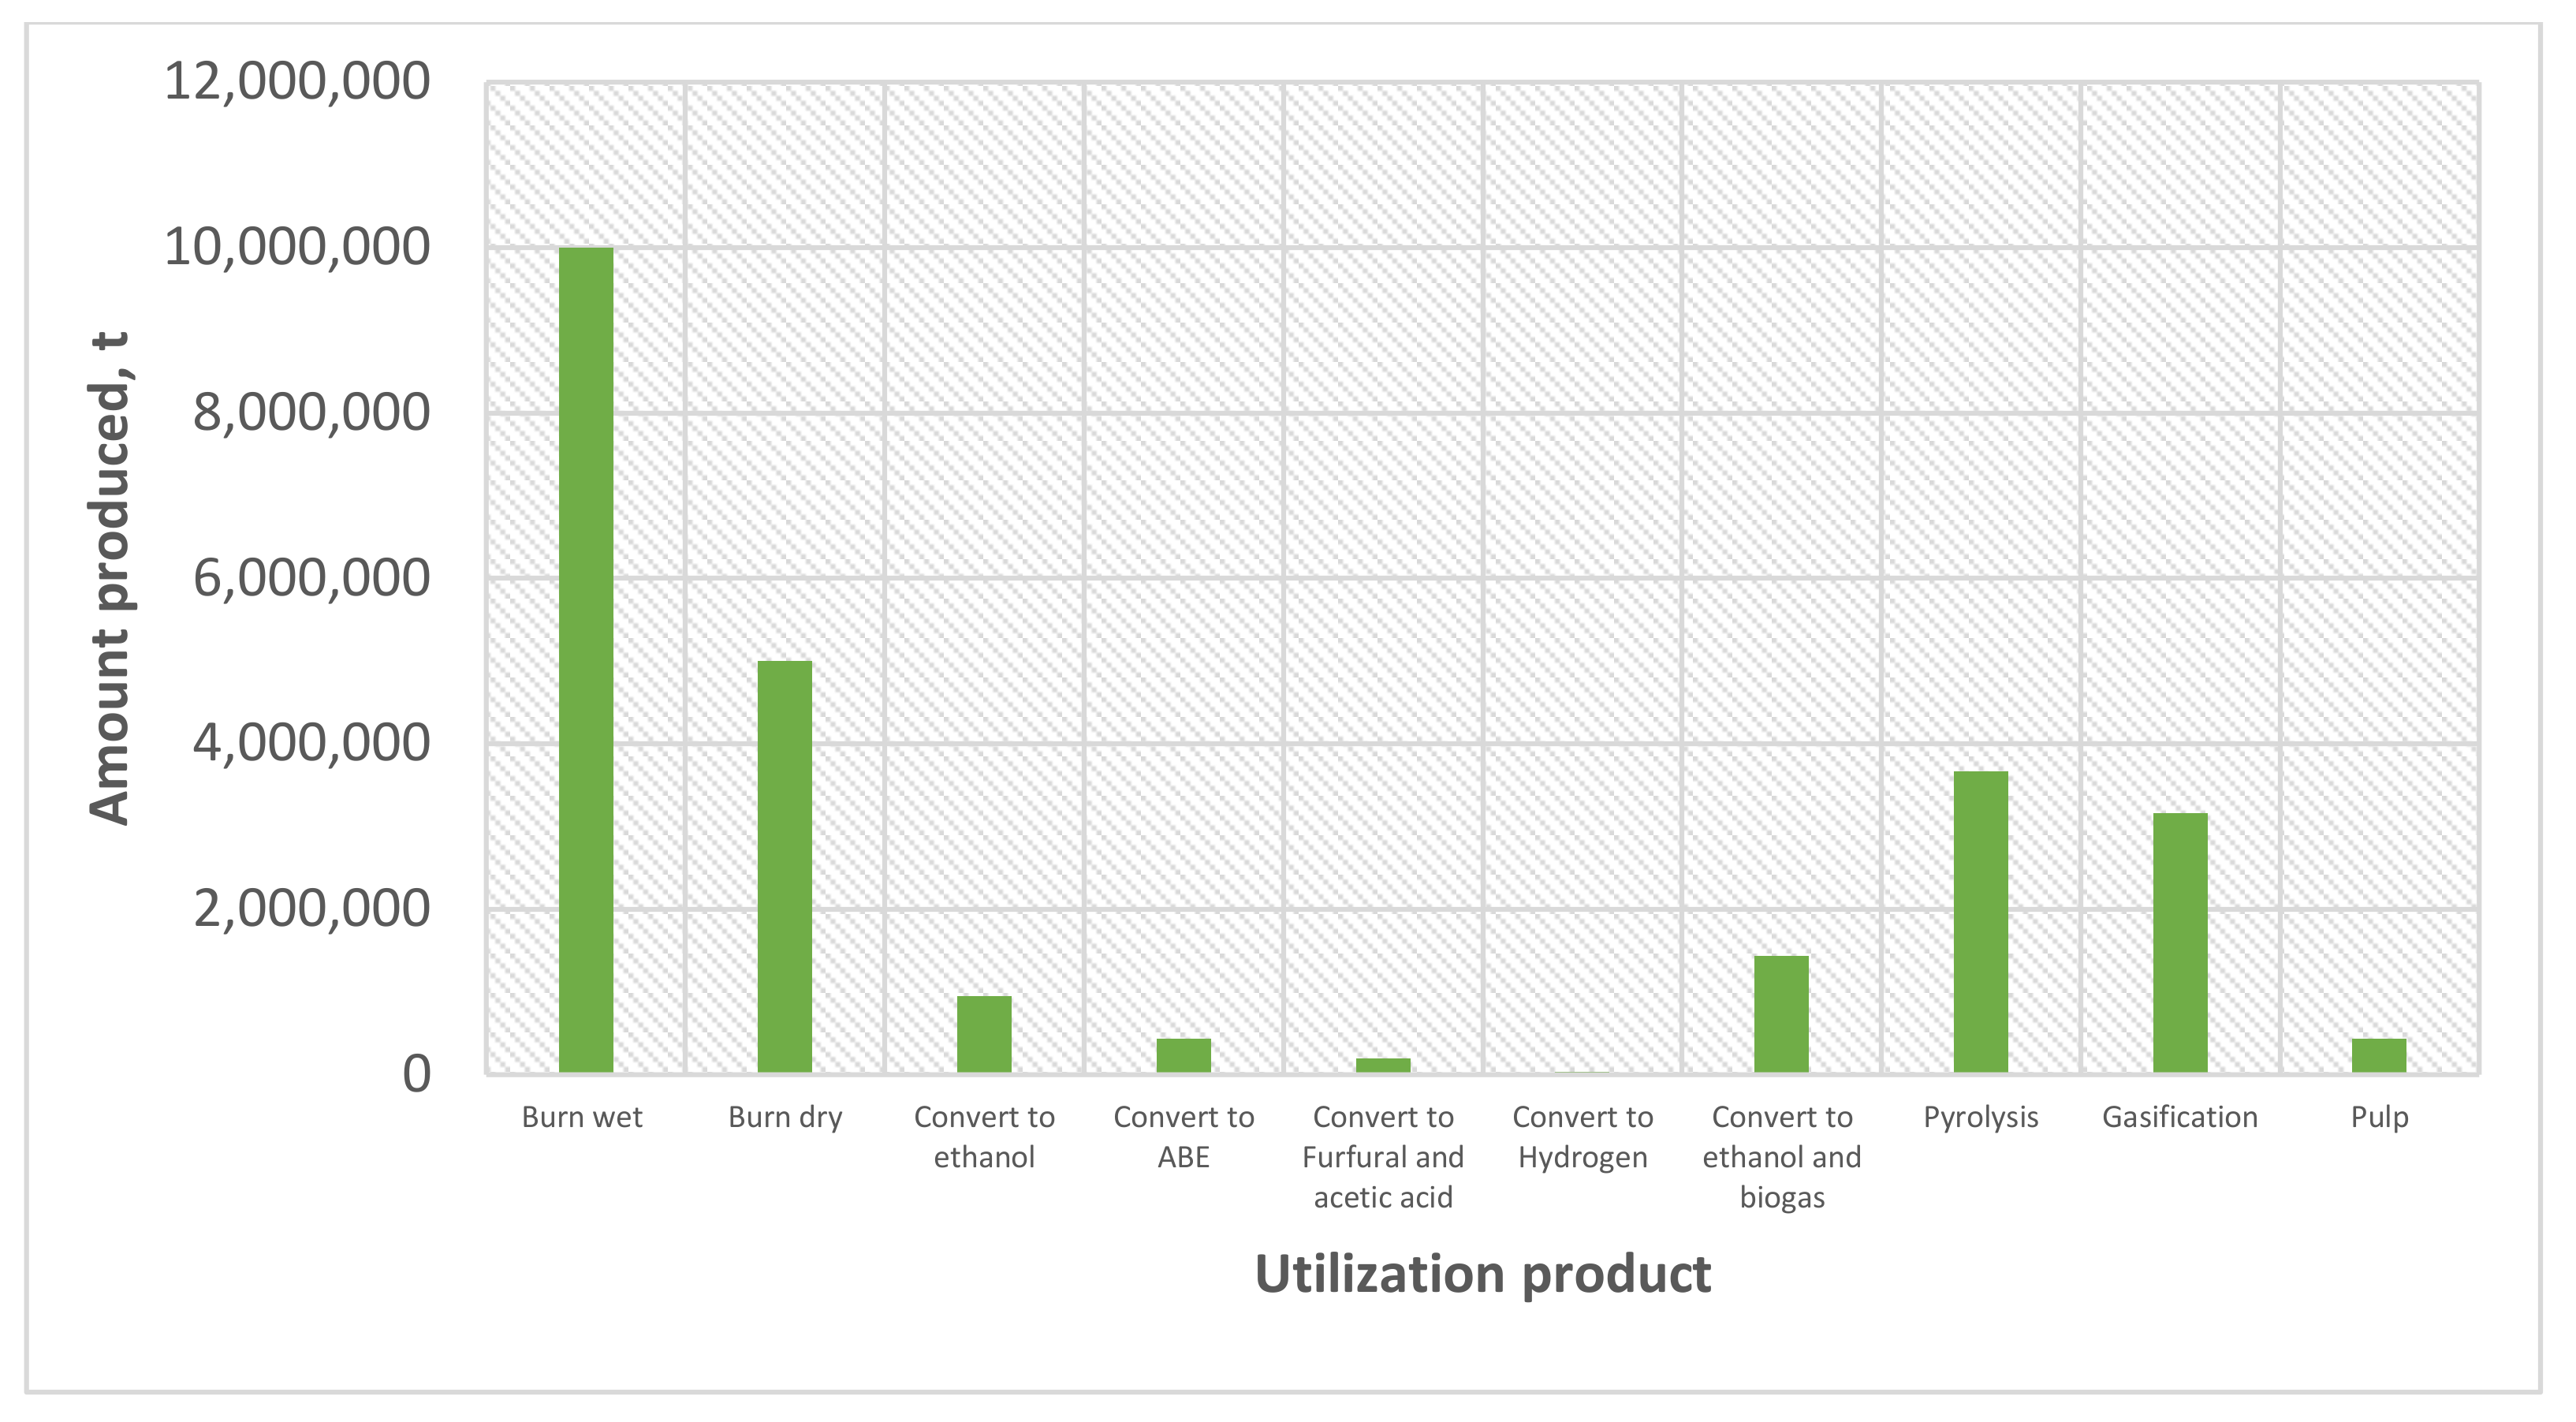
Table A1 (Appendix A) and Figure 4, Figure 5 and Figure 6 summarise the findings of this study by comparing the potential energy produced from each byproduct. In many cases, the capital and operating costs for the technology used in utilising the wastes were not included in the estimates. The value of energy is based on the energy content and price of coal. Moreover, the market prices of some of the products were not included. The sugarcane milling industry produces one main product, sugar and four byproducts: molasses, bagasse, cane trash and mill mud/ash mixture. Sugar is an edible product, and it is not recommended to be used for any other purposes even though an extra one billion dollars can be made from converting sugar to ethanol.
Molasses is a byproduct that can be used for human consumption and animal feeds and to produce ethanol due to its high sugar content (around 50–70%). Based on the current market value of molasses, it is recommended that molasses be converted to ethanol to generate revenue of around AUD 165 million. The current practice of burning bagasse in the milling boiler has the potential to generate about AUD 38 million when first dried, around AUD 1.2 billion per year when converted to ethanol and AUD 1.35 billion when converted to ethanol/biogas. It is worth mentioning that fermenting bagasse comes with many technical challenges, such as the pre-treatment processes. Fermenting bagasse to ABE is a good option compared to burning it; however, the revenue generated is much lower than converting it to ethanol. When fermenting bagasse to furfural, acetic acid and hydrogen are not feasible options because the revenues generated from these processes are lower than burning bagasse. Pyrolysis, gasification and production of pulp are all feasible options but still way below ethanol or ethanol/biogas production. The same also applies to sugarcane trash.
As shown in Figure 5, the product that has the highest energy content is the dry bagasse (drying energy is subtracted from the net energy) followed by wet bagasse, products from pyrolysis and gasification. Figure 5 does not consider the leftover solid from these processes. For example, if the energy from the leftover solid from the ethanol production process is added to the energy content of the produced ethanol, the total energy will be approximately 80% of the energy content in the dry bagasse. However, if the energy consumed during the production of ethanol from bagasse is considered, the net energy of this process will significantly be lower than that of dry bagasse. It is obvious that the value of the final product depends on the energy consumed during the processes of conversion. Despite the fact that the amount of ethanol/biogas produced is less than the other products, as shown in Figure 6, these two products have the potential to produce the highest revenue Figure 4.
Author Contributions
Conceptualisation, methodology, validation, formal analysis, investigation, resources, data curation and writing—original draft preparation: I.H. Review, editing and visualisation: W.d.S., S.S. and J.B., All authors have read and agreed to the published version of the manuscript.
Funding
This research received no external funding.
Institutional Review Board Statement
Not applicable.
Informed Consent Statement
Not applicable.
Data Availability Statement
This study did not report any data.
Conflicts of Interest
The authors declare no conflict of interest.
Appendix A

Table A1.
Value proposition for different scenarios of utilising the wastes from sugarcane milling industry.
Table A1.
Value proposition for different scenarios of utilising the wastes from sugarcane milling industry.
| Utilisation Method | Amount, kg/t Material | Total Amount, t/Year | Energy Content, kJ/kg | Total Energy, GJ | Value, AUD | |
|---|---|---|---|---|---|---|
| Sugar and Molasses | ||||||
| Sugar (AUD 390/t) | --- | 4,360,000 | --- | --- | 1,700,400,000 | |
| Sugar to Ethanol (based on energy content) | 484 | 2,110,240 | 29,677 | 62,625,592 | 246,118,576 | |
| Sugar to Ethanol (AUD 1/L) | 484 | 2,110,240 | --- | --- | 2,674,575,411 | |
| Molasses (AUD 100/t) | --- | 1,000,000 | --- | --- | 100,000,000 | |
| Molasses—Ethanol (based on energy content) | 209 | 209,766 | 29,677 | 6,225,226 | 24,465,137 | |
| Molasses—Ethanol (AUD 1/L) | 209 | 209,766 | --- | --- | 265,863,000 | |
| Bagasse | ||||||
| Burn Wet | --- | 10,000,000 | 7588 | 75,880,000 | 298,208,400 | |
| Burn Dry (energy for drying included) | 500 | 5,000,000 | 17,659 | 85,513,400 | 336,067,662 | |
| Sell dry (AUD 40/t) | 500 | 5,000,000 | --- | --- | 200,000,000 | |
| Ethanol | Ethanol (Energy) | 268.3 | 952,859 | 29,677 | 28,277,996 | 111,132,526 |
| Ethanol (AUD 1/L) | 268.3 | 952,859 | --- | --- | 1,207,680,000 | |
| dry solid | 226 | 2,260,000 | 17,659 | 39,909,340 | 156,843,706 | |
| ABE | ABE (energy) | 45.3 | 435,000 | 31,377 | 13,648,995 | 53,640,550 |
| ABE (AUD 1/L) | 45.3 | 435,000 | --- | --- | 559,259,259 | |
| dry solid | 260 | 2,600,000 | 17,659 | 45,913,400 | 180,439,662 | |
| Furfural + acetic acid | Furfural (AUD 1200/t) | 13.7 | 136,896 | --- | --- | 164,275,200 |
| Acetic acid (AUD 550/t) | 6.3 | 62,496 | --- | --- | 34,372,800 | |
| Dry solid | 0.317 | 3,168,000 | 17,659 | 55,943,712 | 219,8587,88 | |
| Hydrogen, Water extraction | H2 (energy) | 3.06 | 30,600 | 142,000 | 4,345,200 | 17,076,636 |
| H2 (AUD 2.7/kg) | 3.06 | 30,600 | --- | --- | 82,620,000 | |
| Dry solid | 260 | 2,600,000 | 17,659 | 45,913,400 | 180,439,662 | |
| Biogas + Ethanol | Biogas (energy) | 86.02 | 430,100 | 22,000 | 9,462,200 | 37,186,446 |
| Biogas (Electricity) | 86.02 | 430,100 | --- | --- | 78,540,000 | |
| Ethanol (energy) | 201.2 | 1,005,975 | 29,677 | 29,854,320 | 117,327,477 | |
| Ethanol (AUD 1/L) | 201.2 | 1,005,975 | --- | --- | 1,275,000,000 | |
| Pyrolysis at 900 °C for 1 h | --- | 3,664,000 | --- | 71,171,500 | 529,703,000 | |
| Gasification at 900 °C | --- | 3,158,500 | --- | 53,707,000 | 415,819,000 | |
| Pulp | Pulp (AUD 1132/t) | 0.044 | 438,750 | -- | -- | 496,665,000 |
| Remain solid | 0.94 | 9,405,250 | 7588 | 71,367,037 | 280,472,455 | |
| Total | 777,137,455 | |||||
| Burn Wet | Tops | --- | 4,748,800 | 4472 | 21,239,150 | 83,469,859 |
| Leaves | --- | 2,337,300 | 15,417 | 36,036,421 | 141,623,134 | |
| Burn Dry + drying energy included | Tops | 0.38 | 1,804,544 | 17,659 | 30,226,492 | 118,790,113 |
| Leaves | 0.91 | 2,122,268 | 17,659 | 37,357,365 | 146,814,444 | |
| Ethanol Tops | Ethanol (energy) | 33.5 | 158,933 | 29,677 | 4,716,654 | 18,536,452 |
| Ethanol (AUD 1/L) | 33.5 | 158,933 | --- | --- | 201,435,995 | |
| dry solid | 131.5 | 624,859 | 17,659 | 11,034,385 | 43,365,133 | |
| Ethanol Leaves | Ethanol (energy) | 95.1 | 222,274 | 29,677 | 6,596,425 | 25,923,952 |
| Ethanol (AUD 1/L) | 95.1 | 222,274 | --- | --- | 281,716,096 | |
| dry Solid | 356 | 832,014 | 17,659 | 14,692,535 | 57,741,663 | |
| ABE tops | ABE (energy) | 22.6 | 107,391 | 31,377 | 3,369,607 | 13,242,557 |
| ABE (AUD 1/L) | 22.9 | 107,391 | --- | --- | 132,581,481 | |
| dry solid | 94 | 470,000 | 17,659 | 8,299,730 | 32,617,938 | |
| ABE leaves | ABE (energy) | 66.9 | 156,592 | 31,377 | 4,913,387 | 19,309,611 |
| ABE (AUD 1/L) | 66.9 | 156,592 | --- | --- | 193,323,456 | |
| dry solid | 240 | 1,200,000 | 17,659 | 21,190,800 | 83,279,844 | |
| Furfural + acetic acid Tops | Furfural (AUD 1200/t) | 3.1 | 14,609 | --- | --- | 17,530,800 |
| Acetic acid (AUD 550/t) | 1.4 | 6669 | --- | --- | 3,667,950 | |
| Dry solid | 0.163 | 774,149 | 17,659 | 13,670,697 | 53,725,839 | |
| Furfural + acetic acid Leaves | Furfural | 6.4 | 15,034 | --- | --- | 18,040,800 |
| Acetic acid | 2.9 | 6863 | --- | --- | 3,774,650 | |
| Dry solid | 0.472 | 1,103,579 | 17,659 | 19,388,779 | 76,197,903 | |
| Hydrogen, Trash—Tops, water extraction | H2(energy) | 3.06 | 8440 | 142,000 | 1,198,480 | 4,710,026 |
| H2 (AUD 2.7/kg) | 3.06 | 8440 | --- | --- | 22,788,000 | |
| Dry solid | 260 | 969,040 | 17,659 | 17,112,277 | 67,251,250 | |
| Hydrogen, Trash—Leaves, water extraction | H2 (energy) | 3.06 | 9920 | 142 | 1,408,640 | 5,535,955 |
| H2 (AUD 2.7/kg) | 3.06 | 9920 | --- | --- | 26,784,000 | |
| Dry solid | 260 | 1,090,845 | 17,659 | 19,263,231 | 75,704,501 | |
| Biogas + Ethanol (tops + leaves) | Biogas (energy) | 86.02 | 337,784 | 22,000 | 7,431,248 | 29,204,804 |
| Biogas (Electricity) | 86.02 | 337,784 | --- | --- | 61,682,362 | |
| Ethanol (energy) | 201.2 | 790,054 | 29,677 | 23,446,432 | 92,144,479 | |
| Ethanol (AUD 1/L) | 201.2 | 790,054 | --- | --- | 1,001,337,060 | |
| Pyrolysis at 900 °C for 1 h | Tops | --- | --- | --- | --- | 191,281,664 |
| Leaves | --- | --- | --- | --- | 149,777,152 | |
| Gasification at 900 °C | Tops | --- | --- | --- | --- | 224,960,408 |
| Leaves | --- | --- | --- | --- | 176,148,244 | |
| Pulp Tops | Pulp (AUD 1132/t) | 0.088 | 158,799 | --- | --- | 179,761,455 |
| Remain dry solid | 0.88 | 1,587,998 | 17,659 | 28,042,456 | 110,206,854 | |
| Total | 289,968,309 | |||||
References
- De Albuquerque Wanderley, M.C.; Martín, C.; de Moraes Rocha, G.J.; Gouveia, E.R. Increase in ethanol production from sugarcane bagasse based on combined pretreatments and fed-batch enzymatic hydrolysis. Bioresour. Technol. 2013, 128, 448–453. [Google Scholar] [CrossRef] [Green Version]
- Kent, A.; Mercer, D. Australia’s mandatory renewable energy target (MRET): An assessment. Energy Policy 2006, 34, 1046–1062. [Google Scholar] [CrossRef]
- Pillai, I.; Banerjee, R. Renewable Energy in India: Status and Potential. Energy 2009, 34, 970–980. [Google Scholar] [CrossRef]
- Fischer, R.A.; Byerlee, D.; Edmeades, G.O. Crop Yields and Global Food Security: Will Yield Increase Continue to Feed the World? Australian Centre for International Agricultural Research: Canberra, Australia, 2014. [Google Scholar]
- Chisti, Y. Biodiesel from microalgae beats bioethanol. Trends Biotechnol. 2008, 26, 126–131. [Google Scholar] [CrossRef] [PubMed]
- O’Hara, I. Cellulosic Ethanol from Sugarcane Bagasse in Australia: Exploring Industry Feasibility through Systems Analysis, Techno-Economic Assessment and Pilot Plant Development. Ph.D. Thesis, Queensland University of Technology, Brisbane, Australia, 2011. [Google Scholar]
- Covey, G.; Thomas, R.; Dennis, S. A New Opportunity to Pulp Bagasse in Australia? In Proceedings of the Australian Society of Sugar Cane Technologists; Hogarth, D., Ed.; QUT ePrints: Mackay, Australia, 2006. [Google Scholar]
- O’Hara, I.M. The potential for ethanol production from sugarcane in Australia. In Proceedings of the Australian Society of Sugar Cane Technologists 2010; Australian Society of Sugar Cane Technologists: Bundaberg, Australia, 2010; Volume 32, pp. 600–609. [Google Scholar]
- Hay, R.K.M. Harvest index: A review of its use in plant breeding and crop physiology. Ann. Appl. Biol. 1995, 126, 197–216. [Google Scholar] [CrossRef]
- Laj, P.; Klausen, J.; Bilde, M.; Plaß-Duelmer, C.; Pappalardo, G.; Clerbaux, C.; Baltensperger, U.; Hjorth, J.; Simpson, D.; Reimann, S.; et al. Measuring atmospheric composition change. Atmos. Environ. 2009, 43, 5351–5414. [Google Scholar] [CrossRef]
- Zhu, C.; Xu, X.; Wang, D.; Zhu, J.; Liu, G.; Seneweera, S. Elevated atmospheric [CO2] stimulates sugar accumulation and cellulose degradation rates of rice straw. GCB Bioenergy 2015, 8, 579–587. [Google Scholar] [CrossRef]
- Furtado, A.; Lupoi, J.S.; Hoang, N.V.; Healey, A.; Singh, S.; Simmons, B.A.; Henry, R.J. Modifying plants for biofuel and biomaterial production. Plant Biotechnol. J. 2014, 12, 1246–1258. [Google Scholar] [CrossRef] [PubMed]
- Lee, W.C.; Kuan, W.C. 2015. Miscanthus as cellulosic biomass for bioethanol production. Biotechnol. J. 2015, 10, 840–854. [Google Scholar] [CrossRef]
- Vohra, M.; Manwar, J.; Manmode, R.; Padgilwar, S.; Patil, S. Bioethanol production: Feedstock and current technologies. J. Environ. Chem. Eng. 2014, 2, 573–584. [Google Scholar] [CrossRef]
- Sugar Research Australia (SRA). Strategic Plan 2013/2014—2017/2018. Available online: www.sugarresearch.com.au (accessed on 15 August 2021).
- Australian Sugar (AS) & Milling Council (MC). Australian Sugarcane Industry Overview. Available online: http://asmc.com.au/industry-overview/statistics/ (accessed on 15 August 2021).
- Pippo, W.A.; Luengo, C.A. Sugarcane energy use: Accounting of feedstock energy considering current agro-industrial trends and their feasibility. Int. J. Energy Environ. Eng. 2013, 4, 10. [Google Scholar] [CrossRef] [Green Version]
- The Agricultural Production Indices FAOSTAT. Food and Agricultural Organisation of the United Nations (FAO). Available online: http://faostat.fao.org/ (accessed on 15 August 2021).
- Qureshi, M.E.; Wegener, M.K.; Mallawaarachchi, T. The economics of sugar mill waste management in the Australian Sugar Industry: Mill mud case study. In Proceedings of the 45th Annual Conference of the Australian Agricultural and Resource Economics Society 2001, Adelaide, Australia, 23–25 January 2001. [Google Scholar]
- Bortolussi, G.; O’Neill, C.J. Variation in molasses composition from eastern Australian sugar mills. Aust. J. Exp. Agric. 2006, 46, 1455–1463. [Google Scholar] [CrossRef]
- Meat and Livestock Australia (MLA). Tips & Tools: Expanded Use of Molasses for Intensive Beef Cattle Feeding. Fact Sheet Published in 2008. Available online: www.mla.com.au/publications (accessed on 15 August 2021).
- Selina Wamucci. Australia Molasses Prices. Available online: https://www.selinawamucii.com/insights/prices/australia/molasses/ (accessed on 15 August 2021).
- Bundaberg Molasses (BM). Published in 2015. Available online: https://www.bundabergmolasses.com.au/molasses.html (accessed on 15 August 2021).
- Meier, E.A.; Thorburn, P.J.; Wegener, M.K.; Basford, K.E. The availability of nitrogen from sugarcane trash on contrasting tropics of North Queensland. Nutr. Cycl. Agroecosyst. 2006, 75, 101–114. [Google Scholar] [CrossRef]
- Franco, H.C.J.; Pimenta, M.T.B.; Carvalho, J.L.N.; Magalhães, P.S.G.; Rossell, C.E.V.; Braunbeck, O.A.; Vitti, A.C.; Kölln, O.T.; Neto, J.R. Assessment of sugarcane trash for agronomic and energy purposes in Brazil. Sci. Agric. 2013, 70, 305–312. [Google Scholar] [CrossRef] [Green Version]
- CANEGROWERS. Green Versus Burnt Cane Harvesting. Cited in 2015. Available online: http://www.bdbcanegrowers.com.au/images/images/fact_sheets/Green_Versus_Burnt_Cane_Harvesting.pdf (accessed on 15 August 2021).
- OECD/FAO. OECD-FAO Agricultural Outlook. OECD Agriculture Statistics (Database) 2021. doi:10.1787/agr-outldata-en. Available online: https://www.agri-outlook.org/commodities/oecd-fao-agricultural-outlook-meat.pdf (accessed on 15 August 2021).
- Biofuel Association of Australia (BAA). Ethanol in Australia. 2015. Available online: https://www.epw.qld.gov.au/__data/assets/pdf_file/0020/15950/biofuels-association-australia-biofuel-submission.pdf (accessed on 15 August 2021).
- Lavarack, B.P. Estimates of ethanol production from sugar cane feedstocks. In Proceedings of the 2003 Conference of the Australian Society of Sugar Cane Technologists, Townsville, Australia, 6–9 May 2003; p. 25. [Google Scholar]
- Qureshi, N.; Saha, B.C.; Hector, R.E.; Hughes, S.R.; Cotta, M.A. Butanol production from wheat straw by simultaneous saccharification and fermentation using Clostridium beijerinckii: Part I -Batch fermentation. Biomass Bioenergy 2008, 32, 168–175. [Google Scholar] [CrossRef]
- Qureshi, N.; Saha, B.C.; Cotta, M.A. Butanol production from wheat straw by simultaneous saccharification and fermentation using Clostridium beijerinckii: Part II -Batch fermentation. Biomass Bioenergy 2008, 32, 176–183. [Google Scholar] [CrossRef]
- Jonglertjunya, W.; Makkhanon, W.; Siwanta, T.; Prayoonyong, P. Dilute Acid Hydrolysis of Sugarcane Bagasse for Butanol Fermentation. Chiang Mai J. Sci. 2014, 41, 60–70. [Google Scholar]
- Congcong, L.M.S. Butanol Production from Lignocellulosic Feedstocks by Acetone-Butanol-Ethanol Fermentation with Integrated Product Recovery. Ph.D. Thesis, The Ohio State University, Columbus, OH, USA, 2011. [Google Scholar]
- Uppal, S.K.; Gupta, R.; Dhillon, R.S.; Bhatia, S. Potential of sugarcane bagasse for production of furfural and its derivatives. Sugar Tech. 2008, 10, 298–301. [Google Scholar] [CrossRef]
- Wondu Business and Technology Services (WBTS). Furfural Chemicals and Biofuels from Agriculture; Publication No. 06/127. Project No. WBT-2A; Rural Industries Research and Development Corporation: Sydney, Australia, 2006. [Google Scholar]
- Tanisho, S. Feasibility study of biological hydrogen production from sugarcane by fermentation. Hydrog. Energy 1995, 6, 2. [Google Scholar]
- Hamawand, I.; Sandell, G.; Pittaway, P.; Chakrabarty, S.; Yusaf, T.; Chen, G.; Seneweera, S.; Al-Lwayzy, S.; Bennet, J.; Hopf, J. Bioenergy from Cotton Industry Wastes: A review and potential. Renew. Sustain. Energy Rev. 2016, 66, 435–448. [Google Scholar] [CrossRef]
- Hallenbeck, P.C.; Benemann, J.R. Biological hydrogen production; fundamentals and limiting processes. Int. J. Hydrog. Energy 2002, 27, 1185–1193. [Google Scholar] [CrossRef]
- Wang, X.; Jin, B. Process optimization of biological hydrogen production from molassesby a newly isolated Clostridium butyricum W5. J. Biosci. Bioeng. 2009, 107, 138–144. [Google Scholar] [CrossRef]
- Janke, L.; Leite, A.; Nikolausz, M.; Schmidt, T.; Liebetrau, J.; Nelles, M.; Stinner, W. Biogas Production from Sugarcane Waste: Assessment on Kinetic Challenges for Process Designing. Int. J. Mol. Sci. 2015, 16, 20685–20703. [Google Scholar] [CrossRef] [Green Version]
- Paturau, J.M.; Alternative Uses of Sugarcane and Its by-Products in Agro-Industries. FAO Corporation Document. 2014. Available online: http://www.fao.org/docrep/003/s8850e/s8850e03.htm (accessed on 15 August 2021).
- Beeby, C. Drying in Superheated Steam-Fluidized Bed. Ph.D. Dissertation, University of Monash, Melbourne, Australia, 1984. [Google Scholar]
- Trommelen, A.M.; Crosby, E.J. Evaporation and drying of drops in superheated vapours. AIChE J. 1969, 16, 857–867. [Google Scholar] [CrossRef]
- Deventer, H.C.; Heijmans, R.M.H. Drying with superheated steam. Dry. Technol. 2001, 19, 2033–2045. [Google Scholar] [CrossRef]
- Pronyk, C.; Cenkowski, S.; Muir, W.E. Drying foodstuff with superheated steam. Dry. Technol. 2004, 22, 899–916. [Google Scholar] [CrossRef]
- Tang, Z.; Cenkowski, S. Dehydration dynamics of potatoes in superheated steam and hot air. Can. Agric. Eng. 2000, 42, 6. [Google Scholar]
- Wimmerstedt, R.; Hager, J. Steam drying—Modelling and applications. Dry. Technol. 1996, 14, 1099–1119. [Google Scholar] [CrossRef]
- Hamawand, I.; Silva, W.P.; Eberhard, F.; Antille, D.L. Issues related to waste sewage sludge drying under superheated steam. Pol. J. Chem. Technol. 2015, 17, 5–14. [Google Scholar] [CrossRef] [Green Version]
- Figueroa, J.E.J.; Ardila, Y.C.; Lunelli, B.H.; Filho, R.M.; Maciel, M.R.W. Evaluation of Pyrolysis and Steam Gasification Processes of Sugarcane Bagasse in a Fixed Bed Reactor. Chem. Eng. Trans. 2013, 32, 925–930. [Google Scholar]
- Marshall, A.J. Commercial Application of Pyrolysis Technology in Agriculture. 2013. Available online: https://ofa.on.ca/wp-content/uploads/2017/11/Pyrolysis-Report-Final.pdf (accessed on 15 August 2021).
- IISD & SSI. Global Sustainable Sugarcane Production Shows Significant Growth. Available online: https://www.iisd.org/ssi/announcements/global-sustainable-sugarcane-production-shows-significant-growth-report/ (accessed on 30 January 2020).
- Lucas, F.; Philip, M.; Fearnside. Sugarcane Threatens Amazon Forest and World Climate; Brazilian Ethanol Is Not Clean. 2019. Available online: https://news.mongabay.com/2019/11/sugarcane-threatens-amazon-forest-and-world-climate-brazilian-ethanol-is-not-clean-commentary/ (accessed on 30 January 2020).
- Ihsan, H.; Saman, S.; Pubudu, K.; Jochen, B. Nanoparticle technology for separation of cellulose, hemicellulose and lignin nanoparticles from lignocellulose biomass: A short review. Nano-Struct. Nano-Objects 2020, 24, 100601. [Google Scholar]
- Atlas, B. Countries by Sugarcane Production. Available online: https://www.atlasbig.com/en-au/countries-by-sugarcane-production (accessed on 15 August 2021).
- Shahbandeh, M. Sugar Production Worldwide in 2020/2021, by Leading Country (in Million Metric Tons). 2021. Available online: https://0-www-statista-com.brum.beds.ac.uk/statistics/495973/sugar-production-worldwide/ (accessed on 15 August 2021).
- Strain, K.V.; Akshaya, G.M. Conversion of Lignocellulosic Sugarcane Bagasse Waste into Bioethanol using Indigenous Yeast. Iosci. Biotechnol. Res. Asia 2020, 17, 559–565. [Google Scholar]
- Yogita, L.; Rohit, R.; Ashish, A.; Prabhu, P.M.; Meenu, H.; Vinod, K.; Sachin, K.; Anuj, K.; Chandel, R.S. Recent Advances in Bioethanol Production from Lignocelluloses: A comprehensive focus on enzyme engineering and designer biocatalysts. Biofuel Res. J. 2020, 7, 1267–1295. [Google Scholar]
- Nerijus, P.; Marius, P.; Justinas, P.; Eugenija, F.D. Analysis of Wood Chip Characteristics for Energy Production in Lithuania. Energies 2021, 14, 13. [Google Scholar] [CrossRef]
- Shweta, J.; Keerthi Prabhu, M.K.; Mascarenhas, R.J.; Shetti, N.P.; Tejraj, M.A. Recent advances and viability in biofuel production. Energy Convers. Manag. 2021, 10, 100070. [Google Scholar]
- Zhang, X.; Zhou, Y.; Jia, X.; Feng, Y.; Dang, Q. Multi-Criteria Optimization of a Biomass-Based Hydrogen Production System Integrated With Organic Rankine Cycle. Front. Energy Res. 2020, 8, 584215. [Google Scholar] [CrossRef]
- Rana, A.A.; Al-Zuhairi, F.K. Biofuels (Bioethanol, Biodiesel, and Biogas) from Lignocellulosic Biomass: A Review. J. Univ. Babylon Eng. Sci. 2020, 28, 1. [Google Scholar]
- Deodatus, K.; Justin, N.; Godlisten, K. A Review of Intermediate Pyrolysis as a Technology of Biomass Conversion for Coproduction of Biooil and Adsorption Biochar. J. Renew. Energy 2021, 2021, 5533780. [Google Scholar]
- Bikash, K.; Nisha, B.; Komal, A.; Venkatesh, C.; Pradeep, V. Current perspective on pretreatment technologies using lignocellulosic biomass: An emerging biorefinery concept. Fuel Process. Technol. 2020, 199, 106244. [Google Scholar]
- Bastos Lima, M.G. Corporate Power in the Bioeconomy Transition: The Policies and Politics of Conservative Ecological Modernization in Brazil. Sustainability 2021, 13, 12. [Google Scholar] [CrossRef]
- D’Adamo, I.; Falcone, P.M.; Morone, P. A New Socio-economic Indicator to Measure the Performance of Bioeconomy Sectors in Europe. Ecol. Econ. 2020, 176, 106724. [Google Scholar] [CrossRef]
- D’Adamo, I.; Falcone, P.M.; Morone, P. A circular economy model based on biomethane: What are the opportunities for the municipality of Rome and beyond? Renew. Energy 2021, 163, 1660–1672. [Google Scholar] [CrossRef]
Figure 1.
World sugarcane production from 1997 to 2010 [17].
Figure 1.
World sugarcane production from 1997 to 2010 [17].

Figure 2.
Quantity of each component in bagasse (Mt) in Australia.

Figure 3.
Worldwide sugar production by the ten leading countries [55].
Figure 3.
Worldwide sugar production by the ten leading countries [55].

Figure 4.
Potential revenue from different utilisation processes of bagasse, the leftover solid was not considered in the calculation.
Figure 4.
Potential revenue from different utilisation processes of bagasse, the leftover solid was not considered in the calculation.

Figure 5.
Energy content of the products from different utilisation processes of bagasse, the leftover solid was not considered in the calculation.
Figure 5.
Energy content of the products from different utilisation processes of bagasse, the leftover solid was not considered in the calculation.

Figure 6.
Amount of the products from different utilisation processes of bagasse, the leftover solid was not considered in the calculation.
Figure 6.
Amount of the products from different utilisation processes of bagasse, the leftover solid was not considered in the calculation.

Table 1.
Main product and byproducts of sugar cane mill.
| Products | Unit | Production Annually | Unit * | Production |
|---|---|---|---|---|
| Main Product | ||||
| Sugar | metric tonne | 4,360,000 | tonne/hectare | 11.75 |
| Cane | metric tonne | 30,500,000 | tonne/hectare | 82.21 |
| Byproducts | ||||
| Bagasse | tonne/tonne sugar | 2.294 | tonne/hectare | 26.954 |
| Trash | tonne/tonne sugar | 1.63 | tonne/hectare | 19.1 |
| Molasses | tonne/tonne sugar | 0.229 | tonne/hectare | 2.695 |
| Mill mud ** | tonne/tonne sugar | 0.140–0.419 | tonne/hectare | 1.644–4.932 |
* 371,000 ha harvested, ** Mill mud quantity varies depend on the seasons.
Table 2.
A typical constitutive analysis of Australian and world bagasse fibre on a dry basis [8].
Table 2.
A typical constitutive analysis of Australian and world bagasse fibre on a dry basis [8].
| Bagasse Constituent | Australia, Weight per Cent | World, Weight per Cent |
|---|---|---|
| Cellulose | 43 | 34–47 |
Hemicellulose
| 31 | 24–29 |
| 27 | -- | |
| 4 | -- | |
| Lignin | 23 | 18–28 |
| Extractives | 1 | -- |
| Ash | 2 | -- |
Table 3.
Mean molasses composition from surveys of NSW and Queensland sugar mills [20].
Table 3.
Mean molasses composition from surveys of NSW and Queensland sugar mills [20].
| Molasses Component | NSW (1997–2001) | Queensland (1997–2001) |
|---|---|---|
| Dry matter (g/kg) | 769 ± 5.9 | 765 ± 1.0 |
Total sugars (g/kg DM)
| 651 ± 9.6 | 637 ± 1.4 |
| 214 ± 10.6 | 183 ± 1.8 | |
| 436 ± 6.9 | 454 ± 1.3 | |
| Ash (g/kg DM) | 164 ± 8.1 | 176 ± 1.1 |
| Other organic matter (g/kg DM) | 184 ± 10.3 | 187 ± 1.3 |
| Calculated metabolisable energy (MJ/kg DM) | 10.6 ± 0.10 | 10.5 ± 0.02 |
Table 4.
Bundaberg molasses analysis [23].
Table 4.
Bundaberg molasses analysis [23].
| Specifications | Values |
|---|---|
| TDN, % | 62–65 |
| Dry Matter, % | 75.0 |
| Total Sugars, % | 50.0 |
| Sucrose, % | 35.0 |
| Protein, % | 3–5 |
| Calcium, % | 1.15 |
| Phosphors, % | 0.07 |
| Magnesium, % | 0.61 |
| Potassium, % | 5.19 |
| Sodium, % | 0.1 |
| Chlorine, % | 2.98 |
| Sulphur, % | 0.73 |
| Copper, mg/kg | 11.0 |
| Zinc, mg/kg | 11.6 |
| Manganese, mg/kg | 82.4 |
| Iron, mg/kg | 246.0 |
| Energy, MJ.ME/kg | 10.29 |
Table 5.
Trash produced per hectare and its nutrient content.
| Fresh Matter, % | Fresh Matter, t/ha | Moisture, % | N, g/kg | K, g/kg | P, g/kg | Ca, g/kg | Mg, g/kg | S, g/kg | |
|---|---|---|---|---|---|---|---|---|---|
| Tops | 67 | 12.8 | 62 | 7.5 | 12.4 | 0.86 | 6.8 | 1.7 | 1.5 |
| Dry leaves | 33 | 6.3 | 9.2 | 3.4 | 1.8 | 0.17 | 5.3 | 2.5 | 1.5 |
| Total/average | 100 | 19.1 | 44.6 | 4.75 | 5.29 | 0.39 | 5.79 | 2.24 | 1.5 |
Table 6.
Composition of trash in regard to lignocellulosic materials and ash content.
| Ash | Lignin | Cellulose | Hemicelluloses | ||
|---|---|---|---|---|---|
| Tops | % | 4.7 | 21.7 | 39.7 | 32.0 |
| t | 84,813 | 391,586 | 716,403 | 577,454 | |
| Dry leaves | % | 4.7 | 22.7 | 40.8 | 28.7 |
| t | 99,746 | 481,754 | 865,885 | 609,091 | |
Table 7.
Amount of tops and leaves produced in Australia.
| Byproduct | Produced, t/ha | Land Harvested, ha | Produced, t | Moisture Content, % |
|---|---|---|---|---|
| Trash, tops | 12.8 | 371,000 | 4,748,800 | 62 |
| Trash, leaves | 6.3 | 371,000 | 2,337,300 | 9.2 |
| Total/average | 19.1 | 371,000 | 7,086,100 | 44.6 |
Table 8.
Ethanol plants in Australia [28].
Table 8.
Ethanol plants in Australia [28].
| Ethanol Plant | Feed Stock | Location | Owner | Installed Capacity, ML |
|---|---|---|---|---|
| Dalby Bio-Refinery | Red Sorghum | South, QLD | Dalby Bio-Refinery Pty Ltd. | 80 |
| Manildra Ethanol Plant | Waste Starch | Coastal, NSW | Manildra Group | 300 |
| Sarina Distillery | Molasses | Central, QLD | Sucrogen | 60 |
| Total Capacity (ML) | 440 | |||
Table 9.
Potential of ethanol production form final molasses in Australia.
| Production Steps | Estimated |
|---|---|
| Molasses, t | 1,000,000 |
| Sugar content, % | 50 |
| Sugar (hexoses), t | 500,000 |
| Fermentable to Ethanol, % | 48.40 |
| Ethanol potential, t | 242,000 |
| Distillation efficiency, % | 98.5 |
| Ethanol lost in the distillation, t | 3630 (1.5%) |
| Ethanol lost as side products, t | 13,700 (51.14 − 48.4 = 2.74%) |
| Ethanol produced, t; ML; L/t molasses | 238,370; 302; 302 |
| For fermentation yield of 88% *, t; L/t molasses | 209,766; 266 |
| CO2 produced, t | 244,300 |
| Total gain, selling molasses, (AUD 100/t) | AUD 100,000,000/year |
| Energy content, kJ/kg; Total energy GJ | 29,677; 6,225,226 |
| Total gain, based on AUD 3.93/GJ Based on 1 tonne of black coal, which can produce 28 GJ energy at a price of AUD 110, this means AUD 3.93 per GJ. | AUD 24,465,137/year |
| Based on AUD 1/L price of ethanol | AUD 266,000,000/year |
Ethanol density: 789 kg/m3, * O’Hara, 2010.
Table 10.
Potential of ethanol production from bagasse in Australia.
| Bagasse Content | In Wet Solid, % | Amount in 10 Mt, Mt | Ethanol Potential, L/t | Amount of Ethanol, L in 3.552 Million Tonne Dry Fibre |
|---|---|---|---|---|
| Cellulose | 20.64 | 2.064 | 340 | 1,207,680,000 |
| Hemicellulose | 14.88 | 1.488 | ||
| Lignin | 11.04 | 1.104 | Leftover solid | |
| Assume 20% leftover solid from cellulose and 50% from hemicellulose. Leftover dry solids (0.2064 × 0.2 + 0.1488 × 0.5 + 0.1104 = 0.226 kg/kg wet bagasse) | ||||
Table 11.
Energy production from wet bagasse compared to bagasse-based ethanol.
| Sugarcane Waste | Energy, kJ/kg | Conversion | Energy Content in 1 kg, kJ | Comments |
|---|---|---|---|---|
| Wet Bagasse | 7588 | --- | 7588 | Expensive to transport and store |
| Ethanol | 29,677 | 0.268 kg ethanol/kg wet bagasse | 7953 + 3990 = 11,943 kJ | Easy to transport and store The 0.226 kg solid/kg wet bagasse leftover can produce 3990 kJ when burned wet (17,659 kJ/kg × 0.226 kg) |
| Net Energy gain | 4355 kJ/kg | |||
| Net energy gain for 10 million tonnes bagasse | 43,550,000 GJ | |||
| One tonne of black coal can produce 28 GJ energy at a price of AUD 110, this means AUD 3.93 per GJ. The saving is around AUD 171,151,500/year | ||||
Table 12.
Composition and amount of trash in regard to lignocellulosic materials after hydrothermal treatment.
Table 12.
Composition and amount of trash in regard to lignocellulosic materials after hydrothermal treatment.
| Tops, % | Amount, t | Dry Leaves, % | Amount, t | |
|---|---|---|---|---|
| Cellulose | 27.1 | 489,031 | 33.6 | 713,082 |
| Hemicelluloses | 8.8 | 158,799 | 7.7 | 163,414 |
| Lignin | 15.8 | 285,117 | 18.4 | 390,497 |
Table 13.
Potential of ethanol production from trash/tops.
| Bagasse Content | Amount, t | Conversion to Glucose after Hydrolysis, % | Amount of Glucose, t | Ethanol Potential, Conversion% | Amount of Ethanol, t | Amount of Ethanol kg/t Wet Tops |
|---|---|---|---|---|---|---|
| Cellulose | 489,031 | 63.6 ± 1.7 | 311,023 | 51.1 | 158,933 | 33.5 |
| Hemicellulose | 158,799 | --- | --- | --- | --- | |
| Lignin | 285,117 | --- | --- | --- | --- | --- |
| Solid leftover, t (37% Cellulose + Hemicellulose + Lignin) | 624,859 | Solid leftover is 0.1315 kg/kg wet tops | ||||
Table 14.
Potential of ethanol production from trash/leaves.
| Bagasse Content | Amount, t | Conversion to Glucose after Hydrolysis, % | Amount of Glucose, t | Ethanol potential, Conversion% | Amount of Ethanol, t | Amount of Ethanol kg/t Wet Leaves |
|---|---|---|---|---|---|---|
| Cellulose | 713,082 | 61.0 ± 1.0 | 434,980 | 51.1 | 222,274 | 95.1 |
| Hemicellulose | 163,414 | --- | --- | --- | --- | --- |
| Lignin | 390,497 | --- | --- | --- | --- | --- |
| Solid leftover, t (39% Cellulose + Hemicellulose + Lignin) | 832,014 | Solid leftover is 0.356 kg/kg wet leaves | ||||
Table 15.
Energy production from wet trash compared to ethanol-trash-based.
| Sugarcane Waste | Energy, kJ/kg | Conversion, kg/kg Wet | Energy Content in 1 kg Wet, kJ | Comments |
|---|---|---|---|---|
| Wet trash | 7588 | --- | 7588 | Expensive to transport and store |
| Ethanol from tops | 29,677 | 0.0335 | 994 + dry solid (0.1315 × 17,659) = 3316 | Easy to transport and store |
| Ethanol from leaves | 29,677 | 0.095 | 2819 + dry solid (0.356 × 17,659) = 9105 | Easy to transport and store |
| Net Energy gain | 4834 kJ/kg wet | |||
| Net energy gain for 7,086,100 tonne wet tops plus leaves | 34,256,028 GJ | |||
| One tonne of black coal can produce 28 GJ energy at a price of AUD 110, and this means AUD 3.93 per GJ. The saving is around AUD 134,626,192/year | ||||
Table 16.
Potential amount of ABE produced from trash and bagasse.
| Cellulose Amount, t | Convert to Glucose, Average, % | Glucose Convert to ABE, % | Amount of ABE, t | Amount Of ABE, Kg/Kg Wet Waste | ||
|---|---|---|---|---|---|---|
| Trash | tops | 489,031 | 61 | 36 | 107,391 | 0.0226 |
| leaves | 713,082 | 61 | 36 | 156,592 | 0.0669 | |
| Bagasse | 2,064,000 | 61 | 36 | 453,254 | 0.0453 | |
Table 17.
Energy production from wet trash and bagasse compared to ABE-trash/bagasse based.
| Sugarcane Waste | Energy, ABE kJ/kg | Amount of ABE, kg/kg Wet Waste | Energy Content, kJ/kg Wet Solid | Total Amount, t | Total Energy, GJ | |
|---|---|---|---|---|---|---|
| ABE ABE 3:6:1 Average Energy = (3 × A + 6 × B + 1 × E) | Tops | 31,377 | 0.0226 | 709 + dry solid (0.094 × 17,659) = 2369 * | 4,748,800 | 11,249,650 |
| Leaves | 31,377 | 0.0669 | 2099 + dry solid (0.24 × 17,659) = 6337 * | 2,337,300 | 14,811,844 | |
| Bagasse | 31,377 | 0.0453 | 1421 + dry solid (0.26 × 17,659) = 6012 * | 10,000,000 | 60,123,400 | |
* solidleftover is Hemicellulose+ Lignin, kg dry solid/kg wet solid × kJ/kg dry solid = kJ/kg wet solid.
Table 18.
Potential amount of furfural produced from trash and bagasse.
| Hemicellulose Amount, t | Convert to Furfural, Yield, % | Amount of Furfural, t | g/kg Wet | Convert to Acetic Acid, Yield, % | Amount of Acetic Acid, t | g/kg Wet | ||
|---|---|---|---|---|---|---|---|---|
| Trash | tops | 158,799 | 9.2 | 14,609 | 3.1 | 4.2 | 6669 | 1.4 |
| leaves | 163,414 | 9.2 | 15,034 | 6.4 | 4.2 | 6863 | 2.9 | |
| Bagasse | 1,488,000 | 9.2 | 136,896 | 13.7 | 4.2 | 62,496 | 6.3 | |
Table 19.
Potential revenue of furfural produced from trash and bagasse.
| Liquid Products | Amount of Furfural, t | Price, AUD/t * | Revenue Generated, AUD | Amount of Acetic Acid, t | Price, AUD/t | Revenue Generated, AUD | |
|---|---|---|---|---|---|---|---|
| Trash | tops | 14,609 | 1200 | 17,530,800 | 6669 | 550 | 3,667,950 |
| leaves | 15,034 | 1200 | 18,040,800 | 6863 | 550 | 3,774,650 | |
| Bagasse | 136,896 | 1200 | 164,275,200 | 62,496 | 550 | 34,372,800 | |
| Solid left after fermentation | Energy, kJ/kg dry solid | Amount of dry solid, t (cellulose + lignin) | Total, GJ | Revenue | |||
| Trash | tops | 17,659 | 774,149 | 13,670,697 | 53,725,839 | ||
| leaves | 17,659 | 1,103,579 | 19,488,101 | 76,588,239 | |||
| Bagasse | 17,659 | 3,168,000 | 55,943,712 | 219,8587,88 | |||
| One tonne of black coal can produce 28 GJ energy at a price of AUD 110, this means AUD 3.93 per GJ. | |||||||
| Total revenue from the liquids produced and the solids remained | |||||||
| Trash | tops | 74,924,589 | |||||
| leaves | 98,403,689 | ||||||
| Bagasse | 418,506,788 | ||||||
* assumption made AUD = USD.
| Substrate | H2 Production | H2 Production | Sugar and Byproduct Production, t | Total H2 Production, mm3 | |
|---|---|---|---|---|---|
| Sugar | 2.4 mol H2/mol sugar * | 313.4 m3/t sugar | 4,360,000 | 1366.4 | |
| Molasses (53% sugar) | 2.4 mol H2/mol sugar * | 166.1 m3/t molasses | 998,440 | 165.8 | |
| Bagasse | Acid hydrolysis route, sugar 2.5% (w/w) | 0.072 m3H2/kg of dry bagasse | 72 m3/t dry bagasse | 5,000,000 | 360 |
| Water extraction route, sugar 1% (w/w) | 0.055 m3H2/kg of dry bagasse | 55 m3/t dry bagasse | 5,000,000 | 275 | |
| Trash Water extraction route, sugar 1% (w/w) | Tops | 0.055 m3H2/kg of dry trash | 55 m3/t dry tops | 1,804,544 | 99.25 |
| Leaves | 0.055 m3H2/kg of dry trash | 55 m3/t dry leaves | 2,122,268 | 116.7 | |
Gas density of hydrogen: 0.085 kg/m3 (at 1.013 Bar and 15 °C), * hydrogen production of 1.85 mol H2/mol hexose [39].
Table 21.
Potential of hydrogen production from bagasse.
| mm3, kg | Energy Content MJ/kg | Total Energy GJ | Gain, AUD | ||
|---|---|---|---|---|---|
| Sugar | 1366.4; 116,144,000 | 142 | 16,492,448 | 64,815,320 | |
| Molasses (53% sugar) | 165.8; 14,093,000 | 142 | 2,001,206 | 7,864,739 | |
| H2 from bagasse, acid hydrolysis | 360; 30,600,000 | 142 | 4,345,200 | 17,076,636 | |
| H2 from bagasse, water extraction | 275; 23,375,000 | 142 | 3,319,250 | 13,044,652 | |
| H2 from Trash—tops, water extraction | 99.25; 8,440,000 | 142 | 1,198,480 | 4,710,026 | |
| H2 from Trash—leaves, water extraction | 116.7; 9,920,000 | 142 | 1,408,640 | 5,535,955 | |
| Solid left after fermentation | Energy, kJ/kg dry solid | Amount of dry solid, t (hemicellulose + lignin) | Total, GJ | Revenue | |
| Bagasse, Water extraction | 17,659 | 2,592,000 | 45,772,128 | 179,884,463 | |
| Trash, water extraction | Tops | 17,659 | 969,040 | 17,112,277 | 67,251,250 |
| Leaves | 17,659 | 1,090,845 | 19,263,231 | 75,704,501 | |
| One tonne of black coal can produce 28 GJ energy at a price of AUD 110, and this means AUD 3.93 per GJ. | |||||
Table 22.
Biogas production from sugarcane wastes (bagasse and trash).
| Waste Type | Fuel Type | Methane Production, m3 Methane/Ton of Waste on Dry Weight Basis | Total Amount, t | Electricity Generated, kWh/m3 | Price, AUD/kWh; AUD/L | Value, AUD |
|---|---|---|---|---|---|---|
| Bagasse | Biogas | 74.8 | 5,000,000 | 2.1 | 0.1 | 78,540,000 |
| Trash | 74.8 | 3,926,812 | 2.1 | 0.1 | 61,682,362 | |
| Total | 140,222,362 | |||||
| Bagasse | Ethanol | 0.255 | 5,000,000 | -- | 1.0 | 1,275,000,000 |
| Trash | 0.255 | 3,926,812 | -- | 1.0 | 1,001,337,060 | |
| Total | 2,276,337,060 | |||||
| Overall Total | 2,416,559,422 | |||||
Table 23.
Energy required for drying bagasse.
| Energy for Drying, kJ/kg Water | Total Energy for Drying, GJ | Recovered, kJ/kg (80%) | Total Recovered, GJ | Net Lost, GJ | |
|---|---|---|---|---|---|
| Dry Bagasse | 2783 | 13,915,000 | 2226.7 | 11,133,400 | 2,781,600 |
Table 24.
Net energy difference between wet and dry bagasse.
| Amount, t | Energy Content, kJ/kg | Total, GJ | Lost Due to Drying GJ | Total, GJ | |
|---|---|---|---|---|---|
| Wet Bagasse | 10,000,000 | 7588 | 75,880,000 | --- | 75,880,000 |
| Dry Bagasse | 5,000,000 | 17,659 | 88,295,000 | 2,781,600 | 85,513,400 |
| Net energy gain from drying bagasse | 9,633,400 | ||||
| One tonne of black coal can produce 28 GJ energy at a price of AUD 110, and this means AUD 3.93 per GJ. The saving is around AUD 37,859,262 | |||||
Table 25.
Net energy difference between wet and dry trash.
| Amount, t | Energy Content, kJ/kg | Total, GJ | Lost Due to Drying GJ | Total, GJ | ||
|---|---|---|---|---|---|---|
| Wet trash | Tops | 4,748,800 | 4472 | 21,239,150 | --- | 21,239,150 |
| Leaves | 2,337,300 | 15,417 | 36,036,421 | --- | 36,036,421 | |
| Dry trash | Tops | 1,804,544 | 17,659 | 31,866,442 | 1,639,950 | 30,226,492 |
| Leaves | 2,122,268 | 17,659 | 37,477,137 | 119,772 | 37,357,365 | |
| Net energy gain from drying Trash | Tops | 8,987,342 | ||||
| Leaves | 1,320,944 | |||||
| One tonne of black coal can produce 28 GJ energy at a price of AUD 110, and this means AUD 3.93 per GJ. By collecting and burning the trash (tops), the revenue generated can be as much as AUD 35,320,254. By drying and burning the trash (leaves), the revenue can be increased by AUD 5,191,309. | ||||||
Table 26.
Gas composition at different temperatures—pyrolysis [49].
Table 26.
Gas composition at different temperatures—pyrolysis [49].
| 500 °C | 600 °C | 700 °C | 800 °C | 900 °C | ||
|---|---|---|---|---|---|---|
| Char, wt% | 45.4 | 41.9 | 32.9 | 27.6 | 26.4 | |
| Tar, wt% | 22.1 | 22.8 | 24.1 | 20.9 | 20.6 | |
| Gas, wt% | 32.5 | 35.3 | 43.0 | 51.5 | 53.1 | |
| Gas, mole | H2 | -- | 3 | 42 | 49 | 42 |
| CO | 8 | 10 | -- | -- | 19 | |
| CH4 | 22 | 29 | 35 | 29 | 18 | |
| CO2 | 70 | 56 | 23 | 22 | 21 | |
| Butane | -- | 1 | -- | -- | -- | |
| Ethane | -- | 1 | -- | -- | -- | |
Table 27.
Gas composition at 900 °C and different reaction times—gasification [49].
Table 27.
Gas composition at 900 °C and different reaction times—gasification [49].
| 20 min | 40 min | 60 min | 80 min | 120 min | ||
|---|---|---|---|---|---|---|
| Char, wt% | 7 | |||||
| Tar, wt% | 27 | |||||
| Gas, wt% | 66 | |||||
| Gas, mole | H2 | 52 | 54 | 57 | 59 | 60 |
| CO | 19 | 19 | 18 | 17 | 16 | |
| CH4 | 5 | 6 | 5 | 4 | 4 | |
| CO2 | 24 | 21 | 20 | 20 | 20 | |
| Butane | -- | -- | -- | -- | -- | |
| Ethane | -- | -- | -- | -- | -- | |
Table 28.
Converting mole per cent to weight per cent—pyrolysis at 900 °C.
| 900 °C, kmole | Mwt, kg/kmole | Wt, kg | Wt % | ||
|---|---|---|---|---|---|
| Gas, mole | H2 | 42 | 2 | 84 | 4.6 |
| CO | 19 | 28 | 532 | 29.1 | |
| CH4 | 18 | 16 | 288 | 15.8 | |
| CO2 | 21 | 44 | 924 | 50.5 | |
| Butane | -- | -- | -- | -- | |
| Ethane | -- | -- | -- | -- | |
| 100 | 1828 | 100 | |||
Table 29.
Converting mole per cent to weight per cent—gasification at 900 °C.
| 60 min, kmole | Mwt, kg/kmole | Wt, kg | Wt % | ||
|---|---|---|---|---|---|
| Gas, mole | H2 | 57 | 2 | 114 | 7.2 |
| CO | 18 | 28 | 504 | 31.9 | |
| CH4 | 5 | 16 | 80 | 5.1 | |
| CO2 | 20 | 44 | 880 | 55.8 | |
| Butane | -- | -- | -- | -- | |
| Ethane | -- | -- | -- | -- | |
| 100 | 1578 | 100 | |||
Table 30.
Amount of char, tar and gases produced during the pyrolysis and gasification processes.
| Pyrolysis | Gasification | ||||||
|---|---|---|---|---|---|---|---|
| Wt% at 900 °C | Amount, kg/t dry Bagasse | Amount, kg/t wet Bagasse | Wt% at 900 °C and 60 min | Amount, kg/t Dry Bagasse | Amount, kg/t Wet Bagasse | ||
| Char | 26.4 | 264 | 132 | 7 | 70 | 35 | |
| Tar | 20.6 | 206 | 103 | 27 | 270 | 135 | |
| Gas | 53.1 | 531 | 265.5 | 66 | 660 | 330 | |
| Gas | H2 | 4.6 | 24.4 | 12.2 | 7.2 | 47.5 | 23.75 |
| CO | 29.1 | 154.5 | 77.25 | 31.9 | 210.5 | 105.25 | |
| CH4 | 15.8 | 83.9 | 41.95 | 5.1 | 33.7 | 16.85 | |
| CO2 | 50.5 | 268.2 | 134.1 | 55.8 | 368.3 | 184.15 | |
| Butane | -- | -- | -- | -- | -- | -- | |
| Ethane | -- | -- | -- | -- | -- | -- | |
Table 31.
The potential energy and revenue from pyrolysis and gasification.
| Utilisation Method | Amount, kg/t Wet Bagasse | Total Amount, t | Energy Content, kJ/kg | Total Energy, GJ | Value, AUD |
|---|---|---|---|---|---|
| Pyrolysis at 900 °C for 1 h | |||||
| Char (AUD 250/t) | 132 | 10,000,000 | -- | -- | 250,000,000 |
| Tar | 103 | 22,100 | 22,763,000 | 89,458,000 | |
| H2 | 12.2 | 142,000 | 17,324,000 | 68,083,320 | |
| CO | 77.25 | 10,100 | 7,802,250 | 30,662,842 | |
| CH4 | 41.95 | 55,500 | 23,282,250 | 91,499,242 | |
| CO2 | 134.1 | -- | -- | -- | |
| Total * | 529,700,000 | ||||
| Gasification at 900 °C and 60 min | |||||
| Char (AUD 250/t) | 35 | 10,000,000 | -- | -- | 87,500,000 |
| Tar | 135 | --- | --- | --- | |
| H2 | 23.75 | 142,000 | 33,725,000 | 132,539,250 | |
| CO | 105.25 | 10,100 | 10,630,250 | 41,776,882 | |
| CH4 | 16.85 | 55,500 | 9,351,750 | 36,752,377 | |
| CO2 | 184.15 | -- | -- | -- | |
| Total * | 298,568,000 | ||||
* The energy required for these processes is not included.
Table 32.
The potential revenue from pyrolysis and gasification of cane trash based on AUD/kg generated from bagasse/cane trash.
Table 32.
The potential revenue from pyrolysis and gasification of cane trash based on AUD/kg generated from bagasse/cane trash.
| Bagasse | Dry Solid, kg | Revenue, AUD | Rate, AUD/kg | |
|---|---|---|---|---|
| Bagasse | Pyrolysis | 5,000,000 | 529,700,000 | 106 |
| Gasification | 5,000,000 | 298,568,000 | 60 | |
| Trash | Rate, AUD/kg | Dry solid, kg | Revenue, AUD | |
| Trash—Tops | Pyrolysis | 106 | 1,804,544 | 191,281,664 |
| Gasification | 60 | 1,804,544 | 108,272,640 | |
| Trash—Leaves | Pyrolysis | 106 | 2,122,268 | 224,960,408 |
| Gasification | 60 | 2,122,268 | 127,336,080 | |
Table 33.
Potential pulp production from Bagasse in Australia.
| Total Quantity, t | Fibre Content, % | Total Fibre, t | Fibre is Required to be Removed as Pith, % | Pulp Yield, % | Potential Pulp, t | |
|---|---|---|---|---|---|---|
| Bagasse | 10,000,000 | 13 | 1,300,000 | 35 | 45 | 438,750 |
| Total quantity, t | Solid remained after removing the fibre, % | Total solid remained, t | Solid remained as pith | Solid remained based on converted yield, t | Total remained after removing the potential pulp, t | |
| Solid remained, dry, wet | 10,000,000 | 37 | 3,700,000 | 455,000 | 250,250 | 4,405,250; 9,405,250 |
Table 34.
Potential gain from pulp production from Bagasse and trash in Australia.
| Product | Amount | Price | Total Revenue, AUD | ||
|---|---|---|---|---|---|
| Bagasse | Pulp * | 438,750 t | 1132 AUD/t ** | 496,665,000 | |
| Wet Solid, fuel for the boiler (50% MC) | 9,405,250 t ***, 71,367,037 GJ | 3.93 AUD/GJ | 280,472,455 | ||
| Total *** | 777,137,455 | ||||
| Product | Production rate, kg/kg dry solid | Total, t | Total produced, t | Total revenue, AUD | |
| Trash—tops | Pulp * | 0.088 | 1,804,544 | 158,799 | 179,761,455 |
| dry Solid, fuel for the boiler | 0.88 | 1,804,544 | 1,587,998 | 110,206,904 | |
| Total *** | 289,968,359 | ||||
* Does not include the processing of bagasse to produce pulp. ** retrieved from http://www.indexmundi.com/commodities/?commodity=wood-pulp¤cy=aud (access on 15 April 2021). *** Assume no solid losses during the process.
Table 35.
Ethanol production from sugar.
| Products | Production, t/y | Fermentable Ethanol, % | Ethanol, t/Year | Energy Content, kJ/kg | Total Energy, GJ |
|---|---|---|---|---|---|
| Sugar | 4,360,000 | 48.4 | 2,110,240 | 29,677 | 62,625,592 |
| Production, t/y | Price AUD/t | Total AUD | |||
| Sugar | 4,360,000 | 390 * | 1,700,400,000 | ||
| Based on AUD 3.93/GJ the total gain from converting sugar to ethanol will be around AUD 246,118,576/year or based on AUD 1/l ethanol, the revenue is around AUD 2,674,575,411/year | |||||
* http://www.rabobank.com.au/Research/Documents/Agribusiness_monthly/2013/Agri_Monthly_Jun-2013.pdf (access on 15 April 2021).
Table 36.
Estimated global production of sugarcane byproducts is 2021.
| Byproduct | Produced, Tone |
|---|---|
| Bagasse | 9575.87 |
| Trash | 6804.3 |
| Molasse | 955.92 |
| Mill mud | 584.40–592.75 |
Table 37.
Different pyrolysis processes and products’ yield [62].
Table 37.
Different pyrolysis processes and products’ yield [62].
| Property | Slow | Intermediate | Fast | Flash |
|---|---|---|---|---|
| Heating rate (°C/s) | 1.1–1 | 1–10 | 10–200 | >1000 |
| Feed size (mm) | 5–50 | 1–5 | <1 | <0.5 |
| Reaction temperature (°C) | 400–500 | 400–650 | 850–1250 | >1000 |
| Vapor residence time (s) | 300–550 | 0.5–20 | 0.5–10 | <1 |
| Feed water content (%) | Up to 40 | Up to 40 | <<10 | <<10 |
| Biooil yield (%) | 20–50 | 35–50 | 60–75 | 60–75 |
| Biochar yield (%) | 25–35 | 25–40 | 10–25 | 10–25 |
| Gas yield (%) | 20–50 | 20–30 | 10–30 | 10–30 |
Publisher’s Note: MDPI stays neutral with regard to jurisdictional claims in published maps and institutional affiliations. |
© 2021 by the authors. Licensee MDPI, Basel, Switzerland. This article is an open access article distributed under the terms and conditions of the Creative Commons Attribution (CC BY) license (https://creativecommons.org/licenses/by/4.0/).
Share and Cite
MDPI and ACS Style
Hamawand, I.; da Silva, W.; Seneweera, S.; Bundschuh, J. Value Proposition of Different Methods for Utilisation of Sugarcane Wastes. Energies 2021, 14, 5483. https://0-doi-org.brum.beds.ac.uk/10.3390/en14175483
AMA Style
Hamawand I, da Silva W, Seneweera S, Bundschuh J. Value Proposition of Different Methods for Utilisation of Sugarcane Wastes. Energies. 2021; 14(17):5483. https://0-doi-org.brum.beds.ac.uk/10.3390/en14175483
Chicago/Turabian StyleHamawand, Ihsan, Wilton da Silva, Saman Seneweera, and Jochen Bundschuh. 2021. "Value Proposition of Different Methods for Utilisation of Sugarcane Wastes" Energies 14, no. 17: 5483. https://0-doi-org.brum.beds.ac.uk/10.3390/en14175483
Note that from the first issue of 2016, this journal uses article numbers instead of page numbers. See further details here.