
A Compact, Self-Sustaining Fuel Cell Auxiliary Power Unit Operated on Diesel Fuel
by
 , ,
, ,
Remzi Can Samsun
* ,
,
Matthias Prawitz
,
Andreas Tschauder
,
Stefan Weiske
,
Joachim Pasel
and
Ralf Peters
Forschungszentrum Jülich GmbH, Institute of Electrochemical Process Engineering (IEK-14), 52425 Jülich, Germany
*
Author to whom correspondence should be addressed.
Energies 2021, 14(18), 5909; https://0-doi-org.brum.beds.ac.uk/10.3390/en14185909
Submission received: 19 August 2021
/
Revised: 13 September 2021
/
Accepted: 14 September 2021
/
Published: 17 September 2021
(This article belongs to the Special Issue Design, Modeling, and Optimization of Novel Fuel Cell Systems)
Abstract
:A complete fuel cell-based auxiliary power unit in the 7.5 kWe power class utilizing diesel fuel was developed in accordance with the power density and start-up targets defined by the U.S. Department of Energy. The system includes a highly-integrated fuel processor with multifunctional reactors to facilitate autothermal reforming, the water-gas shift reaction, and catalytic combustion. It was designed with the help of process analyses, on the basis of which two commercial, high-temperature PEFC stacks and balance of plant components were selected. The complete system was packaged, which resulted in a volume of 187.5 l. After achieving a stable and reproducible stack performance based on a modified break-in procedure, a maximum power of 3.3 kWe was demonstrated in a single stack. Despite the strong deviation from design points resulting from a malfunctioning stack, all system functions could be validated. By scaling-up the performance of the functioning stack to the level of two stacks, a power density of 35 We l−1 could be estimated, which is close to the 40 We l−1 target. Furthermore, the start-up time could be reduced to less than 22 min, which exceeds the 30 min target. These results may bring diesel-based fuel cell auxiliary power units a step closer to use in real applications, which is supported by the demonstrated indicators.
1. Introduction
Hydrogen technology is currently in the spotlight of international energy roadmaps [1] as a key solution to limiting the increase in greenhouse gas emissions and achieving long-term greenhouse gas neutrality. In this context, fuel cells are known as clean and efficient energy converters that can be used in various sectors and application areas [2,3,4], even including special applications utilizing microbial fuel cells [5,6]. Hydrogen is the optimal fuel for fuel cells; however, the use of fuel cells is not limited to pure hydrogen. The on-board reforming of liquid fuels such as methanol or diesel carry the advantage of enabling the quicker widespread deployment of fuel cells in many mobile applications without the need to wait for a complete hydrogen infrastructure to be established around the world. Such applications can profit from the high energy density of liquid fuels and their ease of handling. At the same time, diesel fuel and methanol can be produced from renewable routes of biogenic origin or via the power-to-fuel route, offering a sustainable option for future power systems in which the direct use of green hydrogen is not economically- or technically-feasible.
Although methanol-based fuel cell systems are already utilized in various applications, diesel-based fuel cell systems have yet to reach a commercialization status, as diesel reforming is far more challenging than methanol and necessitates complicated systems.
The main challenges of diesel reforming for fuel cell systems are conversion and durability issues related to catalysts, start-up/shut-down procedures, and system volume and weight. A recent survey of the literature on the complexity of diesel reforming and stability issues showed that many groups use surrogate fuels at low space velocities, and that the best performances with commercial fuels could be achieved by using precious metal catalysts in combination with the autothermal reforming route [7]. Research efforts also continue to develop Ni-based catalysts for the steam reforming of diesel [8]. Rh-based catalyst systems for autothermal diesel reforming are also being further developed experimentally and accompanied by modeling efforts [9,10,11]. A kinetic model for the autothermal reforming of diesel was recently developed, which was intended to provide a basis for reactor design and system operation efforts for auxiliary power unit (APU) applications, taking into account the complexity of the reaction network [12].
Several rapid start-up strategies have been published that focus on fuel processors. Maximini et al. reported a start time of 23 min and 40 s for their fuel processor based on the steam reforming of surrogate diesel [13]. Han et al. were able to reduce the start time of a conventional diesel autothermal reformer (ATR) from 60 min to 21 using hydrogen peroxide and its utilization heat [14]. In turn, Bae et al. coupled their ATR with the waste heat from a high-temperature fuel cell and managed to reduce the start time after the diesel supply to 9 min and the reformer start time to approximately 40 min [15]. All of these studies reflect recent progress in start-up strategies for diesel fuel processors based on ATR technology; however, the reported start-up times only refer to the start-up of the fuel processors and not the complete fuel cell systems.
For diesel-based fuel cell systems used in mobile applications, polymer electrolyte fuel cell (PEFC), solid oxide fuel cell (SOFC) and high-temperature PEFC (HT-PEFC) technologies are commonly preferred. PEFC technology offers high power densities and stack efficiencies due to the high technology readiness level of this stack type, but its low tolerance against CO leads to large systems and complex fuel processing configurations. The SOFC technology does not possess the same level of technological development for mobile applications such as PEFCs, but CO is not a catalyst poison for this technology, which substantially simplifies fuel processing. However, operation at high temperatures increases the start-up periods or requires a stand-by mode in the system at elevated temperatures if it is not being used. The HT-PEFC offers the advantage of increased CO tolerance and thus simpler fuel processing in comparison to PEFCs. There is also no need for humidification, and increased operating temperatures simplify heat management. In comparison to an SOFC, the lower operating temperature of around 160 °C permits a shorter start-up period. As a compromise between SOFC and PEFC technologies, the HT-PEFC features the lowest technology readiness level among these three fuel cell technologies.
Engelhardt et al. operated PEFC and HT-PEFC stacks with six and five cells, respectively, with the reformate from a diesel steam reformer permitting more stable voltage behavior in the case of HT-PEFCs due to the presence of high concentrations of higher hydrocarbons in the reformate [16]. Ekdunge et al. reported on the combination of diesel ATR with a PEFC for a truck APU [17]. This system was built for demonstration purposes and also included balance of plant (BoP) components. A gross efficiency of 29% was achieved at a maximum load of 2.35 kWe, whereas the net efficiency dropped to 19–23.5% after subtraction of the internal consumers. The dimensions and power density of the demonstrator were not reported. A similar system was developed by Pregelj et al. in the 3 kWe power class as part of the European Project Fuel Cell Based Power Generation (FCGEN), which exhibited 2.9 kWe gross electric power at 25.3% gross efficiency and 18.4% net efficiency [18]. Rautanen et al. operated a 0.5 kWe SOFC stack in a furnace with diesel reformate from ATR during inline testing. Following an initial phase of degradation, the stack displayed stable electrochemical performance [19]. The combination of the diesel ATR and metal-based SOFC technology is also being developed at the Korea Advanced Institute of Science and Technology (KAIST) with the aim of implementing it in truck APUs [20]. In another European Project, Demonstration of the first European SOFC Truck APU (DESTA), a diesel-based SOFC APU in the 3 kWe class was built to demonstrate in a truck [21]. This system achieved a 34% gross efficiency and 29% net efficiency and had a start-up time of 70 min from cold and 30 min under warm conditions, and a volume of 178 l.
The above discussion shows that various technology combinations have been realized and even complete fuel cell APUs with diesel reforming have been demonstrated to date. Most of the works reported laboratory testing and the complete system demonstrations showed the potential of higher power densities (40 We l−1) and shorter start-up times (30 min), which are defined as targets by the United States Department of Energy (U.S. DOE) for 1–10 kWe fuel cell APUs that operate on ultra-low-sulfur diesel fuel [22,23].
The main research question posed in this work concerns how to implement laboratory technology in an application-oriented system that takes power density and start-up time targets as a reference. For this purpose, a complete fuel cell APU was designed, manufactured, commissioned, and characterized. NEXBTL diesel from Neste, which is a renewable, synthetic diesel fuel produced from renewable fats and oils, was used in this work [24]. The fuel cell technology selected for the APU system was HT-PEFC-based due to its advantages in the context of start-up times by comparison to SOFCs and CO tolerances against PEFCs. As noted above, the technology readiness level of HT-PEFCs is not as high as that of PEFC or SOFC technologies. HT-PEFC technology remains the subject of numerous research initiatives. Schmidt lists the activity of the anode for CO oxidation in the presence of H2, that of cathodes in the presence of phosphoric acid (H3PO4), and high corrosion stability under dynamic conditions or local fuel starvation as the requirements to be met by a viable HT-PEFC catalyst [25]. Similarly, Lehnert et al. summarize a number of drawbacks of HT-PEFCs compared to PEFCs, including lower power density, high catalyst loading, the necessity of heating to at least 100 °C before power production in order to avoid the accumulation of liquid water inside the cells, which will finally lead to H3PO4 losses, and highly corrosive conditions due to hot H3PO4 [26]. Araya et al. point out the recent improvements in reliability on the component level and state that operating conditions and real-world interactions between components and system peripheries are currently the predominant cause of failures [27]. They list membrane and catalyst degradation, carbon corrosion, and electrolyte losses as the degradation mechanisms of the different components of an HT-PEFC. Non-ideal operating conditions that can lead to degradation include operation at open circuit voltage, start/stop cycles, contaminations such as CO, and insufficient fuel or oxidant supply leading to gas starvation.
A number of research groups have reported on the effects of impurities and temperatures, as well as operating strategies, on the performance of HT-PEFCs [28,29,30,31,32,33,34,35,36,37]. The number of studies of systems operated on diesel reformate is very limited, and several works focus on residential combined heat and power systems fueled by methane [38,39,40,41] and biogas [42,43] on the one hand, or methanol-based systems for mobile applications [44,45,46,47] on the other.
The novelty of the present work lies in its development of a complete fuel cell system based on autothermal diesel reforming and HT-PEFC stacks being complemented by further fuel processing and BoP components. A fuel cell system aimed at APU applications is characterized by compactness and quick start-up capability, inspired by the U.S. DOE targets. The novelty of the selected approach is to transfer the scientific and technical know-how from laboratory systems to a prototype that can be used in field tests and upgraded to industrial viability in the subsequent stage.
The paper is structured as follows: The materials and methods are presented in Section 2 to describe how the system was developed and which experimental approaches were applied to characterize it. Section 3 presents the results of the system experiments. A discussion of these in light of other publications is undertaken in Section 4. Finally, Section 5 derives conclusions from the results and their discussion.
2. Materials and Methods for Design and Testing
In this section, the materials and methods applied for the development and testing of the HT-PEFC system with diesel reforming technology are outlined.
2.1. Reactor and System Design
As mentioned in the introduction, the aim of system development is to achieve a complete fuel cell unit encompassing diesel fuel processing, stacks, and BoP components that enable its start-up, operation, and shut-down. Further highlights include the compactness and integrated quick start-up capability, as defined in the U.S. DOE targets.
The approach followed was to fully develop a fuel processor and combine it with commercially-available fuel cell technology in the first step. In the second step, commercial BoP components are selected.
In recent years, several fuel processor generations have been developed at Jülich that focus on quick start-up capability and stable steady-state operation. With these fuel processors, it was always sought to achieve a high power density with an eye to later system integration. The latest fuel processor in the sixth generation can be considered the final step in these developments before complete system integration. Using an electrical start-up strategy, it took 14–16 min for this system to complete the start-up procedure [48]. In further experiments, it was possible to simultaneously maximize fuel conversion in the reformer and CO conversion in the shift reactor, enabling optimal conditions for coupling with a high-temperature PEFC [7]. Previous achievements demonstrated that it is possible to develop highly integrated reactors for fuel processing. It is often stated in the literature that HT-PEFC stacks can be operated using reformates containing 1 (vol.)% CO without a critical performance drop. In order to achieve this set-up, the sixth generation fuel processor was built using an autothermal reformer, a two-stage water gas shift reactor, and a catalytic burner. Steam generation for the reforming reaction was realized in the heat exchangers placed in the reformer and catalytic burner. The heat exchanger placed in the reformer also adopted the function of temperature adjustment for the downstream shift reactor. Both shift stages were realized within one reactor shell in order to minimize heat losses and pressure drops. The start-up was achieved with the help of integrated electric heating wires in the reformer and shift reactor, with a glow plug placed at the catalytic burner inlet.
Despite this high level of system integration, the complexity of diesel reforming at a systems level indicates that further steps are required to achieve an even more compact system. It was clear that the three above-mentioned key components show a minimum of reactors to be used in a diesel fuel processor as part of an HT-PEFC system. The design strategy for the new generation fuel cell system, “APU S2”, reported in this work is based on the approach that all additional system functions must be integrated into these three key components.
For this purpose, the sixth-generation fuel processor system was further developed in this study. Due to its key role, the ATR 12 reformer was not changed and was also used in the complete fuel cell system. The computational fluid dynamics (CFD)-assisted design approach of the ATR 12 was published in Peters et al. [49], its component-level characterization in Pasel et al. [50], and system-level characterization in Samsun et al. [7]. The extended functions were realized in the new versions of the catalytic burner (CAB) and the water-gas shift (WGS) reactor. In order to describe these functions, the system design is presented in Figure 1.
The basic strategy of steam preparation within the heat exchangers of the reformer and catalytic burner was maintained in the APU S2, as in the sixth-generation fuel processor. The strategy is explained and experimentally-validated for a complete fuel cell system in the preceding generation, the APU S1 [51]. In this work, most of the additional functions are included in the new catalytic burner CAB 6. This was developed on the basis of the CAB 5, which was initially conceptualized for this system but could not be realized due to the technological risks associated with the laser additive manufacturing technology [52]. Therefore, in this study the same concept was further developed for conventional manufacturing technology. The features of the CAB 6 are listed below:
- -
- CAB 6 is designed to be used with anode off-gas during the normal operation of the fuel cell system. During start-up, when the fuel cell has not yet reached its optimal operating temperature, the reformate produced in the fuel processor is fully processed in the catalytic burner in order to heat the stacks with the produced heat. In both modes of operation, the main task of the catalytic burner is the combustion of all calorific components (methane, carbon monoxide, hydrogen, and possibly higher hydrocarbons) and production of an off-gas that is mainly composed of CO2, H2O, and N2.
- -
- As Figure 1 illustrates in a simplified manner, the catalytic burner features several inlets and outlets. In order to realize a number of various functions, CAB 6 was built as a pressure vessel featuring several shells. The monolith containing the precious metal catalyst was placed in the middle segment of the reactor and serves as a heat source for all of the heat recovery functions that are discussed in the following. Air for catalytic combustion enters the reactor from the bottom part in the middle after passing through a glow plug. The feed gases also enter the CAB at this position.
- -
- On top of the CAB 6, some of the reforming water is sprayed via a nozzle, which is evaporated upon contact with a hot hemisphere surface. Hot combustion gases from the monolith flow through the bottom part of this surface, and are directed to a shell and tube heat exchanger after passing the first hollow volume surrounding the catalyst bed.
- -
- The evaporated steam flows through the second hollow volume, in which a complete evaporation and slight superheating is sustained. A part of the air for the ATR is also fed through the upper section of the CAB 6, together with water for the ATR. The mixture of superheated steam and part of the reforming air leaves the CAB 6 on the lower section and these are directed to the reformer for further processing in the reformer heat exchanger via the brown line.
- -
- The off-gas flows through the shell component of the above-mentioned shell and tube heat exchanger, which can be considered the third hollow volume. The heat exchange fluid, colored in purple, flows through the tube side of this heat exchanger. With this loop, the catalytic burner is thermally coupled to the fuel cell stack, and therefore the excess heat from reformate combustion during the start-up phase can be used to heat up the stacks.
- -
- The remaining part of the reforming air is fed into the catalytic burner through the fourth hollow volume covering the entire reactor. Air leaves the CAB 6 through the red line on the bottom part, which is directly connected to the reformer’s fuel mixing chamber.
In summary, the integrated catalytic burner CAB 6 performs several heat exchange functions, including steam evaporation, air pre-heating over two paths, heat exchange fluid tempering, and off-gas cooling. In addition to its heat exchange functions, the CAB 6 also includes a diffusor for the homogenization of the air/feed gas mixture and a flame arrester at its inlet. The monolith has a volume of 1.29 l, whereas the complete reactor has a gross volume of 19.2 l and net volume of 10.4 l. The complete reactor has a mass of 9.6 kg, with the heat exchange area totaling 810,000 mm2. The concept development for the reactor was supported by CFD simulations, which are reported in Meißner at al. [52]. In addition to these, further CFD simulations using ANSYS Fluent were performed in order to optimize the flow distribution in the shell and tube heat exchanger, which resulted in a modified diffusor geometry to uniformly guide the off-gas flow through the heat exchanger channels. The dimensioning of the reactor walls was performed on the basis of detailed thermo-mechanical analyses that drew on the finite element method (FEM) using ANSYS Mechanical. The dimensions and type of catalyst were the same as those in CAB 3, and are outlined in detail in Samsun et al. [53].
Similarly, the new water-gas shift reactor generation WGS 6B_WÜ presented in this work represents a further development of its predecessor, the WGS 6B [48]. The main features of the WGS 6B_WÜ are as follows:
- -
- Similar to the WGS 6B, the inner component of the reactor represents the catalytic reaction zone for the high-temperature shift (HTS) stage. After the HTS, water is sprayed onto a hot hemispheric surface, which faces a hot reformate flow on its other surface, resulting in the evaporation of steam and a strong cooling of the reformate gas from the HTS. In contrast to the concept embodied in the CAB 6, both flows are mixed and flow through the hollow volume between both shift stages, as the added water is used as an educt in the low-temperature shift stage (LTS) that covers this hollow volume. As in the case of WGS 6B, an electrical heater is positioned between the HTS and LTS stages that heats up the WGS reactor during start-up. In comparison to the WGS 6B, the heater has a higher maximum heating power of 2.6 kW.
- -
- Similar to CAB 6, a shell and tube heat exchanger surrounds the LTS stage. The hot reformate leaving the LTS flows through the tube side, which is cooled before entering the anode compartment of the fuel cell stack. Cold air flows through the shell side of this heat exchanger, which is heated prior to entering the cathode compartment of the fuel cell. By this, the fuel cell stack and WGS reactor are thermally-coupled.
The resulting reactor has a monolith volume of 1.43 l for the low-temperature shift stage, 0.62 l for the high-temperature one, a gross volume of 12.5 l, a net volume of 10.9 l, a mass of 9 kg, and a heat exchange area of 740,000 mm2. As the catalytic section is the same as in the WGS 6B, further information on the catalyst type and its dimensions can be found in Samsun et al. [48]. Through the integration of this shell and tube heat exchanger in the shift reactor, another heat exchange function was realized without the use of additional components in the system. Similar to the CAB 6, the weight of the WGS 6B_WÜ was optimized through simulations based on FEM.
Both reactors were produced using industrial manufacturing methods in order to reduce costs in later, small series production. Figure 2 displays cross-sectional views of the newly-developed multi-functional reactors CAB 6 and WGS 6B_WÜ.
As noted above, a commercial stack technology was selected for the system. As no diesel-based fuel cell systems are currently available in the market, HT-PEFC stacks from Serenergy were used. Serenergy is not a stack manufacturer, but a producer of complete fuel cell systems with methanol reforming. Given that no data was available on the stack performance using reformate from autothermal diesel reforming, characteristic polarization curves from the previous system generation, the APU S1, were used for the dimensioning process, in which in-house-developed HT-PEFC stacks using commercial phosphoric acid-doped polybenzimidazole (PBI) membranes were employed [51]. For this, a hydrogen utilization rate of 83% and 1 (vol.)% CO concentration in wet product gas at the WGS outlet was assumed. The S 165 L liquid-cooled HT-PEFC stack from Serenergy is available in 25-, 65-, and 120-cell configurations, each of which has an active cell area of 163.5 cm2 [54]. In order to utilize the available potential of the developed fuel processor components, two stacks with the highest cell number were selected, resulting in 240 cells in total. At the selected operating point of 410 mA cm−2, a cell voltage of 475 mV is estimated, resulting in a 7.5 kWe power output from two stacks if 2520 g h−1 NEXBTL diesel is used for the reforming. With this, the power class of the APU system is also set. It must be noted that the fuel processor components are designed for a maximum fuel flow rate of 2700 g h−1. Therefore, by using two stacks with 120 cells each, the maximum hydrogen generation rate of the fuel processor is also approached. Further assumptions regarding this dimensioning are a molar oxygen-to-carbon ratio of 0.47 and steam-to-carbon ratio of 1.9 in the reformer, stack operation at λair = 2 and λfuel = 1.2, and catalytic burner operation at λair = 1.3.
However, as the selected stacks are normally used in methanol-based systems, they are mounted together with specially-developed end plates with integrated flow channels for their original use. In the case of APU S2, it was necessary to develop new end plates to operate the stacks and combine them with the fuel processor. At the same time, a sound strategy was required to ensure the homogenous distribution of the fuel, air, and heat transfer medium to both stacks. In combination with the goal of building a compact system, manifolds were developed to combine both stacks with each other and enable the implementation of space-saving interfaces to the fuel processing system. The developed geometries were optimized with the help of CFD simulations to ensure the homogenous distribution of educts to each stack. As Figure 3 shows, the distributions of the air and reformate educts were quite close to the ideal level of 50%. The larger deviation was observed for air, which is not critical, as the cathode side is operated with a large amount of excess air (see above). The anode side is also operated with an excessive quantity of reformate. The calculated values lead to a variation in the anode side stoichiometry between 1.18 and 1.22, which is unproblematic for the stack’s stable operation. In the case of the heat exchange medium, the distribution is even more homogeneous than for both educts.
The designed manifolds were manufactured using laser additive manufacturing. Figure 4 displays an illustration to explain the final geometry of the developed end plates and how they combine both stacks with one another.
Up until this step, the main system components were selected in terms of Basic Engineering. Before selecting the BoP components, which must serve all operating modes, the system design must be finalized according to Detailed Engineering parameters. The Detailed Engineering calculations were performed for various operating loads and modes for start-up, and are outlined briefly in Table 1.
In normal operation mode, a hydrogen-rich gas is produced in the reformer and WGS reactor, which is then electrochemically-converted into heat and electricity in the fuel cell stacks, together with air as the oxidant. The anode off-gas is catalytically-combusted in the catalytic burner. Three cases are defined for this scenario using the same assumptions as above for “Basic Engineering” considering reformer, stack, and catalytic burner operation.
The minimum load (2.8 kWe) is determined through the reformer load of 25.8% (696 g h−1 diesel), at which the diesel spray formation can still be sustained. This is the prerequisite for stable reformer operation. An average cell voltage of 650 mV is estimated for this point. It is also possible to achieve operation at lower loads at the expense of a higher fuel stoichiometry than λfuel = 1.2, but this option was not considered, as it leads to a higher fuel consumption and lower system efficiency. At a medium load (5 kWe) the reformer load corresponds to 53% and the average cell voltage is estimated to be 555 mV. Finally, the maximum load case corresponds to 7.5 kWe, which is already defined in the Basic Engineering at the 93% reformer load. It is clear that the reformer load does not change as a linear function of the stack power, as the average cell voltage and therefore the fuel cell efficiency drop at higher current densities.
In start phase A, the system is heated up using the electrical heating wires in the reformer and shift reactor and the glow plug that is placed in the air inlet of the catalytic burner. In order to transfer the produced heat to the system components, all of the three air compressors (reformer, catalytic burner, and cathode) are operated at 10,000 Nl h−1.
Start phase B refers to a special operating phase in which the fuel processor is already in operation but the stacks have not yet reached their minimum operating temperature of 140 °C. In this phase, all of the produced reformate is bypassed through the dashed line in Figure 1 and burned in the catalytic burner at a high air ratio of λair = 3.5. Such a high air ratio is required in order to keep the adiabatic reaction temperature in the catalytic burner below the 950 °C limit. In comparison to normal operation with the anode off-gas, the catalytic combustion of the reformate presents a huge challenge for the catalytic burner, as the complete amount of produced reformate with its calorific components of hydrogen, carbon monoxide, and methane must be converted into steam and carbon dioxide in order to ensure low-emission operation. Therefore, this operating mode is restricted with a maximum 50% reformer load in start phase B1 and even lower loads in B2 and B3. Higher reformer loads in this phase can reduce the start time, as more heat will be available to heat up the stacks.
Finally, start phase C describes the transition mode from start phase B to normal operation modes. In order to minimize the pressure increase on the anode during the switch from reformate mode to stack operation mode due to the large amount of combustion air in reformate mode, the reformer load is reduced to a minimum in this phase and the valve position at the anode inlet is changed so that the produced reformate flows through the anode instead of the catalytic burner.
Based on these principles, the set of flow rates and temperatures at different positions of the system layout were determined with the help of process simulations for different operating modes, and are listed in Table 2. NEXBTL diesel from Neste, simulated by the hydrocarbon C17H36, was used in the process simulations and experiments in this work. The fuel properties are listed elsewhere [55]. All simulations were performed using an oxygen-to-carbon ratio of 0.47 and a steam-to-carbon ratio of 1.9 in the reformer, except for start phase A, during which the system was heated up with air. A share of 70% of the reforming water was introduced to the ATR mixing chamber by being passed through the heat exchangers in CAB and ATR, following the steam path, as explained above. The remaining 30% was introduced directly through the ATR heat exchanger and was therefore mixed with the first mixture on the upper side of the reformer. Similarly, a share of 30% of the reforming air was distributed via the steam path through the heat exchangers in the CAB and ATR. The remaining share of 70% was introduced directly into the ATR mixing chamber after being pre-heated in the CAB heat exchanger. These ratios could be adjusted during the experiments as needed.
The flow rates displayed in Table 2 show clear trends. On the one hand, the normal operating modes include cases with higher reformer loads and therefore higher flow rates in the reformer and shift reactor. In addition, high amounts of air are required in the stack in order for the electrochemical reactions at the selected air stoichiometries to be realized. As most of the hydrogen is already used in the stacks, the catalytic burner is operated at comparatively lower flow rates of anode off-gas and air than in start-up phase B. On the other hand, start-up phase B shows lower flow rates in the system, apart from the catalytic burner. Here, operation with reformate results in a seven-fold increase in the maximum air flow, and the amount of off-gas is more than doubled.
Table 3 complements the data compiled for the “Detailed Engineering” analysis, with temperatures and gas compositions at selected positions in the system, such as the ATR, WGS, anode, cathode, and CAB outlets. For the first two, the design temperatures and compositions were identical in both operating modes. Again, the CO concentration at the WGS outlet was set to the target value of 1 (vol.)% in wet product gas. For the last three positions, the values differ according to the operating mode. It must be noted that a temperature increase of 10 K is allowed in the stack during APU operation mode. For the cooling and heating of the stacks, triethylene glycol (TEG) is used as the heat transfer medium. The cooling/heating loop was already presented in Figure 1. For the ATR, WGS, and CAB, the design temperatures represent those at the reactor outlet, which also includes the heat exchangers. The outlet temperatures at the catalytic zones are much higher, at around 680 °C for the ATR, 320 °C for the WGS, and 670–730 °C for the CAB. Based on the set of defined operating parameters, combined with the integrated design approach, a self-sustaining system is realized, which requires no extra heat input for the operation of the system during steady-state.
For the “Detailed Engineering”, the pressure losses were estimated in order to determine the required pressure levels of the air compressors in the system. The air compressor for the ATR, which was connected to the CAB for the above-discussed pre-heating, must deliver 1.42 bar(a). The air compressor for the stack must deliver 1.24 bar(a) and the air compressor for the CAB 1.14 bar(a). Similarly, the pressure levels for the liquid pumps for the water and fuel supply were determined so that appropriate pump-nozzle combinations could be selected, which can produce good spray behavior for the selected operating window. Accordingly, the water pumps will deliver 22 bar(a) and the diesel pump 81 bar(a). Based on this information, the BoP components were selected in the next step.
For the sake of completeness, the BoP components were categorized and listed in different groups consisting of the flow meter, compressor, pump, glow plug, valve, filter, heat exchanger, fan, and pressure transmitter in Table A1, which can be found in the Appendix A. The main selection criteria for the BoP components was their compactness and reliability. Furthermore, all BoP components could be operated at low DC voltages (12, 24 or 48 V). The three air compressors from Celeroton are turbo compressors that are not only compact but also feature very high isentropic efficiencies on the order of 58–59% [56]. Moreover, they function in battery and fuel cell modes, representing the system start and normal operation, respectively. Despite the large discrepancy between the required air flow rates from the CAB compressor for the start-up phase and normal operation (see Table 2), this task was achieved with a single compressor. As the air flow rates during normal operation are very low, the compressor delivers a higher flow rate during normal operation and a solenoid valve discharges excess air. This approach is acceptable from an energetic point of view, as the selected compressor features an exceedingly low power consumption of less than 50 W at a maximum load point during normal operation. A further highlight is the diesel micro-pump from Hydro Leduc, which enables high liquid pressures as a good alternative to fragile laboratory pumps. In addition, the membrane pumps from KNF offer a cost-effective and compact solution for water supply. Several flow meters are used in addition to compressors and pumps in order to achieve the smooth and precise operation of the complete system at pre-defined and reproducible input parameters. The BoP list also contains several valves that are used to adjust the flow distribution through different paths, such as air distribution for the reforming reaction, CAB operation with anode off-gas or reformate, or non-return valves to avoid backflows in order to sustain proper system functioning and as a safety consideration. Tailor-made heat exchangers from Thermatron were used in cooling loops, together with ebm-papst fans. Finally, several pressure transmitters were used in the system in order to monitor the operating pressure at selected locations to control the flow stability and operate the BoP components and main system components within their permissible and recommended pressure levels.
The next step in the system’s development was its packaging design. Here, the challenge was to demonstrate the 40 We l−1 target defined for fuel cell-based APUs by the U.S. DOE. For this purpose, starting from the estimated power output of 7.5 kWe, an available volume of 187.5 l was calculated as the design basis. Following preliminary design studies, it was decided to place the two stacks at the upper back portion and the fuel processor components in the frontal section. With this configuration, the lower back part of the available system volume remained for the BoP components. This available volume has the advantage of operating the critical electronics of the BoP components at an ideal temperature level. In order to combine all of the system components according to the simplified system layout presented in Figure 1, an intensive design study was performed with the help of computer-aided design (CAD), analogous to packaging concepts utilized in the automotive industry. This design study yielded the CAD model shown on the left-hand side of Figure 5.
In the next step, the system was assembled in accordance with this model. The built system, which is shown in the middle and on the right-hand side of Figure 5, featured a volume of 187.5 l, which resulted in a power density of 40 We l−1 in terms of system performance estimated in the Detailed Engineering phase, based on the process simulations.
2.2. Experimental
The next step was the validation of the design with the aid of experiments. For this purpose, the following experiments were planned:
- Commissioning of the system and break-in procedure of the stacks.
- Characterization of the system at steady-state: Normal system operation at different loads.
- Optimization of the start-up phase.
For the commissioning, the BoP components were first tested and, where necessary, calibrated. The characteristic curves were generated in order to predict and assess their performance at different operating points. As this was a technical process, the details of the commissioning of the BoP components are not discussed in detail. Subsequently, the fuel processor was taken into operation without an electrochemical reaction in the stacks, as per start phases A and B.
In the second part of the commissioning, the fuel cell stacks were taken into operation. In the literature, different approaches for the break-in procedure of HT-PEFCs are reported. Tingelöf and Ihonen investigated different procedures for HT-PEFCs with phosphoric acid-doped polybenzimidazole membranes [57]. They observed that the 100 h break-in with hydrogen at a low current density (0.2 A cm−2) at 160 °C, as recommended by the membrane electrode assembly supplier, leads to a voltage increase of 20–25 mV over 100 h. They also observed a further performance increase after 100 h. In a second approach, they tested the potential cyclic break-in, but found out that this approach did not increase the cell performance. Finally, they identified a suitable break-in procedure to cover a one-day galvanostatic operation at 200 °C, followed by two days of relaxation at 160 °C.
Amongst other groups, Thomas et al. [58] compared different break-in times and analyzed the effect of operation with reformate from methanol reforming during and after break-in. The break-in was realized at a low current density of 0.2 A cm−2. Their results showed that different break-in times did not affect cell performance. The break-in tests with reformate instead of hydrogen also showed little or only negligible voltage losses during break-in.
In the case of the highly integrated system design developed in this study, it was not possible to achieve a break-in with pure hydrogen. Therefore, a break-in of at least 24 h at a low load was planned with the reformate. However, the strong drop in the average cell voltage, as will be reported in the results section, indicated that it would not be possible to conduct a 24 h break-in experiment, even at a low current density. Therefore, an alternative break-in approach was developed for this study. According to this procedure, each break-in experiment consisted of 1 h of operation at 20 A (0.12 A cm−2), followed by 1 h at 10 A (0.06 A cm−2).
After having reached a stable performance through a series of break-in experiments, the system load was varied in order to analyze the system performance with the help of polarization curves. For these experiments, the composition of the reformate at the WGS outlet was continuously analyzed using a combination of a mass and Fourier-transform infrared (FTIR) spectrometer (Cirrus 2/Multigas TM 2030). For these analyses, dry gas samples were used following their condensation at 7 °C. Further details on the equipment used and the measurement uncertainties can be found in Samsun et al. [53]. In addition, further gas analyses were performed for the reformate at the ATR outlet and off-gases at the CAB outlet at steady-state points.
The break-in and characterization experiments were conducted at different reformer loads with pre-defined parameters, such as a molar steam-to-carbon ratio (1.9) and oxygen-to-carbon ratio (0.47) in the ATR, an air ratio of 1.3 in the CAB and 2.0 in the HT-PEFC cathode, and a hydrogen utilization of 83% in the stack, unless otherwise stated in the results section.
After characterizing the system, the focus was placed on the start-up period. The U.S. DOE targets call for a start-up time of 30 min from ambient temperature [22]. As explained in the system design section, the system featured an integrated start-up capability, which means that it can be started without the need for an external heat source other than electric current. The heating up of the fuel processor reactors and the preparation of superheated steam for the autothermal reforming was enabled by the electrical heating wires in the ATR and WGS. The glow plug placed at the CAB inlet helps to heat the CAB catalyst during start-up. At the beginning of the start-up procedure, all three heaters are turned on at their pre-defined levels and the air feed begins through the catalytic burner and shift reactor inlets. The CAB glow plug is turned off after the start of catalytic combustion in the reactor. The ATR heater is turned off after having reached 500 °C in the middle of the ATR monolith and ensuring internal steam production at temperatures higher than 100 °C in the CAB, after the start of the reforming reactions. The WGS heater is turned off upon reaching 225 °C at the inlet of the LTS stage. Once the fuel processor commences operation, the system can recover its excess heat for educt recovery and the electrical heaters are turned off. This part of the start-up strategy was already validated and optimized using the sixth-generation fuel processor [48]. For the APU system, however, start-up is only completed if the fuel cell stacks are brought to ideal operating temperatures, whereby the electrochemical reactions can begin. As discussed in the system design phase, the fuel processor and fuel cell stacks are thermally-coupled through the heat exchange fluid. In the start-up phase, the excess heat from the CAB operating in reformate mode is transferred to stack heating. Thus, the experiments to optimize the start-up period have the aim of finding the best operating phase among start-up phases B1–B3 that can ensure the quickest start-up time without exceeding the temperature, pressure, and flow rate limits defined for various system components. For this purpose, a series of start-up experiments were performed, the results of which will be discussed in the next section.
3. Results
In this section, the experimental results are presented in three parts, namely: the break-in procedure, characterization, and start-up.
3.1. Break-In Procedure
During the first experiment on the full system under operation (E5), it was found that the complete current was delivered by a single stack. An electrical measurement showed no indices for a short-circuit and the final inspections before the assembly of the stacks in the system did not show any signs of a malfunction. In order to exclude the possibility of a non-homogenous distribution of educts, the upper and lower stacks were exchanged. Yet, the same stack continued to show no signs of electrochemical activity, whereas the other one delivered the complete power. This situation did not change during further experiments. The malfunctioning of the stack could be explained by defects in the cross-tightness between the anode and cathode parts of some cells, but it was not possible to determine a concrete reason for this. This issue complicated the system’s operation, as the current set-up distributed the produced reformate gas equally to the two stacks without the possibility of detaching one stack or guiding the reformate through a single stack.
The direct consequence of this issue was the operation of the functioning stack at the desired hydrogen utilization level while the non-functioning stack was operated at zero hydrogen utilization. The overall hydrogen utilization was only 41.5% instead of 83% at the design point. Consequently, the CAB had to process 58.5% of the produced hydrogen instead of 17%. As the CAB was thermally-coupled with the ATR via the steam and air paths, it is obvious that the malfunctioning of the stack also led to a shift in the design points for the upstream reactors ATR and WGS as well.
Nevertheless, it was still possible to operate the system with a single stack and test almost all of its functions. As noted in the previous section, a modified break-in procedure was applied, as it was not possible to achieve stable stack performance during its first contact with the reformate. This is because the functioning stack was also not in the ideal state at the start of the experiments. The stacks were purchased new for this system and had not been used previously. However, the long downtime of the stacks prior to their first use in the system, on the order of several years, strongly influenced their performance in a negative manner, despite their storage under vacuum conditions and frequent purging with nitrogen during this period.
A series of experiments, depicted in Figure 6, summarized the applied break-in procedure beginning with E5 and ending with E25. In the first experiment, E5, a strong decrease in the stack voltage could already be observed in the beginning of the experiment at 20 A, with a drop in the stack voltage from 69 V to 61 V within a period of 8 min. Due to this strong drop in cell voltage within this short period, it was clear that the recommended break-in procedure at a low current density for a period of 24 h would not be possible to achieve. In decreasing the current to 15 A, the decreasing rate of the voltage drop was only slightly reduced, and therefore the current was reduced to 10 A for the remaining part of the experiment, which lasted 140 min, during which the stack voltage showed a more stable trend. Especially during the last hour, the stack voltage was stable at 62 V. The next experiment, E7, featured better performance, whereby the stack was first operated for 70 min at 20 A and then another 70 min at 10 A. Despite a strong voltage drop, especially during the first period, the voltages were higher than in E5, and were again stable towards the end of the experiment. Also in E8, the voltage curves exhibited a better trend with respect to the voltage drop and were higher than those in E7. Until this point, an improvement in the stack performance had been observed in every experiment.
Experiment E10 was performed after a couple of days of no operation due to a weekend falling in between. In this experiment, especially in the beginning, a comparable performance to E8 was observed, with no performance improvement, unlike in the previous experiments. This indicates that even a short downtime of stacks for a weekend negatively affects their performance. In the course of the experiment, a stable performance was again observed, which was better than in the previous experiments. Unlike the other experiments, this experiment was continued for a longer time period in order to check the effect of slight parameter changes on the stack performance. The drop in stack voltage at around 125 min in Figure 6 can be explained by the negative disturbance that resulted in an increased CO concentration of >1 (vol.)%. In the further course of the experiment, the CO concentration at the WGS outlet was again reduced to <0.5 (vol.)%, so that the original stack voltage was restored and remained stable at the end of this extended experiment, which lasted more than 3.5 h. In the next two experiments, E11 and E12, the stack voltage curves displayed another improvement in favor of a more stable trend and higher levels. The remaining experiments exhibited a more or less similar trend. Even at 20 A, the stack voltage curves showed stable behavior and the values at 10 A could be considered totally stable at around 81 V during the 1 h of operation at this current.
As no further improvement was observed in the electrochemical performance, the break-in experiments were closed at this stage with E25. It must be noted that the resulting procedure, with 1 h of operation at 20 A and another hour at 10 A, was established as the standard break-in approach, and so these experiments were also performed after longer periods of downtime. It must be noted here that Figure 6 only shows a selection of the experiments for the sake of simplicity. Figure A1 in Appendix B displays a complete overview of further experiments corresponding to this strategy.
3.2. Normal Operation Mode
After achieving a stable voltage level following the break-in experiments, the system was characterized with the help of polarization curves. For this experimental series, the reformer load was varied for different measurement points and the current density was set to pre-defined values. The stack voltage and the produced electrical power were read as the results. In parallel, all flow rates, temperatures, and pressures were recorded and gas samples were taken for an analysis of the concentrations.
The reformer load was varied between 25.7% and 83.7% according to the accompanying parameters defined in the design section. The load changes were attained within 5 s by applying the load change strategy developed for the sixth generation fuel processor in Samsun et al. [7]. The continuous product gas analyses indicated that the CO concentration at the WGS outlet remained under 1 (vol.)% (dry gas) at all times during these experiments. As already noted, because the produced reformate was equally distributed to each stack, but electrochemical reactions took place in only one, the catalytic burner was operated at a much higher air flow rate so that the total amount of anode off-gas could be utilized in the catalytic burner. This deviation resulted in higher reaction temperatures in the catalytic burner and higher pressure drops than initially estimated. As a direct consequence, the maximum load of the reformer was limited to 83.7%, and it was not possible to achieve the pre-defined maximum load of 93%, which was required to obtain the maximum power point of 3.75 kWe per stack according to the process simulations. Thus, the potential of the reformer could not be fully exploited due to the fact that the CAB was overloaded by zero hydrogen utilization in one stack, together with the resulting high temperatures and pressures in the system.
However, it was possible to operate the stack and check all system functions despite this large deviation from the design parameters. Figure 7 shows the polarization curves from two experiments, which were reproducible. At the highest current density of 396 mA cm−2, operation at the maximum possible reformer load of 83.7% (corresponding to 2260 g h−1 NEXBTL diesel, n(O2)/n(C) = 0.48, n(H2O)/n(C) = 1.9, a share of 65% of ATR water, and 60% of ATR air via steam path through the CAB, 1790 g h−1 water feed to LTS, 32,800 Nl h−1 air for cathode via WGS, 18,000 Nl h−1 air for the CAB) resulted in 3.3 kW of electrical power from one stack.
The complete heat exchange strategy was validated in this experiment, with a steam-air mixture temperature of 356 °C at the ATR heat exchanger inlet and 460 °C at the ATR mixing chamber inlet, an ATR air temperature of 160 °C at the mixing chamber inlet, a cathode air temperature of 149 °C, and a reformate temperature of 146 °C at the stack inlets. Moreover, the heat exchange fluid had a temperature of 159 °C at the stack inlet and 167 °C at the stack outlet, revealing a highly effective cooling of the stack within the allowable limits (10 K) at the maximum load.
The main components in the analyzed dry product gas sample taken at the WGS outlet were hydrogen (41.5 (vol.)%), nitrogen (37.4 (vol.)%), carbon dioxide (19.8 (vol.)%), argon (0.6 (vol.)%), carbon monoxide (0.5 (vol.)%), and methane (0.2 (vol.)%). Balance calculations showed that the product gas also contained 22.9 (vol.)% steam, so that the concentration of CO of the wet product gas at the anode inlet dropped to 0.4 (vol.)%. The concentrations of undesired side products were at a negligible level at their detection limits.
Further balance calculations showed that the hydrogen utilization of the anode was 88%, which was even higher than the 83% targeted in the process simulations. With these results, the achieved electrical power of 3.3 kW was 450 W lower than the maximum power target defined in the process simulations. Higher power levels at a higher current density could not be achieved so as to not exceed the maximum allowable pressure difference between the anode and cathode (200 mbar) due to the overloading of the catalytic burner, with one stack operating at zero hydrogen utilization. Consequently, higher reformer loads could not be obtained, which could lead to higher power at higher current densities.
During complete system operation in APU mode, all calorific gases were catalytically-converted into steam and carbon dioxide in the catalytic burner, although one stack exhibited no hydrogen utilization, substantially increasing the load of the catalytic burner by comparison to its design point. In this mode, an example gas analysis revealed no hydrogen and carbon monoxide, 81.5 (vol.)% nitrogen, 10.9 (vol.)% oxygen, 6.4 (vol.)% carbon dioxide, 1.3 (vol.)% argon, and very low amounts of methane (0.0014 (vol.)%). During reformate operation, such as in the start phase, which presents the highest challenge for the CAB, an example gas analysis again showed no hydrogen and carbon monoxide, 80.9 (vol.)% nitrogen, 13.1 (vol.)% oxygen, 5.0 (vol.)% carbon dioxide, 1.0 (vol.)% argon, and higher but still very low amounts of methane (0.01 (vol.)%). In both cases, the undesired side products of reforming (higher hydrocarbons) were below their detection limits.
3.3. System Start
As noted in the previous section, the goal of the start-up experiments was to reach the 30 min start-up time target. Until this stage, the heating-up and start of operation were realized under mild conditions, resulting in a start-up period of 60–70 min. Such a long start-up period is energy-intensive and limits the practical applications of a fuel cell APU. The start-up segment of the system’s steady-state experiments showed that it would not be possible to achieve the 30 min target according to the parameters defined in start-up phase B3 (see Table 2).
In this section, the results of the four start-up experiments (SE) are presented. In the first two experiments, SE1 and SE2, parameters corresponding to start-up phase B2 were applied, which are based on a reformer load of 37%. The last two experiments, SE3 and SE4, were performed according to start-up phase B1 at a 50% reformer load, which is the highest possible reformer load during start-up. The reformer was always started at the minimum load of 25.7% before increasing the load level to 37% and 50%, respectively, for start-up phase B. During all stages, the molar oxygen-to-carbon ratio was set to 0.48 and the steam-to-carbon ratio to 1.9.
In the following, the results are discussed with reference to Figure 8. Figure 8a shows the typical flow rates of fuel (left) and air (right) at the inlet of the ATR mixing chamber, which play the key role in the reformer’s start-up. In each experiment, the fuel flow is set to a higher flow rate than the minimum value, corresponding to a 25.7% load for a few seconds in order to initiate a spray formation at the selected low load level. In Figure 8b, the course of carbon monoxide concentrations (dry state) at the outlet of the WGS reactor are given, which are critical for stack operation. Finally, Figure 8c shows the response of the stack with the help of the stack voltage (left) and current (right) curves.
In start-up experiment SE1, the electrical heating wires in the reformer and shift reactor were heated at 2640 We and 687 We, respectively. The glow plug at the CAB inlet was heated at 771 We. Reforming started after 8 min 30 s, with the CO concentration at the anode outlet being less than 1 (vol.)% after 12 min 24 s. Electricity generation by the stack was commenced after 30 min.
SE2 was performed with exactly the same parameters as SE1 with one exception: in SE2, the reformer load was increased to its steady-state value for reformate operation (start-up phase B2) in one step instead of three. The three-step load increase, which can be clearly observed in Figure 8a, obviously prolonged the start-up period in SE1, as this measure boosted the start-up strategy in SE2, thus reducing the start-up period to 28 min 30 s. As expected, the start-up of the reforming did not change in this experiment.
Switching to the operating parameters corresponding to start-up phase B3 in SE3, a substantial reduction in the start-up period was demonstrated without increasing the power input to heat the reactors. With this measure, the start-up time was reduced to 23 min 55 s. The start of the reforming did not change as in SE2, but took longer (13 min 39 s) to reduce the CO concentration to the target value of below 1 (vol.)% due to the load increase at the beginning.
In the final start-up experiment SE4, two additional measures were applied. First, the internal heating wire of the ATR was operated at a slightly higher power level of 3020 W. With the start of the reformer’s operation, the power was reduced to the same level as in SE1–SE3 in order to avoid overheating, before the wire was fully shut down. As a second measure, the complete ATR air was introduced through the steam path, so that the complete air amount arrived at the ATR mixing chamber and therefore the ATR catalyst at a higher temperature. With the start of reforming in the ATR, the share of air through the steam path was reduced to its steady-state value of 60% as in SE1–SE3. With the help of these two additional measures in SE4, the start of the reforming was commenced more quickly, in 7 min 22 s. The time period to reduce the CO to less than 1 (vol.)% was 13 min. The start-up was completed in 21 min 47 s, i.e., more than 2 min faster than in SE3.
The energy consumption accounted for by the electrical heating was 2.58 MJ and 2.60 MJ in SE1 and SE2, respectively. The quicker start-up in SE3 slightly reduced the energy consumption to 2.53 MJ. The quickest start-up, in SE4, was achieved at the lowest energy consumption of 2.50 MJ. Here, the negative effect of heating at higher power was compensated for by the reduced heating period for all three components. Table 4 summarizes the experimental results in start-up experiments SE 1–4.
4. Discussion
Tingelöf and Ihonen list membrane humidification, the removal of impurities from the catalyst, the ripening of the catalyst, and the redistribution of the electrolyte as possible reasons for performance improvement during the break-in period. Operation of the PBI membrane at a higher level than its design temperature can cause a decrease in performance due to the evaporation of phosphoric acid and lowering of membrane conductivity. Similarly, they did not observe an activating effect of potential cycling in the range of 0.5–0.8 V after 100 h of galvanostatic break-in [57].
Thomas et al. [58] demonstrated that the degradation rates were of the same degree of magnitude, independent of the break-in time. They also point out that break-in with hydrogen is important for ensuring greater durability when operating on reformed methanol. They point out that high degradation, which is primarily caused by mass transport, is influenced by acid redistribution in the presence of water. They also state that in the initial period, the acid is spread over the MEA non-uniformly, with water tending to drag the acid away. Thus, they suggest a break-in with hydrogen in order to achieve a uniform acid distribution prior to switching to wet reformate operation. Similarly, Lang et al. observed that short operation (90 h) under highly humidified conditions exhibited a similar degree of degradation with a long-term test (4600 h), suggesting a detrimental effect of the water [59]. Boaventura and Mendes observed an increase in catalyst activity and a decrease in ohmic resistance during the galvonastatic activation of a commercial PBI cell [60]. They suggest that an increase in the catalyst activity can be achieved by removing impurities or redistributing the electrolyte.
Traces of phosphoric acid were found in the downstream components and piping, even before the start of stack operation in this study. This suggests the presence of acid leaching during heating-up cycles and pressure tests at operating temperatures. The results from the developed break-in procedure, which consists of 1 h each of operation at low currents of 20 A and 10 A, suggest that the non-uniformity of phosphoric acid is reduced during each operation. Moreover, each start/stop cycle without longer downtime periods in between seem to have a positive influence on the performance. In contrast, longer operation does not lead to an improvement in the voltage. The modified break-in procedure results in the stack being operated at very low currents for a period of more than 30 h, which is longer than the 24 h recommended by the stack manufacturer. At the same time, the 30 h were not reached in a single experiment, but rather in 14 experiments following a mild and controlled start/stop strategy, as the performance drop was very strong in the initial experiments and longer runs only stabilized the performance, but did not lead to it improving. Instead, higher cell voltages and improved stability were observed after each start, especially in those without a long downtime.
At this stage, it is not possible to identify the concrete mechanism that resulted in a complete malfunction in one stack and lower performance in the functioning stack without further analysis. However, it is not the goal of this work to perform a post-mortem analysis on the used stacks, as they are not developed herein but bought as commercial products. Due to their commercial nature, the stacks did not allow for the possibility of single cell voltage measurements to be taken, and therefore it was not possible to identify whether some of the cells suffered from defects in cross-tightness between the anode and cathode. Araya et al. point out catalyst degradation and phosphoric acid loss as two causes of the performance decay in the initial stage of the service life, caused by a higher operating temperature and dynamic conditions such as load, start/stop, and thermal cycling [27].
Thanks to the adapted break-in procedure, it was possible to bring the functioning stack to a stable performance level. In the light of previous findings reported in the literature, the results from this work suggest that a more uniform distribution of phosphoric acid may be achieved towards the end of the experiment series. This is in agreement with Araya et al., who state that the effect of phosphoric acid loss on the cell performance decreases gradually over time [27]. At the same time, the results suggest that a long downtime prior to operation beginning, which is on the order of years in this case, must be avoided. Similarly, short downtimes on the order of days also resulted in a performance loss, which could, however, be eliminated by applying the modified break-in procedure described herein. Traces of phosphoric acid found in the piping, even before the start of electrochemical stack operation, suggest that either the dry heating of the stack with air for pre-tests or the long period of downtime resulted in the leaching of the phosphoric acid.
The results from the characterization of the system demonstrate the robustness and flexibility of the system design, notwithstanding its high level of integration. Despite a large deviation from the design parameters due to a malfunctioning stack, it was possible to find proper parameters for operating the complete system, including the fuel processor reactors, BoP components, and one functioning stack, and to achieve a maximum power level of 3.3 kWe at a high hydrogen utilization of 88% in one stack. The maximum power achieved is fairly close to the target value of 3.75 kWe per stack. This result suggests that if both stacks were to be in the same condition, a maximum power of at least 6.6 kWe (3.3 kWe × 2) would be possible, resulting in a power density of 35 We l−1. This value is lower than the U.S. DOE target of 40 We l−1, but is still better than published values for conventional APUs that range from 11 to 33 We l−1, with an average of 20 We l−1 [22]. Moreover, the state-of-the-art fuel cell APU based on SOFC technology (status 2015) is given as 16 We l−1 in the DOE targets [23]. The approach of upscaling the achieved stack power to two stacks can be justified by the fact that the produced reformate was distributed equally to both stacks, despite one showing no electrochemical performance. As higher reformer loads and current densities could not be tested due to the malfunctioning stack, although all system components had this potential, it can be stated that even higher power levels would be possible, with the second stack performing as well as the functioning one.
The developed start-up strategy using electrical wires in ATR and WGS and a glow plug at the CAB inlet for start-up of the fuel processor and to heat up the stacks recovering the heat produced in the fuel processor in the reformate operation mode of the CAB was validated and optimized in four steps. Following the middle strategy, in accordance with start-up phase B2 parameters, the start-up time could be reduced to 28 min 30 s. Applying the parameters according to the more ambitious start-up phase B1, increasing the power of the internal heating wire of the ATR slightly and introducing the complete ATR air through the steam path, a start-up period of less than 22 min was demonstrated. With this start-up time, the U.S. DOE target of 30 min is undershot. As discussed in the introduction, similar or even longer start-up times have only been reported in the literature for fuel-processing systems based on diesel reforming, with the achieved start-up time for the complete system advancing the state-of-the-art for fuel cell systems with diesel reforming in the kW class. In comparison, in the DOE targets, the 2015 status is reported as 70 min and refers to the APU system from the DESTA project, which was an SOFC APU [23].
It is important to note that the electrical start-up strategy is the outcome of an intensive development process, starting with the development of a concept with the help of a validated CFD analysis [61], as well as optimization tests on a reformer [50] and fuel processor [48] level. In this work, the complete start-up strategy was achieved for the first time, including the stack heat-up without using external means of heating such as a thermostat, which was the case in the first-generation APU system developed at Jülich [51].
Finally, the gross system efficiency can be calculated in relation to the electricity output of the stacks against the energy input of the fuel:
ηgross, system = Pout, stack/Pin, diesel.
The energy input can be calculated as follows using the lower heating value (LHV) of NEXBTL diesel (44 MJ kg−1 [24]) and the mass flow rate of the fuel used.
For the three design cases, the gross system efficiency varies between 25% at a maximum load and 34% at a minimum one. In the experiments, the gross system efficiency varied between 24% at the maximum achieved load, which is slightly lower than the design case, and 34% at the minimum reformer load, which corresponds to 25.8%, as in the design case. Although operation at current densities lower than 121 mA cm−2 was also achieved, these operating points were not considered in the efficiency calculation, as the hydrogen utilization was low at these points. It was not possible to keep the hydrogen utilization at a high level at these low current densities, as the lowest reformer load level had already been reached at 121 mA cm−2.
By introducing two further efficiency definitions it becomes possible to analyze the shares of chemical conversion in the fuel processor and electrochemical conversion in the fuel cell stack in the overall efficiency:
ηfuel processor = Pout, hydrogen/Pin, diesel,
ηstack = Pout, stack/Pin, hydrogen.
The fuel processor efficiency, according to Equation (3), defines the conversion of diesel into hydrogen in the fuel processor. Due to the complete heat recovery in the system, the fuel processor efficiency can be defined using diesel input as the sole input term. The stack efficiency in Equation (4) relates hydrogen input from the fuel processor to the produced power in one stack. Considering both experimental points at maximum achieved load and the minimum reformer load, the fuel processor efficiency is calculated as 80%. The stack efficiency was 30% at maximum and 43% at minimum load. As expected, the multiplication of fuel processor efficiency with stack efficiency results in the gross system efficiency according to Equation (1). These results point out two findings. Firstly, the diesel fuel processing route demonstrated in this paper already consumes one fifth of the energy content of diesel fuel for hydrogen production, which quantifies the energetic disadvantage of this reformate-based system against hydrogen-based ones. Secondly, it is clear that the low stack efficiency in the case of maximum load operation is responsible for the low system efficiency at this load level.
Despite the very good agreement between the efficiency windows from the design and experiment cases, the experimental results suggest slightly poorer electrochemical performance due to two factors. Firstly, the operation window considered for the efficiency comparison was smaller in the experiment, due to the fact that the maximum planned reformer load was not achieved. As the average cell voltage typically drops at higher current densities due to higher ohmic potentials, which would be the case if operation at higher reformer loads were possible, the efficiency would drop at higher current densities. As the achieved current densities in the experiment were lower, we would expect a higher system efficiency in the experiment at a constant hydrogen utilization rate. Secondly, a higher hydrogen utilization rate was achieved in the experiment, with 88% instead of 83% assumed in the design case, with both values being constant for the window of the calculated system efficiencies. The operation at higher hydrogen utilization, which results in higher stack efficiency, was attained by achieving a much lower CO concentration of approximately 0.5 (vol.)% at the anode inlet compared to 1.0 (vol.)% in the design case. In addition, the stack was operated at slightly higher current densities for each corresponding reformer load. With the help of these indicators, it can be concluded that the condition of the stacks was not as good as that which was assumed in the design stage based on previous experience with HT-PEFC stack operation using diesel reformate.
At this point, a comparison between the condition of both stacks from the current system experiments and the first-generation system can be made. The stacks in the first-generation system were also built using PBI membranes, but not purchased as external components, and were built as a prototype using commercial MEAs [62,63]. Janßen et al. measured an average open-circuit voltage (OCV) of 0.96 V per cell for both hydrogen and synthetic reformate operation [63]. In turn, Samsun et al. measured similar values during operation with NEXBTL diesel [51]. The polarization curves displayed in Figure 7 show an average open circuit voltage of 0.86 V. This comparison suggests that the functioning stack was also negatively influenced by the long downtime before its assembly and testing in the APU system, which did not portray its ideal performance.
The demonstrated values for gross system efficiency can be compared to those discussed in the introduction for PEFC and SOFC systems. For PEFC-based systems with diesel reforming, values of 25.3–29% are reported at 2.3 kWe [17] and 2.9 kWe [18], respectively, whereas an efficiency of 34% was reported at 3 kWe for an SOFC system [21]. The gross efficiency achieved at maximum load in this work with HT-PEFC technology can compete with the lower value reported for the PEFC system, but the high value achieved by the SOFC system at maximum load could only be achieved in this study at partial load. As the consumption of the auxiliaries was not measured in this work, the net efficiency values cannot be compared with the available data at this point.
5. Conclusions
A complete fuel cell auxiliary power unit operating on diesel fuel was developed and tested. The core technologies were autothermal reforming and a high-temperature PEFC. The fuel cell system also included multifunctional reactors for the water-gas shift reaction and catalytic combustion, as well as balance of plant components. The main motivation for the system’s development was to incorporate recent scientific progress from diesel fuel processing into a complete system level and thus to bring the technology closer to real-world application. Therefore, the U.S. DOE targets for power density (40 We l−1) and start-up time (30 min) were defined as guiding objectives for the system’s development.
Despite a malfunctioning stack and the resulting deviations from the design parameters, it was possible to take the system into operation and achieve a stable and reproducible stack and system performance thanks to the modified break-in procedure developed for this study. Under these conditions, which limited the operation at the maximum reformer load defined in the design stage, a maximum electric power of 3.3 kWe was demonstrated at a high hydrogen utilization rate of 88%. By scaling this performance to two functioning stacks, the power density corresponds to 35 We l−1, which is not as good as the U.S. DOE target, but still better than the performance of conventional internal combustion engine-based APUs and demonstrated fuel cell APUs for trucks. Moreover, the developed start-up procedure could reduce the start-up period to under 22 min, which is quicker than the U.S. DOE target of 30 min.
Based on these results, it can be concluded that the developed system could advance the state-of-the-art of diesel-based fuel cell auxiliary power units in approaching the power density target and performing better than the start-up goal. The results and their discussion herein show that the performance of HT-PEFC stacks is decisive for the performance of the complete system.
Based on the promising results at the system level, the next step could be the replacement of both stacks and the characterization of the system with two new stacks. The results show that the very long downtime of the stacks prior to their first use in the system negatively influenced their performance, suggesting that such a downtime, on the order of years, must be avoided in the future. Furthermore, one stack delivering no power led to a major deviation from the design parameters. The operation with two stacks delivering a comparable performance could exploit the full potential of all system components, which could in turn further enhance the power density. In addition, future work could analyze the power consumption of auxiliary components and the extension of the operation to additional diesel- and kerosene-type fuels.
Author Contributions
Conceptualization, R.C.S., M.P. and A.T.; data curation, M.P. and A.T.; funding acquisition, R.P.; investigation, R.C.S., S.W. and J.P.; methodology, R.C.S.; resources, R.C.S. and J.P.; supervision, R.P.; visualization, R.C.S. and M.P.; writing–original draft, R.C.S.; writing–review and editing, M.P., A.T., S.W., J.P., and R.P. All authors have read and agreed to the published version of the manuscript.
Funding
This research received no external funding.
Institutional Review Board Statement
Not applicable.
Informed Consent Statement
Not applicable.
Data Availability Statement
Not applicable.
Acknowledgments
The authors are particularly grateful to their colleagues in the fuel synthesis and systems department of the IEK-14, especially Lydia Lang for the system assembly, Uwe Klüttgen for the manifold design and coordination of the system manufacturing, and Jan Meißner for support in the analysis of the product gas. We are also thankful to all colleagues from other departments of the IEK-14 who supported the development of this system with scientific and/or technical input. Special thanks are also due to the Central Institute of Engineering and Technology (ZEA-1) of the Forschungszentrum Jülich for the manufacture of the fuel processing reactors and system components for assembling the complete system.
Conflicts of Interest
The authors have no conflict of interest to disclose.
Appendix A

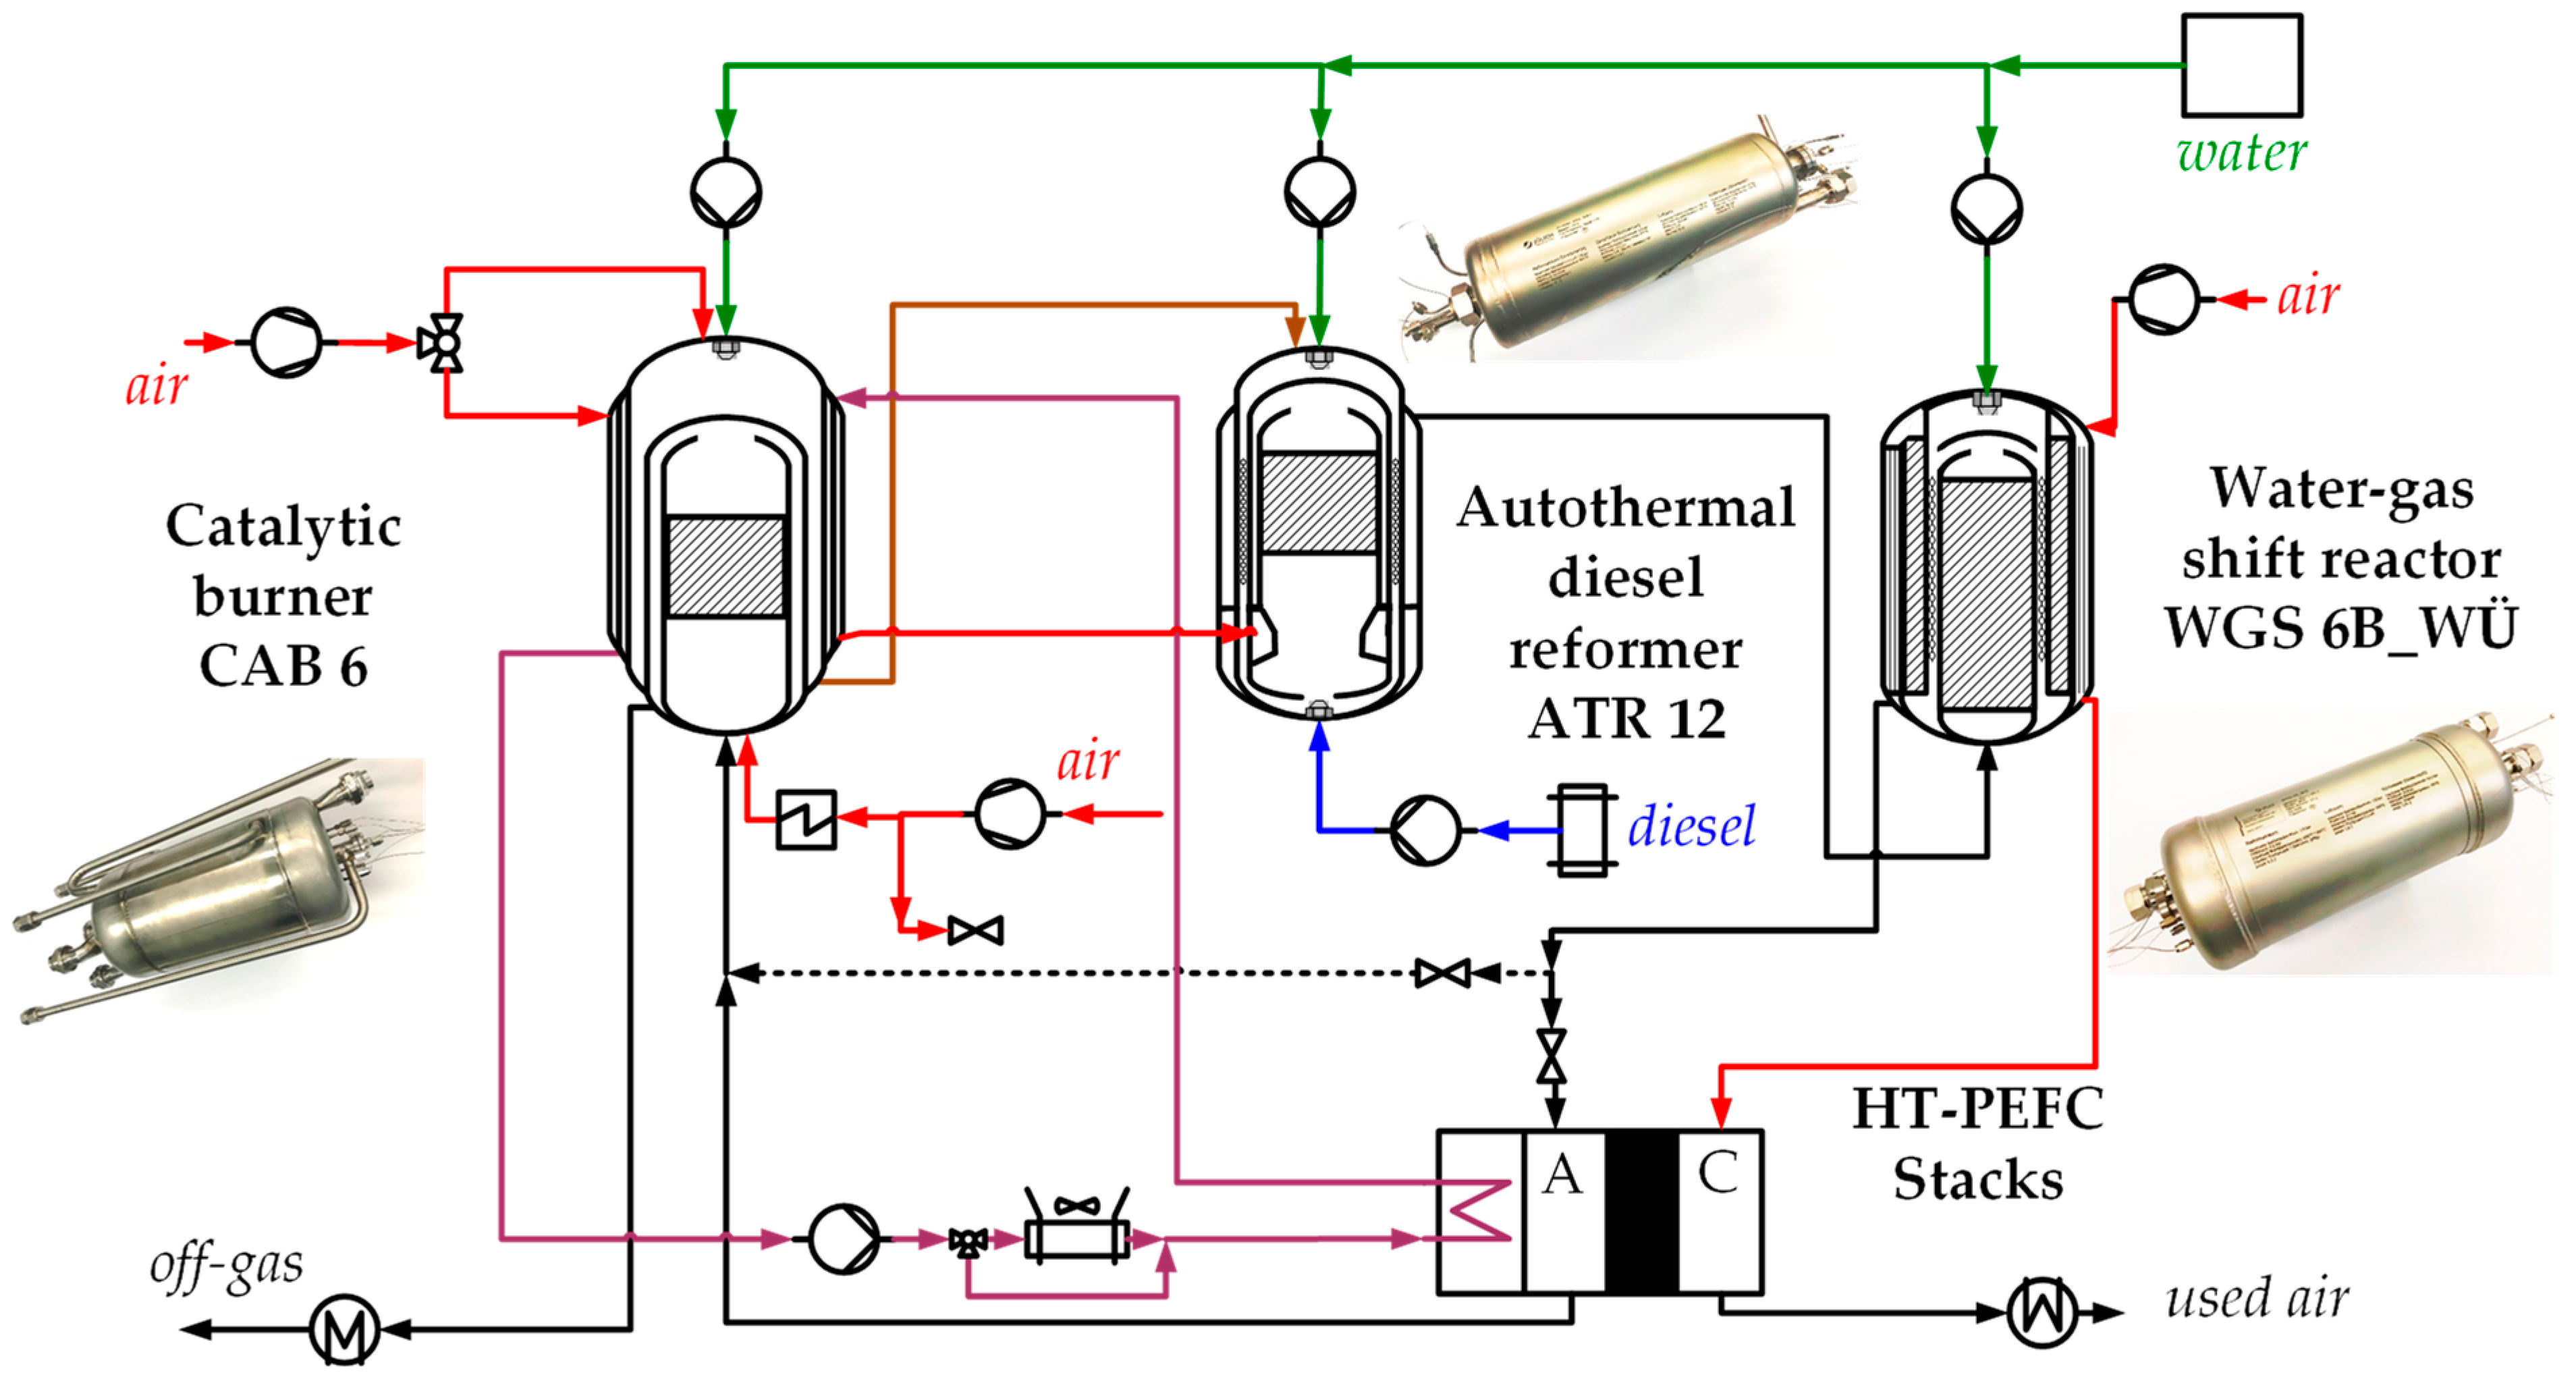
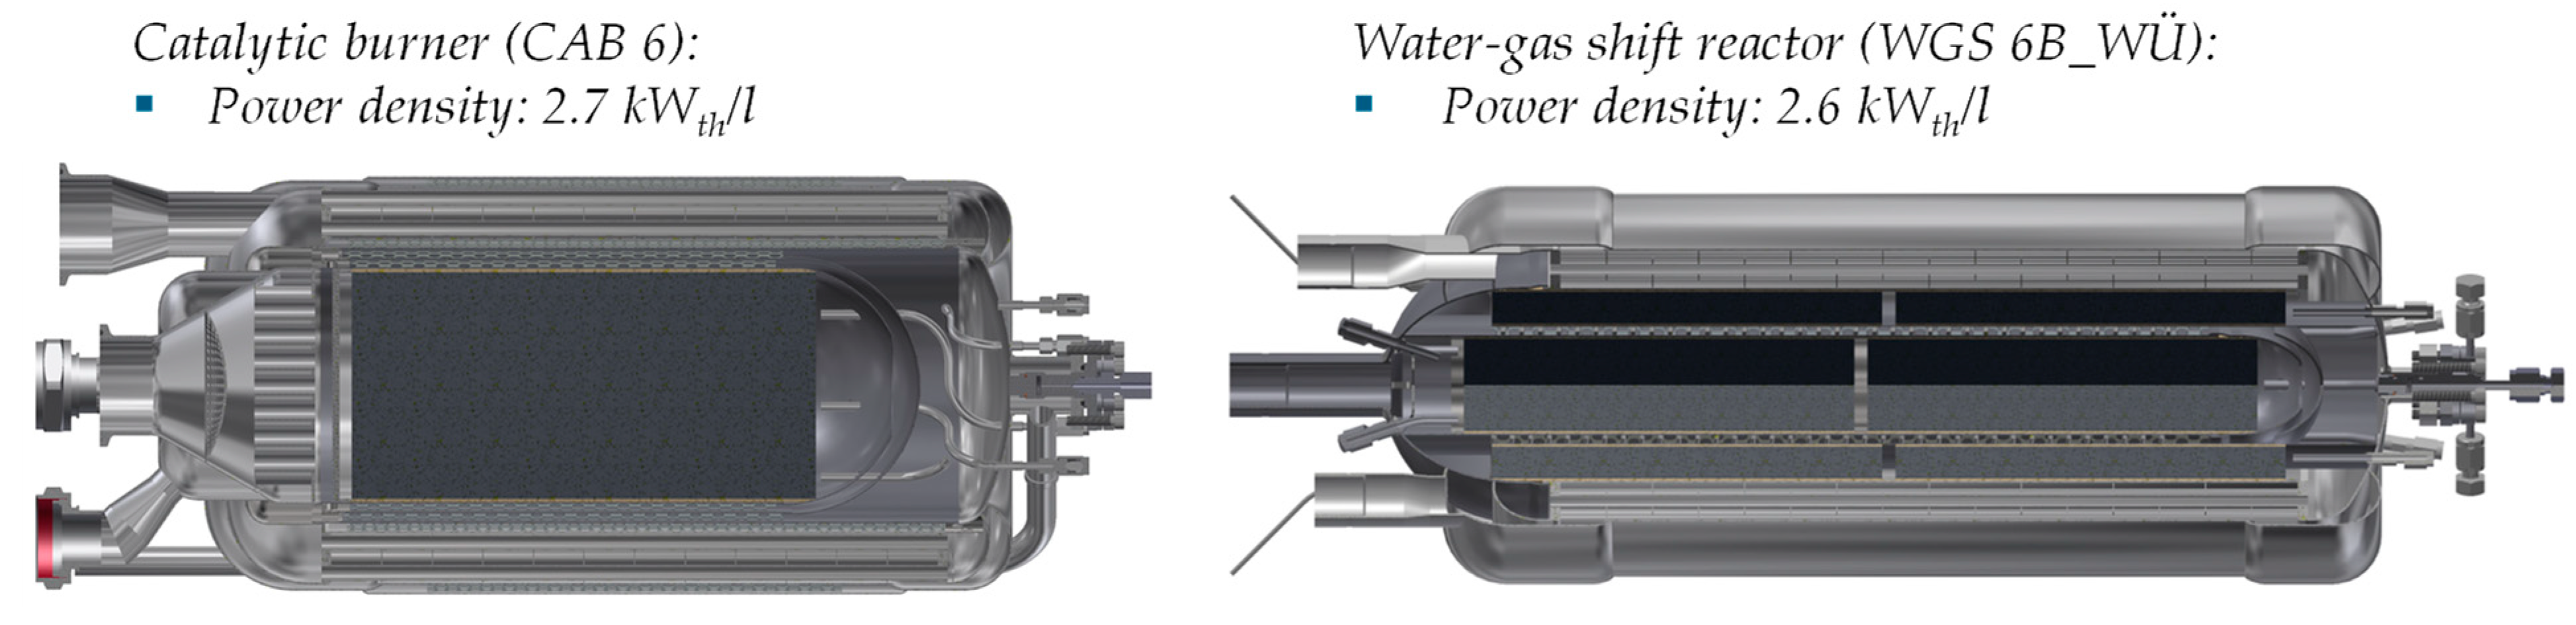
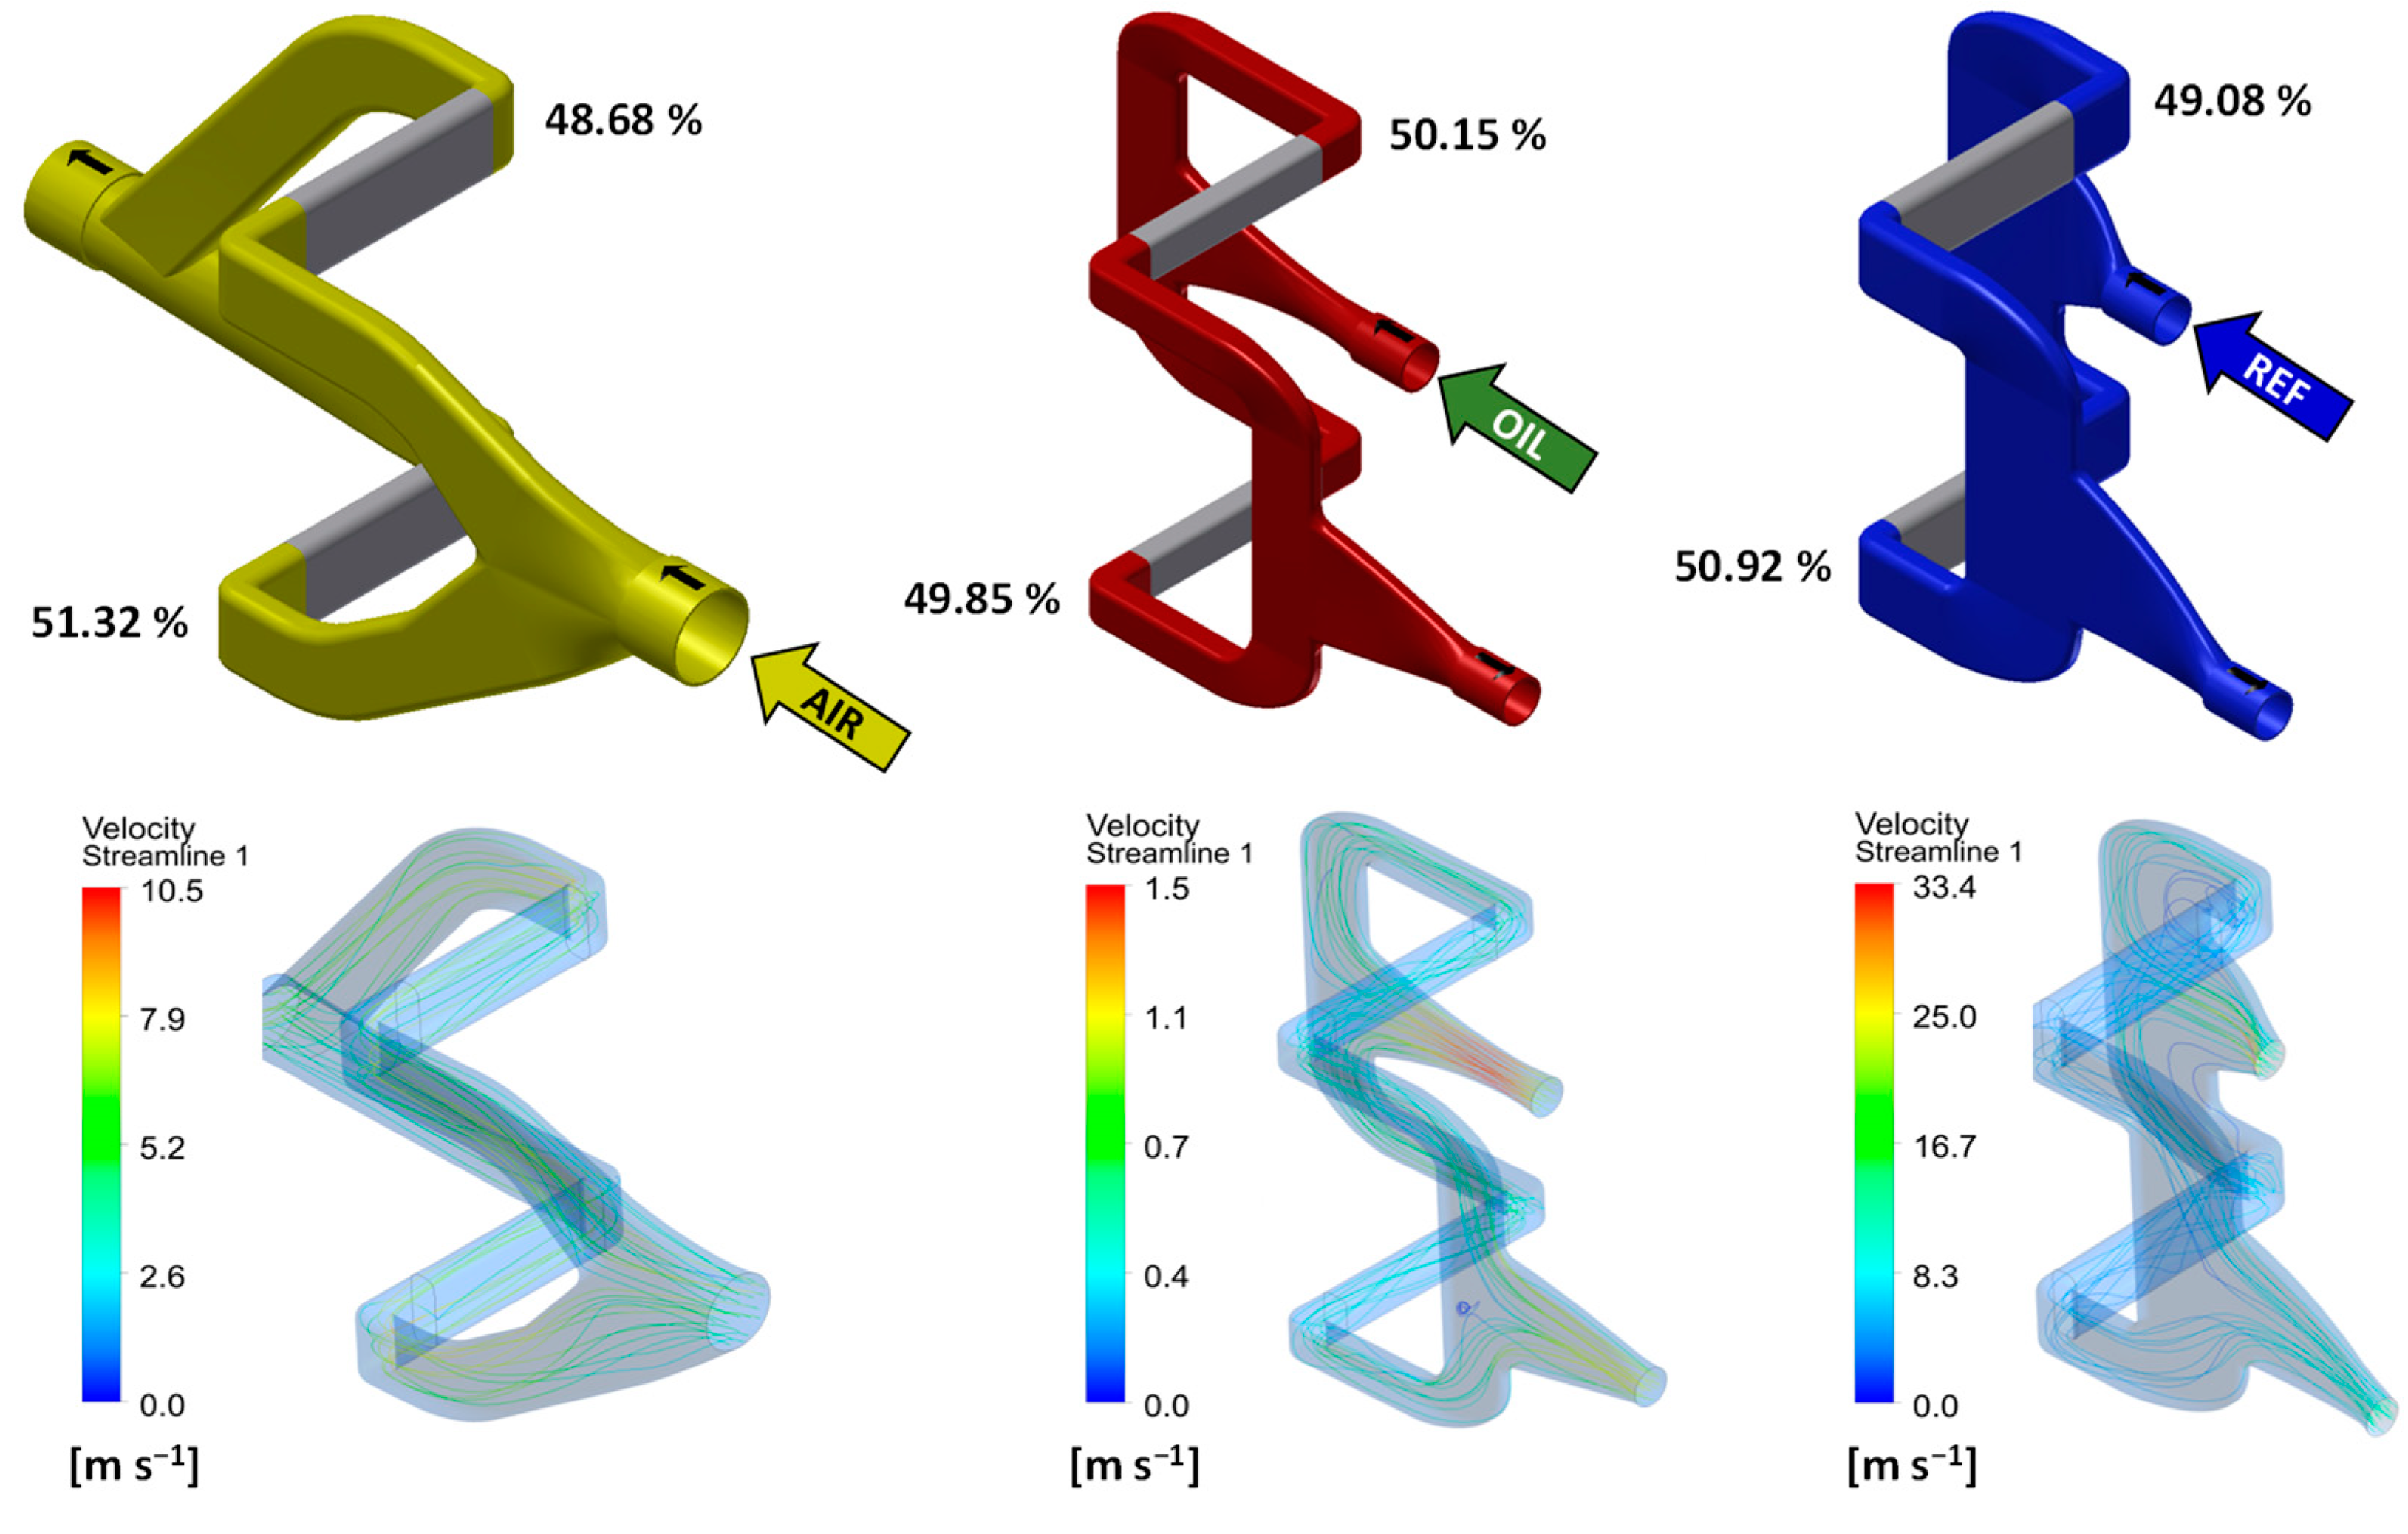
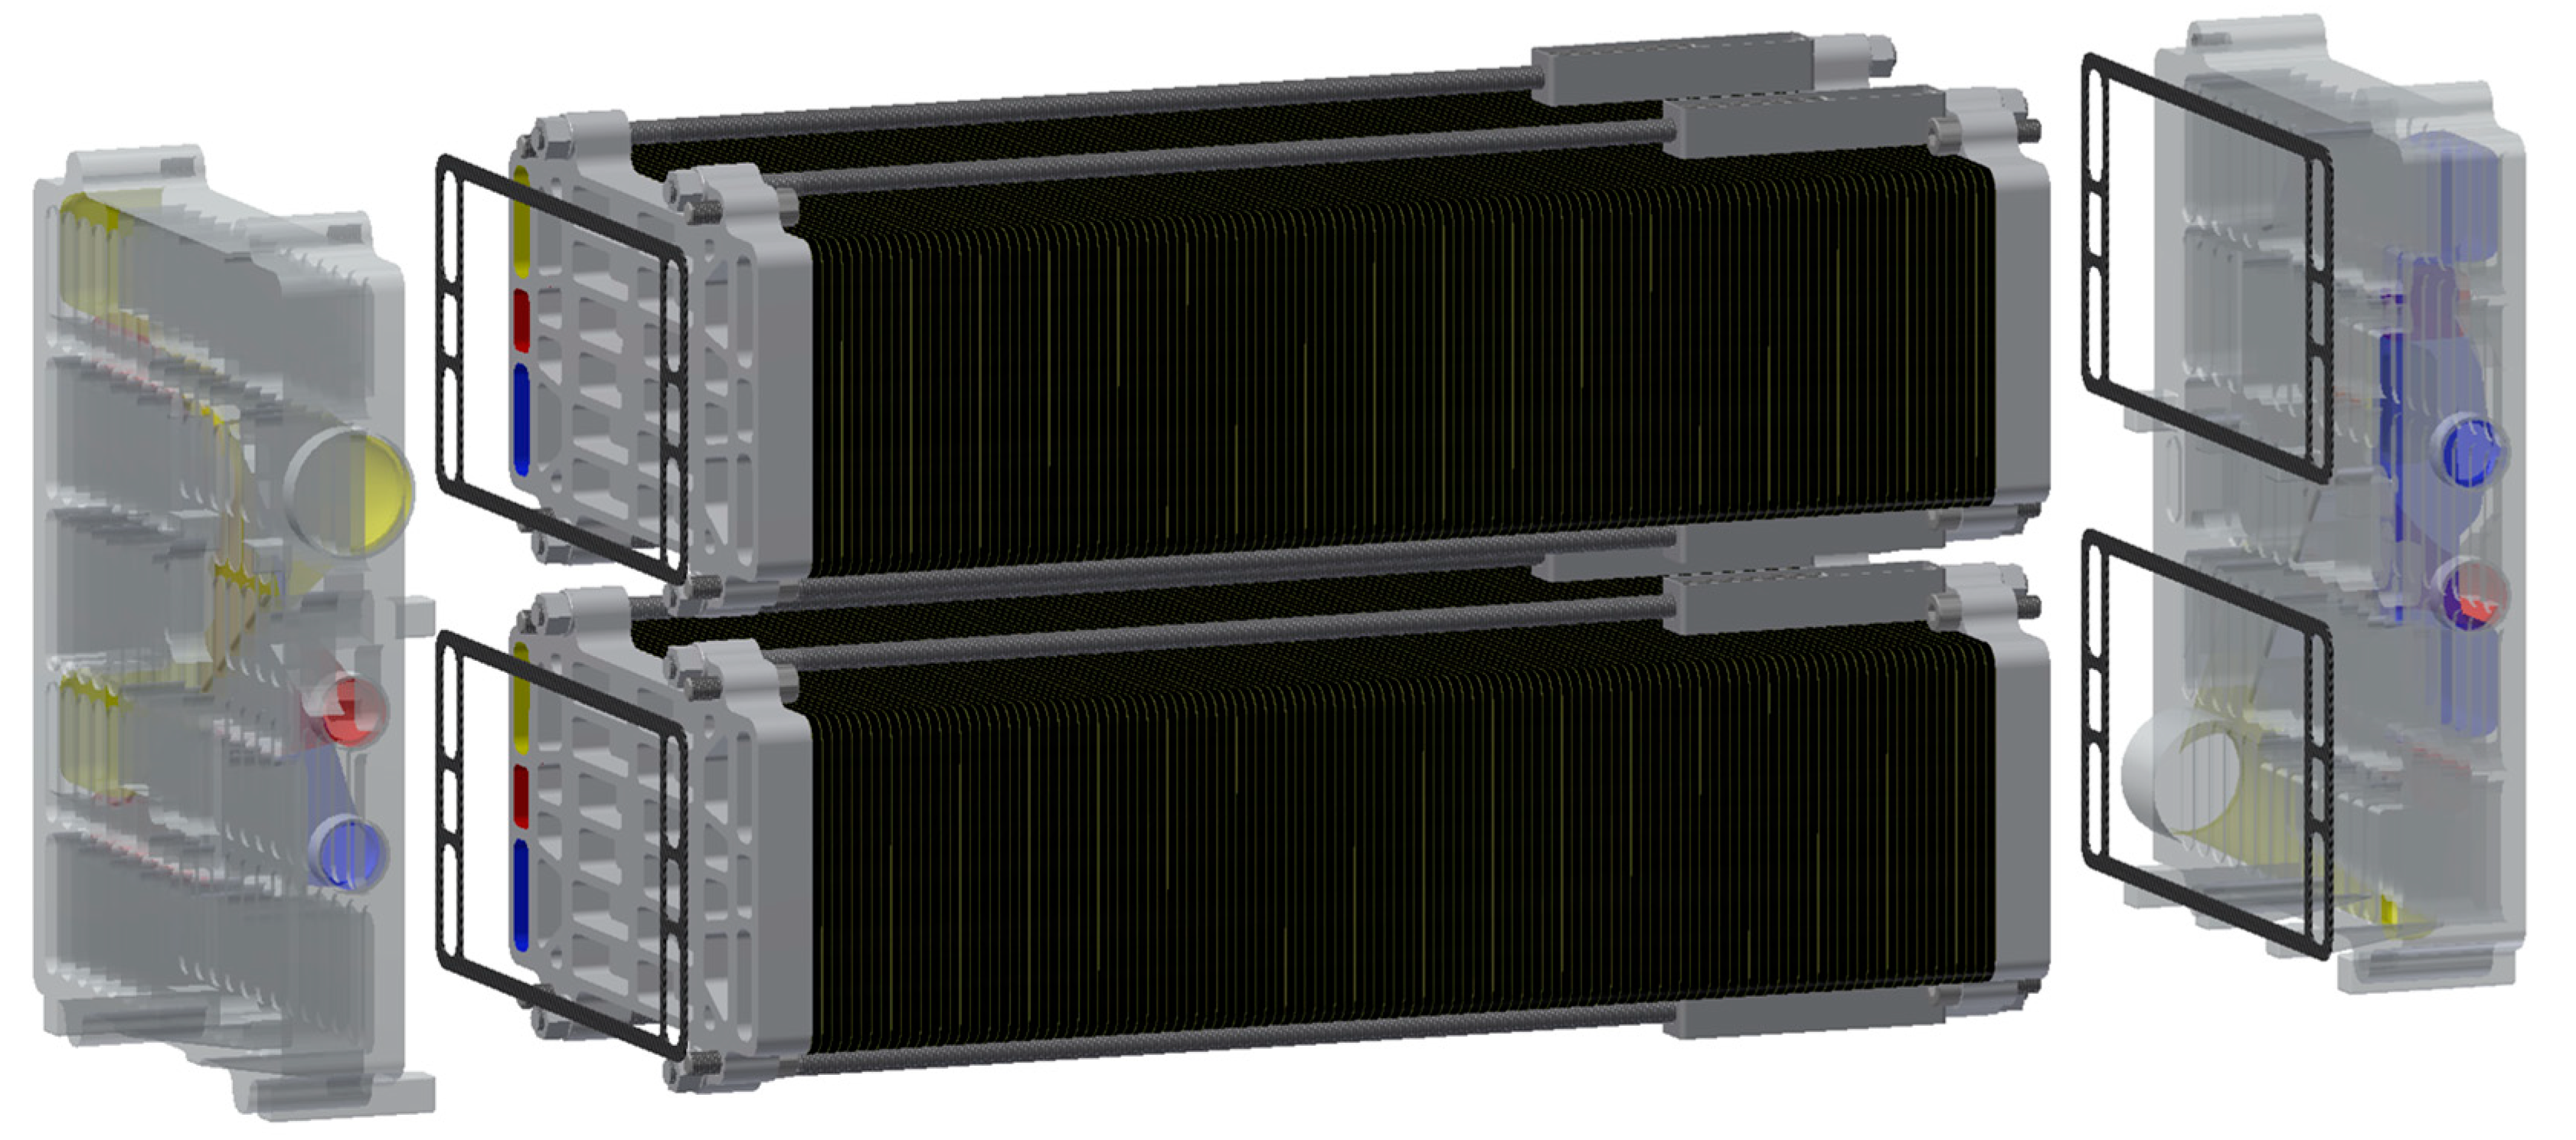
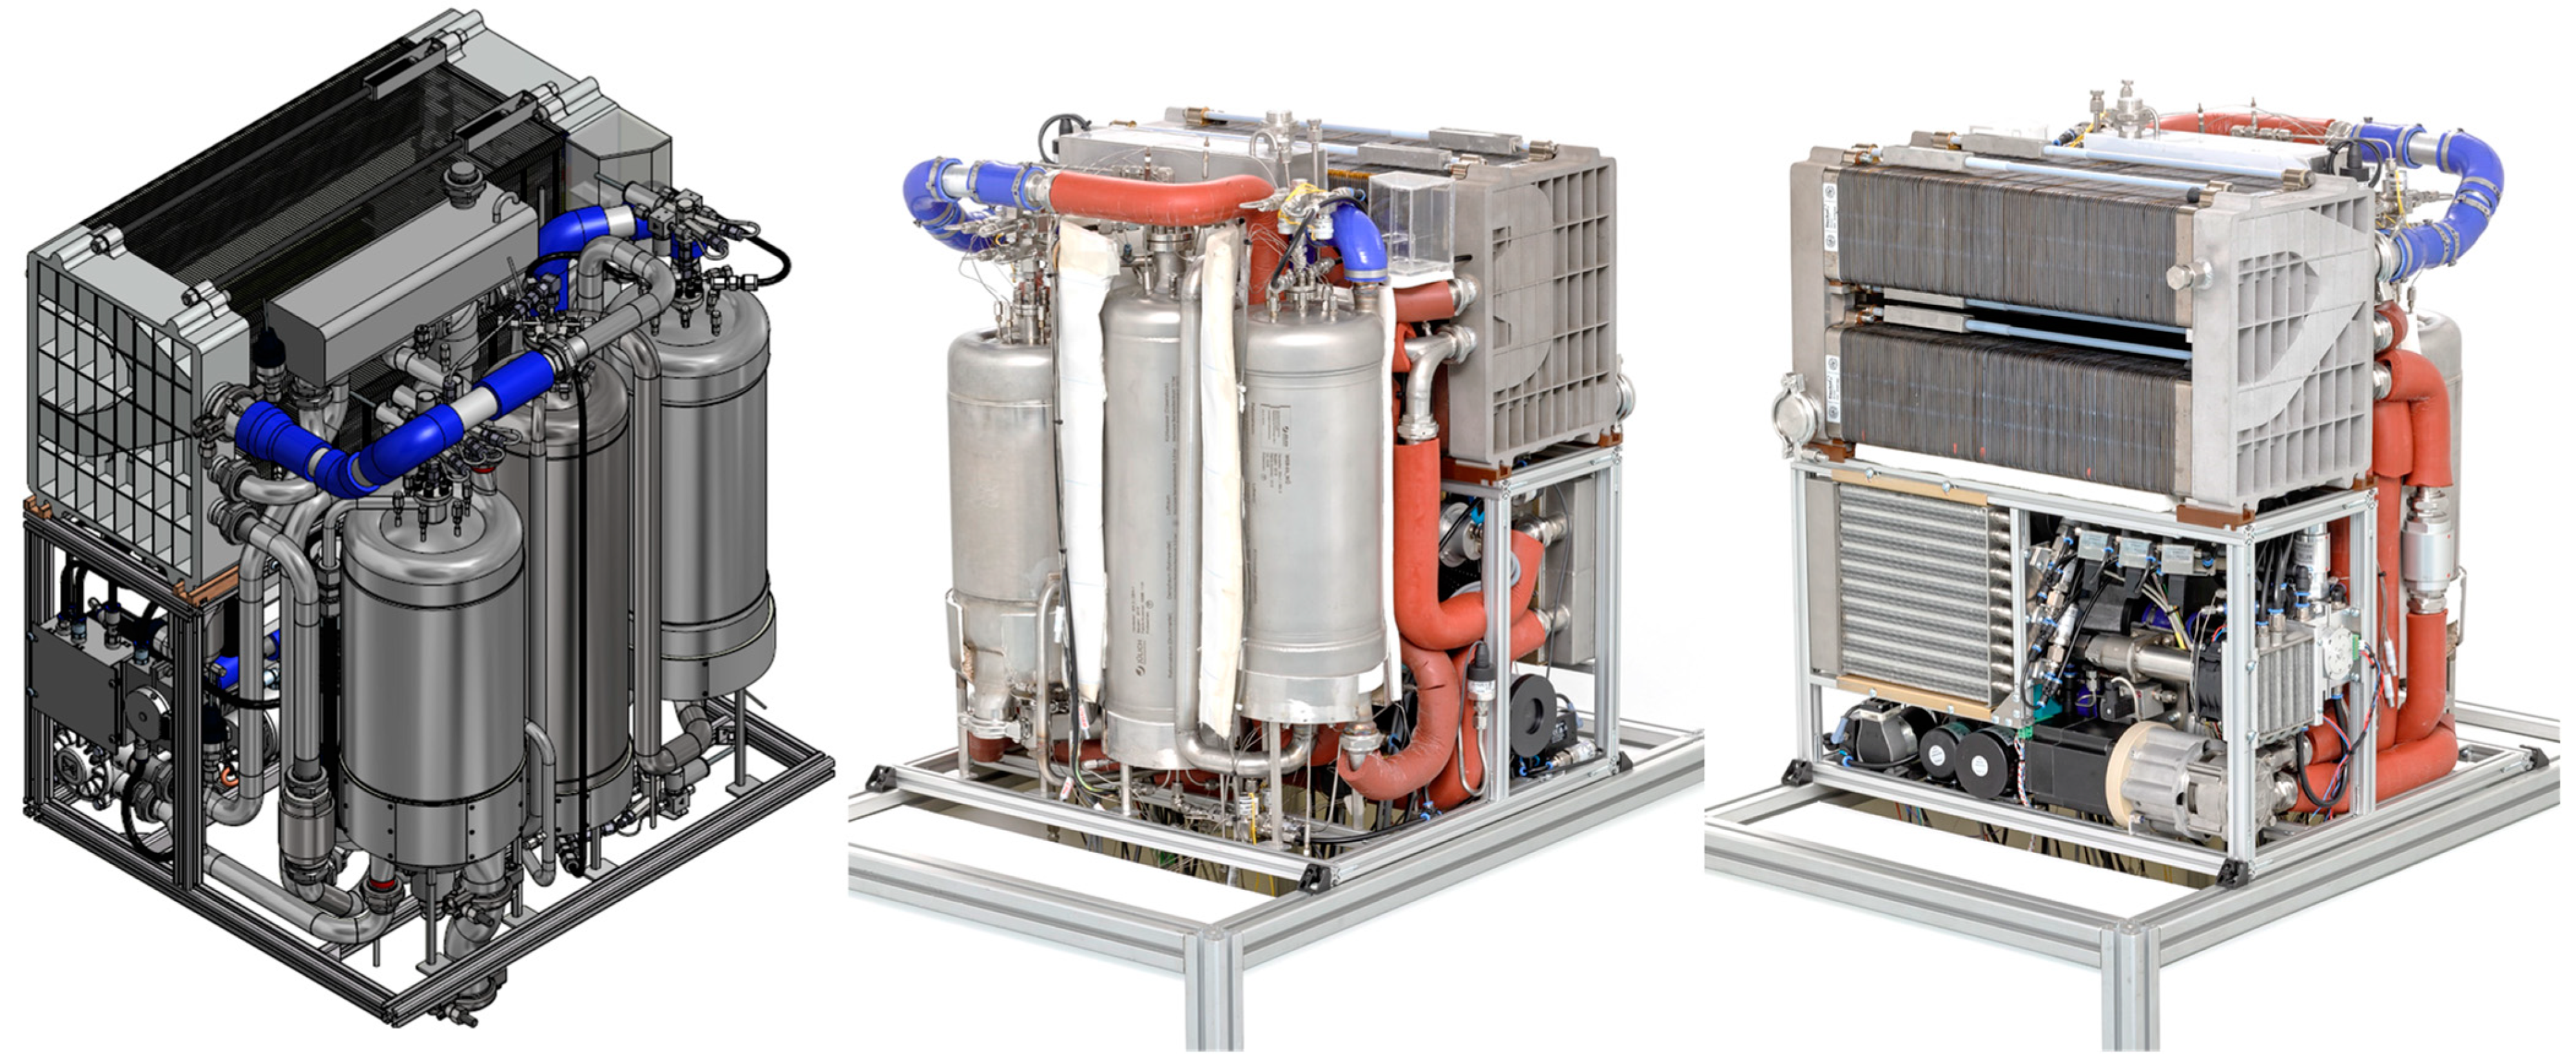
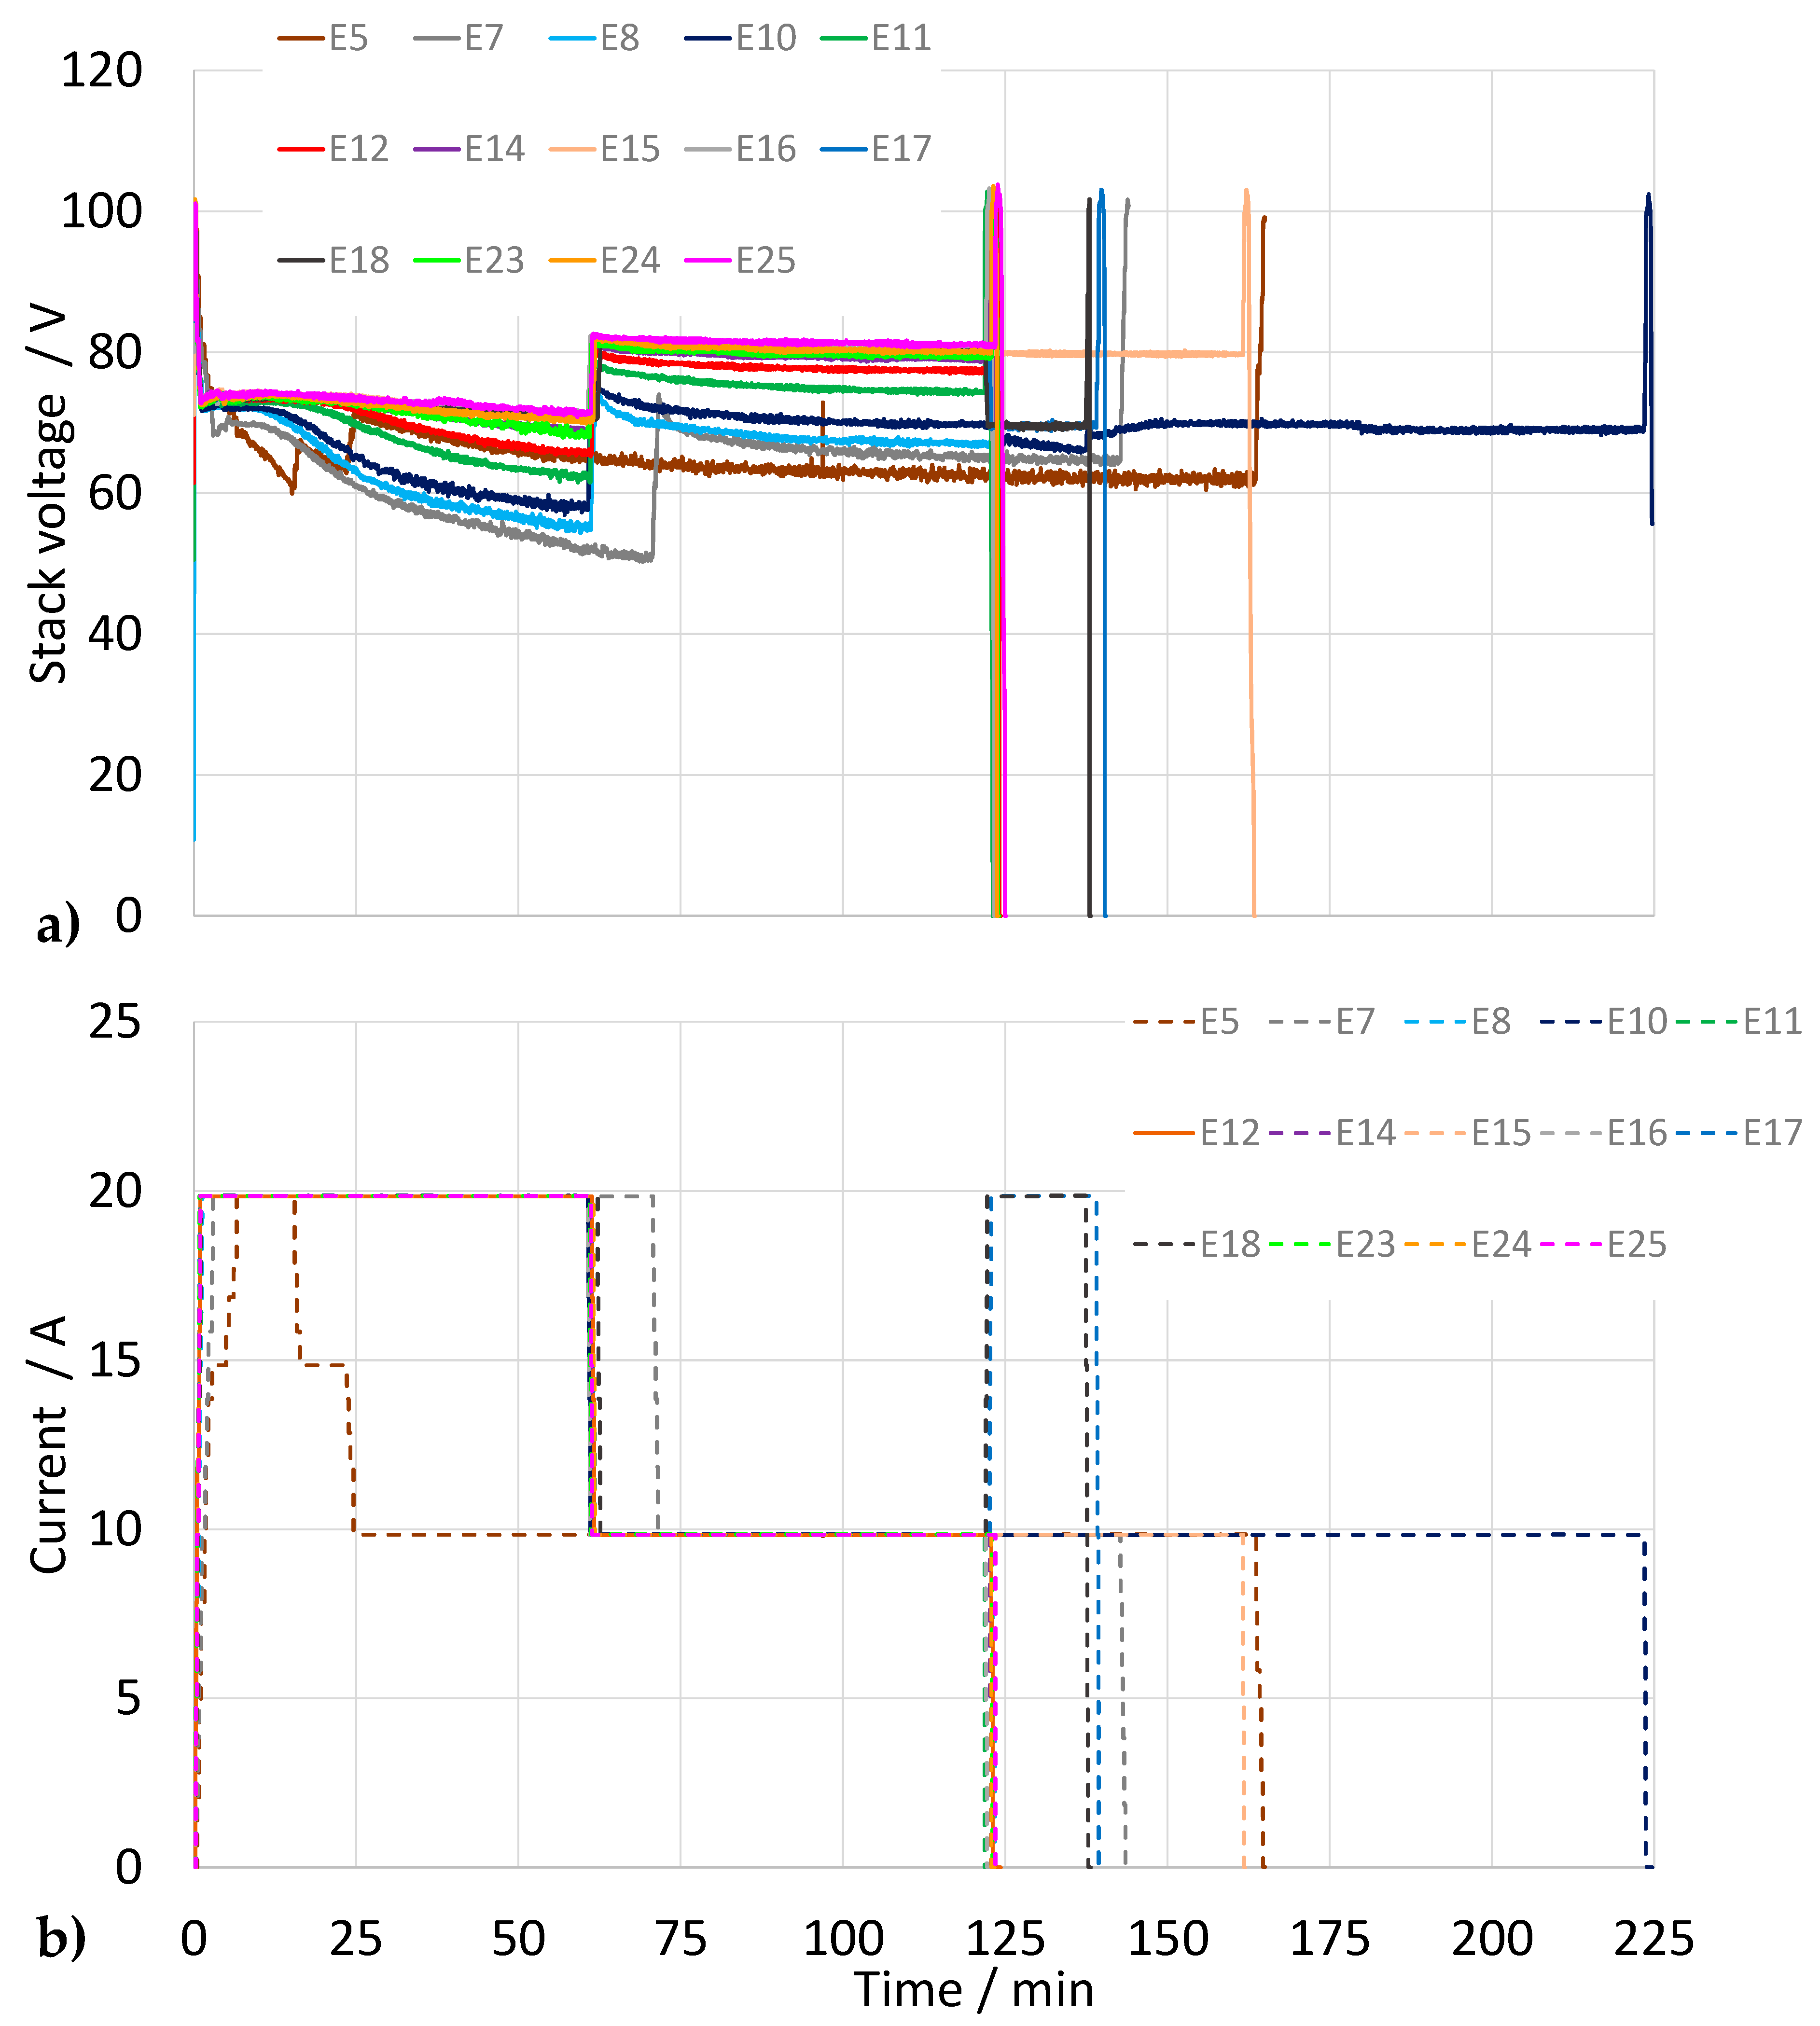
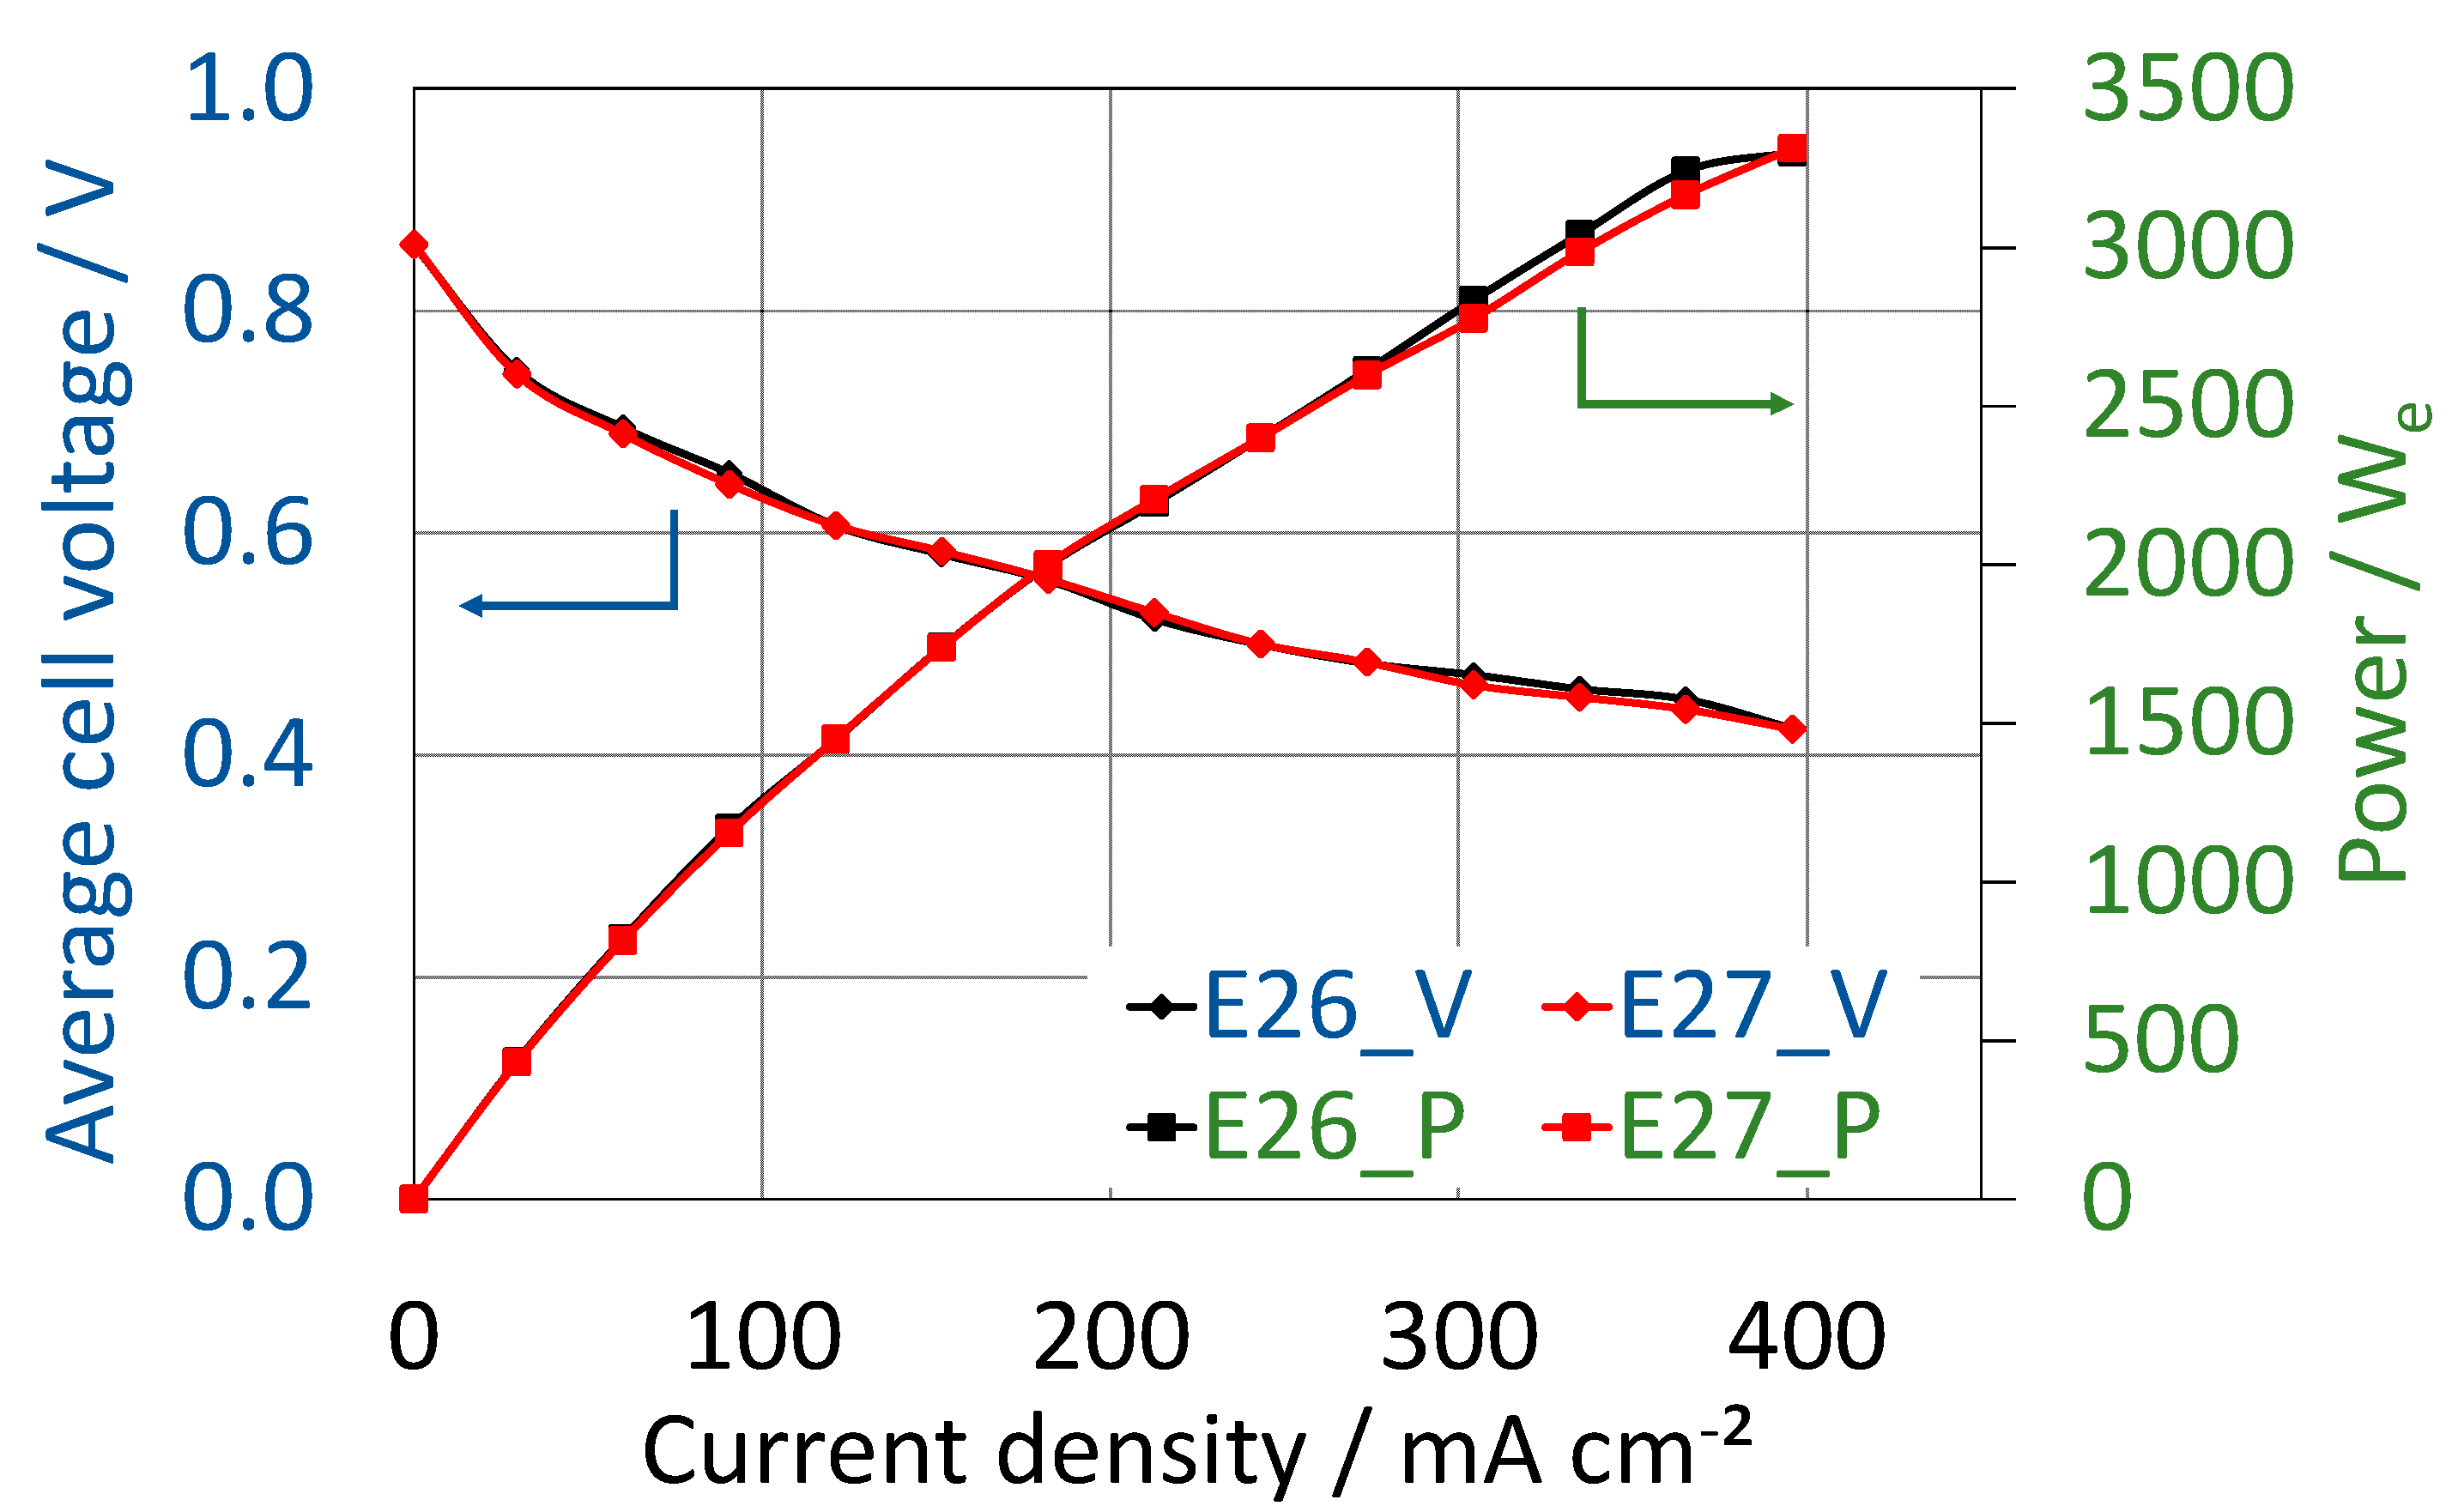
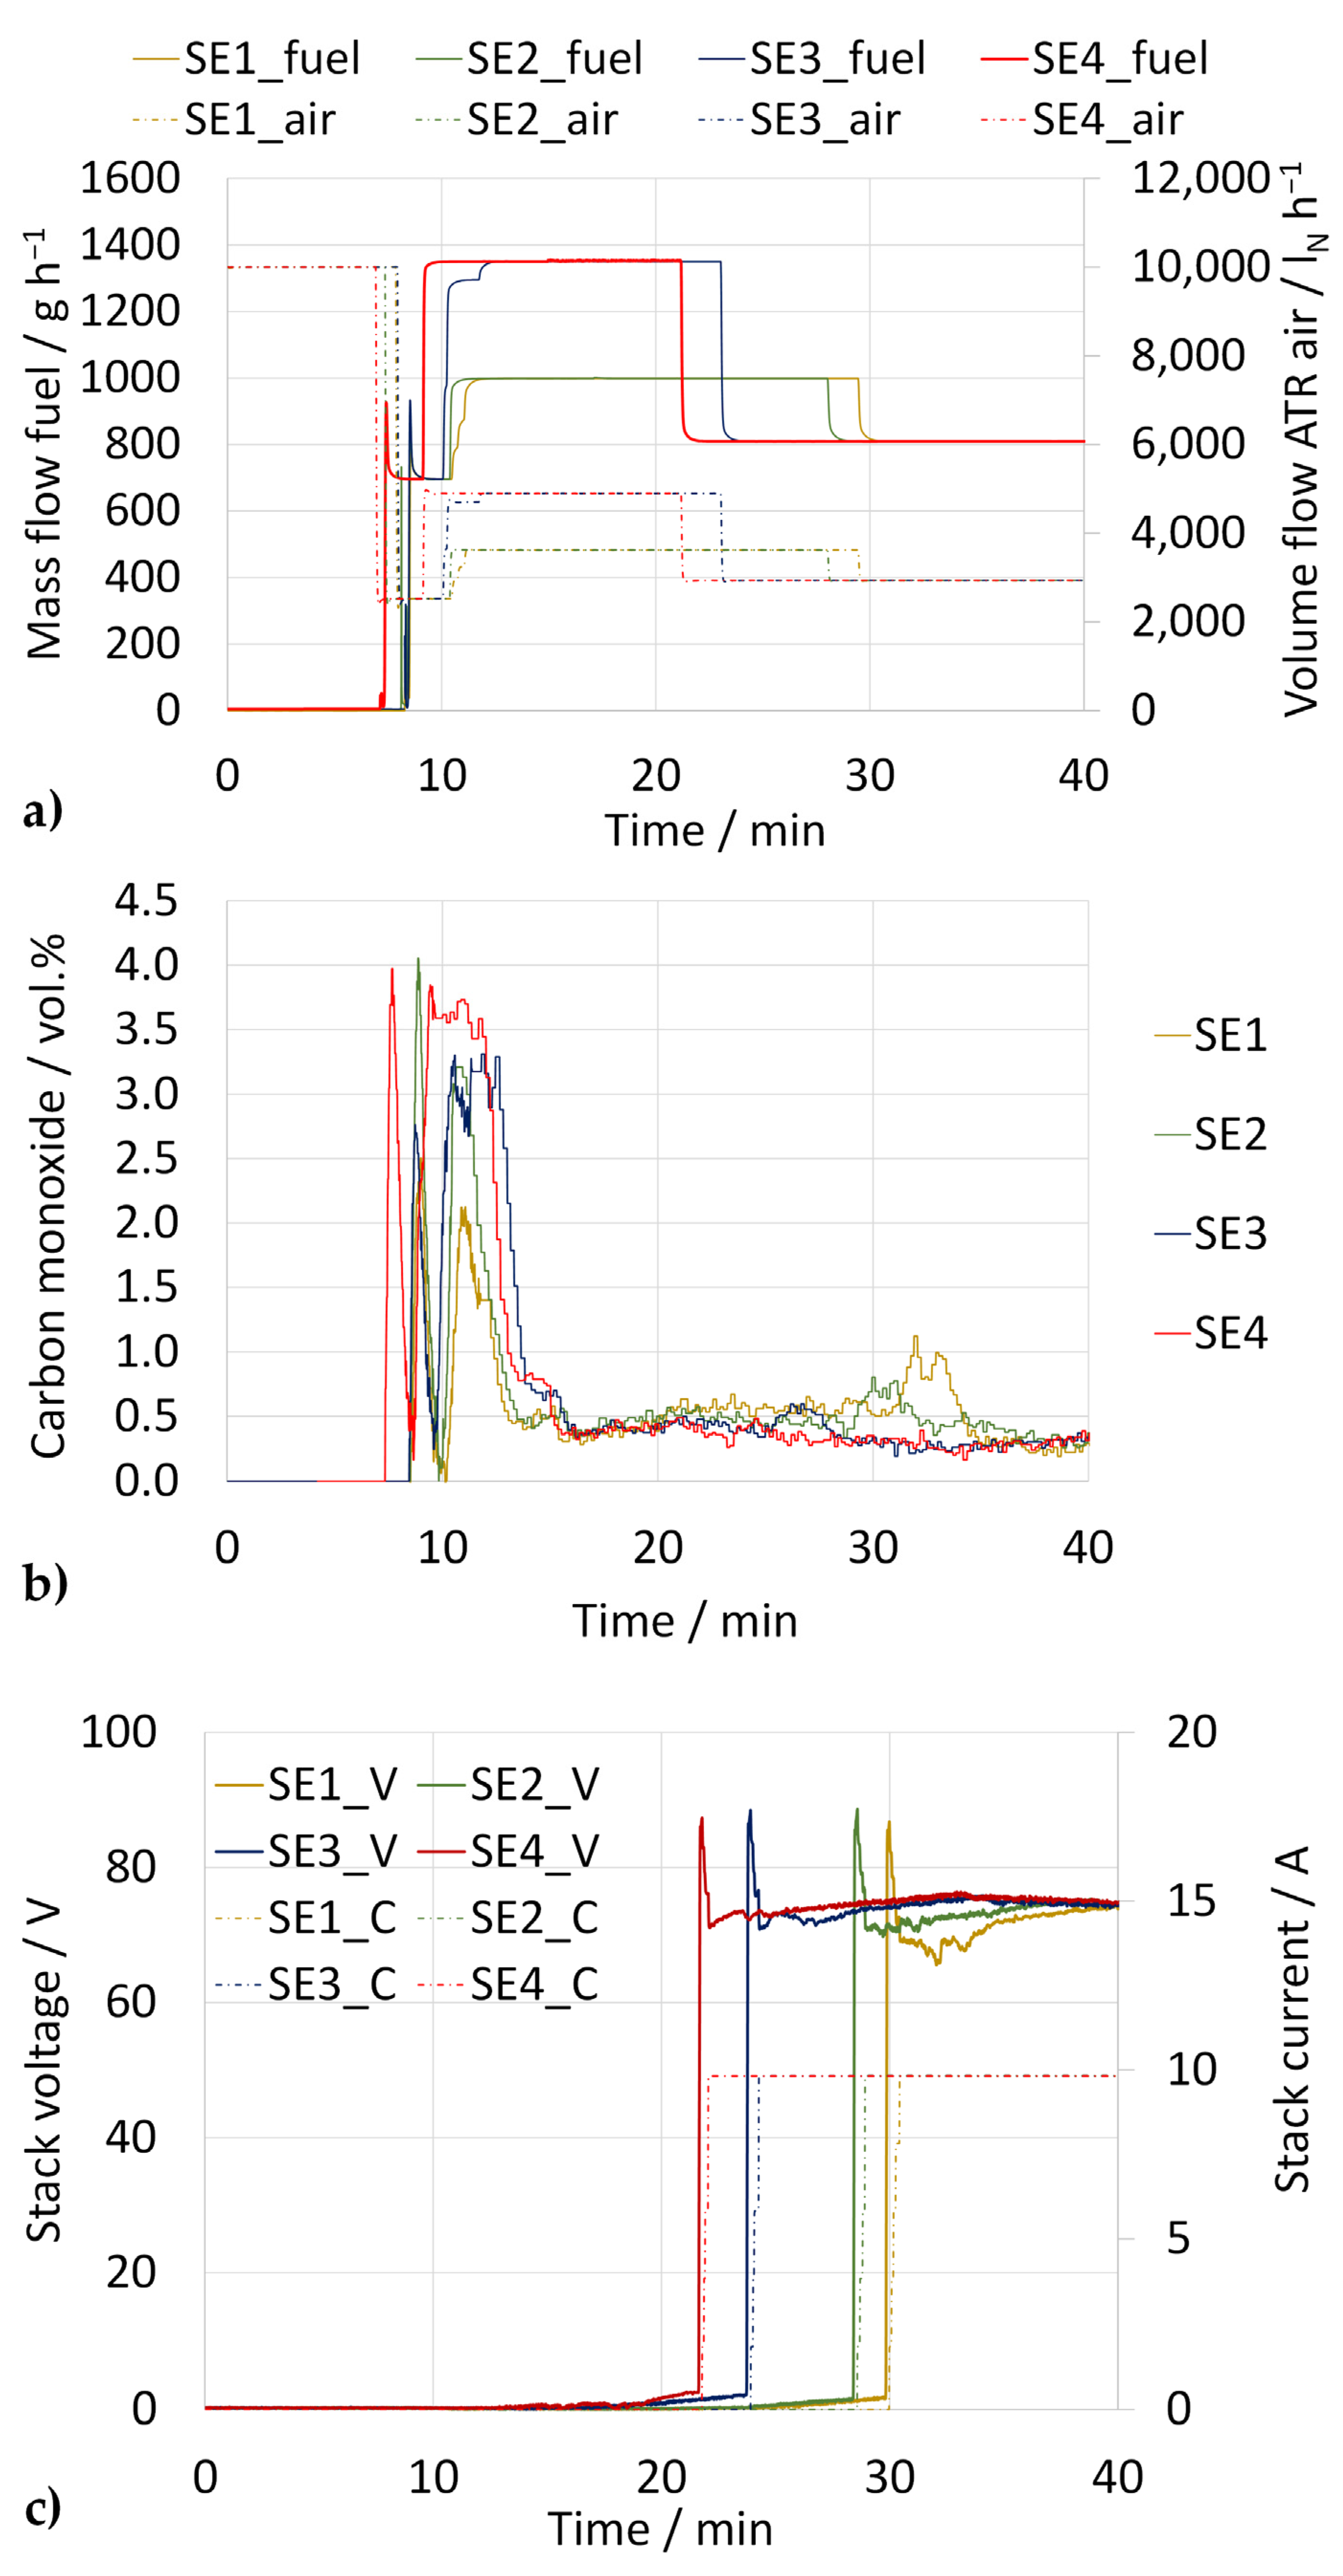
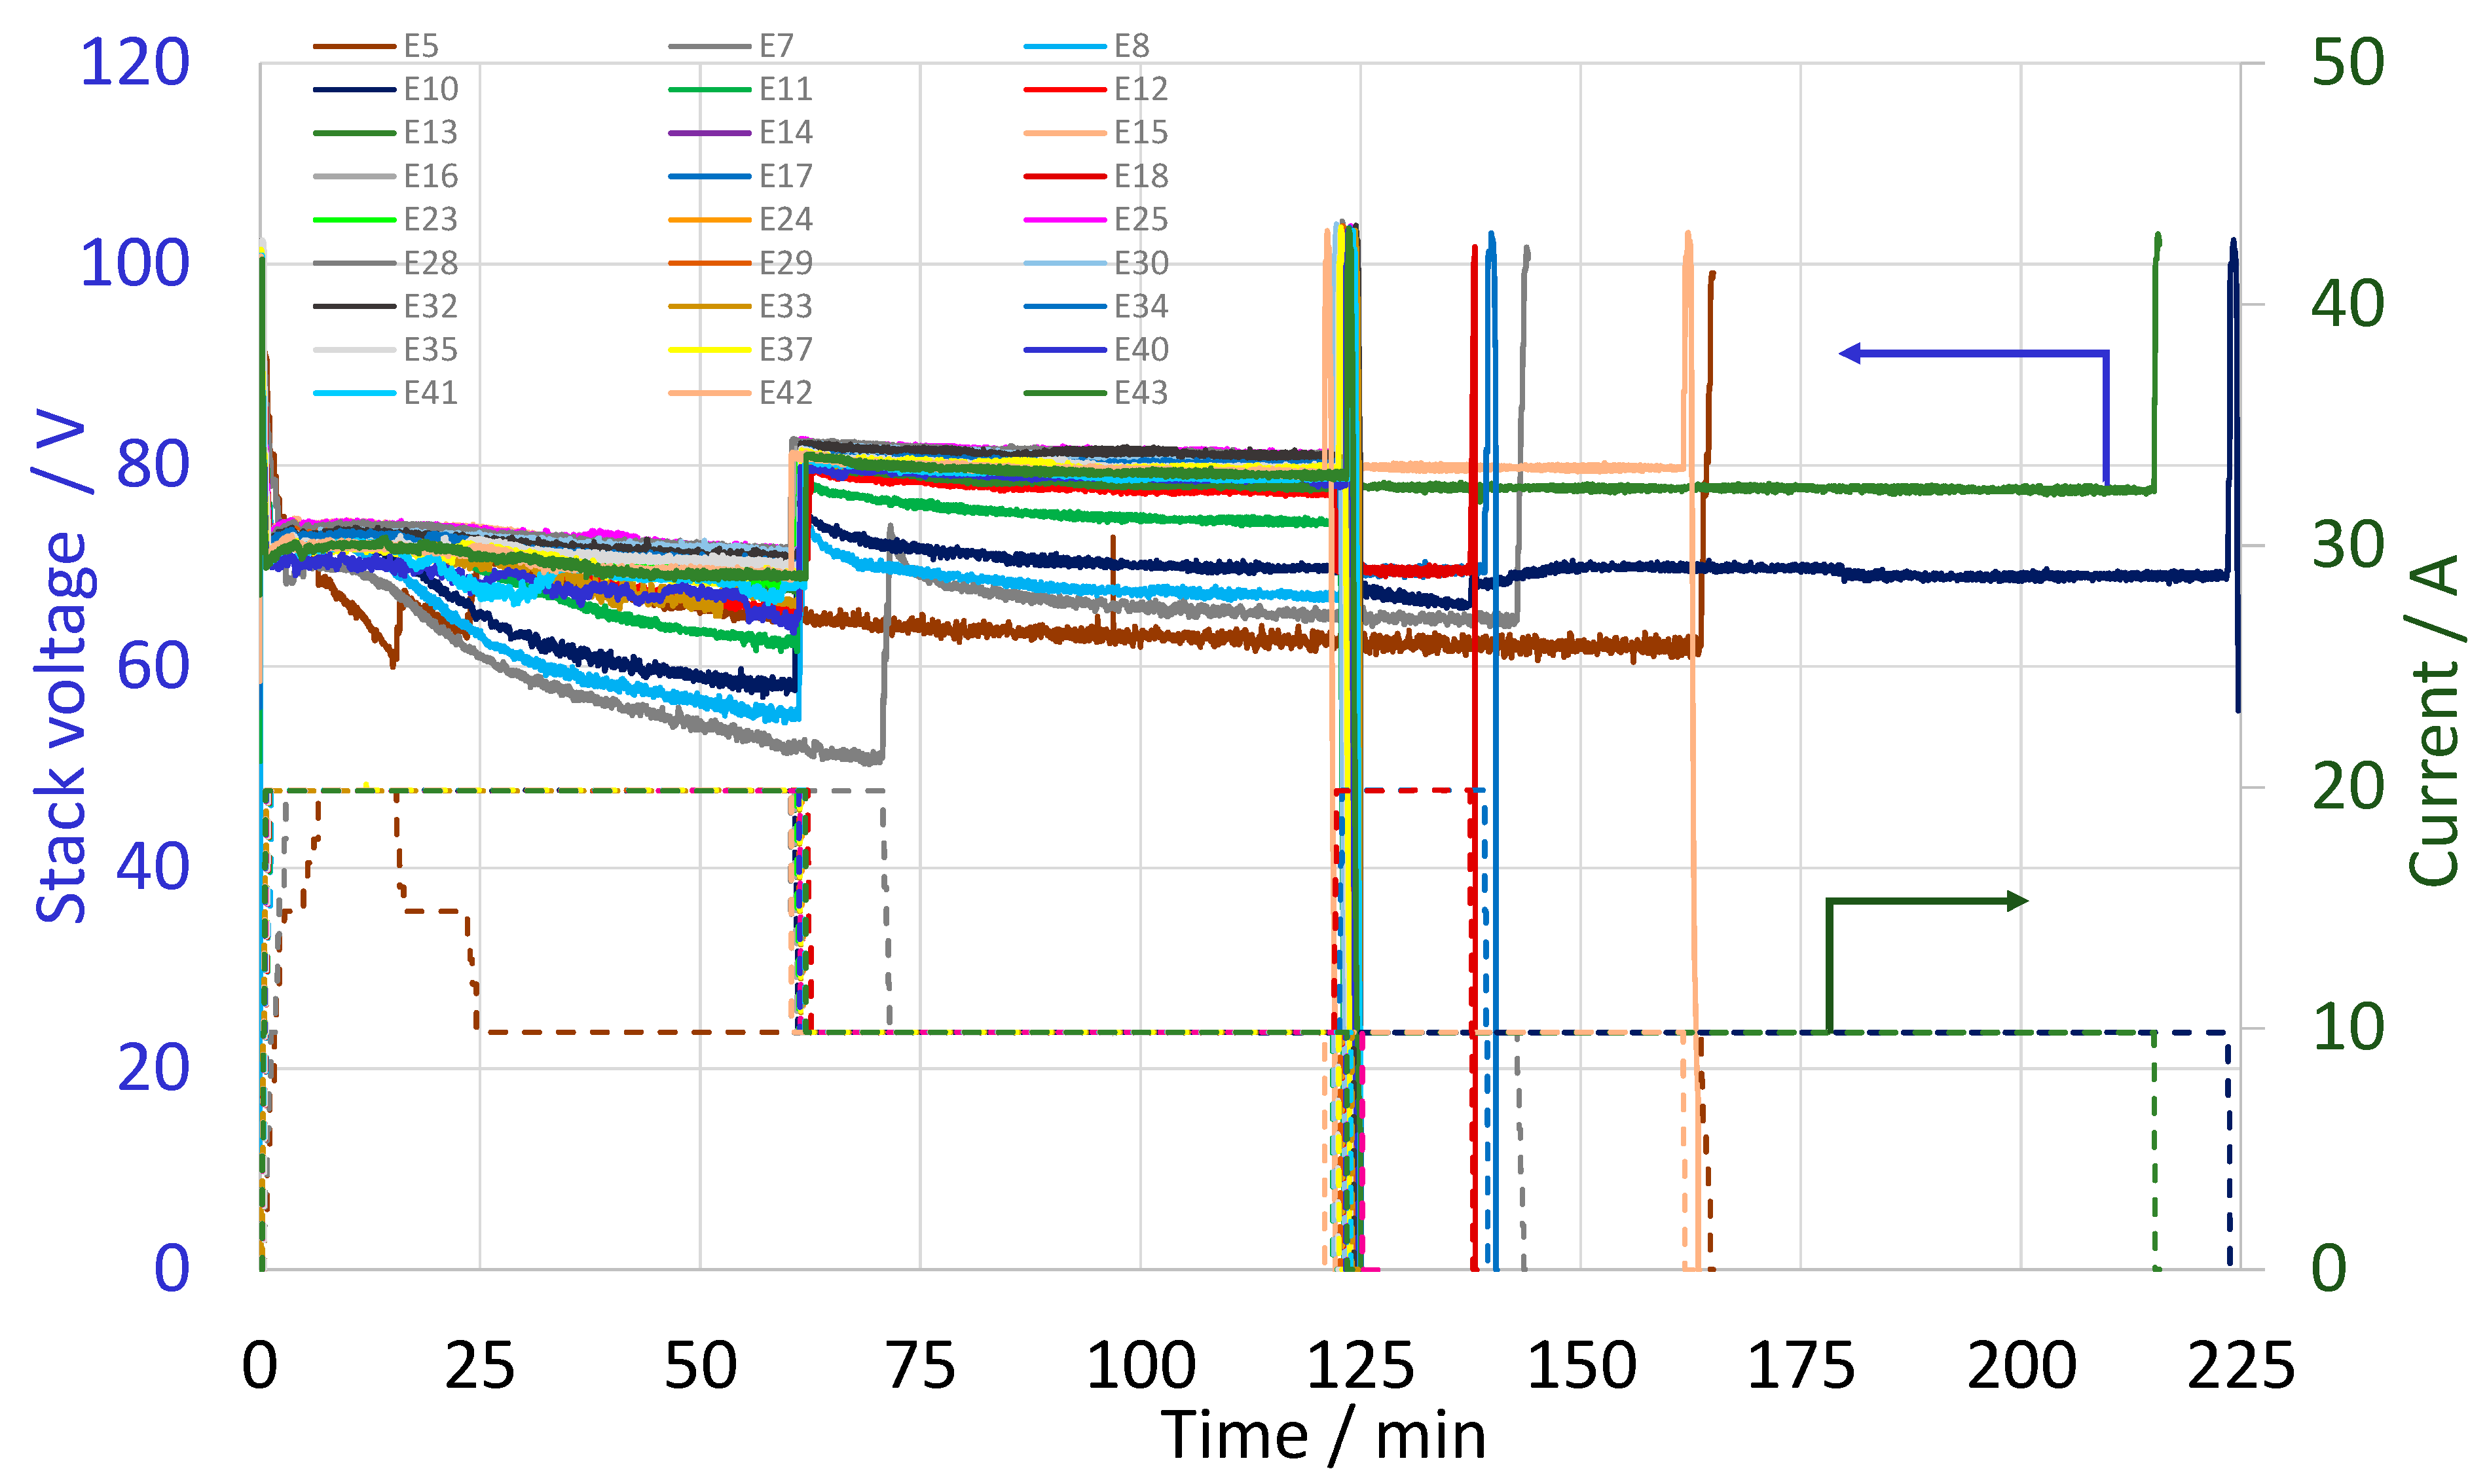
Table A1.
List of balance of plant (BoP) components used in the system.
| Component | Type | Explanation |
|---|---|---|
| Flow meter | ABB Sensyflow eco2 | 2x for CAB and stack air flows |
| Sensirion SFM3000-200-C | For ATR air | |
| Bio Tech VZS 003-ALU | For the fuel pump ATR | |
| Bio Tech VZS 003-VA | 3x for the water pumps in ATR, WGS, CAB | |
| FESTO SFAH-5U-Q6 | For air purging of the nozzles | |
| FESTO SFAH-50U.Q08 | For excess air discharge after the CAB turbo compressor | |
| Compressor | Celeroton CT-17-1000 | Turbo compressor for the cathode air |
| Celeroton CT-17-700 | Turbo compressor for the CAB air | |
| Celeroton CT-18-200 | Turbo compressor for the ATR air | |
| KNF NPK 03 KV DC-B4 | Swing piston compressor for air purging of the nozzles | |
| Pump | Hydro Leduc PB 32.5 (Faulhaber 3274 BP4) | Fixed displacement micropump for diesel with a brushless DC-servomotor |
| Speck AY-2251-MK-XX (Nanotec PB6) | Regenerative turbine pump for the heat exchange fluid for stack cooling/heating with a brushless DC-servomotor | |
| KNF NF 2.35 | 3x membrane pump for the CAB, ATR and WGS water | |
| KNF NF 1.100 | Membrane pump for nozzle cooling via water | |
| KNF NF 300 | Membrane pump for compressor cooling via water | |
| Glow plug | BERU GH 010 | For air pre-heating at the CAB inlet during start-up |
| Valve | bürkert 3280 | Two-way motor valve for air distribution between the ATR mixing chamber and steam paths |
| bürkert 6628 NC | Two-way rocker solenoid valve for excess air discharge after the CAB | |
| bürkert 2006 | 3/2-way seat valve for opening/closing the bypass path | |
| bürkert 2301 NC | Two-way globe control valve for heat exchange fluid in cooling mode (APU operation) | |
| bürkert 2301 NO | Two-way globe control valve for heat exchange fluid in heating mode (start-up phase) | |
| LEE CSFX 0512800 B | Non-return valves: 3x for water and 3x for air purging at water nozzle inlets for the ATR, CAB and WGS | |
| LEE CSFA 1876005 A | Non-return valves: 1x for fuel and 1x for air-purging at the fuel nozzle inlet for ATR | |
| Parker 099-0080-900 | Liquid solenoid valves for 3x water and 3x air purging at the water nozzle inlets for the ATR, CAB and WGS | |
| Parker 099-0340-900 | Liquid solenoid valves for 1x fuel and 1x air purging at ATR fuel nozzle inlet | |
| WITT NV150-ES | Non-return valve for the ATR air inlet at the CAB to avoid reformate backflow to the compressor | |
| WITT NV650 | Non-return valve to avoid reformate backflow at the anode outlet | |
| WITT NV650-ES | Non-return valve for the CAB air inlet to avoid reformate backflow to the compressor | |
| Filter | Freudenberg FC F-0824Q | 3x air filter before the turbo compressors for the ATR, CAB and cathode |
| Swagelok SS-2F-K4-7 | 4x filter elements for 1x the fuel inlet, 3x water inlets for the ATR, WGS and CAB | |
| Heat exchanger | Thermatron 76MSLSO-IECR | Heat exchanger for cooling of the nozzle and compressor |
| Thermatron 762MLP5A01 | Heat exchanger for the stack cooling loop | |
| Fan | ebm-papst 618JH | DC axial compact fan for the nozzle and compressor cooling |
| ebm-papst 63182 TDH4P | DC axial compact fan for the stack cooling loop | |
| Pressure transmitter | WIKA A-10 | Pressure measurement: 4x for the air (CAB glow plug, CAB, WGS, and cathode inlet), 1x for the reformate (WGS outlet), 2x for the heat exchange fluid (CAB and anode inlet) |
| WIKA M-10 | Pressure measurement: 1x for the air for nozzle purging, 1x for fuel at the nozzle inlet, 3x for water at the ATR, WGS and CAB nozzle inlets |
Appendix B
Figure A1.
Overview of the break-in experiments (E5–E43) for the HT-PEFC stack using reformate from NEXBTL diesel reforming: Stack voltage (left) and current (right) as a function of time on the stream; stack operation at 160 °C.
Figure A1.
Overview of the break-in experiments (E5–E43) for the HT-PEFC stack using reformate from NEXBTL diesel reforming: Stack voltage (left) and current (right) as a function of time on the stream; stack operation at 160 °C.

References
- Hydrogen Insights. A Perspective on Hydrogen Investment, Market Development and Cost Competitiveness; Hydrogen Council and McKinsey & Company: Brussels, Belgium, 2021.
- Emonts, B.; Blum, L.; Grube, T.; Lehnert, W.; Mergel, J.; Müller, M.; Peters, R. Technical Advancement of Fuel-Cell Research and Development. In Fuel Cell Science and Engineering; Wiley: Weinheim, Germany, 2012; pp. 1–42. [Google Scholar]
- Dicks, A.L.; Rand, D.A.J. The Complete System and Its Future. In Fuel Cell Systems Explained; Dicks, A.L., Rand, D.A.J., Eds.; Wiley: Hoboken, NJ, USA, 2018; pp. 351–399. [Google Scholar]
- Sørensen, B.; Spazzafumo, G. 7-Conclusion: A conditional outcome. In Hydrogen and Fuel Cells, 3rd ed.; Sørensen, B., Spazzafumo, G., Eds.; Academic Press: Cambridge, MA, USA, 2018; pp. 463–491. [Google Scholar]
- Modi, A.; Singh, S.; Verma, N. In situ nitrogen-doping of nickel nanoparticle-dispersed carbon nanofiber-based electrodes: Its positive effects on the performance of a microbial fuel cell. Electrochim. Acta 2016, 190, 620–627. [Google Scholar] [CrossRef]
- Pupkevich, V.; Karamanev, D. Scale-up of a novel bioelectrochemical technology for the conversion of hydrogen to electricity. Int. J. Hydrogen Energy 2018, 43, 19305–19314. [Google Scholar] [CrossRef]
- Samsun, R.C.; Prawitz, M.; Tschauder, A.; Meißner, J.; Pasel, J.; Peters, R. Reforming of diesel and jet fuel for fuel cells on a systems level: Steady-state and transient operation. Appl. Energy 2020, 279, 115882. [Google Scholar] [CrossRef]
- Bozdag, A.A.; Kaynar, A.D.; Dogu, T.; Sezgi, N.A. Development of ceria and tungsten promoted nickel/alumina catalysts for steam reforming of diesel. Chem. Eng. J. 2019, 377, 120274. [Google Scholar] [CrossRef]
- Zazhigalov, S.V.; Rogozhnikov, V.N.; Snytnikov, P.V.; Potemkin, D.I.; Simonov, P.A.; Shilov, V.A.; Ruban, N.V.; Kulikov, A.V.; Zagoruiko, A.N.; Sobyanin, V.A. Simulation of diesel autothermal reforming over Rh/Ce0.75Zr0.25O2-δ-η-Al2O3/FeCrAl wire mesh honeycomb catalytic module. Chem. Eng. Process.-Process Intensif. 2020, 150, 107876. [Google Scholar] [CrossRef]
- Zazhigalov, S.V.; Shilov, V.A.; Rogozhnikov, V.N.; Potemkin, D.I.; Sobyanin, V.A.; Zagoruiko, A.N.; Snytnikov, P.V. Modeling of hydrogen production by diesel reforming over Rh/Ce0.75Zr0.25O2-δ-ƞ-Al2O3/FeCrAl wire mesh honeycomb catalytic module. Catal. Today 2020, 378, 240–248. [Google Scholar] [CrossRef]
- Shilov, V.A.; Rogozhnikov, V.N.; Zazhigalov, S.V.; Potemkin, D.I.; Belyaev, V.D.; Shashkov, M.V.; Zagoruiko, A.N.; Sobyanin, V.A.; Snytnikov, P.V. Operation of Rh/Ce0.75Zr0.25O2-δ-ƞ-Al2O3/FeCrAl wire mesh honeycomb catalytic modules in diesel steam and autothermal reforming. Int. J. Hydrogen Energy 2021, in press. [Google Scholar] [CrossRef]
- Kim, D.; Choi, S.; Jeong, S.; Bae, M.; Katikaneni, S.P.; Bae, J.; Heo, S.; Lee, J.H. Kinetic modeling of diesel autothermal reforming for fuel cell auxiliary power units. Chem. Eng. J. 2021, 424, 130564. [Google Scholar] [CrossRef]
- Maximini, M.; Engelhardt, P.; Brenner, M.; Beckmann, F.; Moritz, O. Fast start-up of a diesel fuel processor for PEM fuel cells. Int. J. Hydrogen Energy 2014, 39, 18154–18163. [Google Scholar] [CrossRef]
- Han, G.; Bae, M.; Cho, S.; Bae, J. Start-up strategy of a diesel reformer using the decomposition heat of hydrogen peroxide for subsea applications. J. Power Sources 2020, 448, 227465. [Google Scholar] [CrossRef]
- Bae, M.; Cheon, H.; Oh, J.; Kim, D.; Bae, J.; Katikaneni, S.P. Rapid start-up strategy of 1 kWe diesel reformer by solid oxide fuel cell integration. Int. J. Hydrogen Energy 2021, 46, 26575–26581. [Google Scholar] [CrossRef]
- Engelhardt, P.; Maximini, M.; Beckmann, F.; Brenner, M.; Moritz, O. Coupled operation of a diesel steam reformer and an LT- and HT-PEFC. Int. J. Hydrogen Energy 2014, 39, 18146–18153. [Google Scholar] [CrossRef]
- Ekdunge, P.; Toftefors, I.; Kylhammar, L.; Nordström, J. Powercells fuel processing development and its application in APU system with a PEM fuel cell. In Proceedings of the AIChE 2013 Annual Meeting, San Francisco, CA, USA, 3–8 November 2013. [Google Scholar]
- Pregelj, B.; Debenjak, A.; Dolanc, G.; Petrovcic, J. A diesel-powered fuel cell APU—Reliability issues and mitigation approaches. IEEE Trans. Ind. Electron. 2017, 64, 6660–6670. [Google Scholar] [CrossRef]
- Rautanen, M.; Halinen, M.; Noponen, M.; Koskela, K.; Vesala, H.; Kiviaho, J. Experimental Study of an SOFC Stack Operated With Autothermally Reformed Diesel Fuel. Fuel Cells 2013, 13, 304–308. [Google Scholar] [CrossRef]
- Jeong, J.; Baek, S.W.; Bae, J. A diesel-driven, metal-based solid oxide fuel cell. J. Power Sources 2014, 250, 98–104. [Google Scholar] [CrossRef]
- Rechberger, J.; Kaupert, A.; Hagerskans, J.; Blum, L. Demonstration of the First European SOFC APU on a Heavy Duty Truck. Transp. Res. Procedia 2016, 14, 3676–3685. [Google Scholar] [CrossRef] [Green Version]
- Spendelow, J.S.; Papageorgopoulos, D.C. Application Requirements/Targets for Fuel Cell APUs. In Fuel Cells: Data, Facts and Figures; Stolten, D., Samsun, R.C., Garland, N., Eds.; Wiley-VCH: Weinheim, Germany, 2016; pp. 197–201. [Google Scholar]
- DOE Technical Targets for Fuel Cell Systems for Portable Power and Auxiliary Power Applications. Available online: https://www.energy.gov/eere/fuelcells/doe-technical-targets-fuel-cell-systems-portable-power-and-auxiliary-power (accessed on 18 June 2021).
- Rantanen, L.; Linnaila, R.; Aakko, P.; Harju, T. NExBTL—Biodiesel Fuel of the Second Generation; SAE Technical Papers: Warrendale, PA, USA, 2005. [Google Scholar]
- Schmidt, T.J. High-Temperature Polymer Electrolyte Fuel Cells: Durability Insights. In Polymer Electrolyte Fuel Cell Durability; Büchi, F.N., Inaba, M., Schmidt, T.J., Eds.; Springer: New York, NY, USA, 2009; pp. 199–221. [Google Scholar]
- Lehnert, W.; Lüke, L.; Samsun, R.C. High Temperature Polymer Electrolyte Fuel Cells. In Fuel Cells: Data, Facts and Figures; Stolten, D., Samsun, R.C., Garland, N., Eds.; Wiley-VCH: Weinheim, Germany, 2016; pp. 235–247. [Google Scholar]
- Araya, S.S.; Zhou, F.; Liso, V.; Sahlin, S.L.; Vang, J.R.; Thomas, S.; Gao, X.; Jeppesen, C.; Kær, S.K. A comprehensive review of PBI-based high temperature PEM fuel cells. Int. J. Hydrogen Energy 2016, 41, 21310–21344. [Google Scholar] [CrossRef]
- Moser, H.; Perchthaler, M.; Hacker, V.; Siebenhofer, M. Experimental Study of CO and Temperature Impact on High Temperature Proton Exchange Membrane Fuel Cell (HT-PEM FC) Performance and Current Distribution; AIChE: New York, NY, USA, 2009. [Google Scholar]
- Araya, S.S.; Andreasen, S.J.; Kær, S.K. Experimental Characterization of the Poisoning Effects of Methanol-Based Reformate Impurities on a PBI-Based High Temperature PEM Fuel Cell. Energies 2012, 5, 4251–4267. [Google Scholar] [CrossRef]
- Araya, S.S.; Kær, S.K.; Andreasen, S.J. Vapor delivery systems for the study of the effects of reformate gas impurities in HT-PEM fuel cells. J. Fuel Cell Sci. Technol. 2012, 9, 111–119. [Google Scholar] [CrossRef]
- Hjuler, H.A.; Steenberg, T.; Terkelsen, C.; Holst, T.; Garcia, H.R.; Cooper, K. Performance of the HT-PEM membrane electrode assembly. ECS Trans. 2012, 50, 1127–1135. [Google Scholar] [CrossRef]
- Kerr, R.; García, H.R.; Romero, M.T.; Terkelsen, C.; Hjuler, H.A.; Steenberg, T. Performance of the high temperature PEM membrane electrode assembly. ECS Trans. 2014, 64, 973–982. [Google Scholar] [CrossRef]
- Sun, H.; Zhang, F.; Wang, R.; Liu, Y. Effects of CO2 content in fuel on performance of the HT-PEM fuel cell. J. Shenyang Jianzhu Univ. 2015, 31, 898–905. [Google Scholar] [CrossRef]
- Pinar, J.F.; Rastedt, M.; Pilinski, N.; Wagner, P. Characterization of HT-PEM membrane-electrode-assemblies. In High Temperature Polymer Electrolyte Membrane Fuel Cells: Approaches, Status, and Perspectives; Springer International Publishing: Heidelberg, Germany, 2016; pp. 353–386. [Google Scholar]
- Rastedt, M.; Pinar, F.J.; Pilinski, N.; Dyck, A.; Wagner, P. Effect of Operation Strategies on Phosphoric Acid Loss in HT-PEM Fuel Cells. ECS Trans. 2016, 75, 455–469. [Google Scholar] [CrossRef]
- Waller, M.G.; Walluk, M.R.; Trabold, T.A. Performance of high temperature PEM fuel cell materials. Part 1: Effects of temperature, pressure and anode dilution. Int. J. Hydrogen Energy 2016, 41, 2944–2954. [Google Scholar] [CrossRef] [Green Version]
- Myles, T.; Bonville, L.; Maric, R. Catalyst, membrane, free electrolyte challenges, and pathways to resolutions in high temperature polymer electrolyte membrane fuel cells. Catalysts 2017, 7, 16. [Google Scholar] [CrossRef] [Green Version]
- Mamaghani, A.H.; Najafi, B.; Casalegno, A.; Rinaldi, F. Optimization of an HT-PEM fuel cell based residential micro combined heat and power system: A multi-objective approach. J. Clean. Prod. 2018, 180, 126–138. [Google Scholar] [CrossRef]
- Arsalis, A.; Nielsen, M.P.; Kær, S.K. Modeling and optimization of a 1 kWe HT-PEMFC-based micro-CHP residential system. Int. J. Hydrogen Energy 2012, 37, 2470–2481. [Google Scholar] [CrossRef]
- Arsalis, A.; Nielsen, M.P.; Kær, S.K. Modeling and parametric study of a 1 kWe HT-PEMFC-based residential micro-CHP system. Int. J. Hydrogen Energy 2011, 36, 5010–5020. [Google Scholar] [CrossRef]
- Najafi, B.; Haghighat Mamaghani, A.; Rinaldi, F.; Casalegno, A. Long-term performance analysis of an HT-PEM fuel cell based micro-CHP system: Operational strategies. Appl. Energy 2015, 147, 582–592. [Google Scholar] [CrossRef]
- Taccani, R.; Schnitzhofer, W.; Scagliotti, M.; Valli, C. Experimental Performance Analysis of a HT PEM Fuel Cell System Fed with Biogas. In Proceedings of the 4th European Fuel Cell Piero Lunghi Conference and Exhibition EFC 2011, Rome, Italy, 14–16 December 2011; Barchiesi, C., Chianella, M., Lunghi, P., Ubertini, S., Cigolotti, V., Eds.; ENEA: Rome, Italy, 2011; pp. 185–186. [Google Scholar]
- Nalluraya, N.K.; Köhne, H.; Köhne, S.; Konrad, M. Feasibility study of auto thermal reforming of biogas for HT PEM fuel cell applications. Notes Numer. Fluid Mech. Multidiscip. Des. 2015, 129, 117–133. [Google Scholar] [CrossRef]
- Wichmann, D.; Engelhardt, P.; Wruck, R.; Lucka, K.; Könne, H. Development of a highly integrated micro fuel processor based on methanol steam reforming for a HT-PEM fuel cell with an electric power output of 30 W. ECS Trans. 2010, 26, 505–515. [Google Scholar] [CrossRef]
- Lee, H.; Jung, I.; Roh, G.; Na, Y.; Kang, H. Comparative analysis of on-board methane and methanol reforming systems combined with HT-PEM fuel cell and CO2 capture/liquefaction system for hydrogen fueled ship application. Energies 2020, 13, 224. [Google Scholar] [CrossRef] [Green Version]
- Kolb, D.-I.G.; Schelhaas, K.-P.; Wichert, M.; Burfeind, J.; Heßke, C.; Bandlamudi, G. Entwicklung eines mikrostrukturierten Methanolreformers gekoppelt mit einer Hochtemperatur-PEM Brennstoffzelle. Chem. Ing. Tech. 2009, 81, 619–628. [Google Scholar] [CrossRef]
- Sahlin, S.L.; Andreasen, S.J.; Kær, S.K. System model development for a methanol reformed 5 kW high temperature PEM fuel cell system. Int. J. Hydrogen Energy 2015, 40, 13080–13089. [Google Scholar] [CrossRef]
- Samsun, R.C.; Prawitz, M.; Tschauder, A.; Pasel, J.; Peters, R.; Stolten, D. An autothermal reforming system for diesel and jet fuel with quick start-up capability. Int. J. Hydrogen Energy 2019, 44, 27749–27764. [Google Scholar] [CrossRef]
- Peters, R.; Pasel, J.; Samsun, R.C.; Scharf, F.; Tschauder, A.; Stolten, D. Heat exchanger design for autothermal reforming of diesel. Int. J. Hydrogen Energy 2018, 43, 11830–11846. [Google Scholar] [CrossRef]
- Pasel, J.; Samsun, R.C.; Tschauder, A.; Peters, R.; Stolten, D. Advances in autothermal reformer design. Appl. Energy 2017, 198, 88–98. [Google Scholar] [CrossRef]
- Samsun, R.C.; Pasel, J.; Janßen, H.; Lehnert, W.; Peters, R.; Stolten, D. Design and test of a 5 kWe high-temperature polymer electrolyte fuel cell system operated with diesel and kerosene. Appl. Energy 2014, 114, 238–249. [Google Scholar] [CrossRef]
- Meißner, J.; Weiske, S.; Faidel, D.; Tschauder, A.; Samsun, R.C.; Pasel, J.; Peters, R.; Stolten, D. Highly integrated catalytic burner with laser-additive manufactured manifolds. React. Chem. Eng. 2017, 2, 437–445. [Google Scholar] [CrossRef]
- Samsun, R.C.; Prawitz, M.; Tschauder, A.; Pasel, J.; Pfeifer, P.; Peters, R.; Stolten, D. An integrated diesel fuel processing system with thermal start-up for fuel cells. Appl. Energy 2018, 226, 145–159. [Google Scholar] [CrossRef]
- Liquid Cooled HTPEM Stack S165L, Datasheet v1.0-0313; Serenergy A/S: Aalborg, Denmark, 2015.
- Samsun, R.C.; Pasel, J.; Peters, R.; Stolten, D. Fuel cell systems with reforming of petroleum-based and synthetic-based diesel and kerosene fuels for APU applications. Int. J. Hydrogen Energy 2015, 40, 6405–6421. [Google Scholar] [CrossRef]
- Turbo Compressors with Gas Bearings. Available online: https://www.celeroton.com/fileadmin/user_upload/produkte/kompressor/Celeroton_Product_Brochure_Turbo_Compressors_with_Gas_Bearings.pdf (accessed on 10 June 2021).
- Tingelöf, T.; Ihonen, J.K. A rapid break-in procedure for PBI fuel cells. Int. J. Hydrogen Energy 2009, 34, 6452–6456. [Google Scholar] [CrossRef]
- Thomas, S.; Araya, S.S.; Vang, J.R.; Kær, S.K. Investigating different break-in procedures for reformed methanol high temperature proton exchange membrane fuel cells. Int. J. Hydrogen Energy 2018, 43, 14691–14700. [Google Scholar] [CrossRef]
- Lang, S.; Kazdal, T.J.; Kühl, F.; Hampe, M.J. Experimental investigation and numerical simulation of the electrolyte loss in a HT-PEM fuel cell. Int. J. Hydrogen Energy 2015, 40, 1163–1172. [Google Scholar] [CrossRef]
- Boaventura, M.; Mendes, A. Activation procedures characterization of MEA based on phosphoric acid doped PBI membranes. Int. J. Hydrogen Energy 2010, 35, 11649–11660. [Google Scholar] [CrossRef]
- Samsun, R.C.; Krupp, C.; Tschauder, A.; Peters, R.; Stolten, D. Electrical start-up for diesel fuel processing in a fuel-cell-based auxiliary power unit. J. Power Sources 2016, 302, 315–323. [Google Scholar] [CrossRef]
- Janßen, H.; Supra, J.; Lüke, L.; Lehnert, W.; Stolten, D. Development of HT-PEFC stacks in the kW range. Int. J. Hydrogen Energy 2013, 38, 4705–4713. [Google Scholar] [CrossRef]
- Janßen, H.; Lüke, L.; Lehnert, W.; Stolten, D. Setup and experimental validation of a 5 kW HT-PEFC stack. Int. J. Hydrogen Energy 2017, 42, 11596–11604. [Google Scholar] [CrossRef]
Figure 1.
Simplified layout of the APU S2 fuel cell system illustrating the system integration. Red: air streams; green: water streams; brown: steam/air mixture; purple: heat exchange fluid; blue: diesel; black: reformate, off-gas and used air streams.
Figure 1.
Simplified layout of the APU S2 fuel cell system illustrating the system integration. Red: air streams; green: water streams; brown: steam/air mixture; purple: heat exchange fluid; blue: diesel; black: reformate, off-gas and used air streams.

Figure 2.
Cross-sectional views of newly-developed multi-functional reactors, the CAB 6 (left) and WGS 6B_WÜ (right).
Figure 2.
Cross-sectional views of newly-developed multi-functional reactors, the CAB 6 (left) and WGS 6B_WÜ (right).

Figure 3.
Design and CFD-supported optimization of flow channels for the stack manifolds. Left: Air; middle: Oil (heat transfer medium); and right: Reformate. The upper figures present the channel design and simulated flow rate distribution for each educt and the lower figures the simulation results for the velocity profile in each channel.

Figure 4.
Connection of both stacks (middle) with the developed manifolds (left, right) for educt distribution and collection.
Figure 4.
Connection of both stacks (middle) with the developed manifolds (left, right) for educt distribution and collection.

Figure 5.
CAD model (left) of the APU S2 and built system with the fuel processor components at the front (middle) and the fuel cell stacks and BoP components at the back (right).
Figure 5.
CAD model (left) of the APU S2 and built system with the fuel processor components at the front (middle) and the fuel cell stacks and BoP components at the back (right).

Figure 6.
Summary of the selected break-in experiments (E5–E25) for the HT-PEFC stack using reformate from NEXBTL diesel reforming: (a) Stack voltage and (b) current as a function of time on stream; stack operation at 160 °C.
Figure 6.
Summary of the selected break-in experiments (E5–E25) for the HT-PEFC stack using reformate from NEXBTL diesel reforming: (a) Stack voltage and (b) current as a function of time on stream; stack operation at 160 °C.

Figure 7.
Polarization curves of the fuel cell stack during complete system operation with NEXBTL diesel, with a hold time of 2 min. Left: Average cell voltage (V) and Right: Power (P).
Figure 7.
Polarization curves of the fuel cell stack during complete system operation with NEXBTL diesel, with a hold time of 2 min. Left: Average cell voltage (V) and Right: Power (P).

Figure 8.
Start-up experiments (SE1–SE4) with the complete system: (a) Fuel and air flow rates in the ATR; (b) CO concentration (dry product gas) at the WGS outlet (anode inlet); and (c) stack voltage (V) and current (C).
Figure 8.
Start-up experiments (SE1–SE4) with the complete system: (a) Fuel and air flow rates in the ATR; (b) CO concentration (dry product gas) at the WGS outlet (anode inlet); and (c) stack voltage (V) and current (C).

Table 1.
Overview of considered operating modes for detailed engineering.
| Case | Explanation |
|---|---|
| APU 2.8 kWe | Normal system operation at minimum load |
| APU 5 kWe | Normal system operation at medium load |
| APU 7.5 kWe | Normal system operation at maximum load |
| Start phase A | Heating up the system with air flow |
| Start phase B1 | Reformate operation with 1350 g h−1 of fuel |
| Start phase B2 | Reformate operation with 999 g h−1 of fuel |
| Start phase B3 | Reformate operation with 696 g h−1 of fuel |
| Start phase C | Transition from reformate operation to stack operation at 696 g h−1 of fuel |
Table 2.
Flow rates for the operation of the ATR, WGS, HT-PEFC stacks, and CAB, as well as produced reformate and off-gases in different operation modes based on process simulations. Fuel: NEXBTL diesel, n (O2)/n (C) = 0.47; n (H2O)/n (C) = 1.9. APU mode: Anode: λfuel = 1.2; cathode: λair = 2; CAB: λair = 1.3. Reformate mode: λair = 3.5 in CAB.
| Operating Mode | APU | Start Phase A | Start Phase B | Start Phase C | ||||
|---|---|---|---|---|---|---|---|---|
| 2.8 kWe | 5 kWe | 7.5 kWe | - | B1 | B2 | B3 | - | |
| ATR | ||||||||
| fuel/g h−1 | 696 | 1435 | 2520 | - | 1350 | 999 | 696 | 696 |
| water/g h−1 | 1684 | 3472 | 6098 | - | 3267 | 2417 | 1684 | 1684 |
| air/Nl h−1 | 2522 | 5200 | 9133 | 10,000 | 4892 | 3620 | 2522 | 2522 |
| reformate/Nl h−1 | 6352 | 13,097 | 22,999 | 10,000 | 12,321 | 9118 | 6352 | 6352 |
| WGS | ||||||||
| water/g h−1 | 457 | 943 | 1656 | - | 887 | 656 | 457 | 457 |
| reformate/Nl h−1 | 6921 | 14,270 | 25,060 | 10,000 | 13,425 | 9934 | 6921 | 6921 |
| Stack | ||||||||
| air/Nl h−1 | 9014 | 18,586 | 32,639 | 10,000 | 17,130 | 12,676 | 8832 | 8832 |
| anode off-gas/Nl h−1 | 5069 | 10,451 | 18,352 | - | - | - | - | 6921 |
| used air/Nl h−1 | 9941 | 20,496 | 35,992 | 10,000 | 17,130 | 12,676 | 8832 | 8832 |
| CAB | ||||||||
| air/Nl h−1 | 1532 | 3158 | 5546 | 10,000 | 38,598 | 28,562 | 19,899 | 19,899 |
| off-gas/Nl h−1 | 6376 | 13,146 | 23,086 | 20,000 | 49,791 | 36,845 | 25,670 | 25,670 |
Table 3.
Temperatures and gas compositions at selected positions in the system in different operating modes based on process simulations.
Table 3.
Temperatures and gas compositions at selected positions in the system in different operating modes based on process simulations.
| Position | Temperature | Oxygen | Water | Carbon Monoxide | Hydrogen | Carbon Dioxide | Methane | Nitrogen | Argon |
| /°C | /(vol.)% | ||||||||
| ATR outlet | 400 | 0 | 24.0 | 8.2 | 27.4 | 9.2 | 0.1 | 30.7 | 0.4 |
| WGS outlet | 160 | 0 | 23.1 | 1.0 | 31.9 | 15.1 | 0.1 | 28.4 | 0.3 |
| Anode outlet | |||||||||
| APU operation | 170 | 0 | 32.2 | 1.4 | 7.5 | 20.2 | 0.2 | 38.1 | 0.5 |
| Start-up phase | - | - | - | - | - | - | - | - | - |
| Cathode outlet | |||||||||
| APU operation | 170 | 9.3 | 20.4 | 0 | 0 | 0 | 0 | 69.5 | 0.8 |
| Start-up phase | 145 | 20.6 | 1.9 | 0 | 0 | 0 | 0 | 76.6 | 0.9 |
| CAB outlet | |||||||||
| APU operation | 183 | 1.1 | 32.3 | 0 | 0 | 17.3 | 0 | 48.7 | 0.6 |
| Start-up phase | 167 | 11.3 | 16.5 | 0 | 0 | 4.4 | 0 | 67.0 | 0.8 |
Table 4.
Summary of results from start-up experiments. Power WGS heating wire: 687 We; power glow plug: 771 We. SE1: Three-step increase of reformer load. SE 2–4: One-step increase of reformer load.
Table 4.
Summary of results from start-up experiments. Power WGS heating wire: 687 We; power glow plug: 771 We. SE1: Three-step increase of reformer load. SE 2–4: One-step increase of reformer load.
| Experiment | Reformer Load | Power ATR Heating Wire | Start Time | Energy Consumption |
|---|---|---|---|---|
| SE 1 | 37% | 2640 We | 30 min | 2.58 MJ |
| SE 2 | 37% | 2640 We | 28 min 30 s | 2.60 MJ |
| SE 3 | 50% | 2640 We | 23 min 55 s | 2.53 MJ |
| SE 4 | 50% | 3020 We | 21 min 47 s | 2.50 MJ |
Publisher’s Note: MDPI stays neutral with regard to jurisdictional claims in published maps and institutional affiliations. |
© 2021 by the authors. Licensee MDPI, Basel, Switzerland. This article is an open access article distributed under the terms and conditions of the Creative Commons Attribution (CC BY) license (https://creativecommons.org/licenses/by/4.0/).
Share and Cite
MDPI and ACS Style
Samsun, R.C.; Prawitz, M.; Tschauder, A.; Weiske, S.; Pasel, J.; Peters, R. A Compact, Self-Sustaining Fuel Cell Auxiliary Power Unit Operated on Diesel Fuel. Energies 2021, 14, 5909. https://0-doi-org.brum.beds.ac.uk/10.3390/en14185909
AMA Style
Samsun RC, Prawitz M, Tschauder A, Weiske S, Pasel J, Peters R. A Compact, Self-Sustaining Fuel Cell Auxiliary Power Unit Operated on Diesel Fuel. Energies. 2021; 14(18):5909. https://0-doi-org.brum.beds.ac.uk/10.3390/en14185909
Chicago/Turabian StyleSamsun, Remzi Can, Matthias Prawitz, Andreas Tschauder, Stefan Weiske, Joachim Pasel, and Ralf Peters. 2021. "A Compact, Self-Sustaining Fuel Cell Auxiliary Power Unit Operated on Diesel Fuel" Energies 14, no. 18: 5909. https://0-doi-org.brum.beds.ac.uk/10.3390/en14185909
Note that from the first issue of 2016, this journal uses article numbers instead of page numbers. See further details here.