
Efficiency Increase of Energy Systems in Oil and Gas Industry by Evaluation of Electric Drive Lifecycle


1
Department of Energy, Saint Petersburg Mining University, 199106 Saint Petersburg, Russia
2
Department of Oil and Gas, Saint Petersburg Mining University, 199106 Saint Petersburg, Russia
*
Author to whom correspondence should be addressed.
Energies 2021, 14(19), 6074; https://0-doi-org.brum.beds.ac.uk/10.3390/en14196074
Submission received: 30 July 2021
/
Revised: 18 September 2021
/
Accepted: 19 September 2021
/
Published: 24 September 2021
(This article belongs to the Special Issue Advances in Sustainable Energy and Environmental Economics)
Abstract
:The efficiency issue of energy systems in the oil and gas industry is a crucial factor nowadays. Energy share in the production costs of oil and gas can reach 50%. Among the most important energy equipment are the electric drives of the pumps, compressors, auxiliary units, etc. The paper considered the lifecycle of the electric drives used at oil and gas fields and evaluated their efficiency parameters during periods of operational wear or malfunctioning. At the same time, the lifecycle of the energy equipment was seen as its technical state during operation. Based on the spectral analysis of the current using the finite Fourier transform (FFT), the main frequency components were identified that characterize the type and level of malfunction, taking into account defined efficiency indicators of the electric drive. A technique for assessing the technical state of an electric drive was proposed based on the normalized levels of the amplitudes of the frequency components. Predictive management of the electric drive was implemented in terms of correcting the control system when a malfunction occurs, providing the required efficiency indicators. Boundaries for the technical state of the electric drive were determined. Recommendations for further operation, terms of maintenance and repair or preventive management were presented.
1. Introduction
Prospects for the development of enterprises in the fuel, energy and mineral resources industries in the context of growing economic, environmental and technical requirements are associated with an increase in the efficiency of electromechanical equipment. Such devices, including electric motors and electric drives (ED), account for up to 85% [1,2,3] of electricity consumption and are the main production unit in automated and robotic systems.
Solution to the issues of increasing the energy efficiency of oil and gas production is directly related to the use and improvement of a variable electric drive. Nowadays it is implemented to a greater extent based on an asynchronous motor (AM) with a squirrel cage rotor. Its widespread use in electric drives is due to its simplicity of design and low cost. At the same time, the problems of large starting current, relatively low power factor and reactive power consumption from the network are solved by using power frequency converters, in particular, converters with an active rectifier [4,5]. Despite this, various effects (thermal, electrical, mechanical, environmental, etc.) on the electric drive lead to wear and tear during its operation. Unregulated operating modes, frequent overloads, switching and natural degradation processes create malfunctions. They lead to a decrease in the electric drive’s life cycle, energy efficiency indicators (power loss, efficiency of AM and electric drive) and mechanical characteristics (efficiency of the executive body (EB), speed and torque on the shaft). Untimely detection of defects at the stage of their origin and development without preemptive action leads to their active growth and impact on the associated units of electromechanical equipment with subsequent economic damage to the enterprise [6,7].
Therefore, issues of assessing the current state of the electrical equipment used, timely diagnosis of emergency and pre-emergency modes of its operation and assessment of the residual resource are of particular importance. Despite the fact that enterprises are transitioning to predicting the state of their assets within the framework of digital transformation, complexity and high cost of using damage detection and control systems for each piece of equipment does not allow enterprises to abandon the existing system of scheduled repairs [8,9]. This system involves decommissioning electrical equipment and replacing components with new parts at fixed intervals. However, this approach does not take into account the real load of the equipment and its real technical condition. Thus, downtime and even replacement of equipment that has not yet worked out its resource are possible. At the same time, the probability of sudden failures remains if the equipment develops its resource earlier than planned. Nevertheless, the economic effect of repair work often turns out to be unreasonably low.
Repair and maintenance cost of electrical equipment is a significant part of the total operating costs for enterprises, especially in the mineral resources industry [10,11]. Moreover, their total share in the process of operation increases as the equipment resource is depleted. The complexity of technical diagnostics for electrical equipment in technological systems of the oil and gas industry is due to its wide range, specifics of performance and operating modes, as well as difficult operating conditions and being in hard-to-reach places that may be dangerous for the servicing personnel [12].
Currently, various devices based on vibration, electromagnetic and other methods are used to diagnose an asynchronous motor. A method for diagnosing malfunctions of an asynchronous motor based on the analysis of the consumed currents is presented in [13,14]. The method provides the identification of defects by the calculated frequency components, but at the same time, it is difficult to assess the level of influence.
An analysis of vibrations in an asynchronous motor in order to identify malfunctions of the motor and the working body by analyzing the averaged components of vibration movement, vibration velocity and vibration acceleration is presented in [15,16]. A method for analyzing the harmonic components of vibration movement, vibration velocity and vibration acceleration is described in [17]. However, there are only experimental methods for assessing the level of defects and their effect on the performance of electromechanical equipment by the vibroacoustic data of the electric motor.
Papers [18,19,20] describe an approach to wavelet analysis of frequency vibration and electrical characteristics of electromechanical equipment. The method has high informative value, but there are no methods and means of processing the wavelets themselves.
Analysis of the above-mentioned works allows us to outline the imperfection of diagnostic methods for electromechanical equipment, which determines the relevance of solving this problem. Solving the problem with identifying the level and type of defect will make it possible to develop a method for assessing the technical condition of electromechanical equipment.
The main aim of the work is the development of an ED diagnostic method based on a comprehensive analysis of data with a calculation of the technical condition for pumping units with a variable frequency drive.
2. Materials and Methods
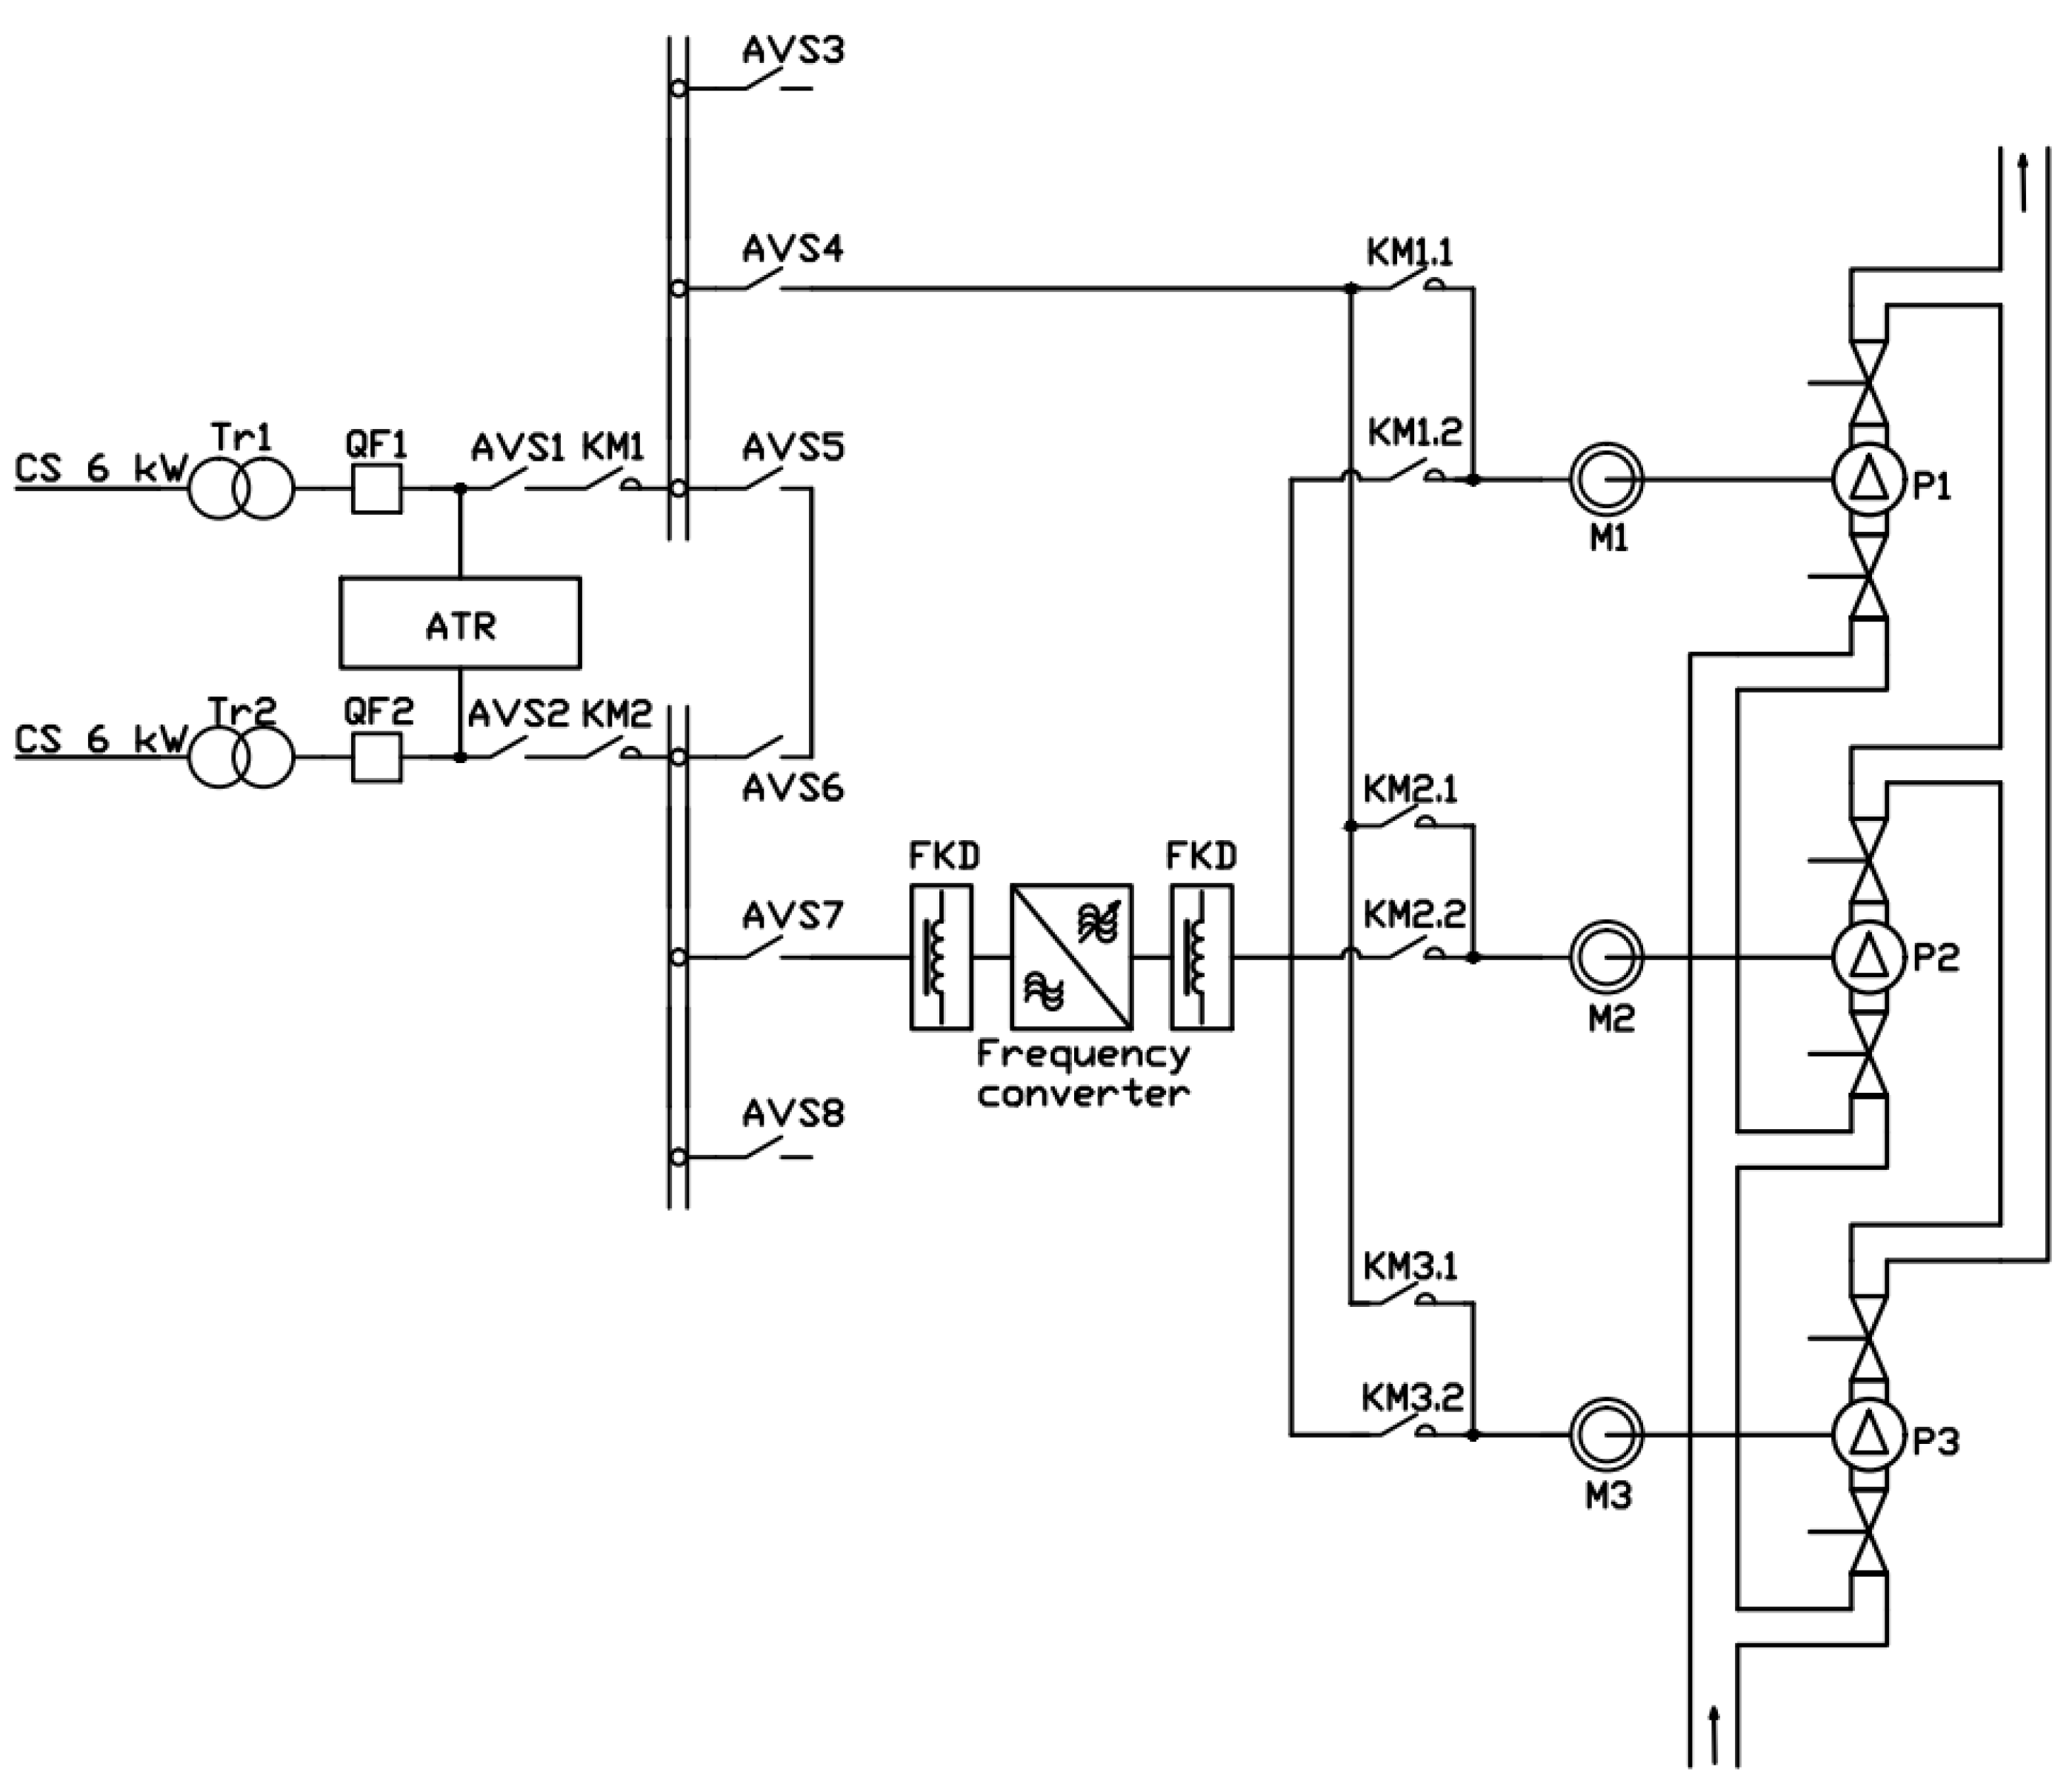
The object of this research is a multi-motor electric drive in a system with asynchronous motors of a medium power class (132 kW) for general industrial purposes in continuous operating modes S1. The system is intended for pumping oil products. Shaft rotation frequency is controlled by scalar U/f algorithms, and the motor is switched over with synchronization to the electrical network when reaching the nominal parameters. The power part of the converter is represented by a two-tier structure with a 6-pulse uncontrolled rectifier and a two-level autonomous voltage inverter. The system has rather low requirements for rotation frequency and electromagnetic torque, and the requirements for uninterrupted operation are no more than 1 h [21,22]. Electric motors are powered in nominal modes from an electric network with a sinusoidal voltage of an industrial frequency (50 Hz). If the load is reduced, they are switched to power from an autonomous inverter with a pulse-width modulation (PWM) of voltage and quasi-sinusoidal current (Figure 1). Considering the nature of changes and commutations, methods based on the analysis of electrical parameters and coordinates were chosen to identify the states of an electric drive, taking into account the audit of modern diagnostic methods [23]. To measure the distortions in current consumption by AM, which allow outlining the components that characterize the state of the nodes, it is necessary to use current sensors on the Hall effect, thereby ensuring measurement accuracy [24,25]. Subsequent transformations, calculations and analysis were performed on a microcontroller, personal computer or server.
Spectral analysis should be used considering the condition of motor power supply from both sinusoidal and non-sinusoidal voltage, which determines the shape of the current, as well as distortions caused by machine defects [26]. Energy-efficiency of an electric drive (Figure 1) is determined by the operating mode of the motor and its state, but is quantified by the power factor χ (1) with a non-sinusoidal current and voltage waveform, taking into account the harmonic distortions for current KI and voltage KU, (2), and for sinusoidal form of current and voltage KI = 1, KU = 1 [27].
where KI, KU—current and voltage harmonic distortions (THD); I1p, U1p—amplitude of the fundamental harmonic of current and voltage in a phase (A, V); I, U—effective value of current and voltage (A, V); P, S—net and apparent power (W, VAR); φ—shift angle between fundamental harmonic of phase current and voltage (rad).
Composition of the current at the output of an autonomous inverter is described by Equation (3) and is determined by three main parts: the first is the main harmonic of the supply network; the second is harmonics determined by the structure and pulsation of the inverter; the third is the combination harmonics of the first and second parts.
where In—amplitude harmonics of the stator current, multiples of the fundamental harmonic (A); Im—amplitudes of current harmonics (A), multiples of the carrier frequency; Inm—amplitudes of the combinational harmonics for the stator current (A); ω1 = 2πf1—rotation frequency for the fundamental current harmonic (rad/s); ωH = 2πfH—rotation frequency for the carrier harmonic of the stator current (rad/s); m = 1, 2, 3... and n = 1, 5, 7...—multiples of carrier ωH and fundamental ω1 rotation frequencies; f1, fH—fundamental and carrier frequencies (Hz).
According to the results of the statistical data analysis on the malfunction of the electric drive due to malfunctions of the asynchronous motor, the main types of defects were identified. They were: bearings wear, eccentricity of the air gap, turn-to-turn short circuit and breakage of rotor rods [28,29], described by harmonic current components (4).
where ir, id.st, ib, iec—amplitude values of the stator current modulated with defects in the rotor, stator, bearings and eccentricity of the air gap; ωr = 2πfr—rotor rotation frequency (rad/s); s—asynchronous motor slip; k = 1, 3, …—odd integer; p—number of pole pairs; rs—number of rotor rods.
The stator current Ist, taking into account the AM defects at a sinusoidal voltage, will be formed according to (5), and when powered from an autonomous inverter, according to (6).
where Idi—amplitude values of stator current (A), corresponding to the defect; ωdi = 2πfdi—rotation frequency for the harmonic component of the stator current caused by the defect (rad/s); fdi—defect frequency.
In this case, the harmonic current distortion factor, taking into account (1), (3), (4) and (6), can be represented in the form of two components (7).
where KI(n)—harmonic distortion coefficient of current, determined by the quality of electrical energy in the supply network in phases A, B, C; KI*—harmonic distortion of current in phases A, B, C of the electric motor, determined by defects.
Distortions of the stator current curve not only lead to a non-sinusoidal current and a decrease in the power factor, but also are a moment-defining value of the electromagnetic moment of an asynchronous motor (8).
where zp—number of pole pairs of an asynchronous motor, Lm—magnetizing inductance, Lr—rotor winding inductance, ψr—rotor flux linkage, θ—angle between the stator current vectors Ist and the rotor flux linkage ψr.
Electromagnetic moment M(n) is formed by the vectors of the stator current and the rotor flux linkage formed by the fundamental voltage harmonic (9). Structure and operation of an autonomous inverter determines the composition of the higher harmonics of the stator current and rotor flux linkage as well as their combinations form alternating moments M(qp) (9). At the same time, the components (4) are taken into account, which in turn form subharmonics of the stator current and rotor flux linkage and form additional alternating moments M(di) (9).
where M(n), M(qp), M(di)—components of the electromagnetic moment (Nm), created as a result of the interaction of the n harmonics for the stator current and the rotor flux linkage, di harmonics for the stator current and the rotor flux linkage, q harmonic for the stator current and p harmonic of the rotor flux linkage; Ist(n), Ist(q), Ist(di), ψr(n), ψr(p), ψr(di)—harmonic components of stator current and rotor flux linkage (A, Wb); θ(qp)—angle between the q harmonic of the stator current and the p harmonic of the rotor flux linkage, θ(di)—angle between the di harmonics of the stator current and the rotor flux linkage (rad) (6).
Total influence of alternating moments on the resulting AM electromagnetic moment is determined by the coefficient for pulsations of the electromagnetic moment Kp (10). To take into account the effects of the multicomponent harmonic composition caused by both the converter and the AM defects, with regard to (8) and (9), it is necessary to divide the total coefficient of pulsations ∑Kp into components Kp and Kp* (11).
where Mav—average value of the electromagnetic moment of the asynchronous motor (N∙m), Kp(n)—pulsation coefficient of the electromagnetic moment, determined by the type and structure of the power frequency converter, Kp*—pulsation coefficient of the electromagnetic moment, determined by the type and level of defect in the motor and the mechanical part of the electric drive.
To study the influence of faults under operating conditions with switching the motor power supply between the frequency converter and the energy grid, a model in MATLAB Simulink was developed (Figure 2). It consisted of a multi-motor electric drive in a pumping station for pumping oil products. The model was consistent with the above-described drive structure.
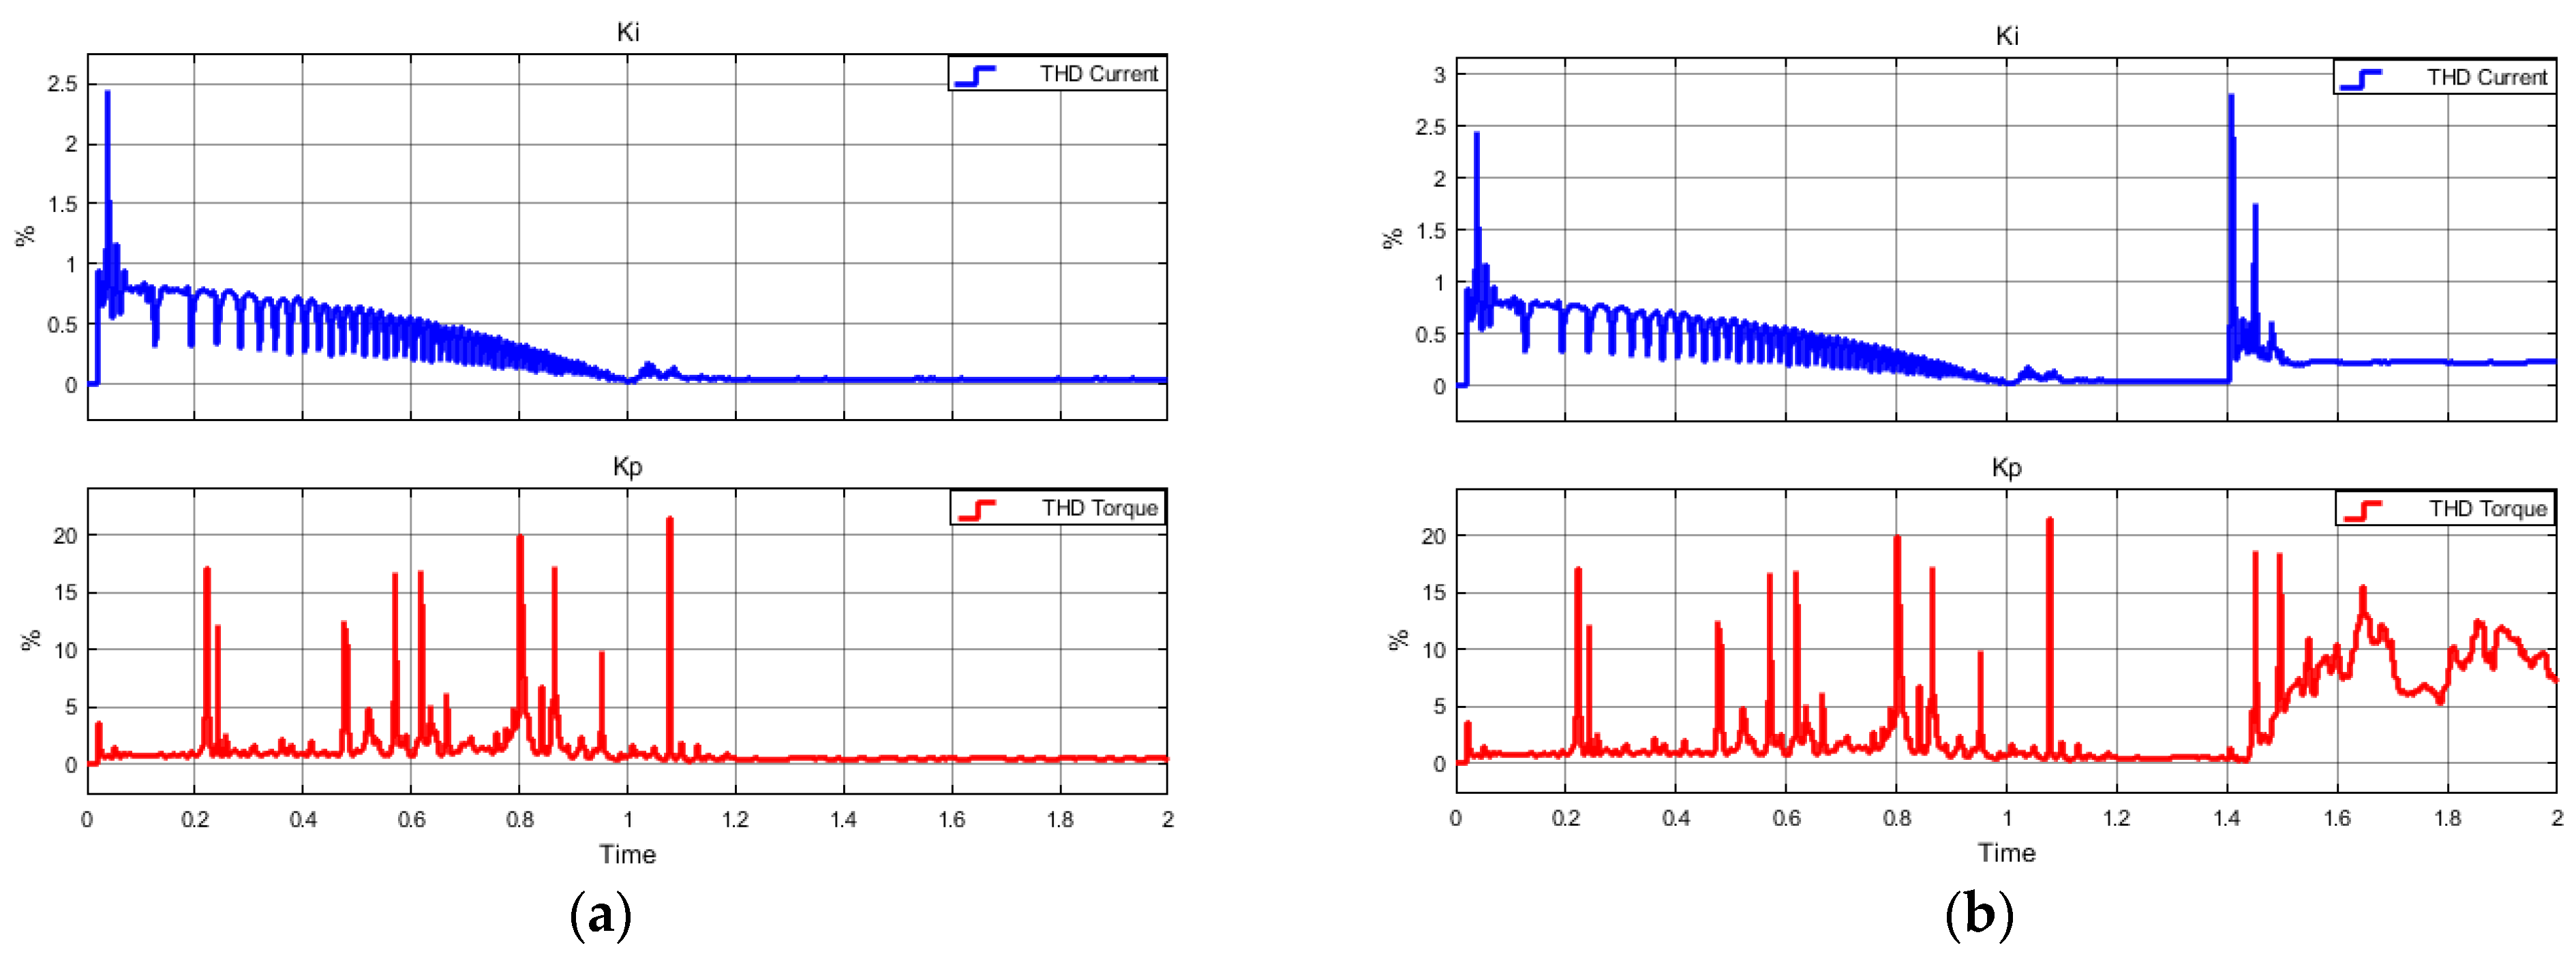
The results of modeling a fault for one phase (phase A) in the form of an equivalent turn-to-turn short-circuit during t = 1.4 s while maintaining a constant rotation frequency and electromagnetic moment in the interval 1.2 < t < 2 s due to control algorithms show that the shape was distorted and the amplitude of stator current increased. This led to corresponding changes in the current harmonic distortion KI (7) of the oscillogram (Figure 3). Appearance of distortions in the current that were not multiples of the fundamental harmonic and caused by defects determined the increase in the pulsation coefficient of the electromagnetic moment ΣKp (11) of the oscillogram (Figure 3).
Method for Assessing the ED Technical Condition
The development of a diagnostic system based on comprehensive analysis of parameters of various physical nature will allow solving the problems of increasing the accuracy of assessing the technical condition and life cycle of electromechanical equipment.
An approach to assess the technical condition and predict the life cycle was proposed based on the analysis of the electrical and mechanical coordinates of the electric drive. A large number of parameters, recorded and calculated signal components as well as their processing, suggested the use of an artificial neural network (ANN).
The diagnostic system (Figure 4) represented a hardware and software system that included software algorithms for data analysis based on ANN operation, and a data collection system consisting of several sets of sensors that transmit signals to the data collection board (DCB). The main database of parameters was formed from the received signals. It also included an additional database of parameters (hereinafter indirect parameters) about the technical condition of the unit from the data preprocessing block, consisting of static data (T—average ambient temperature, ρ—humidity, ξ—insulation strength, etc.) and data from the process automation system (e.g., vr(t)—reducer speed signal, vi(t) EB signal).
Before submitting the main and indirect parameters to the ANN input, they were filtered, and a database was formed on the permanent memory device. Data processing using ANN led to the formation of a retrospective data base, according to which it was possible to assess the performance of an electric drive.
Evaluation of the technical condition and resource of unit was carried out using ANN as an assessment for the possibility of failure-free ED functioning. Determination of the probability for failure-free ED operation can be represented as the construction of Equation (1). It is based on the retrospective database with the requirements for the relative error, or for limit of the confidence period of prediction λ at p ≥ 95%—less than 5% [30].
where Pi—probability forecast; t—current time; Δt—time period between measurements; λ—forecast interval; n—amount of intervals in the past; k—amount of intervals in the future; l—amount of assessed characteristics; Pim(mi), Pih(hi)—values of probabilities for electrical and vibration parameters (mi—defect identified in the analysis of electrical parameters, hi—defect identified during the analysis of vibration parameters in accordance with Table 1; Ni—indirect parameters affecting the forecast for assessing the likelihood of failure-free operation.
It was required to form training and test samples according to the diagnosed parameters from the retrospective database for ANN to function. That means the data obtained from the sensors was necessary for ANN operation. Indirect parameters could be added to the data that affect forecasting of failure-free operation, taking into account the performed regression analysis and the assessment for the significance of the correlation coefficients.
Operation of ANN was as follows: initial conditions for the neural network were started and set (values of the weight coefficients, number of training samples, ANN parameters, given small value that determines the forecast accuracy), values of the measured entities were read and then followed the process of transformation into relative values Yi within the range (0 ≤ Yi ≤ 1). Initial data for determining the probabilities of a defect using ANN were the operating, statistical and repair parameters of an asynchronous motor and parameters that indirectly affect its technical condition, according to Table 1.
An algorithm for ANN operation was compiled based on Equation (10). It took into account the system operation, which evaluates the possibility of failure-free functioning for analyzed electric and vibration AM characteristics using ANN.
The input of a neuron network included a block for generating training data and a block for creating an ANN. It defined the ANN type, number of intermediate layers, number of neurons and function of activation. A defined training algorithm and parameters were set in training block. Probability for a failure-free EM operation was assessed by electrical, vibration and indirect parameters. They were compared with set EM values in the blocks, which were responsible for testing and assessing the quality of forecasting.
Structural model for a formal neuron, from which a neural network is built, intended for the prediction [31], is shown in Figure 5.
A formal neuron is an elementary transforming element with multiple inputs, to which signals x1, x2… xn are received, an adder block, a signal conversion block using a transfer function (or activation function) f(NET) and one output y. Each input has its own “weight” wi, θ is the bias parameter. The presented neuron functions in two stages. At the first stage, magnitude of the excitation received by the neuron is calculated in the adder block [32].
where i is number of the input, j—neuron number in layer, l—layer number, xijl—i input signal of j neuron in layer l; wijl—weight coefficient of i input for the neuron of j number in layer l; NETjl—signal of NET neuron of number j in layer l, θ—threshold level of a given neuron [33].
Displacement parameter θ is often represented as a single input xn + 1 = 1 with weight wn + 1 = θ. At the second stage, total excitation is passed through the activation function. The result is the output signal y = f(NET). The transform function, as a rule, must satisfy two conditions:
- (1)
- f(NET)—monotone (usually non-decreasing) function;
- (2)
- |f(NET)| ≤ 1,
where f—non-linear function called activation function.
3. Results and Discussion
Prediction accuracy was achieved by comparing the results with the actual data at the previous iteration. This allowed retraining the system with new data with a deviation of more than 5%, thereby reducing the data processing cycle time. The learning algorithm automatically performed the minimum number of iterations to obtain the required accuracy. Reference data of vibration and electrical parameters according to Table 2 were used as the initial data for the system. At the end of training the neural network, its characteristics were assessed, taking into account standard requirements [36,37].
Value of the electromechanical equipment lifecycle, taking into account ANN operation (11), (12), (13), (14), is represented by Equation (15) [38,39,40].
where K1 is coefficient taking into account the state of the boundaries for the assessment of vibration parameters and detected defects at time t, depending on the normal, pre-crisis and crisis states.
K2—coefficient taking into account the state of the boundaries for the assessment of electrical parameters and onset (detection) of defects at time t, depending on the normal, pre-crisis and crisis states.
K3—coefficient that takes into account the state of the boundaries for the assessment of vibration parameters and measured parameters and factors affecting the forecast of the lifecycle at time t, depending on the normal, pre-crisis and crisis states.
K4—coefficient taking into account the state of the boundaries for the assessment of electrical parameters and measured parameters and factors affecting the forecast of the lifecycle at time t, depending on the normal, pre-crisis and crisis states.
Pih(h), Pim(m)—probabilities for vibration and electrical parameters, taking into account ANN operation.
where ∆wij; ∆θj—correction for weight coefficients and threshold levels, taking into account the calculated output and comparing the resulting output vector ys with the standard ds ε—ANN training rate.
The calculated value of the lifecycle, obtained based on ANN operation, taking into account the electrical, vibration and indirect parameters, and detected defects were estimated in accordance with the boundaries presented in Table 3.
The results of the operation of the system for diagnosing the technical condition and assessing the lifecycle of an electromechanical unit with an asynchronous motor are diagnostic images of the probabilities for the technical condition in Figure 6, Figure 7 and Figure 8.
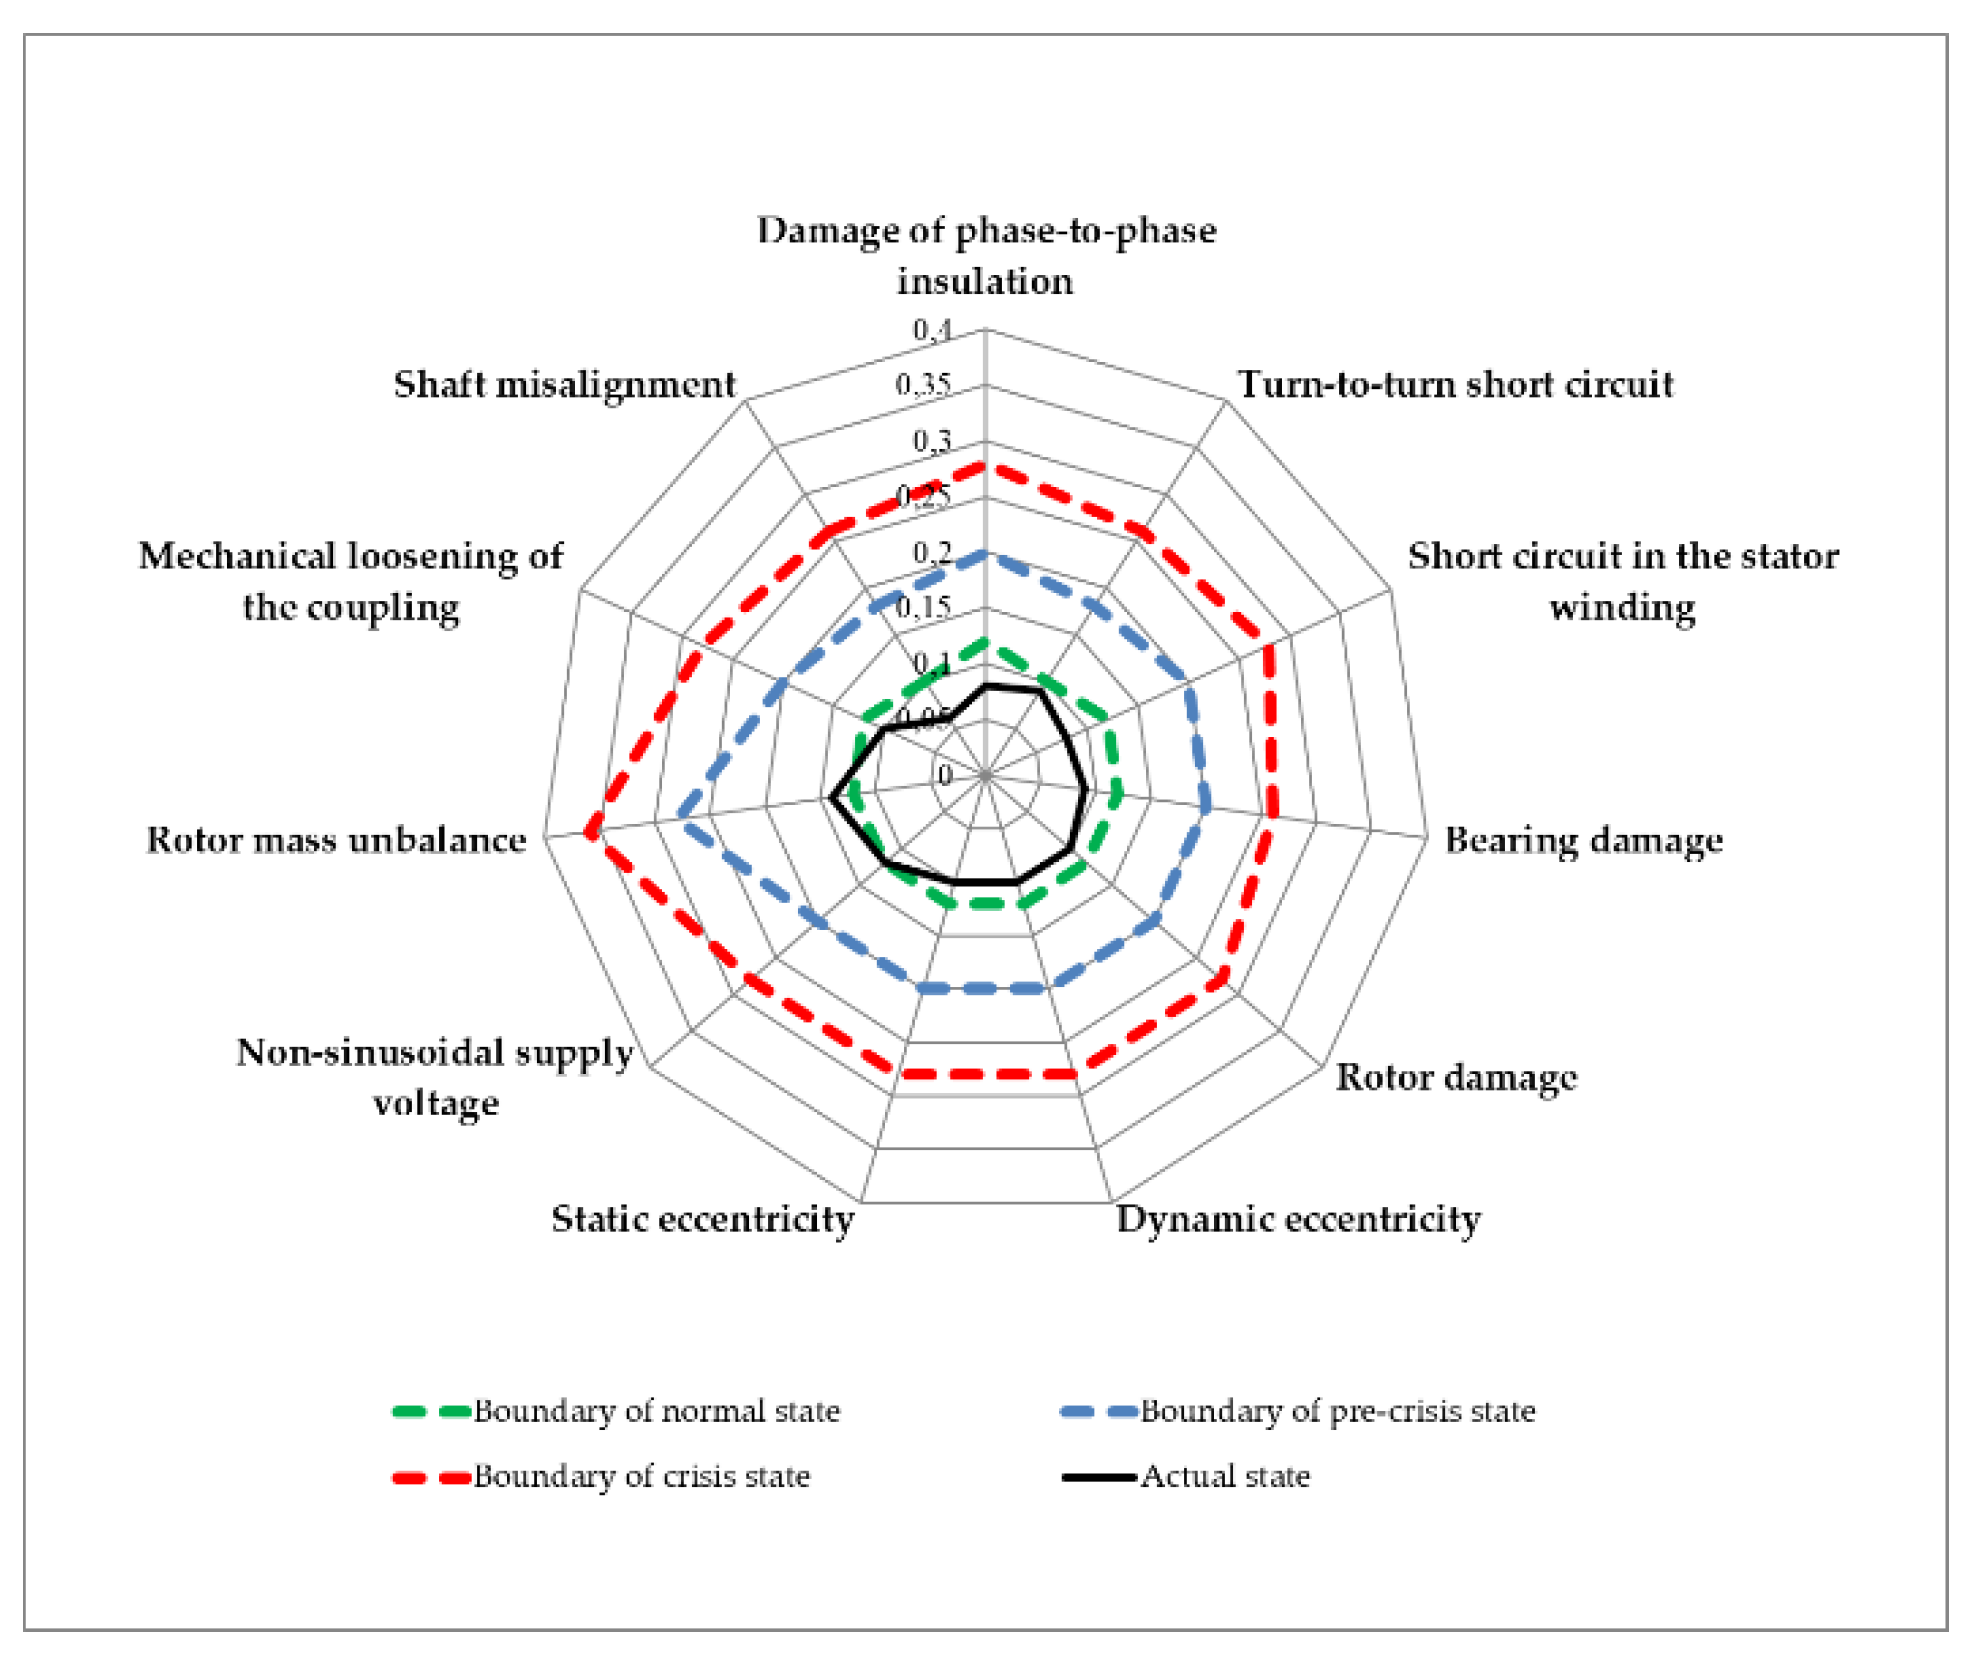
Figure 6 shows the diagnostic image of the ED normal state for all monitored parameters. After creating several minor artificial defects in the unit, four parameters that deviated from the normal state were identified, while the general condition of the machine was assessed as pre-crisis (Figure 7). During long-term operation of the unit, rapidly increasing changes in three parameters were revealed that went into the zone of critical values, and the condition of the unit was assessed as a crisis state with recommendations for stopping and repairs (Figure 8).
4. Conclusions
Safe functioning of enterprises in the petroleum industry directly depends on the qualitative and quantitative indicators associated with economic efficiency. It is expressed in the cost of carrying out work on diagnostics and monitoring and the operation of electromechanical equipment, which includes a set of measures aimed at improving diagnostic systems.
The described approach for assessing the technical condition and predicting the possibility of failure-free operation by electrical, vibration and indirect parameters will provide an instant picture of the state for the electric drive with high accuracy.
The final result will be a reduction in the number of unexpected shutdowns of the drive and downtime of associated equipment, as well as reduction of the cost of scheduled and unscheduled repairs and maintenance.
According to the data obtained at the output of the system, it was possible to indirectly determine the state of the associated mechanical equipment and explore ways to maintain the operability of the electric drive by correcting the control algorithms.
Author Contributions
Conceptualization, A.K.; formal analysis, A.K. and N.K.; investigation, N.K.; methodology, A.K. and N.K.; project administration, V.M.; resources, N.K.; software, N.K.; validation, A.K.; visualization, V.M.; writing—original draft, N.K.; writing—review and editing, V.M. All authors have read and agreed to the published version of the manuscript.
Funding
The research was performed at the expense of the subsidy for the state assignment in the field of scientific activity for 2021 No. FSRW-2020-0014.
Data Availability Statement
The data presented in this study are available on request from the corresponding author. The data are not publicly available due to its storage in private networks.
Conflicts of Interest
The authors declare no conflict of interests.
Nomenclature
The following abbreviations are used in this manuscript:
| FFT | finite Fourier transform |
| ED | electric drives |
| AM | asynchronous motor |
| EB | executive body |
| ANN | artificial neural network |
| DCB | data collection board |
| CS | closed switchgear |
| Tr | transformer |
| QF | circuit breaker |
| ATR | automatic transfer of reserve |
| AVS | automatic vacuum switch |
| FKD | filter |
| KM | magnetic contactor |
| AM | asynchronous motor |
| P | pump |
| List of Symbols | |
| I1p, U1p | amplitude of the fundamental harmonic of current and voltage in a phase (A, V) |
| I, U | effective value of current and voltage (A, V) |
| P, S | net and apparent power (W, VAR) |
| In | amplitude harmonics of the stator current, multiples of the fundamental harmonic (A) |
| Im | amplitudes of current harmonics (A), multiples of the carrier frequency |
| Inm | amplitudes of the combinational harmonics for the stator current (A) |
| Idi | amplitude values of stator current (A), corresponding to the defect |
| Ist(n), Ist(q), Ist(di) | harmonic components of stator current (A) |
| ir, id.st, ib, iec | amplitude values of the stator current modulated with defects in the rotor, stator, bearings and eccentricity of the air gap |
| ω1 | rotation frequency for the fundamental current harmonic (rad/s) |
| ωH | rotation frequency for the carrier harmonic of the stator current (rad/s) |
| ωr | rotor rotation frequency (rad/s) |
| ωdi | rotation frequency for the harmonic component of the stator current caused by the defect (rad/s) |
| φ | shift angle between fundamental harmonic of phase current and voltage (rad) |
| s | asynchronous motor slip |
| rs | number of rotor rods |
| f1, fH | fundamental and carrier frequencies (Hz) |
| fdi | defect frequency (Hz) |
| M(n), M(qp), M(di) | components of the electromagnetic moment (Nm), created as a result of the interaction of the n harmonics for the stator current and the rotor flux linkage, di harmonics for the stator current and the rotor flux linkage, q harmonic for the stator current and p harmonic of the rotor flux linkage |
| Mav | average value of the electromagnetic moment of the asynchronous motor (N∙m) |
| ψr(n), ψr(p), ψr(di) | harmonic components of rotor flux linkage (Wb) |
| θ(qp) | angle between the q harmonic of the stator current and the p harmonic of the rotor flux linkage(rad) |
| θ(di) | angle between the di harmonics of the stator current and the rotor flux linkage (rad) |
| T | average ambient temperature |
| ρ | humidity |
| ξ | insulation strength |
| vr(t) | reducer speed signal |
| vi(t) | EB signal |
| KI(n) | harmonic distortion coefficient of current, determined by the quality of electrical energy in the supply network in phases A, B, C |
| KI* | harmonic distortion of current in phases A, B, C of the electric motor, determined by defects |
| Kp(n) | pulsation coefficient of the electromagnetic moment, determined by the type and structure of the power frequency converter |
| Kp* | pulsation coefficient of the electromagnetic moment, determined by the type and level of defect in the motor and the mechanical part of the electric drive |
| K1 | coefficient taking into account the state of the boundaries for the assessment of vibration parameters, and detected defects at the time t and depending on the normal, pre-crisis and crisis states |
| K2 | coefficient taking into account the state of the boundaries for the assessment of electrical parameters, and onset (detection) of defects at time t and depending on the normal, pre-crisis and crisis states |
| K3 | coefficient that takes into account the state of the boundaries for the assessment of vibration parameters, and measured parameters and factors affecting the forecast of the lifecycle, at time t and depending on the normal, pre-crisis and crisis states |
| K4 | coefficient taking into account the state of the boundaries for the assessment of electrical parameters, and measured parameters and factors affecting the forecast of the lifecycle, at time t and depending on the normal, pre-crisis and crisis states |
| Pih(h), Pim(m) | probabilities for vibration and electrical parameters, taking into account ANN operation |
| ε | ANN training rate |
| δ | lifecycle indicator |
| ∆wij; ∆θj | correction for weight coefficients and threshold levels, taking into account the calculated output and comparing the resulting output vector ys with the standard ds |
References
- Sychev, Y.A.; Zimin, R.Y. Improving the quality of electricity in the power supply systems of the mineral resource complex with hybrid filter-compensating devices. J. Min. Inst. 2021, 247, 132–140. [Google Scholar] [CrossRef]
- Shklyarskiy, Y.; Skamyin, A.; Vladimirov, I.; Gazizov, F. Distortion load identification based on the application of compensating devices. Energies 2020, 13, 1430. [Google Scholar] [CrossRef] [Green Version]
- Kodkin, V.L.; Anikin, A.S.; Baldenkov, A.A. Performance identification of the asynchronous electric drives by the spectrum of rotor currents. Int. J. Power Electron. Drive Syst. 2019, 10, 211–218. [Google Scholar] [CrossRef]
- Marco, L.; Blaabjerg, F.; Hansen, S. Design and control of an LCL-filter-based three-phase active rectifier. IEEE Trans. Ind. Appl. 2005, 41, 1281. [Google Scholar] [CrossRef]
- Dell’Aquila, A.; Liserre, M.; Monopoli, V.G.; Rotondo, P. An energy-based control for an nH-bridges multilevel active rectifier. IEEE Trans. Ind. Electron. 2005, 52, 670. [Google Scholar] [CrossRef]
- Zhukovskiy, Y.L.; Korolev, N.; Filatova, I. Asynchronous motor drive operability field with two-link structure of frequency converter. J. Phys. Conf. Ser. 2020, 1661, 012127. [Google Scholar] [CrossRef]
- Klyuev, R.V.; Bosikov, I.I.; Mayer, A.V.; Gavrina, O.A. Comprehensive analysis of the effective technologies application to increase sustainable development of the natural-technical system. Sustain. Dev. Mt. Territ. 2020, 2, 283–290. [Google Scholar] [CrossRef]
- Salomon, C.P.; Ferreira, C.; Sant’Ana, W.C.; Lambert-Torres, G.; Borges da Silva, L.E.; Bonaldi, E.L.; Torres, B.S. A study of fault diagnosis based on electrical signature analysis for synchronous generators predictive maintenance in bulk electric systems. Energies 2019, 12, 1506. [Google Scholar] [CrossRef] [Green Version]
- Filatova, I.; Nikolaichuk, L.; Zakaev, D.; Ilin, I. Public-private partnership as a tool of sustainable development in the oil-refining sector: Russian case. Sustainability 2021, 13, 5153. [Google Scholar] [CrossRef]
- Lavrenko, S.A.; Shishljannikov, D.I. Performance evaluation of heading-and-winning machines in the conditions of potash mines. Appl. Sci. 2021, 11, 3444. [Google Scholar] [CrossRef]
- Klyuev, R.; Fomenko, O.; Gavrina, O.; Turluev, R.; Marzoev, S. Energy indicators of drilling machines and excavators in mountain territories. In Energy Management of Municipal Transportation Facilities and Transport; Springer: Cham, Switzerland, 2019; Volume 1258, pp. 272–281. [Google Scholar] [CrossRef]
- Natalia, K.; Frenkel, I. Digital Processing of Seismic Data from Open-Pit Mining Blasts. Appl. Sci. 2021, 11, 383. [Google Scholar] [CrossRef]
- Minav, T.A.; Laurila, L.I.E.; Pyrhönen, J.J. Analysis of electro-hydraulic lifting system’s energy efficiency with direct electric drive pump control. Autom. Constr. 2013, 30, 144. [Google Scholar] [CrossRef]
- CusidÓCusido, J.; Romeral, L.; Ortega, J.A.; Rosero, J.A.; Espinosa, A.G. Fault detection in induction machines using power spectral density in wavelet decomposition. IEEE Trans. Ind. Electron. 2008, 55, 633. [Google Scholar] [CrossRef]
- Wang, J.; Fu, P.; Zhang, L.; Gao, R.X.; Zhao, R. Multilevel information fusion for induction motor fault diagnosis. IEEE/ASME Trans. Mechatron. 2019, 24, 2139. [Google Scholar] [CrossRef]
- Glowacz, A.; Glowacz, W.; Kozik, J.; Piech, K.; Gutten, M.; Caesarendra, W.; Khan, Z.F. Detection of deterioration of three-phase induction motor using vibration signals. Meas. Sci. Rev. 2019, 19, 241. [Google Scholar] [CrossRef] [Green Version]
- Raj, V.P.; Natarajan, K.; Girikumar, S.T. Induction motor fault detection and diagnosis by vibration analysis using MEMS accelerometer. In Proceedings of the 2013 International Conference on Emerging Trends in Communication, Control, Signal Processing and Computing Applications (C2SPCA), Bangalore, India, 10–11 October 2013; IEEE: Bangalore, India, 2013; pp. 1–6. [Google Scholar] [CrossRef]
- Tsypkin, M. Induction motor condition monitoring: Vibration analysis technique-a twice line frequency component as a diagnostic tool. In Proceedings of the 2013 International Electric Machines & Drives Conference, Chicago, IL, USA, 12–15 May 2013; IEEE: Chicago, IL, USA, 2013; pp. 117–124. [Google Scholar] [CrossRef]
- Seker, S.; Ayaz, E. Feature extraction related to bearing damage in electric motors by wavelet analysis. J. Frankl. Inst. 2003, 340, 125–134. [Google Scholar] [CrossRef]
- Kar, C.; Mohanty, A.R. Monitoring gear vibrations through motor current signature analysis and wavelet transform. Mech. Syst. Signal Process. 2006, 20, 158–187. [Google Scholar] [CrossRef]
- Ye, Z.; Wu, B.; Sadeghian, A. Current signature analysis of induction motor mechanical faults by wavelet packet decomposition. IEEE Trans. Ind. Electron. 2003, 50, 1217. [Google Scholar] [CrossRef]
- Kiselichnik, O.I.; Bodson, M. Nonsensor control of centrifugal water pump with asynchronous electric-drive motor based on extended Kalman filter. Russ. Electr. Eng. 2011, 82, 69–75. [Google Scholar] [CrossRef]
- Uddin, J.; Kang, M.; Nguyen, D.V.; Kim, J.M. Reliable fault classification of induction motors using texture feature extraction and a multiclass support vector machine. Math. Probl. Eng. 2014, 2014, 814593. [Google Scholar] [CrossRef]
- Glowacz, A. Diagnostics of DC and induction motors based on the analysis of acoustic signals. Meas. Sci. Rev. 2014, 14, 257. [Google Scholar] [CrossRef] [Green Version]
- Petruk, O.; Szewczyk, R.; Ciuk, T.; Strupiński, W.; Salach, J.; Nowicki, M.; Trzcinka, K. Sensitivity and offset voltage testing in the hall-effect sensors made of graphene. In Recent Advances in Automation, Robotics and Measuring Techniques; Springer: Cham, Switzerland, 2014; Volume 267. [Google Scholar] [CrossRef]
- Vasilev, B.Y. The study methods of increase efficiency algorithms pulse width modulation in AC electric drives. Int. J. Electr. Comput. Eng. 2016, 6, 2855. [Google Scholar] [CrossRef] [Green Version]
- Long, P.T.; Van An, N.; Vasilev, B. Compare the Efficiency of the Active Filter and Active Rectifier to Reduce Harmonics and Compensate the Reactive Power in Frequency Controlled Electric Drive Systems. In International Conference on Engineering Research and Applications; Springer: Cham, Switzerland, 2020; Volume 78, pp. 242–253. [Google Scholar] [CrossRef]
- Belsky, A.A.; Saint Petersburg Mining University; Dobush, V.S.; Haikal, S.F. Lebanese University Operation of a Single-phase Autonomous Inverter as a Part of a Low-power Wind Complex. J. Min. Inst. 2019, 239, 564–569. [Google Scholar] [CrossRef]
- Cardoso, A.J.M.; Saraiva, E.S. Computer aided detection of Airgap eccentricity in operating three phase induction motors by Park’s vector approach. IEEE Trans. Ind. Appl. 1993, 29, 897–901. [Google Scholar] [CrossRef]
- Zhukovskiy, Y.L.; Korolev, N.A.; Babanova, I.S.; Boikov, A. The probability estimate of the defects of the asynchronous motors based on the complex method of diagnostics. IOP Conf. Ser. Earth Environ. Sci. 2017, 87. [Google Scholar] [CrossRef]
- Jing, L.; Zhao, M.; Li, P.; Xu, X. A convolutional neural network based feature learning and fault diagnosis method for the condition monitoring of gearbox. Measurement 2017, 111, 1–10. [Google Scholar] [CrossRef]
- Thomson, W.T.; Fenger, M. Current signature analysis to detect induction motor faults. IEEE Ind. Appl. 2001, 7, 26–34. [Google Scholar] [CrossRef]
- Tino, P.; Benuskova, L.; Sperduti, A. Artificial neural network models. In Springer Handbook of Computational Intelligence; Springer: Berlin/Heidelberg, Germany, 2015; pp. 455–471. [Google Scholar] [CrossRef]
- Bounds, D.G.; Lloyd, P.J.; Mathew, B.G.; Waddell, G. A multilayer perceptron network for the diagnosis of low back pain. ICNN 1988, 2, 481–489. [Google Scholar] [CrossRef]
- Vasil’ev, B.Y.; Shpenst, V.A.; Kalashnikov, O.V. Providing energy decoupling of electric drive and electric grids for industrial electrical installations. J. Min. Inst. 2018, 229, 41. [Google Scholar] [CrossRef]
- Xiao, C.; Ye, J.; Esteves, R.M.; Rong, C. Using Spearman’s correlation coefficients for exploratory data analysis on big dataset. Concurr. Comput. Pract. Exp. 2016, 28, 3866–3878. [Google Scholar] [CrossRef]
- Rebekić, A.; Lončarić, Z.; Petrović, S.; Marić, S. Pearson’s or Spearman’s correlation coefficient-which one to use. Poljoprivreda 2015, 21, 47–54. [Google Scholar] [CrossRef]
- Abramovich, B.N. Uninterruptible power supply system for mining industry enterprises. J. Min. Inst. 2018, 229, 31. [Google Scholar] [CrossRef]
- Abramovich, B.N.; Veprikov, A.A.; Sychev, Y.A.; Lyakh, D.A. Use of active power transducers in industrial dc power systems supplying electrolysis cells. Tsvetnye Met 2020, 2, 95–100. [Google Scholar] [CrossRef]
- Turysheva, A.; Voytyuk, I.; Guerra, D. Estimation of Electricity Generation by an Electro-Technical Complex with Photoelectric Panels Using Statistical Methods. Symmetry 2021, 13, 1278. [Google Scholar] [CrossRef]
Figure 1.
Block diagram of the investigated electric drive. CS—closed switchgear; Tr—transformer; QF—circuit breaker; ATR—automatic transfer of reserve; AVS—automatic vacuum switch; FKD—filter-compensating devices; KM—magnetic contactor; M-asynchronous motor; P—pump.
Figure 1.
Block diagram of the investigated electric drive. CS—closed switchgear; Tr—transformer; QF—circuit breaker; ATR—automatic transfer of reserve; AVS—automatic vacuum switch; FKD—filter-compensating devices; KM—magnetic contactor; M-asynchronous motor; P—pump.

Figure 2.
Oscillograms for the output coordinates of the electric motor.

Figure 3.
Changes in the harmonic distortion coefficient KI and the coefficient of pulsation of the electromagnetic moment ΣKp for AM: (a) in normal state; (b) with phase-to-phase short circuit for winding of stator (at t = 1.4 s).
Figure 3.
Changes in the harmonic distortion coefficient KI and the coefficient of pulsation of the electromagnetic moment ΣKp for AM: (a) in normal state; (b) with phase-to-phase short circuit for winding of stator (at t = 1.4 s).

Figure 4.
Structural diagram of the system for assessing the probability of failure-free operation by diagnosed electrical and vibration AM parameters using ANN.
Figure 4.
Structural diagram of the system for assessing the probability of failure-free operation by diagnosed electrical and vibration AM parameters using ANN.

Figure 5.
Model of a formal neuron.

Figure 6.
Graph for probabilistic normal state of the unit.

Figure 7.
Graph for probabilistic pre-crisis state of the unit.

Figure 8.
Graph for probabilistic crisis state of the unit.


Table 1.
Monitored parameters of asynchronous motors.
| Parameters | |||
|---|---|---|---|
| Electrical | Vibration | Indirect | |
| Registered | 1. Instantaneous current values in each phase (I, Ist) | 1. Instantaneous vibration displacement values (axial sx, horizontal sy, vertical sz) | 1. Average ambient temperature (T) |
| 2. Instantaneous voltage values in each phase (U, Ust) | 2. Instantaneous values of vibration velocity (axial vx, horizontal vy, vertical vz) | 2. Humidity (ρ) | |
| 3. Instantaneous power values in each phase (P, S) | 3. Instantaneous values of vibration acceleration (axial ax, horizontal ay, vertical az) | 3. Insulation durability (ξ) | |
| 4. Reducer speed (vr(t)) | |||
| 5. Executive body speed (vi(t)) | |||
| Calculated/statistical/repair | 1. Current RMS in each phase | 4. Vibration displacement RMS | |
| 2. Voltage RMS in each phase | 5. Vibration velocity RMS | ||
| 3. Power RMS in each phase | 6. Vibration acceleration RMS | ||
| 4. Current spectra of each phase | 7. Spectrum of vibration displacement | ||
| 5. Power spectra of each phase | 8. Spectrum of vibration velocity | ||
| 6. Power factor | 9. Spectrum of vibration acceleration | ||
| 7. Power loss value | 10. Fundamental harmonic power | ||
| 8. Voltage unbalance coefficients | |||
Table 2.
Values of defect probability in terms of electrical and vibration parameters at different stages of its operation.
Table 2.
Values of defect probability in terms of electrical and vibration parameters at different stages of its operation.
| Defects | mi i: | hi i: | Probability | ||||
|---|---|---|---|---|---|---|---|
| Normal State | Pre-Crisis state | Crisis State | According to Factory Data | Actual State | |||
| Damage of phase-to-phase insulation | 1 | 0.12 | 0.2 | 0.28 | 0.1 | 0.16 | |
| Turn-to-turn short circuit | 2 | 0.1 | 0.18 | 0.26 | 0.09 | 0.3 | |
| Short circuit in the stator winding | 3 | 0.12 | 0.2 | 0.28 | 0.1 | 0.12 | |
| Bearing damage | 1 | 0.1 | 0.18 | 0.26 | 0.09 | 0.17 | |
| Rotor damage | 2 | 0.12 | 0.2 | 0.28 | 0.1 | 0.16 | |
| Dynamic eccentricity | 4 | 3 | 0.12 | 0.2 | 0.28 | 0.1 | 0.3 |
| Static eccentricity | 5 | 4 | 0.12 | 0.2 | 0.28 | 0.1 | 0.3 |
| Non-sinusoidal supply voltage | 6 | 0.12 | 0.2 | 0.28 | 0.1 | 0.14 | |
| Rotor mass unbalance | 5 | 0.2 | 0.28 | 0.36 | 0.14 | 0.18 | |
| Mechanical loosening of the coupling | 6 | 0.12 | 0.2 | 0.28 | 0.1 | 0.22 | |
| Shaft misalignment | 7 | 0.1 | 0.18 | 0.26 | 0.09 | 0.14 | |
Table 3.
Assessment levels of AM lifecycle.
| Lifecycle Indicator δ | Technical Condition Characteristics | Operation Permission |
|---|---|---|
| 0 < δ ≤ 0.1 | “reference” state, no effect on performance | Permitted |
| 0.1< δ ≤ 0.2 | “normal” state, impact on performance is insignificant | Permitted |
| 0.2 < δ ≤ 0.4 | “pre-crisis” state, requires integrated diagnostics with set periods, reducing the load on the unit | Permitted with integrated diagnostics |
| 0.4 < δ ≤ 1 | “crisis” state, high probability of failure, equipment is sent for repair | Not permitted |
Publisher’s Note: MDPI stays neutral with regard to jurisdictional claims in published maps and institutional affiliations. |
© 2021 by the authors. Licensee MDPI, Basel, Switzerland. This article is an open access article distributed under the terms and conditions of the Creative Commons Attribution (CC BY) license (https://creativecommons.org/licenses/by/4.0/).
Share and Cite
MDPI and ACS Style
Korolev, N.; Kozyaruk, A.; Morenov, V. Efficiency Increase of Energy Systems in Oil and Gas Industry by Evaluation of Electric Drive Lifecycle. Energies 2021, 14, 6074. https://0-doi-org.brum.beds.ac.uk/10.3390/en14196074
AMA Style
Korolev N, Kozyaruk A, Morenov V. Efficiency Increase of Energy Systems in Oil and Gas Industry by Evaluation of Electric Drive Lifecycle. Energies. 2021; 14(19):6074. https://0-doi-org.brum.beds.ac.uk/10.3390/en14196074
Chicago/Turabian StyleKorolev, Nikolay, Anatoly Kozyaruk, and Valentin Morenov. 2021. "Efficiency Increase of Energy Systems in Oil and Gas Industry by Evaluation of Electric Drive Lifecycle" Energies 14, no. 19: 6074. https://0-doi-org.brum.beds.ac.uk/10.3390/en14196074
Note that from the first issue of 2016, this journal uses article numbers instead of page numbers. See further details here.