Article

Sensitivity of Reservoir and Operational Parameters on the Energy Extraction Performance of Combined CO2-EGR–CPG Systems

1
Geothermal Energy and Geofluids Group, Department of Earth Sciences, ETH Zurich, Sonneggstrasse 5, 8092 Zurich, Switzerland
2
Hydromechanics Group, Helmut Schmidt University, Holstenhofweg 85, 22043 Hamburg, Germany
3
Department of Earth and Environmental Sciences, University of Minnesota, 116 Church Street SE, Minneapolis, MN 55405, USA
*
Author to whom correspondence should be addressed.
Submission received: 31 August 2021 / Revised: 17 September 2021 / Accepted: 22 September 2021 / Published: 26 September 2021
(This article belongs to the Special Issue Energy Efficiency, Low Carbon Resources and Renewable Technology)

Abstract

:
There is a potential for synergy effects in utilizing CO2 for both enhanced gas recovery (EGR) and geothermal energy extraction (CO2-plume geothermal, CPG) from natural gas reservoirs. In this study, we carried out reservoir simulations using TOUGH2 to evaluate the sensitivity of natural gas recovery, pressure buildup, and geothermal power generation performance of the combined CO2-EGR–CPG system to key reservoir and operational parameters. The reservoir parameters included horizontal permeability, permeability anisotropy, reservoir temperature, and pore-size-distribution index; while the operational parameters included wellbore diameter and ambient surface temperature. Using an example of a natural gas reservoir model, we also investigated the effects of different strategies of transitioning from the CO2-EGR stage to the CPG stage on the energy-recovery performance metrics and on the two-phase fluid-flow regime in the production well. The simulation results showed that overlapping the CO2-EGR and CPG stages, and having a relatively brief period of CO2 injection, but no production (which we called the CO2-plume establishment stage) achieved the best overall energy (natural gas and geothermal) recovery performance. Permeability anisotropy and reservoir temperature were the parameters that the natural gas recovery performance of the combined system was most sensitive to. The geothermal power generation performance was most sensitive to the reservoir temperature and the production wellbore diameter. The results of this study pave the way for future CPG-based geothermal power-generation optimization studies. For a CO2-EGR–CPG project, the results can be a guide in terms of the required accuracy of the reservoir parameters during exploration and data acquisition.

1. Introduction

The effects of global warming on the environment (including sea-level rise, extreme weather conditions etc.) are on the rise due to anthropogenic emissions of greenhouse gases, namely carbon dioxide (CO2). The development and use of clean, low-carbon, energy-efficient technologies and renewable energy sources are ways of reducing such emissions. To this effect, the technology known as carbon capture and storage (CCS), which features the capture of CO2 from flue gases of power plants (and other large CO2-emitting industrial plants) that are then stored in suitable, carefully selected geological formations, is one of the technologies that can contribute to achieving net-zero CO2 emissions [1,2,3].
The coupling of CCS to the industrial utilization of the captured CO2, termed carbon capture, utilization, and storage (CCUS) can reduce its costs. Depleted gas reservoirs are considered one of the prime candidates for the storage of CO2 due to the integrity and safety benefits that such sites provide. CO2 injection into partially depleted or depleted natural gas reservoirs can enhance the production of the gas (enhanced gas recovery, EGR), which is a typical example of combining CO2 utilization and storage.
CO2 injection into natural gas reservoirs was studied for CO2 storage and EGR [4,5,6,7]. Published studies on the injection of CO2 into depleted gas reservoirs with the purpose of improving gas recovery and storing CO2 go as far back as three decades [8,9]. Examples of pilot projects of CO2 injection into depleted natural gas reservoirs include the CO2-EGR project in the Budafa Szinfelleti field in Hungary [10,11]; the CO2-EGR and CO2 storage project in the K12-B depleted gas field in the Netherlands [12,13]; and the CLEAN project in the Altmark gas field in Germany [14,15,16]. Feasibility studies (numerical simulations and laboratory experiments) of CO2-EGR in natural gas reservoirs were carried out using geological data from gas fields in different countries including the Netherlands [7,12,13], USA [17,18,19], Germany [14,15,16,20,21], Italy [22], Austria [6,23,24], Australia [25,26], and China [27,28]. Results from various studies showed that significant amounts of additional natural gas can be recovered through CO2-EGR [4,7,21,26].
Geothermal energy development is one of the promising renewable energy options [29,30,31]. It was also proposed that using supercritical carbon dioxide (scCO2), in place of the traditional water or brine, as the subsurface heat-transmission working fluid to develop geothermal energy, comes with added benefits [32,33,34,35]. Due to the favorable heat-extraction properties of CO2 (i.e., high thermal expansivity and low kinematic viscosity) compared to subsurface water/brine, low- and medium-enthalpy geothermal reservoirs can be utilized more efficiently when employing supercritical CO2 as the subsurface working fluid than when water/brine is used.
CO2-based geothermal power generation was initially considered for enhanced geothermal systems (EGS) [32,34,36,37], which involves hydraulically stimulating (fracturing or shearing) crystalline rocks to create flow paths for the injected CO2. However, EGS comes with the disadvantages of limited spatial extent, and thus a rather limited energy resource, and induced seismicity [38,39]. Over the last decade, the concept of CO2 plume geothermal (CPG), which involves injecting CO2 into sedimentary reservoirs (for example deep aquifers or hydrocarbon reservoirs) overlain by a low-permeability caprock, was featured more prominently in research [35,40,41,42,43,44,45,46,47,48,49]. During CPG, the injected CO2 is circulated back to the land surface and used to generate power in a CO2 turbomachinery. The produced CO2 is reinjected, and all the injected CO2 is permanently stored in the same reservoir. CPG is thus an example of a CCUS system.
The above research on CPG has thus far focused on deep saline formations as CPG-host reservoirs. However, refs. [45,50] have investigated natural gas reservoirs as CPG hosts. We have presented, in ref. [45], the potential for extracting heat from produced natural gas and utilizing scCO2 as a subsurface working fluid for the dual purpose of enhancing gas recovery (CO2-EGR) and extracting geothermal energy (CPG) from deep, hot natural gas reservoirs for electric power generation, while ultimately storing all of the subsurface-injected CO2. We refer to this as a combined CO2-EGR–CPG system. The advantages associated with this combined system were discussed in detail in refs. [45,51]. Some of these main advantages include:
(i)
The combined system exhibits less pore-water influence (due to the presence of residual natural gas), potentially reducing the resistance to flow of the CO2 in the reservoir. It may also reduce the extent of unwanted geochemical CO2-rock-brine interaction, such as salt precipitation;
(ii)
Additional natural gas and geothermal energy are extracted for power generation, which leads to an increase in the gas field’s total amount of producible energy;
(iii)
The natural gas-based power generation would likely be operated with CCS, providing the CO2 for the EGR and CPG operations;
(iv)
Economic (cost-saving) benefits are achieved by using/sharing already-existing multidisciplinary datasets (on reservoir parameters) and infrastructure (surface facilities, wells etc.). Hence, investment costs are significantly reduced;
(v)
The combined system extends the useful lifetime of the gas reservoir, recovering otherwise stranded assets, such as wells, offshore platforms etc., thereby postponing the expensive decommissioning phase of the wells and abandonment stages of the gas field.
Different stages were identified for energy (and power) generation from the combined system (see also ref. [45]). The first stage is the conventional natural gas recovery (CNGR) stage. Here, natural gas is produced by the primary-recovery drive. Heat is extracted from the natural gas at the surface and converted to power using an organic Rankine cycle (ORC) or a CO2-based Rankine cycle (CRC). The CNGR stage is followed by the CO2-EGR stage when the fluid pressure or natural gas is depleted and the remaining natural gas cannot be economically recovered by just the natural primary drive. CO2 is injected into the reservoir to recover the remaining natural gas and reduce the residual methane content in the reservoir. The associated heat in the produced and remaining natural gas is extracted and converted to power as described above. At some point during the CO2-EGR stage, CO2 breakthrough occurs in the production well. Hence, the installation of a methane-CO2 separator is required at the surface.
A transition period (TP) exists at the end of the CO2-EGR stage. It is the period when the mass fraction of CO2 in the produced fluid is greater than 10% and less than 90%. We assume that the separation of the produced mixed fluid is necessary. The separation process of CO2 and methane (CH4) is cost- and energy-intensive, requiring higher energy input than the geothermal power generated during the CO2-EGR stage. The longer this transition period lasts, the higher the parasitic power required to separate the mixed fluid at the surface.
Ref. [45] described a CO2-plume establishment (PE) stage, where the production well is shut-in and CO2 injection is continued to charge the reservoir with CO2 and establish a CO2 plume between the injection and the production wells. The PE stage can come before or after the CO2-EGR stage (the latter is the case in the simulations shown later), depending on the operational strategy.
After these stages, the CPG stage commences and all produced fluid (mostly CO2) is sent to the CO2 turbine for direct-CPG [41,43,44] power generation. The CO2 leaving the turbine is further cooled and reinjected into the reservoir. When the reservoir heat is depleted, after decades as shown in refs. [41,44], the CPG-based injection and production wells are shut down and the injected CO2 is permanently stored in the natural gas reservoir.
In this study, we used a similar anticlinal natural gas reservoir model, as described in ref. [45], to carry out reservoir simulations in TOUGH2 [52,53], aimed at expanding the previous study on the combined CO2-EGR–CPG system to:
(i)
Accommodate lessons learned from ref. [54], including that the bottom-hole production flowrate directly influences how much water enters the production well and that the two-phase (water/CO2) flow regime in the production well is an important design parameter;
(ii)
Determine the effect of the residual CH4 content of the reservoir and the effect of the CO2-plume-establishment stage on the performance of the combined system, as quantified by the amount of natural gas recovery, fluid-pressure buildup, and electric power generation;
(iii)
Determine the sensitivity of the performance metrics mentioned in (i) and (ii) to various important reservoir and operational (non-reservoir) parameters.
Hence, this work provides a preliminary guide for an effective implementation strategy of the combined CO2-EGR–CPG system. The sensitivity study provides information necessary for the optimization of such a system.

2. Methodology

In this section, we describe the natural gas model, numerical simulation, and performance metrics used for this study. We report the changes we made to the original natural gas reservoir model (presented in ref. [45]) and the implementation strategy/concept of the combined system for effective natural gas and geothermal energy extraction from the natural gas reservoir. We describe the numerical model we used to simulate the three main stages (CNGR, CO2-EGR+TP, and CPG stages) associated with the combined system. Finally, we explain how the sensitivity study was conducted.

2.1. Reservoir Modeling and Simulation

2.1.1. Reservoir Model

Using the reservoir properties from some examples of hot/deep natural gas fields around the world, we set up a similar natural gas reservoir to that of our previous study (see ref. [45]), in terms of model geometry, well configuration, boundary conditions, and relative permeability functions. However, the fluid properties of the current model were updated, such that the salt concentration changed from zero in the previous model to 150,000 ppm in the current model. Furthermore, the y-axis dimension of the full model was extended from the previous 3 km to 4.5 km, so that the updated model had equal dimensions on all sides. We also introduced a horizontal-to-vertical permeability anisotropy of kh/kv = 2 in the base-case model. We conducted our simulations using the same reservoir simulator, TOUGH2 with the EOS7C module, developed for simulating gas and brine flow as well as heat transport in (natural gas) reservoirs [52,53]. The rock and fluid properties of the new model, as well as the initial conditions, are summarized in Table 1. Note that the model comprised of two fluid phases: brine and gas. The gas phase may contain CO2 and/or CH4.

2.1.2. Reservoir Simulation Schemes

Based on the model of the combined CO2-EGR-CPG described above, the numerical simulations were carried out in three main stages:
  • The CNGR stage with a base-case duration of 25 years at a production flowrate of 4 kg/s/well;
  • The CO2-EGR stage with all simulated cases lasting for 1 year with a high injection-production flowrate ratio [45,51] (i.e., injection flowrate of 30 kg/s/well and production flowrate of 4 kg/s/well). The high injection-production flowrate ratio is beneficial for achieving a good CO2-EGR performance as well as a short duration for establishing an adequate CO2-plume reservoir [51]. After the 1 year period of high injection-production flow-rate ratio, the production rate was increased to 30 kg/s/well (equal to the injection flowrate). The CO2-EGR stage ended when the mass fraction of CO2 (XCO2) at the production-well region reached 90%. In this study, we considered some cases that were associated with 1.5 years of the CO2-plume establishment (PE) stage after the 1 year CO2-EGR stage. After the PE stage, the transition period, which involves CO2-CH4 separation, continued till 90% CO2 mass fraction (in the gas phase) was reached at the production well region;
  • Finally, the CPG stage, where the base-case CPG-stage duration was 30 years at a circulation flowrate of 30 kg/s/well.

2.2. Performance Metrics

In this section, we present how we calculated the metrics used to measure the energy-extraction performance for the different cases considered in this study. These metrics included:
(a)
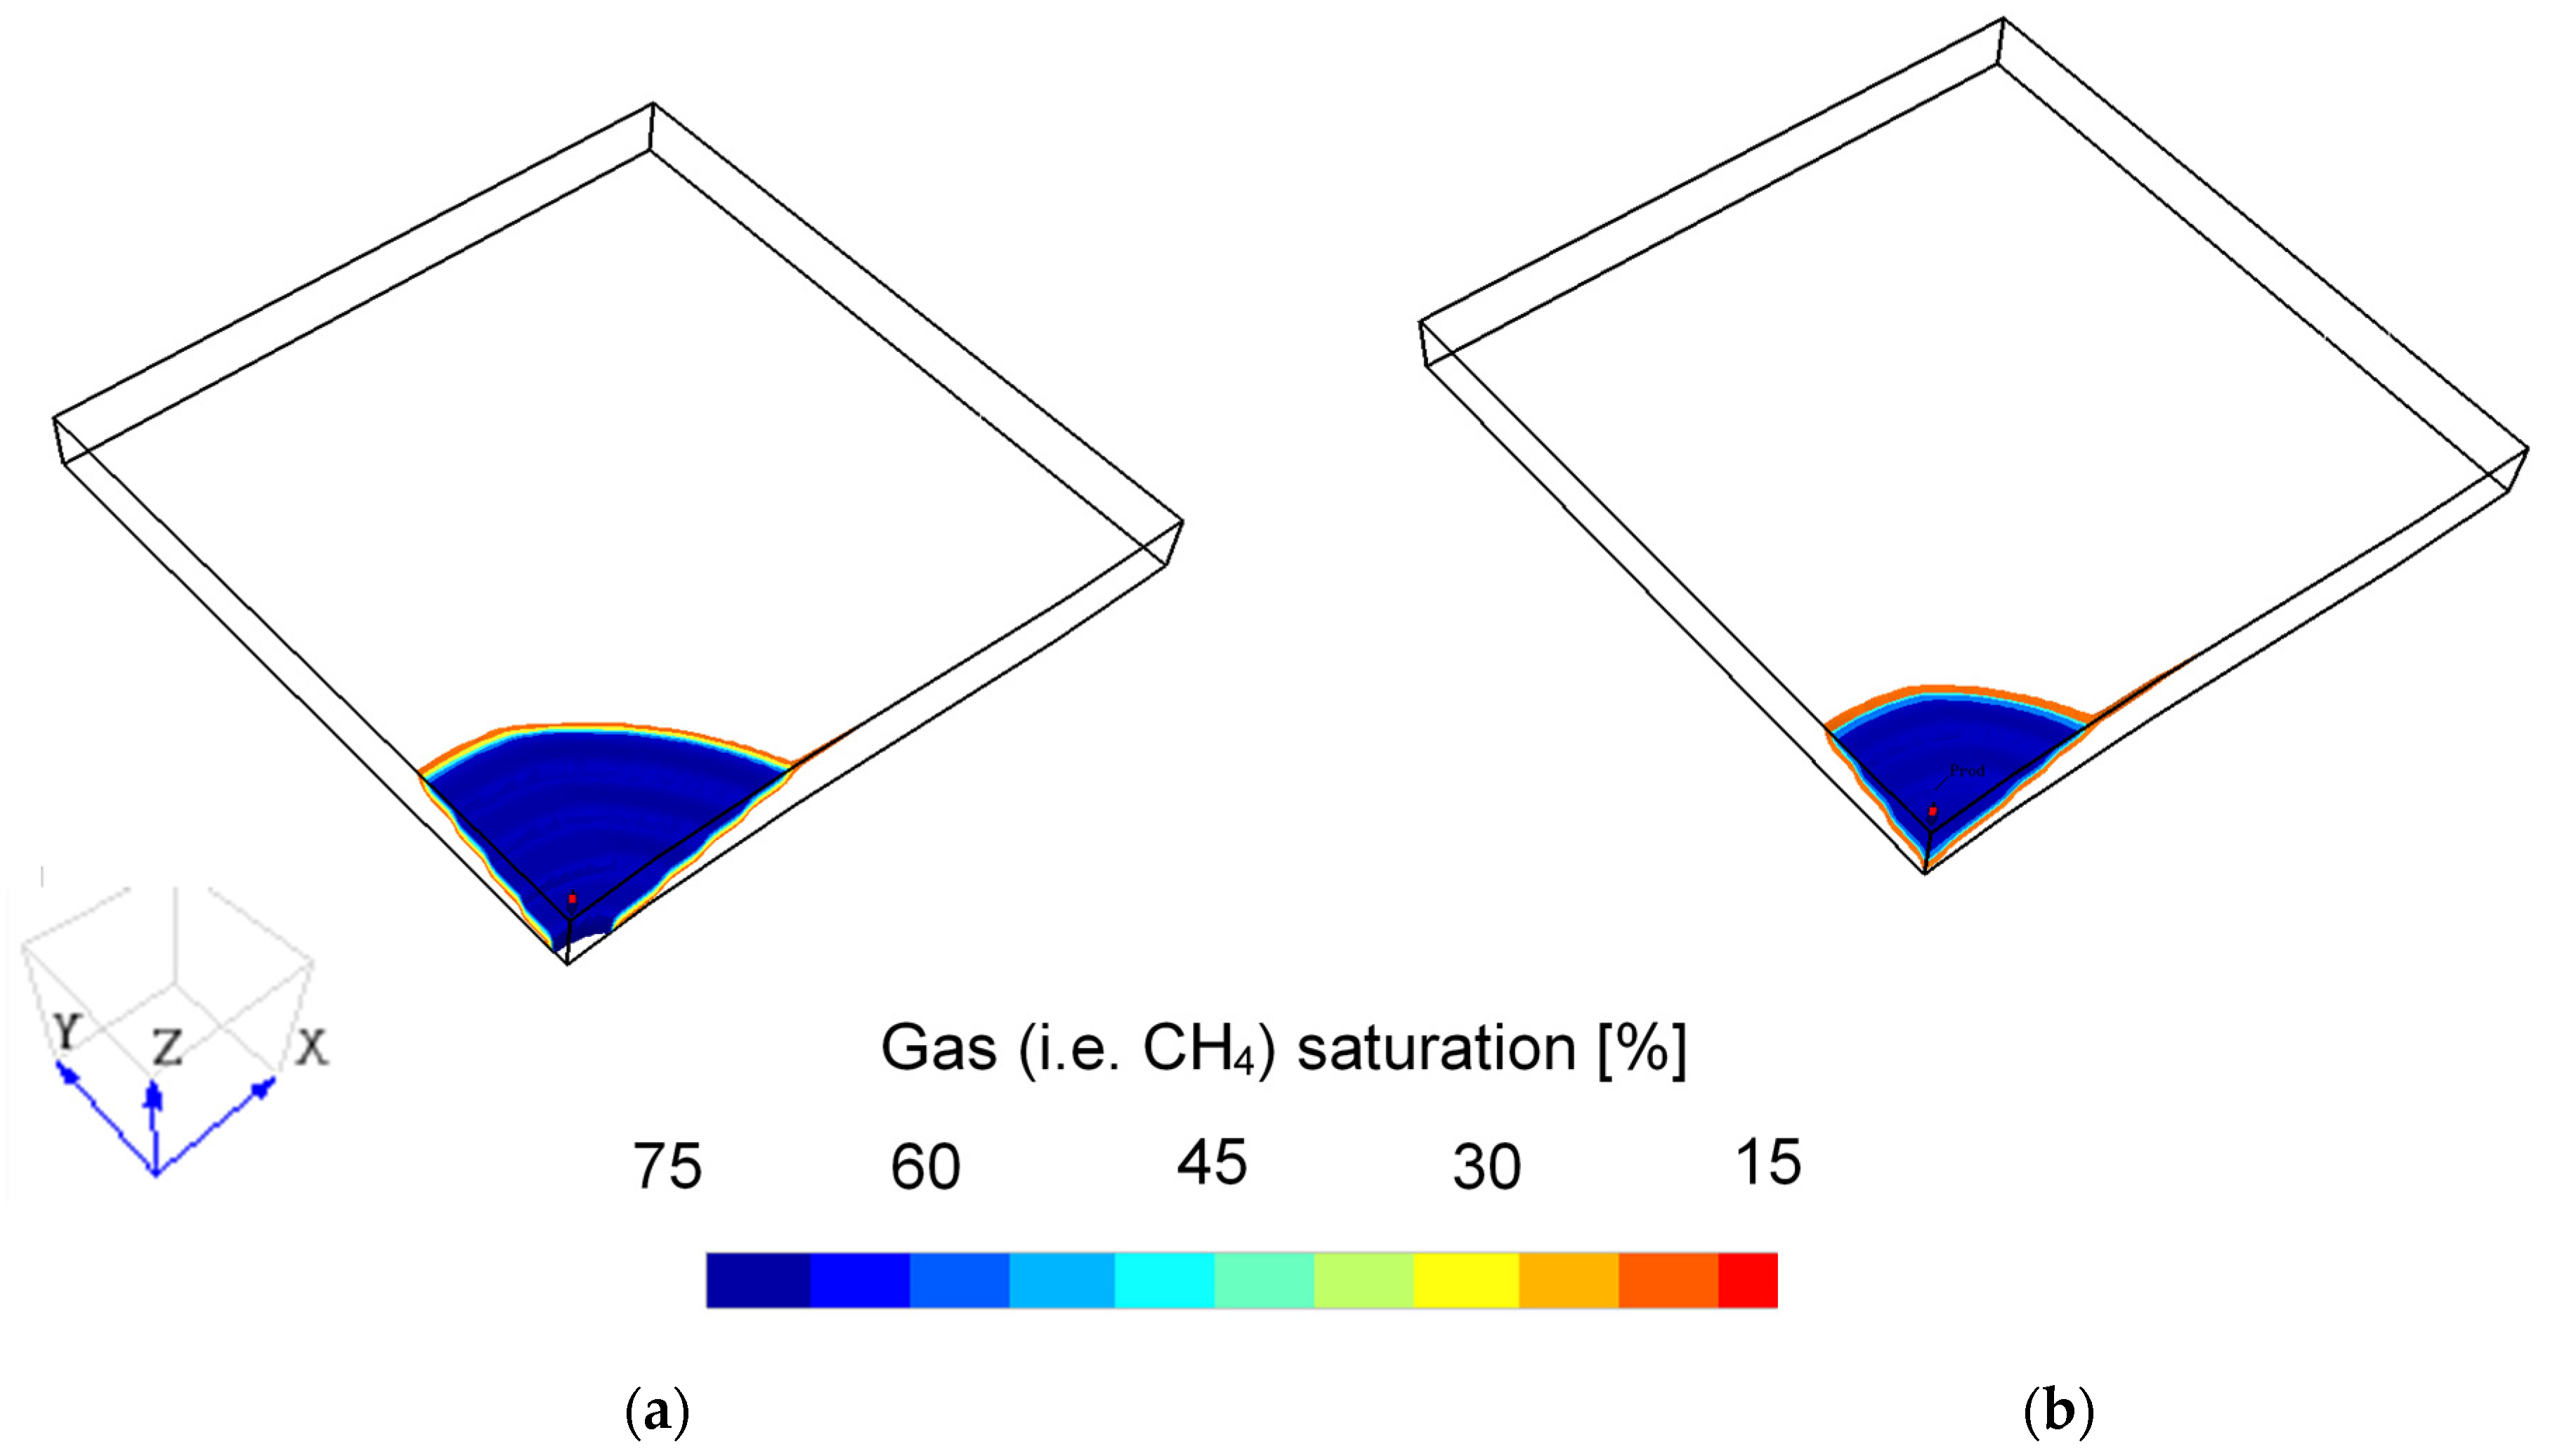
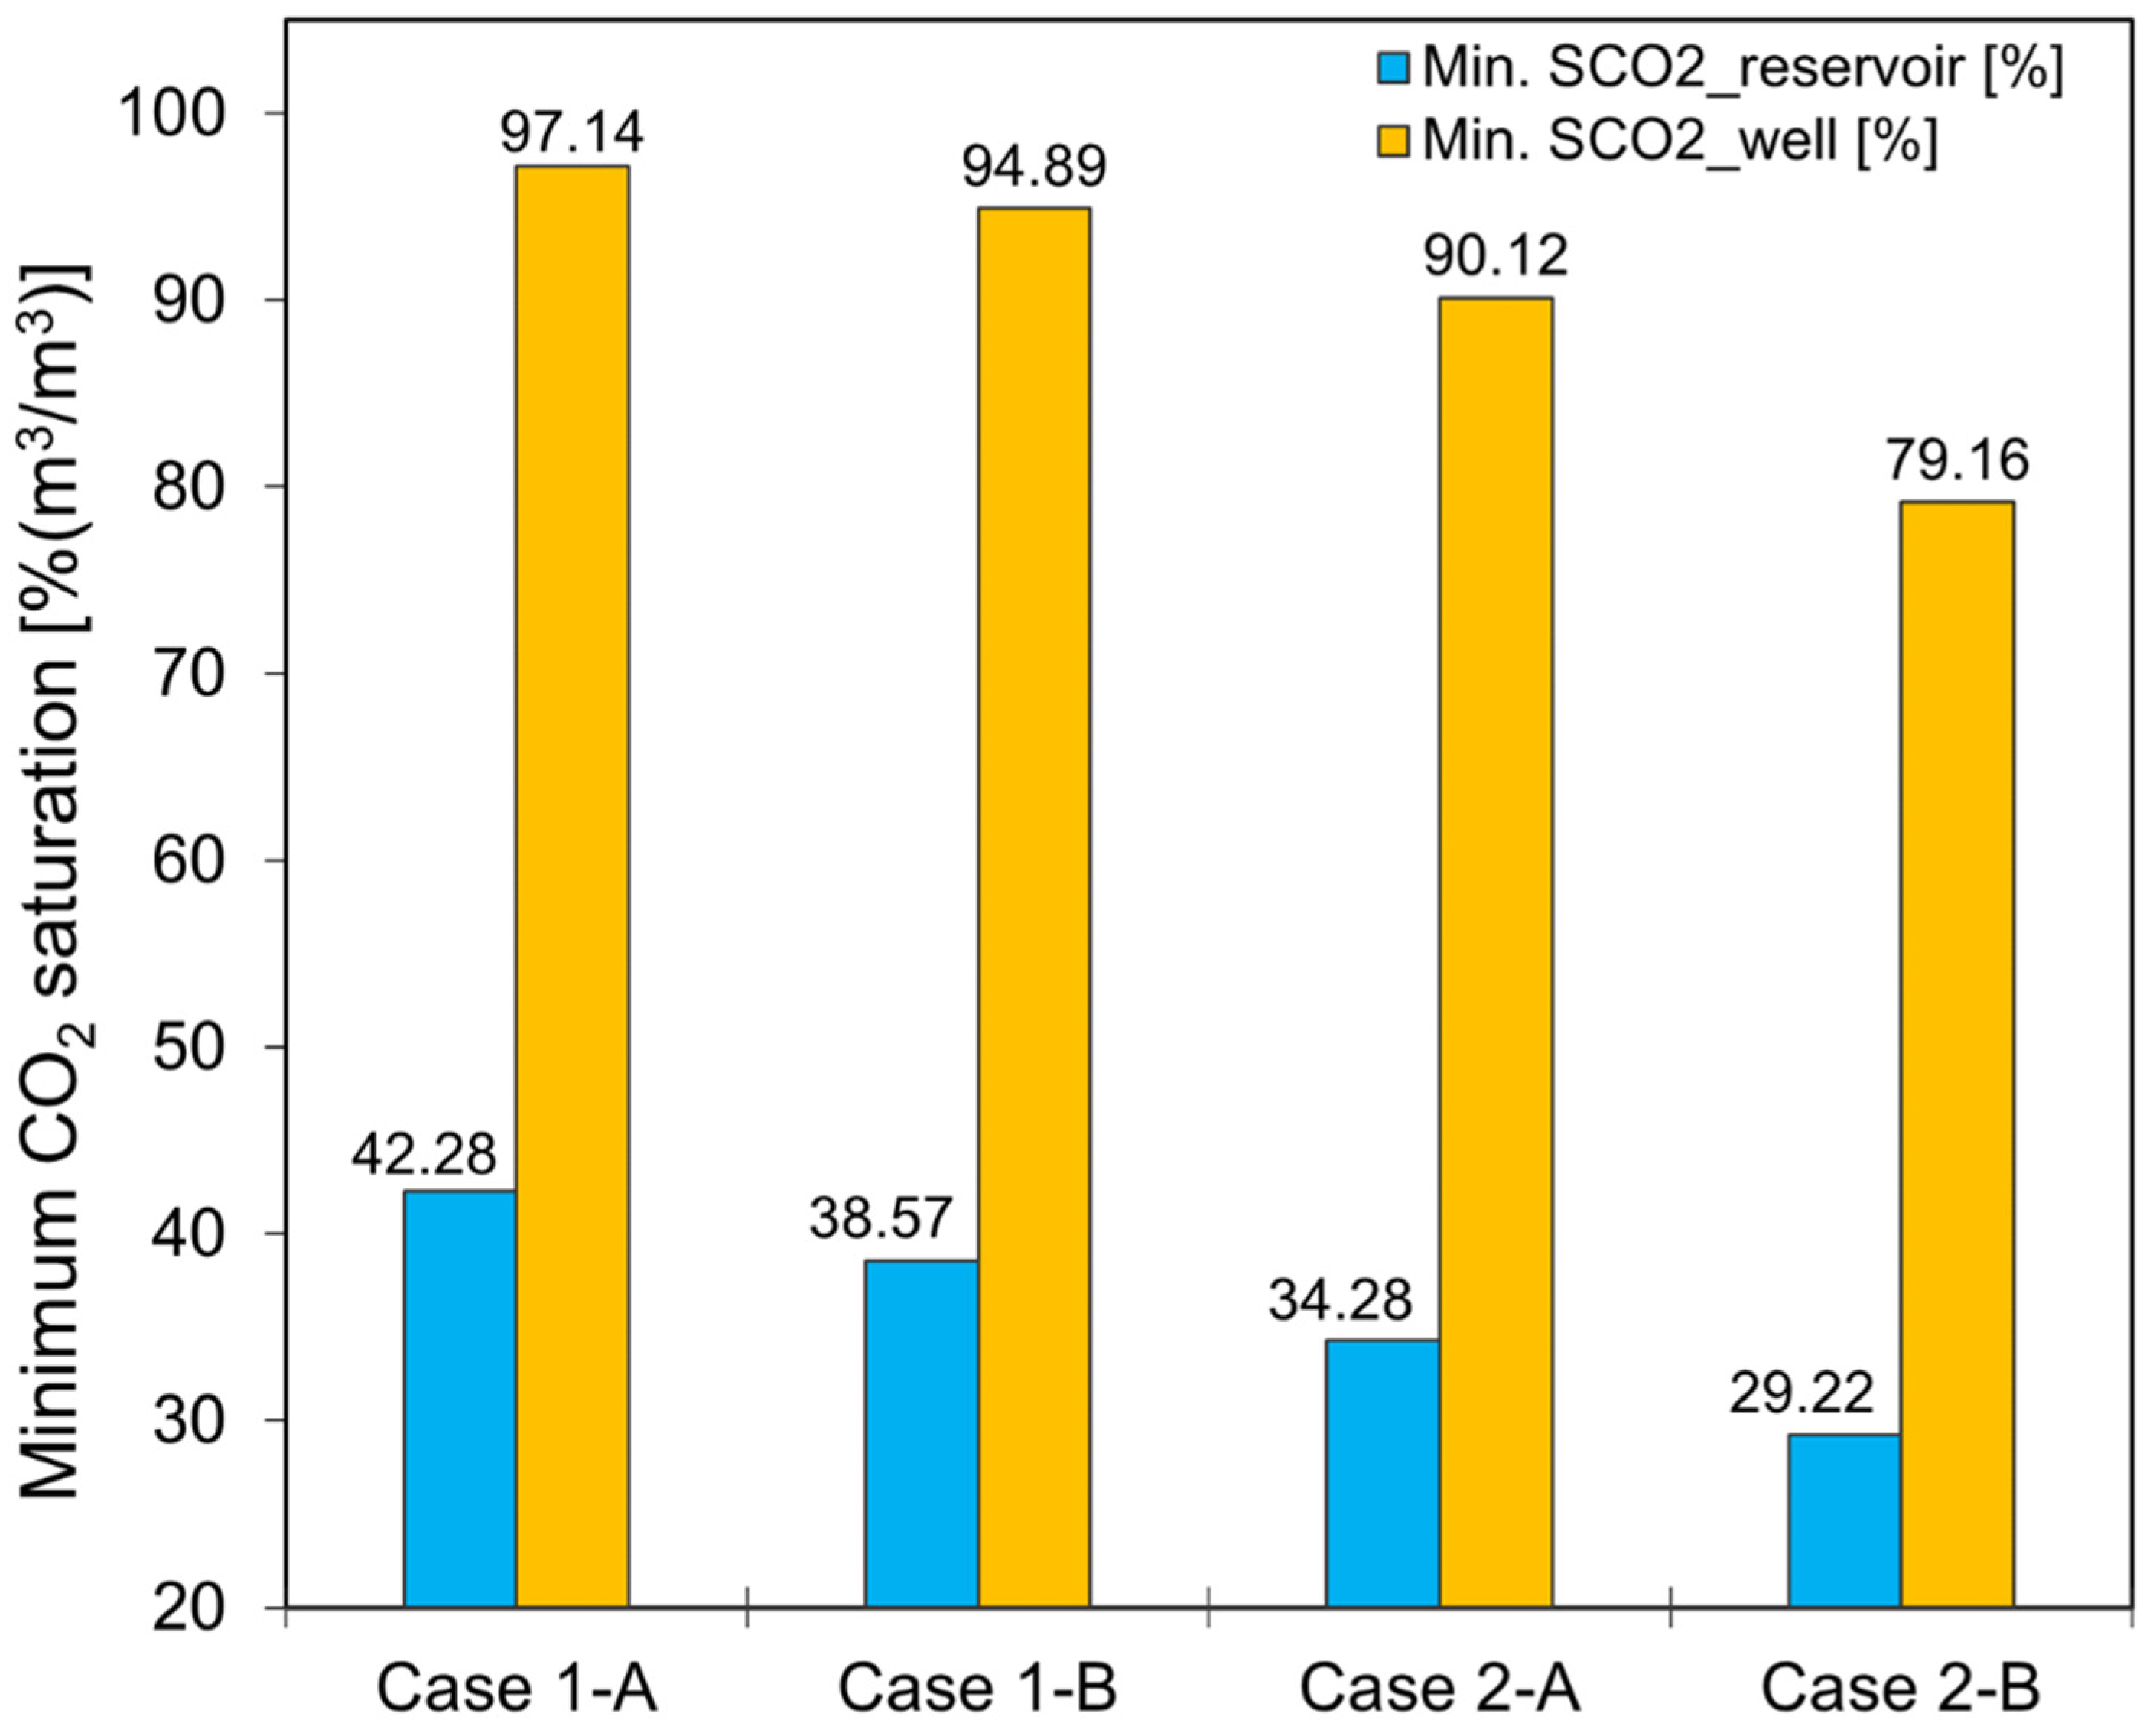
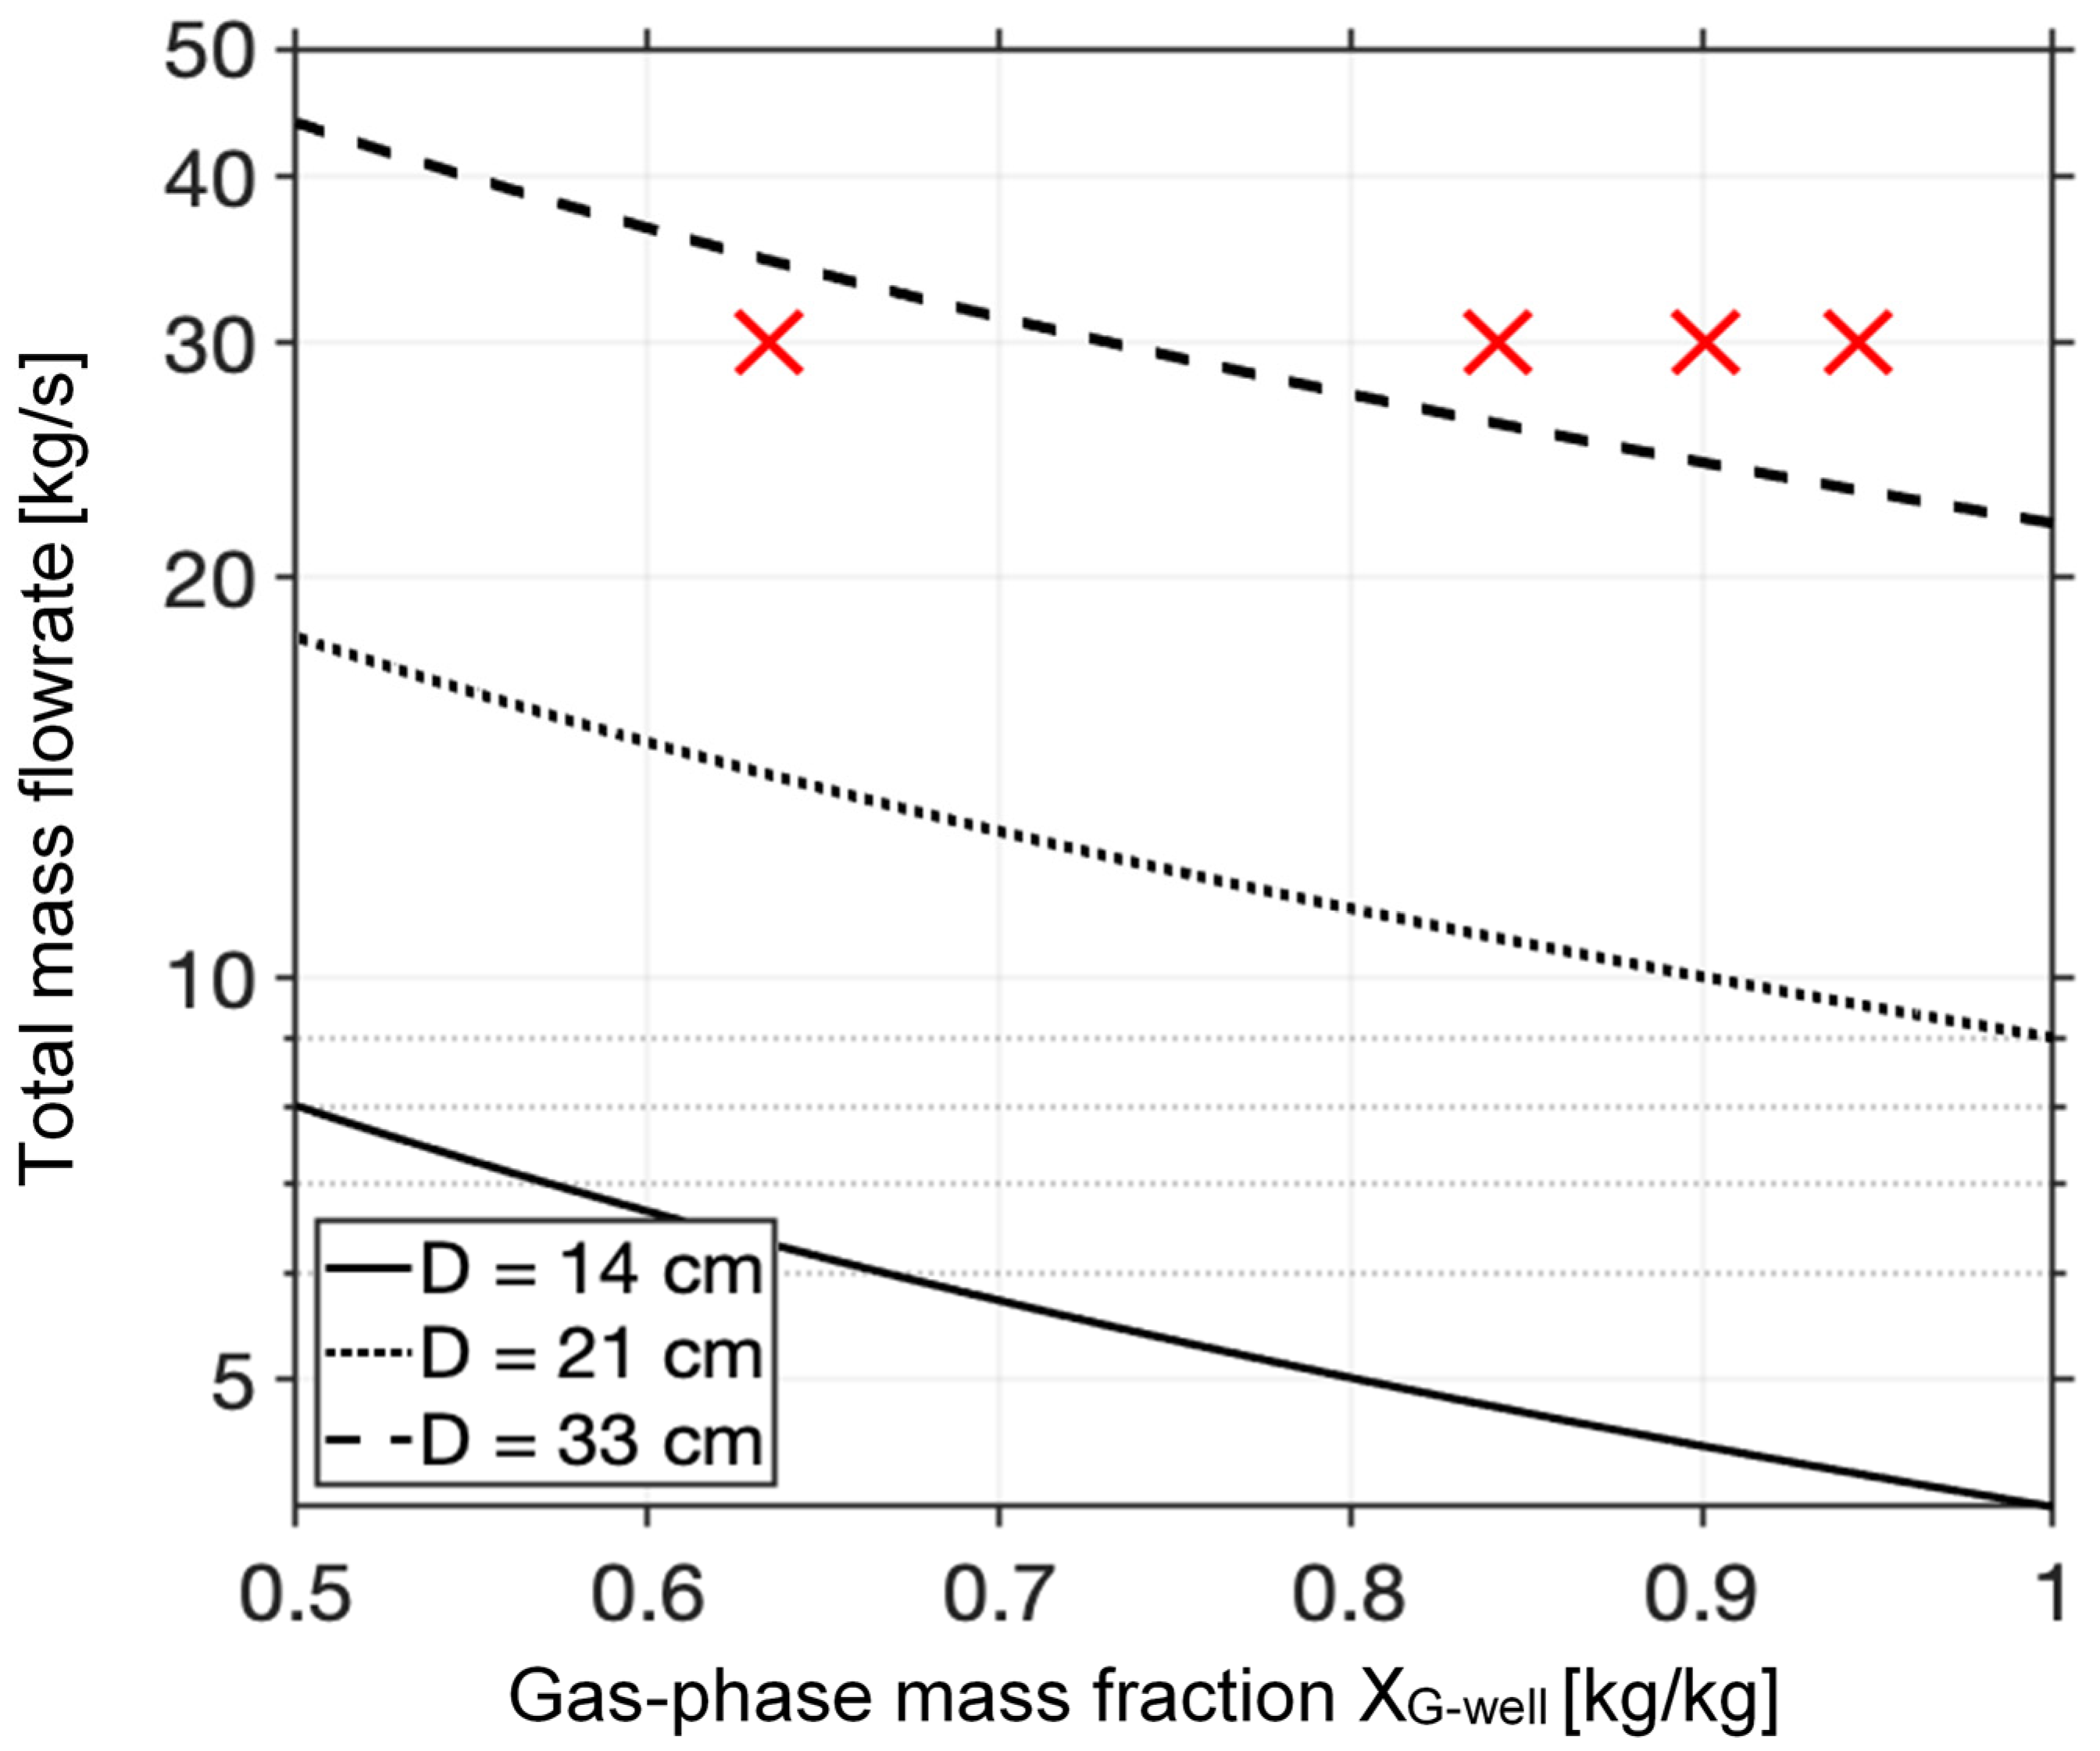
The CO2 saturation (in the reservoir and in the production well), and the corresponding flow regime established (at the bottom-hole section of the production well) at the time of the highest water saturation around the production-well inlet region of the reservoir (ref. [45]). This performance metric was only applicable for the reservoir parameters, and it can be used to determine the importance of the PE stage for the combined system to achieve an annular flow regime (dominant CO2 flow) in the production well. The method to calculate this metric, using the gas saturation in the well and flowrate, can be found in ref. [54];
(b)
The natural gas recovery performance (NGRP), which incorporates the amount of natural gas recovered (in terms of natural gas recovery factor) and the duration of the CNGR and CO2-EGR stages (including the transition period, TP). This implies that the duration of natural gas recovery also includes the time of CH4-CO2 separation at the land surface. The natural gas recovery factor during the CNGR and CO2-EGR stages can be measured as a percentage of the original gas in place (OGIP). These respective factors are calculated as:
CNGR   factor ,   F CNGR   ( % ) = V g CNGR OGIP · 100 ,
where V g CNGR is the volume of gas produced during the CNGR stage, and OGIP is the volume of gas initially in place,
EGR   factor ,   F EGR   ( % ) = V g EGR OGIP · 100 ,
where V g EGR is the volume of gas produced during the CO2-EGR stage,
Ultimate   recovery   factor ,   F UR   F CNGR + F EGR
The volumes of the produced gas during the CNGR and CO2-EGR stages can be obtained from the TOUGH2 simulation output files.
The natural gas recovery performance was measured using a natural gas recovery index (RI), which is calculated as the ultimate recovery factor [%] divided by the sum of the durations of the CNGR stage, t CNGR [year] and CO2-EGR+TP stage, t EGR [year] (Equation (4)).
RI   ( % / year ) = F UR ( t CNGR + t EGR + TP ) .
The recovery index provides a way to select the best reservoir parameters and strategies that favor natural gas recovery and a shorter duration of the CO2-CH4 separation. The shorter this transition period is, the higher the energy efficiency of the combined system. Hence, a high value of RI is favorable;
(c)
The pressure buildup at the injection wells was one of the performance metrics considered for the combined system. It can compromise the integrity of the caprock overlying the natural gas reservoir. The non-dimensional pressure buildup (PBU) metric, used in this study, compares the maximum pressure in the injection well, P wb max , to the initial reservoir pressure, P 0 , as shown in Equation (5).
PBU = P wb max P 0 P 0
P wb max can be calculated by using Equation (6) from ref. [52].
P w b m a x = P G max + q G μ G k r G ρ G I I
where I I is the injectivity index, calculated as
I I = 2 π k d z In ( r e / r w ) 3 / 4
P G m a x is the average of the maximum pressures in the injection grid cells of the two injection wells. The perforation layer thickness, d z , is 20 m, the well radius, r w , is 0.07 m, and the effective gridblock radius, r e = A / π . Here, A is the grid block area, which is 100 m2. The q G is the CO2 mass flowrate [kg/s], k r G is the relative permeability [-], and ρ G and μ G are the density [kg/m3] and the dynamic viscosity [Pa·s] of the gas (i.e., CO2) phase, respectively;
(d)
The average net geothermal electricity (measured in gigawatt-hours [GWeh]) generated using the produced natural gas (via the organic/CO2-based Rankine cycle) during the CNGR, Q CNGR , and EGR, Q EGR , stages and from the produced CO2 (via the direct CO2 turbomachinery) during the direct-CPG stage, Q CPG . The average net power generated was calculated using the output wellhead temperature and pressure results obtained from the wellbore heat transfer model described in ref. [45]. The power system models applied in this study for the indirect and direct CO2 turbomachinery power systems were extensively described in ref. [43] and ref. [45].

2.3. Sensitivity Analysis of the Performance Metrics

2.3.1. Residual Methane Content and CO2-Plume Establishment Stage

In our simulations, the residual CH4 content was accounted for in the simulations using two main cases: case 1 (base case) and case 2, which considered the CNGR stage for 25 years and 26 years, respectively (Table 2). This implies that case 2 had a lower residual CH4 content than case 1 (Figure 1). Case 2 was equivalent to the example case presented in ref. [45]. Case 2 is an example of a depleted reservoir, while case 1 is an example of a partially depleted natural gas reservoir because it had a higher proportion of the residual CH4 in the reservoir after the CNGR stage. These two cases were further classified into four sub-cases to represent cases with and without the 1.5 years of the CO2-plume establishment (PE) stage. Cases 1-A and 2-A considered the 1.5 years of the PE stage, whereas cases 1-B and 2-B did not consider the PE stage (Table 2). This enabled us to investigate the effects of the PE stage on the production performance of the combined system in terms of ensuring annular flow in the production well, and in reducing the duration of the “expensive” transition period. The corresponding effects of these four sub-cases on the minimum CO2 saturation in the well, natural gas recovery (during the CNGR and CO2-EGR stages–including the transition period), the geothermal energy generation (during the three stages), and performance metrics were also evaluated and discussed in this study (in Section 3.1).

2.3.2. Reservoir and Operational Parameters

We varied some key reservoir and operational (non-reservoir) parameters in a fixed range of ±5%, as compared to the base-case conditions (presented in Table 1), to investigate the sensitivity of the performance metrics of the combined system described in Section 2.2 to these parameters. The reservoir parameters (and their respective base-case values) that were studied include permeability (100 mD), anisotropy kh/kv (2.0 [-]), relative permeability (van Genuchten parameter of 0.77 [-]), and initial temperature (120 °C). The operational parameters (and their respective base-case values) that were studied include well diameter (0.14 m) and average ambient surface temperature (15 °C). These base-case values corresponded to the values chosen for the reservoir example presented in ref. [45], except the reservoir initial temperature (150 °C was chosen in our previous study).
The simulations for each of the reservoir and operational parameter spaces considered in this study were run for a duration of 25 years for the CNGR stage and without considering the PE stage. The simulation results (high and low bounds) of the performance metrics for each of the respective parameter spaces were compared to the simulation results of the base-case example presented as case 1-B (i.e., partially depleted natural gas reservoir without the PE stage).
The comparison indicated the sensitivity on the performance metrics (m) for a 5% change (both high and low) in the value of the parameter (X) from the base-case value considered in this study. Mathematically, we represent this sensitivity value, σ, as
σ = ( m high m low ) / m 0 ( X high X low ) / X 0
where m 0 and X 0 are the base-case performance metric result and the value of the parameter for the base case, respectively. The subscripts “high” and “low” denote the respective upper and lower bounds of the 5% deviation from the base-case value. We chose ( X high X low ) / X 0 = 0.1 (i.e., 5% both ways from the base case). This implies that σ is a function of the performance metric results, m , and Equation (8) becomes:
σ = 10 · m high m low m 0
It should be noted that the non-reservoir (operational) parameters considered in this study do not affect the natural gas recovery performance and the pressure-buildup metrics because these performance metrics are only dependent on the reservoir conditions. In addition, the sensitivity values obtained for the minimum CO2 saturation in the well did not show any significant changes with the 5% deviation from the base case.

3. Results and Discussions

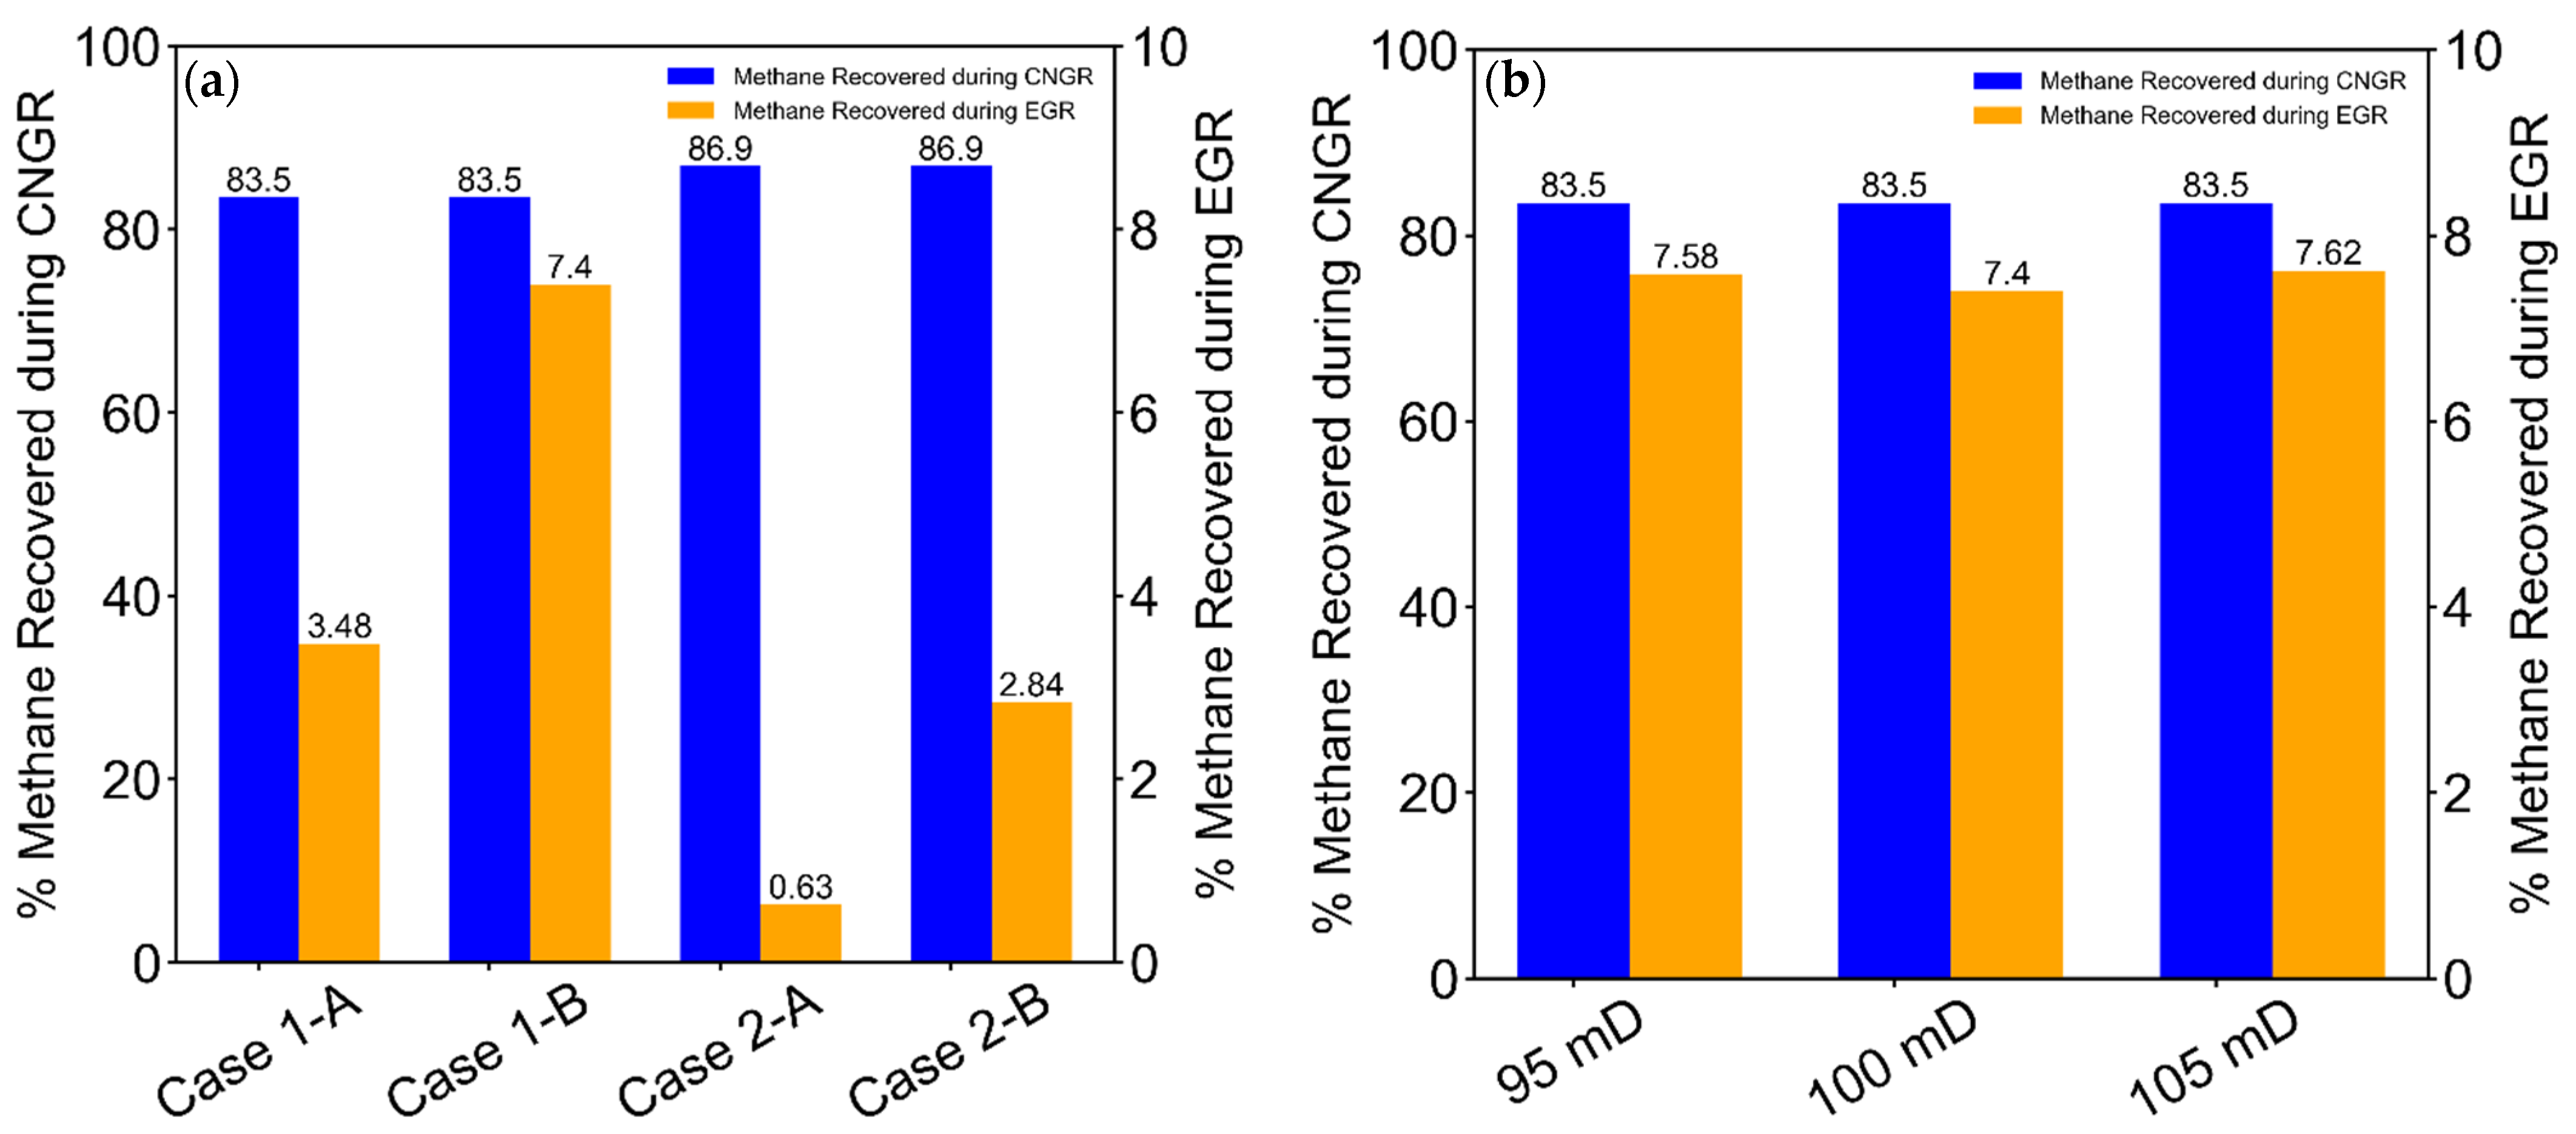
3.1. Effects of Residual CH4 Content and CO2-Plume Establishment Stage on the Performance Metrics

When the water saturation around the production well inlet was the highest during the CO2-EGR+TP stage, we considered whether the CO2-plume establishment (PE) stage was required to ensure the desired [49] annular flow regime in the bottom-hole region of the production well. Recall that “A” denotes that the PE stage exists, whereas “B” denotes that the PE stage does not exist. Figure 2 shows that, at the time of highest water saturation at the bottom-hole, case 1-A had the highest CO2 saturation in the reservoir and in the production well. This implies that the PE stage helped reduce the amount of water entering the production well. The results in Figure 3 show that the lower the residual CH4 content after the CNGR stage, the higher the probability that the production well may experience slug/churn flow. However, for relatively low-diameter production wells (14 cm and 21 cm), the desired [49] annular flow was sustained even when the residual CH4 content was low (cases 2-A and 2-B). For a production-well diameter of 33 cm, case 2-B (depleted reservoir with no CO2 plume establishment option) exhibited slug/churn flow at the bottom of the production well. Hence, if the diameter of the production well is relatively large, it may be necessary to include the CO2 plume establishment (PE) stage. As discussed in ref. [54], the optimal diameter of the production well needs to be determined not only to achieve an annular flow regime, but also to maintain minimal pressure and heat losses in the production well.
We also investigated the effect of residual CH4 content (in terms of partially depleted or depleted natural gas) on the natural gas recovery performance. The natural gas recovered during CNGR was greater for the depleted reservoir scenario (see Table 3 and Figure A1a in Appendix A). The natural gas recovery during the CO2-EGR stage was higher for the cases without CO2-plume establishment (case 1-B and case 2-B). This is because of the relatively high CO2-CH4 mixing rate that is associated with the CO2-plume establishment stage, which may slightly reduce natural gas recovery during the CO2-EGR+TP stage.
From Table 3, we observed a decrease in the number of years for the expensive separation period in the CO2-EGR+TP stage for the two cases that considered the PE stage, which led to a higher recovery index (RI). For the partially depleted natural gas reservoir example cases, the expensive separation duration reduced when the PE stage was considered (i.e., case 1-A), and this led to better performance (higher RI) for case 1-A than for case 1-B. Table 3 also shows that the calculated RI was lower for the depleted natural gas reservoir example cases, and that there was only a slight increase in RI between cases 2-A and 2-B. Hence, the simulation results showed that the effect of the PE stage on the natural gas recovery index was more pronounced when the reservoir was partially depleted of natural gas. However, if the natural gas reservoir was depleted, the PE stage was important to establish a CO2 connection between the injectors and producers.
During the CNGR stage, more geothermal energy was generated from the natural gas for the depleted reservoir cases (case 2) than the partially depleted reservoir cases (case 1), shown in Table 4 and Figure A2, as the amount of natural gas recovered from the depleted natural gas reservoir was greater than that recovered from the partially depleted natural gas reservoir. The opposite was the case for the CO2-EGR+TP stage, during which more natural gas, and hence more associated geothermal energy, was produced from the partially depleted reservoir (see Table 3). During the CPG stage, case 1-A had the highest value of geothermal electricity generated (Table 4). This was because it had the shortest duration of the CO2-EGR+TP stage (1.50 years), which ensured an earlier start, and longer duration, of the CPG stage.
Of all four cases considered, the combined CO2-EGR-CPG system in a partially depleted natural gas reservoir, which includes a PE stage (case 1-A), yielded the best results in terms of: (i) the desired [49] annular flow regime in the production well, (ii) the natural gas recovery performance (including having the shortest duration of the CO2-EGR+TP stage), and (iii) the average total net electricity generation performance. Hence, it appears advantageous to plan the combined CO2-EGR-CPG system (including the PE stage) to commence before the natural gas reservoir is completely depleted.

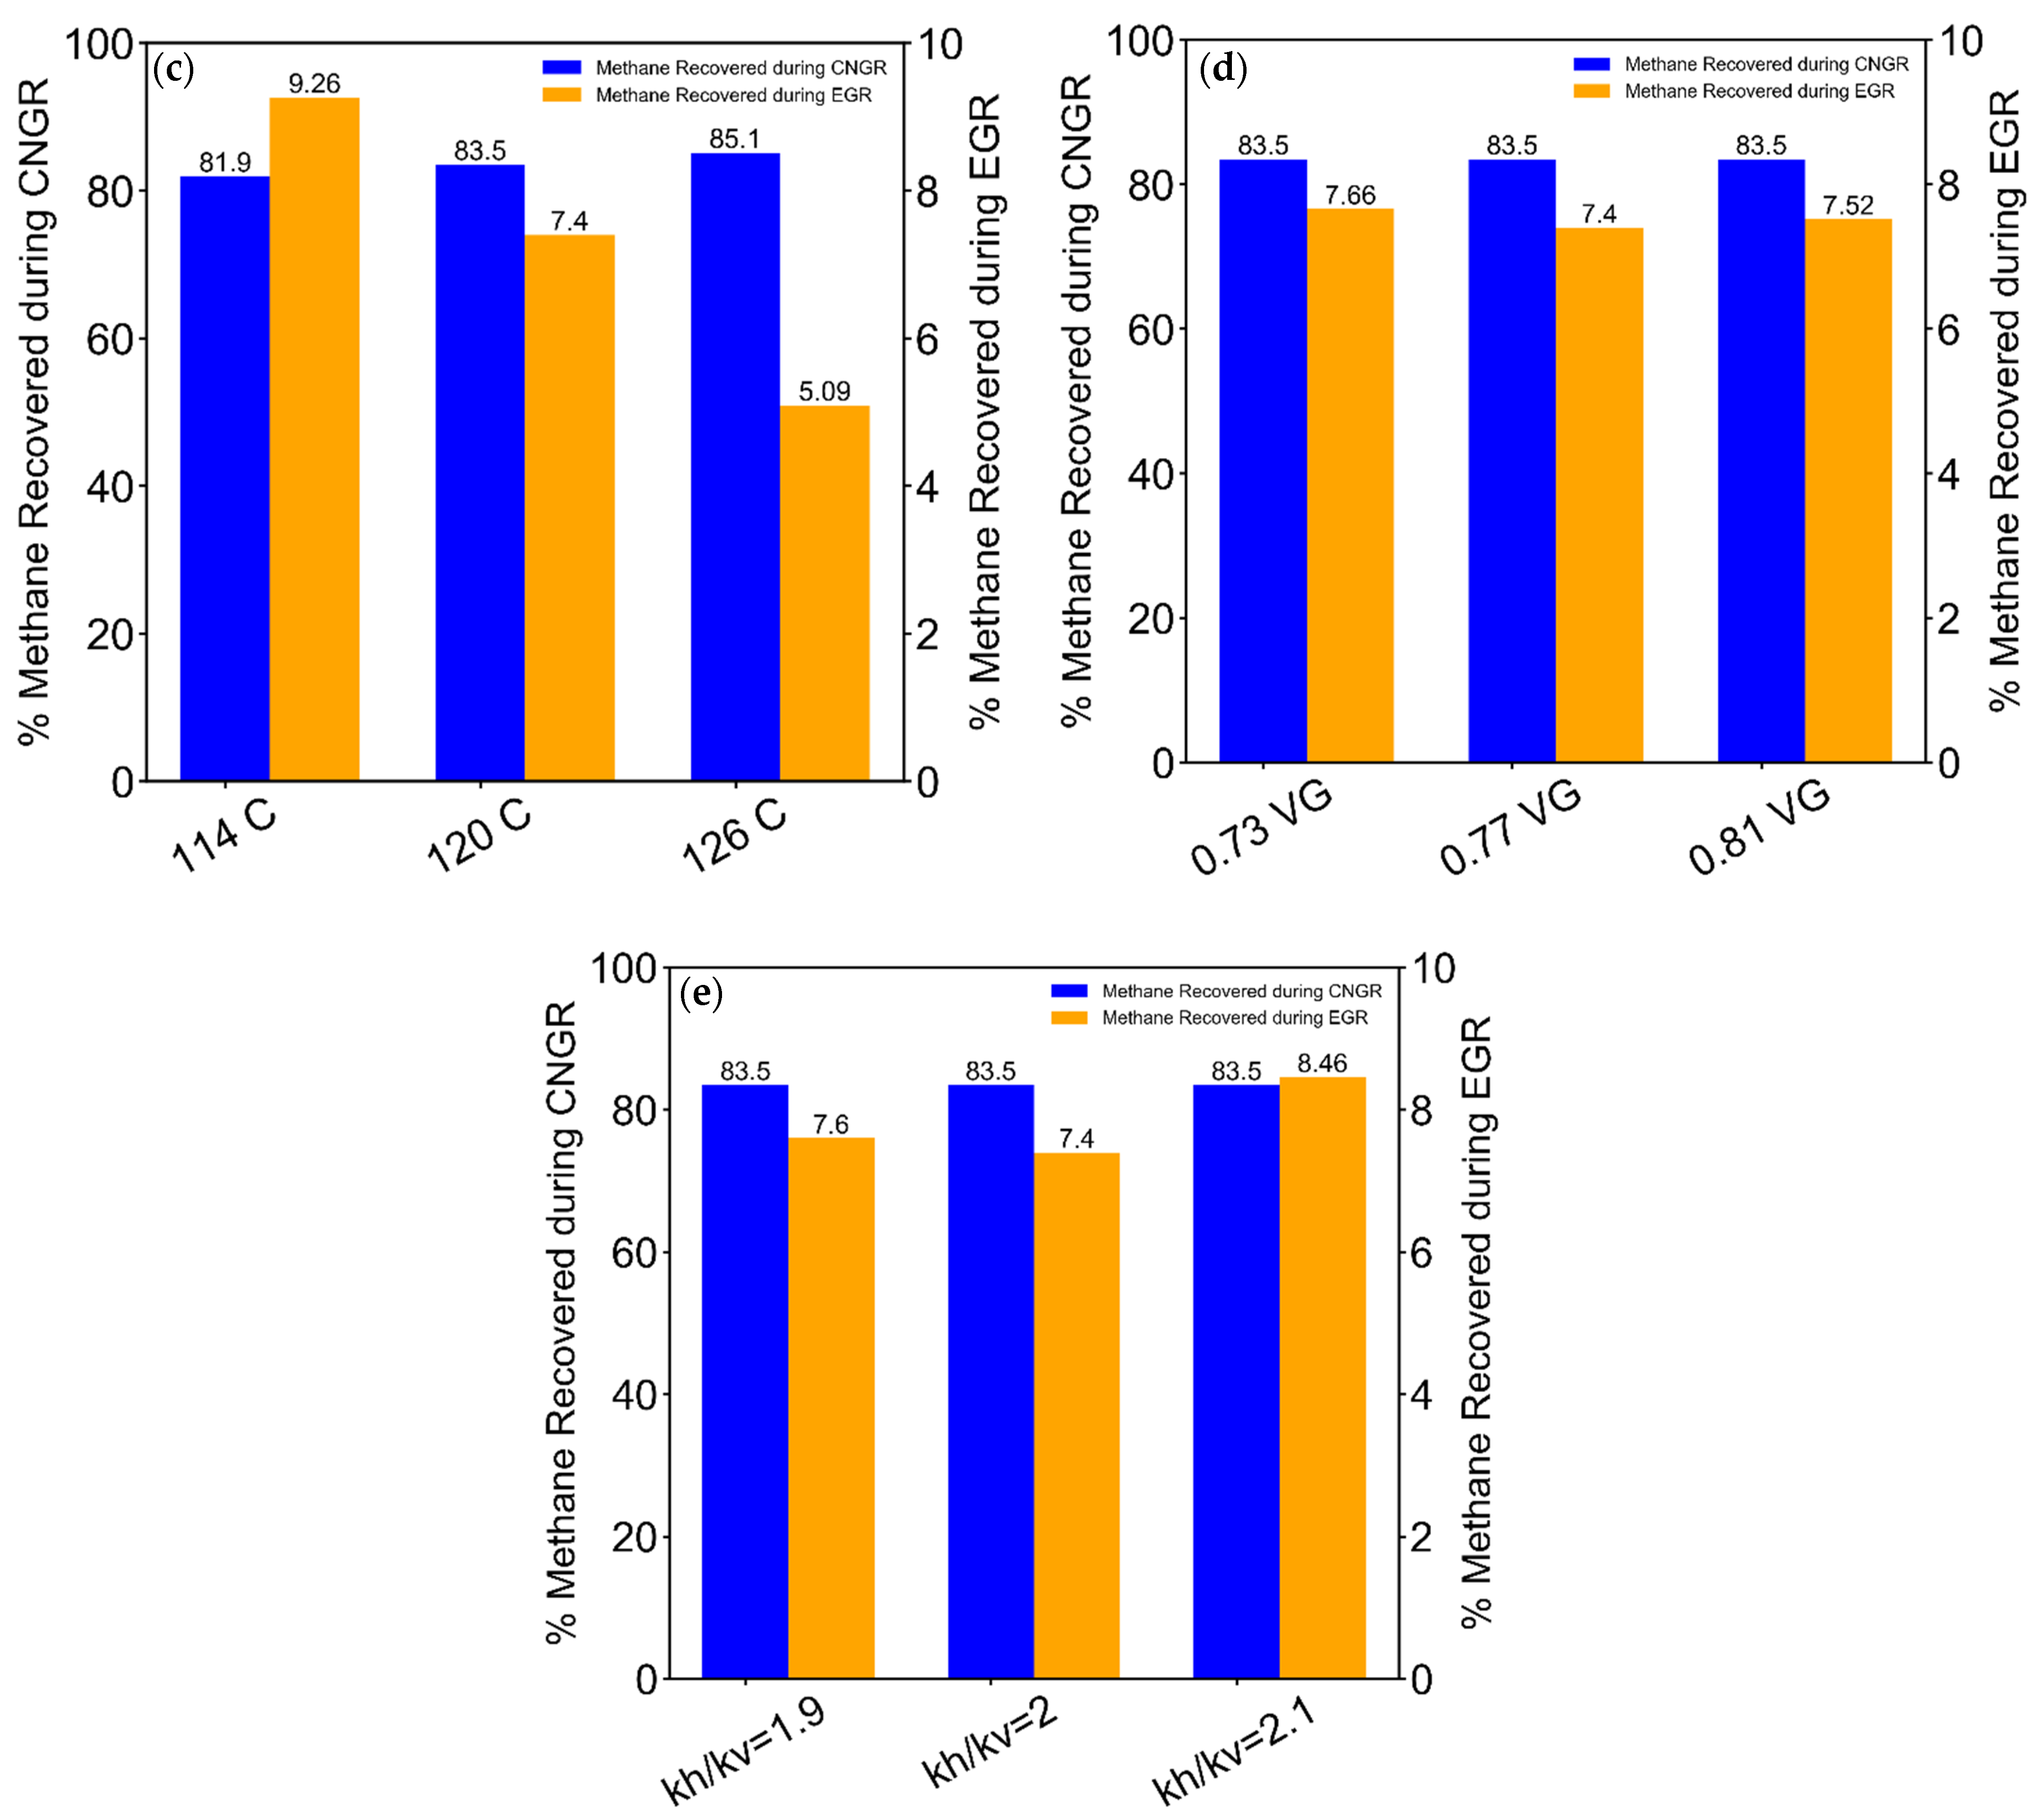
3.2. Effects of Reservoir and Operational Parameters on the Performance Metrics

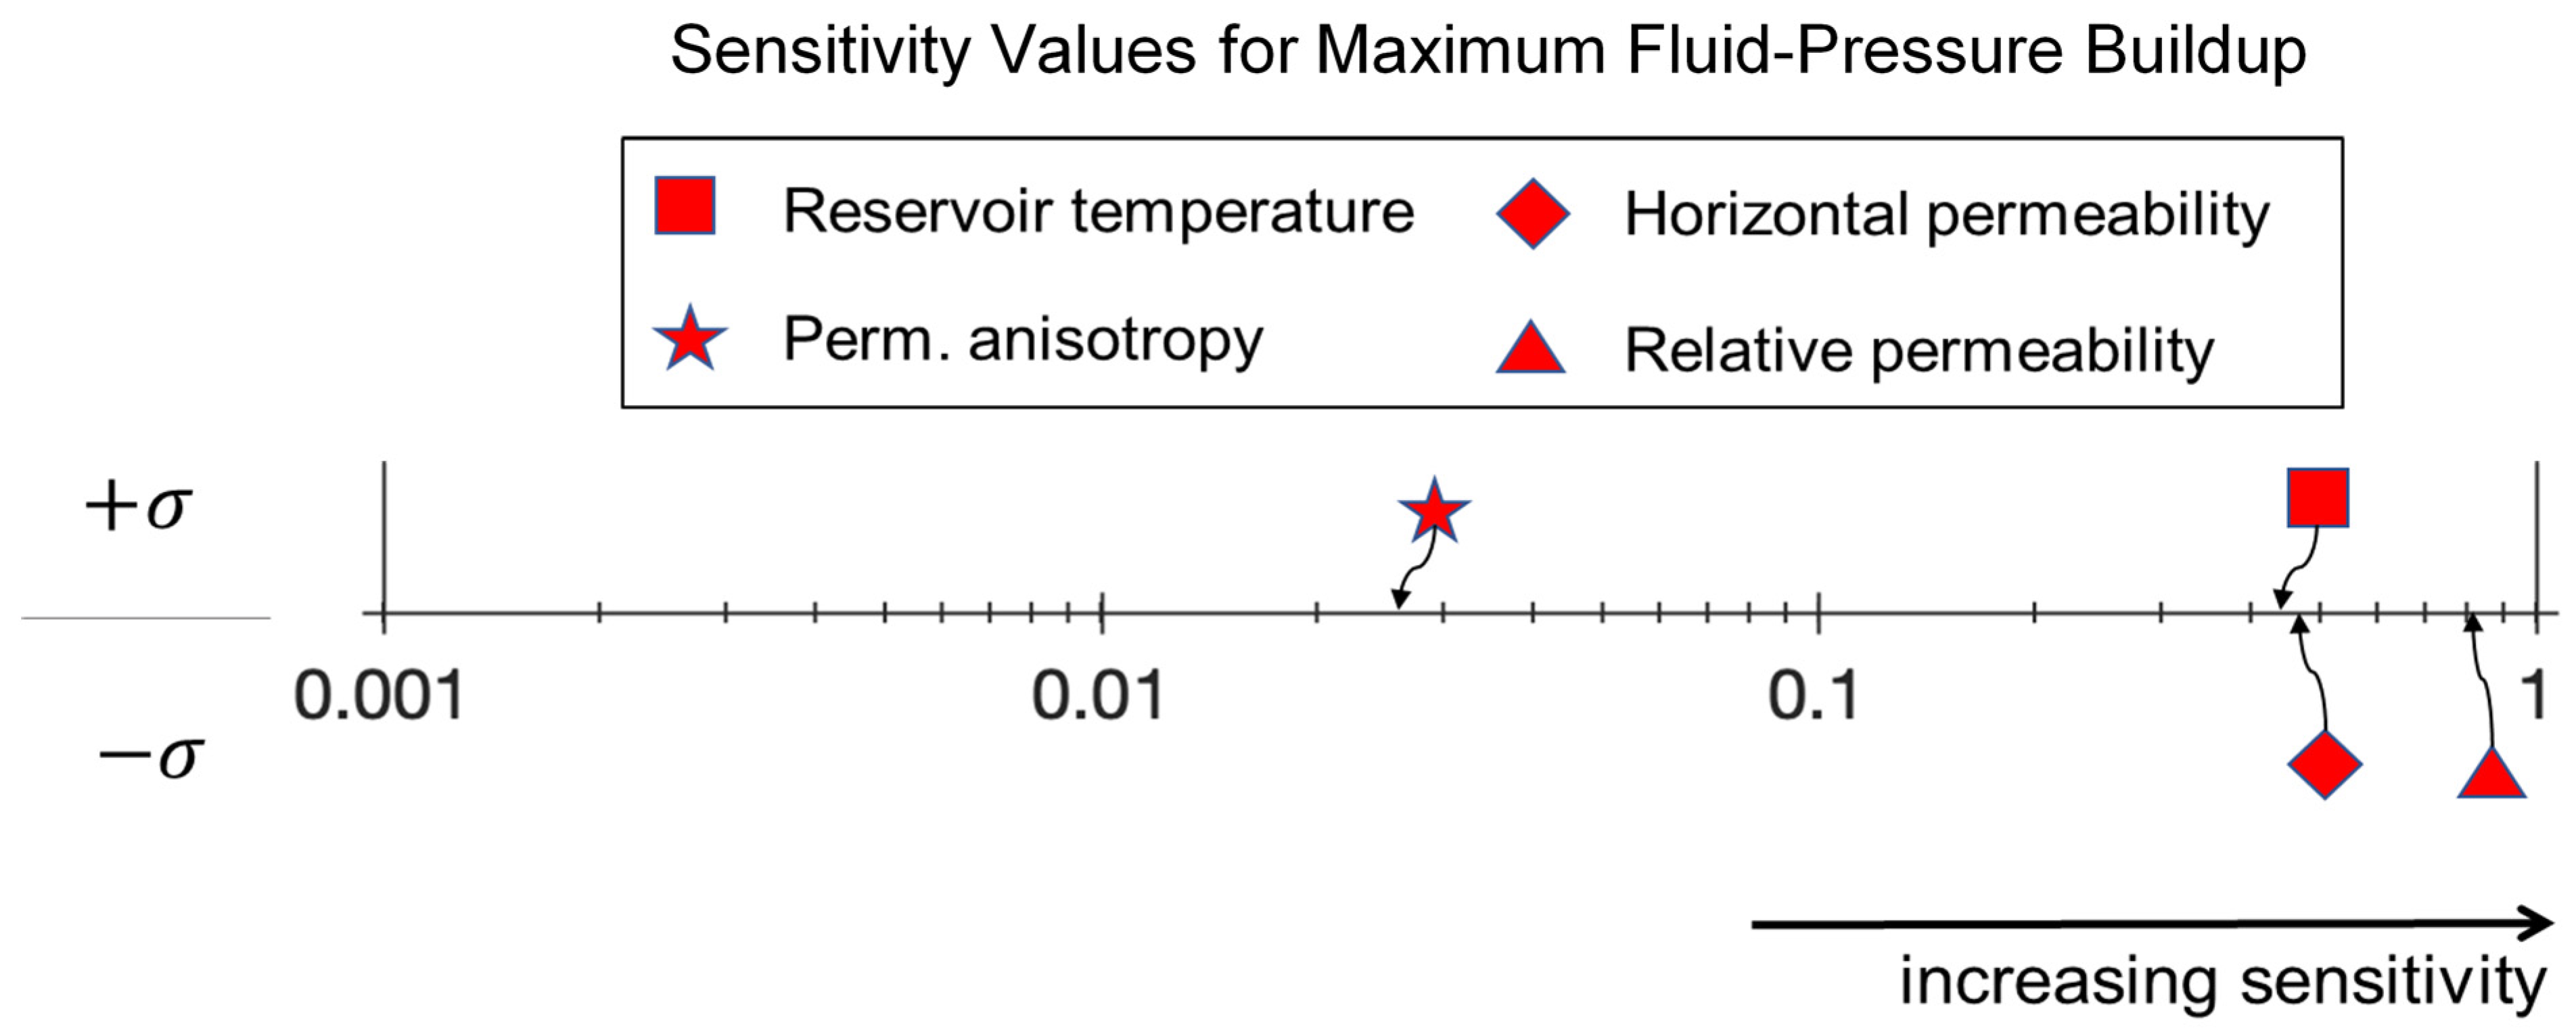
3.2.1. Natural Gas Recovery Performance and Maximum Fluid-Pressure Buildup

Recall that the natural gas recovery performance (NGRP) metric is only dependent on the changes in the reservoir parameters and not on non-reservoir parameters. As described in Section 2.2, the NGRP was determined in this study by the value of the natural gas recovery index (RI), which can be calculated using Equation (4). Figure A1b–e show the volume of natural gas recovered (in %OGIP) during the CNGR and CO2-EGR stages for the different reservoir parameters considered in this study. Figure 4 shows the sensitivity for the reservoir parameters considered in this study on the natural gas recovery performance for the CNGR and the CO2-EGR+TP stages (when natural gas was being produced and methane was separated from CO2). The parameters plotted on the upper part of the horizontal logarithmic axis (Figure 4) indicated those with a positive sensitivity value (σ), and those parameters that were plotted on the lower part of the axis have a negative σ. A positive (+) value of σ shows that there was an increase in the NGRP when the value of the parameter increased, whereas the opposite was the case for a negative (–) value of σ.
The sensitivity results, plotted in Figure 4, show that permeability anisotropy and reservoir temperature were the most sensitive parameters (both ~0.2) to the NGRP, with each having a different sign of the sensitivity value. We observed that, as the permeability anisotropy increases, the NGRP significantly decreased (i.e., negative σ value). This was the case as the production well was perforated only over the topmost layer interval (20 m out of the entire 100 m reservoir thickness), and a decrease in the vertical permeability (i.e., increase in permeability anisotropy) led to less upward flow of the natural gas towards the production well perforation. Hence, the decrease in NGRP. However, an increase in reservoir temperature would lead to a significant increase in the NGRP, as the kinematic viscosity of the gas is reduced at higher temperatures, increasing the gas mobility. The horizontal permeability parameter was the least sensitive parameter for the NGRP, with a sensitivity value of +0.0045, which was two orders of magnitude less than those of the most sensitive parameters.
The sensitivity results for the maximum fluid-pressure buildup, plotted in Figure 5, showed that the van Genuchten relative permeability parameter was the most sensitive parameter, followed by horizontal permeability and reservoir temperature. The sensitivity to the van Genuchten parameter was because the maximum fluid-pressure buildup happened during the beginning of the CO2-EGR+TP stage when two-phase flow processes near the injection wells are important. An increase in horizontal permeability obviously leads to a decrease in pressure-buildup intensity, hence a high (negative) sensitivity value was observed for this parameter. The sensitivity to reservoir temperature was a result of the constant CO2 injection mass flowrate used. If a constant volume flowrate was applied instead, the fluid-pressure buildup would be significantly less sensitive to reservoir temperature. Figure 5 also shows that the fluid-pressure-buildup metric was not sensitive to permeability anisotropy changes.

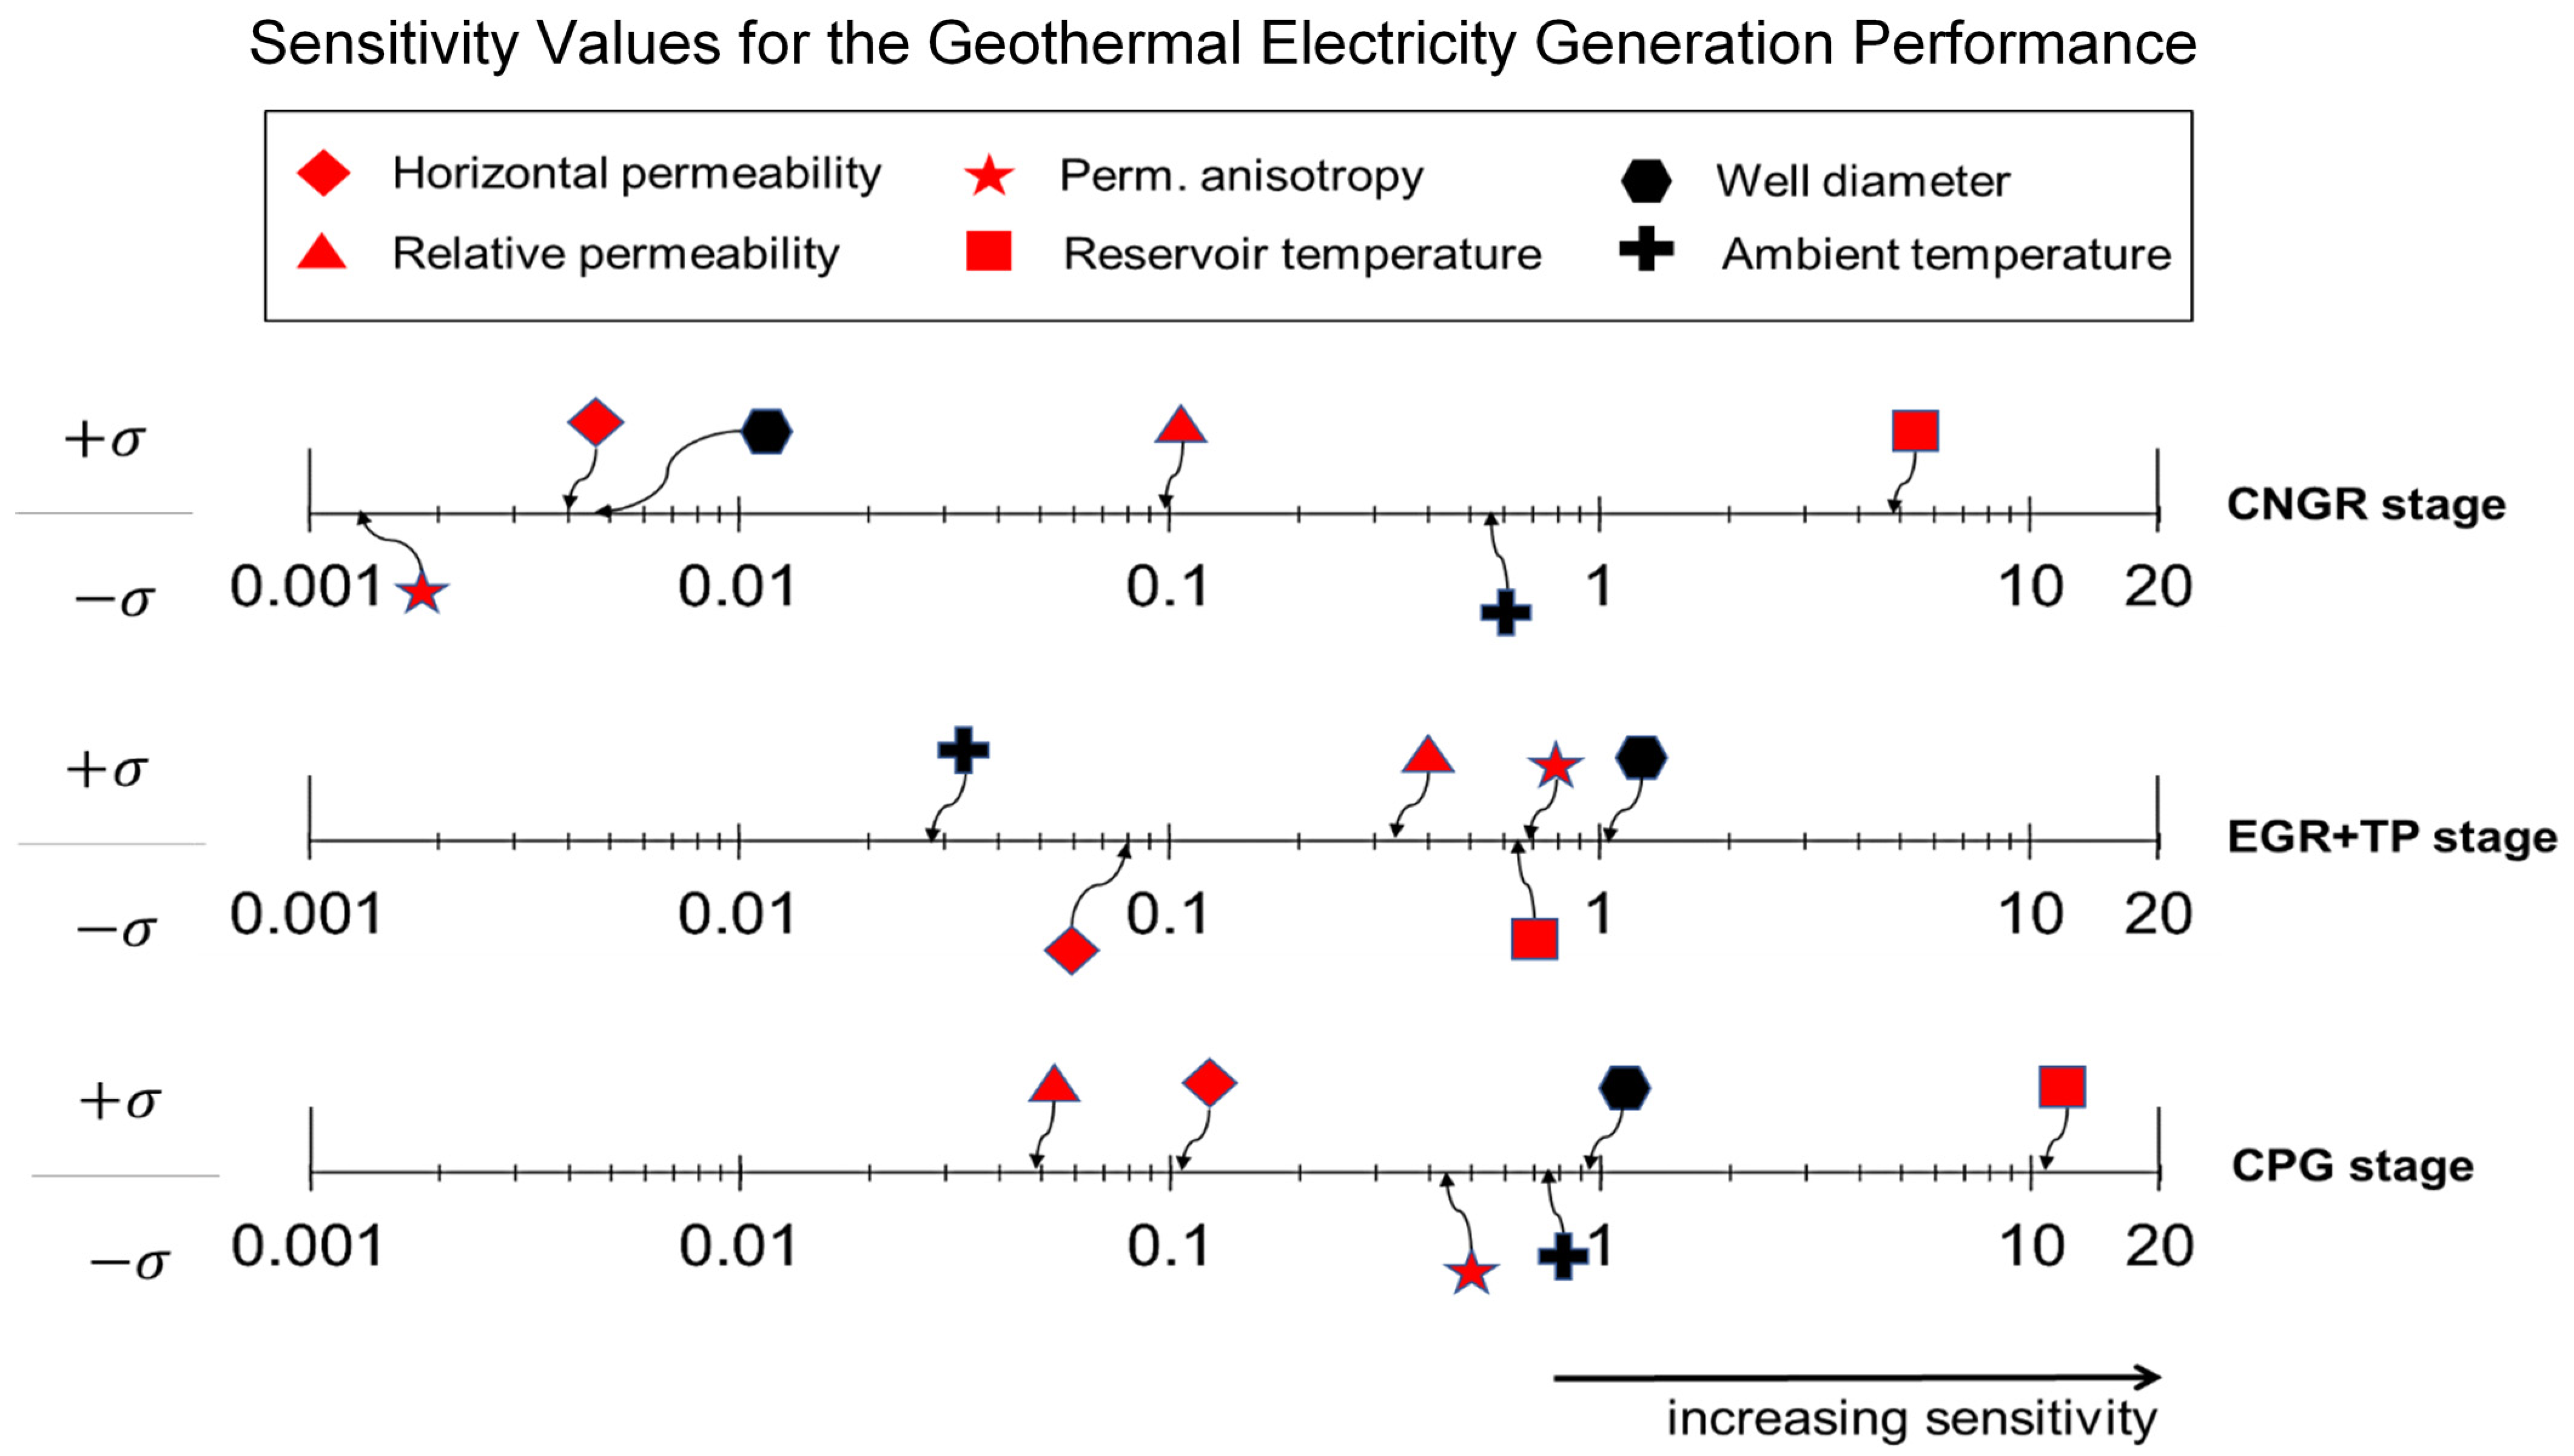
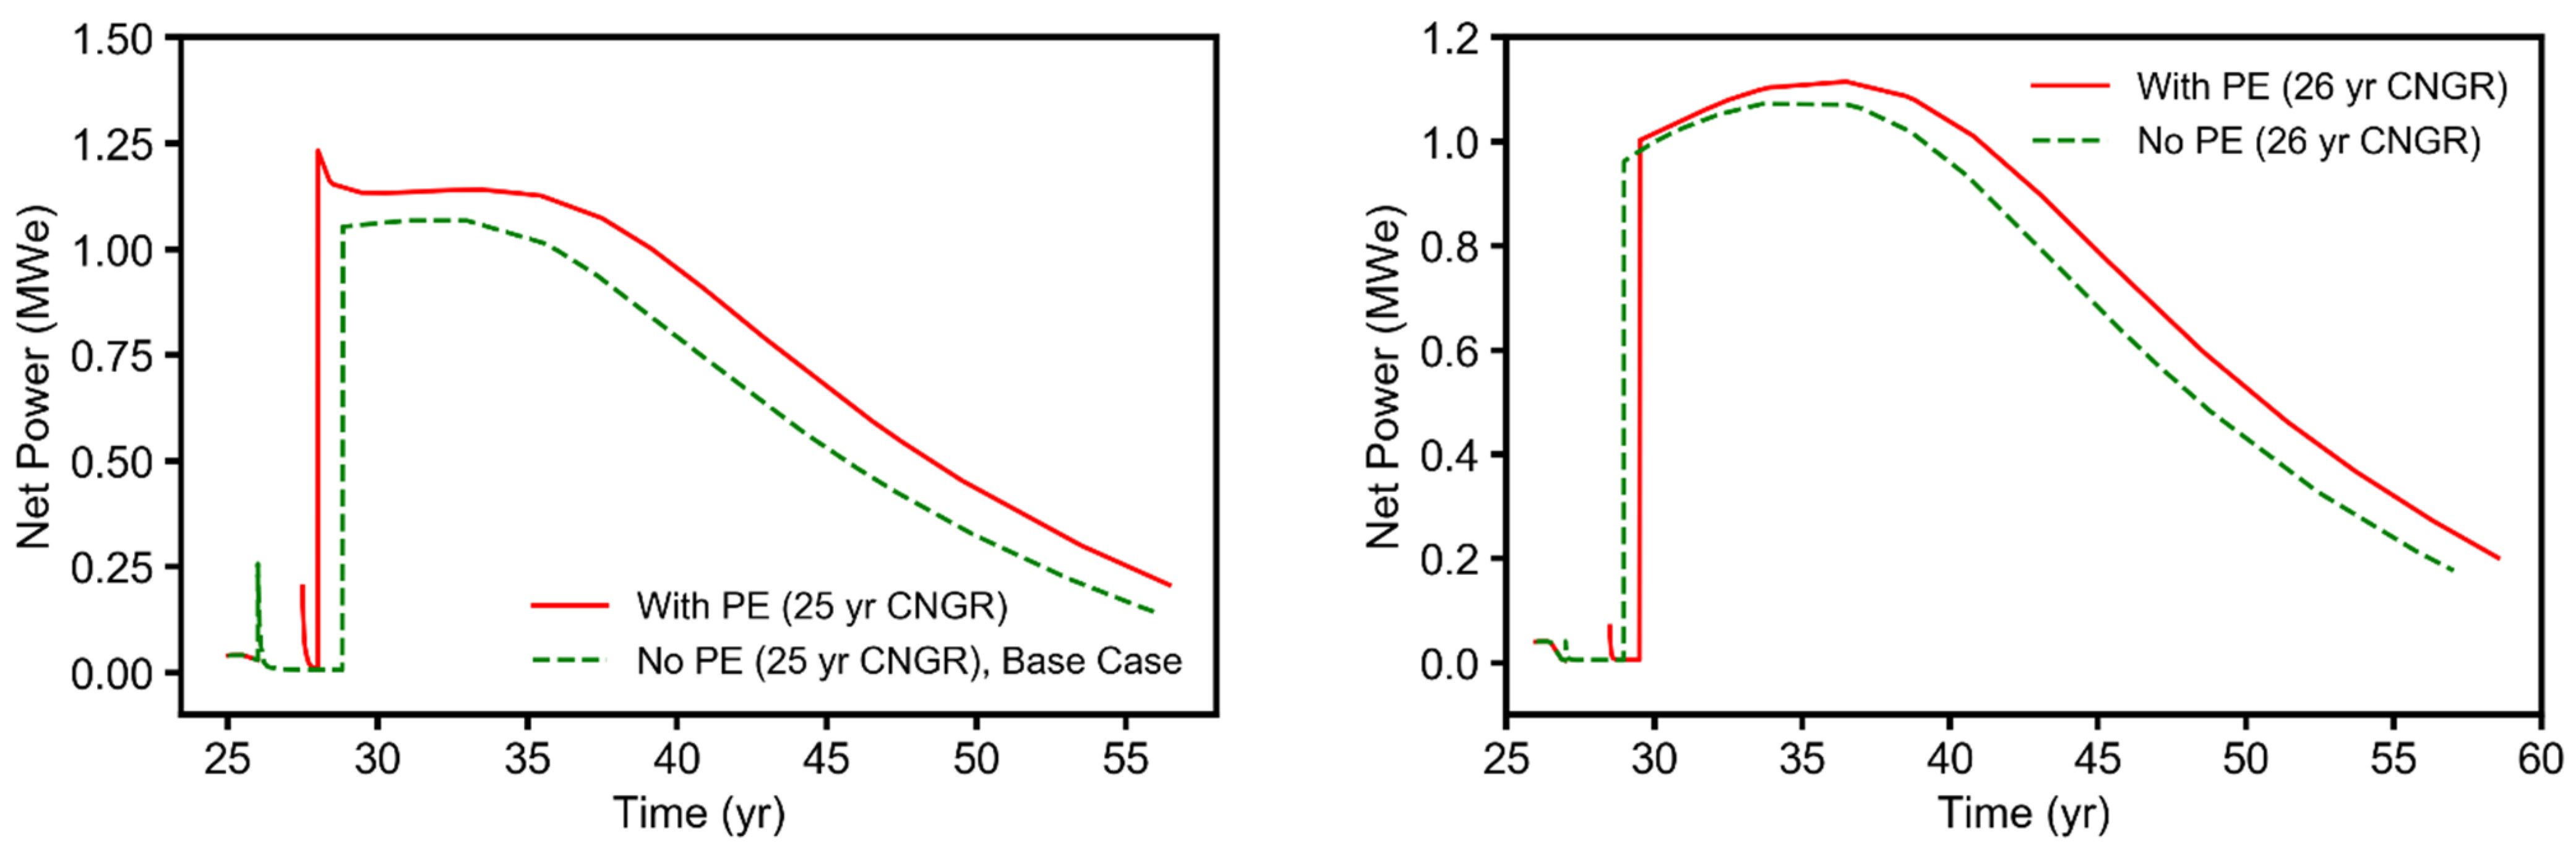
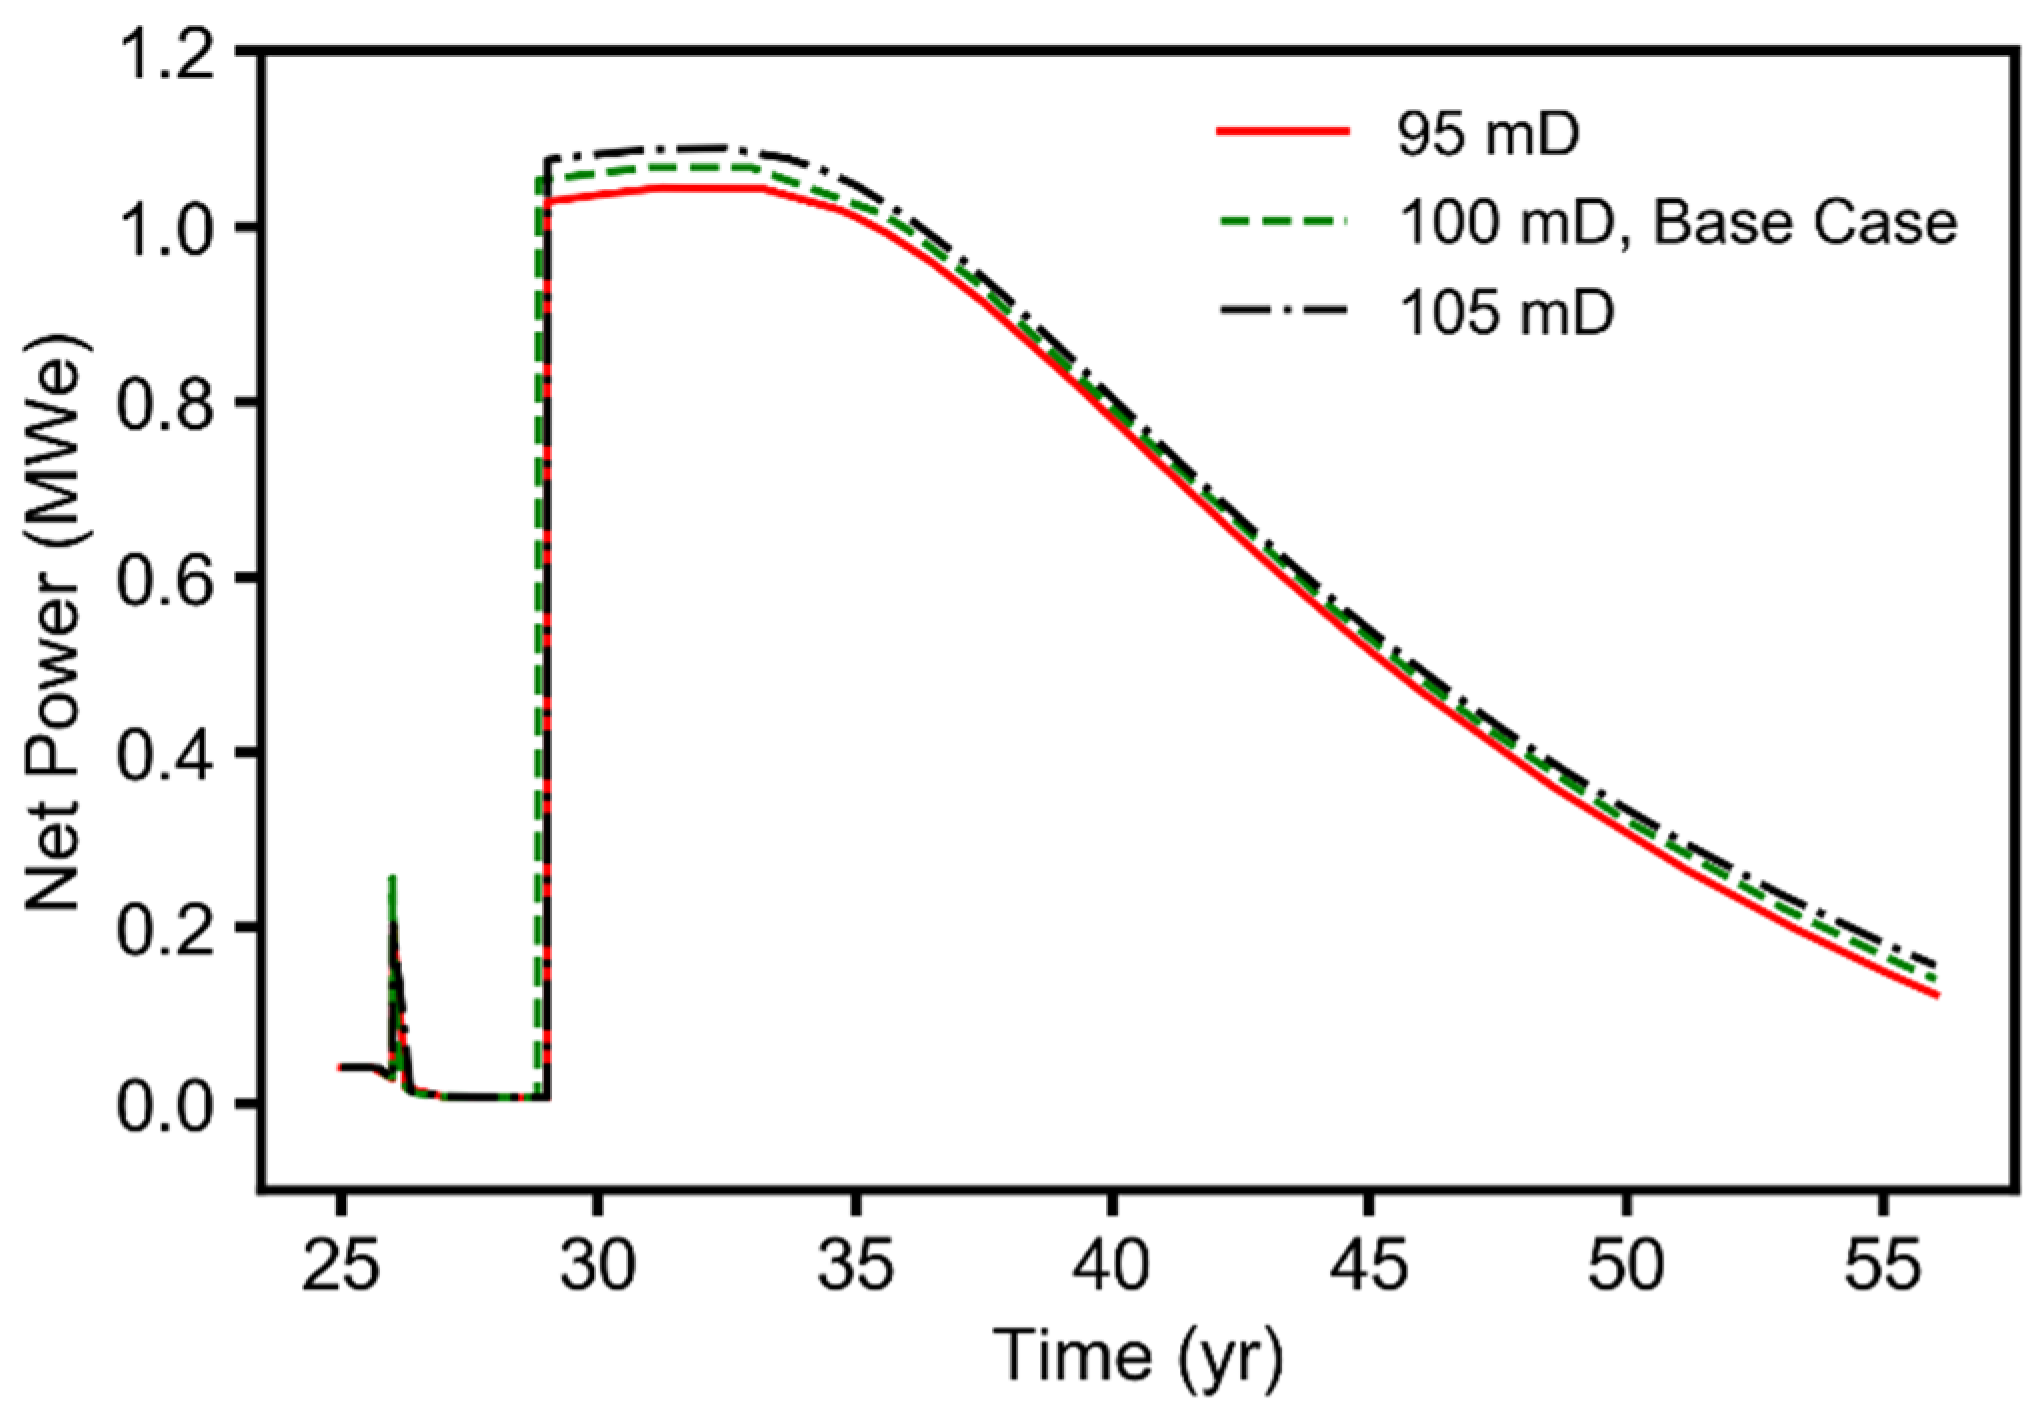
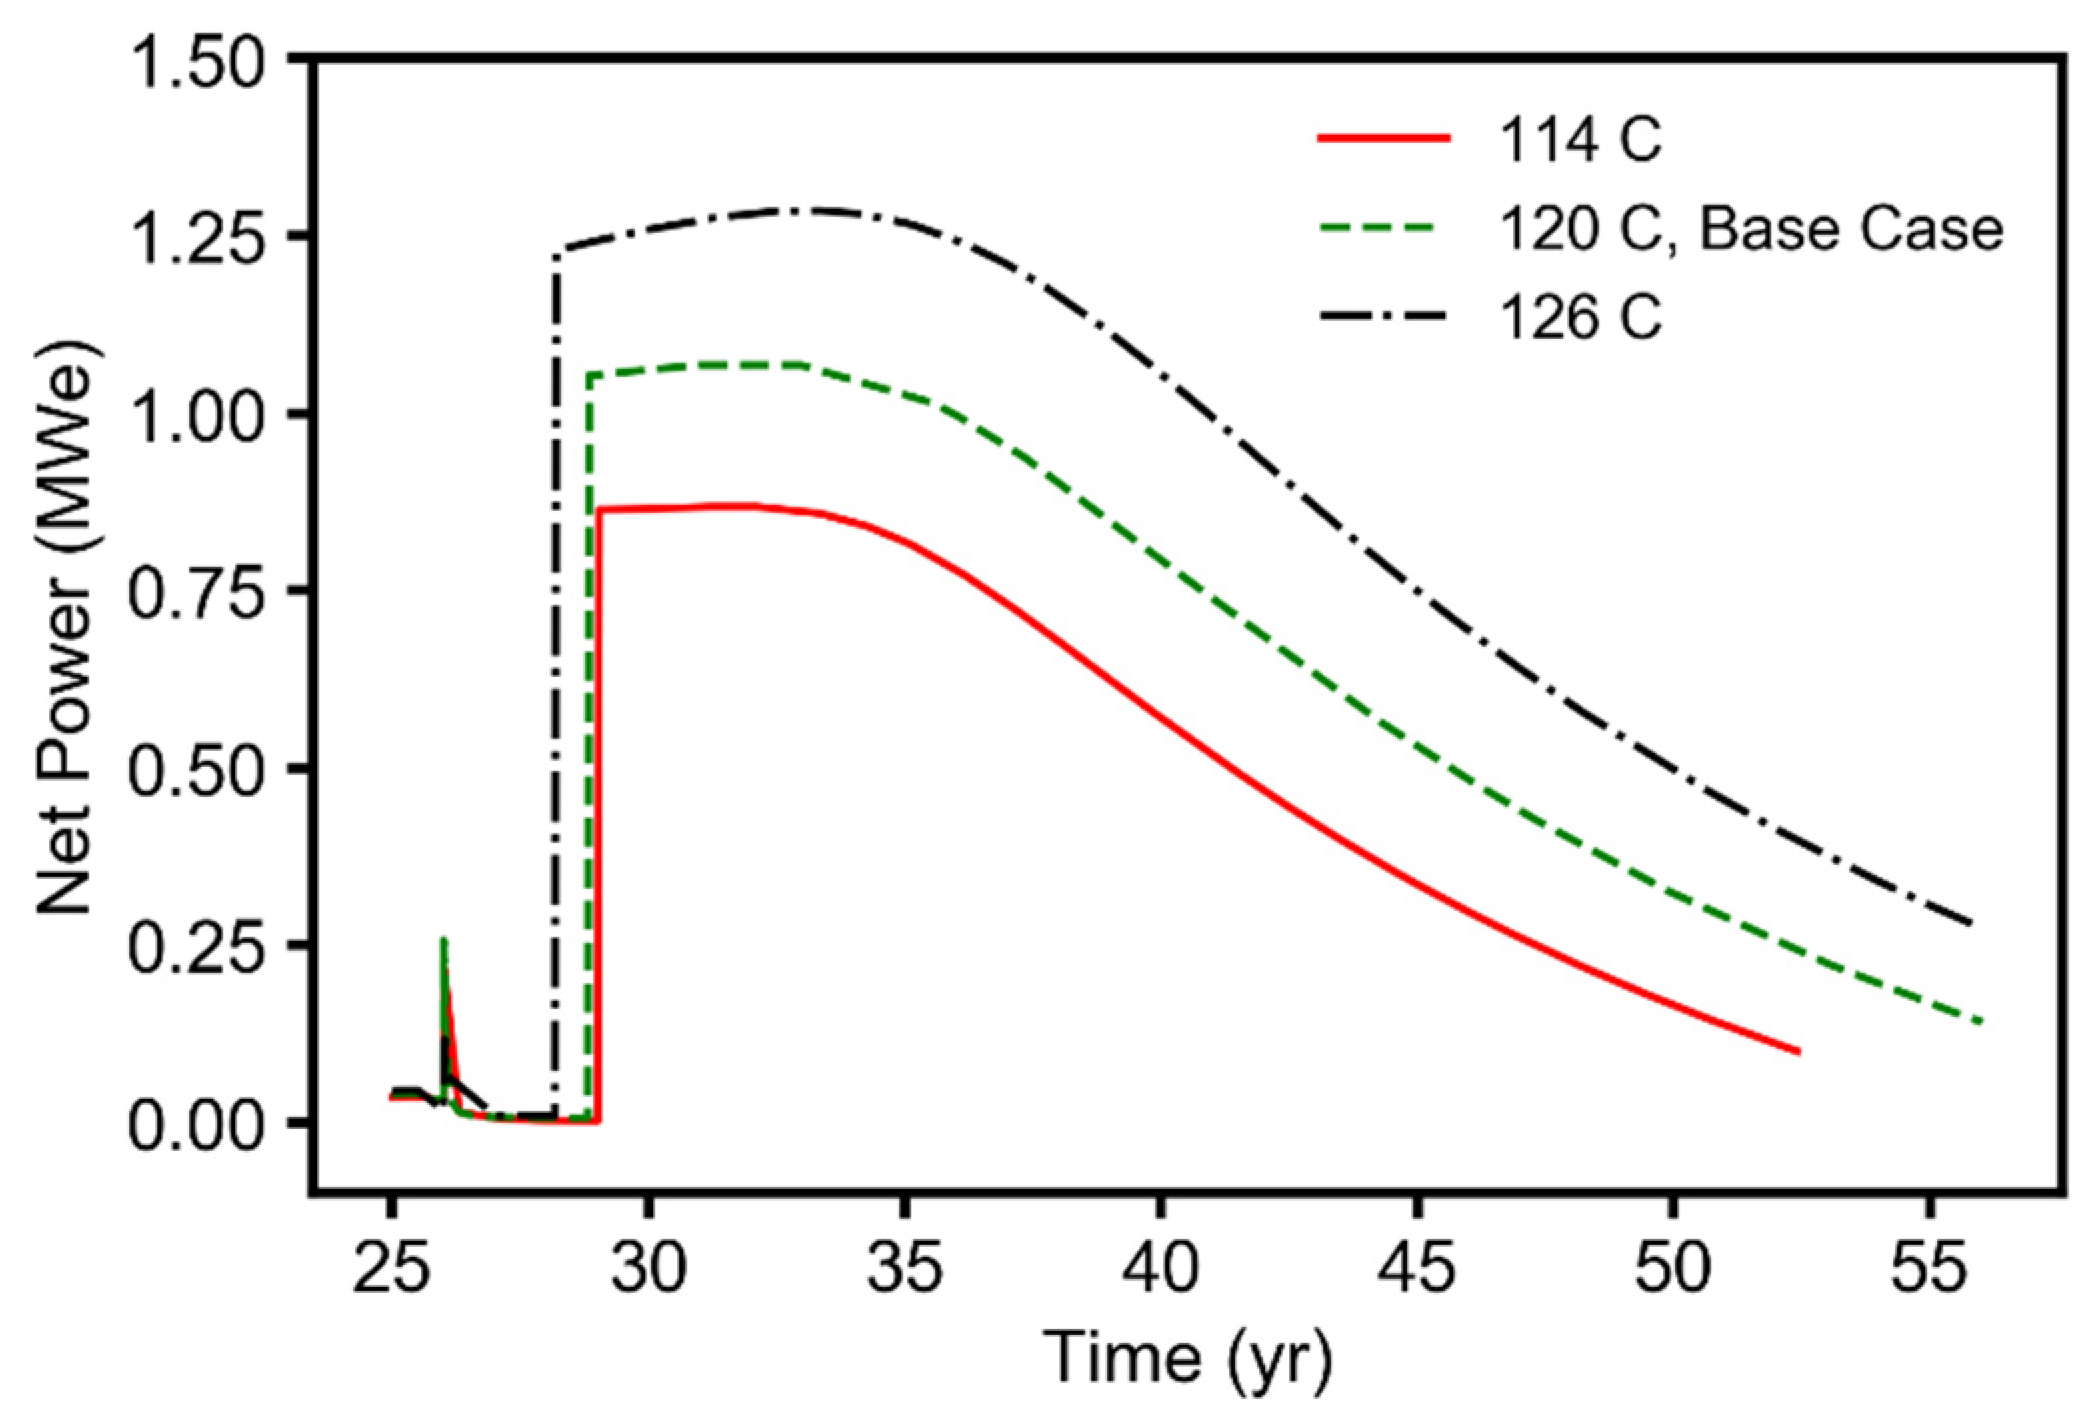
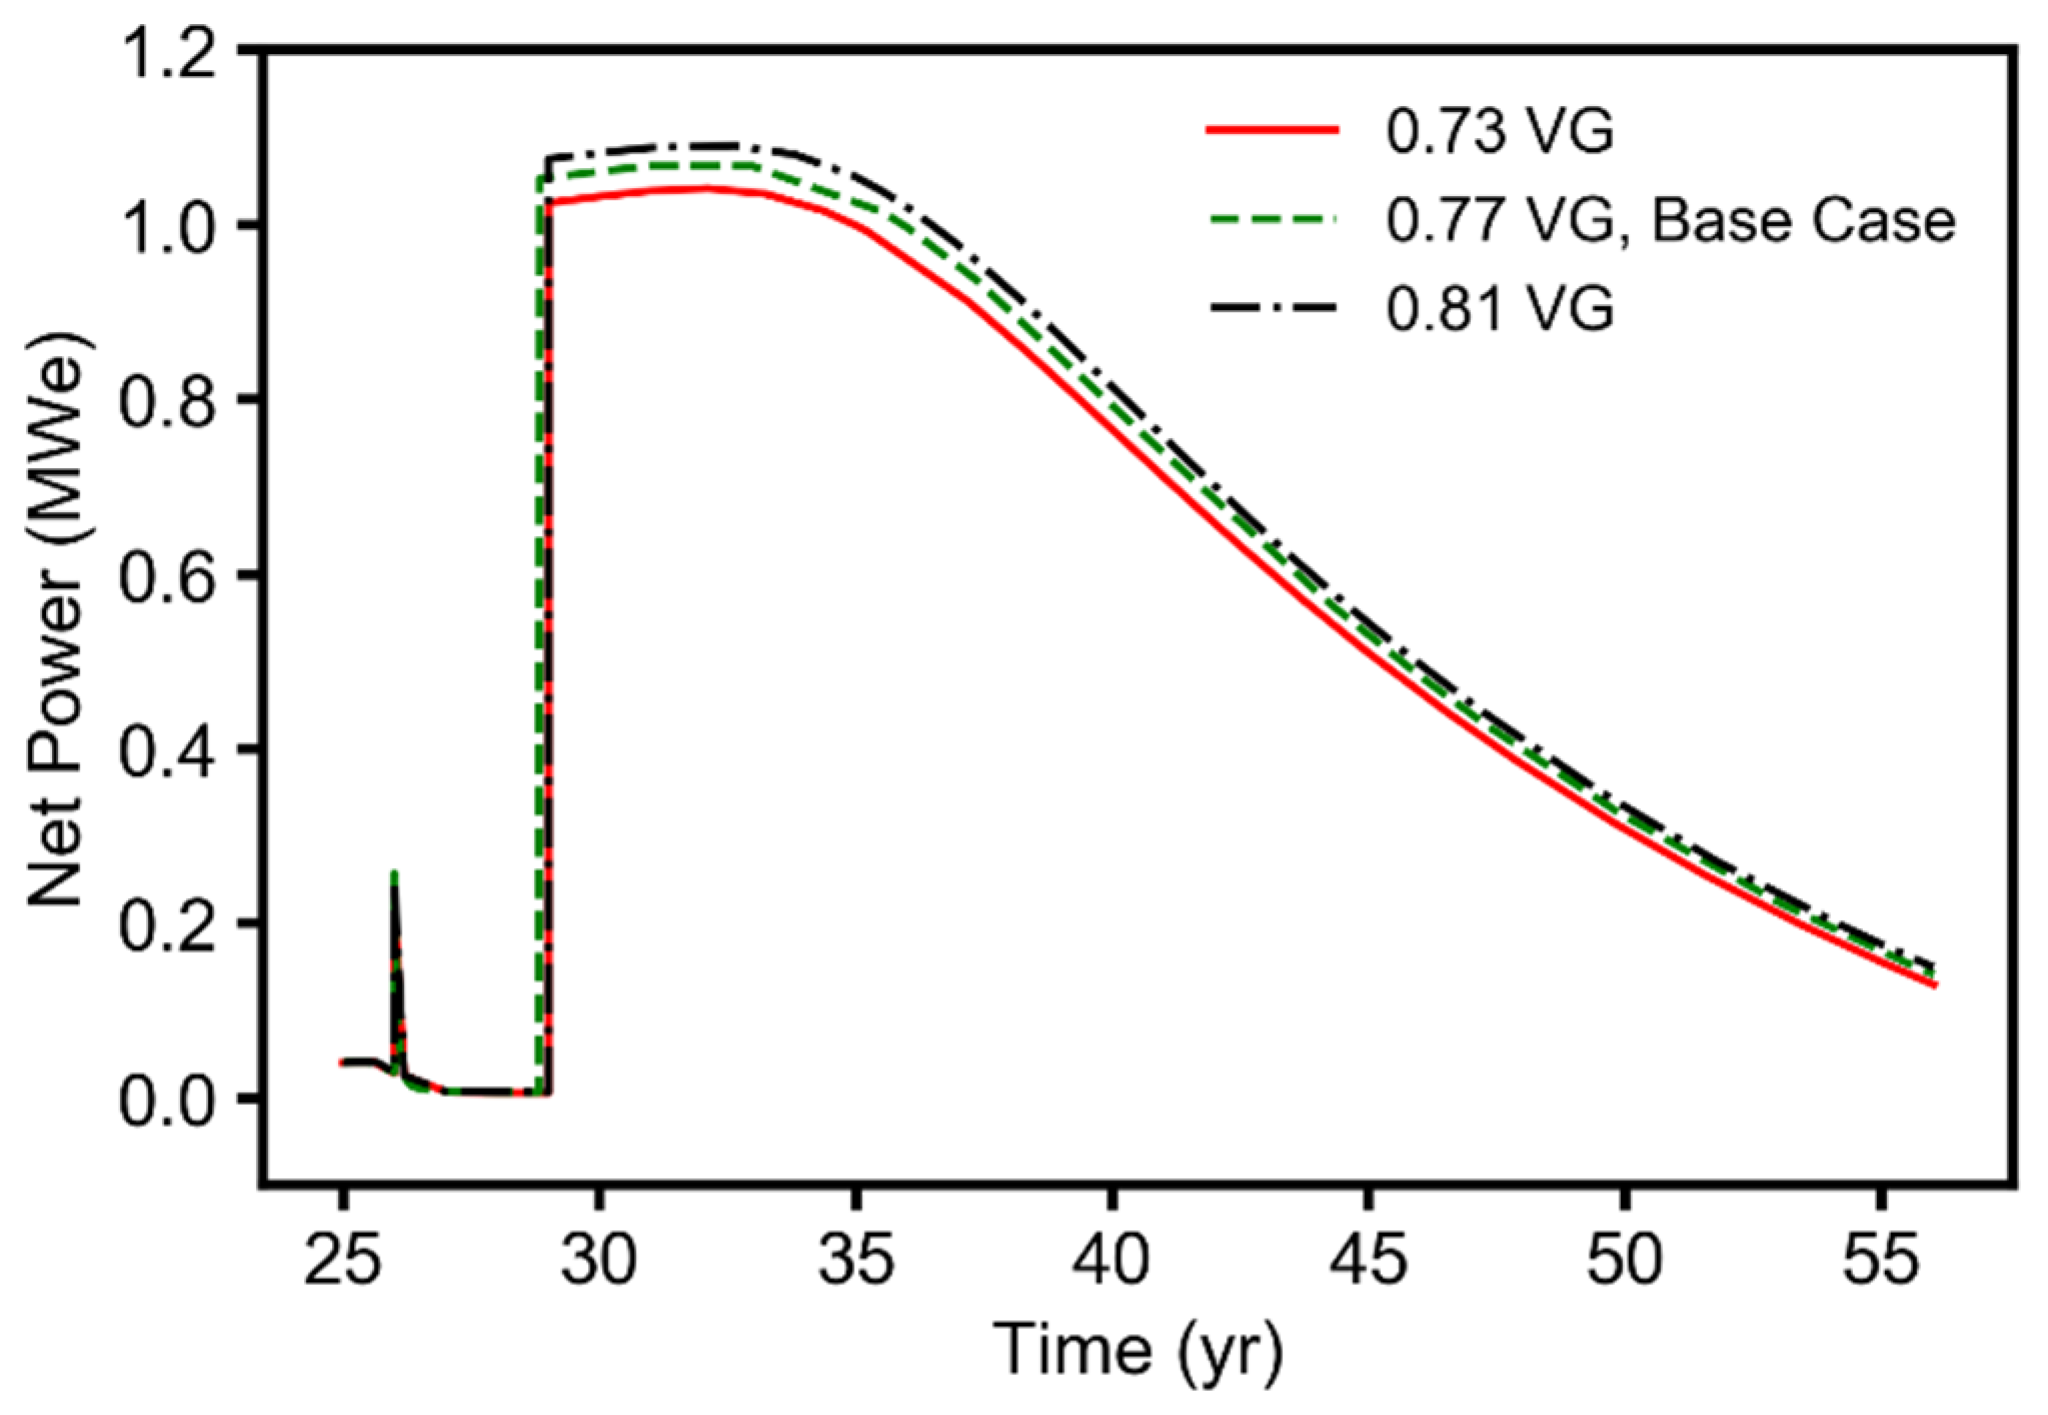
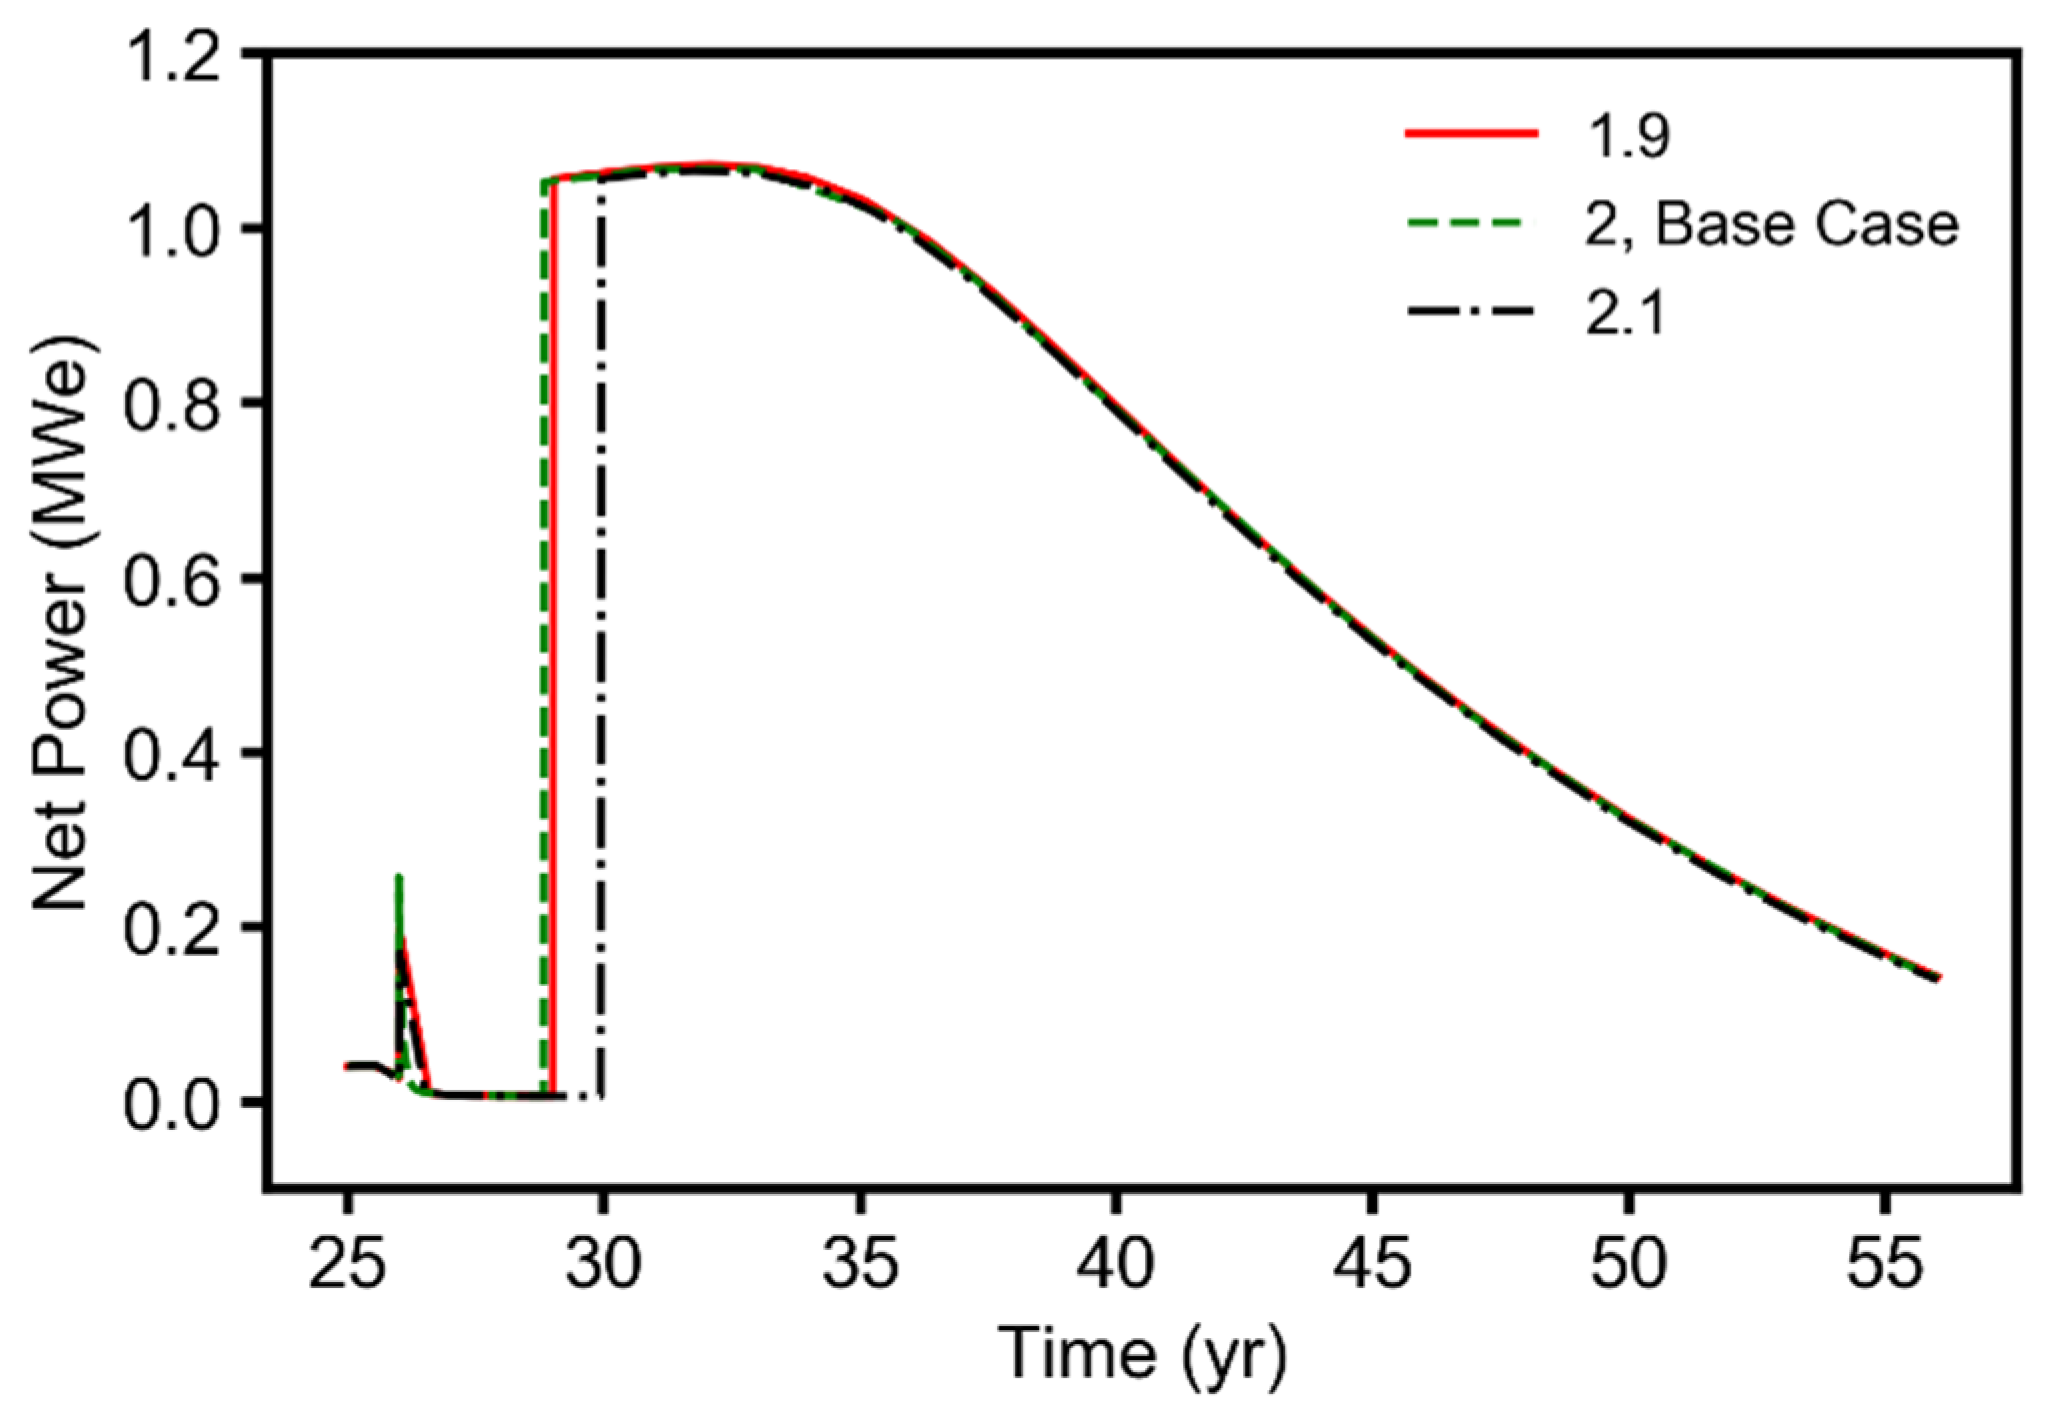
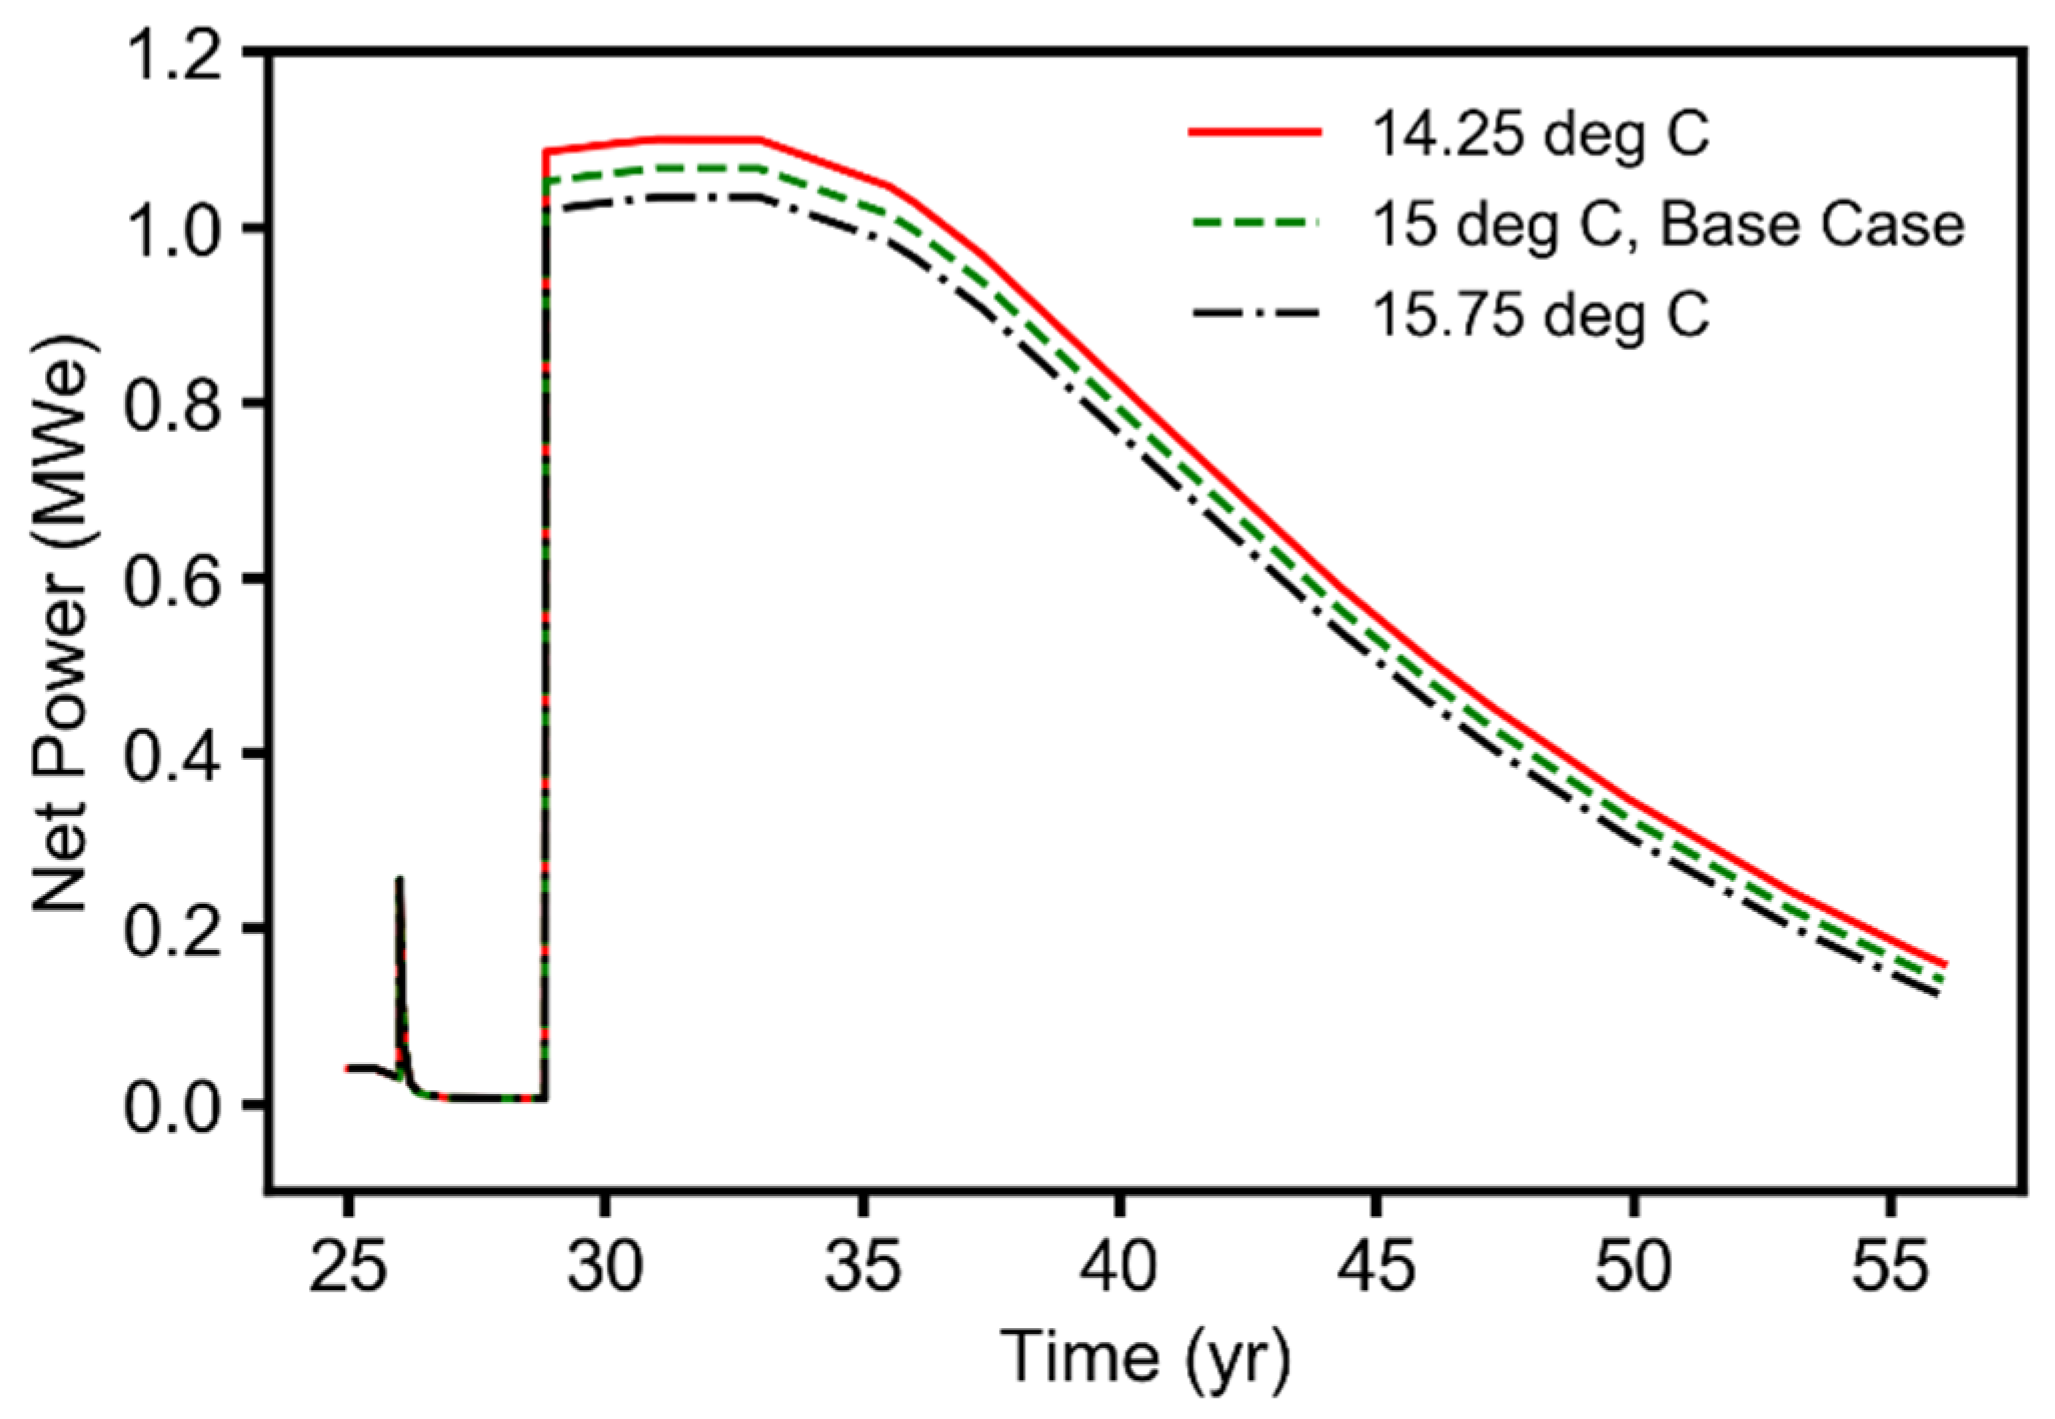
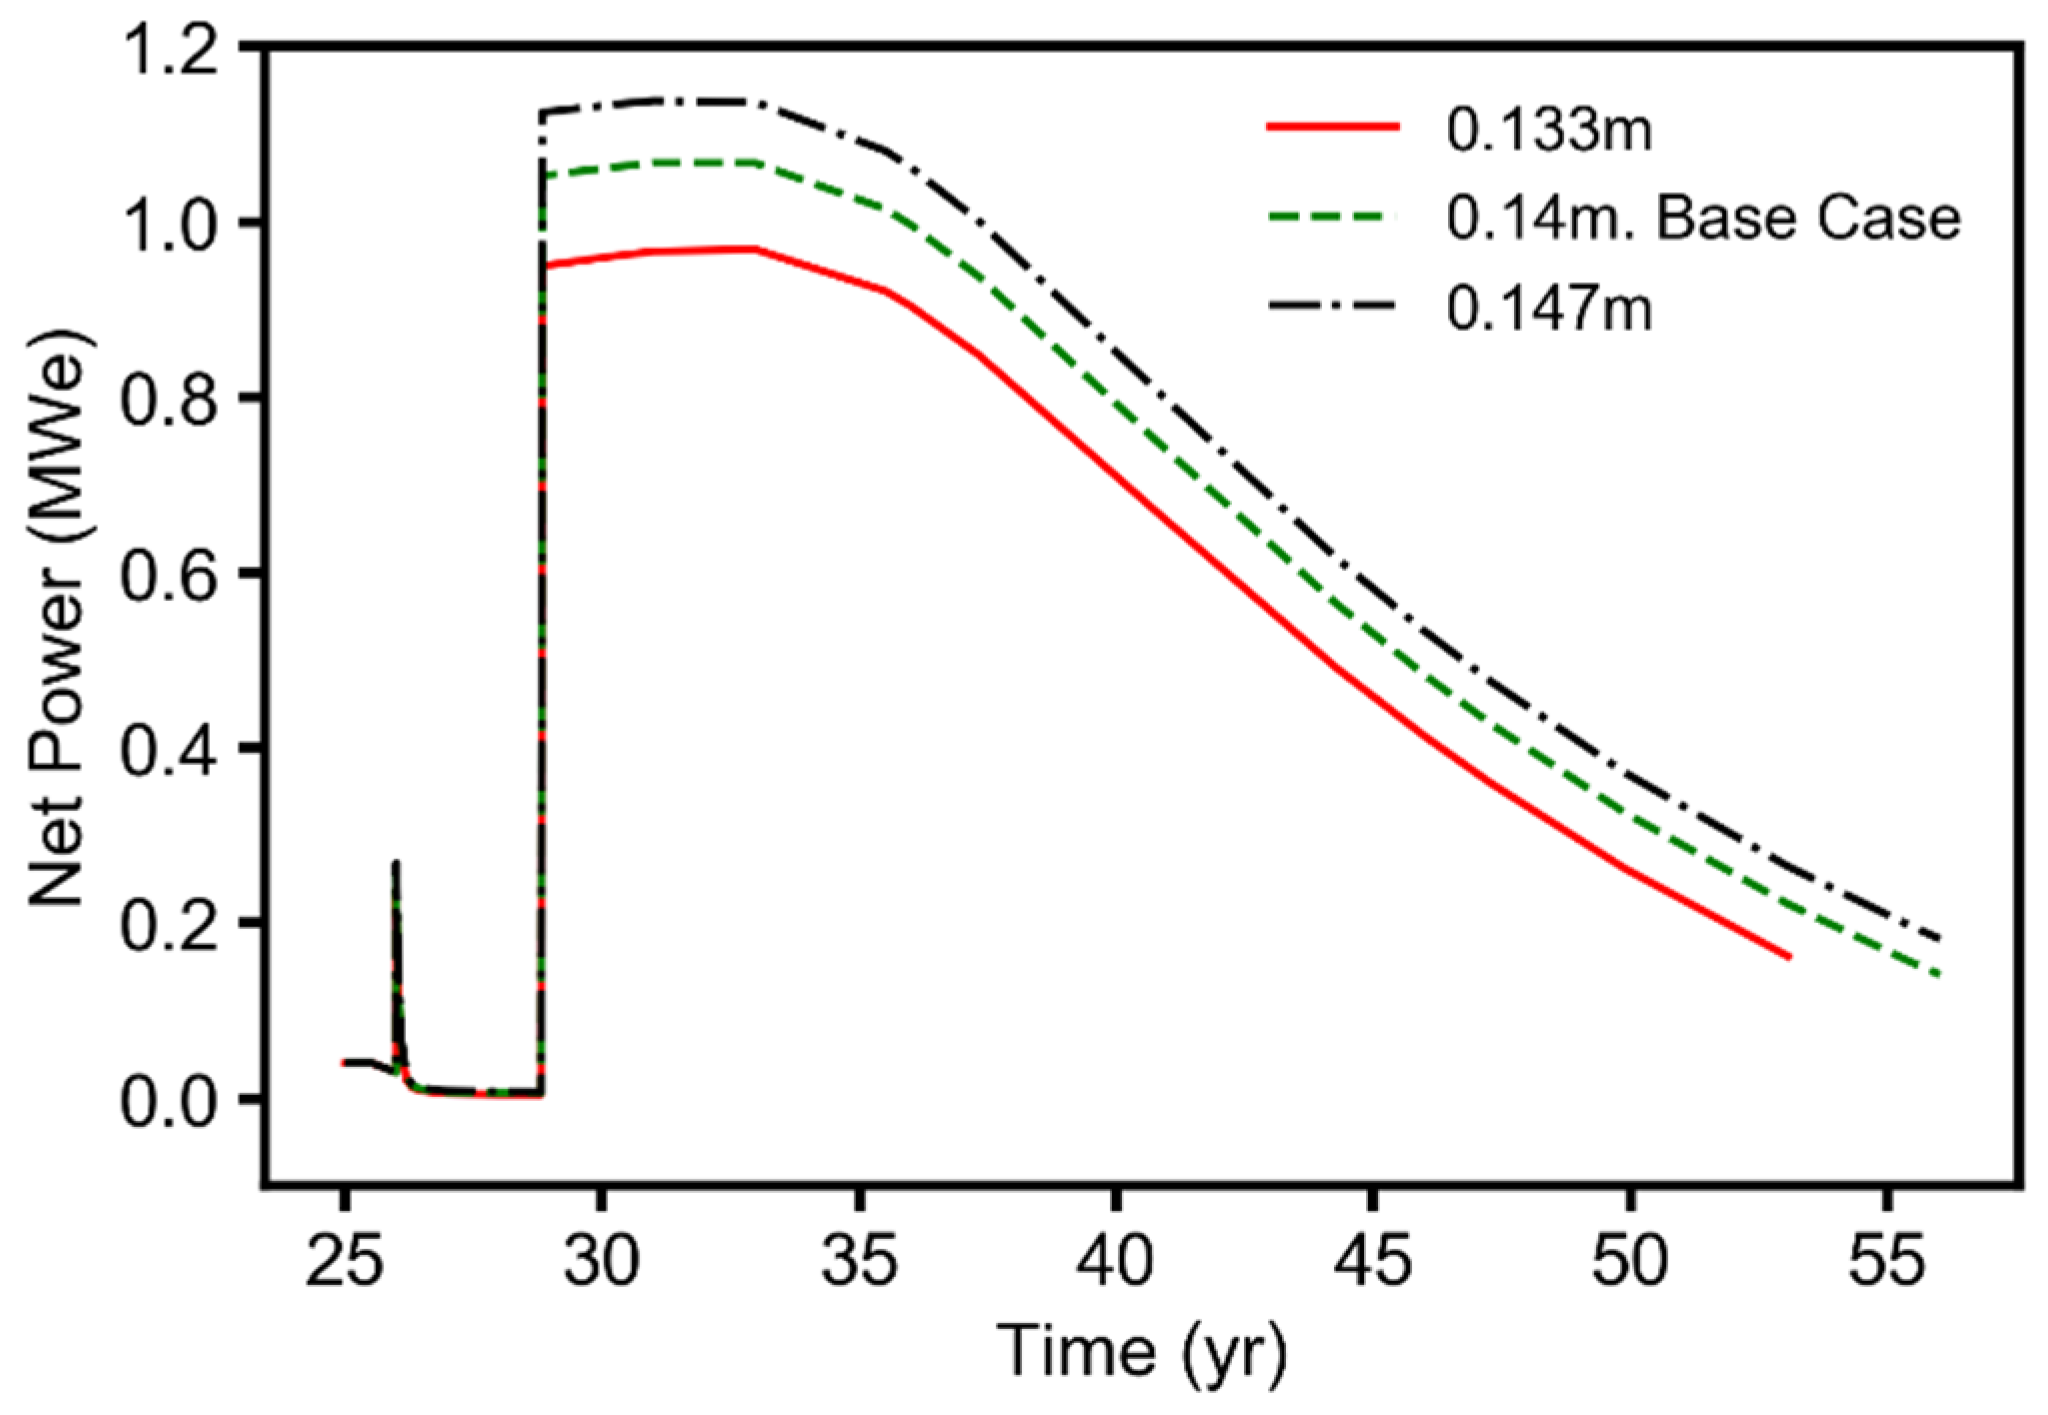
3.2.2. Geothermal Energy (Electricity) Generation Performance during the CNGR, CO2-EGR+TP, and CPG Stages

During the CNGR stage, the average net power and electricity generated by the base-case example (i.e., case 1-B, described in Section 3.1) were 0.042 MWe and 9.16 GWeh over 25 years. The time series plots of the simulation results, showing the net power generated for the different parameters considered in this study, can be found in the Appendix A (Figure A3, Figure A4, Figure A5, Figure A6, Figure A7 and Figure A8). Figure 6 shows that the most sensitive parameter that influenced the net electrical geothermal energy generated during the CNGR stage was the reservoir temperature (σ = +5.0), followed by the mean surface ambient temperature (σ = –0.5). It is no surprise that the net energy generated increased with an increase in reservoir temperature, but decreased with an increase in the mean surface ambient temperature. The permeability anisotropy parameter was the least sensitive parameter for this performance metric during the CNGR stage. The sensitivity value (–0.0015) for the permeability anisotropy differed by 3 orders of magnitude from that of the reservoir temperature parameter. Figure 6 also shows that, during the CNGR stage, changes in the other parameters considered in this study had little effect on the geothermal energy generation performance, with their sensitivity values of σ < ±0.1.
During the CO2-EGR+TP stage, the average net power and the electricity generated for the base-case example were 0.053 MWe and 1.78 GWeh (over 3.82 years). From Figure 6, we observed that the most sensitive parameter for the CO2-EGR+TP stage was the production wellbore diameter, with σ = +1.50. This is because during this stage, the CO2 mass fraction increases, leading to a higher density of the fluid flowing in the well and causing higher pressure losses due to friction as the well diameter decreases. This reduces the amount of energy extractable from the produced/separated methane. The least sensitive parameter was the mean ambient surface temperature, with σ = +0.028.
During the CPG stage (when the CO2 mass fraction was >90% and only the direct CO2-thermosiphon power system model was used), the average net power and the geothermal energy generated for the base case example were 0.739 MWe and 173.44 GWeh (over 27.18 years). This was about 17.6 and 13.9 times higher than the average net power generated during the CNGR and CO2-EGR+TP stages, respectively. This is due to the use of the direct CPG power system [40] and the increase in production mass flowrate from 4 kg/s to 30 kg/s applied during this stage.
As expected, the most sensitive parameter for this CPG stage was reservoir temperature, with a sensitivity value of σ > +10.0 (Figure 6). The wellbore diameter and the mean surface ambient temperature also showed high sensitivity values because, as the wellbore diameter increases, the fluid pressure and the heat losses decrease, while lower mean surface ambient temperatures favor higher net energy extraction and power generation rates at the land surface. The least sensitive parameter during this CPG stage was the relative permeability with a σ that was more than 2 orders of magnitude lower than that for the reservoir temperature. The relatively sensitivity of horizontal permeability was due to the fact that a constant CO2 flowrate was used in this study. If, instead, the fluid-pressure difference between the injection and the production wells were kept constant, permeability would be a key parameter.
In this study, we observed that reservoir temperature was the most important parameter for the combined CO2-EGR–CPG system, especially during the CNGR and CPG stages. The second most important parameter was the production-wellbore diameter, which can be adjusted, i.e., engineered. Interestingly, the performance metrics, except for pressure buildup, studied here were not particularly sensitive to the van Genuchten relative-permeability parameter for pore-size distribution.

4. Conclusions

We present a reservoir simulation study of a combined CO2 enhanced gas recovery (EGR)-CO2 plume geothermal (CPG) system. We investigated how the residual CH4 content and the CO2-plume establishment (PE) stage affected the performance of the CO2-EGR–CPG system. This performance was quantified by assessing the amount of natural gas recovered, the amount of geothermal energy generated, and whether an annular flow regime could be achieved in the production well when a specified mass flowrate is used. In addition, the sensitivity of the system performance to key reservoir and operational parameters was investigated. Based on the simulation results, our key results and findings were:
  • The PE stage was important to establish the desired annular flow regime near the bottom of the production well, especially when large-diameter wells were used. However, it was possible to achieve an annular flow regime by using wells with smaller diameters;
  • Commencing with the injection of CO2 into the natural gas reservoir before it was completely depleted and including the PE stage increased the natural gas recovery performance of the combined CO2-EGR-CPG system;
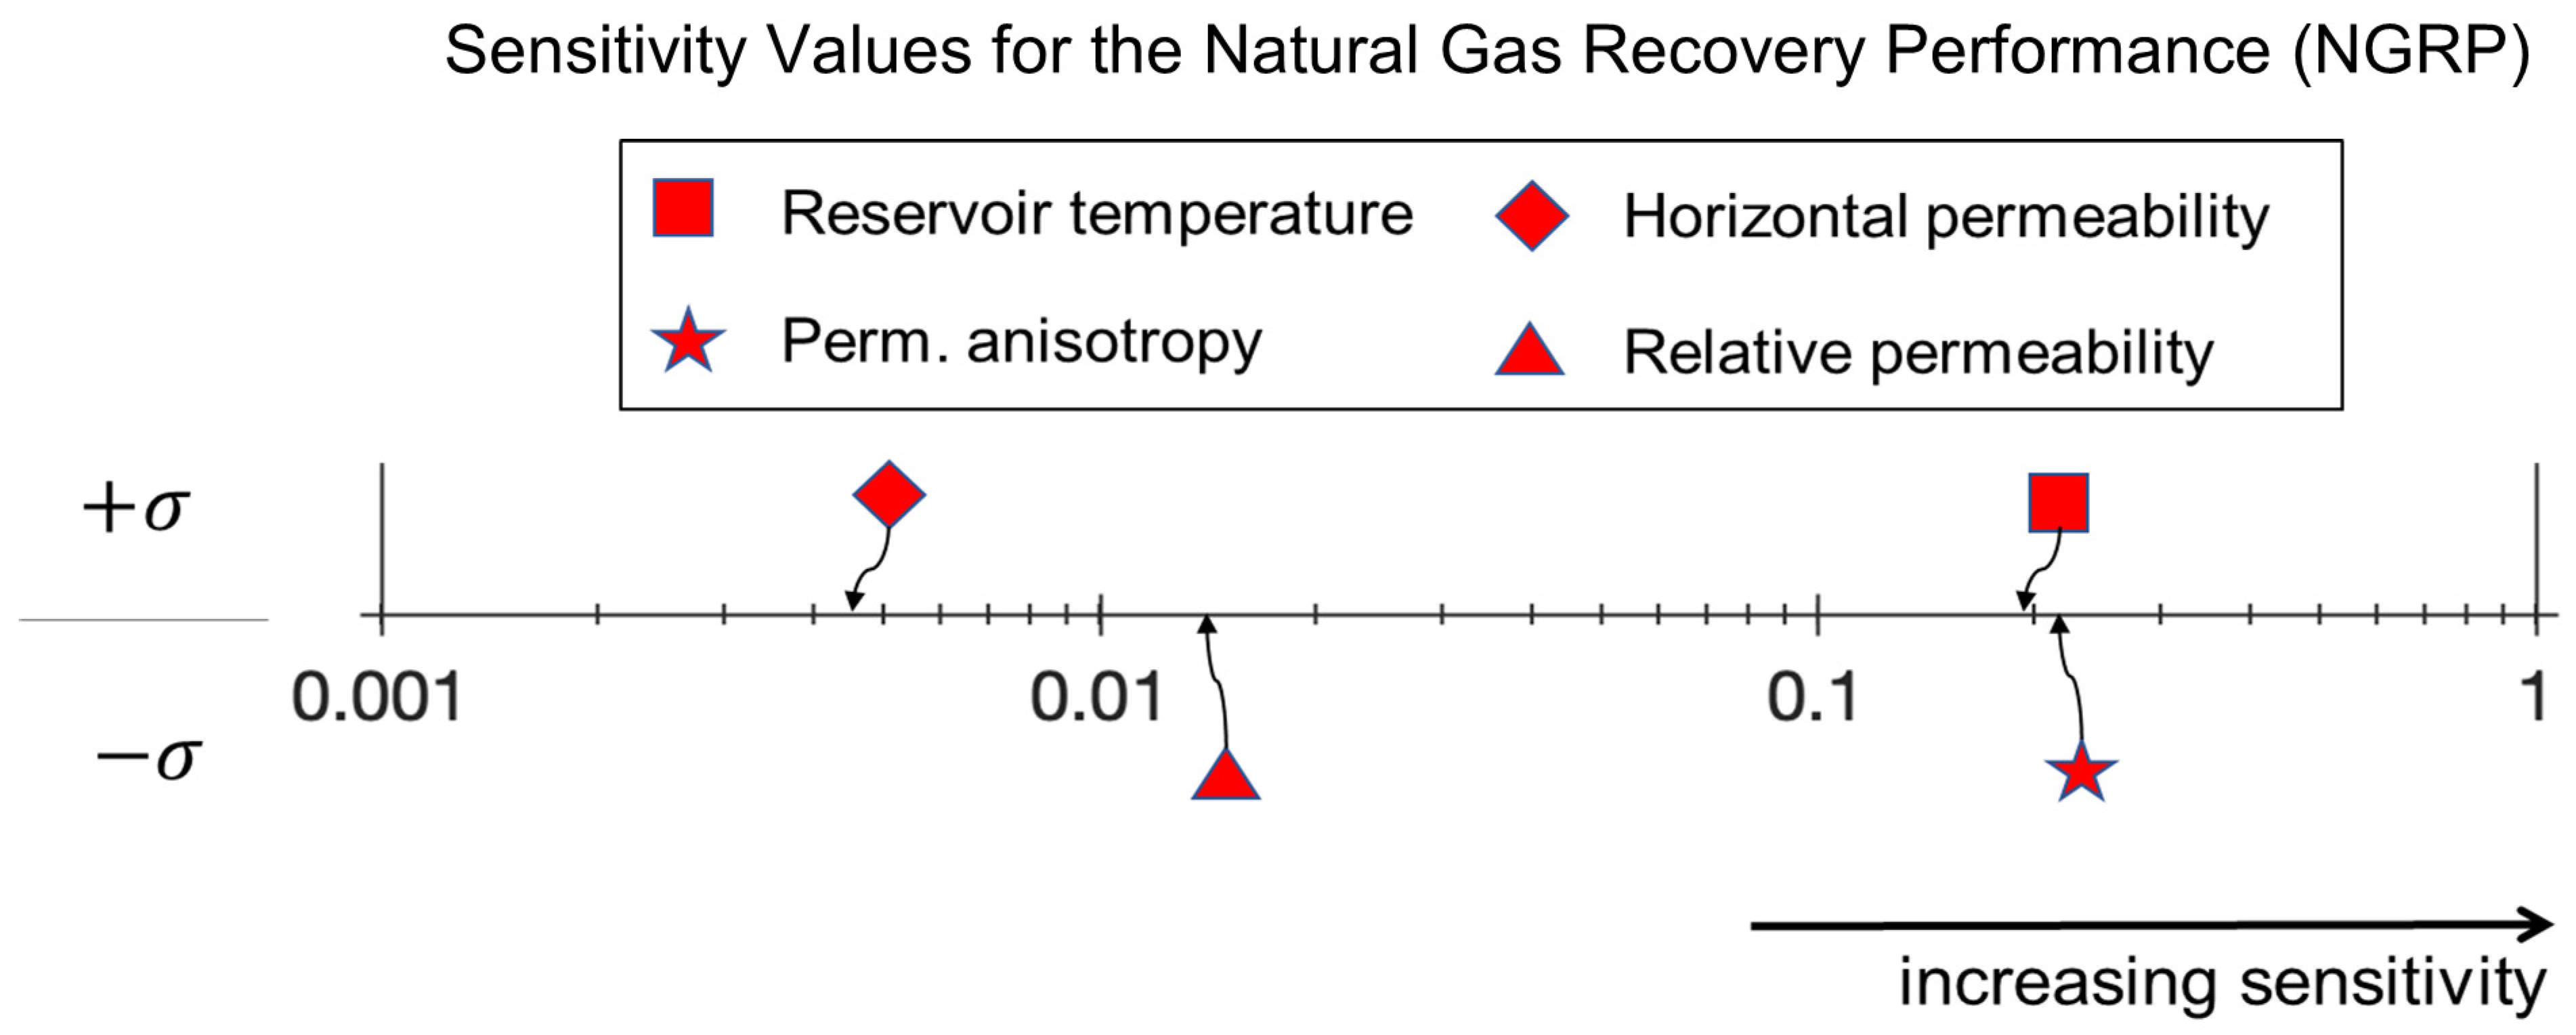
  • Of the four reservoir parameters (permeability anisotropy, horizontal permeability, relative permeability, and reservoir temperature) considered in this study, permeability anisotropy and reservoir temperature were the parameters that most strongly affected the natural gas recovery performance. The fluid pressure buildup at the injection wells was most sensitive to changes in the van Genuchten relative permeability and horizontal-permeability parameters;
  • The sensitivity results revealed that, for a given CO2 flowrate, the reservoir temperature was the parameter the geothermal power generation performance was most sensitive to. The production wellbore diameter was the second most sensitive parameter. Changes in the van Genuchten relative permeability parameter for pore-size distribution did not have a significant influence on the geothermal power generation performance of the combined CO2-EGR-CPG system.

Author Contributions

Conceptualization, J.E. and A.E.; formal analysis, J.E. and A.E.; funding acquisition, M.O.S.; investigation, J.E., D.K. and A.E.; methodology, J.E., A.E. and B.M.A.; resources, M.O.S.; software, J.E. and D.K.; supervision, A.E. and M.O.S.; validation, J.E., A.E., B.M.A. and M.O.S.; visualization, J.E. and D.K.; writing—original draft, J.E.; writing—review and editing, J.E., A.E., B.M.A. and M.O.S. All authors have read and agreed to the published version of the manuscript.

Funding

This research received no external funding. The APC was funded by the ETH Zurich Library.

Acknowledgments

The authors would like to thank the State Secretariat for Education, Research and Innovation (SERI), Switzerland for the Swiss Government Excellence Scholarships for Foreign Scholars and Artists that supported this study. The Werner Siemens Foundation (Werner Siemens-Stiftung) is also thanked by M.O.S. for its support of the Geothermal Energy and Geofluids (GEG.ethz.ch) Group at ETH Zurich, Switzerland.

Conflicts of Interest

The authors declare no conflict of interest.

Appendix A

Figure A1. Percentage of original gas in place (OGIP) recovered during the CNGR and EGR stages for the four reservoir model example cases (a) and the four reservoir parameters (permeability (b), temperature (c), relative permeability (d), and permeability anisotropy (e)).
Energies 14 06122 g0a1aEnergies 14 06122 g0a1b
Figure A2. Simulation results (time-series plots) for the four reservoir model example cases, showing the net geothermal power generated during the EGR and CPG stages (25/26–55/56 years).
Energies 14 06122 g0a2
Figure A3. Simulation results (time-series plots) for the reservoir permeability parameter, showing the geothermal net power generated during the EGR and CPG stages (25–55 years).
Energies 14 06122 g0a3
Figure A4. Simulation results (time-series plots) for the reservoir temperature parameter, showing the geothermal net power generated during the EGR and CPG stages (25–55 years).
Energies 14 06122 g0a4
Figure A5. Simulation results (time-series plots) for the relative permeability (van Genuchten) parameter, showing the geothermal net power generated during the EGR and CPG stages (25–55 years).
Energies 14 06122 g0a5
Figure A6. Simulation results (time-series plots) for the reservoir permeability anisotropy parameter, showing the geothermal net power generated during the EGR and CPG stages (25–55 years).
Energies 14 06122 g0a6
Figure A7. Simulation results (time-series plots) for the mean ambient surface temperature parameter, showing the geothermal net power generated during the EGR and CPG stages (25–55 years).
Energies 14 06122 g0a7
Figure A8. Simulation results (time-series plots) for the well pipe diameter, showing the geothermal net power generated during the EGR and CPG stages (25–55 years).
Energies 14 06122 g0a8

References

  1. Rubin, E.; De Coninck, H. IPCC Special Report on Carbon Dioxide Capture and Storage; Cambridge University Press: Cambridge, UK, 2005. [Google Scholar]
  2. Global Status of CCS: Targeting Climate Change; Global CCS Institute: Docklands, Australia, 2019.
  3. Townsend, A.; Raji, N.; Zapantis, A. The Value of Carbon Capture and Storage (CCS); Global CCS Institute: Docklands, Australia, 2020. [Google Scholar]
  4. Oldenburg, C.M.; Pruess, K.; Benson, S.M. Process modeling of CO2 injection into natural gas reservoirs for carbon sequestration and enhanced gas recovery. Energy Fuels 2001, 15, 293–298. [Google Scholar] [CrossRef]
  5. Oldenburg, C.; Stevens, S.; Benson, S. Economic feasibility of carbon sequestration with enhanced gas recovery (CSEGR). Energy 2004, 29, 1413–1422. [Google Scholar] [CrossRef] [Green Version]
  6. Polak, S.; Grimstad, A.A. Reservoir simulation study of CO2 storage and CO2-EGR in the Atzbach–Schwanenstadt gas field in Austria. In Energy Procedia; Elsevier: Amsterdam, The Netherlands, 2009; Volume 1, pp. 2961–2968. [Google Scholar]
  7. Leeuwenburgh, O.; Neele, F.; Hofstee, C.; Weijermans, P.-J.; de Boer, H.; Oosthoek, P.; Lefebvre, A.; Godderij, R.; Gutierrez-Neri, M. Enhanced Gas Recovery—A Potential ‘U’ for CCUS in The Netherlands. In Energy Procedia; Elsevier: Amsterdam, The Netherlands, 2014; Volume 63, pp. 7809–7820. [Google Scholar]
  8. Koide, H.; Tazaki, Y.; Noguchi, Y.; Iijima, M.; Ito, K.; Shindo, Y. Underground storage of carbon dioxide in depleted natural gas reservoirs and in useless aquifers. Eng. Geol. 1993, 34, 175–179. [Google Scholar] [CrossRef]
  9. Van der Burgt, M.J.; Cantle, J.; Boutkan, V.K. Carbon dioxide disposal from coal-based IGCC’s in depleted gas fields. Energy Convers. Manag. 1992, 33, 603–610. [Google Scholar] [CrossRef]
  10. Papay, J. Improved recovery of conventional natural gas. Part I: Theortical discussion of recovery methods. Erdoel Erdgas Kohle 1999, 6, 302–308. [Google Scholar]
  11. Papay, J. Improved recovery of conventional natural gas. Part II: Results of a pilot test. Erdoel Erdgas Kohle 1999, 115, 354–356. [Google Scholar]
  12. Van Der Meer, L.G.; Kreft, E.; Geel, C.; Hartman, J. K12-B A Test site for CO2 storage and enhanced gas recovery. In Proceedings of the SPE Europec/EAGE Annual Conference and Exhibition, Madrid, Spain, 13–16 June 2005; pp. 1–9. [Google Scholar]
  13. Van Der Meer, B.L.G.H.; Arts, R.J.; Geel, C.R.; Hofstee, C.; Winthaegen, P.; Hartman, J.; D’Hoore, D. K12-B: Carbon Dioxide Injection in a Nearly Depleted Gas Field Offshore the Netherlands. In Carbon Dioxide Sequestration in Geological Media—State of the Science; Grobe, M., Pashin, J.C., Dodge, R.L., Eds.; American Association of Petroleum Geologists: Tulsa, OK, USA, 2009; Volume 59, pp. 379–390. [Google Scholar]
  14. Denney, D. Technical and economic challenge of mature gas fields: The Giant Altmark Field, Germany. J. Pet. Technol. 2006, 58, 38–39. [Google Scholar] [CrossRef]
  15. Kühn, M.; Förster, A.; Großmann, J.; Meyer, R.; Reinicke, K.; Schäfer, D.; Wendel, H. CLEAN: Preparing for a CO2-based enhanced gas recovery in a depleted gas field in Germany. In Energy Procedia; Elsevier: Amsterdam, The Netherlands, 2011; Volume 4, pp. 5520–5526. [Google Scholar]
  16. Kühn, M.; Tesmer, M.; Pilz, P.; Meyer, R.; Reinicke, K.; Förster, A.; Kolditz, O.; Schäfer, D. CLEAN Partners CLEAN: Project overview on CO2 large-scale enhanced gas recovery in the Altmark natural gas field (Germany). Environ. Earth Sci. 2012, 67, 311–321. [Google Scholar] [CrossRef]
  17. Oldenburg, C.M.; Benson, S.M. CO2 injection for enhanced gas production and carbon sequestration. In Proceedings of the SPE International Petroleum Conference and Exhibition in Mexico, Villahermosa, Mexico, 10–12 February 2002; Society of Petroleum Engineers: Richardson, TX, USA, 2002; pp. 1–10. [Google Scholar]
  18. Oldenburg, C.M. Carbon dioxide as cushion gas for natural gas storage. Energy Fuels 2003, 17, 240–246. [Google Scholar] [CrossRef] [Green Version]
  19. Jikich, S.A.; Smith, D.H.; Sams, W.N.; Bromhal, G.S. Enhanced Gas Recovery (EGR) with Carbon Dioxide Sequestration: A Simulation Study of Effects of Injection Strategy and Operational Parameters. In Proceedings of the SPE Eastern Regional Meeting, Pittsburgh, PA, USA, 6–10 September 2003; Society of Petroleum Engineers: Richardson, TX, USA, 2003; pp. 1–9. [Google Scholar]
  20. Rückheim, J.; Voigtlaender, G.; Stein-Khokhlov, M. The Technical and Economic Challenge of “Mature Gas Fields”: The Giant Altmark Field, a German Example. In Proceedings of the SPE Europec/EAGE Annual Conference, Madrid, Spain, 13–16 June 2005; Society of Petroleum Engineers: Richardson, TX, USA, 2005; pp. 1–4. [Google Scholar]
  21. Gou, Y.; Hou, Z.; Liu, H.; Zhou, L.; Were, P. Numerical simulation of carbon dioxide injection for enhanced gas recovery (CO2-EGR) in Altmark natural gas field. Acta Geotech. 2014, 9, 49–58. [Google Scholar] [CrossRef]
  22. Procesi, M.; Cantucci, B.; Buttinelli, M.; Armezzani, G.; Quattrocchi, F.; Boschi, E. Strategic use of the underground in an energy mix plan: Synergies among CO2, methane geological storage and geothermal energy. Latium Region case study (Central Italy). Appl. Energy 2013, 110, 104–131. [Google Scholar] [CrossRef]
  23. Clemens, T.; Secklehner, S.; Mantatzis, K.; Jacobs, B. Enhanced gas recovery, challenges shown at the example of three gas fields. In Proceedings of the SPE EUROPEC/EAGE Annual Conference and Exhibition, Barcelona, Spain, 14–17 June 2010; pp. 1–17. [Google Scholar]
  24. Polak, S.; Zweigel, J.; Lindeberg, E.; Pannetier-Lescoffit, S.; Schulz, H.-M.; Faber, E.; Teschner, M.; Poggenburg, J.; May, F.; Krooss, B.; et al. The Atzbach-Schwanenstadt gas field—A potential site for onshore CO2 storage and EGR. Geophysics 2006, 25, 1272–1275. [Google Scholar] [CrossRef]
  25. Khan, C.; Amin, R.; Madden, G. Carbon dioxide injection for enhanced gas recovery and storage (reservoir simulation). Egypt. J. Pet. 2013, 22, 225–240. [Google Scholar] [CrossRef] [Green Version]
  26. Regan, M.L.M. A Numerical Investigation into the Potential to Enhance Natural Gas Recovery in Water-Drive Gas Reservoirs through the Injection of CO2. Ph.D. Dissertation, The University of Adelaide, Adelaide, Australia, 2010. [Google Scholar]
  27. Xie, H.; Li, X.; Fang, Z.; Wang, Y.; Li, Q.; Shi, L.; Bai, B.; Wei, N.; Hou, Z. Carbon geological utilization and storage in China: Current status and perspectives. Acta Geotech. 2014, 9, 7–27. [Google Scholar] [CrossRef]
  28. Shi, Y.; Jia, Y.; Pan, W.; Huang, L.; Yan, J.; Zheng, R. Potential evaluation on CO2-EGR in tight and low-permeability reservoirs. Nat. Gas Ind. B 2017, 4, 311–318. [Google Scholar] [CrossRef]
  29. Rybach, L. Geothermal energy: Sustainability and the environment. Geothermics 2003, 32, 463–470. [Google Scholar] [CrossRef]
  30. Axelsson, G.; Stefánsson, V.; Björnsson, G.; Liu, J. Sustainable management of geothermal resources and utilization for 100–300 years. In Proceedings of the World Geothermal Congress, Antalya, Turkey, 24–29 April 2005; International Geothermal Association: Bonn, Germany, 2005; pp. 1–8. [Google Scholar]
  31. Lund, J.W.; Boyd, T.L. Direct utilization of geothermal energy 2015 worldwide review. Geothermics 2016, 60, 66–93. [Google Scholar] [CrossRef]
  32. Brown, D.W. A hot dry rock geothermal energy concept utilizing supercritical CO2 instead of water. In Proceedings of the Twenty-Fifth Workshop on Geothermal Reservoir Engineering, Stanford, CA, USA, 24–26 January 2000; pp. 1–6. [Google Scholar]
  33. Pruess, K. Enhanced Geothermal Systems (EGS) comparing water with CO2 as heat transmission fluids. In New Zealand Geothermal Workshop; University of Auckland: Auckland, New Zealand, 2007; pp. 1–13. [Google Scholar]
  34. Pruess, K. Enhanced geothermal systems (EGS) using CO2 as working fluid-A novel approach for generating renewable energy with simultaneous sequestration of carbon. Geothermics 2006, 35, 351–367. [Google Scholar] [CrossRef] [Green Version]
  35. Randolph, J.B.; Saar, M.O. Combining geothermal energy capture with geologic carbon dioxide sequestration. Geophys. Res. Lett. 2011, 38, 1–7. [Google Scholar] [CrossRef] [Green Version]
  36. Pruess, K. On production behavior of enhanced geothermal systems with CO2 as working fluid. Energy Convers. Manag. 2008, 49, 1446–1454. [Google Scholar] [CrossRef] [Green Version]
  37. Wang, C.L.; Cheng, W.L.; Nian, Y.L.; Yang, L.; Han, B.B.; Liu, M.H. Simulation of heat extraction from CO2-based enhanced geothermal systems considering CO2 sequestration. Energy 2018, 142, 157–167. [Google Scholar] [CrossRef]
  38. Majer, E.L.; Baria, R.; Stark, M.; Oates, S.; Bommer, J.; Smith, B.; Asanuma, H. Induced seismicity associated with Enhanced Geothermal Systems. Geothermics 2007, 36, 185–222. [Google Scholar] [CrossRef]
  39. Amann, F.; Gischig, V.; Evans, K.; Doetsch, J.; Jalali, R.; Valley, B.; Krietsch, H.; Dutler, N.; Villiger, L.; Brixel, B.; et al. The seismo-hydromechanical behavior during deep geothermal reservoir stimulations: Open questions tackled in a decameter-scale in situ stimulation experiment. Solid Earth 2018, 9, 115–137. [Google Scholar] [CrossRef] [Green Version]
  40. Randolph, J.B.; Saar, M.O. Coupling Carbon Dioxide Sequestration with Geothermal Energy Capture in Naturally Permeable, Porous Geologic Formations: Implications for CO2. In Energy Procedia; Elsevier: Amsterdam, The Netherlands, 2011; Volume 4, pp. 2206–2213. [Google Scholar]
  41. Garapati, N.; Randolph, J.B.; Saar, M.O. Brine displacement by CO2, energy extraction rates, and lifespan of a CO2-limited CO2-Plume Geothermal (CPG) system with a horizontal production well. Geothermics 2015, 55, 182–194. [Google Scholar] [CrossRef] [Green Version]
  42. Adams, B.M.; Kuehn, T.H.; Bielicki, J.M.; Randolph, J.B.; Saar, M.O. On the importance of the thermosiphon effect in CPG (CO2 plume geothermal) power systems. Energy 2014, 69, 409–418. [Google Scholar] [CrossRef]
  43. Adams, B.M.; Kuehn, T.H.; Bielicki, J.M.; Randolph, J.B.; Saar, M.O. A comparison of electric power output of CO2 Plume Geothermal (CPG) and brine geothermal systems for varying reservoir conditions. Appl. Energy 2015, 140, 365–377. [Google Scholar] [CrossRef]
  44. Adams, B.M.; Vogler, D.; Kuehn, T.H.; Bielicki, J.M.; Garapati, N.; Saar, M.O. Heat Depletion in Sedimentary Basins and its Effect on the Design and Electric Power Output of CO2 Plume Geothermal (CPG) Systems. Renew. Energy 2021, 172, 1393–1403. [Google Scholar] [CrossRef]
  45. Ezekiel, J.; Ebigbo, A.; Adams, B.M.; Saar, M.O. Combining natural gas recovery and CO2-based geothermal energy extraction for electric power generation. Appl. Energy 2020, 269, 1–21. [Google Scholar] [CrossRef]
  46. Fleming, M.R.; Adams, B.M.; Kuehn, T.H.; Bielicki, J.M.; Saar, M.O. Increased Power Generation due to Exothermic Water Exsolution in CO2 Plume Geothermal (CPG) Power Plants. Geothermics 2020, 88, 101865. [Google Scholar] [CrossRef]
  47. Norouzi, A.M.; Babaei, M.; Han, W.S.; Kim, K.-Y.; Niasar, V. CO2-plume geothermal processes: A parametric study of salt precipitation influenced by capillary-driven backflow. Chem. Eng. J. 2021, 425, 130031. [Google Scholar] [CrossRef]
  48. Cui, G.; Ren, S.; Rui, Z.; Ezekiel, J.; Zhang, L.; Wang, H. The influence of complicated fluid-rock interactions on the geothermal exploitation in the CO2 plume geothermal system. Appl. Energy 2017, 227, 49–63. [Google Scholar] [CrossRef]
  49. McDonnell, K.; Molnár, L.; Harty, M.; Murphy, F. Feasibility Study of Carbon Dioxide Plume Geothermal Systems in Germany−Utilising Carbon Dioxide for Energy. Energies 2020, 13, 2416. [Google Scholar] [CrossRef]
  50. Cui, G.; Zhang, L.; Ren, S. Assessment of Heat Mining Rate for Geothermal Exploitation from Depleted High-Temperature Gas Reservoirs via Recycling Supercritical CO2. In Energy Procedia; Elsevier: Amsterdam, The Netherlands, 2017; Volume 105, pp. 875–880. [Google Scholar]
  51. Zhang, L.; Li, X.; Zhang, Y.; Cui, G.; Tan, C.; Ren, S. CO2 injection for geothermal development associated with EGR and geological storage in depleted high-temperature gas reservoirs. Energy 2017, 123, 139–148. [Google Scholar] [CrossRef]
  52. Pruess, K.; Oldenburg, C.; Moridis, G. TOUGH2 User’s Guide, Version 2 (Revised); Lawrence Berkeley National Laboratory (LBNL): Berkeley, CA, USA, 2012. [Google Scholar]
  53. Oldenburg, C.M.; Moridis, G.J.; Spycher, N.; Pruess, K. EOS7C Version 1.0: TOUGH2 Module for Cambon Dioxide or Nitrogen in Natural Gas (Methane) Reservoirs; Ernest Orlando Lawrence Berkeley NationalLaboratory: Berkeley, CA, USA, 2004. [Google Scholar]
  54. Ezekiel, J.; Adams, B.M.; Saar, M.O.; Ebigbo, A. Numerical analysis and optimization of the performance of CO2-plume geothermal (CPG) production wells and implications for electric power generation. Geothermics 2021. under review. [Google Scholar]
Figure 1. Quarter model showing the gas (i.e., CH4) saturation in the reservoir pore space after the CNGR stage for the partially depleted (a) and depleted (b) natural gas reservoir model. Note that the part of the model with gas (i.e., CH4) saturation less than 15% (i.e., high brine saturation) has been blanked.
Energies 14 06122 g001
Figure 2. Simulation results for partially depleted (case 1) and depleted (case 2) natural gas reservoirs during the CO2-EGR+TP stage, representing different residual CH4 content with (A) and without (B), including the CO2-plume establishment (PE) stage, showing the minimum gas (i.e., mainly CO2) saturation in the reservoir pore space immediately surrounding the production well inlet (blue bars) and inside the production well (bottom-hole) itself (yellow bars). These results imply that the amount of water in the bottom-hole of the production well is 2.86% vol. (case 1-A), 5.11% vol. (case 1-B), 9.88% vol. (case 2-A), and 20.84% vol. (case 2-B).
Energies 14 06122 g002
Figure 3. Two-phase wellbore flow regime plot showing the total mass flowrate of all fluids [kg/s] over the gas-phase mass fraction [kg/kg] at the bottom of the production well defined as X G w e l l = S G well · ϱ G S L well · ϱ L + S G well · ϱ G , where S G well is the gas-phase saturation in the well, S L well is the water-phase saturation in the well, and ϱ denotes density. The plotted symbols show the lowest gas-phase mass fraction points of the four investigated cases (Table 2) for three production well diameters, D. The lines indicate the minimum flowrate required to achieve the annular flow regime in the production well. Hence, conditions above each line indicate the annular flow regime, while conditions below each line indicate the undesired slug/churn flow regime in the production well.
Energies 14 06122 g003
Figure 4. Sensitivity values (plotted on a logarithmic axis) for the natural gas recovery performance (NGRP) metric for the reservoir parameters considered in this study for the CNGR and the CO2-EGR+TP stages. The positive (upper) part signifies that an increase in the parameter values will improve the NGRP. The negative (lower) part identifies parameters that, when being increased, will result in a decrease in the NGRP.
Energies 14 06122 g004
Figure 5. Sensitivity values (plotted on a logarithmic axis) for the fluid-pressure buildup metric for the reservoir parameters considered in this study. The positive (upper) part signifies that an increase in the parameter values will increase the fluid-pressure buildup. The negative (lower) part identifies parameters that, when being increased, will result in a decrease in the fluid-pressure buildup.
Energies 14 06122 g005
Figure 6. Sensitivity values (plotted on a logarithmic axis) for the geothermal electricity generation performance metric for the reservoir and operational parameters considered in this study. This is calculated for the three main stages of the combined system. The positive (upper) part signifies that an increase in the parameter values will increase the geothermal power output. The negative (lower) part identifies parameters that, when being increased, will result in a decrease in the geothermal power output.
Energies 14 06122 g006
Table 1. Parameters for the base-case reservoir model.
ParameterValue
Reservoir size, x (km), y (km), z (km)4.5 × 4.5 × 0.1
Depth (km)3.0
Porosity (-)0.20
Horizontal permeability, kh (m2)10−13 (100 mD)
Anisotropy kh/kv (-)2.0
Thickness (m)100
Reservoir initial pressureHydrostatic (30 MPa at the reservoir top)
Reservoir initial temperature (°C)120
Initial CO2 mass fraction in gas phase0.025 (dissolved in brine)
Residual gas saturation (-)0.05
Residual brine saturation (-)0.25
van Genuchten parameters α (Pa), m (-)3 × 10³, 0.77
Native brine NaCl saturation (ppm)150,000
Mol. diffusivity in gas; in water (m2/s)10−5; 10−10
Rock grain density (kg/m3)2650
Thermal conductivity λwet, λdry (W/m °C)2.51, 1.6
Rock specific heat capacity (J/kg °C)1000
Geothermal gradient (°C/km)35
Rock compressibility (1/Pa)10−10
CO2 injection enthalpy (J/kg)2.8 × 105
Well diameter (m)0.14
Lateral boundary conditions of the reservoirHydrostatic pressure; 120 °C (Dirichlet boundary conditions)
Top and bottom boundary conditions of the reservoirNo fluid flow and no heat flux
Table 2. Description of the four cases used to show the effects of residual CH4 content and CO2-plume establishment stage on the performance metrics.
CasesCase 1-ACase 1-BCase 2-ACase 2-B
CNGR period (years)25252626
Reservoir typePartially depleted natural gas reservoirPartially depleted natural gas reservoirDepleted natural gas reservoirDepleted natural gas reservoir
PE stage consideredYesNoYesNo
Table 3. Simulation results of the percentages of the original gas in place (OGIP), recovered during the CNGR and CO2-EGR+TP stages, and associated natural gas recovery index (RI).
Cases%OGIP Recovered at CNGR Stage%OGIP Recovered at EGR+TP StageTotal %OGIP Recovered, FURDuration of CO2-EGR+TP Stage (Year)Total Duration of NG Recovery (Year)RI (%/Year)
Case 1-A:
25 years w/PE
83.513.4886.991.5028.503.28
Case 1-B:
25 years no PE
83.517.4390.943.8228.823.16
Case 2-A:
26 years w/PE
86.850.6387.482.0028.003.12
Case 2-B:
26 years no PE
86.852.8489.692.9728.973.10
Table 4. Simulation results for the net geothermal electricity generation performance metrics during the four stages of the combined CO2-EGR–CPG system, calculated for the four cases (considering residual methane content and the PE stage).
CasesNet Electricity Generated at CNGR Stage [GWeh]Net Electricity Generated at CO2-EGR+TP Stage [GWeh] *Net Electricity Generated at CPG Stage [GWeh] **Total Net Electricity Generated during the Project [GWeh]
Case 1-A:
25 years w/PE
9.1630.676232.048241.887
Case 1-B:
25 years no PE
9.1631.767173.443184.373
Case 2-A:
26 years w/PE
9.2460.484214.514224.244
Case 2-B:
26 years no PE
9.2460.599199.342209.184
* The duration of the respective CO2-EGR+TP stage, for each of the four cases, is given in Table 3. ** The duration of the respective CPG stage, for each of the four cases, was calculated as the end year—the durations of the CNGR and CO2-EGR+TP stages.
Publisher’s Note: MDPI stays neutral with regard to jurisdictional claims in published maps and institutional affiliations.

