1. Introduction
Solar photovoltaic (PV) technology is playing a fundamental role in the transition of the energy sector towards renewable energies sources. Thanks to the continuous technology advances in the field, along with policy support, the sector is expected to reach the era of terawatt-scale PV generation by 2022 [
1]. At the same time, advanced agriculture based on modern greenhouses, combined with automated control of the internal temperature, shading and irrigation, demands an increasing amount of available electricity [
2]. Most often, the medium to large distance from greenhouses to the grid requires an additional investment in order to build the connection, which together with the increasing price of retail electricity makes attractive the option of local in situ electricity generation. For this purpose, the best option is photovoltaic technology, but those systems will require land use, and although greenhouses and photovoltaics are usually installed in sunny areas, the competition for the available surface is high. In this context, spatial management considerations when deploying PV systems are essential in order to avoid land conflicts. Many varied solutions have emerged in the sector that consider a double-function criterion for land use: agriculture and PV electricity generation. Thus, PV applications, such as building integration photovoltaics, floating PV or agrivoltaics (also known as agrophotovoltaics in a German context and solar sharing in a Japanese context), are attracting the attention of research, industry and public institutions in recent years, bringing new challenges and opportunities. The energy efficiency of buildings and other structures in rural areas has been extensively studied in recent years, either with empirical methods, which show potential energy savings up to 29% in two-story rural residential buildings [
3], or with more sophisticated machine learning methods applied to experimental ad-hoc systems using novel solar collectors [
4].
In the case of agrivoltaic systems, the concept of a dual land-use approach for both solar photovoltaic power generation and agricultural crop production was conceived by Goetzberger and Zastrow in 1982 [
5]. They proposed to elevate the structure and the distance between rows in order to achieve uniform radiation on the ground and facilitate the movement of mechanized agricultural equipment. This approach helped to minimize the conflict between sustainable food production and renewable energy development. Many studies have pointed out the potential of agrivoltaics from different perspectives, depending on the geographical location, weather conditions, and land availability, where crops need to grow under a controlled micro-climate. In this case, the implementation of PV into agricultural settings is achieved by integrating PV modules into the greenhouse’s envelope. However, replacing conventional cover material with PV inevitably affects the climatic conditions inside the greenhouse, which is directly related to optimal growth and production. Greenhouses which include photovoltaic modules as a structural component, both in the roof and walls, appear to be the best solution [
2,
6]. In recent years, many studies have been devoted to the design, modelling, construction and testing of greenhouses with integrated photovoltaic systems [
7,
8]; an extensive literature review of PV technologies to be applied in greenhouses has been carried out by some authors [
4,
7,
8,
9], and with a special focus on key strategies of energy saving and climate control technologies for greenhouses [
10].
A major difficulty for PV-integrated greenhouses is sharing the solar spectrum between the photovoltaic modules and crop growth, because light absorption by the modules in the photosynthetically active radiation (PAR) regions of the spectrum may reduce the crop yield. This problem has been addressed by different means: optical methods, which selectively focus different wavelengths on modules and plants [
11]; photovoltaic technologies, which allow for engineered band absorptions [
12]; or semi-transparent modules [
13,
14] and the use of luminescent solar concentrators [
15]. Nevertheless, in all cases, the crop yield is modified by the inclusion of the photovoltaic modules in the greenhouse, but sharing the solar spectrum can be tailored in such a way that an optimal global compromise is obtained [
16,
17,
18]. Considering the profitability of land use, Dupraz et al. [
19] found that the potential of land productivity can be increased by 35–73%; Dinesh and Pearce [
20] showed an increase in economic value of over 30%, considering the generated solar electricity together with shade-tolerant crops instead of conventional agriculture; and Marrou et al. [
21] showed that these systems could contribute to the reduction of evapotranspired water by 14–29%, thus leading to economic savings. From the point of view of crop production, there is a reduction when the land has to be shared with PV systems on top of the crops (either integrated in the greenhouse or in open, elevated structures). In the greenhouse case, the characterization of the microclimate conditions inside of a PV greenhouse is a challenge, because it depends on the PV technology, layout, greenhouse materials, crop type and weather conditions. Cossu et al. [
17] studied a PV greenhouse with 50% PV roof coverage, with a focus on the ways in which partial shading affects internal temperature, humidity and light distribution for the production of tomatoes. Kavga et al. [
22] investigated the response associated to the effects of the solar radiation intensity, temperature and humidity of lettuce and rocket in a small-scale experimental greenhouse with a PV system which covers the 12% of the roof. Marucci and Cappuccini [
23] considered a dynamic approach as a passive cooling system to control the microclimate inside the structure using PV and reflective aluminium mirrors. In general, most of the results indicate that PV module coverage in the range of 20% of the surface could lead to a crop yield reduction of between 25% and 5%, depending on the cultivated product, and affecting in a different way the biomass production (almost unaffected), but with higher impacts on the quality of production (fruit size, hardness, or color) [
19,
24,
25]. Nevertheless, many greenhouses are designed with much higher coverages, larger than 50% and in some cases, and up to 100%, assuming that a reduction in crop yield will be compensated be revenues in the electricity market (or savings in electricity consumption), which requires that grid connection is available at the site of the photovoltaic greenhouse (or that the distance is not too large to construct a local grid), such that the generated electricity can be injected into the grid [
17]. Therefore, many system topologies are designed to maximize electricity production either in a self-consumption scheme (with or without net balance) or to sell the electricity at retail price. In both cases, the integration of the photovoltaic system into the structure of the greenhouse is the option which maximises the land use.
A complementary strategy for passive thermal control lies in the color tuning of the building envelope materials in order to modify the overall heat flux, and therefore the inside-building volume temperature [
26]. Chromogenic materials, which are able to modify their optical absorption spectra in response to external stimuli (temperature, electric potential or light, among others) have been extensively studied in the past as intelligent building envelopes, resulting in existing commercially-available technologies, especially in the field of smart windows based on electrochromic materials [
27,
28]. The massive implementation of these technologies remains elusive, with the cost, fabrication complexity, and exigent control mechanisms being some of the reasons that can be pointed out for that. The use of these technologies in structures such as greenhouses remains practically unexplored. In this context, the use of simplified configurations, such as those corresponding to thermochromic materials that can be applied as a paint, without the need of further substrates and zero-energy consumption, appears to be a promising route. It is worth noting, however, that these materials suffer from an intense photodegradation aspect that needs to be improved in order to allow their use in external climate conditions.
This article is focused on the thermal properties of the photovoltaic modules which are integrated into the greenhouse structure. In particular, the thermal behaviour of the modules (operating temperature) and the impact on the internal temperature of the greenhouse was studied experimentally in four structures (coined PV cubes) for four photovoltaic technologies: crystalline silicon (c-Si), amorphous silicon (a-Si:H), cadmium telluride (CdTe), and polymeric organic (OPV). The temperature of the modules (its internal and external faces for all orientations: east, west, south, north and horizontal), the internal temperature of the structure, the and ambient parameters (solar irradiance and external temperature) were recorded continuously, every five minutes, for more than two years; the details of the PV cubes and the monitoring system are summarized in
Section 2, and described in detail by Toledo et al. [
29,
30]. Additionally, other materials (brick, wood, plasterboard and glass) were characterized in a laboratory using artificial halogen lamp light with irradiances generated in the range of 200–900 W/m
2. The data were analysed using simple thermal models to obtain the thermal parameters of the PV modules and
supplementary materials, and the overall heat transfer of the structures, which were then used to calculate the internal temperature of the structures by using a heat transfer model; the thermal properties of the additional materials, other than the photovoltaic modules to be used in the construction of the greenhouses, were also characterized experimentally. Finally, an additional strategy for passive thermal control was explored, consisting in the color tuning of the building envelope materials in order to modify the overall heat flux and therefore the inside area temperature. The results are presented and discussed in
Section 3, in which all of the measured thermal properties of the materials were considered in a more general model in order to describe the thermal behaviour of a greenhouse in any irradiance and ambient temperature conditions. The conclusions are presented in
Section 4.
2. Methodology: Thermal Models and Experimental Systems
The experimental test of the four PV technologies was carried out on structures built with the corresponding PV modules (and a small addition of aluminium and polycarbonate), while the experimental test of the additional building materials was carried out on cubic structures in which the corresponding material was used as the front wall. The experimental data were fitted with models which are explained in detail in the following subsections.
2.1. The Thermal Models
Two simple models were applied; firstly, a dynamical model in which temperature increases with time upon applied irradiation (which is kept constant), and secondly, an energy balance based on a global heat transfer coefficient when irradiance varies in outdoor experiments.
Many of the parameters that characterize the thermal behaviour of PV modules as building elements can be selected, but in this case study, the objective is to select only a few of them, and to obtain good energy modelling for the greenhouse. Among the thermal parameters that describe the thermal performance of any building envelope element, we selected the global heat transfer coefficient, well known as U-value, which is the most widespread in the field. It is defined as the rate of transfer of heat through a building element (which can be a single material or a composite), divided by the difference in temperature across that element (units: W/m
2 K). In this sense, the better insulated the constructive element is, the lower the U-value will be. Its value can be calculated by Equation (1).
where
q is the density of the heat flow rate (W/m
2) through the element, and
Ti and
Te are the indoor and outdoor ambient temperatures, respectively. In our case, these temperatures correspond to the external environmental temperature and the internal temperature achieved within the PV cube. The thermal conductivity of the PV modules is obtained experimentally by a linear fitting of the temperature difference between the module faces normalized by its thickness as a function of the irradiance (using the horizontal surface as a reference) and expressed in W/m per Kelvin, or W/m K.
Finally, a simple static equilibrium thermal model is proposed to calculate the inner temperature of the greenhouse through the combination of the experimental parameters obtained for the PV modules and the additional building materials, and its evolution along a selected day.
The model takes into account the energy equilibrium and heat transfer through all of the surfaces of the experimental structures, with the aim to calculate the internal temperature of the structure at any time during the day. The thermal coefficients of the PV panels and the additional building materials are proposed as the input for the model (they were obtained from literature or measured experimentally [
29]; those technical parameters together with the ambient parameters, such as irradiance and temperature, were again obtained from databases such as the Photovoltaic Geographical Information System (PVGIS) and measured experimentally in-situ during two years), providing enough input to obtain the internal temperature of the structures at any time during the day and night.
Complementary to this model applied to the PV cubes, in the case of chromic boxes, we implemented a 1-D transient heat conduction finite difference model, which is explained in more detail in
Section 3.6 and the
Supplementary Information sections.
2.2. The Experimental Systems
Two different experimental systems were used in order to validate the models and to measure the experimental parameters: the PV cubes and the chromic boxes (
Figure 1).
The first is a set of four photovoltaic cubes (the so called ‘PV cubes’), which are described in detail elsewhere [
29,
30]. Commercial modules were used to build a cubic structure with a volume of 1.4 m
3, in which all of the faces are composed of PV modules (one module in the east, west, north and south faces, and two modules in the horizontal surface; the floor is a polycarbonate square, 10 mm thick, with a U-value 3.02 W/m
2), the corners are made of aluminium profiles (4 cm × 4 cm), and small pieces of polycarbonate were added to match the size of the modules, in order to close the structures and guarantee the good matching of all of the modules and an equal volume in all of the structures. The electrical and mechanical characteristics of the modules used to build the PV cubes are included in
Table S1 in the
Supplementary Information.
An automated data acquisition system was designed and fabricated in order to measure the temperature in all of the faces of the PV modules (inner and outer faces) and the internal temperature of the module; the data transmission was carried out by radio-frequency, and the data were stored in a remote computer. The irradiance data was measured using a pyranometer (model DeltaT Device BF5), and the environmental parameters were measured using a meteorological station which records the ambient temperature, humidity, wind speed and direction, and an additional irradiance measurement (model Froggit WH3080). The temperature parameters that were measured in the PV cubes are the following: the surface temperature of each module face for each orientation, which deliver ten temperatures for each PV cube (i.e., each technology), and thus a total of forty temperatures were measured every five minutes during two years; additionally, the internal temperature of each structure (four) and ambient temperature (one, common for all structures because they are installed in the same location), were also measured every five minutes during two years.
The second set of experimental structures are formed of smaller cubes of building materials of different colors, which are therefore called ‘chromic boxes’. Four different construction materials (brick + mortar, pine wood, plasterboard and glass) were tested, consisting in 25 × 25 cm2 square pieces which were 3.5 cm, 2.7 cm, 1.75 cm and 1.75 cm thick, respectively. The samples were painted with either white or black acrylic commercial paint. A cubic box (40 × 40 × 36.5 cm3) with removeable walls was used for the thermal tests. The front wall was the corresponding tested material, while the rest of the cube walls were insulated with 2.5 cm thick glass wool panels. The front wall was submitted to a variable known normal incident irradiance coming from a calibrated spotlight (equipped with a 1000 W halogen lightbulb, 3400 K). The calibration of the spotlight was performed with a Kipp & Zonne SP Lite2 pyranometer. A group of sixteen K-type thermocouples were used to monitor the inner and outer surface of the front wall, the inner and outer surface of the insulating wall, the inner air temperature, and the irradiated and non-irradiated air temperature. The temperature data were simultaneously collected through a multiplexer each minute.
3. Results and Discussion
The PV cubes and chromic boxes were tested under outdoor and laboratory conditions, respectively. The data sets were used to characterize the passive heating and cooling mechanisms of both kinds of structures. Their combination and inclusion in future greenhouse structures are discussed.
3.1. Working Conditions: Thermal Stress of the Photovoltaic Modules
The importance of the thermal behaviour of the PV panels used in a fully integrated approach for PV greenhouse systems becomes clear through the strong thermal variation of the air volume present inside the PV cubes when they are compared to the ambient conditions. The internal temperature of the air within the cube (or eventually the greenhouse covered by PV modules) is strongly dependant on the thermal transmission properties of the modules. The temperature gradient throughout the modules was monitored as a function of time by the careful measurement of the temperature differences between the internal (T
rear) and external (T
front) faces of the modules in all orientations (north, south, east, west and horizontal); the other small pieces of aluminium or polycarbonate are not considered, because they only represent minor perturbations to the thermal behaviour of the PV cube. In
Figure 2, the thermal gradient found in the different faces of the PV cube is shown.
Figure 2 shows that the heat input into the volume depends strongly on the orientation of each face, as the irradiation on each face is very different (both the global amount and the direct/diffuse ratio) and changes constantly as the day progresses, creating an imbalance between the temperature of the air inside the PV Cube and the temperature of the different faces. The different orientations of the modules provide different thermal behaviour for each PV technology considered along the day. Thus, the faces that receive more solar radiation, such as the south and horizontal face, are more likely to have the warmest indoor surface temperature compared to the other orientations. The highest recorded value is 76.33 °C for the horizontal inner surface in the a-Si:H structure. Similarly, the thermal stress across each module (the temperature difference between T
rear and T
front) is shown graphically as the deviation from the diagonal (red dashed line) in all of the
Figure 2 plots, with the a-Si:H horizontal panel being the one suffering the maximum thermal stress, which can reach up to +15 °C, with the T
rear temperature being higher than T
front in all cases for c-Si, a-Si:H and CdTe, and the contrary being true for OPV in all orientations except north (due to the polycarbonate support for the cells). It is interesting to emphasize that the OPV north face showed a different behaviour with a strong inversion of the temperature gradient (in this case, T
rear was higher than T
front).
3.2. Thermal Conductivity of Photovoltaic Modules
In order to characterize the ability of the PV modules used in the PV cubes to conduct heat, the thermal conductivity for each PV technology was calculated based on the measured parameters provided by the monitoring system during the analysed period, in a way that takes into account the real working conditions to which the PV modules had been exposed (the horizontal face was taken as the reference for the calculations; the irradiance was directly measured for this orientation, and there was no need to apply transposition models for this surface). Because the temperature of the internal and external face of each PV module was measured experimentally throughout two years (in different irradiance and ambient temperature conditions), the large amount of data provides a good approach for the thermal conductivity, which is calculated by a linear fit to the temperature difference between the surfaces of each PV module (normalized by its thickness) and the irradiance for each data point.
Figure 3 shows the results for each PV technology, including the linear fit.
From the red fitting lines, the values of 0.59, 0.42, 0.77 and 0.78 W/m K can be determined for the c-Si, a-Si:H, CdTe and OPV, respectively. It should be noted from
Figure 3d that the dispersion is greater (R
2 < 0.8) for OPV because the polycarbonate sheet has a nerved structure which allows air flow to pass through the module, and thus this result is more dependent on wind speed and direction, which was not taken into account for the fit.
3.3. Internal Temperature Evolution of the PV Cubes
The modules acting as the façades of the PV cube create an inner space of which the temperature is strongly dependant on the incident irradiation and the thermal properties of the PV modules (with small contributions from other components, such as the aluminium corners and the polycarbonate bottom of each cube). The time evolution of the internal temperature (orange) is shown in
Figure 4, together with the ambient temperature (blue) measured during the two years (measured every five minutes, totalling 184,235 time points,) for the c-Si PV cube (similar data were obtained for all of the cubes). The daily variation (including night time) and seasonal variation are shown as short period and long period oscillations within well-defined boundaries. A detailed plot of three days during July 2017 is shown in
Figure 5; the main features of the thermal behaviour of the PV cube can be summarized with this figure: a strong heating effect during the daytime between the ambient (environment) and internal temperature, and a lower cooling effect during the night-time, with crossing at times when direct beam irradiation appears or disappears. The thermal inertia makes the temperature evolution smoother than the irradiance variations, as can be seen in the part of the graph corresponding to 5th July 2017. It is also worthwhile to mention the effect, during clear days, of the direct beam on the west and east façades, when it creates a doubled peak of internal temperature in the central hours of the day (the histogram of the sky conditions according to Igawa’s classification is shown in
Figure S1 of the
Supplementary Information, with most of days in Murcia being ‘clear’ [
31]).
When the evolution of the internal temperature is plotted as a function of the ambient temperature, an interesting pattern is created: each day closes a cycle with a certain temperature hysteresis [
30]. An example is shown in
Figure 6 for four selected days for the c-Si PV cube (two winter days and two summer days, with very different irradiance patterns, as shown by the figure inset); the functional behaviour is very complex because the functional form of T
int should include contributions from irradiance, ambient temperature, wind speed and direction, and internal and external humidity. The path is not random, but reflects a very complex pattern which evolves along each day.
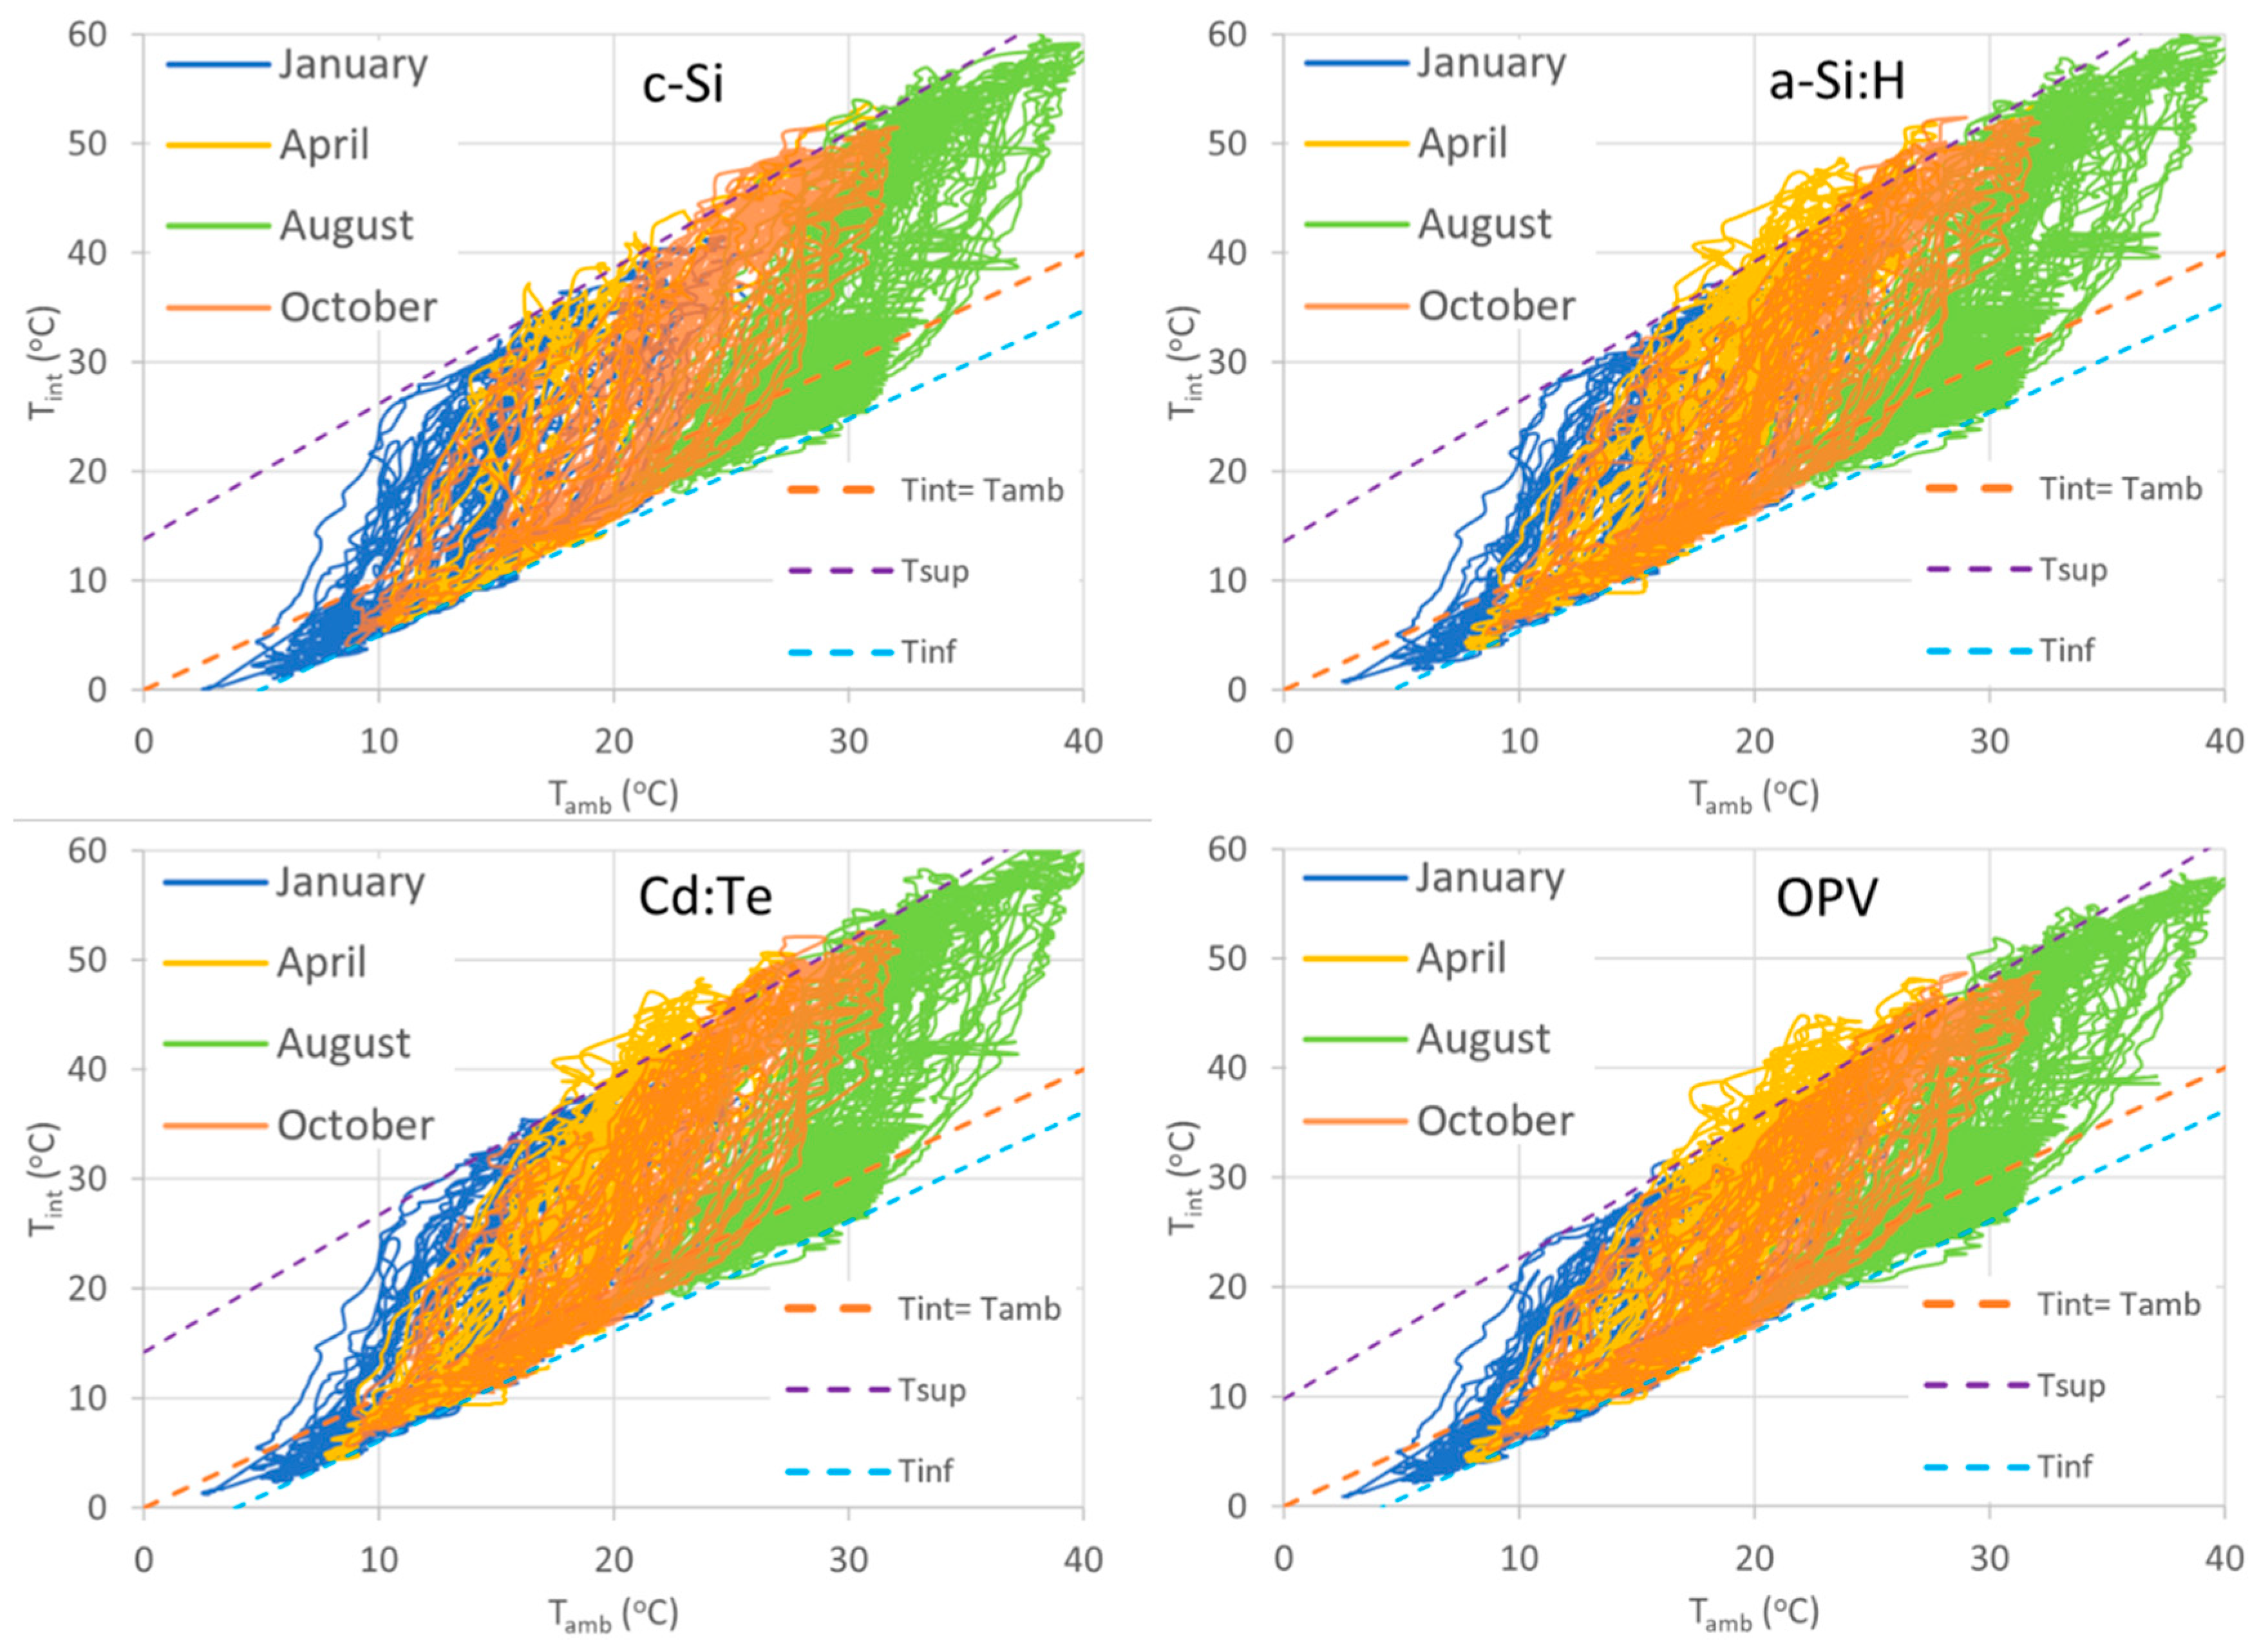
The trend of the plot is clear: the variability of the irradiance draws the main dependence for the dynamic evolution of the inner temperature of the PV cube, but the upper and lower limits of the inner temperature as a function of the ambient temperature are within a well-defined boundary which does not depend on the strong variability of the irradiance. Furthermore, if complete months of data are superimposed, the boundary established with those few data is confirmed. This result is evident from
Figure 7, where all of the daily data for four different months are superimposed in the same graph. Each month has its own boundary, but there is also a global boundary with a similar behaviour for all months.
Therefore, a more useful approach can be taken when all of the days of each month of the year are represented: the complex pattern is always contained within well-defined boundaries. The selection of a boundary for each month can be seen as a rather arbitrary decision (the set will have an initial and final day) but it is useful to represent subsets (by colors) for each month within a full year. This is represented in
Figure 7 for four months (January, April, August, October) which are representative of each season for the four technologies under investigation (all of the days of each month are included in each plot; the fits were carried out with the full data set of 12 months).
The boundary behaviour can be described with a simple linear function for the upper and lower limits indicated in the graph by the slashed lines corresponding to the T
sup (purple) and T
inf (blue) boundaries. The linear trend for both limits is valid for all months, and can be represented by Equation (2):
where T
bound can be defined for the upper limit (label T
sup in the graph) and for the lower limit (label T
inf in the graph) for the global boundary. Parameters obtained from the fitting are shown in
Table 1.
The slope for the upper limit is around 25% higher than the direct Tint = Tamb dependence for all of the technologies, while the slope for the lower limit could almost be discarded (only a −1% reduction compared with Tint = Tamb). The higher impact is provided by the Tint(0) parameter; strikingly, this is a single parameter which is valid for the boundaries in all months, and it describes all of the technologies with high accuracy; only for organic photovoltaic technology is there a slight deviation in the spring and autumn months in the upper boundary, but even in this case the effect is very robust despite the very different material (the organic modules use a polycarbonate support for the module). This simple model provides a direct method for the estimation of the heating and cooling properties of the PV cubes during day and night times.
The parameter Tint(0), which is described as an upward shift increasing the internal temperature of the PV cube, could also be seen as a temperature lag due to the thermal inertia of the modules, and equivalently, considered as a leftward shift reducing the ambient temperature. Additionally, the change of slope provided by the parameter α is a minor correction to the simple temperature shifts (almost inexistent for the lower temperature boundary). It must be emphasized that, for the purpose of greenhouse applications, only a few thermal parameters can be used for the modelling of the internal temperature swing of the structures throughout the whole year: these are the Tbound (for both the superior and inferior limits) and the α parameter for each technology, out of all of the possible thermal parameters which fully characterize the thermal behaviour of the structures (the temperatures of the internal and external faces of the PV modules on each orientation and for each PV technology; the evolution of the internal temperature throughout the whole year, including day and night; and the thermal stress throughout the modules).
3.4. Global Heat Transfer of PV Cubes
The U-value was obtained experimentally considering an average of all of the surfaces for each PV cube. The evolution of the internal temperature of the PV cubes does not present strong variations between the considered PV technologies, and therefore it will depend mainly on the irradiance and ambient temperatures (external and internal), and will depend less strongly on the variations of the encapsulation of the modules. The average U-value for all of the faces of each PV cube is obtained based on the method proposed by Cornaro et al. [
32] for c-Si technology, in which the U-value is calculated by the minimization of the normalized root mean square error (nRMSE) between the simulated and calculated temperatures using different values of thermal transmittances in the input model. The RMSE is defined as:
where
N is the number of data points with the calculated (
ci) and measured (
mi) values; and the nRMSE is the normalized, scale-independent RMSE, obtained by dividing the obtained absolute value in Equation (3) by the mean of the measured values. For the minimization, a range spanning from 1 to 100 W/m
2 K (see
Figure 8) was considered. The minimum daily nRMSE point delivers a U-value of 41 W/m
2 K, which is very similar for the four PV technologies being tested. This value is high, which is indicative of a poor insulating property, but it should be taken into account that it is an average of all of the orientation and outdoor conditions. Values in the range of 20 to 45 W/m
2 K were reported, in some cases in floating PV systems in which the cooling effect was emphasized [
33]. Finally, if the average U-value of the PV cubes is multiplied by its form factor (cubic volume), a K-value of around 168 W/K m
3 for all of the PV cubes is obtained. This is quite significant because, in order to decrease the internal temperature of the cubes by 20 °C and thus achieve a thermal comfort inside, a large cooling power input will be required (of the order of 10 kW), which is a large value due to the large thermal differences that occur between the two inner and outer environments of the PV cube. This could also be seen as a supplementary heating power that is provided by the PV cube structures, acting as a greenhouse (they are mainly comprised of glass).
However, there are studies showing that static experimental methods are not suitable for PV module thermal characterization because they omit the influence of irradiance impact and considers constant the heat transfer coefficients of the element with respect the ambient conditions [
34,
35]. In general, steady-state equilibrium techniques are useful when the temperature of the material does not change with time, which is not the case of the PV modules, which are very sensitive to irradiance variations, as seen in the previous sections.
In PV modules, the internal and external heat transfer coefficients depend on the temperature, wind conditions, or geometry of the building, and therefore the simplification of these parameters may lead to inaccuracies in the determination of a correct U-value parameter. For example, Sanchez-Palencia et al. [
34] showed how the irradiance impact on the U-value is significant, varying from U = 3.3 W/m
2 K in dark conditions to 3.6 W/m
2 K at 500 W/m
2 and 4.3 W/m
2 K at 1000 W/m
2 under controlled irradiance conditions. Therefore, alternative approaches to the measurement of the in-situ thermal parameter coefficients of PV modules included in structures are strongly required; the measurements carried out in the PV cubes as described in these works are closer to the real environmental conditions of the PV greenhouse thermal performance, and they provide an indication of the great potential for heat accumulation in the greenhouse, as was demonstrated for more conventional building-integrated photovoltaics [
32,
34]. Nevertheless, more sophisticated models which include shadowing, ventilation, and the heat transfer mechanisms of the plants inside the greenhouse are required in order to refine the models and therefore to improve the fitting results, in which the internal and external humidity conditions will also influence the heat transfer rate [
36]; such refined models are beyond the scope of this article, and should be considered in future approaches.
3.5. Thermal Response of Additional Building Materials under Constant Irradiance
As a complementary approach in order to gain insight into the thermal effect of different envelope options, four conventional building materials with different colorations (white/black) were tested. White and black colorations were chosen because they can provide the maximum and minimum reflectance values, and therefore have a greater influence on the absorbed radiation and temperature differences. These materials, described in
Section 2, were submitted to constant irradiance tests for 4 h in order to reach stationary temperature conditions. Five different irradiances were tested in each case by means of the variation of the spotlight distance (50, 62.5, 70, 87.5 and 100 cm). The temperature evolutions were recorded, and were found to follow exponential evolutions with the form (
Figure S2 in
Supplementary Information):
where T
sta stands for the stationary temperature, that is, the maximum temperature reached in thermal equilibrium; ΔT represents the variation of the temperature from the initial to stationary values; and
τ is the time constant for the exponential evolution.
Good fittings were found for all of the materials and for the two colors tested; the parameters obtained from the corresponding fittings to Equation (4) are shown in
Tables S2 and S3 in the
Supplementary Information.
Among the different recorded temperature evolutions (inner and outer surface of the front wall, inner and outer surface of the insulating wall, inner air temperature, irradiated and non-irradiated air temperature) we focused our attention on two of them: firstly, the inner air temperature, because controlling this value via passive thermal elements is our ultimate goal; secondly, the outer front wall temperature. In this case, with the prospective use of thermochromic materials in mind, the transition temperature (that is, the temperature at which the color change takes place) would be the trigger to control the heat flux and, subsequently, the inner air temperature. The outer wall temperature, therefore, would determine whether the color transition takes place.
Stationary temperature values were extracted from those fittings, and their evolution with irradiance was found to be linear for each corresponding color and material. The results for the inner air temperatures are shown in
Figure 9, while the equivalent results for the front wall are depicted in
Figure S3, together with the corresponding linear fitting values (
Table S4). It can be concluded that there is a clear effect of the transmittance properties of the envelope on the temperature reached at the outer wall as well as in the inner temperature.
3.6. Predicted Passive Thermal Control through Color Tuning: Modelling of the Thermal Response under Variable Irradiance Conditions
With the aim of evaluating the effect of the transmittance spectra of the envelope on the thermal response of a building under real ambient conditions, we modeled the thermal response of the studied materials. In order to simulate the temperature evolutions in our test box, we used a simple 1-D transient heat conduction finite difference model with a mesh composed of eight nodes (a draft showing the structure, the parameters, and a detailed description of the model are included in the
Supplementary Information,
Figure S4,
Table S5 and accompanying text).
In order to elucidate the effect of the color tuning in the thermal response of our test box under real ambient conditions in a daily range, we used an extended model based on the same scheme shown above. Firstly, we obtained the heat transfer coefficients for each color and material from constant irradiance experiments. Secondly, we used those values to simulate and predict the thermal response of each material under real ambient conditions and variable daily irradiance. The heat coefficients implemented in this case corresponded to the average values calculated under different fixed irradiance values. The irradiance values—and subsequently, the rest of heat fluxes involved in the model—and ambient temperatures were varied in each iteration according to the experimental values obtained from the PV cubes dataset. In order to analytically implement those irradiation and ambient temperatures in the calculations, they were fitted to a gaussian and a sinusoidal function, respectively (
Figure S5 in the Supplementary Information).
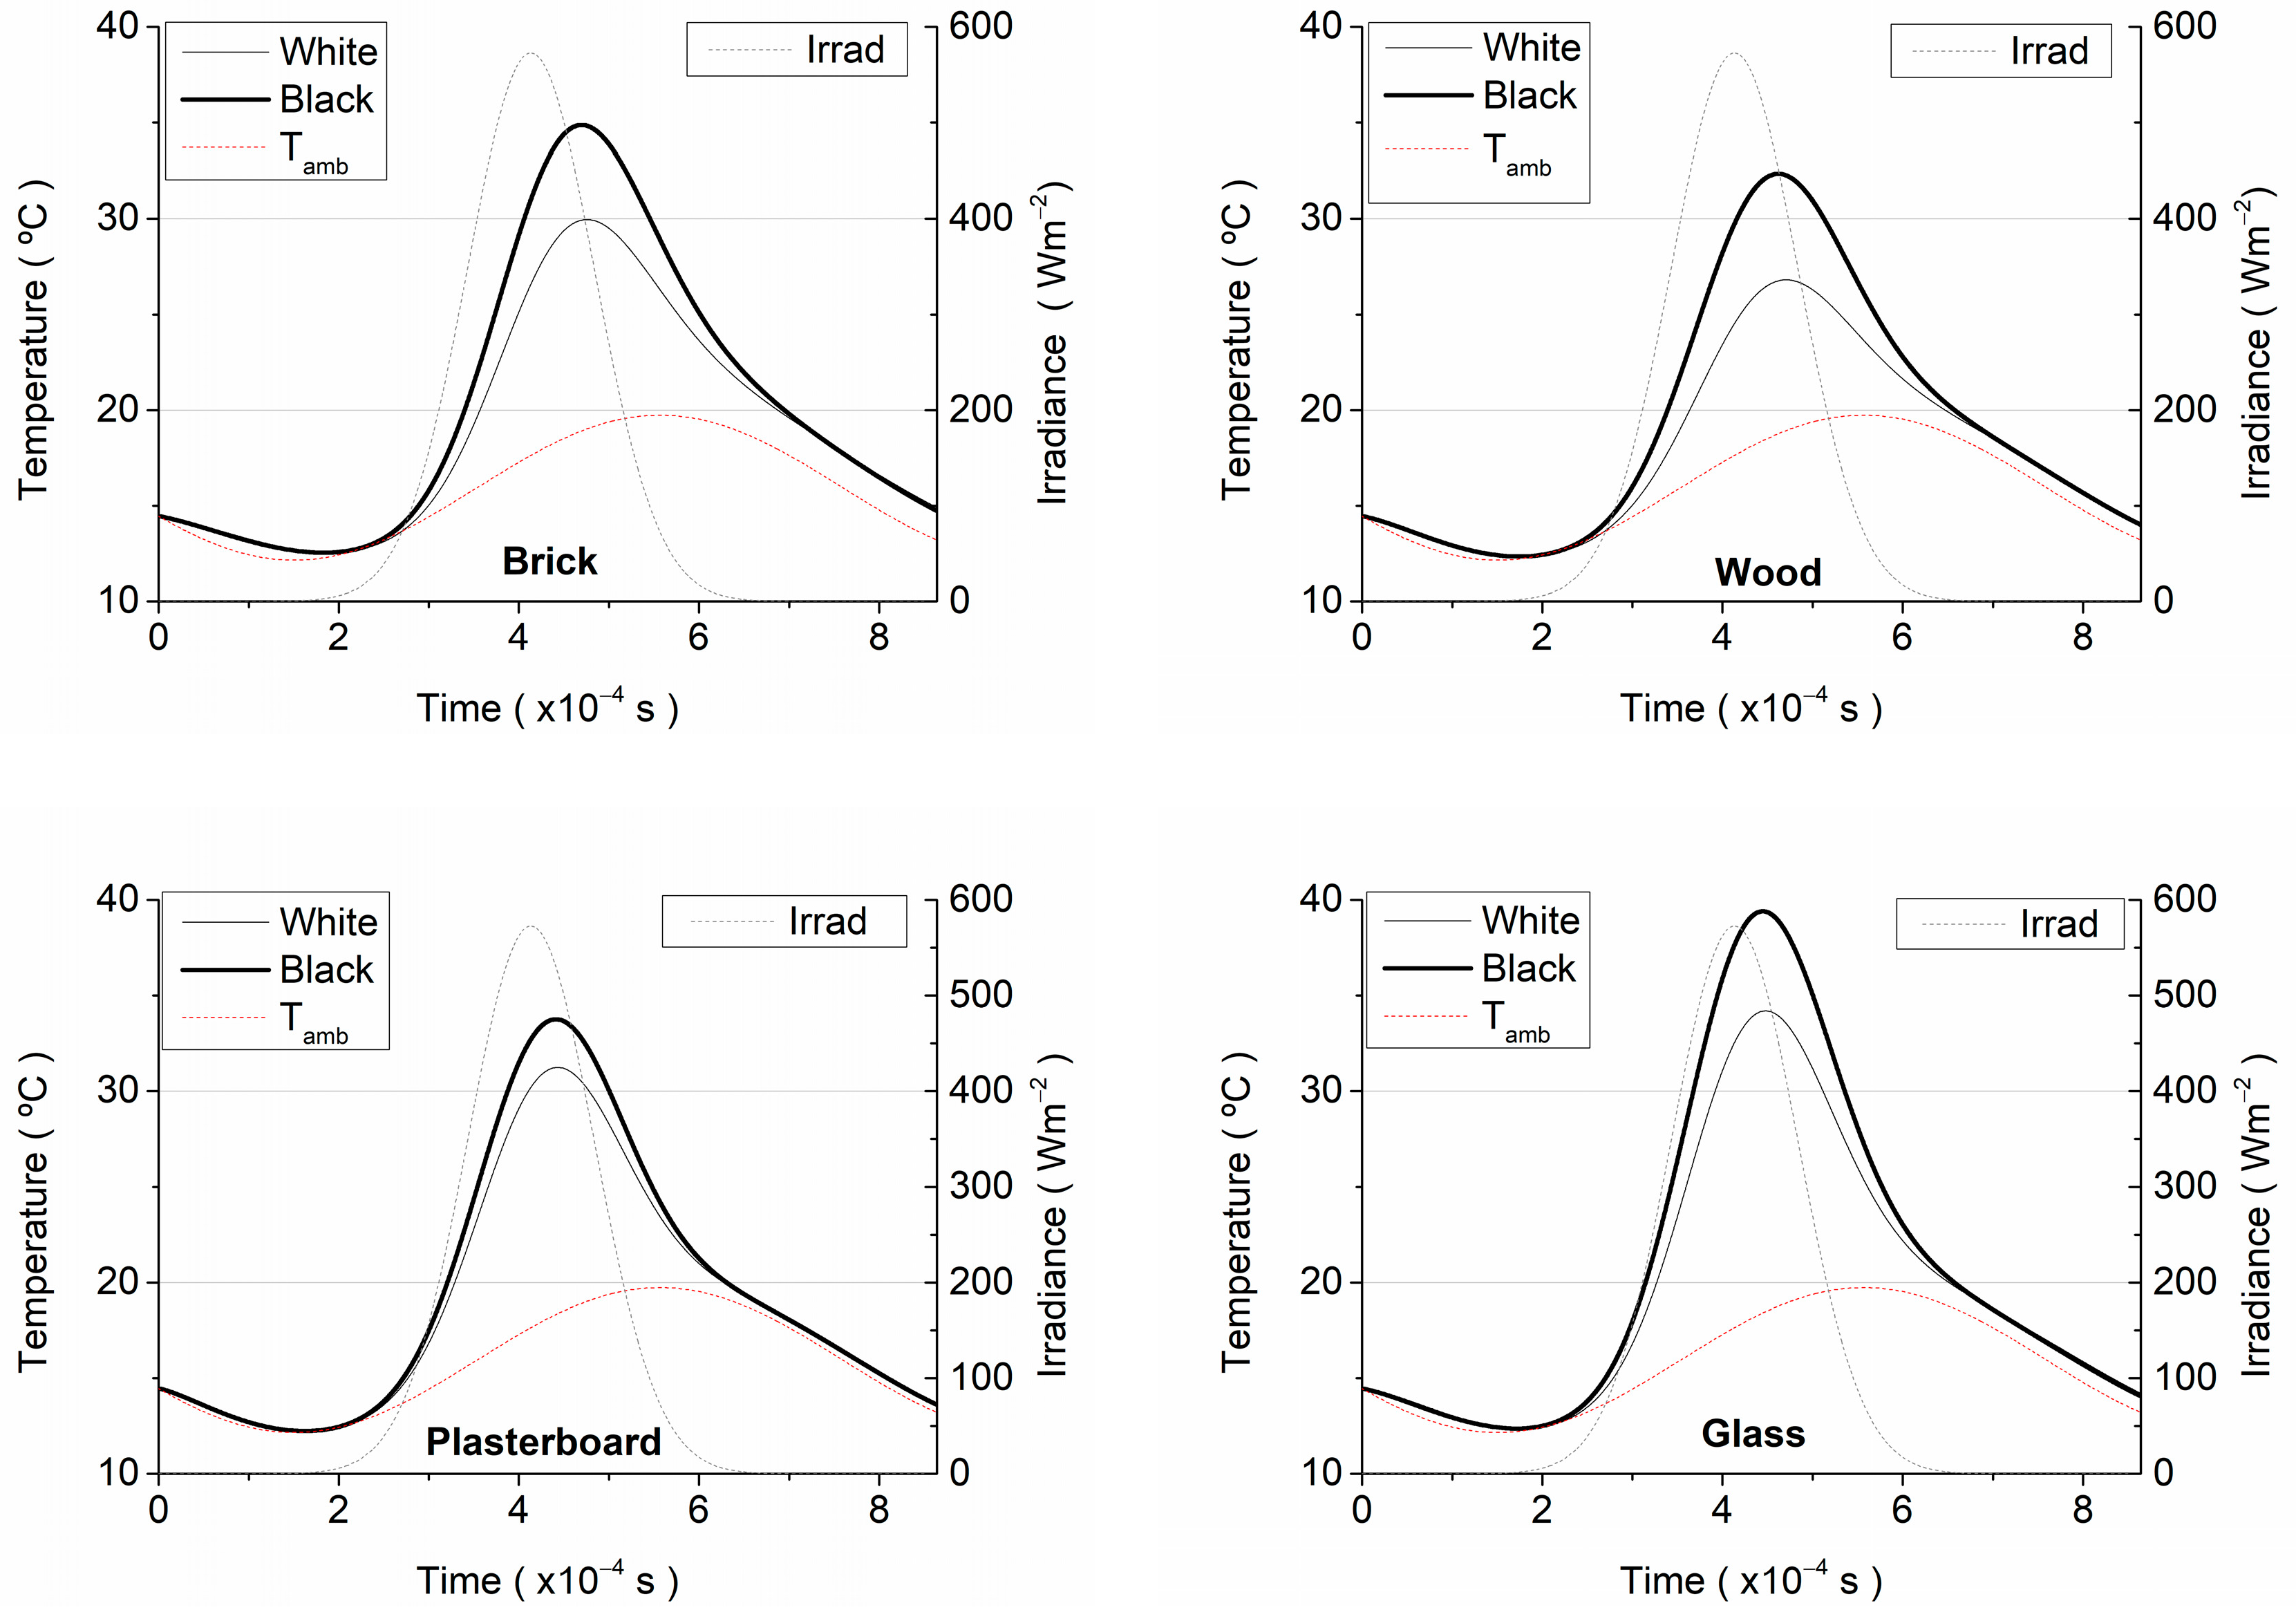
A representative summer day and a representative winter day condition were chosen in order to visualize the temperature evolutions of the inner air as a function of the wall material and its color.
Figure 10 shows the evolutions of the inner air temperatures for a complete winter day, together with the irradiance and ambient temperature for the corresponding white colored and black colored front walls.
Figure 11 shows the equivalent data for a representative summer day.
The temperature evolutions for the inner air showed a gaussian-type profile in all cases, mainly influenced by the corresponding daily irradiance evolution, with a slight delay in the maximum values reached due to the heat transfer kinetics to the inner volume of the test box.
There is a clear effect on the maximum temperatures achieved for the two coloring conditions, with higher temperatures for the black, absorbing materials compared to the white, reflecting materials, as expected. The data reveal a relevant effect of the wall color for the inner temperature, reaching differences as high as 9 °C. The differences between the black and white wall scenarios in those maximum temperatures range from 2.5 to 5.5 °C in the winter, and from 3.9 to 9.3 °C in the summer (minimum values for plasterboard, maximum for wood).
From the perspective of the improvement of the growing conditions in the greenhouses, it is desirable to promote actions to modify the temperature differences between the ambient temperature and the inner air, which usually means the use of heating, ventilation, and air conditioning (HVAC) devices, with consequent energy consumption. In a Mediterranean climate such as the one present in this study, cold winters are present together with hot summers, resulting in large annual temperature variations. The conditioning of the inner spaces implies the use of heating elements in winter to increase the inner temperature (i.e., to increase the difference between the inner temperature and the ambient temperature), while in summer, extremely hot temperatures force the use of cooling elements to decrease the inner temperature.
In this sense, white, reflecting surfaces represent a well-established strategy in traditional architectures to reduce the heat transfer to the inner volume in the summer season, with zero energy consumption. However, this strategy produces counter-productive results in the winter season, preventing the heating of the inner volume through the wall. The use of black, absorbent surfaces appear as an effective solution in this case.
The use of different coloration for different seasons seems to be a promising strategy to reduce detrimental heat transfer effects to (in summer) or from (in winter) the inner volume of the greenhouse. Such dynamic coloring can be achieved using chromogenic materials or devices, among which thermochromic materials could be the more suitable, owing to the ease of installation, self-controlled color changing mechanism and zero-energy consumption [
28].
The color change in these materials is activated by a transition temperature. For this kind of material to be effective in reducing heating and cooling demands, the transition temperature must be adapted to the climate conditions of the corresponding greenhouse. Based on the previously-described model, we implemented a dynamic color-changing scenario attending to the different reflectance values obtained for the white or black paints used. Therefore, when the irradiated front wall temperature reached the previously defined transition temperature, the reflectance values were changed accordingly.
Figure 12 shows the temperature differences between the inner air and the ambient temperature in winter and summer when using thermochromic paints with different transition temperature values, for the four materials tested in this study. The simulated thermochromic materials are assumed to have a black to white color change when the transition temperature is reached, based on existing commercial products. According to the previously-obtained temperature ranges for the front wall and inner temperatures, the simulated transition temperatures ranged from 0 to 100 °C. For practical considerations, materials with 0 °C or 100 °C transition temperatures represent static coloring situations; the material with a 0 °C transition temperature remains white during all seasons, and the material with a 100 °C transition temperature remains black in all of the experimental conditions studied. The optimum transition temperature, then, will correspond to that which promotes lower inner air temperatures in the summer, and higher inner air temperatures in the winter. For all of the materials tested in this study and the corresponding Mediterranean climate conditions, the most suitable transition temperature lies between 50–60 °C, according to the range in which the minimum difference between the summer and winter conditions appears. These simulations, therefore, appear to be an efficient decision-making tool in a prospective implementation of thermochromic materials.
3.7. Application to Photovoltaic Greenhouses
The experimental systems presented in this work aim to characterize the passive influence of PV module coverage in greenhouse applications using the worst-case condition which occurs at the maximum coverage ratio, with 100% opaque modules without a ventilation system. Furthermore, the thermal performance of the PV cubes was tested in real working conditions in a geographical region characterized by high solar irradiation throughout the year (Murcia, Spain). Due to the mounting condition of the PV panels, there is no ventilation at the rear side of the module, which explains the large temperature gradient present between the ambient and the inside environments. This significant increase of the internal temperature affects both the plant growth, due to changes in the microclimatic conditions, and the electricity generation, due to voltage losses. In this regard, the use of thermochromic materials can potentially minimize these changes. Our results are in agreement with studies which have shown that the temperature of the modules is strongly affected by the color coating: in extreme cases, a decrease up to 10 °C in the module temperature for white PV modules was measured [
37]. On the other hand, the direct application of an opaque system, such as the PV cubes, is ideal for crops in which artificial lighting is used to regulate cycles; research on the effectiveness of artificial lighting in greenhouses shows initial promising results, although currently, higher production is achieved in plants cultivated with natural light [
38]. The experimental results of the PV cubes contribute to the identification of the upper limit condition, from the thermal point of view, for the use of integrated PV modules in greenhouse applications.
In less-extreme conditions, some studies have already shown that PV greenhouses with high levels of PV coverage are suitable for the cultivation of species which require low light, without significant yield reduction; in particular, Cossu et al. reviewed the yield of 14 greenhouse horticultural and floricultural crops inside four commercial photovoltaic greenhouses spread in southern Europe with different PV cover ratios (PVR, the ratio of the projected area of PV panels to the ground and the total greenhouse area), finding promising results [
39]. Furthermore, with the help of light distribution maps to evaluate the light variability in the greenhouse area, they found that most crops are viable with PVR <25%, with negligible crop yield, while for a PVR of up to 60%, lower light species must be selected in order to avoid a reduction in the yield, and finally, for PVR around 100%, only very low light species can be cultivated [
40]. The broad range of organic materials with different absorption bands make the organic photovoltaic technology very suitable for greenhouse applications [
12,
41]. The best trade-off between shading and crop production is a complex matter because the structure should be understood as a whole design in which the conditions generated by the passive action of the PV panels must help to minimize the impact on the plant growth (according to the crop light needs), whilst at the same time improving the microclimate and working conditions inside the greenhouse. In this sense, this study is a first attempt to identify the thermal impact of different PV technologies with conventional encapsulations (which means the poor thermal insulation of the modules, similar to the materials used in greenhouse conventional construction), together with complementary chromic coating strategies. The higher and lower temperature limits (during the day and night for two years) inside the structure were experimentally established for four PV technologies (c-Si, a-Si:H, CdTe and OPV), and a simple linear method to determine the seasonal thermal boundaries was proposed with two simple empirical parameters for the four PV technologies (T
bound, which can be applied to T
sup and T
inf, and the parameter described in Equation (2)).
4. Conclusions
An experimental system was designed and built with the purpose to analyse the thermal evolution of greenhouses covered with photovoltaic modules. The system comprises four photovoltaic cubes, with five sides made of PV modules, and a bottom side made of polycarbonate. Each cube was fabricated with a different PV technology (c-Si, a-Si:H, CdTe and OPV); complementary to those systems, other building materials were also experimentally tested (brick, wood, plasterboard and glass). The large amount of data collected during the continuous monitoring of the temperatures over two years, with a sampling rate of five minutes, provided detailed information about the passive heating and cooling effects created by the PV modules on the internal temperature of the cube. The differences between the internal and external temperatures reached up to ΔT = +20 °C during daytime and ΔT = −5 °C during the night-time. A simple empirical linear model was proposed to obtain the thermal boundaries of the seasonal variation of the temperatures inside the PV structures of these four different technologies, which delivered a similar α parameter for three of them, with the OPV offering larger deviations. Additionally, the effect of the envelope color on the thermal evolution of the exterior and interior sections of other construction materials was tested. A simple change from white to black is reflected in considerable inner air temperature increases that may surpass 10 °C, depending on the season.
The crop development is compromised in this design configuration, in which all of the facades and the roof are covered by PV modules for electricity generation, because the sunlight inside the greenhouse is strongly decreased due to the shading cast by the opaque panels. Therefore, further considerations should be taken into account in the future when extrapolating these findings to commercial PV greenhouses. Hence, the development of novel materials (semitransparent, wavelength-selective) and advanced configurations (gutter height of the greenhouse, distribution of the PV panels on the envelope, etc.) for the improvement of the synergy between the biomass productivity and energy yield opens up new fields of interest for research. Finding the best trade-off between shading induced by opaque or semi-transparent PV modules and crop production therefore becomes an important issue to take into account in future studies.
The complementary use of adaptive color-changing materials appears to be an efficient way to further improve the growing conditions of the greenhouse from an energy efficiency point of view, because the temperature regulation is achieved by passive heating and cooling mechanisms. Additional heat storage methods could help keep a more constant temperature during the year, which would be beneficial to improve the cultivating conditions in all of the seasons.

 ,
, 


