
Novel Instantaneous Wavelet Bicoherence for Vibration Fault Detection in Gear Systems


1
Department of Engineering and Technology, School of Computing and Engineering, The University of Huddersfield, Queensgate, Huddersfield HD1 3DH, UK
2
Meggitt Sensing Systems, Rte de Moncor 4, 1701 Fribourg, Switzerland
*
Author to whom correspondence should be addressed.
Energies 2021, 14(20), 6811; https://0-doi-org.brum.beds.ac.uk/10.3390/en14206811
Submission received: 1 February 2021
/
Revised: 11 October 2021
/
Accepted: 14 October 2021
/
Published: 18 October 2021
(This article belongs to the Collection Feature Papers on Wind, Wave and Tidal Energy)
Abstract
:Higher order spectra exhibit a powerful detection capability of low-energy fault-related signal components, buried in background random noise. This paper investigates the powerful nonlinear non-stationary instantaneous wavelet bicoherence for local gear fault detection. The new methodology of selecting frequency bands that are relevant for wavelet bicoherence fault detection is proposed and investigated. The capabilities of wavelet bicoherence are proven for early-stage fault detection in a gear pinion, in which natural pitting has developed in multiple pinion teeth in the course of endurance gearbox tests. The results of the WB-based fault detection are compared with a stereo optical fault evaluation. The reliability of WB-based fault detection is quantified based on the complete probability of correct identification. This paper is the first attempt to investigate instantaneous wavelet bicoherence technology for the detection of multiple natural early-stage local gear faults, based on comprehensive statistical evaluation of the industrially relevant detection effectiveness estimate—the complete probability of correct fault detection.
1. Introduction
Local gear tooth faults generate vibration transients each time a mechanical interaction with a faulty tooth surface occurs. Fault-induced vibration transients appear periodically with every gear cycle and have a non-Gaussian character. Due to a short transient duration, their energy is distributed over broad frequency bands and, usually, is contaminated by noise, which makes their detection difficult via commonly used second-order signal processing techniques.
Reference [1] applies the short-time Fourier transform (STFT) and the Wigner–Ville distribution for diagnosing the planetary gearbox under nonstationary load conditions. A diagnostic feature, quantifying the changes in multiple signal components, is employed. In further investigations, vibration diagnostics is carried out by principal component analysis [2].
Reference [3] uses the wavelet transform modulus for vibration natural pitting detection at an early stage of gearbox damage. The novelty of their research is in the wavelet modulus feature that is integrated in a specific frequency band, in which vibration signal changes between damaged and nondamaged gearbox cases are identified. This approach allows the identification of individual damaged teeth.
Reference [4] compares the diagnostic effectiveness of technologies based on the advanced demodulation approach and gearbox residual signal analysis. In this research, the technologies are used to track developing gearbox damage and prove the diagnostic capabilities of residual signal analysis. Reference [5] introduces the vibration method for the identification of the conditions that accelerate local damage of the helicopter components and result in helicopter component failure, caused by crack occurrence.
Reference [6] proposes optimised variational mode decomposition (VMD) of vibration signals. The VMD approach allows one to adaptively divide the frequency domain of the signal in order to obtain a better signal to noise ratio and to separate the fault-related signal components. The optimal selection of VMD parameters is achieved via the Fast Grey Wolf Optimizer. Reference [7] proposes a new filtering approach based on planetary gearbox mesh components to enable gearbox local fault detection via envelope spectra. The advantage of this method is that it enables fault detection without the reference signal, representing an undamaged gearbox.
Reference [8] uses the STFT for the analysis of planetary gearbox signals in non-stationary run-up and run-down conditions. Reference [9] uses the STFT for instantaneous frequency estimation of the gearbox, operating under time varying operating conditions. The instantaneous speed, obtained from time–frequency signal analysis, is compared with tachometer data for validation purposes.
Reference [10] proposes gearbox local fault detection, based on the demodulation method, utilising both the Hilbert transform and the wavelet packet transform. The effectiveness of the proposed approach is demonstrated by detecting the vibration signal modulation, caused by a chipped tooth [10]. The diagnostic effectiveness of the Hilbert transform is also examined in reference [11]. In reference [12], the filtering capabilities of the discrete wavelet transform in combination with maximal kurtosis are used for vibration transient detection. Reference [13] proposes an ensemble decision tree methodology for the remaining useful life prediction of spur gears under natural pitting progression. Their research utilises correlation coefficients based on the residual vibration signals.
Reference [14] proposes the multichannel vibration signal processing method, utilising time–frequency signal decomposition together with principal component analysis. The proposed method is validated by comparison with results obtained from individual channels and the effectiveness of this approach is proven. Reference [15] utilises time domain analysis and envelope analysis for rolling element bearing and planetary gearbox diagnostics and analyses vibration signal pattern changes, depending on machinery fault size and location.
Reference [16] also evaluates changes in vibration signals, determined by gear tooth cracks of various depths. Reference [17] analyses the changes in vibration signals generated by the gearbox under different load conditions. The pseudo-Wigner–Ville distribution is applied to the test data in order to identify the influence of the fluctuating load conditions on gearbox vibration.
Reference [18] uses the residual signal as a base for vibration signal analysis of the gearbox, operating under nonstationary conditions. In this research, an adaptive time series model is investigated, which is based on Bayesian model selection, to remove the non-fault-related components in the structural response of a gear assembly and to obtain a residual signal, which is robust to fluctuating operating conditions. In reference [19], a novel modelling of planetary gearbox vibration signals is proposed. The novelty of the approach is related to the modelling of the time varying transmission paths between moving planetary gears and a stationary vibration sensor.
Transient signal components, generated by gear faults, in most cases have an impact on vibration signal probability density functions. Reference [20] utilises maximum correlated kurtosis deconvolution for vibration fault detection. The spectral kurtosis approach, initially proposed for rolling element bearing fault detection [21], is used for gear diagnostics by references [22,23,24]. This approach, based on time–frequency analysis and cyclo-stationarity analysis, is proposed in references [25,26].
Numerous studies utilise various condition indicators, based on the Fourier transform [27,28,29]. These indicators signalise potential machinery faults and are subjected to classification processes (e.g., k nearest neighbours or principal component analysis) [26,30]. References [31,32] propose correlation-based degradation parameters extracted from gearbox residual vibration signals. This approach allows the identification of multiple stages of natural pitting progression.
Because of non-linearity, which characterises a variety of gear systems, most vibration transients, which are related to gear faults, create statistically dependent characteristic spectral components. Therefore, higher order spectra (HOS), capable of detecting their presence in vibration signals, have been broadly used in the field of machinery fault detection, e.g., [33,34,35,36], and in various domains of science, e.g., [37,38]. In reference [33], the wavelet HOS and HOS integrated features are used for early-stage gear fault detection. The research presented in reference [34] uses the classical Fourier HOS for the detection of distortions of the intake airflows of an aircraft engine, known as an intake separation. Reference [35] presents, for the first time, the application of wavelet bicoherence to the detection of naturally developed early-stage gearbox pinion faults. In reference [36], the bispectrum and the trispectrum are used for the detection of relations between multiple spectral components, which appear in analysed signals as a result of fault-related nonlinear behaviour.
HOS’s superiority for the detection of early-stage faults over commonly used second-order transforms, such as the short time Fourier transform and the wavelet transform, etc., is well known and was a topic of numerous works [39,40,41,42]. References [39,40] compare the results obtained by traditional linear spectral analysis to the results obtained by the higher order bispectral approach, which is proved to be more effective in detecting nonlinearities of the mechanical system that appear due to developing cracks in straight beams and cantilever beams, respectively. In reference [41], higher order spectral analysis is used for early-stage fault detection in shipboard rotating machinery such as induction motors. In reference [42], HOS are used for the analysis of epileptic EEG signals.
Numerous bispectrum-related research works are oriented on the analysis of the statistical relations between multiple narrowband spectral components, generated due to machinery nonlinearities, and, therefore, representing clear poly-harmonic spectral patterns. The bispectrum has been used for helicopter gear system fault detection [43], for AC motor current modulation estimation, for the analysis of vibration signals of spur gearboxes [44,45] and for planetary gear vibration diagnostics [46,47].
The chirp Fourier HOS [48,49] and the chirp Wigner-based HOS [50] are introduced for the analysis of spectral components, exhibiting variations in the instantaneous frequency. In further research, the chirp Fourier HOS are applied for combustion instability detection [51].
A novel approach, employing the wavelet transform as an HOS kernel function, was first introduced by van Milligen et al., who proposed a locally averaged wavelet bicoherence (WB) and applied it as a tool for turbulence analysis [52]. However, the locally averaged WB is not applicable for the detection of a short-duration transients generated by local gear faults.
Wavelet HOS research most focuses on the analysis of fault-related narrowband signal components, i.e., fault signatures, that present an explicit poly-harmonic pattern. Further development of wavelet HOS resulted in a novel method [34,36] oriented on the detection of fault-related vibration transients, the energy of which is spread over several broad frequency bands. Gelman et al. [34] proposed a novel instantaneous WB for the detection of transient signal components. The novelty of this approach is that the WB was used without a local average for the evaluation of statistical relations between multiple spectral components, contained in multiple broadband frequency bands and generated by local gear faults. In this approach, multi-dimensional WB results were used for the estimation of WB integrated features, which was the base of subsequent statistical analysis, leading to gear fault detection and localisation.
The instantaneous WB technology was investigated for gear systems to a very limited extent in works [33,35,53]. In references [33,53], instantaneous WB was investigated only for artificially seeded faults, and in reference [35], it was investigated via very limited experimental statistics of naturally developed gear faults.
For all Fourier and wavelet-based higher order spectra technologies, the selection of analysed spectral components plays a critical role. In investigations [33,35,53], the choice of frequency bands, used for WB feature integration, is determined by the evaluation of bicoherence maps, originating from signals recorded for faultless and faulty gears.
The disadvantage of this approach is that it requires the estimation of the complete probabilities of correct fault detection by WB for all possible frequency pair combinations, which is not optimal from a computation time standpoint. Another disadvantage of this approach is that the selected frequency bands are not physically explained/justified. Furthermore, the evaluation of the HOS modulus map is possible in the case of WB; however, it is very difficult to apply to HOS featuring orders higher than order 3 due to the lack of efficient tools for the graphical representation of multidimensional results.
So, in summary, very few gear fault detection studies, related to WB, are based on seeded gear faults [33,53], and there are limited experimental data from experimental trials, processed without well justified and physically explained frequency band selection [33,35,53]. Finally, the obtained gear detection effectiveness results for instantaneous WB are based only on the Fisher criterion (FC), which is not a comprehensive and practical measure of fault detection effectiveness.
All these essential limitations are stopping the wide implementation of powerful nonlinear non-stationary instantaneous WB for the detection of local faults in gears. Therefore, the objectives of the presented research are to carry out, for the first time, a fault detection investigation of instantaneous WB:
- For multiple natural local faults in gears: i.e., natural pitting at a very early stage of pitting that has developed in the course of well-controlled gear endurance tests;
- Via proposed, developed and employed novel methodology of selecting frequency bands that are relevant for WB-based fault detection;
- Based on comprehensive experimental statistics;
- Using the industrially relevant detection effectiveness estimate—the complete probability of correct fault identification.
Wavelet HOS-based vibration diagnosis is dominated by wavelet HOS of the 3rd order, i.e., the wavelet bispectrum. Studies concerning wavelet HOS of the 4th order, i.e., the wavelet trispectrum, are rare and are not related to fault detection in electromechanical systems. Initially, the trispectrum is used in examinations of simulated and nonlinearly interacting ocean waves, generated by a hurricane [54]. The power cepstrum and trispectrum equalisation algorithms are applied in the field of communications [55]. Applications of the wavelet trispectrum include geophysics and offshore engineering [56,57,58]. In the mentioned applications, the trispectrum is used for the evaluation of the relations between narrowband spectral components. So far, there is no research related to wavelet spectral techniques of the 4th order in the context of machinery fault detection. So, wavelet tricoherence is used for the first time in worldwide terms in the present research for gear fault detection via the identification of fault-related vibration transients, the energy of which is spread over several broad frequency bands.
The novelties of the presented research are as follows:
- Instantaneous wavelet bicoherence is investigated for the first time in worldwide terms for gear fault detection via very comprehensive experimental statistics of naturally developed pitting of gear teeth at a very early stage of fault development, based on the industrially relevant detection effectiveness estimate—the complete probability of correct fault identification;
- We use a novel methodology of selecting the frequency bands that are relevant for gear fault detection for wavelet HOS integrated features, which enable efficient fault detection and localisation.
2. Wavelet Bicoherence
The 3rd order wavelet HOS, the instantaneous WB, are defined by following equation:
where are frequencies of the spectral components for which WB is calculated. E denotes the mean value operator and is the complex conjugation operator. is the wavelet transform of the analysed signal x(t), given by:
a and t are scale and time shift variables. is a mother wavelet function.
WB is a complex function. The physical sense of instantaneous WB is related to its capabilities of detecting statistical dependencies, which exist between multiple spectral components, determined by periodically recurring fault-related transient phenomena. Thus, WB is sensitive to the appearance of damage-related vibration spectral components. As WB is the normalised wavelet bispectrum, its output values fall into the range between 0 and 1. Due to normalisation, the instantaneous WB output is not affected by input signal amplitude changes.
As WB output has a complex multidimensional form, its interpretation is difficult. In order to enable the visualisation of signal processing results, which allows fault detection decisions, the integrated WB (IWB) feature is proposed to use:
where and are spectral widths of frequency bands, containing multiple spectral components at multiple frequencies within these [33].
The purpose of the IWB feature is to aggregate the information carried by WB multidimensional results into a scalar value, which changes over time. These periodically appearing changes in the IWB are associated with gear kinematics, which allows precise gear fault localisation. The presented research employs a novel approach, i.e., WB does not focus on the analysis of fault-related specific narrowband signal components, but, instead, is oriented on the detection of fault-related vibration transients, the energy of which is spread over several broad frequency bands.
The bulleted list below shows the sequence of digital signal processing operations, employed in order to apply the instantaneous WB technology for gear fault detection and localisation:
- Angular resampling of vibration signals, representing faultless and faulty gear cases;
- Time synchronous averaging (TSA) of the signals, subjected to angular resampling;
- Gear classical residual signal (CRS) estimation via the removal of meshing components;
- Wavelet scalogram estimation for the CRS;
- Absolute difference estimation between the CRS wavelet scalograms, representing faultless and faulty gear cases;
- Estimation of relevant (from a fault detection point of view) frequency bands, driven by fault-related changes in gear spectral patterns;
- Instantaneous WB estimation for spectral components, contained in relevant frequency bands;
- Estimation of IWB fault detection feature;
- Estimation of the Fisher criterion for IWB values, representing the faultless and faulty gear cases;
- Estimation of the complete probability of correct fault identification (PCFI) via instantaneous wavelet bicoherence.
3. Experimental Validation of Wavelet Bicoherence for Gear Fault Detection
3.1. The Experimental Setup and Test Rig Description
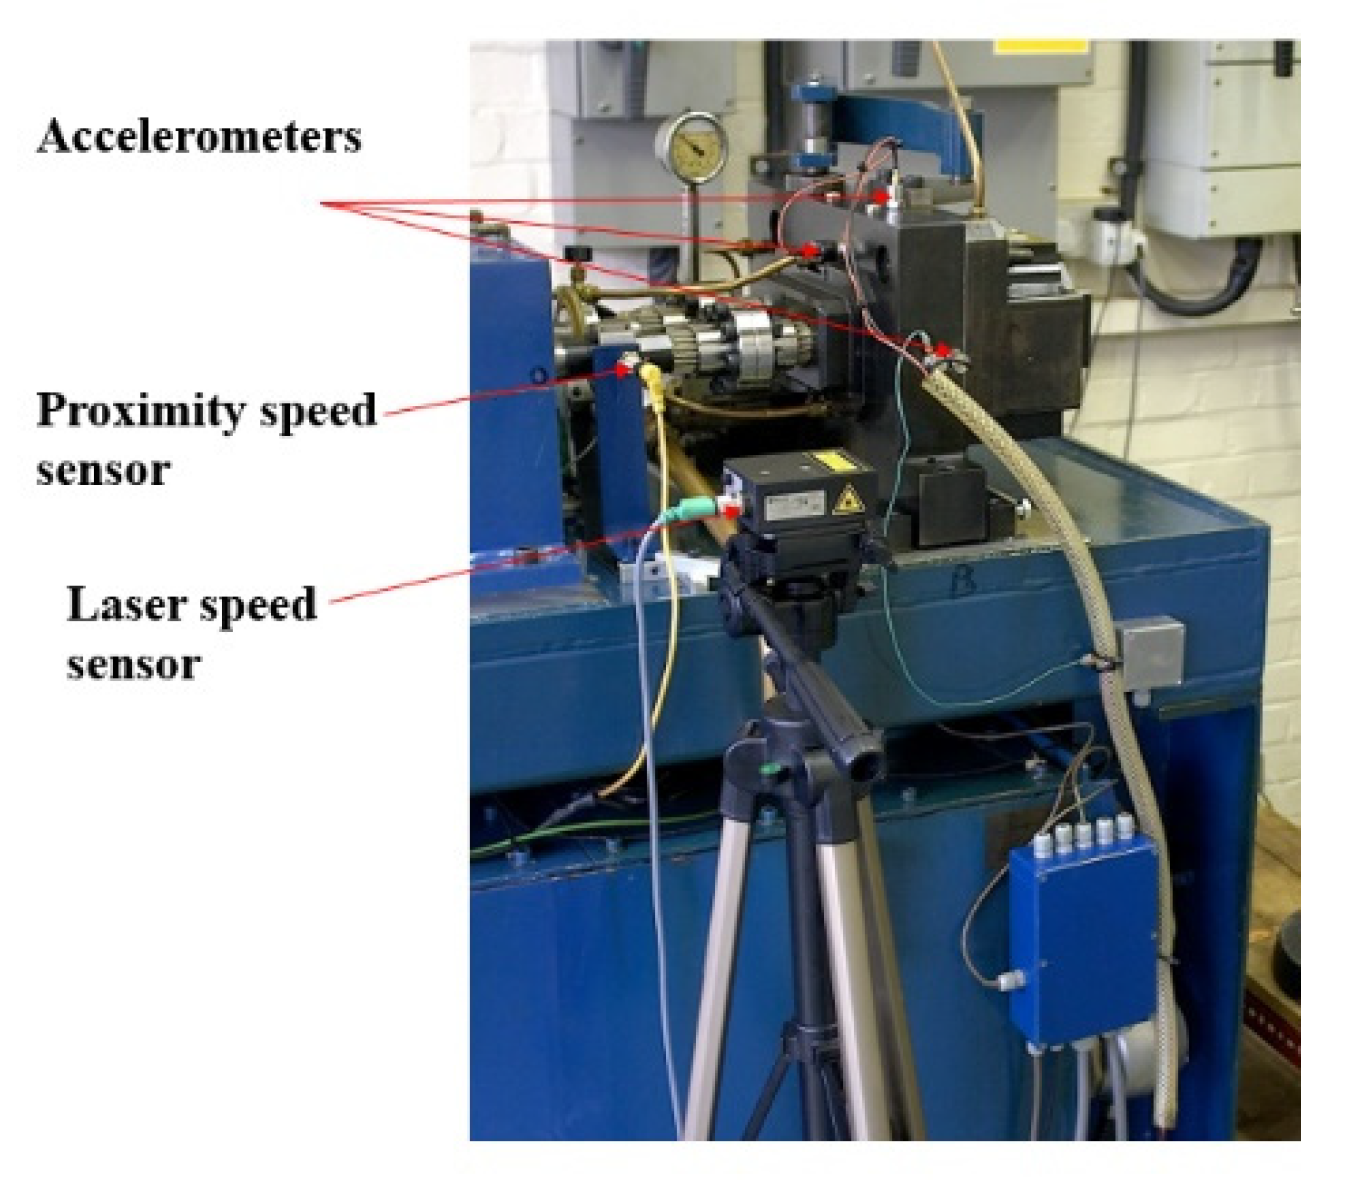
Vibration signals, subjected to instantaneous WB-based analysis, were recorded during a gear endurance test, carried out on the gear test rig. The test rig, shown in Figure 1, consists of two gearboxes, featuring the same ratio (16 pinion (16 teeth) and gear (24 teeth)), connected with two shafts. One of the shafts featured a hydraulic actuator, which together with an electric motor allowed us to exert close-loop loading torque. Gears under test were made of carburised and tempered S156 steel. The pinion operated under a load of 500 Nm at a rotation speed of 50 Hz [59].
The analysed vibration signals were recorded via an accelerometer in axial direction on the housing of the gearbox on the prepared flat, unpainted surface, using a thread mounting stud, ensuring the minimal influence of vibration signal propagation paths. The accelerometer has a sensitivity of 50 pC/g, a frequency response of up to 6000 Hz (+/−1 dB) and an acceleration measurement range of (0–80) g. Vibration and speed signals were sampled at 40 kHz sampling rate. Vibration signals were lowpass-filtered at a passband edge frequency of 13.5 kHz. The selection of passband edge frequency was driven by the accelerometer’s resonance frequency.
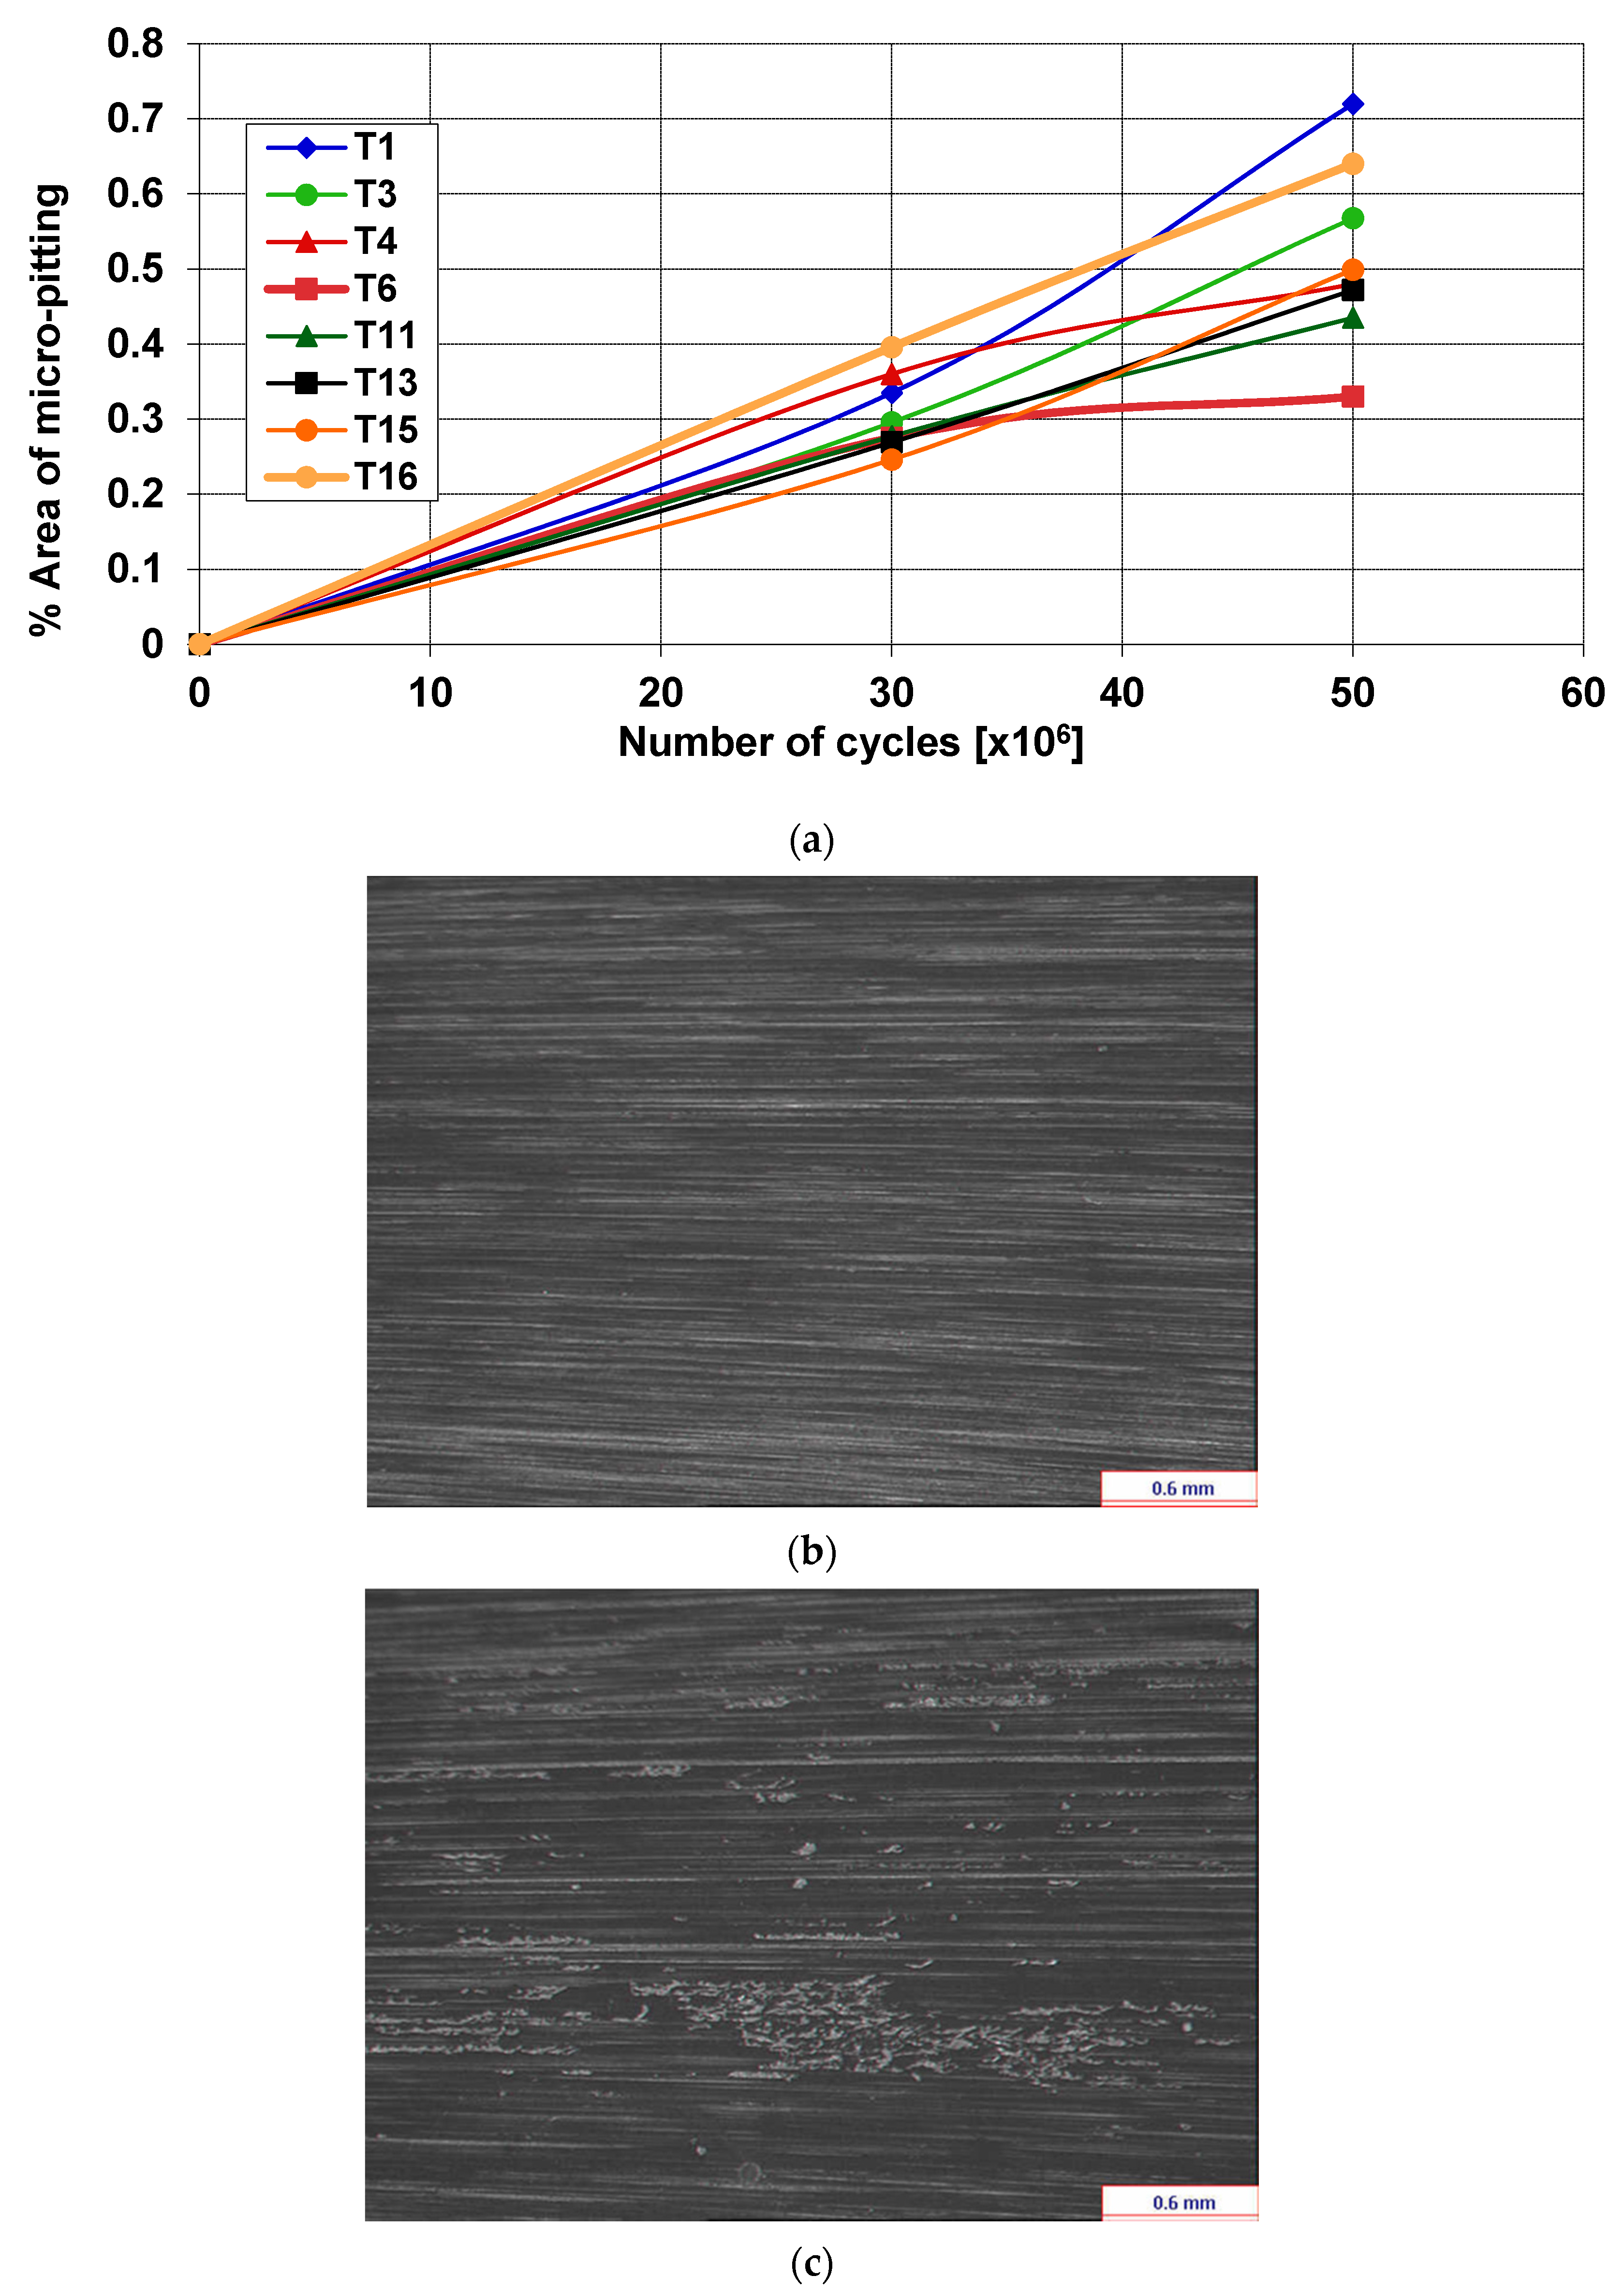
The test rig allowed us to create stable and fully controlled conditions, under which the development of natural early-stage pitting occurred in multiple gear teeth. In the course of the experiment, in each 106 cycle of a pinion the gearbox was disassembled, and pinon tooth surfaces were subjected to evaluation in terms of developed pitting. After performing a stereo optical pitting evaluation, both gear and pinion were installed back in the test rig in exactly the same angular positions and the test was continued. Figure 2 shows estimations of pitting that developed on some pinion teeth during the experiment [35].
Such an approach allows the comprehensive experimental validation of fault detection capabilities of WB technology in terms of early-stage gear fault detection in multiple teeth, which is critical in numerous gear applications, including energy, aerospace, marine, automotive, etc.
In the presented investigation, out of all signals recorded during the endurance test, two sets of five random consecutive signal files were selected. The dataset representing the faultless gear case was recorded between 0 and 10 × 106 cycles of the pinion. The dataset representing the faulty gear case was recorded between 40 × 106 and 50 × 106 cycles of the pinion.
In order to ensure smooth and relatively silent operation as well as smooth torque transmission, a gear system should be properly designed in a way that few gear teeth should be in contact at the same time and take part in torque transmission. For a properly designed gear system, the total contact ratio should not be smaller than 1.2. However, to ensure a smooth and quiet operation, a common practice is to design gear pairs that provide a total contact ratio of more than 2.
The gear system, which is the object of the presented investigation, featured the estimated total contact ratio of 2.4. This means that 60% of the time the forces were transferred by two teeth, and the remaining 40% of the time they were transferred by three teeth. This feature of the gear system adds complexity to the vibration signal analysis, as vibration signals, generated by the gear system at any time, originate from interactions between two or three teeth. Therefore, the geometry of the helical teeth of the gear system played a crucial role in the presented investigation and has to be taken into account for gear fault detection.
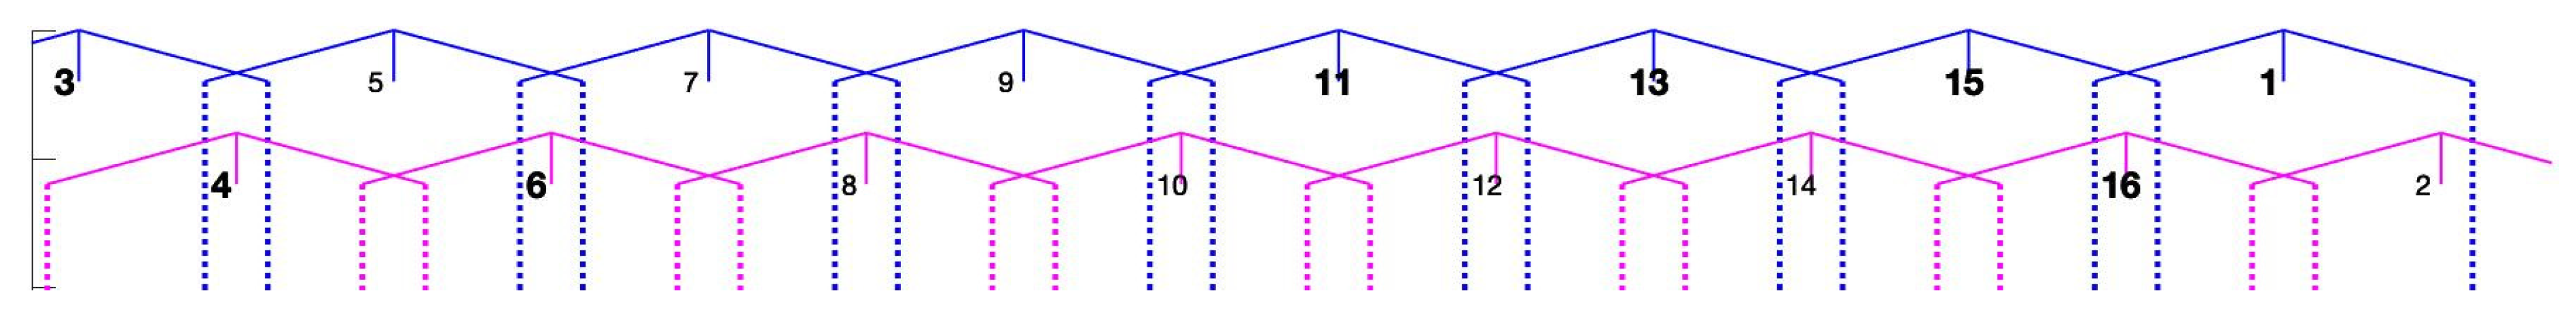
In order to ensure easier interpretation of the results, Figure 3 presents the data as a function of the angular position of a pinion feature (red and blue vertical lines for faulty and fault-free cases, respectively—the vertical lines indicate the angular ranges in which pinion teeth are in contact with gear teeth [59]), marking the angular ranges within which particular teeth of the pinion are in contact with teeth of the gear. To improve the clarity of the presentation and to enhance comparison with a stereo optical pitting evaluation, the numbers of teeth on which the development of pitting was observed (i.e., pinion teeth 1, 3, 4, 6, 11, 13, 15, 16) were marked with a bold font.
3.2. Digital Signal Processing of Gear Vibration Data
3.2.1. Angular Signal Resampling, Time Synchronous Averaging and Classical Residual Signal Estimation
Due to slight fluctuations in the pinion rotation speed, the number of signal samples in sections corresponding to one pinion revolution fluctuated around 800. In order to ensure that every sample of the signal can be associated with the exact angular position of a pinion, which is necessary to obtain a precise result, the signal was up-sampled to precisely 1024 samples per revolution.
Resampled signals contained the signal components originating not only from the meshing gears under test but also other mechanically interacting elements of the test rig, which were not relevant for the research. In order to minimise the presence of the signal components irrelevant for gear fault detection, the resampled signal sections corresponding to one pinion revolution were averaged in order to estimate the time synchronous averaged (TSA) signal, which preserves the signal components synchronous to the pinion speed and removes components that do not occur at frequencies where the pinion interacts with the gear. In the presented research, each TSA signal section was estimated for 50 consecutive raw signal sections. The raw signal sections used for TSA estimation were not overlapping.
The TSA signal contains signal components generated by the pinion, and, in most cases, it is dominated by high-amplitude gear-meshing frequency components. High-amplitude gear-mesh components, which do not carry information about early-stage local gear faults, mask low-energy vibration transients induced by these faults. Therefore, a common practice is the removal of frequency components related to gear meshing from the TSA signal, which leads to the estimation of the classical residual signal (CRS).
There is no standard approach of calculating the CRS. The scope of possible solutions is broad and includes the usage of auto regressive signal models or signal filtering. In the presented research, the CRS was estimated by the subtraction of two-time synchronous averaged signals, where one was averaged with the time period of a pinion rotation and the other was averaged with a period 16 times smaller, thus corresponding to the period of meshing teeth according to the formula:
where is the TSA signal, is the mesh period and is the number of pinion teeth.
The obtained CRS signals were used in subsequent digital signal processing operations as a base for WB estimation.
Because of the stereo optical pitting evaluation and related movements of the pinion in and out of the gearbox, the tacho signal was shifted by a few signal samples in the signal files, recorded at different stages of the experiment. This shift has to be compensated and the results of compensation have to be verified; that has been performed by the comparison of the alignment of meshing components.
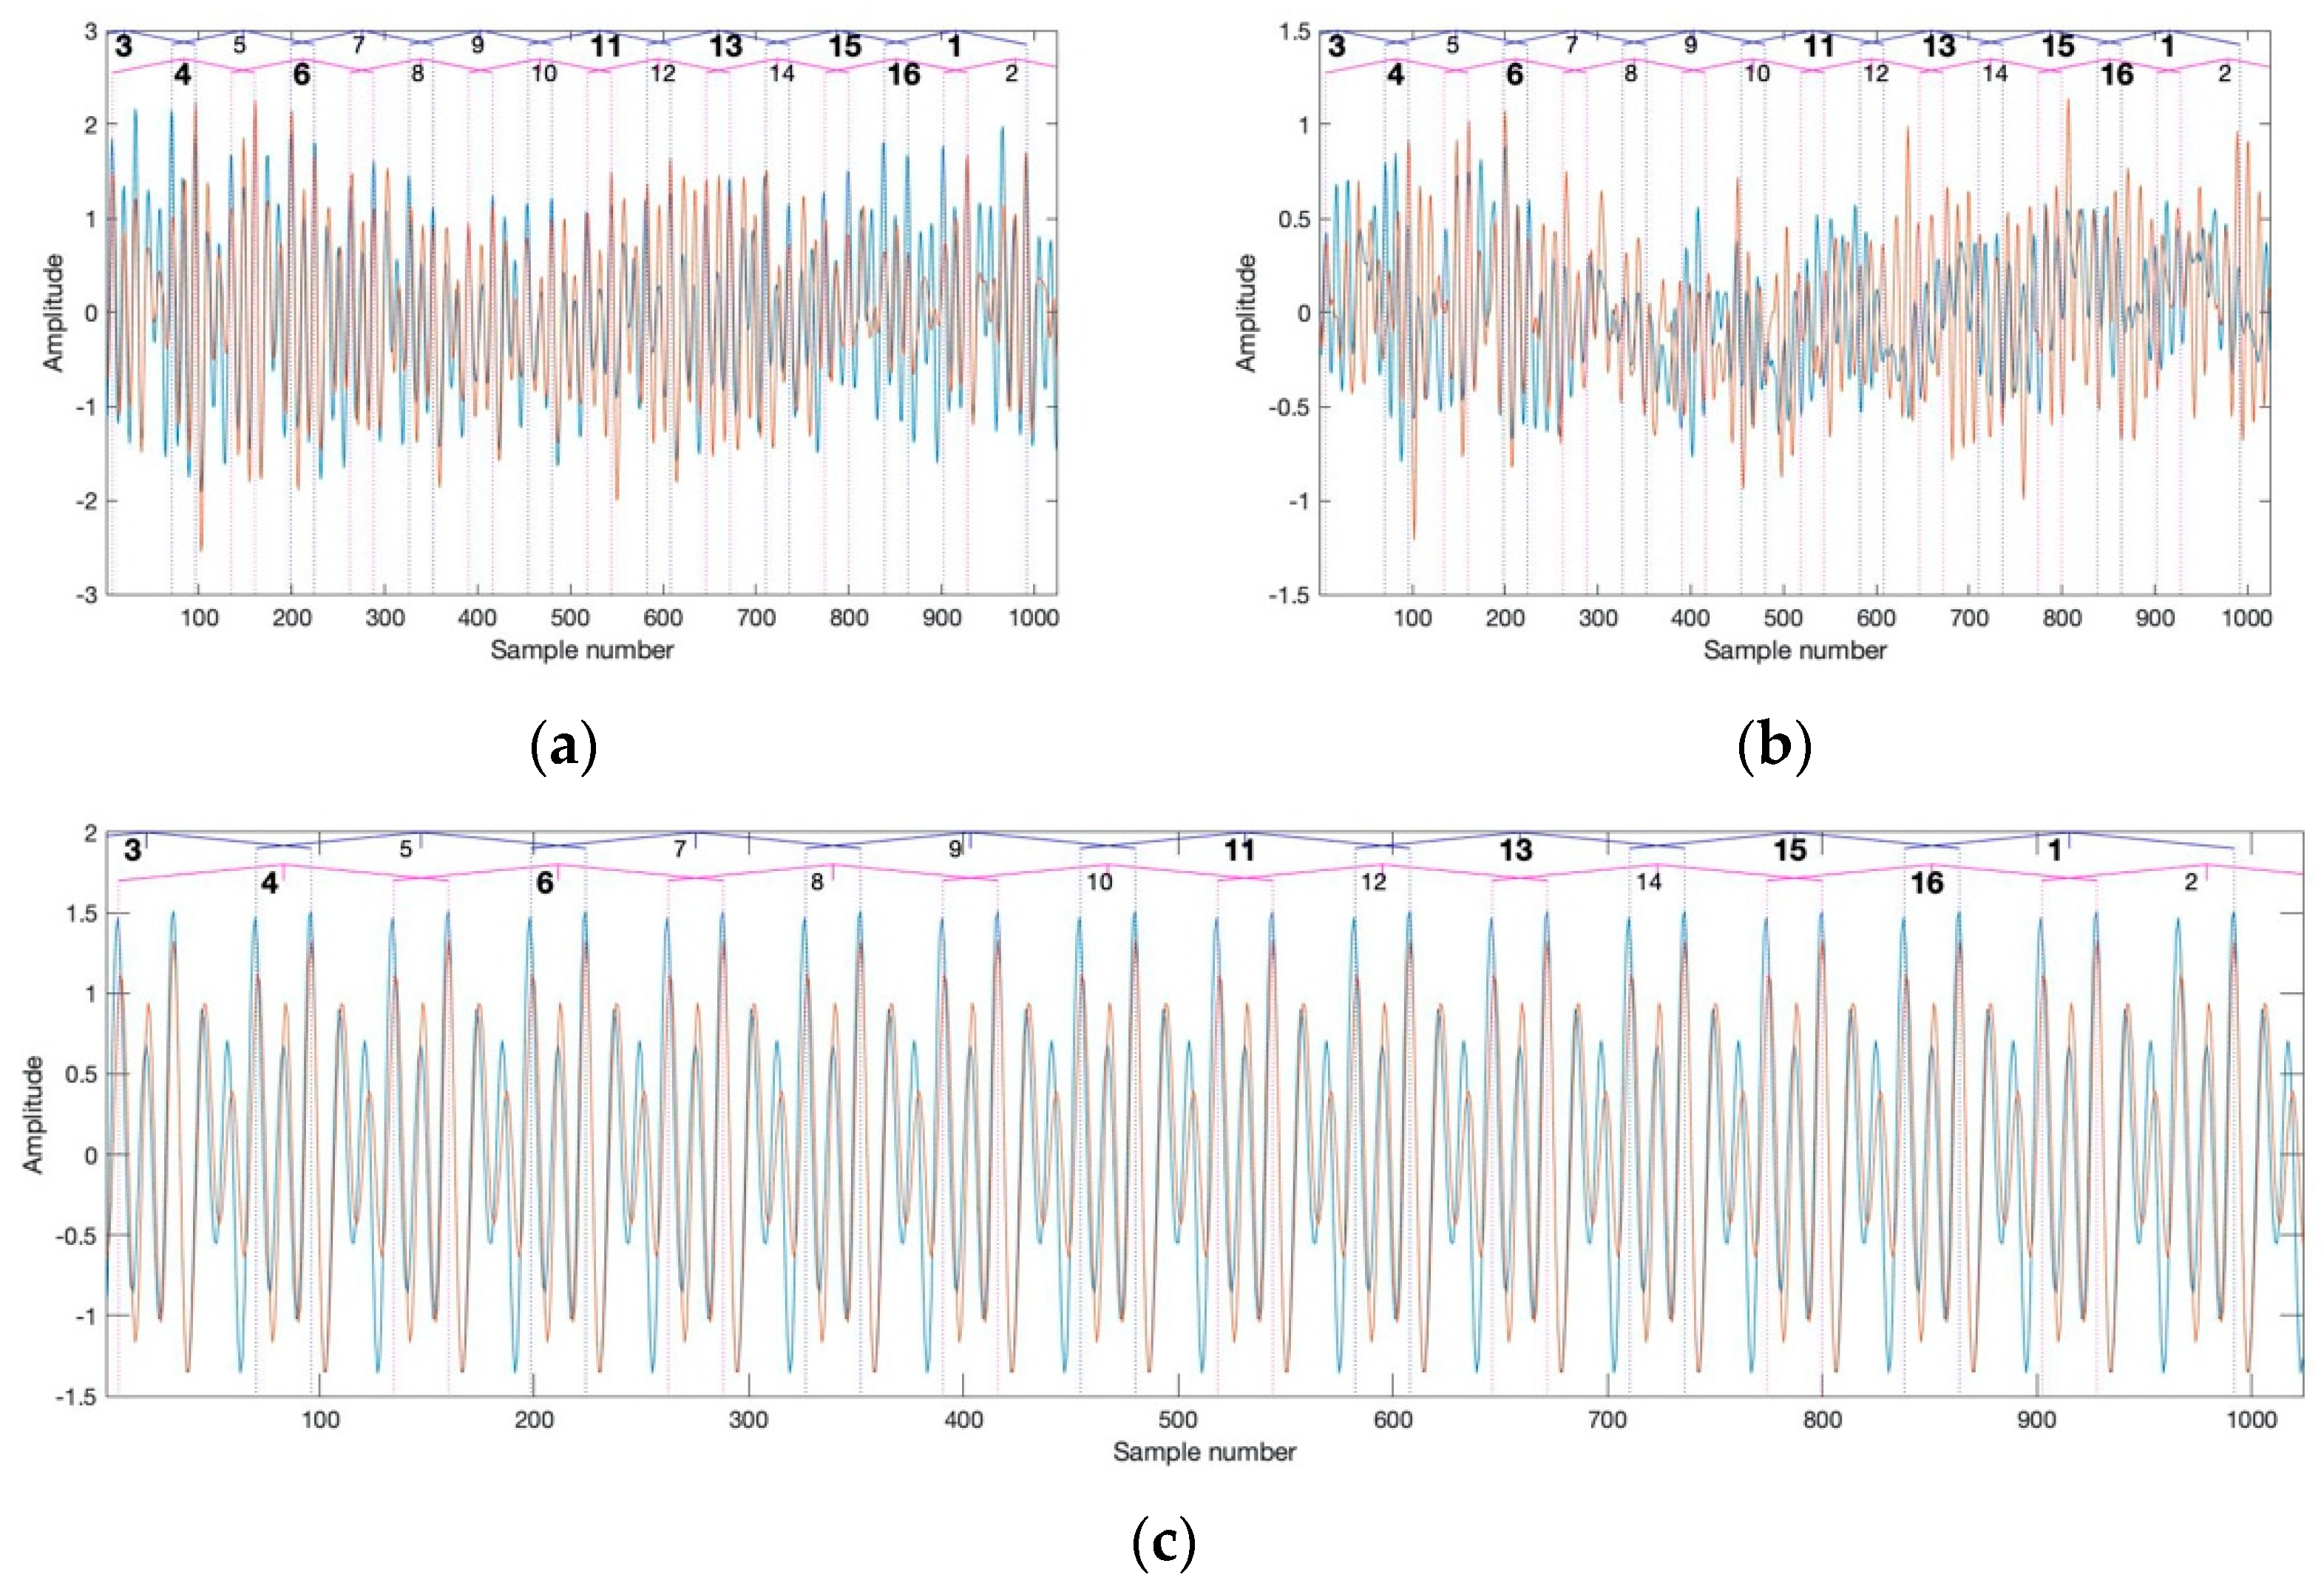
The plots of TSA, the CRS and the gear meshing components recorded for the faultless gear at the beginning of the experiment (blue) and for the faulty gear after 40 × 106 cycles (red) are shown in Figure 4. The vertical dotted lines mark angle ranges in which the teeth of the pinion were in contact with the teeth of the gear.
3.2.2. Selection of the Frequency Bands Relevant for WB Fault Detection
The wavelet transform result, which is the base for WB estimation, depends on the type of complex wavelet function and wavelet transform parameters, which define the trade-off between the time and frequency resolutions of the wavelet transform. In the presented research, the complex Morlet mother wavelet function was chosen because of its property, related to minimised spectral leakage, and its similarity to transient impulses, generated by gear faults. The Morlet wavelet function is expressed by the following equation:
where stands for the Morlet wavelet central frequency and denotes the bandwidth parameter, which defines the time and frequency resolutions of the wavelet analysis.
From a physical standpoint, to ensure the successful detection of a transient phenomenon, the duration of the wavelet function should match the duration of the transient phenomenon. Choosing the mother wavelet function parameters in the way that the duration of the wavelet function will match the duration of the low- and high-frequency components generated by gear faults is difficult and frequently not optimal for the detection of broad frequency band transients. In the presented research, the bandwidth parameter was estimated individually for each frequency to ensure that the duration of the wavelet function matches the duration of gear fault-related transients. Therefore, the time-width of the wavelet function (measured at −3 dB level) was set up to correspond to 1/15 of the period of the pinion.
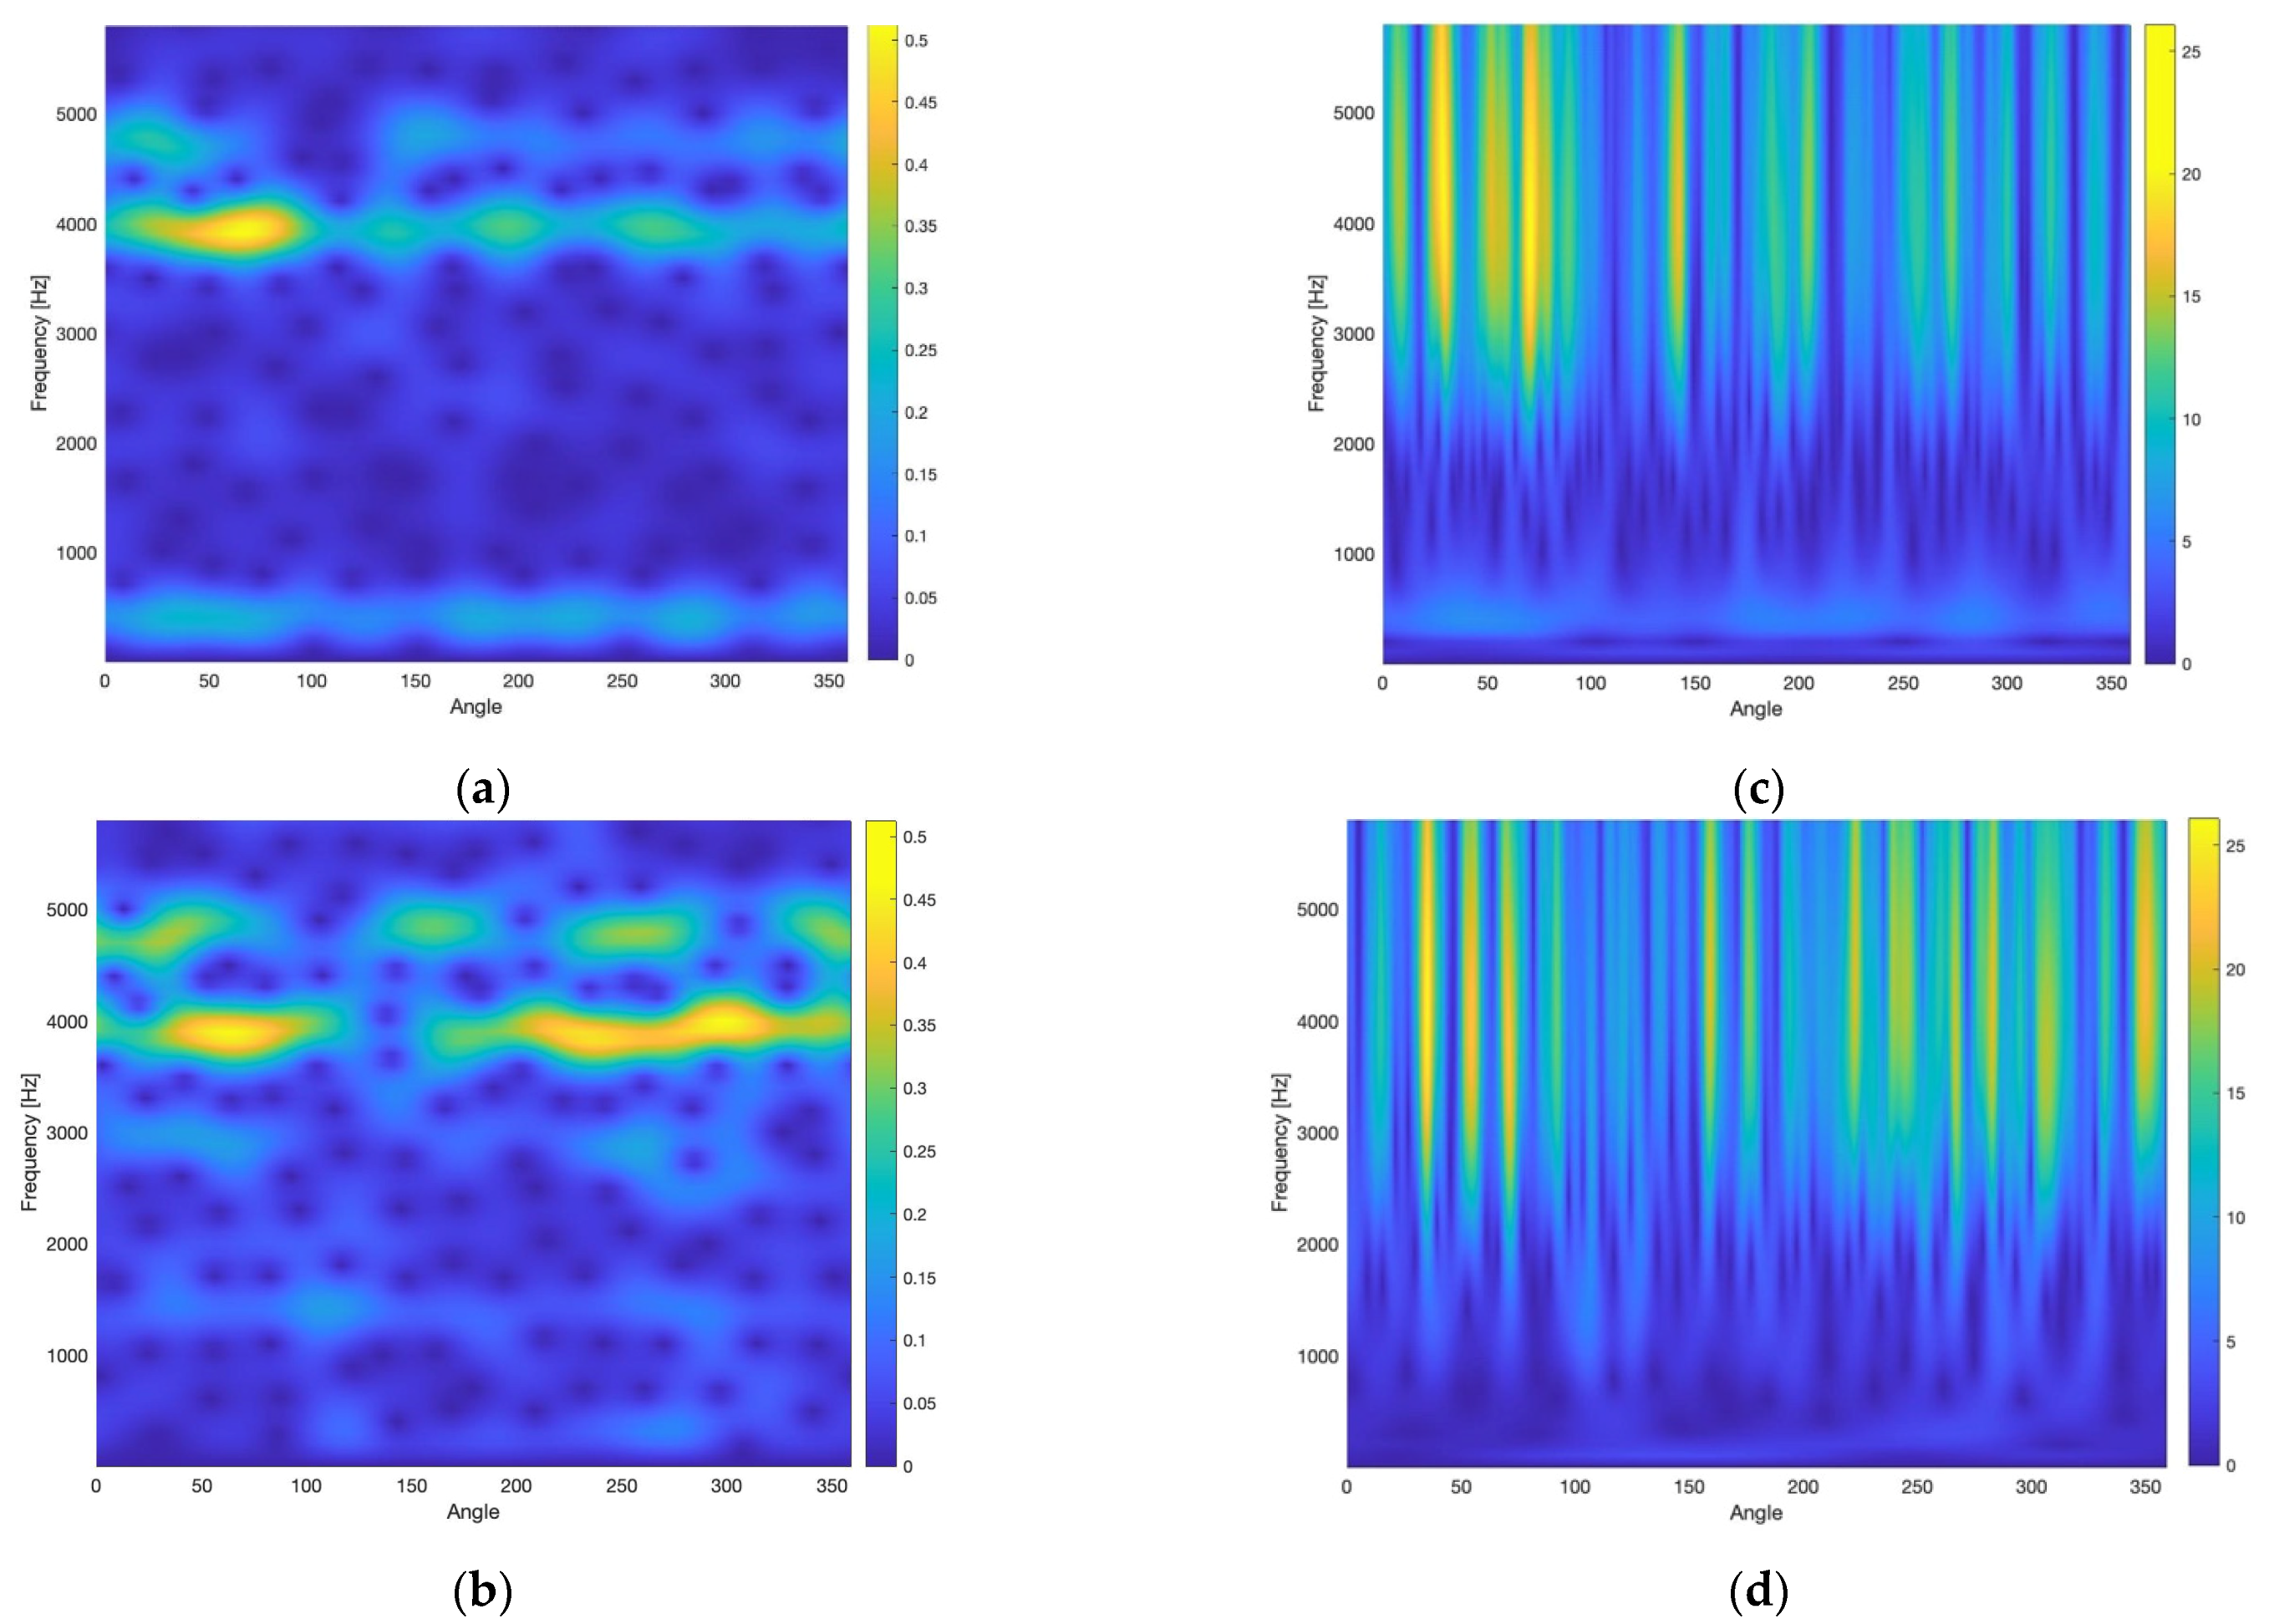
The scalograms of the continuous wavelet transform of the CRS are shown in Figure 5.
In Figure 5, the results are provided of wavelet analysis of the classical residual signals, generated by the gearbox at the beginning and the end of the trials. The wavelet scalograms are obtained by the wavelet transforms, utilising the Morlet and the Mexican hat mother wavelet functions. It can be seen that there are differences between the wavelet scalograms at the beginning (i.e., the undamaged gear conditions) and at the end (i.e., the damaged gear conditions) of the trials for the both mother wavelet functions.
Comparison between the wavelet scalograms, obtained by the Morlet and the Mexican hat wavelets, shows the difference between these scalograms, which is due to essential differences in time–frequency resolutions of the wavelet transforms, provided by these two types of mother wavelet functions. It can be seen that for the both types of mother wavelet functions, the wavelet scalograms exhibit differences between the undamaged and the damaged gearbox cases at the higher frequencies of the scalograms. In addition, the Morlet and the Mexican hat wavelets produce the scalograms that feature essentially different wavelet coefficients, of much higher amplitudes in the case of the Mexican hat wavelet.
As an example, this explains the essential difference between the Morlet scalogram and the Mexican hat scalogram, and a frequency of 4000 Hz is considered, which falls into the (f1 + f2) frequency band for WB estimation. For this particular frequency, the Mexican hat wavelet transform provides the frequency resolution, which is 6.2 times poorer than the frequency resolution of the Morlet wavelet transform.
Taking into account the uncertainty (i.e., Heisenberg) principle, the Mexican hat wavelet transform provides much better time resolution at a frequency of 4000 Hz than the Morlet wavelet transform. This essential difference in time resolutions explains the above-mentioned scalogram amplitude difference between the Mexican hat scalogram and the Morlet scalogram.
The above-mentioned difference in frequency resolutions between the Mexican hat and the Morlet wavelet transforms explains the difference in impact localisations between the Mexican hat scalogram and the Morlet scalogram, i.e., gear damage-related impacts are more localised in the Morlet scalogram compared with the Mexican hat scalogram.
WB can be estimated for all possible combinations of frequencies [33,35]. However, such an approach severely affects the estimation time and does not allow a physical justification of the selected frequency bands. To minimise the estimation time, the selection of the relevant frequency bands, containing fault detection relevant frequency components for integrated feature estimation, should be carried out before WB estimation. Therefore, WB estimation is carried out only for a minimal number of the selected frequency components.
In the previous studies utilising WB for gear fault detection, the selection of relevant frequency bands was based on the WB modulus map evaluation. In the application of WB for the detection of early-stage natural pitting, this approach was insufficient as only three out of eight faulty teeth were successfully detected [35].
In this research, a novel methodology of selecting the frequency bands that are relevant for WB fault detection is proposed and investigated. This methodology is based on the analysis of a difference between the scalograms of CRS signals related to fault-free and faulty gear conditions. The methodology has a series of advantages over previously used methodologies: (I) it does not require HOS estimation, and therefore it does not have a negative impact on calculation time; (II) it has a physical sense allowing it to precisely identify frequency bands in which vibration energies have increased due to gear faults; and (III) it is based on the wavelet transform, which is suitable for gear fault-related transients and matching with wavelet HOS techniques. Therefore, this methodology is applicable even to impulse transients featuring low signal to noise ratios and, therefore, representing early stages of gear faults.
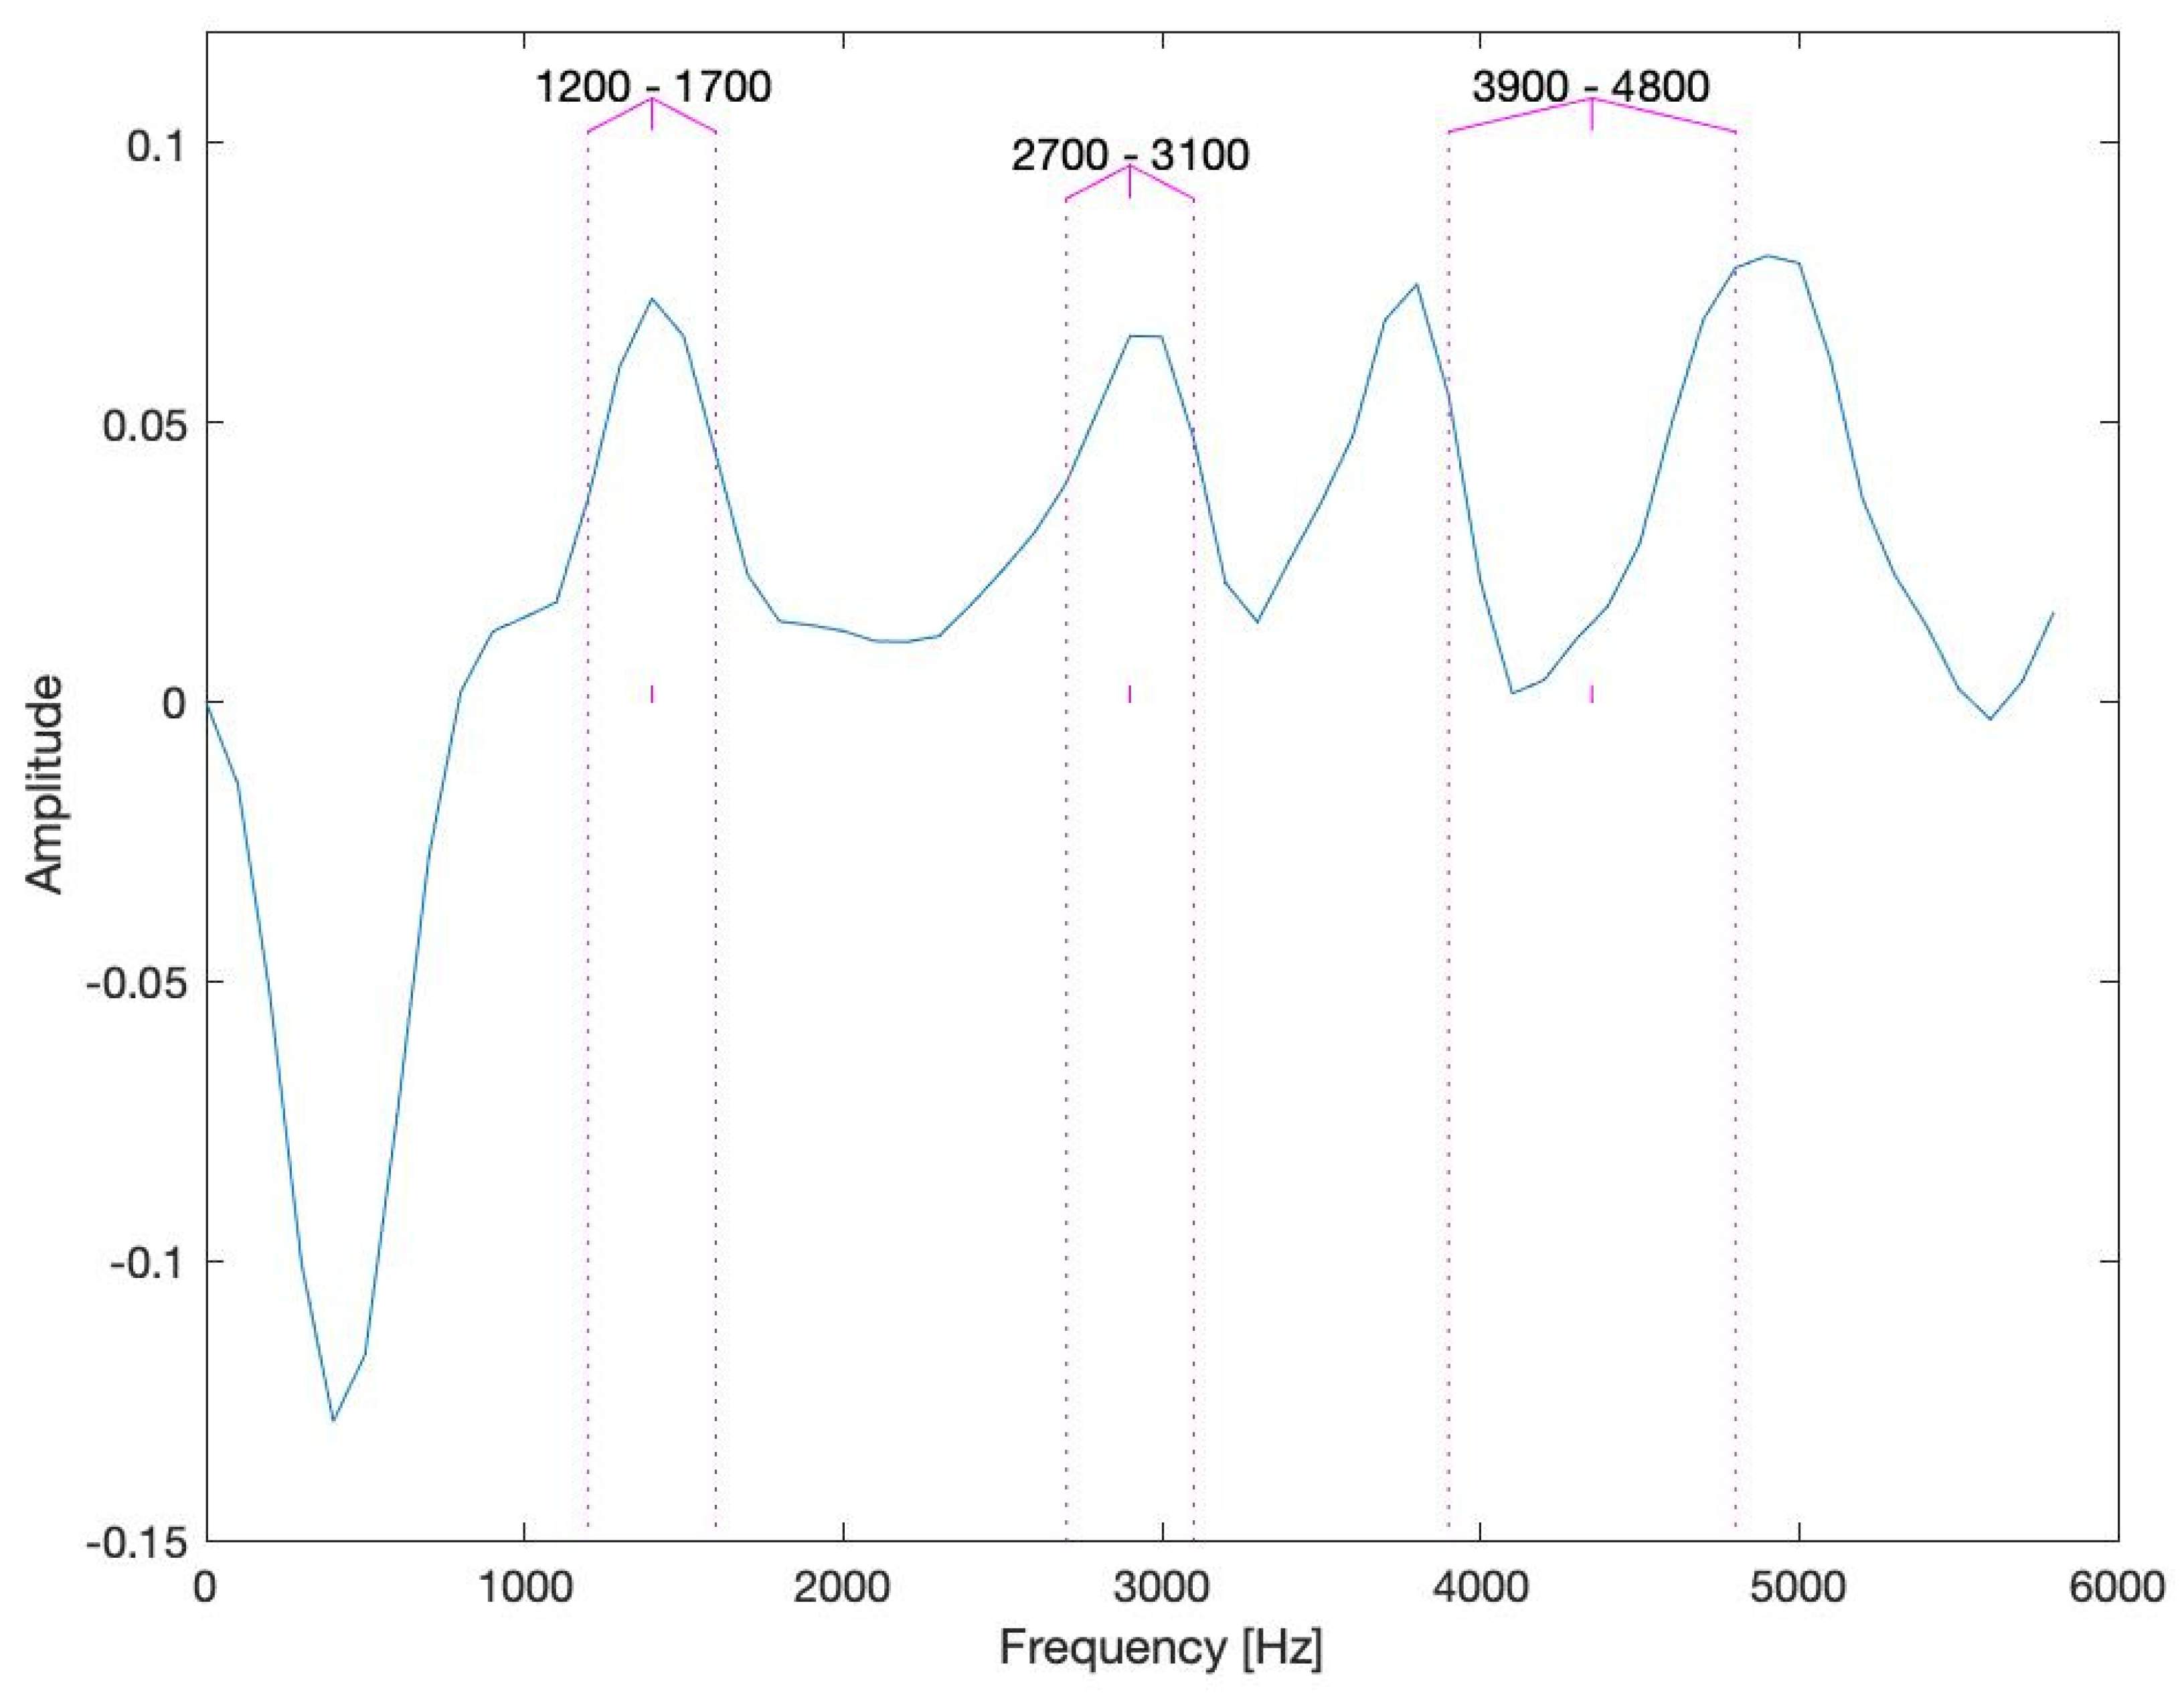
Figure 6 shows graph of the difference amplitude vs. frequency that demonstrate the difference between absolute values of CRS wavelet scalograms recorded at the beginning of the experiment (0–10 × 106 cycles) and the end of the experiment (40 × 106–50 × 106 cycles). The frequency bands, chosen for WB and for subsequent integrated feature estimation, have been marked with dotted vertical lines. In the case of WB, frequency bands <1200 Hz, 1700 Hz>; <2700 Hz, 3100 Hz> contain spectral components at frequencies and , respectively. Band <3900 Hz, 4800 Hz> contains spectral components at frequency .
In the presented research, the gearbox operates at a constant load and constant rotation pinion speed of 50 Hz. For real industrial cases, in which the speed and load of gearboxes are changing (e.g., renewable energy, transport), it is necessary to define relevant frequency bands for the integration of the IWB diagnostic feature. The relevant frequency bands are determined by the novel methodology proposed here, which is based on the wavelet spectral characteristics of gearbox vibrations for damaged and undamaged conditions at different gear speeds/loads. Therefore, carrying out vibration WB diagnostics of gearboxes operating at multiple speeds and loads would require the selection of relevant frequency bands, used for the integrated diagnostic feature, via the proposed novel methodology for specific combinations of gear speed and load.
3.2.3. The Wavelet Bicoherence Integrated Feature
WB is estimated according to Equation (1). The averaging, represented by operator E in Equation (1), is carried out for 30 consecutive complex wavelet transforms of the CRS signals.
The WB integrated feature has been estimated, according to Equation (3), for all combinations of spectral components and belonging to the bands <1200 Hz, 1700 Hz> and <2700 Hz, 3100 Hz>, respectively, identified as relevant for WB-based fault detection and shown in Figure 6.
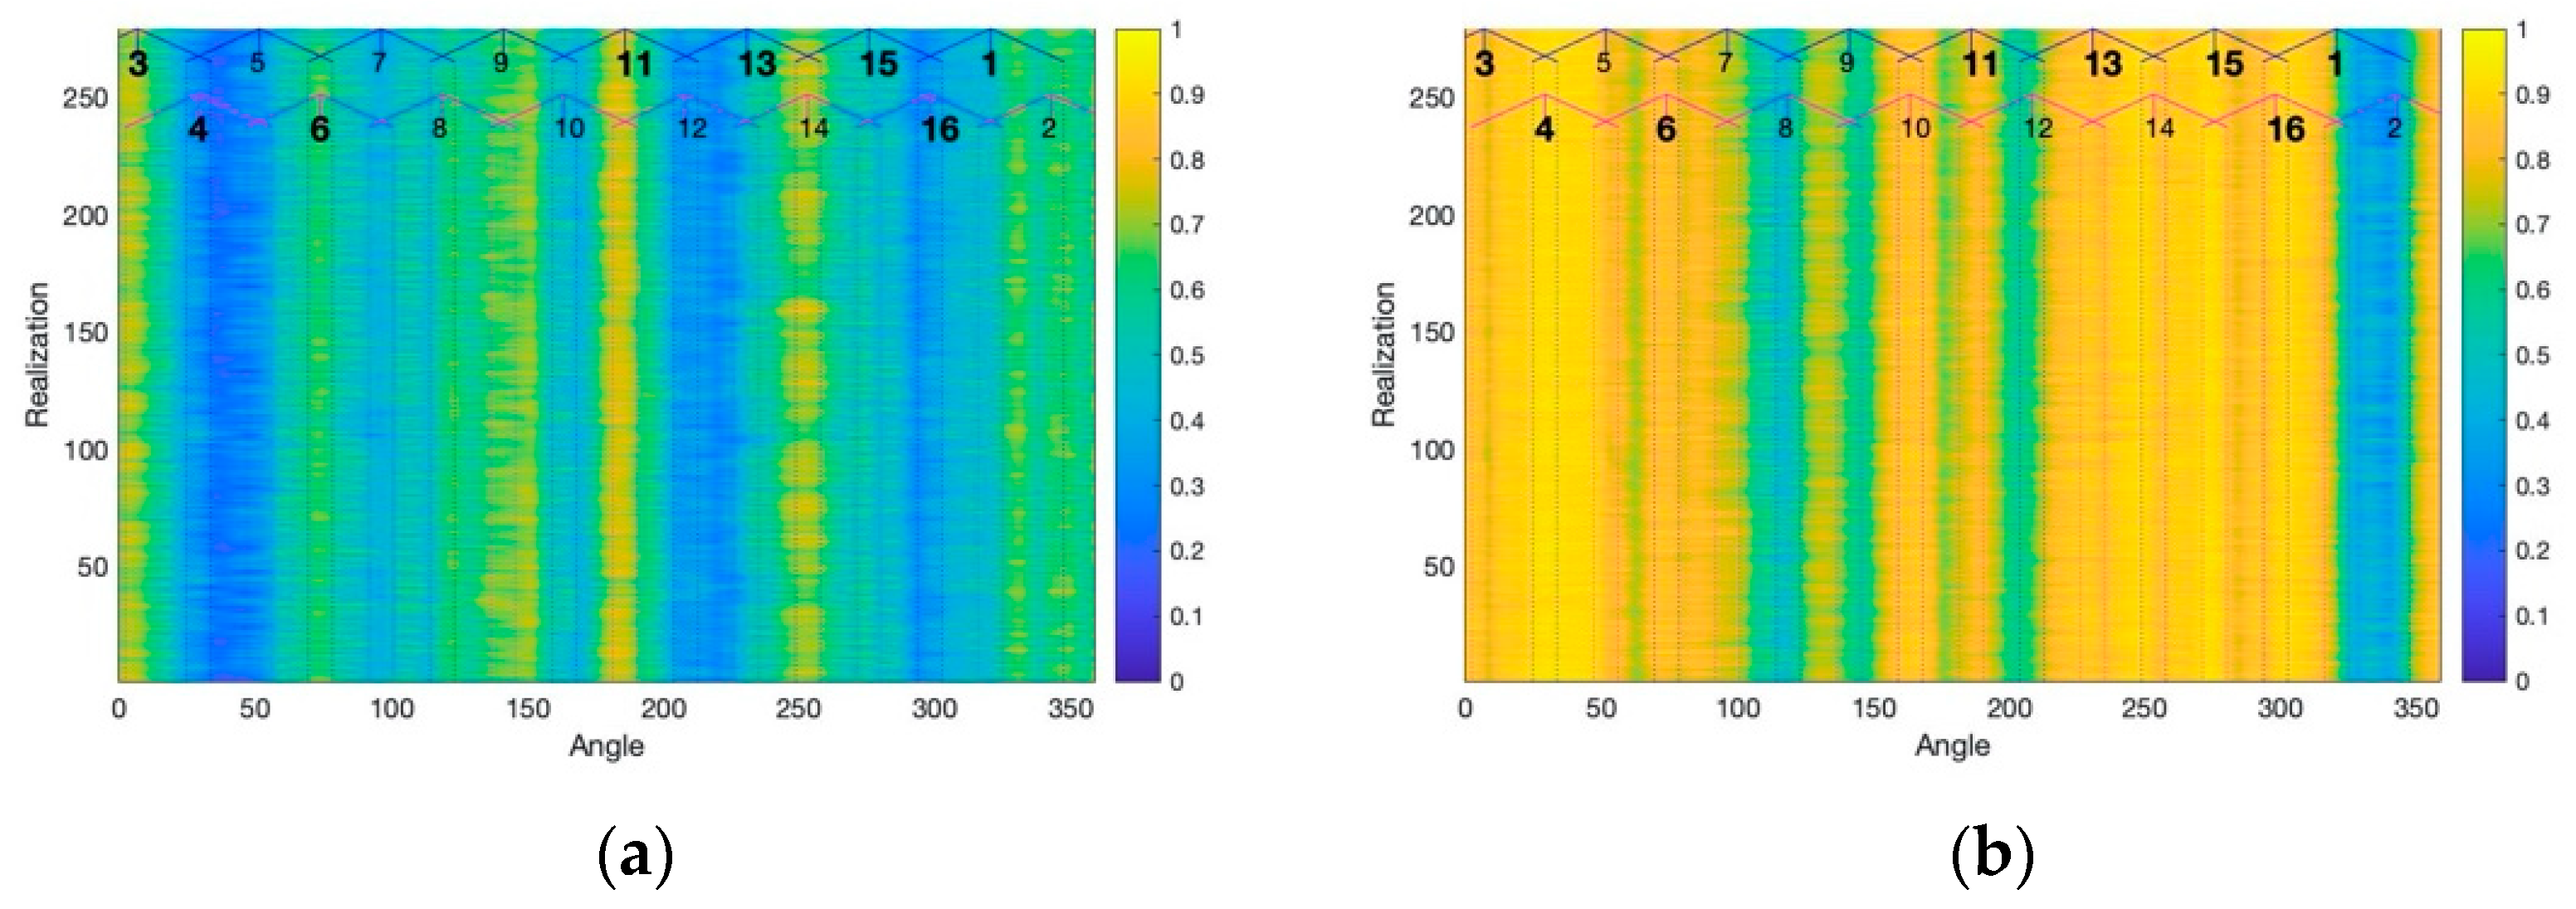
Figure 7 shows the plots of 270 consecutive estimations of IWB integrated features obtained for faultless and faulty gear cases.
Although the IWB integrated feature reaches essentially higher values for the faulty gearbox, IWB values require further statistical comparison in order to extract the information about the angular distribution of local pinion faults so the teeth affected by pitting can be identified. The comparison of IWB data, representing pitted and un-pitted pinion cases, was based on the Fisher criterion (FC). The FC, a widely used statistical tool for the effectiveness evaluation of fault detection [60,61,62], is expressed by the following equation:
where and are the mean values of IWB, and are the standard deviations of the IWB feature and is the angular position of the pinion for which the FC is calculated. and indexes denote damaged and undamaged pinion cases.
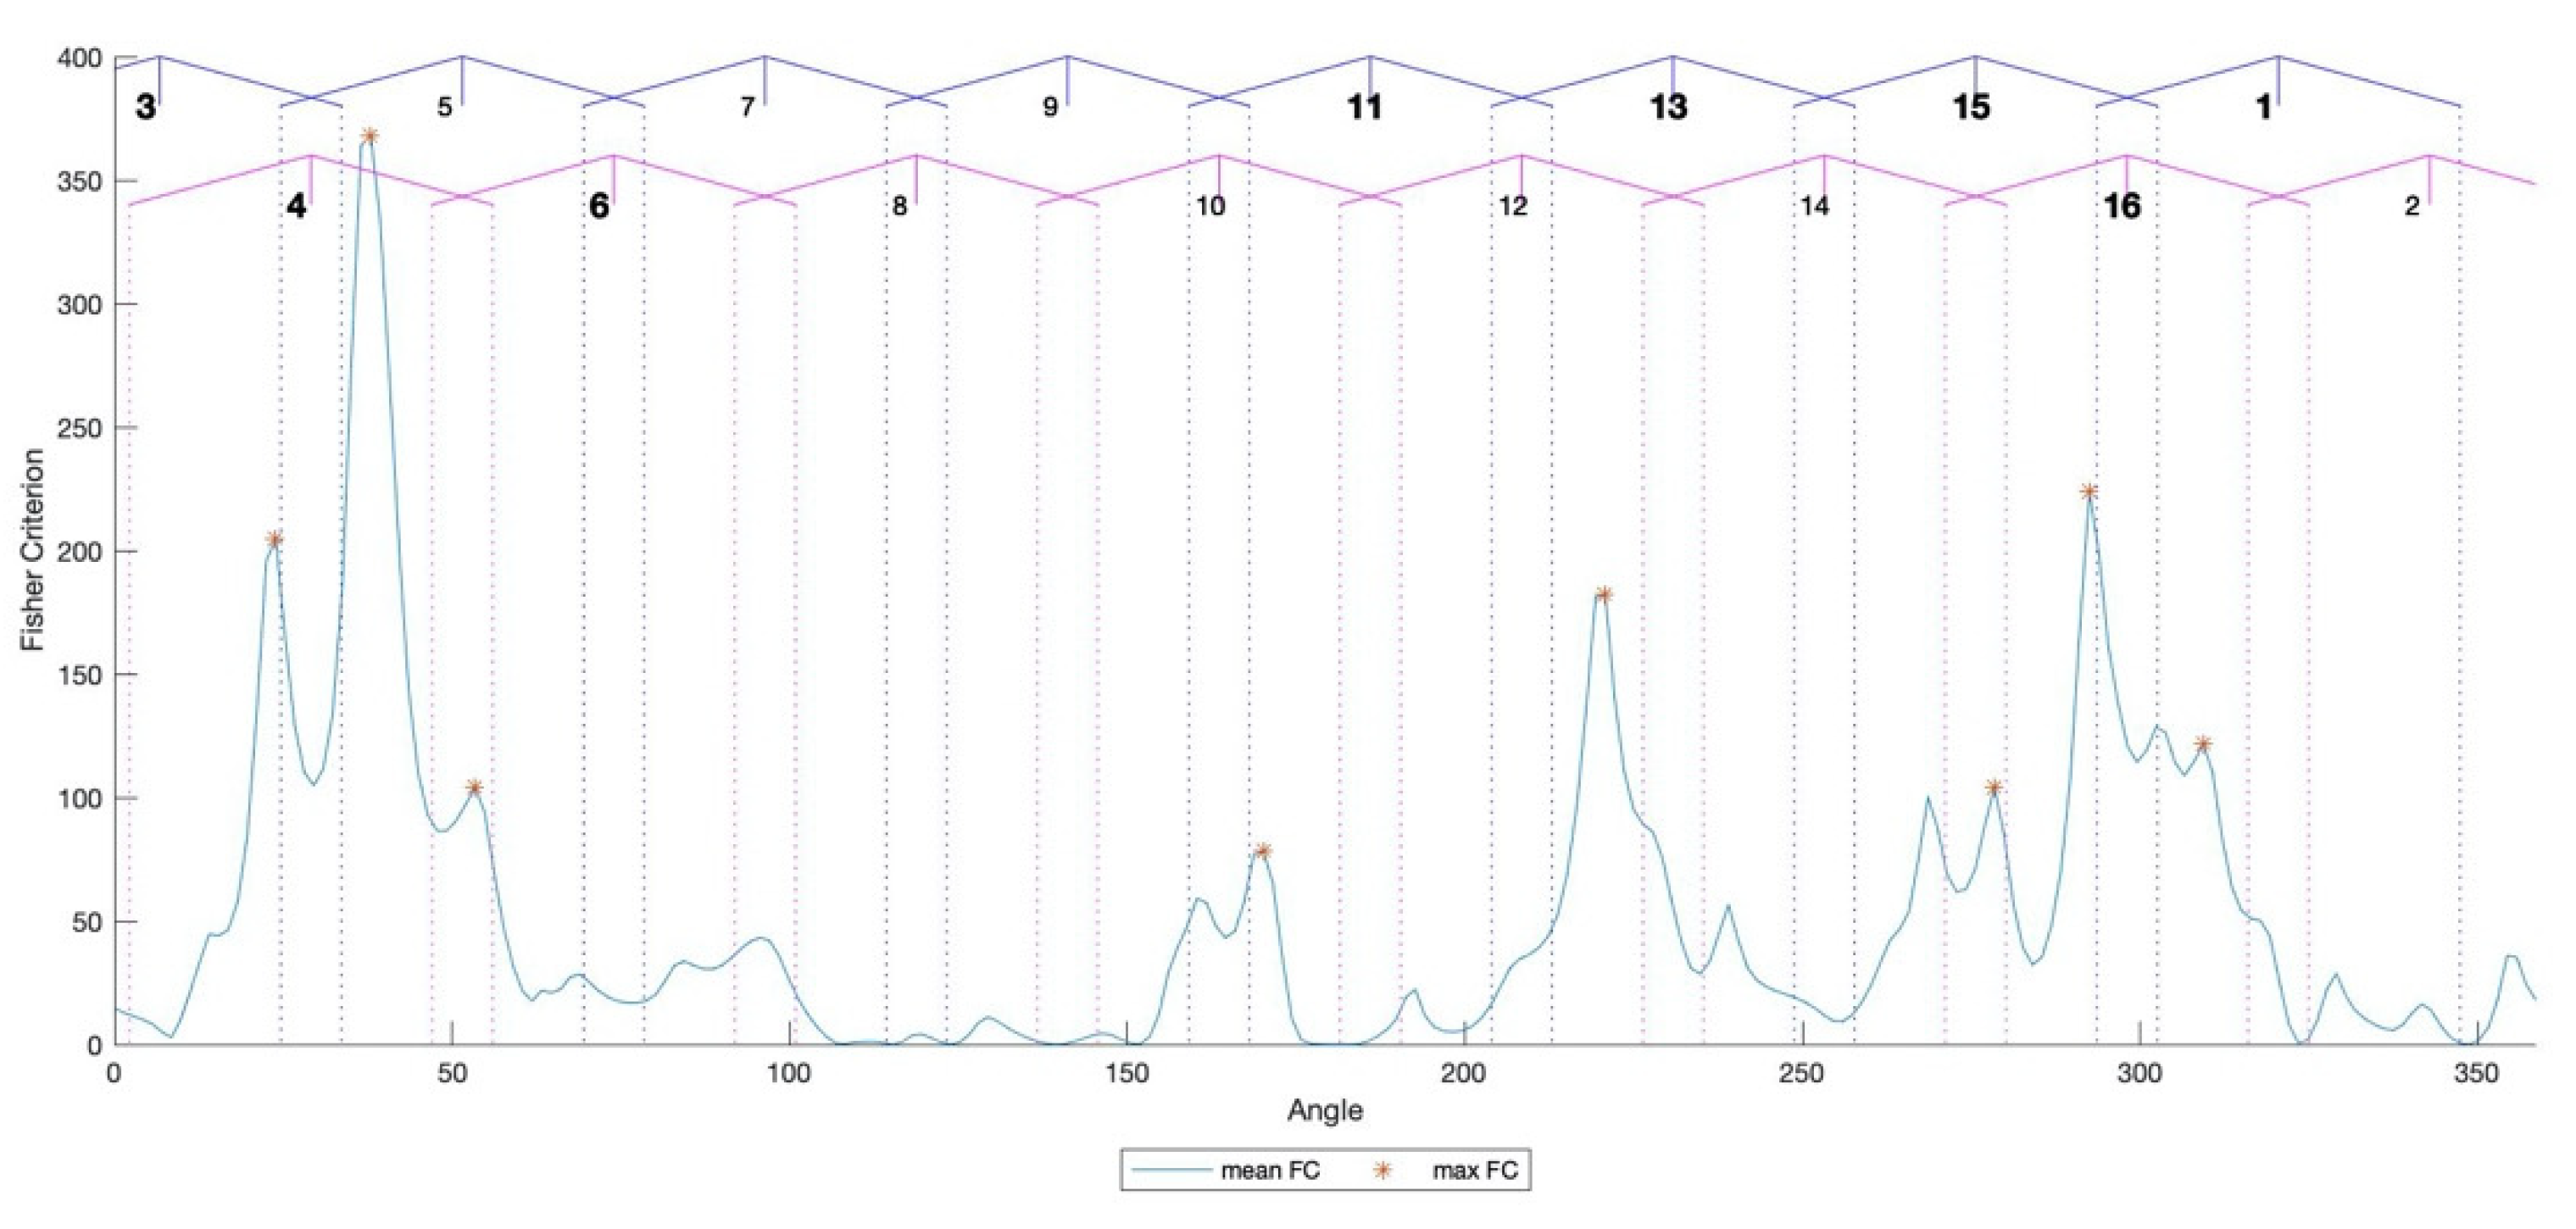
Figure 8 shows the plots of the FC, obtained by the comparison of IWB datasets, representing faultless and faulty gearbox cases, where bold numbers in the top of the plot mark positions of the damaged teeth. Local extreme points, which were used for PCFI estimation, are marked with stars.
3.3. Discussion of Results
IWB values, similarly to WB values, are contained within the range from zero to unity. The relatively high values of FC peaks, which indicate the angular location of the pinion faults, confirm the relatively high effectiveness of fault detection based on the WB technology. All FC peaks fall in the angular ranges that can be associated with individual faulty teeth, on the surface of which the development of pitting was observed. FC values that are close to zero fall into the angular ranges of the teeth on which no pitting development was observed. All faulty teeth were correctly detected and there are no FC peaks that could be interpreted as false positive. The average FC value for all eight detected faulty teeth is 173.
The FC works well for gear fault localisation. However, the FC’s disadvantage is that the FC values do not have any physical meaning. Moreover, for non-Gaussian fault detection features, the FC is not linked to the complete probability of correct fault identification. These two factors mean that the FC is unable to provide a comprehensive estimation of fault identification effectiveness.
Therefore, to provide the correct statistical tool that comprehensively quantifies fault detection effectiveness, the complete probability of correct fault identification (PCFI) was carried out according to the following formula:
where is the probability of true positive fault identification and is the probability of true negative fault identification.
The estimation of the PCFI was based on IWB values, selected from the used datasets. The selected IWB values correspond to the same angular positions of the pinion for which the FC reached its local maxima, marked with stars in Figure 8. The estimate of the PCFI for the IWB is relatively high—95.3%. The estimation was based on integrated feature values that were obtained from 1.14 × 10⁶ raw signal sections, corresponding to a single pinion revolution, which further corresponds to 6 h and 20 min of recorded vibration signals. Therefore, effective vibration-based fault detection is confirmed not only by stereo optical teeth surface evaluation (Figure 2) but also by achieving a high estimate of the PCFI.
In the course of the investigation, gear vibration signals were also subjected to 4th order wavelet spectral analysis using the 4th order wavelet HOS. Five out of eight faulty teeth were identified as faulty, and three faulty teeth were undetected. For the five correctly identified teeth, the complete probability of correct fault identification is 81.9%. It should be noted that the normalised wavelet trispectrum is introduced here for gearbox local fault detection and comparison between WB and the normalised wavelet trispectrum and should be viewed as a preliminary, as fault detection potentials of 4th order wavelet HOS are not fully investigated in the current research due to the limited frequency range of the captured gear vibration data.
3.4. Comparison with Other Works
WB, in comparison to second-order transforms, provides results that enable more accurate diagnostics at an early stage of damage development. The vibration data used in this research are also processed in reference [3] via the second-order wavelet transform, and for diagnostics of undamaged and damaged gearboxes, the obtained FC value is equal to 12, which is essentially lower than the FC value obtained in this research
WB combines the capabilities of two signal processing methods. The wavelet transform enables time–frequency signal processing and bicoherence enables the examination of the relationships between multiple spectral components. Finally, the integrated diagnostic feature allows us to produce one statistical parameter for numerous frequency triplets.
An essential percentage of gearboxes in industry operate at constant speed and constant load conditions. One of such real industrial cases is analysed via the usage of the instantaneous WB technology in reference [33]. In this work, the WB technology is successfully applied for a real industrial case of two back-to-back industrial gearboxes in industrial test bed conditions. The evidence of the effectiveness of the approach, proposed here, could be obtained by comparison with the work conducted by reference [33], in which the natural pitting, covering 3.5% of the tooth surface, evolved in the course of vibration diagnostic experiments. The FC, obtained via the integrated WB feature, reached a value of 45, which is essentially lower than the FC value obtained in this research for the teeth featuring natural pitting not exceeding 0.7%; therefore, the damage severity is five times smaller compared with damage severity in reference [33].
In addition, for five teeth featuring pitting, covering 1.5% to 18% of the tooth flank surface, the average FC value, obtained in [33], is 66. This value is essentially lower than the average FC value obtained in this research.
The novel methodology of selecting the relevant frequency bands also reveals its effectiveness in comparison to reference [35]. In this research, the selection of frequency bands, based on WB averaged maps, allows the correct identification of damaged teeth, featuring natural pitting of 0.5–0.7% of relative pitting size. The achieved FC values for vibration data used in this research do not exceed 16, making them essentially lower than the FC value obtained in this research.
The comparisons of the FC values between the current and the previous research prove the efficiency of the proposed approach. In addition, the new methodology of selecting the relevant frequency bands enables the essential reduction in WB estimation time.
4. Conclusions
(1) The powerful nonlinear non-stationary technique, instantaneous wavelet bicoherence (WB), has been investigated for the vibration fault detection of naturally developed micro-pitting in multiple gear teeth at very early stages of pitting development, i.e., in the range of (0.3–0.7%) of a relative pitting size. The presented research employs a novel approach, i.e., the WB does not focus on the analysis of fault-related specific narrowband signal components, but, instead, is oriented on the detection of fault-related vibration transients, the energy of which is spread over several broad frequency bands.
Detection effectiveness has been quantified by two statistical measures, i.e., the complete probability of correct fault identification and the Fisher criterion.
The presented novel investigation covers the following gaps in previous investigations:
(2) Gear fault detection via vibration signals was performed based on comprehensive experimental data obtained via fully controlled experimental trials. The analysed experimental data originated from endurance gear tests. The multiple local gear tooth faults are pitting, which affects tooth surfaces and has developed in a natural way (i.e., not seeded artificially). Therefore, the datasets are representative for gear damage cases that can occur in industrial applications. The overall length of the analysed vibration signals covers 6 h and 20 min of gear operation, which equals 1.14 × 10⁶ raw signal sections, corresponding to one pinion revolution. Therefore, a large volume of experimental vibration data has been processed and analysed in order to ensure proper statistical support of the obtained results.
(3) The comparison between the results of gear tooth surface evaluation via stereo optics and estimations of angular locations of the gear faults, indicated by the Fisher criterion, show a very good matching. The experimentally obtained fault detection capability of the WB technology is relatively high, i.e., the complete probability of correct fault identification is 95.3%. All faulty gear teeth of the pinion have been successfully detected. The average Fisher criterion, estimated for all detected faulty teeth, is also high at 173.
(4) The novel methodology of selecting the frequency bands that are relevant for WB fault detection is proposed and investigated. The methodology is based on the difference between the wavelet representation of vibration signals recorded for damaged and undamaged gear conditions. It is shown that the methodology provides an estimation of frequency bands in which vibration signal changes, caused by damage development, are the most explicit and enable correct gear fault detection.
(5) The 4th order wavelet spectrum does not allow us to obtain satisfactory fault detection results due to the limited frequency range of the captured gear vibration data; therefore, out of eight teeth, only five teeth have been detected. The complete probability of correct fault identification, estimated for correctly identified damaged teeth, is 81.9%. This novel technique, introduced for the first time in worldwide terms here for machinery fault detection, deserves further attention for the detection of machinery faults presenting complex nonlinear spectral patterns.
The presented novel research is an important step forward for the wide implementation of powerful nonlinear non-stationary instantaneous WB for the detection of local faults in industrial gear systems, related to renewable energy, transport, oil and gas, etc.
Author Contributions
Conceptualisation, L.G. and K.S.; methodology, L.G. and K.S.; software, K.S.; validation, L.G., K.S. and A.B.; analysis, L.G. and K.S.; investigation, L.G., K.S. and A.B.; resources, LG; data curation, L.G.; writing—original draft preparation, K.S.; writing—review and editing, L.G. and A.B.; visualisation, K.S.; supervision, L.G. All authors have read and agreed to the published version of the manuscript.
Funding
This research received no external funding.
Institutional Review Board Statement
Not applicable.
Informed Consent Statement
Not applicable.
Conflicts of Interest
The authors declare no conflict of interest.
References
- Bartelmus, W.; Zimroz, R. A New Feature for Monitoring the Condition of Gearboxes in Non-Stationary Operating Conditions. Mech. Syst. Signal Process. 2009, 23, 1528–1534. [Google Scholar] [CrossRef]
- Zimroz, R.; Bartkowiak, A. Two Simple Multivariate Procedures for Monitoring Planetary Gearboxes in Non-Stationary Operating Conditions. Mech. Syst. Signal Process. 2013, 38, 237–247. [Google Scholar] [CrossRef]
- Gryllias, K.C.; Gelman, L.; Shaw, B.; Vaidhianathasamy, M. Local Damage Diagnosis in Gearboxes Using Novel Wavelet Technology. Insight Non-Destr. Test. Cond. Monit. 2010, 52, 437–442. [Google Scholar] [CrossRef]
- Combet, F.; Gelman, L.; Anuzis, P.; Slater, R. Vibration Detection of Local Gear Damage by Advanced Demodulation and Residual Techniques. Proc. Inst. Mech. Eng. Part G J. Aerosp. Eng. 2009, 223, 507–514. [Google Scholar] [CrossRef]
- Gelman, L.M.; Kripak, D.A.; Fedorov, V.V.; Udovenko, L.N. Condition Monitoring Diagnosis Methods of Helicopter Units. Mech. Syst. Signal Process. 2000, 14, 613–624. [Google Scholar] [CrossRef]
- Li, H.; Fan, B.; Jia, R.; Zhai, F.; Bai, L.; Luo, X. Research on Multi-Domain Fault Diagnosis of Gearbox of Wind Turbine Based on Adaptive Variational Mode Decomposition and Extreme Learning Machine Algorithms. Energies 2020, 16, 1375. [Google Scholar] [CrossRef] [Green Version]
- Wang, T.; Chu, F.; Han, Q. Fault Diagnosis for Wind Turbine Planetary Ring Gear via a Meshing Resonance Based Filtering Algorithm. ISA Trans. 2017, 67, 173–182. [Google Scholar] [CrossRef]
- Hammami, A.; Del Rincon, A.F.; Chaari, F.; Rueda, F.V.; Haddar, M. Dynamic Behaviour of Back to Back Planetary Gear in Run Up and Run Down Transient Regimes. J. Mech. 2015, 31, 481–491. [Google Scholar] [CrossRef]
- Zimroz, R.R.; Millioz, F.; Martin, N. A Procedure of Vibration Analysis from Planetary Gearbox under Non-Stationary Cyclic Operations for Instantaneous Frequency Estimation in Time-Frequency Domain. In Proceedings of the 7th International Conference on Condition Monitoring and Machinery Failure Prevention Technologies 2010 (CM 2010/MFPT 2010), Stratford-upon-Avon, UK, 22–24 June 2010; Volume 2, pp. 1133–1145. [Google Scholar]
- Fan, X.; Zuo, M.J. Gearbox Fault Detection Using Hilbert and Wavelet Packet Transform. Mech. Syst. Signal Process. 2006, 20, 966–982. [Google Scholar] [CrossRef]
- Laval, X.; Mailhes, C.; Martin, N.; Bellemain, P.; Pachaud, C. Amplitude and Phase Interaction in Hilbert Demodulation of Vibration Signals: Natural Gear Wear Modeling and Time Tracking for Condition Monitoring. Mech. Syst. Signal Process. 2021, 150, 107321. [Google Scholar] [CrossRef]
- Lin, J.; Zuo, M.J. Gearbox Fault Diagnosis Using Adaptive Wavelet Filter. Mech. Syst. Signal Process. 2003, 17, 1259–1269. [Google Scholar] [CrossRef]
- Kundu, P.; Darpe, A.K.; Kulkarni, M.S. An Ensemble Decision Tree Methodology for Remaining Useful Life Prediction of Spur Gears under Natural Pitting Progression. Struct. Health Monit. 2020, 19, 854–872. [Google Scholar] [CrossRef]
- Wodecki, J.; Stefaniak, P.; Obuchowski, J.; Wylomanska, A.; Zimroz, R. Combination of Principal Component Analysis and Time-Frequency Representations of Multichannel Vibration Data for Gearbox Fault Detection. J. Vibroengineering 2016, 18, 2167–2175. [Google Scholar] [CrossRef] [Green Version]
- Gui, Y.; Han, Q.; Chu, F. A Vibration Model for Fault Diagnosis of Planetary Gearboxes with Localized Planet Bearing Defects. J. Mech. Sci. Technol. 2016, 30, 4109–4119. [Google Scholar] [CrossRef]
- Wu, S.; Zuo, M.J.; Parey, A. Simulation of Spur Gear Dynamics and Estimation of Fault Growth. J. Sound Vib. 2008, 317, 608–624. [Google Scholar] [CrossRef]
- Stander, C.J.; Heyns, P.S.; Schoombie, W. Using Vibration Monitoring for Local Fault Detection on Gears Operating under Fluctuating Load Conditions. Mech. Syst. Signal Process. 2002, 16, 1005–1024. [Google Scholar] [CrossRef]
- Heyns, T.; Godsill, S.J.; De Villiers, J.P.; Heyns, P.S. Statistical Gear Health Analysis Which Is Robust to Fluctuating Loads and Operating Speeds. Mech. Syst. Signal Process. 2012, 27, 651–666. [Google Scholar] [CrossRef] [Green Version]
- Zghal, B.; Graja, O.; Dziedziech, K.; Chaari, F.; Jablonski, A.; Barszcz, T.; Haddar, M. A New Modeling of Planetary Gear Set to Predict Modulation Phenomenon. Mech. Syst. Signal Process. 2019, 127, 234–261. [Google Scholar] [CrossRef]
- McDonald, G.L.; Zhao, Q.; Zuo, M.J. Maximum Correlated Kurtosis Deconvolution and Application on Gear Tooth Chip Fault Detection. Mech. Syst. Signal Process. 2012, 33, 237–255. [Google Scholar] [CrossRef]
- Antoni, J. Fast Computation of the Kurtogram for the Detection of Transient Faults. Mech. Syst. Signal Process. 2007, 21, 108–124. [Google Scholar] [CrossRef]
- Gelman, L.; Chandra, N.H.; Kurosz, R.; Pellicano, F.; Barbieri, M.; Zippo, A. Novel Spectral Kurtosis Technology for Adaptive Vibration Condition Monitoring of Multi-Stage Gearboxes. Insight Non-Destr. Test. Cond. Monit. 2016, 58, 409–416. [Google Scholar] [CrossRef]
- Chandra, H.; Gelman, L. Novel Gear Diagnosis Technique Based on Spectral Kurtosis. In Proceedings of the ICSV 2016—23rd International Congress on Sound and Vibration, Athens, Greece, 10–14 July 2016; p. 1890. [Google Scholar]
- Gelman, L.; Kolbe, S.; Shaw, B.; Vaidhianathasamy, M. Novel Adaptation of the Spectral Kurtosis for Vibration Diagnosis of Gearboxes in Non-Stationary Conditions. Insight Non-Destr. Test. Cond. Monit. 2017, 59, 434–439. [Google Scholar] [CrossRef]
- Dalpiaz, G.; Rivola, A.; Rubini, R. Effectiveness and Sensitivity of Vibration Processing Techniques for Local Fault Detection in Gears. Mech. Syst. Signal Process. 2000, 14, 387–412. [Google Scholar] [CrossRef]
- Zimroz, R.; Bartkowiak, A. Investigation on Spectral Structure of Gearbox Vibration Signals by Principal Component Analysis for Condition Monitoring Purposes. J. Phys. Conf. Ser. 2011, 305. [Google Scholar] [CrossRef]
- Dadon, I.; Koren, N.; Klein, R.; Bortman, J. A Step Toward Fault Type and Severity Characterization in Spur Gears. J. Mech. Des. 2019, 141. [Google Scholar] [CrossRef]
- Zhang, J.; Feng, Z.; Qin, Z.; Chu, F. Gearbox Fault Diagnosis Using Time-Wavelet Energy Spectral Analysis. In Condition Monitoring of Machinery in Non-Stationary Operations; Springer: Berlin/Heidelberg, Germany, 2012; pp. 223–230. [Google Scholar]
- Obuchowski, J.; Wylomańska, A.; Zimroz, R. Recent Developments in Vibration Based Diagnostics of Gear and Bearings Used in Belt Conveyors. Appl. Mech. Mater. 2014, 683, 171–176. [Google Scholar] [CrossRef]
- Lei, Y.; Zuo, M.J. Gear Crack Level Identification Based on Weighted K Nearest Neighbor Classification Algorithm. Mech. Syst. Signal Process. 2009, 23, 1535–1547. [Google Scholar] [CrossRef]
- Kundu, P.; Darpe, A.K.; Kulkarni, M.S. Gear Pitting Severity Level Identification Using Binary Segmentation Methodology. Struct. Control Health Monit. 2020, 27, 1–20. [Google Scholar] [CrossRef]
- Kundu, P.; Darpe, A.K.; Kulkarni, M.S. A Review on Diagnostic and Prognostic Approaches for Gears. Struct. Health Monit. 2020. [Google Scholar] [CrossRef]
- Combet, F.; Gelman, L.; Lapayne, G. Novel Detection of Local Tooth Damage in Gears by the Wavelet Bicoherence. Mech. Syst. Signal Process. 2012, 26, 218–228. [Google Scholar] [CrossRef]
- Gelman, L.; Petrunin, I.; Parrish, C.; Walters, M. Novel Health Monitoring Technology for In-Service Diagnostics of Intake Separation in Aircraft Engines. Struct. Control Health Monit. 2020, 27, e2479. [Google Scholar] [CrossRef] [Green Version]
- Gelman, L.; Solinski, K.; Shaw, B.; Vaidhianathasamy, M. Vibration Diagnosis of a Gearbox by Wavelet Bicoherence Technology. Insight Non-Destr. Test. Cond. Monit. 2017, 59, 440–444. [Google Scholar] [CrossRef] [Green Version]
- Howard, I.M. Higher-Order Spectral Techniques for Machine Vibration Condition Monitoring. Proc. Inst. Mech. Eng. Part. G J. Aerosp. Eng. 1997, 211, 211–218. [Google Scholar] [CrossRef]
- Larsen, Y.; Hanssen, A. Wavelet-Polyspectra: Analysis of Non-Stationary and Non-Gaussian/Non-Linear Signals. In Proceedings of the Proceedings of the Tenth IEEE Workshop on Statistical Signal and Array Processing (Cat. No.00TH8496), Pocono Manor, PA, USA, 16 August 2000; IEEE: Pocono Manor, PA, USA, 2000; pp. 539–543. [Google Scholar]
- Taplidou, S.A.; Hadjileontiadis, L.J. Nonlinear Analysis of Wheezes Using Wavelet Bicoherence. Comput. Biol. Med. 2007, 37, 563–570. [Google Scholar] [CrossRef]
- Rivola, A. Comparison between Second and Higher Order Spectral Analysis in Detecting Structural Damages. In Proceedings of the Proceedings of Seventh International Conference on Recent Advances in Structural Dynamics, Southampton, UK, 24–27 July 2000; Volume 2, pp. 937–950. [Google Scholar]
- Rivola, A.; White, P.R. Bispectral Analysis of the Bilinear Oscillator with Application to the Detection of Fatigue Cracks. J. Sound Vib. 1998, 216, 889–910. [Google Scholar] [CrossRef]
- Park, H. Nonlinearity Detection for Condition Monitoring Utilizing Higher-Order Spectral Analysis Diagnostics; The University of Texas at Austin: Austin, TX, USA, 2008. [Google Scholar]
- Chua, K.C.; Chandran, V.; Acharya, U.R.; Lim, C.M. Application of Higher Order Spectra to Identify Epileptic EEG. J. Med. Syst. 2011, 35, 1563–1571. [Google Scholar] [CrossRef]
- Parker, B.E.; Ware, H.A.A.; Wipf, D.P.P.; Tompkins, W.R.R.; Clark, B.R.R.; Larson, E.C.C.; Poor, H.V. Fault Diagnostics Using Statistical Change Detection in the Bispectral Domain. Mech. Syst. Signal Process. 2000, 14, 561–570. [Google Scholar] [CrossRef] [Green Version]
- Zhang, R.; Gu, F.; Mansaf, H.; Wang, T.; Ball, A.D. Gear Wear Monitoring by Modulation Signal Bispectrum Based on Motor Current Signal Analysis. Mech. Syst. Signal Process. 2017, 94, 202–213. [Google Scholar] [CrossRef]
- Zhang, R.; Gu, X.; Gu, F.; Wang, T.; Ball, A.D. Gear Wear Process Monitoring Using a Sideband Estimator Based on Modulation Signal Bispectrum. Appl. Sci. 2017, 7, 274. [Google Scholar] [CrossRef]
- Guo, J.; Shi, Z.; Li, H.; Zhen, D.; Gu, F.; Ball, A. Early Fault Diagnosis for Planetary Gearbox Based Wavelet Packet Energy and Modulation Signal Bispectrum Analysis. Sensors 2018, 18, 2908. [Google Scholar] [CrossRef] [PubMed] [Green Version]
- Guo, J.; Zhen, D.; Li, H.; Shi, Z.; Gu, F.; Ball, A.D. Fault Detection for Planetary Gearbox Based on an Enhanced Average Filter and Modulation Signal Bispectrum Analysis. ISA Trans. 2020, 101, 408–420. [Google Scholar] [CrossRef] [PubMed]
- Gelman, L.; Ottley, M. New Processing Techniques for Transient Signals with Non-Linear Variation of the Instantaneous Frequency in Time. Mech. Syst. Signal Process. 2006, 20, 1254–1262. [Google Scholar] [CrossRef]
- Gelman, L.; Kırlangıç, A.S. Novel Vibration Structural Health Monitoring Technology for Deep Foundation Piles by Non-Stationary Higher Order Frequency Response Function. Struct. Control Health Monit. 2020, 27, 1–13. [Google Scholar] [CrossRef]
- Gelman, L.; Gould, J.D. Time-Frequency Chirp-Wigner Transform for Signals with Any Nonlinear Polynomial Time Varying Instantaneous Frequency. Mech. Syst. Signal Process. 2007, 21, 2980–3002. [Google Scholar] [CrossRef]
- Gelman, L.; Parrish, C.; Petrunin, I.; Walters, M. Novel In-Service Combustion Instability Detection Using the Chirp Fourier Higher Order Spectra. Int. J. Progn. Health Manag. 2017, 8, 1. [Google Scholar]
- van Milligen, B.P.; Sanchez, E.; Estrada, T.; Hidalgo, C.; Brafias, B.; Carreras, B.; Garcia, L. Wavelet Bicoherence: A New Turbulence Analysis Tool. Phys. Plasmas 1995, 2, 3017–3032. [Google Scholar] [CrossRef] [Green Version]
- Li, Y.; Zhou, S. A New Instantaneous Wavelet Bicoherence for Local Fault Detection of Rotating Machinery. IEEE Trans. Instrum. Meas. 2020, 69, 135–143. [Google Scholar] [CrossRef]
- Chandran, V.; Elgar, S.; Vanhoff, B. Statistics of Tricoherence. IEEE Trans. Signal Process. 1994, 42, 3430–3440. [Google Scholar] [CrossRef]
- Bessios, A.G.; Nikias, C.L. POTEA: The Power Cepstrum and Tricoherence Equalization Algorithm. IEEE Trans. Commun. 1995, 43, 2667–2671. [Google Scholar] [CrossRef]
- Kharintsev, S.S. Seismic Pattern Recognition By Wavelet Based-Higher Order Statistics. In Proceedings of the AIP Conference Proceedings, Salamanca, Spain, 24 August 2005; AIP: Tokyo, Japan; Volume 780, pp. 825–828. [Google Scholar]
- Yi, E.-J.; Powers, E.J. Application of Wavelet-Based Trispectra to Detect Short-Time Duration Nonlinear Wave Phenomena. In Proceedings of the International Offshore and Polar Engineering Conference, Stavanger, Norway, 17–22 June 2001; ISOPE: Stavanger, Norway, 2001; Volume 3, pp. 65–70. [Google Scholar]
- Larsen, Y.; Hanssen, A.; Krane, B.; Pécseli, H.L.; Trulsen, J. Time-Resolved Statistical Analysis of Nonlinear Electrostatic Fluctuations in the Ionospheric E Region. J. Geophys. Res. Space Phys. 2002, 107. [Google Scholar] [CrossRef] [Green Version]
- Gelman, L.; Soliński, K.; Ball, A. Novel Higher-Order Spectral Cross-Correlation Technologies for Vibration Sensor-Based Diagnosis of Gearboxes. Sensors 2020, 20, 5131. [Google Scholar] [CrossRef] [PubMed]
- Huang, Y.; Liu, C.; Zha, X.F.; Li, Y. A Lean Model for Performance Assessment of Machinery Using Second Generation Wavelet Packet Transform and Fisher Criterion. Expert Syst. Appl. 2010, 37, 3815–3822. [Google Scholar] [CrossRef]
- Hu, Q.; Si, X.S.; Zhang, Q.H.; Qin, A.S. A Rotating Machinery Fault Diagnosis Method Based on Multi-Scale Dimensionless Indicators and Random Forests. Mech. Syst. Signal Process. 2020, 139, 106609. [Google Scholar] [CrossRef]
- Webb, A.R. Statistical Pattern Recognition, 2nd ed.; John Wiley & Sons, Ltd.: Hoboken, NJ, USA, 2002; ISBN 9780470845134. [Google Scholar]
Figure 1.
Gear test rig: an experimental setup.

Figure 2.
Results of stereo optical evaluation of gear tooth surfaces affected by a pitting (a); tooth surface conditions at the beginning (b) and at the end (c) of the experiment [59].
Figure 2.
Results of stereo optical evaluation of gear tooth surfaces affected by a pitting (a); tooth surface conditions at the beginning (b) and at the end (c) of the experiment [59].

Figure 3.
Marking of angular ranges in which pinion teeth are in contact with gear teeth [59].
Figure 3.
Marking of angular ranges in which pinion teeth are in contact with gear teeth [59].

Figure 4.
Gear TSA vibration signal (a), gear CRS vibration signal (b), the gear vibration meshing components (c), reprinted from ref. [59].
Figure 4.
Gear TSA vibration signal (a), gear CRS vibration signal (b), the gear vibration meshing components (c), reprinted from ref. [59].

Figure 5.
The wavelet scalograms of the vibration signal, originating from the faultless gearbox (a) and the faulty gearbox (b), obtained by the Morlet wavelet function, reprinted from ref. [59]. (c,d) are the scalograms of the same signals, originating from the faultless gearbox and the faulty gearbox, respectively, that are obtained by the Mexican hat wavelet function.

Figure 6.
The difference between the modulus of the wavelet transforms of the CRS vibration signals recorded for fault-free and faulty gear conditions.
Figure 6.
The difference between the modulus of the wavelet transforms of the CRS vibration signals recorded for fault-free and faulty gear conditions.

Figure 7.
The wavelet bicoherence integrated feature (IWB) of the vibration signals recorded at the beginning of the endurance test (a) and at the end of the endurance test (b).
Figure 7.
The wavelet bicoherence integrated feature (IWB) of the vibration signals recorded at the beginning of the endurance test (a) and at the end of the endurance test (b).

Figure 8.
The Fisher criterion for the IWB.

Publisher’s Note: MDPI stays neutral with regard to jurisdictional claims in published maps and institutional affiliations. |
© 2021 by the authors. Licensee MDPI, Basel, Switzerland. This article is an open access article distributed under the terms and conditions of the Creative Commons Attribution (CC BY) license (https://creativecommons.org/licenses/by/4.0/).
Share and Cite
MDPI and ACS Style
Gelman, L.; Soliński, K.; Ball, A. Novel Instantaneous Wavelet Bicoherence for Vibration Fault Detection in Gear Systems. Energies 2021, 14, 6811. https://0-doi-org.brum.beds.ac.uk/10.3390/en14206811
AMA Style
Gelman L, Soliński K, Ball A. Novel Instantaneous Wavelet Bicoherence for Vibration Fault Detection in Gear Systems. Energies. 2021; 14(20):6811. https://0-doi-org.brum.beds.ac.uk/10.3390/en14206811
Chicago/Turabian StyleGelman, Len, Krzysztof Soliński, and Andrew Ball. 2021. "Novel Instantaneous Wavelet Bicoherence for Vibration Fault Detection in Gear Systems" Energies 14, no. 20: 6811. https://0-doi-org.brum.beds.ac.uk/10.3390/en14206811
Note that from the first issue of 2016, this journal uses article numbers instead of page numbers. See further details here.