Article

Micro CT and Experimental Study of Carbonate Precipitation from CO2 and Produced Water Co-Injection into Sandstone

by
Julie K. Pearce
1,2,*,
Grant K. W. Dawson
2,
Silvano Sommacal
3 and
Suzanne D. Golding
2
1
Centre for Natural Gas, The University of Queensland, Brisbane, QLD 4072, Australia
2
School of Earth and Environmental Sciences, The University of Queensland, Brisbane, QLD 4072, Australia
3
Research School of Electrical Energy and Materials Engineering, the Australian National University, Canberra, ACT 2601, Australia
*
Author to whom correspondence should be addressed.
Submission received: 31 August 2021 / Revised: 19 October 2021 / Accepted: 19 October 2021 / Published: 26 October 2021
(This article belongs to the Special Issue CO2 Capture and Storage in Geological Media)

Abstract

:
Carbon dioxide geological storage involves injecting captured CO2 streams into a suitable reservoir. Subsequent mineral trapping of the CO2 as carbonate minerals is one of the most secure forms of trapping. Injection of CO2 dissolved in water or co-injection of CO2 with water may enhance trapping mechanisms. Produced waters are already re-injected into reservoirs worldwide, and their co-injection with CO2 could enhance mineral trapping in low reactivity rock by providing a source of cations. Sandstone drill core from a reservoir proposed for CO2 storage was experimentally reacted with supercritical CO2 and a synthetic produced water. Micro computed tomography (CT), QEMSCAN, and SEM were performed before and after the reaction. The sandstone sample was predominantly quartz with minor illite/muscovite and kaolinite. The sandstone sub-plug micro-CT porosity was 11.1% and 11.4% after the reaction. Dissolved Ca, Mg, and Sr decreased during the reaction. After the reaction with CO2 and synthetic produced water, precipitation of crystalline carbonate minerals calcite and dolomite was observed in the pore space and on the rock surface. In addition, the movement of pore filling and bridging clays, as well as grains was observed. Co-injection of CO2 with produced waters into suitable reservoirs has the potential to encourage CO2 mineral trapping.

1. Introduction

Carbon dioxide geological storage has been proposed as part of the transition to lower greenhouse gas emissions. CO2 storage traditionally involves injecting supercritical CO2 into suitable reservoir rock formations such as depleted oil and gas reservoirs, sandstones, carbonates or basalts [1]. CO2 may be structurally trapped under a suitable sealing cap-rock, where it subsequently dissolves into formation water resulting in dissolution or ionic trapping. Formation of carbonic acid lowers the pH conditions and results in mineral reactions that release cations to the solution [2,3,4,5]. Carbonate minerals in the reservoir tend to initially dissolve [6,7,8]. Reactions of non-carbonate minerals can result in mineral trapping of CO2 [9,10,11,12,13,14]. For example, in sandstones and shales, the dissolution of clays such as chlorite has been reported as a source of dissolved Mg or Fe, plagioclase feldspars can be sources of Ca, or Fe-oxides may provide Fe [12,15,16,17,18]. Basalt formations tend to contain a high reactive silicate mineral content including olivine, pyroxenes, and plagioclase that can provide dissolved cations [11,19]. The subsequent formation of carbonate minerals such as calcite, dolomite, siderite or ankerite from the dissolved cations and dissolved CO2 is known as mineral trapping. Mineral trapping of CO2 is thought to be the most secure form of storage [1,20]. The dissolution of supercritical CO2 into formation water during traditional injection, and also the subsequent dissolution of minerals to provide cations are two steps that can control the speed of mineral trapping. Injection of dissolved CO2 or injection of CO2 and water can overcome one of these obstacles. In the lower reactivity rock, such as quartz rich sandstone, co-injected brine or produced water may be able to act as a source of cations such as Ca, Mg or Fe for the reaction with injected dissolved CO2 to form carbonate minerals in mineral trapping. Since the reaction of plagioclase or silicate minerals, for example, to provide the cations for mineral trapping may be one of the rate limiting steps, this may also accelerate the process in some cases.
Produced waters (also known as production waters or brines) are associated with oil or gas production worldwide, for example, from the dewatering of coal seams [21,22,23]. These waters can have various compositions depending on the source. In the USA and Canada, large volumes of produced waters are re-injected into saline aquifers or depleted oil and gas fields [24,25,26,27]. In Alberta, produced water from coal bed natural gas extraction has been reported with total dissolved solids (TDS) of up to 74,440 mg/L, and from conventional oil and gas a TDS up to 328,536 mg/L was reported [28]. In some cases, such as in Queensland, Australia, large volumes of produced waters (from coal seam gas) are stored in ponds or purified for managed aquifer recharge (MAR) [22,29,30,31]. An average of 12–25 mL of purified water per day has been injected into the Precipice Sandstone in Queensland since 2015 via MAR.
Enhanced recovery of oil or gas may involve water alternating gas (WAG) injection. While this is not specifically the focus of this study, experimental studies for enhanced oil recovery (EOR) have been performed often by injecting CO2 and brine or produced water into reservoir cores, especially in the case of carbonate reservoirs. Carbonate cemented sandstones, for example, were experimentally reacted with formation water and CO2 [32]. Permeability increased in calcite cemented sandstone, and calcite dissolution disconnected framework grains mechanically weakening the core. Dissolution of disseminated ankerite and siderite in a second core, however, did not strongly impact permeability or strength, showing the influence of different mineral content on CO2 storage impacts. In a study on tight rock enhanced recovery with CO2 storage, WAG was found to result in improved recovery and CO2 storage compared to continuous gas injection [33]. Cyclic gas injection which included “soaking periods” to allow CO2 to dissolve resulted in even more improved CO2 storage and oil recovery. Longer time scale predictions for CO2 injection at the Weyburn oil field predict that mineral trapping of CO2, in that case as dawsonite, will dominate after 5000 years [34].
Studies on mineral trapping with CO2 dissolved in or co-injected with produced water or wastewater for field scale storage are less common than supercritical CO2 injection [35]. One operating demonstration site in Greenland has co-injected CO2 and wastewater from a geothermal power plant into reactive basalt formations and successfully observed accelerated mineral trapping of CO2 as calcite [11,36]. The CO2 stream was dissolved in the wastewater during the injection process. However, basalts contain relatively reactive minerals (compared to the other formations such as sandstones) that can act as cation donors for mineral trapping. Surface dissolution of CO2 into water in a mixing tank for subsequent injection into an underground reservoir has also been recently proposed [26]. In CO2 storage reservoirs where there are low amounts of reactive minerals that are potential sources of cations for mineral trapping, such as clean quartz sandstones, the co-injection of produced waters that naturally contain cations (Ca, Mg, Fe) may enhance mineral trapping of injected CO2. The cations in the brine may combine with dissolved CO2 to form carbonate minerals, without the initial mineral dissolution step (for example, dissolution of silicates) to provide the cations.
This study employs several characterization techniques. Scanning electron microscopy with energy dispersive spectroscopy (SEM-EDS) is a commonly used imaging technique for characterizing, for example, rock surfaces and obtaining elemental compositions of points or regions. QEMSCAN is an automated quantitative mineralogy technique based on SEM-EDS where a region is scanned. The elemental compositions are compared with a database of minerals to provide images and quantified mineral compositions. X-ray micro computed tomography (µCT or micro-CT) is increasingly being used to non-destructively characterize rock properties, such as resolvable porosity, and to visualize pore space and heavy mineral distribution amongst the other properties.
This study aims to test if the experimental reaction of CO2 at storage conditions with sandstone reservoir rock and a synthetic produced water can result in precipitation of carbonate minerals. A quartz rich sandstone was tested with a water containing cations that could combine with CO2 and form carbonate minerals. The Precipice Sandstone is currently a target for a deep supercritical CO2 injection demonstration trial. Note that the co-injection with produced water described here is entirely a conceptual and experimental study to show its potential, where CO2 co-injection with produced water is not planned in the low salinity Precipice Sandstone. Micro-CT, QEMSCAN, and SEM-EDS are used to characterize the reservoir sandstone before and after the reaction to observe changes in porosity, mineral content, and movement of grains. Moreover, water was sampled from the reactor to measure the pH and dissolved concentrations of ions during the reaction.

2. Materials and Methods

A drill core sample from the Jurassic Precipice Sandstone reservoir was taken at 1211.65 m core depth. The core sample was from the West Wandoan 1 well drilled in the Surat Basin, Australia, for a CO2 storage feasibility study. The core consisted of moderately sorted medium to coarse-grained quartzose sandstone with abundant open pore space, pore filling and bridging clay, as well as scattered heavy minerals (Supplementary Material).
Prior to the CO2-brine-rock reaction, the core sample offcut was characterized in 3D by X-ray µCT and the 3D µCT images were registered into a perfect geometric alignment with higher-resolution 2D scanning electron microscope images and automated, quantified scanning electron microscope energy dispersive spectra QEMSCAN® mineral maps of the same sample.
A FEI HeliScan micro-CT, 2D FEI Quanta FEG 650F SEM imaging and FEI QEMSCAN® instruments at ANU, Canberra, were used [37,38]. The QEMSCAN® instrument comprises a SEM with four light-elements, EDS. Automatic data acquisition was accomplished with iMeasure. After the CO2-brine-rock reaction, the sub-plug was characterized in 3D by micro-CT and 3D:3D registered into perfect geometrical alignment to the “pre reaction” tomogram. The sub-plug was cut horizontally at the end where the polished section was created from the before-reaction image, thus the images (SEM and QEMSCAN®) would as closely as possible represent a mirror-image of the plane pre-reaction. The polished thin-sections were imaged in SEM to investigate texture and secondary porosity below the resolution of the CT images, and analyzed via QEMSCAN® for quantified in situ mineral content.
The high resolution 2D SEM images were registered into the 3D before- and after-reaction tomograms to determine the perfectly matching region, the mineral maps were registered to the corresponding SEM images and subsequently into the 3D tomograms. Details of the procedure are given in the supplementary material and are similar to those published in more detail previously [2,39,40,41]. Table 1 gives the basic sample and CT information.
Separate SEM-EDS of an unpolished 15 mm rock cube sample surface was performed at UQ before and after the reaction on a JEOL JSM-6460LA environmental SEM with a Minicup EDS. The same core sample surface areas were investigated pre- and post-reaction [4].
The cube and sub-plug were suspended in a PEEK basket reacted in an unstirred lined Parr reactor that has been described in detail previously and is shown in the Appendix A [6,42]. The cube and sub-plug were immersed in 165 mL of deoxygenated synthetic produced water, also referred to here as “brine” (Supplementary Material) and heated to 50 °C. CO2 was added with an injection pump and pressurized to 10 MPa. The brine was sampled before CO2 injection and during the reaction, and also after depressurization and reactor cooling. The pH was measured immediately with a TPS WP81 meter and probe, and aliquots of the water sample were filtered and acidified with HNO3 for analysis by inductively coupled plasma optical emission spectroscopy (ICP-OES) with a Perkin Elmer Optima 3300DV (error less than 5%).

3. Results

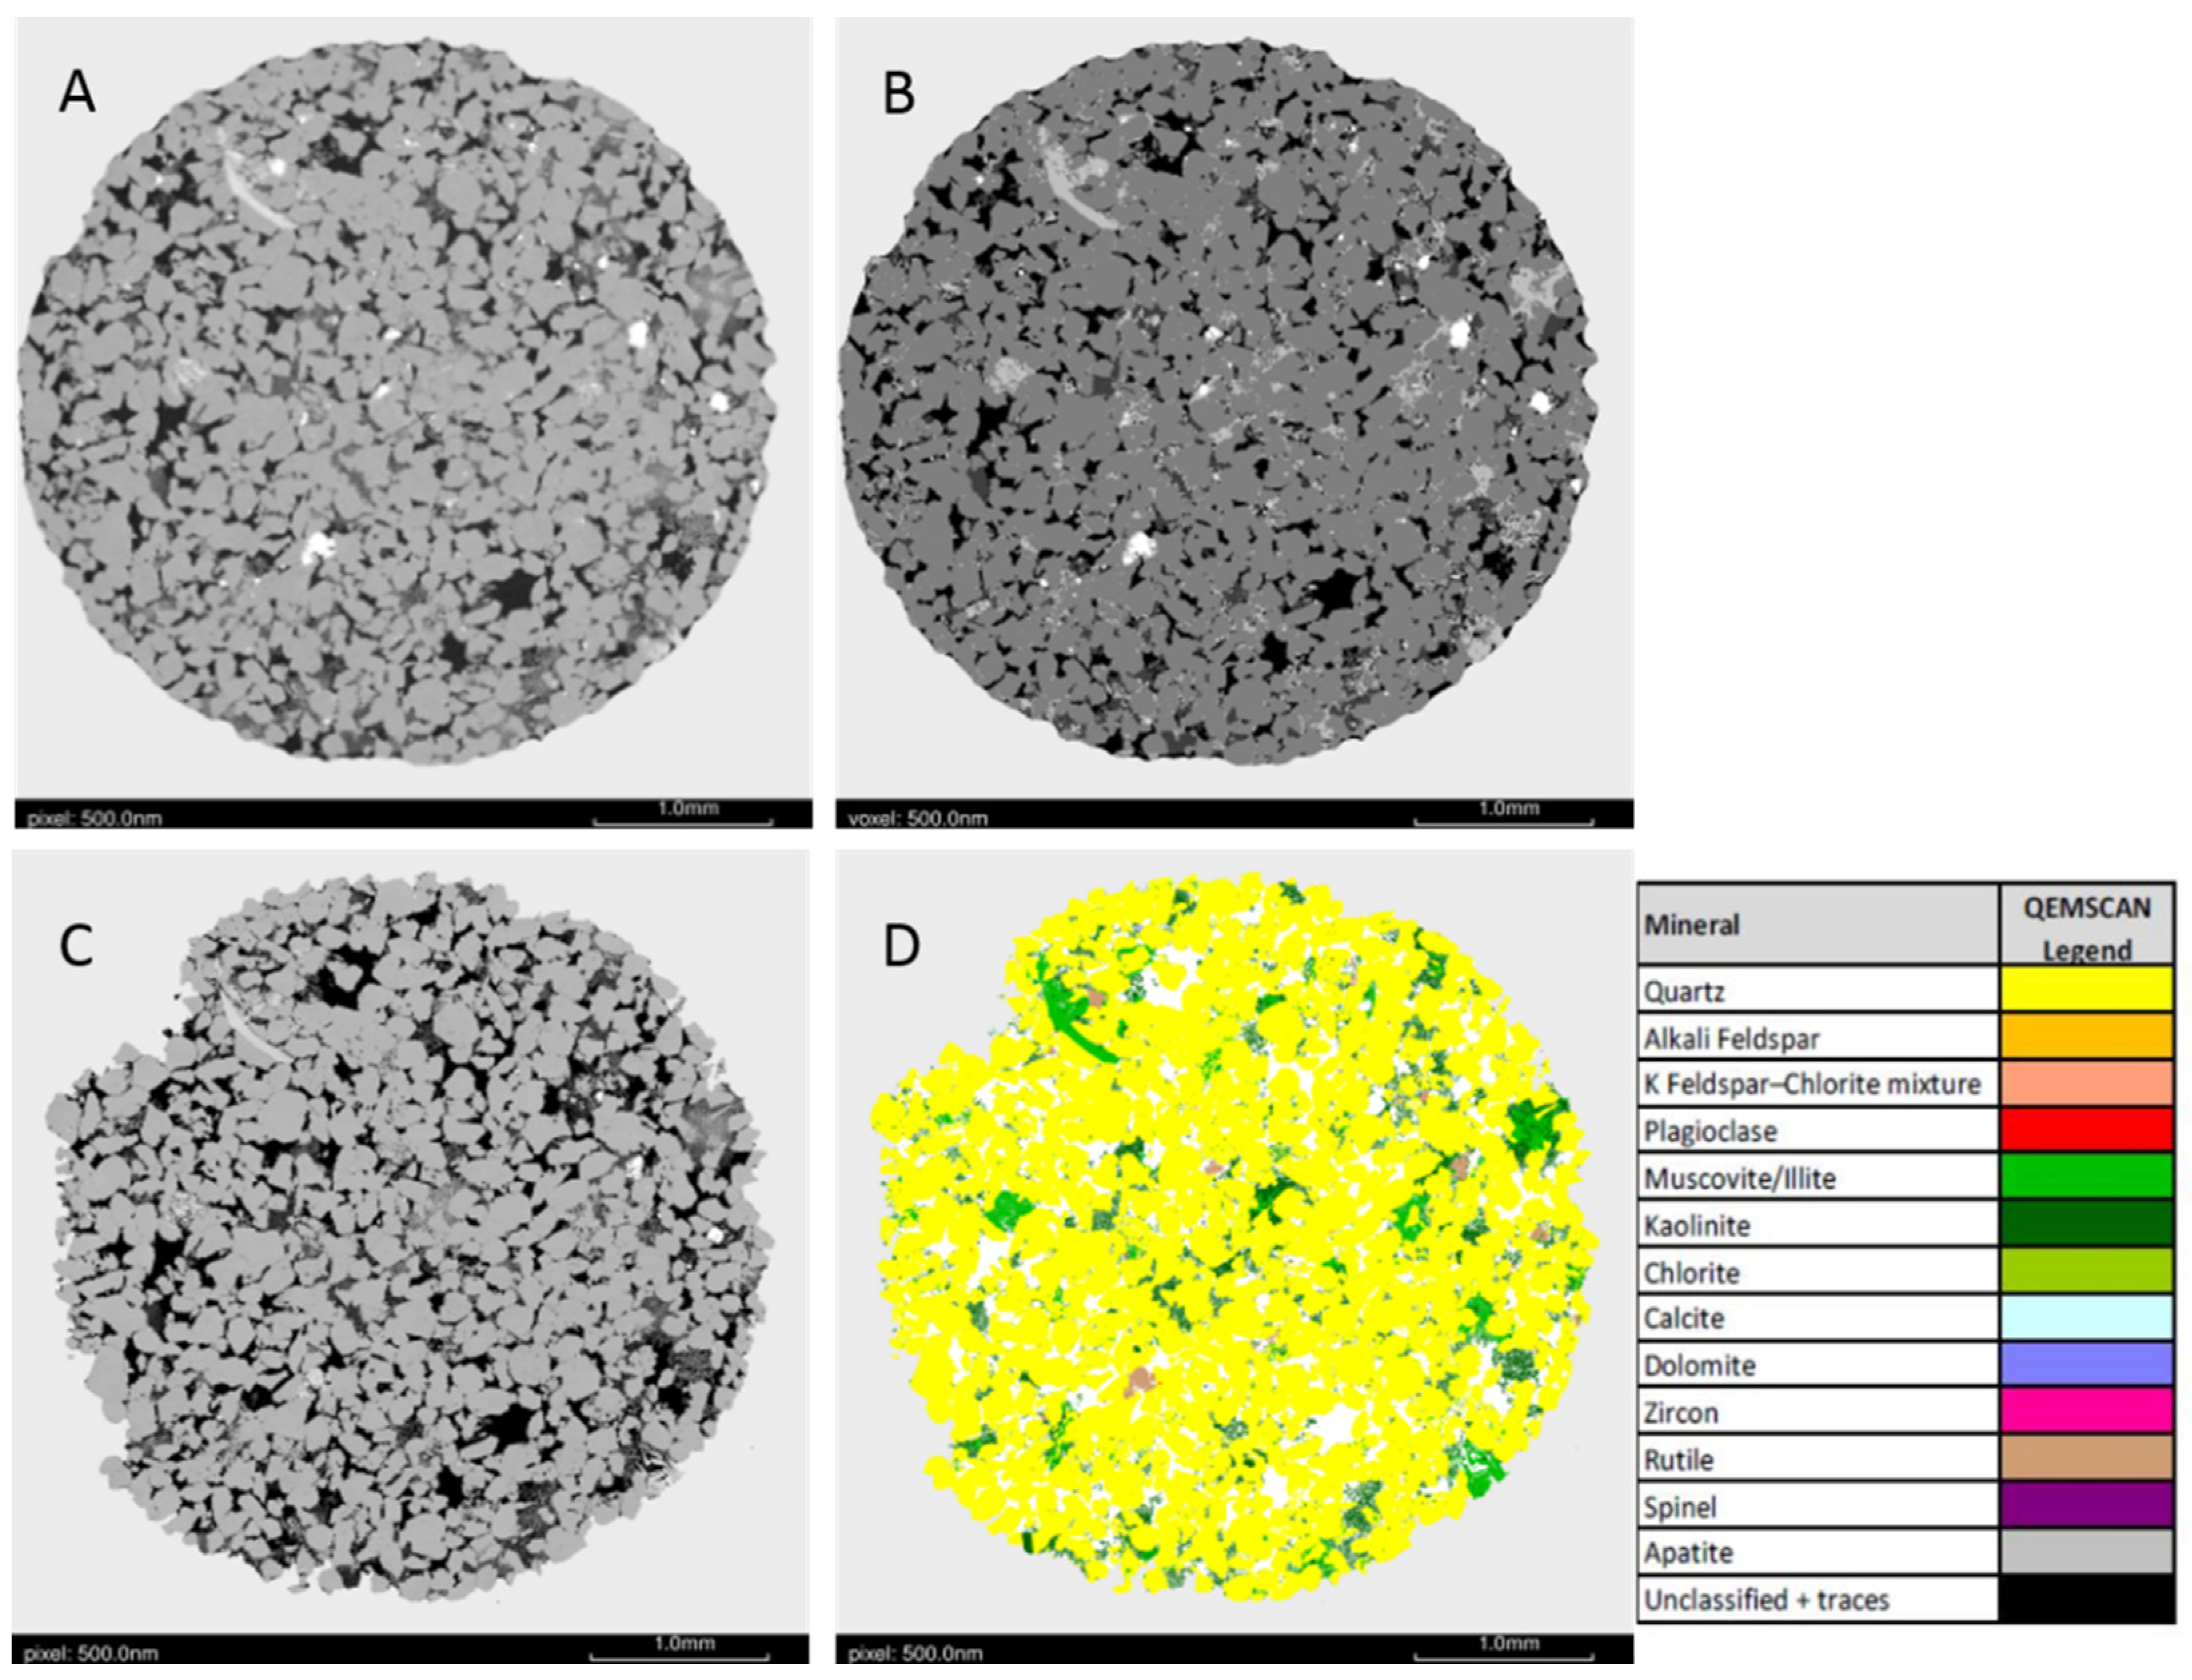
3.1. Pre-Reaction Characterization

Tomogram images of the core offcut scoping scan and sub-plug are shown in supplementary material. Tomogram, segmentation, SEM, and QEMSCAN images of the horizontal plane polished sub-plug slice are shown in Figure 1. Both intergranular open pores and pores filled with kaolinite and illite/muscovite are present, with traces of rutile. Volume percentages of components in the sub-plug are shown in Table 2, and modal mineralogies of the sub-plug slice from QEMSCAN in Table 3. The sub-plug is quartz rich and its resolvable micro-CT porosity was calculated as 11.1%. Adjacent core samples of the Precipice Sandstone core at 1211.65 m have a higher reported mercury injection (MICP) porosity of 20.3%, and He density of 2.69 g/cm3 [43]. This indicates that some sub micro-CT resolution porosity with pores below 3 µm is also present, likely associated with the clays and mica. There may also be differences from the two methods owing to rock heterogeneity. Figure 2 and Figure 3 show the SEM images of the sub-plug slice and selected magnified regions. Kaolinite occurs as pore filling, pore rimming, and pore bridging with both fine and course booklets (Figure 3A–E, and Supplementary Material). In addition, kaolinite fills occasional quartz grain fractures (Figure 3B). Muscovite occurs as booklets in intergranular pores (Figure 3A) and has also been weathered to a muscovite/illite mixture (Figure 3C). Furthermore, SEM images of the pre-reaction unpolished rock cube surface show abundant open intergranular porosity (Figure 4A), altered muscovite/illite (Figure 4B), rutile, and muscovite booklets (Figure 4C,D).

3.2. Post-Reaction Characterization

The post-reaction sub-plug X-ray components, and modal minerals of the sub-plug slice are given in Table 2 and Table 3, respectively. The post-reaction sub-plug slice SEM and QEMSCAN images are shown in Supplementary Material. The micro CT resolvable porosity of the sub-plug increased very slightly from 11.1% to 11.4% (Table 2), with a possible minor loss of quantified clays from the loss of fines. A comparison of before and after tomograms shows changes in pore filling and bridging clays consistent with clay movement, and some loss of fine grains from pores (Figure 5, Figure 6 and Figure 7 and Supplementary Material). Calcite and dolomite were precipitated in the pore space of the sub-plug QEMSCAN polished slice (Table 3, Figure 8). Furthermore, SEM-EDS of the unpolished rock cube surface showed small crystaline precipitates (Figure 9), with Ca signatures in EDS also likely to calcite.
Figure 10 shows dissolved concentrations from the brine-rock soak at time 0 h, and after injection of CO2 during the CO2-brine-rock reaction. The last time point of 1537 h in Figure 10 is after experiment depressurization and cooling. The pH decreased from the initial brine pH of 8.30 to 7.20 during the rock-brine soak, to 7.12 at 1440 h and 7.10 at 1536 h during the reaction. Dissolved Ca, Mg, and Sr decreased during the reaction (Figure 10A,B,D and Appendix A), indicating their incorporation into precipitated minerals, calcite and dolomite. The concentration of K and Al increased slightly, likely from the slight dissolution of muscovite and kaolinite at the beginning of the reaction, then stabilized (Figure 10C). Dissolved Fe increased after CO2 injection and subsequently decreased slightly (Figure 10D). This may have been from the slight dissolution of muscovite/illite, and subsequent precipitation as Fe substitutes into carbonates (or as Fe-oxide coatings). Dissolved Ca concentration dropped below detection (<0.01 mg/L) after depressurization (Figure 10A), with Mg and Sr also decreasing suggesting that some additional carbonate precipitation may have occurred at this stage. Dissolved Si and Mn remained below detection during the reaction. Dissolved Ni increased during the reaction (Appendix A) and again may have been sourced from muscovite/illite or other trace minerals.

4. Discussion

The dissolution of CO2 (Equation (1)) and subsequent reaction with Ca or Mg can form calcite (Equation (2)) and dolomite (Equation (3)) or Mg substituted calcite. Moreover, other cations such as Sr and Fe can substitute into the carbonate minerals.
CO2 + H2O = HCO3 + H+ = CO32− + 2H+
Ca2+ + CO32− = CaCO3 (calcite)
Ca2+ + Mg2+ + 2CO32− = CaMg(CO3)2 (dolomite)
Reactions of the Precipice Sandstone at similar conditions with CO2 and water or a low salinity formation water have shown low reactivity with no mineral precipitation reported and no change in porosity [2,5]. Experimental reactions of CO2 with other quartz rich sandstones such as the Berea Sandstone; Jurassic Sandstones from Poland; and Triassic Sandstones from Germany indicated slight corrosion of feldspars and mica, with no precipitation or only halite precipitation from brine and minor kaolinite precipitation [4,44,45]. The current study used a brine containing cations including Ca, Mg, and Fe. The co-injection of produced waters containing cations such as Ca, Mg, and Fe may induce mineral trapping of CO2 in quartz rich low reactivity reservoirs that lack high proportions of reactive mineral sources of cations such as plagioclase, chlorite or Fe-oxides. The pH during the experiment in the current study remained relatively high compared to other sandstone reactions, likely owing to the buffering capacity of the brine, that would also enhance mineral precipitation. In the current study, the sandstone porosity as measured by micro-CT did not change significantly after the reaction, which is favorable to avoid plugging of the reservoir in the short-term. However, the movement of kaolinite and fines was observed in the current study. Furthermore, this has been observed in previous sandstone reactions with CO2 in low salinity water or brine. In some cases, a decreased permeability has been attributed to this [2,46]. While permeability was not measured in the current study, further work is suggested to investigate permeability changes in near and far wellbore conditions from mineral precipitation or fines migration over longer time scales. Decreases in porosity and permeability may have negative effects in the field if they occur near the wellbore and reduce injectivity [47]. However, decreased porosity and permeability may be favorable if they occur further from the well bore or at the caprock interface, as a lowered permeability can also reduce CO2 migration and increase storage security. This study focused on a quartz rich low reactivity sandstone. However, other rock types such as carbonates may show different effects. A recent micro-CT study of the flow through reaction of carbonate cores with CO2 saturated brine, for example, showed the dissolution of calcite and increased permeability and porosity near the fluid inlet with wormhole formation [48]. Although that study also reported precipitation of calcite further away from the inlet, the sub-micro size precipitated crystals did not block the large pore throats of the carbonate core and did not decrease permeability in that region. In a different study, calcite dissolution was reported to increase porosity and permeability after the reaction of Jurassic calcite cemented sandstones [49]. Separately, calcite dissolution and rock compaction were reported in CO2 saturated brine reactions to increase porosity and permeability and alter elastic rock properties, though the magnitude of changes depended on the rock type [50].
Further work should investigate mineral trapping in a range of reservoir and cap-rock types, produced water compositions, and storage temperature and pressure conditions in both experimental and modelling or field demonstration studies. Moreover, changes in porosity, permeability, and geomechanical properties of the rocks with mineral trapping precipitation should be investigated. CO2 streams from sources such as coal combustion, natural gas processing, cement or steel production may contain ancillary gases that have a higher reactivity to rock or result in precipitation of scaling minerals [51]. Furthermore, the influence of storing an impure CO2 stream containing SOx, NOx, O2 or H2S from industrial sources in produced water co-injection scenarios with sandstones or depleted oil or gas reservoir rocks should be studied.

5. Conclusions

  • A quartz rich sandstone was reacted at carbon storage conditions with supercritical CO2 and a synthetic produced water.
  • Calcite and dolomite carbonate mineral precipitation was observed with QEMSCAN and SEM-EDS imaging.
  • Micro CT image registration before and after the reaction showed no significant change in porosity. However, kaolinite and fine grain movement occurred in the pores. No significant change in porosity is favorable to avoid plugging or injectivity loss near the wellbore. However, clay and fines movement have the potential to alter permeability. Additionally, other rock types may show different responses in porosity, permeability, and mechanical properties and should be further studied.
  • Mineral trapping of CO2 as precipitated carbonate minerals was observed.
  • Injection of CO2 dissolved in produced water or other co-injection schemes may be favorable for inducing or accelerating mineral trapping in low reactivity sandstone, where the water can provide cations such as Ca, Mg or Fe.

Supplementary Materials

The following are available online at https://0-www-mdpi-com.brum.beds.ac.uk/article/10.3390/en14216998/s1. Figure S1: Scoping scan tomograms; Figure S2: Pre-reaction tomograms; Figure S3: Pre-reaction SEM and QEMSCAN; Figure S4: Post-reaction SEM and QEMSCAN; Figure S5: Post-reaction SEM and QEMSCAN regions; Figure S6: Pre- and post-reaction tomograms; Figure S7: Pre- and post-reaction tomograms; Table S1: Synthetic produced water.

Author Contributions

Conceptualization, S.D.G., J.K.P. and G.K.W.D.; methodology, J.K.P. and G.K.W.D.; formal analysis, S.S., G.K.W.D. and J.K.P.; investigation, G.K.W.D. and J.K.P.; writing—original draft preparation, J.K.P.; writing—review and editing, all; visualization, S.S., G.K.W.D. and J.K.P.; supervision, S.D.G.; project administration, S.D.G.; funding acquisition, S.D.G. All authors have read and agreed to the published version of the manuscript.

Funding

This research was funded by the Australian National Low Emissions Coal Research and Development, grant number 7-1011-0189. The authors wish to acknowledge the financial assistance provided through Australian National Low Emissions Coal Research and Development. ANLEC R&D is supported by Low Emission Technology Australia (LETA) and the Australian Government through the Department of Industry, Science, Energy, and Resources.

Institutional Review Board Statement

Not Applicable.

Informed Consent Statement

Not Applicable.

Data Availability Statement

Data are available in Supplementary Material or on request from the authors.

Acknowledgments

Dean Biddle, the UQ Environmental Geochemistry laboratory, and FEI Australia Pty Ltd. are thanked for their technical assistance. The authors acknowledge the SEM facilities and scientific and technical assistance of the Australian Microscopy and Microanalysis Research Facility at the Centre for Microscopy and Microanalysis, University of Queensland. V. Rudolph is thanked for laboratory access, and J. Underschultz for information on potential brine compositions. We acknowledge the grant management assistance by the CO2CRC Pty Ltd. The authors wish to acknowledge the financial assistance provided through Australian National Low Emissions Coal Research and Development. ANLEC R&D is supported by Low Emission Technology Australia (LETA) and the Australian Government through the Department of Industry, Science, Energy, and Resources. We are thankful to three anonymous reviewers for their comments that improved this manuscript.

Conflicts of Interest

The authors declare no conflict of interest. The funders had no role in the design of the study; in the collection, analyses, or interpretation of data; in the writing of the manuscript, or in the decision to publish the results.

Appendix A

Figure A1. Schematic of the reaction rig and a cross section inside a lined Parr reactor vessel. ISCO is the injection pump, V1 is a Parr reactor vessel, DA is the data acquisition and control.
Energies 14 06998 g0a1
Table A1. Dissolved concentrations (mg/kg) during the reaction, time 0 is before CO2 injection, 1537 h is after depressurization. The solution pH is also given.
Time (h)0144015361537
pH7.27.127.10
Ca7797.52903.41176.3<0.01
Mg480.0221.8124.361.7
Al30.930.028.128.0
K152.8210.2212.3210.4
Sr5.32.31.70.3
Fe1.93.82.31.5
Si<0.1<0.1<0.1<0.1
Cr0.60.70.40.2
Cu1.82.21.31.5
Ni3.34.24.16.8
Ti0.2<0.001<0.001<0.001

References

  1. Bachu, S.; Gunter, W.; Perkins, E. Aquifer disposal of CO2: Hydrodynamic and mineral trapping. Energy Convers. Manag. 1994, 35, 269–279. [Google Scholar] [CrossRef]
  2. Pearce, J.K.; Dawson, G.K.W.; Golab, A.; Knuefing, L.; Sommacal, S.; Rudolph, V.; Golding, S.D. A combined geochemical and μCT study on the CO2 reactivity of Surat Basin reservoir and cap-rock cores: Porosity changes, mineral dissolution and fines migration. Int. J. Greenh. Gas Control 2019, 80, 10–24. [Google Scholar] [CrossRef] [Green Version]
  3. Wilke, F.D.; Vásquez, M.; Wiersberg, T.; Naumann, R.; Erzinger, J. On the interaction of pure and impure supercritical CO2 with rock forming minerals in saline aquifers: An experimental geochemical approach. Appl. Geochem. 2012, 27, 1615–1622. [Google Scholar] [CrossRef]
  4. Dawson, G.; Pearce, J.; Biddle, D.; Golding, S.D. Experimental mineral dissolution in Berea Sandstone reacted with CO2 or SO2–CO2 in NaCl brine under CO2 sequestration conditions. Chem. Geol. 2015, 399, 87–97. [Google Scholar] [CrossRef] [Green Version]
  5. Farquhar, S.M.; Pearce, J.K.; Dawson, G.K.W.; Golab, A.; Kirste, D.; Biddle, D.; Golding, S.D. A fresh approach to investigating CO2 storage: Experimental CO2-water-rock interactions in a freshwater reservoir system. Chem. Geol. 2015, 399, 98–122. [Google Scholar] [CrossRef]
  6. Pearce, J.K.; Law, A.C.; Dawson, G.K.; Golding, S.D. SO2–CO2 and pure CO2 reactivity of ferroan carbonates at carbon storage conditions. Chem. Geol. 2015, 411, 112–124. [Google Scholar] [CrossRef]
  7. Smith, M.M.; Sholokhova, Y.; Hao, Y.; Carroll, S.A. CO2-induced dissolution of low permeability carbonates. Part I: Characterization and experiments. Adv. Water Resour. 2013, 62, 370–387. [Google Scholar] [CrossRef]
  8. Wunsch, A.; Navarre-Sitchler, A.K.; Moore, J.; McCray, J. Metal release from limestones at high partial-pressures of CO2. Chem. Geol. 2014, 363, 40–55. [Google Scholar] [CrossRef]
  9. Pearce, J.; La Croix, A.; Underschultz, J.; Golding, S. Long term reactivity of CO2 in a low salinity reservoir-seal complex. Appl. Geochem. 2020, 114, 104529. [Google Scholar] [CrossRef]
  10. Pearce, J.K.; La Croix, A.D.; Brink, F.J.; Hayes, P.J.; Underschultz, J.R. CO2 mineral trapping comparison in different regions: Predicted geochemical reactivity of the Precipice Sandstone reservoir and overlying Evergreen Formation. Pet. Geosci. 2021, 27. [Google Scholar] [CrossRef]
  11. Snæbjörnsdóttir, S.; Gislason, S.R.; Galeczka, I.M.; Oelkers, E.H. Reaction path modelling of in-situ mineralisation of CO2 at the CarbFix site at Hellisheidi, SW-Iceland. Geochim. Cosmochim. Acta 2018, 220, 348–366. [Google Scholar] [CrossRef] [Green Version]
  12. Watson, M.; Zwingmann, N.; Lemon, N. The Ladbroke Grove–Katnook carbon dioxide natural laboratory: A recent CO2 accumulation in a lithic sandstone reservoir. Energy 2004, 29, 1457–1466. [Google Scholar] [CrossRef]
  13. Higgs, K.E.; Funnell, R.H.; Reyes, A.G. Changes in reservoir heterogeneity and quality as a response to high partial pressures of CO2 in a gas reservoir, New Zealand. Mar. Pet. Geol. 2013, 48, 293–322. [Google Scholar] [CrossRef]
  14. Uysal, I.T.; Golding, S.D.; Bolhar, R.; Zhao, J.-X.; Feng, Y.-X.; Baublys, K.A.; Greig, A. CO2 degassing and trapping during hydrothermal cycles related to Gondwana rifting in eastern Australia. Geochim. Cosmochim. Acta 2011, 75, 5444–5466. [Google Scholar] [CrossRef]
  15. Black, J.R.; Haese, R.R. Chlorite dissolution rates under CO2 saturated conditions from 50 to 120 °C and 120 to 200 bar CO2. Geochim. Cosmochim. Acta 2014, 125, 225–240. [Google Scholar] [CrossRef]
  16. Higgs, K.E.; Haese, R.R.; Golding, S.D.; Schacht, U.; Watson, M. The Pretty Hill Formation as a natural analogue for CO2 storage; an investigation of mineralogical and isotopic changes associated with sandstones exposed to low, intermediate and high CO2 concentrations over geological time. Chem. Geol. 2015, 399, 36–64. [Google Scholar] [CrossRef] [Green Version]
  17. Smith, M.M.; Wolery, T.J.; Carroll, S.A. Kinetics of chlorite dissolution at elevated temperatures and CO2 conditions. Chem. Geol. 2013, 347, 1–8. [Google Scholar] [CrossRef]
  18. Palandri, J.L.; Rosenbauer, R.J.; Kharaka, Y.K. Ferric iron in sediments as a novel CO2 mineral trap: CO2–SO2 reaction with hematite. Appl. Geochem. 2005, 20, 2038–2048. [Google Scholar] [CrossRef]
  19. Matter, J.M.; Kelemen, P. Permanent storage of carbon dioxide in geological reservoirs by mineral carbonation. Nat. Geosci. 2009, 2, 837–841. [Google Scholar] [CrossRef]
  20. Xu, T.; Apps, J.A.; Pruess, K. Mineral sequestration of carbon dioxide in a sandstone–shale system. Chem. Geol. 2005, 217, 295–318. [Google Scholar] [CrossRef]
  21. Baublys, K.; Hamilton, S.; Golding, S.; Vink, S.; Esterle, J. Microbial controls on the origin and evolution of coal seam gases and production waters of the Walloon Subgroup; Surat Basin, Australia. Int. J. Coal Geol. 2015, 147, 85–104. [Google Scholar] [CrossRef]
  22. Underschultz, J.; Vink, S.; Garnett, A. Coal seam gas associated water production in Queensland: Actual vs predicted. J. Nat. Gas Sci. Eng. 2018, 52, 410–422. [Google Scholar] [CrossRef] [Green Version]
  23. Gregory, K.B.; Vidic, R.D.; Dzombak, D.A. Water Management Challenges Associated with the Production of Shale Gas by Hydraulic Fracturing. Elements 2011, 7, 181–186. [Google Scholar] [CrossRef]
  24. Hornbach, M.J.; Jones, M.; Scales, M.; DeShon, H.R.; Magnani, M.B.; Frohlich, C.; Stump, B.; Hayward, C.; Layton, M. Ellenburger wastewater injection and seismicity in North Texas. Phys. Earth Planet. Inter. 2016, 261, 54–68. [Google Scholar] [CrossRef] [Green Version]
  25. Akob, D.M.; Mumford, A.C.; Orem, W.H.; Engle, M.A.; Klinges, J.G.; Kent, D.B.; Cozzarelli, I.M. Wastewater Disposal from Unconventional Oil and Gas Development Degrades Stream Quality at a West Virginia Injection Facility. Environ. Sci. Technol. 2016, 50, 5517–5525. [Google Scholar] [CrossRef]
  26. Khan, C.; Pearce, J.; Golding, S.; Rudolph, V.; Underschultz, J. Carbon Storage Potential of North American Oil & Gas Produced Water Injection with Surface Dissolution. Geosciences 2021, 11, 123. [Google Scholar] [CrossRef]
  27. Clark, C.E.; Veil, J.A. Produced Water Volumes and Managment Practices in the United States; ANL/EVS/R-09/1; Argonne National Laboratoy: Lemont, IL, USA, 2009. [Google Scholar]
  28. Fossil-Water Produced Water Beneficial Re-Us—High TDS Waters; Fossil Water: Calgary, AB, Canada, 2007.
  29. Prommer, H.; Rathi, B.; Donn, M.; Siade, A.; Wendling, L.; Martens, E.; Patterson, B. Geochemical Response to Reinjection: Final Report; CSIRO: Canberra, Australia, 2016. [Google Scholar]
  30. Hayes, P.; Nicol, C.; La Croix, A.; Pearce, J.; Gonzalez, S.; Wang, J.; Harfoush, A.; He, J.; Moser, A.; Helm, L.; et al. Enhancing geological and hydrogeological understanding of the Precipice Sandstone aquifer of the Surat Basin, Great Artesian Basin, Australia, through model inversion of managed aquifer recharge datasets. Hydrogeol. J. 2019, 28, 175–192. [Google Scholar] [CrossRef] [Green Version]
  31. APLNG Australia Pacific LNG Upstream Phase 1. Reedy Creek Aquifer Injection Management Plan—Precipice Sandstone; Report Q-4255-95-MP-004; APLNG: Brisbane, Australia, 2013. [Google Scholar]
  32. Wu, Z.; Luhmann, A.J.; Rinehart, A.J.; Mozley, P.S.; Dewers, T.A.; Heath, J.E.; Majumdar, B.S. Chemo-mechanical Alterations Induced from CO2 Injection in Carbonate-Cemented Sandstone: An Experimental Study at 71 °C and 29 MPa. J. Geophys. Res. Solid Earth 2020, 125, e2019JB019096. [Google Scholar] [CrossRef]
  33. Li, D.; Saraji, S.; Jiao, Z.; Zhang, Y. CO2 injection strategies for enhanced oil recovery and geological sequestration in a tight reservoir: An experimental study. Fuel 2020, 284, 119013. [Google Scholar] [CrossRef]
  34. Hutcheon, I.; Shevalier, M.; Durocher, K.; Bloch, J.; Johnson, G.; Nightingale, M.; Mayer, B. Interactions of CO2 with formation waters, oil and minerals and CO2 storage at the Weyburn IEA EOR site, Saskatchewan, Canada. Int. J. Greenh. Gas Control. 2016, 53, 354–370. [Google Scholar] [CrossRef] [Green Version]
  35. Sohrabi, M.; Kechut, N.I.; Riazi, M.; Jamiolahmady, M.; Ireland, S.; Robertson, G. Safe storage of CO2 together with improved oil recovery by CO2-enriched water injection. Chem. Eng. Res. Des. 2011, 89, 1865–1872. [Google Scholar] [CrossRef]
  36. Matter, J.M.; Stute, M.; Snæbjörnsdottir, S.; Oelkers, E.H.; Gislason, S.R.; Aradottir, E.S.; Sigfusson, B.; Gunnarsson, I.; Sigurdardottir, H.; Gunnlaugsson, E.; et al. Rapid carbon mineralization for permanent disposal of anthropogenic carbon dioxide emissions. Science 2016, 352, 1312–1314. [Google Scholar] [CrossRef] [Green Version]
  37. Knackstedt, M.; Carnerup, A.; Golab, A.; Sok, R.; Young, B.; Riepe, L. Petrophysical Characterization of Unconventional Reservoir Core at Multiple Scales. Petrophysics 2013, 54, 216–223. [Google Scholar]
  38. Golab, A.; Knuefing, L.; Goodwin, C.; Sommacal, S.; Carnerup, A.; Dawson, G.; Pearce, J.K.; Golding, S.D. Milestone 5.7: Final Report on Geochemical Reactivity Studies of Core Material Using ScCO2; Report for ANLEC R&D; Lithicon FEI: Hillsboro, OR, USA, 2015. [Google Scholar]
  39. Pearce, J.; Golab, A.; Dawson, G.K.; Knuefing, L.; Goodwin, C.; Golding, S.D. Mineralogical controls on porosity and water chemistry during O2-SO2-CO2 reaction of CO2 storage reservoir and cap-rock core. Appl. Geochem. 2016, 75, 152–168. [Google Scholar] [CrossRef] [Green Version]
  40. Golab, A.; Arena, A.; Sommacal, S.; Goodwin, C.; Rajan, P.; Dodd, N.; Khor, J.; Deakin, L.; Zhang, J.; Young, B.; et al. Milestone 2.9: Final Report of Digital Core Analysis Results for Plug Samples from West Wandoan-1 Well; Report for ANLEC R&D; Lithicon FEI: Hillsboro, OR, USA, 2015. [Google Scholar]
  41. Golab, A.N.; Knackstedt, M.A.; Averdunk, H.; Senden, T.; Butcher, A.; Jaime, P. 3D porosity and mineralogy characterization in tight gas sandstones. Geophysics 2010, 29, 1476–1483. [Google Scholar] [CrossRef]
  42. Pearce, J.K.; Kirste, D.M.; Dawson, G.K.; Farquhar, S.M.; Biddle, D.; Golding, S.D.; Rudolph, V. SO2 impurity impacts on experimental and simulated CO2–water–reservoir rock reactions at carbon storage conditions. Chem. Geol. 2015, 399, 65–86. [Google Scholar] [CrossRef]
  43. Dawson, G.K.W.; Biddle, D.; Farquhar, S.M.; Gao, J.; Golding, S.D.; Jiang, X.; Keck, R.; Khan, C.; Law, A.C.K.; Li, Q.; et al. Achieving Risk and Cost Reductions in CO2 Geosequestration through 4D Characterisation of Host Formations; University of Queensland: St. Lucia, Australia, 2015. [Google Scholar]
  44. Wdowin, M.; Tarkowski, R.; Franus, W. Determination of changes in the reservoir and cap rocks of the Chabowo Anticline caused by CO2–brine–rock interactions. Int. J. Coal Geol. 2014, 130, 79–88. [Google Scholar] [CrossRef]
  45. Fischer, S.; The Ketzin Team; Liebscher, A.; De Lucia, M.; Hecht, L. Reactivity of sandstone and siltstone samples from the Ketzin pilot CO2 storage site-Laboratory experiments and reactive geochemical modeling. Environ. Earth Sci. 2013, 70, 3687–3708. [Google Scholar] [CrossRef]
  46. Saeedi, A.; Piane, C.D.; Esteban, L.; Stalker, L. Flood characteristic and fluid rock interactions of a supercritical CO2, brine, rock system: South West Hub, Western Australia. Int. J. Greenh. Gas Control. 2015, 54, 309–321. [Google Scholar] [CrossRef] [Green Version]
  47. Xu, T.; Apps, J.A.; Pruess, K.; Yamamoto, H. Numerical modeling of injection and mineral trapping of CO2 with H2S and SO2 in a sandstone formation. Chem. Geol. 2007, 242, 319–346. [Google Scholar] [CrossRef] [Green Version]
  48. Seyyedi, M.; Ben Mahmud, H.K.; Verrall, M.; Giwelli, A.; Esteban, L.; Ghasemiziarani, M.; Clennell, M. Pore Structure Changes Occur During CO2 Injection into Carbonate Reservoirs. Sci. Rep. 2020, 10, 3624. [Google Scholar] [CrossRef] [Green Version]
  49. Lamy-Chappuis, B.; Angus, D.; Fisher, Q.; Grattoni, C.; Yardley, B.W.D. Rapid porosity and permeability changes of calcareous sandstone due to CO2-enriched brine injection. Geophys. Res. Lett. 2013, 41, 399–406. [Google Scholar] [CrossRef] [Green Version]
  50. Vialle, S.; Vanorio, T. Laboratory measurements of elastic properties of carbonate rocks during injection of reactive CO2-saturated water. Geophys. Res. Lett. 2011, 38. [Google Scholar] [CrossRef]
  51. Porter, R.T.; Fairweather, M.; Pourkashanian, M.; Woolley, R.M. The range and level of impurities in CO2 streams from different carbon capture sources. Int. J. Greenh. Gas Control 2015, 36, 161–174. [Google Scholar] [CrossRef]
Figure 1. SEM-registered images of the sub-plug slice (A) tomogram, (B) mineral segmentation, (C) SEM, and (D) QEMSCAN and mineral legend.
Energies 14 06998 g001
Figure 2. SEM image of the polished sub-plug slice before the reaction. Squares indicate the locations of images in the next figure.
Energies 14 06998 g002
Figure 3. SEM images of the polished sub-plug slice regions before the reaction. (A) Muscovite and pore filling kaolinite. (B) Pore rimming and bridging kaolinite around quartz and rutile grains. Kaolinite also fills quartz grain fractures. (C) Dense pore filling muscovite/illite and kaolinite. (D) Blocky pore-filling kaolinite. (E) Fine grained kaolinite filling intergranular porosity. Qz: Quartz; Mu: Muscovite; Ka: Kaolinite; Ru: Rutile; Mu/Il: Muscovite/illite mixture or muscovite weathered to illite.
Energies 14 06998 g003
Figure 4. SEM images of the core block surface before the reaction. (A) Quartz frame-work grains with intergranular porosity. (B) Illite and muscovite partly altered to illite mixed with rutile. (C,D) Muscovite booklets. Il/Mu: Ilite and altered muscovite; Ru: Rutile; Mu: Muscovite booklets; Qz: Quartz.
Energies 14 06998 g004
Figure 5. Pre- and post-reaction tomogram horizontal (z) plane images with magnified regions showing changes. The location of the image plane in the sub-plug is also indicated.
Energies 14 06998 g005
Figure 6. Pre- and post-reaction tomogram horizontal (z) plane images in a lower region. Magnified regions show changes and movement of pore bridging clays. The location of the image plane in the sub-plug is also indicated.
Energies 14 06998 g006
Figure 7. Pre- and post-reaction tomogram horizontal (z) plane magnified regions showing changes and movement of pore filling and bridging clays and grains. Image widths are 1 mm (top), and 20 µm (bottom).
Energies 14 06998 g007
Figure 8. (A) Post-reaction SEM image of the polished sub-plug slice. Boxes indicate positions of magnified areas shown in the supplementary material. (B) SEM image from box 4 in (A), with calcite and dolomite filling an intergranular pore. (C) QEMSCAN image of the same area in (B) with the mineral legend. Ca: Calcite; Do: Dolomite; Qz: Quartz; Ka: Kaolinite.
Energies 14 06998 g008
Figure 9. SEM images and EDS of the core block surface after the reaction. (A,B) The same surface areas in Figure 4 with fine-grained crystalline precipitates circled. (C,D) EDS spectra of precipitates containing Ca. Mu: Muscovite booklets.
Energies 14 06998 g009
Figure 10. Dissolved concentrations during the CO2-brine-rock reaction, where time 0 is before CO2 injection, and 1537 h is after depressurization. (A) Dissolved concentration of Ca, note this decreased below detection at 1537 h. (B) Dissolved concentration of Mg. (C) Dissolved concentration of Al and K. (D) Dissolved concentration of Sr and Fe.
Energies 14 06998 g010
Table 1. Sample scoping scan and sub-plug image properties.
FormationPrecipice Sandstone
Depth (m)1211.65
Core offcut size (mm)18 × 12 × 12
Voxel size (scoping scan i (µm))15
Sub-plug size (mm)4 × 11
Voxel size (sub-plug) (µm)3
Table 2. Pre- and post-reaction volume% of X-ray distinct components from segmentation of the sub-plug. The main mineral corresponding to the grain type is also shown.
PropertyGrain TypeMain MineralPrePost
Resolved porosity 11.111.4
Framework-grainGrain-1quartz73.373.4
Framework-grainGrain-2 --
Lower density ClayGrain-1kaolinite87.7
Higher density ClayGrain-2illite/muscovite7.27.1
High densityGrain-1rutile0.450.45
High densityGrain-2zircon--
Table 3. Pre- and post-reaction modal mineralogies (area%) from QEMSCAN of the polished sub-plug slice.
MineralPrePost
Quartz89.289.9
Alkali Feldspar--
Plagioclase--
Muscovite/Illite3.52.2
Kaolinite6.56.8
Chlorite-<0.1
Calcite-0.3
Dolomite-0.1
Zircon-<0.1
Rutile0.70.5
Spinel--
Apatite--
Unclassified and traces0.10.2
Publisher’s Note: MDPI stays neutral with regard to jurisdictional claims in published maps and institutional affiliations.

