
District Heating as Demand Response Aggregator: Estimation of the Flexible Potential in the Italian Peninsula


Institute for Energy Engineering, Universitat Politècnica de València, Camino de Vera, S/n, 5E, F, 5, 46022 Valencia, Spain
*
Author to whom correspondence should be addressed.
Energies 2021, 14(21), 7052; https://0-doi-org.brum.beds.ac.uk/10.3390/en14217052
Submission received: 30 July 2021
/
Revised: 28 September 2021
/
Accepted: 21 October 2021
/
Published: 28 October 2021
(This article belongs to the Special Issue Distributed Energy Resources for the Development of the Energy Horizon 2050)
Abstract
:The liberalization of the gas market has deeply affected the structure of the gas system. The change from a vertically integrated utility structure to a liberalized architecture has resulted in a new network asset where aggregators could play a key role. To enable aggregators’ functionalities, the gas system has moved to a smart configuration. The development of this Advanced Metering Infrastructure (AMI) allowing a two-way communication between the utility and the consumers, together with demand response programs, prove to be an advantageous solution. Utilities are allowed to manage consumers’ gas load by asking them to reduce or shift their gas usage so that rebates or back payments could be available for consumers. In this framework, aimed at ensuring the feasibility of the gas system and promoting the aggregation of small gas loads, a new agent has been identified. In this research, the potential of district heating systems as gas market aggregators, together with a novel architecture for the gas network system has been identified. Furthermore, DR benefits in natural gas systems have been assessed with a focus on the Italian peninsula, where the authors have already carried out a previous analysis in this regard.
1. Introduction
The architecture of energy systems, especially for power and gas, has been strongly impacted by the liberalization process that has been produced worldwide from the end of the nineties [1]. Energy systems have moved from vertically integrated structures based on public utilities to liberalized systems where new agents, such as aggregators, have been called to play a starring role. In power systems, aggregators are entities able to coordinate a group of grid-connected units to fulfill a specific consumption pattern. Therefore, the aggregator is a market player by nature that may contribute to the optimization of the trading and balancing services in the electrical and gas markets [2]. In the new trends of configuration of energy systems based on the smart grid concept, aggregators could optimize the system control services and the load flow in the distribution network. Furthermore, they can operate as load coordinators, so that they may contribute to manage and overcome the existing network constraints. To enable aggregators’ functionalities, electrical and gas systems have to move completely to a smart configuration. This configuration includes the installation of an advanced metering infrastructure (AMI), which allows two-way communication among the different network agents (consumers, network operators, energy traders, etc.). Intelligent sensors and smart meters are nowadays able to control consumers’ consumptions and to quickly modify their electrical or gas demand [3,4].
In this research, the aggregator of demand response (DR) resources in the natural gas system is a novel approach. In this case, not only traditional aggregators but also district heating (DH) systems have to be taken into account, where end users are not final consumers of natural gas but consumers of hot water or steam. In this way, the manager of DH facilities may behave simultaneously as a thermal energy supplier and manager of demand response resources.
In Europe, smart meters in power systems are growing faster, moving from 4th to 5th generation technologies [5,6]. However, the conversion of natural gas networks to smart systems is slow if compared with the electrical system. In the gas system, the rollout started in Europe in 2012 and it is still ongoing [7,8].
The implementation of smart grid systems is fundamental for the diffusion of DR programs. Worldwide, the energy demand is growing, and the combination of smart grids together with DR has proven to be a good solution for the proper operation of such energy systems. DR is an advantageous solution for consumers and utilities. Utilities manage their electrical (or gas) load by asking consumers to reduce or shift their electrical usage, and consumers receive back payments or rebates for this change in their consumption habits. DR programs, predominantly in the electrical field, are in use in some European markets, in the United States and Australia, but less than 2% of its global potential is currently being utilized [9,10,11].
In power systems, DR programs have been used for years as a useful tool for the operation of the grid and as a commercial option for utilities and energy trading companies in order to optimize their customer’s portfolios. However, in the case of natural gas networks, the exploitation of DR options is nowadays anecdotal. Some examples can be found in countries such as the UK, where the National Grid provides Demand Side Response Services to encourage daily-metered customers to vary their gas consumption in case of a gas supply emergency. However, only consumers with a registered demand of 2Mtpa and able to offer a minimum DR offer energy quantity of 100 MWh in any DR offer notice can be eligible to participate [12].
In the US, gas DR services are not used as much as in power systems; but in 2018, the Secretary of Energy and FERC established pilot programs aimed to study the natu-ral gas DR energy and cost savings, inside the Energy Infrastructure Demand Response Act [13]. In California, having the second highest consumer of natural gas of the coun-try, the Aliso Canyon gas leak revealed in 2015 the weakness of the natural gas infra-structure [14]. Therefore, in 2017–2018, California adhered to the SoCalGas Smart Therm program together with 9200 customers. According to that program, partici-pants allow utilities to automatically adjust their Ecobee and Nest smart thermostats up to 4 degrees when a critical event happens. Costumers enrolled are rewarded with a $50 incentive together with an additional $25 income for staying enrolled all year round [15]. In New York, gas DR pilot programs have been experimented with by Consolidated Edison to face a potential gas shortage [16]. Other territories in the Mid-west and Northeast (like Maine) have stated pilot programs to combat the impactful shortages due to extreme weather and to cut costs for consumers that are among the highest energy costs per capita of the country [17]. A preliminary analysis has been carried out in New England by the Brattle Group, which suggested that home heating gas DR programs could save 40 million cubic feet of gas on a peak day during winter months [18].
As it can been seen, DR initiatives in natural gas networks are much less deployed than in power systems, and its diffusion in each country is strongly related to the stage of development of the AMI infrastructure. Therefore, natural gas networks must incorporate IoT devices soon, such as smart meters and smart thermostats, in order to be enabled as a flexible energy system.
On the other side, there is a significant barrier to the diffusion of DR programs related to the lack of governmental rules and regulations for the management of this kind of flexibility service. Furthermore, the role of aggregator must be recognized by national regulation as a fundamental step for DR success, including not just large industrial consumers but also smaller commercial and residential applications.
In this context, this research has investigated and identified a new agent to play the role of demand aggregator in natural gas systems: the district heating operator (DHO). The DHO is a natural gas aggregator as it could be able to manage the thermal demand of consumers in its portfolio, which would mean changes in the gas demand of the whole DH subsystem. In order to illustrate the potential field of application of this agent, an evaluation of the manageable consumption that may be identified in the Italian natural gas system has been evaluated, which means a continuation of previous works of the authors on this research line [19,20].
The article is structured as follows: after a brief introduction on the DR specifically applied to natural gas systems, a review of the DH worldwide is presented. In Section 3, a novel architecture for the smart metering gas system is proposed, followed by a description of the aggregator roles within such configuration. In Section 4, based on the previous ideas, the case of application to the Italian gas system is explained. Finally, results are discussed in Section 5, and some conclusions are presented in Section 6.
2. Worldwide District Heating
The Directive 2012/27/EU on Energy Efficiency of the European Parliament and the Council of 25 October 2012 defines district heating and district cooling networks as “any infrastructure for transporting thermal energy from one or more production sources towards a plurality of buildings or sites of use, mainly built on public land, within the limits allowed by the extension of the network, to connect to it for the supply of thermal energy for heating or cooling of spaces, for manufacturing processes and for covering the needs of domestic hot water” [21]. DH is a centuries-old source, known as early as the 14th century. The thermal springs of Chaudes Aigues, in France, have provided a source of income and energy for the city since 1300 [22]. Inhabitants receive heated water through wooden pipes, still in operation, from a geothermal source. Low temperature energy is provided to heat homes and businesses.
In modern times, the first documented DH system was built by the engineer Birdsill Holly [23]. The system consisted of a large, centralized boiler capable of supplying steam to a group of surrounding buildings through a network of highly insulated ring pipes for reducing heat losses. Later, the first cities that adopted Holly’s system were Lockport and New York (USA) in 1876 [24]. The success achieved led many other North American cities to install similar systems, with the advantage of considerably reducing the risks of fire, which were then very frequent, due to the domestic use of braziers and coal stoves. Subsequently, this experiment was emulated in Europe, mainly in the Northern countries. DH systems resulted as particularly useful during the post-war period and to face the energy crisis of the 1970s, when the first experiments on the use of waste to operate the cogeneration plants that powered the DH systems were carried out to produce both electricity and gas [25].
2.1. District Heating System in the United States of America
North America has more than 700 District energy systems, which held the dominant share of the global district cooling (DC) market in 2014 [26]. The Holly Steam Combination Company was the first steam heating enterprise to commercially distribute DH from a central steam heating system [27]. Three types of DH systems have been developed in the United States [28]:
- Steam heating systems owned and operated by local electric utilities and developed in the late nineteenth century.
- Non-profit systems (usually municipally incorporated or owned), which serves many urban users.
- Finally, and significantly grown in the last two decades, DH systems for institutional users such as university campuses, military bases, etc. [29]
Some of the most significant district heating and cooling (DHC) facilities are shown in Table 1:
2.2. District Heating Systems in Asia
In 2015, the worldwide DHC market was lead by Asia with a share of 55%, followed by Europe in terms of global market revenues. In particular, Japan, China, and South Korea hold a driving position in the transition for a clean heat production by using DHC technologies. Therefore, their DHC market is expected to grow impressively by 2024 [26].
In Japan, the first DHC system was built in 1970 in Osaka. Nowadays, DHC is the third largest public utility after those of electricity and gas and its benefits are globally recognized. Under the Heat Supply Business Law, DHC can receive subsidies if the general demand has a heating capacity of at least 5.8 MW and if a multiple number of buildings are served [30]. In 2016, the total consumption of DHC was about 3577 GWh for cooling, 2546 GWh for heating and 73 GWh for hot water production. The market trend is stable and has grown during the last decade. About 137 DHC systems are operating today in the most densely populated districts and gas is the main used fuel [31].
In the framework of the development of a clean DH system, the Popular Republic of China is deploying new technology for domestic heating and hot water. Even if the use of coal is still the main used fuel, the integration of natural gas and renewable energy is in expansion, mainly due to the stronger political support and country climate commitments [32,33]. DH facilities are predominantly located in the north of China with a total installed heating capacity of 462,595 MWh [34].
In South Korea, DHC started to be recognized in the 1990s as a promising technology for gas emissions reductions. Its diffusion was basically related to the continuous increment of the heating demand and the growing urbanization. At present, the DHC network supplies thermal energy to 15% of the population in the country, with heat capacity of 28,384 GWh and 7.75 million people [35]. Recent studies performed in the country have demonstrated the economic feasibility of DH systems compared to individual heating [36]. Indeed, the Korean District Heating Engineering Company (KDHEC) is promoting a new project for expanding DH systems in cities and supplying low carbon heat [36].
2.3. District Heating Systems in Europe
Among the European countries, Denmark has had a remarkable experience with DH, since the first Danish DH plant was put into regular operation and inaugurated in Copenhagen in 1903. Today, approximately 65% of total energy used for heating in this country comes from a DH plant [37].
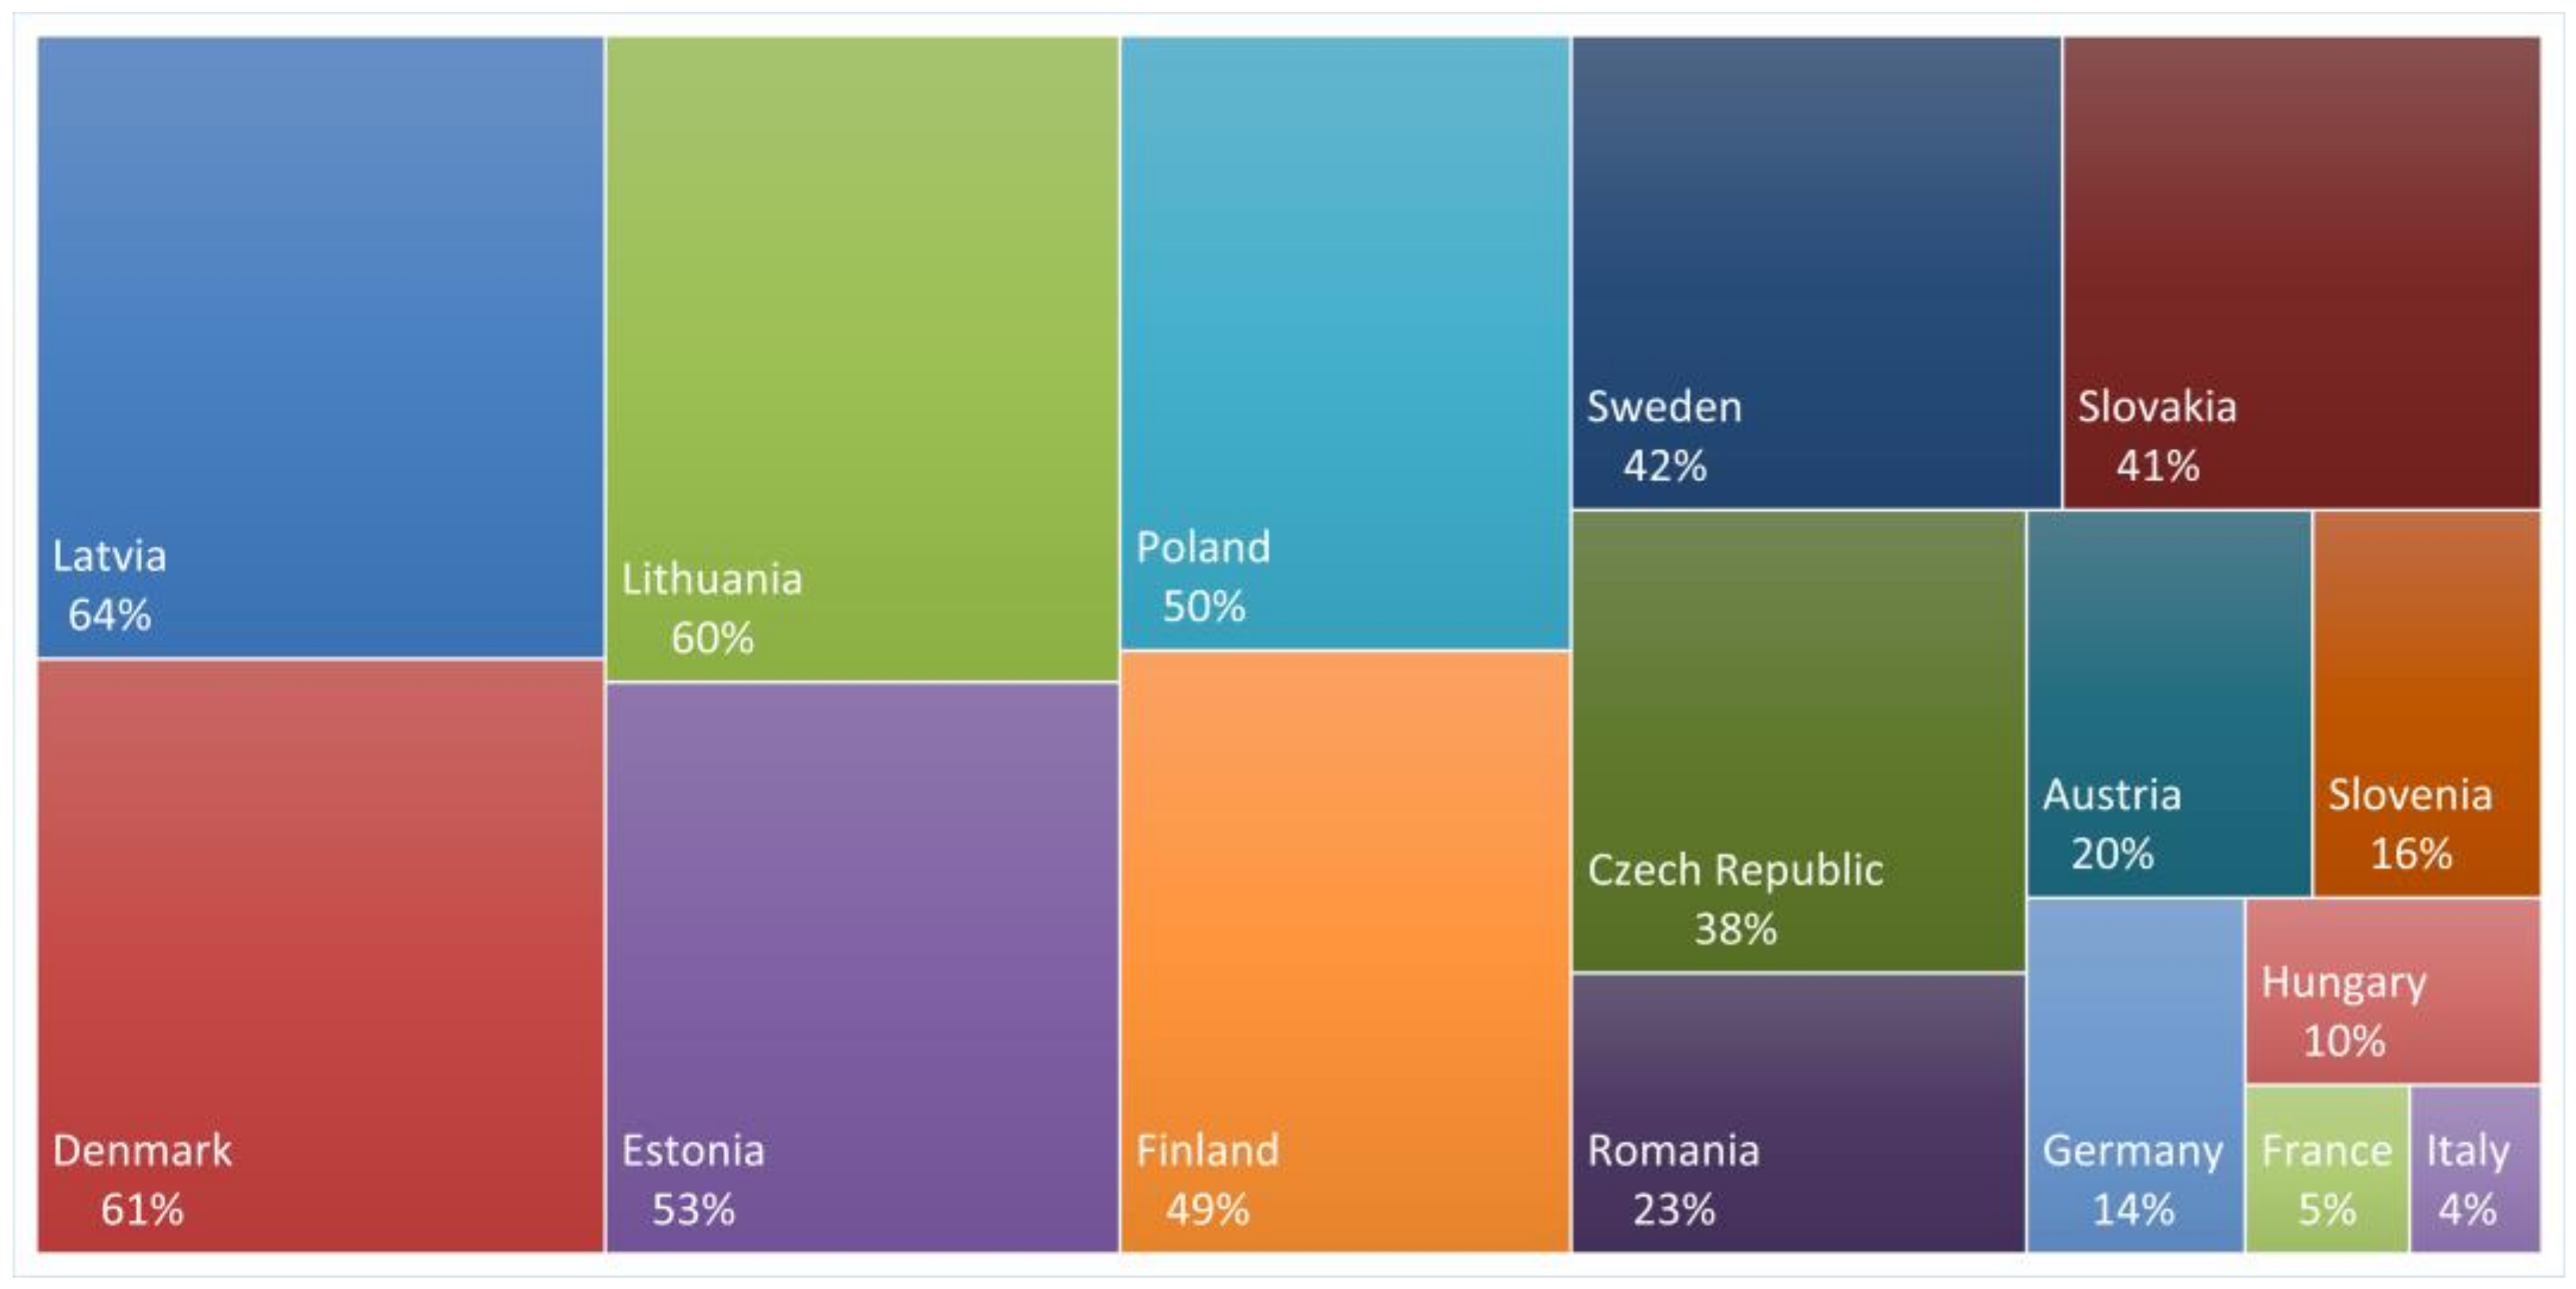
With the exception of Iceland, where 95% of homes receive DH supply produced by geothermal energy, most of the DH facilities in Europe operate under a Combined Heat and Power (CHP) configuration, so that heat and electricity are produced jointly. CHP is a high-energy system that allows the combined production of electricity and heat [38]. In total, there are over 5000 DH networks across Europe and, nowadays, this technology covers 10% of the energy market. In addition, Netherlands and Finland followed by Poland, Czech Republic, Finland and Romania use DH so as to cover more than 60% of their thermal needs.
The Dutch DH network has 30 large-scale grids, supplying the heat produced by such companies as Eneco, Essent or Nuon to approximately 227,000 consumers. In addition, these suppliers deliver heat to around 6900 small-scale grids owned and operated by housing corporations, supplying to approximately 336,000 homes [39].
The main type of fuel used for heat production in DH plants is natural gas and coal, with a small fraction from renewables. However, small-scale grids use a wider variety of energy sources, using cogeneration and conventional boilers, as well as boilers that use solar thermal energy. Figure 1 shows the thermal energy rate produced by DH in the different European countries.
The Technical Research Centre of Finland VTT states that DH is the most popular form of heating in Finland, with an estimated coverage between 50% and 75% of the heating demand in new buildings. The current demand supplied by DH is 33 TWh per year, mainly produced by cogeneration (74% of total) [41]. At present, the thermal demand covered by DH is still growing, being forecasted a total supply of 42 TWh by 2020 [42].
2.4. District Heating in Italy
Currently, the Italian Heat Strategy has different targets to meet the EU 2050 objectives. These targets are stated in the Energy and Climate National Integrated Plan [43]. Among them, the reduction of 43% of the primary energy consumption and of 33% of the greenhouse emissions are some of the most relevant. In this scenario, DH has been identified as an energy system able to contribute to achieve those targets [44].
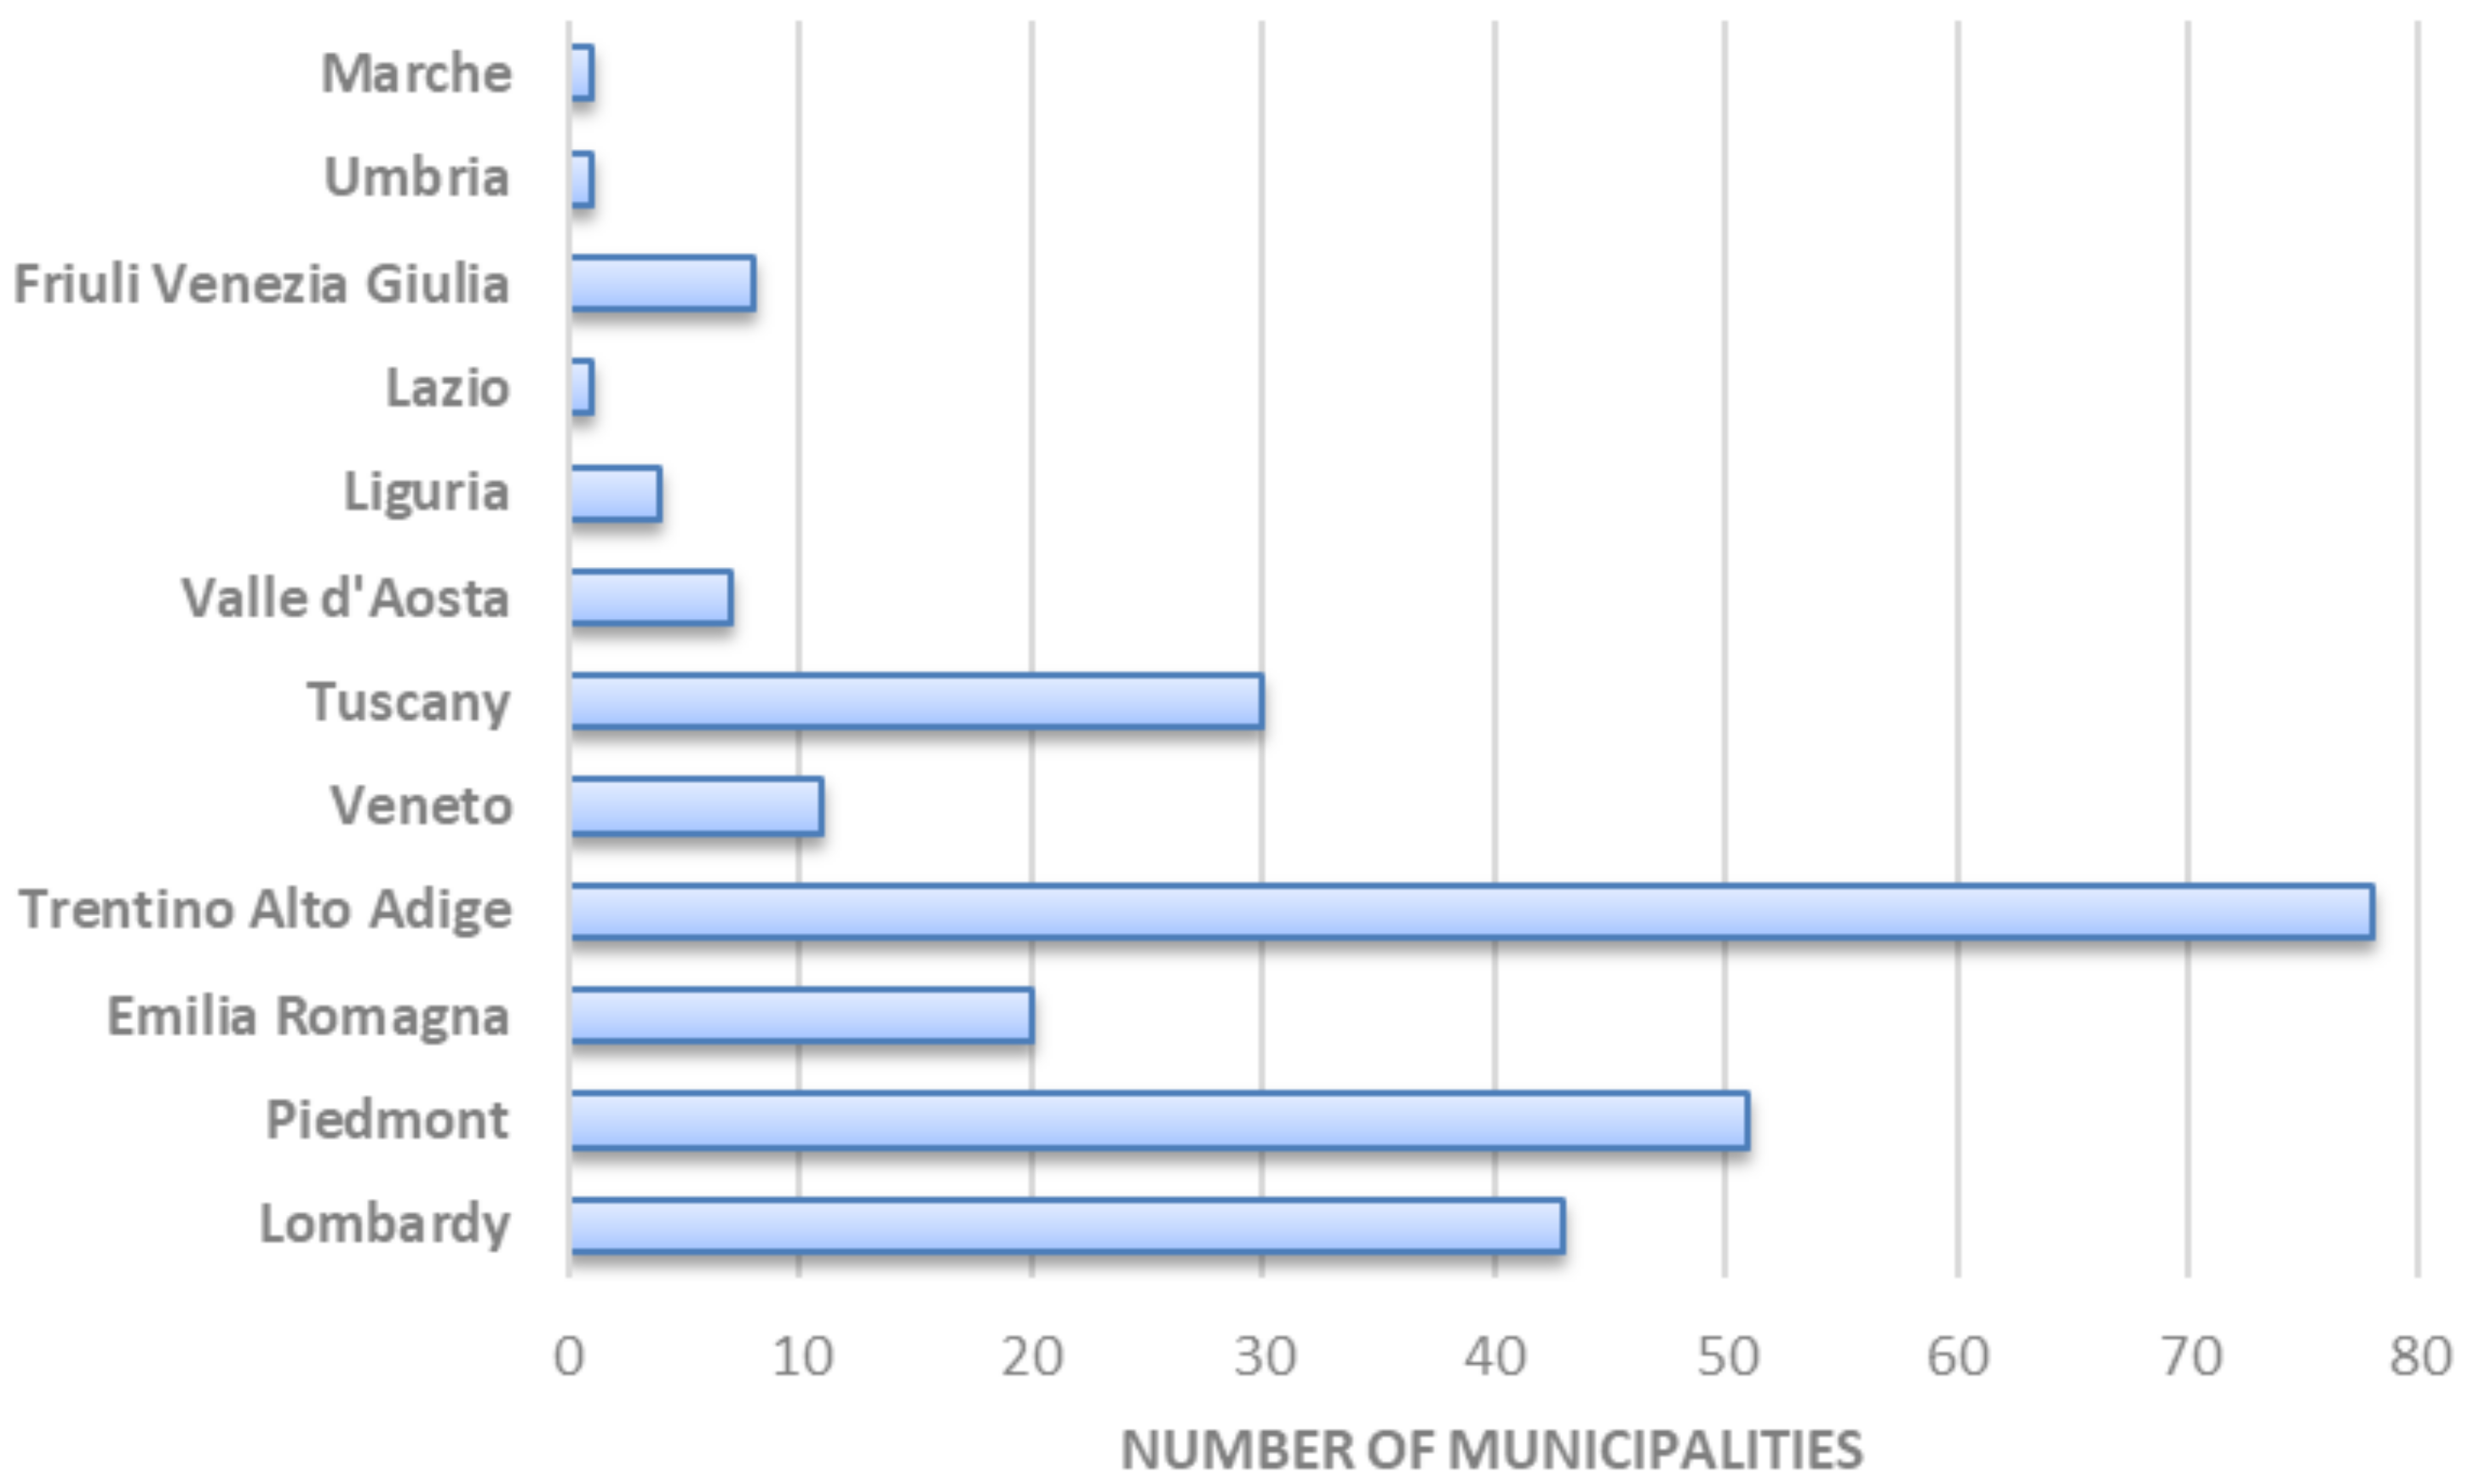
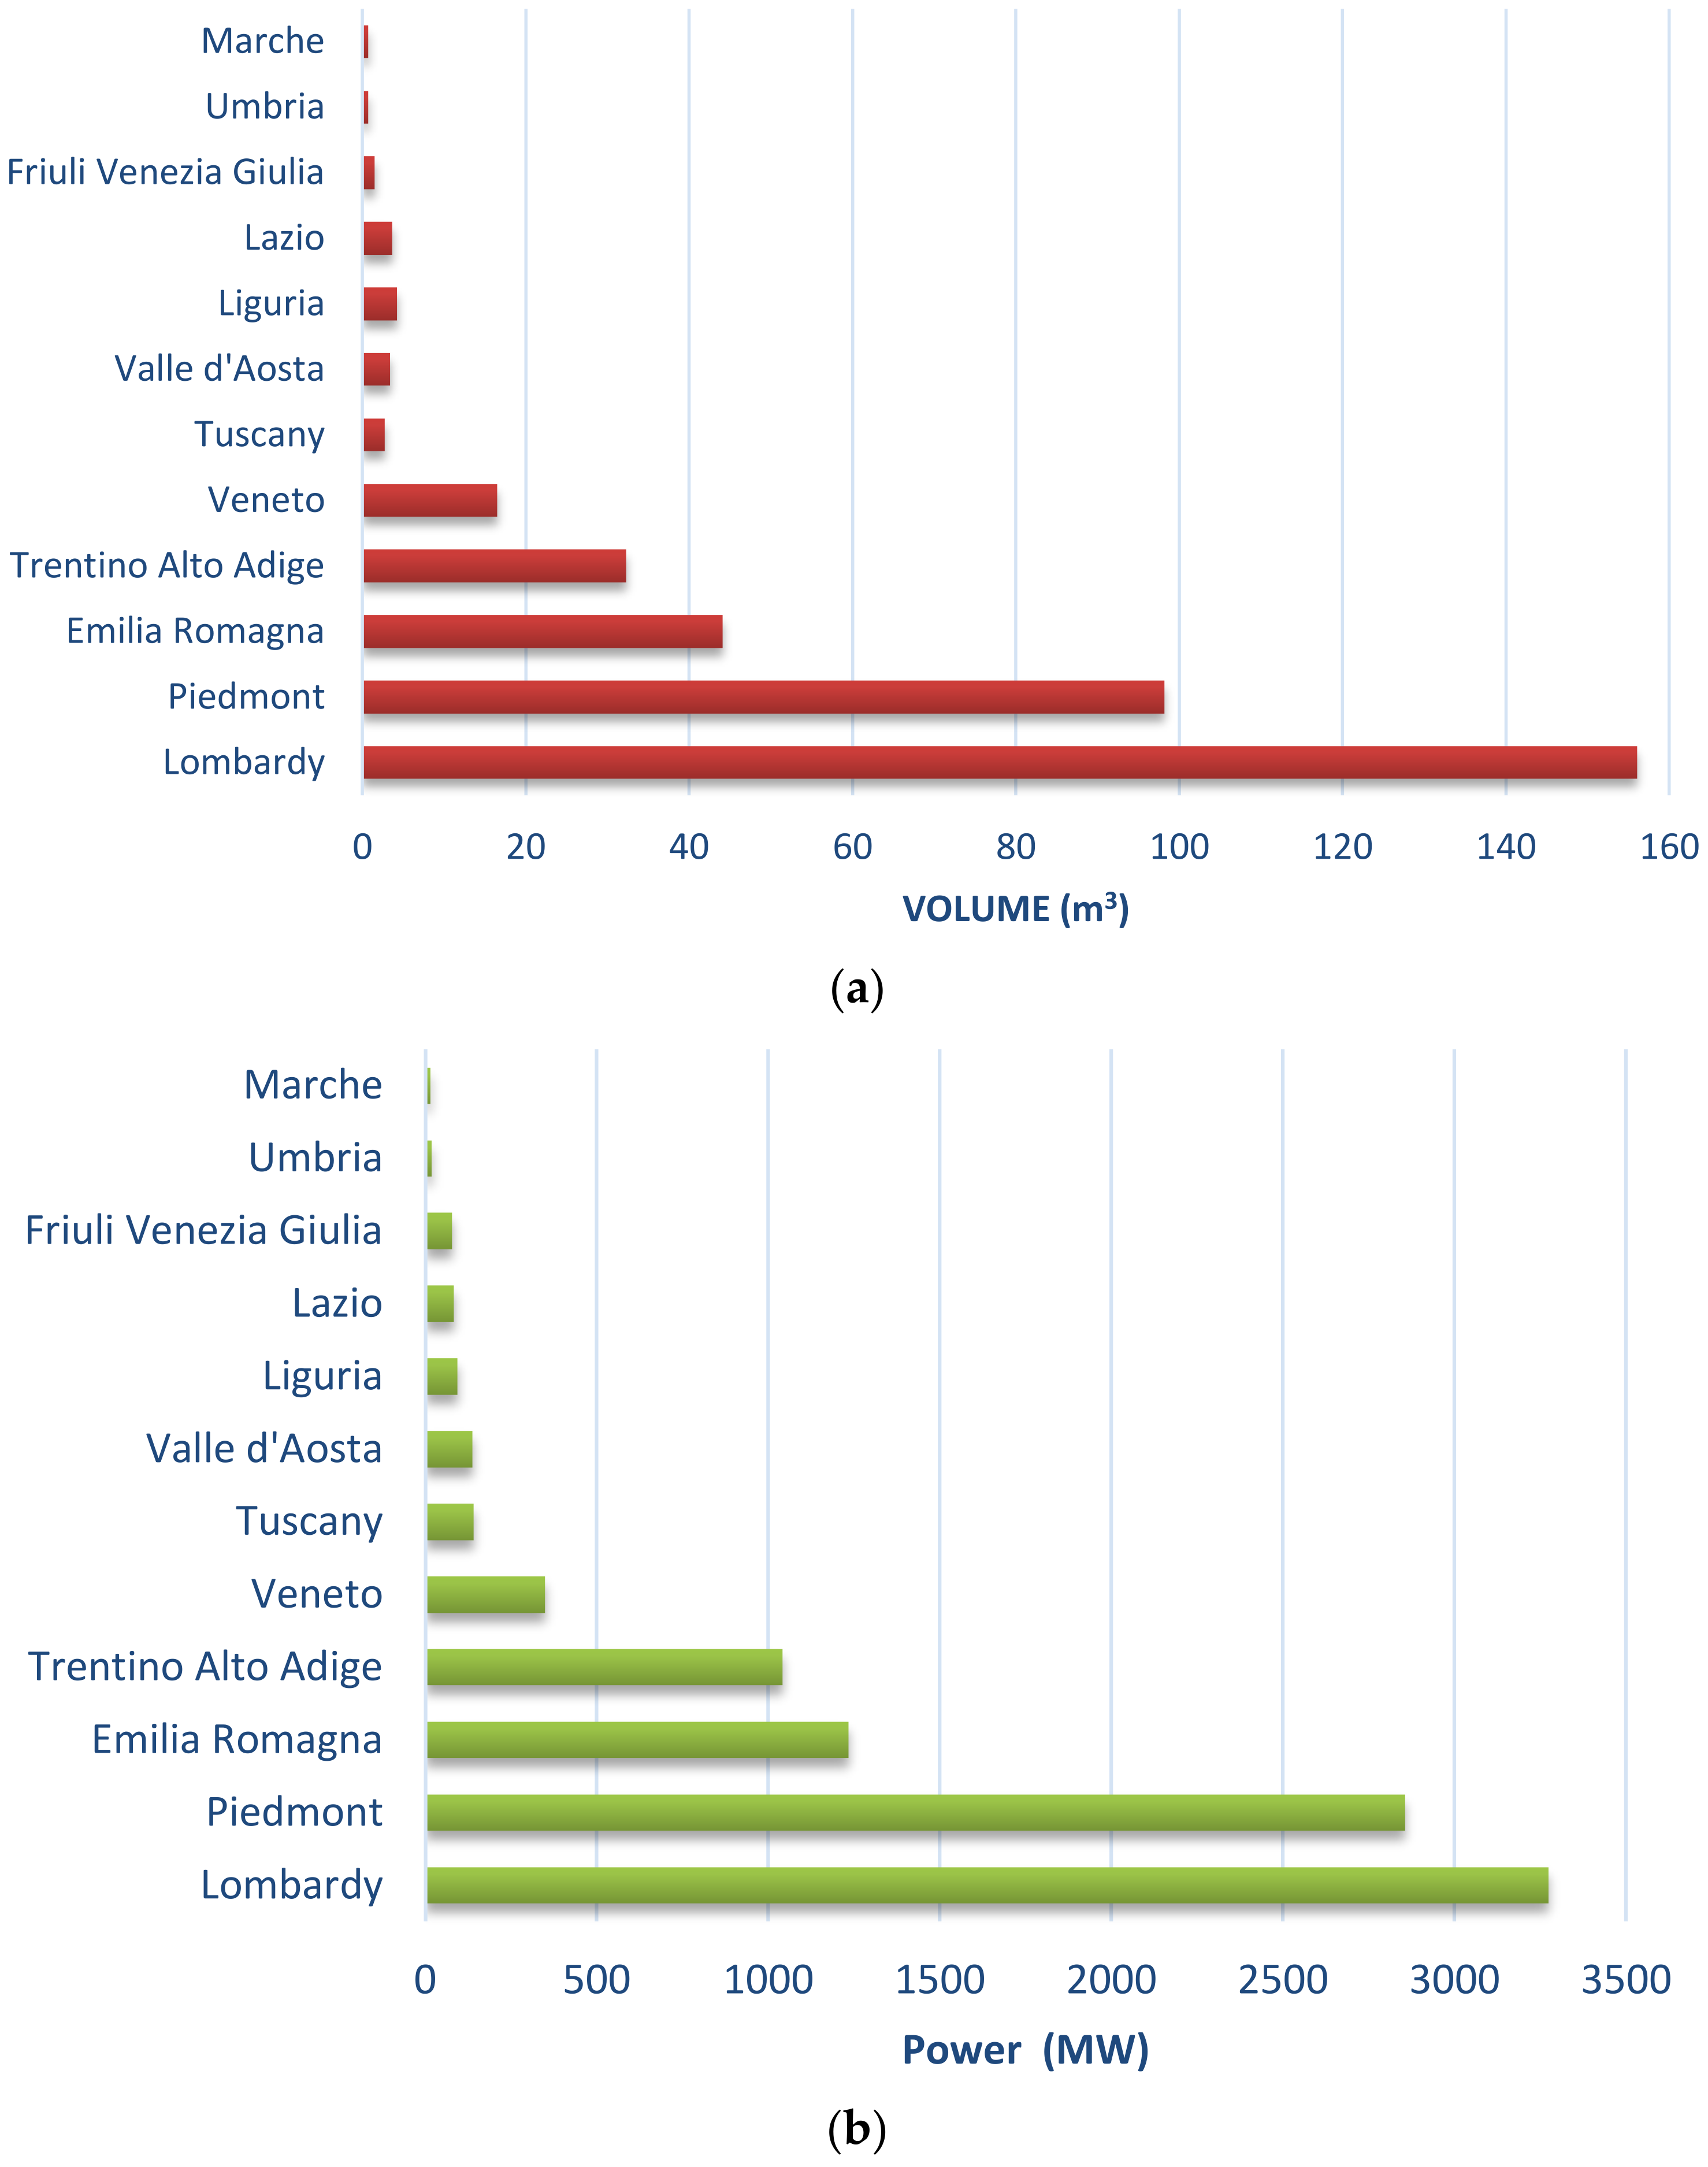
In 2019, the total installed DH capacity in Italy was around 8727 MWth with around 3,900,000 people served and a trench length of roughly 4.400 km for transmission and distribution networks. The recent years, a slight increase has been registered in the DH network of about 2.5%, mainly in the north of the Italian peninsula [45]. Figure 2 shows the number of municipalities served by DH networks in Italy. In addition, the volume and installed power of DH systems in the different Italian regions is highlighted in Figure 3.
The Government interest in DH has been growing from 1972 until now and five lines of investigation are currently open to understanding system feasibility:
- -
- Assessment of the DH potential in the Italian peninsula.
- -
- Integration with this energy system and other energy resources such as solar, heat, hydropower, geothermal energy, waste incineration, etc.
- -
- Analysis of the possibility and challenges of the transition to the 4th generation of DH.
- -
- Integration of various heat sources and thermal storages.
- -
- Development of a low-temperature DH network to achieve an emission-free energy system.
Successful pilot projects of DH networks supplied by natural gas have been carried out in Milan, Brescia, Cremona and Turin [46], while few examples of DH networks integrated with geothermal energy can also be found in Grado and Ferrara [47].
In Turin, heat transmission and distribution networks have an extension of approximately 550 km of double underground supply and return pipes, to serve a volume of 54 million cubic meters, corresponding to 600,000 inhabitants. Thanks to the access to the service of the Torino Nord cogeneration plant, which allows DH of an additional volume of 15 million m3, the leadership of the city of Turin has been consolidated as the most district-heated city in Italy, making it one of the most district-heated areas in Europe [46]. At present, the DH network of Turin is supplied by three combined cycle plants operating in cogeneration mode [49].
The 2021 Industrial Plan lead by the IREN Group foresees bringing the total heated volume to 98.8 million m3, with particular attention to the Turin metropolitan area. It is expected to grow by 13 million m3, partly saturating the existing network, partly extending it to Beinasco, North Turin, South Mirafiori and San Salvario [50].
The DH network of Brescia dates from the 1970,s and it is the second one for extension in Italy. In 2020, there were approximately 177,700 equivalent apartments served by the network, with 42.6 million m3 and 678 km of installed network. Thanks to this network, 69,417 tons of global CO2, 107.1 tons of nitrogen oxide and 2.6 tons of fine particles are avoided a year. DH was also chosen by iconic buildings such as the civil hospitals, the Santa Giulia Museum, the new and old Cathedrals, the courthouse and the Teatro Grande. Over 60% of the heating requirements of the DH system of Brescia come from heat produced by waste [51].
One of the first projects held in Milan was in the early 1990s. The Municipality of Sesto San Giovanni and the distribution network operator, A2A, signed an agreement for the development of DH using the residual heat derived from a combined cycle plant. It consisted of a gas turbine and a steam turbine powered by methane and owned by Edison SpA. Today, this town has one of the largest DH systems in Italy. Nowadays, the DH network covers symbolic buildings such as the Duomo, the Court or Palazzo Marino while it serves about 223,100 apartments with 53.5 million m3 and 344 km of installed network. In 2020, this resulted in a reduction in emissions of about 2.9 tons of fine dust, 99 tons of Nitrogen Oxide, about 24.7 tons of sulfur dioxide and 120,500 tons of CO2 avoided [52]. The most recent investments included the network expansion, which has allowed the city of Milan to increase heat recovery from the Silla waste-to-energy plant by 225%. Other projects include the use of groundwater in the Canavese plant with a further heat recovery of over 25 GWh/year. Finally, another DH project will be [52]:
- The connection to the network of the Vetrobalsamo glass factory in Sesto San Giovanni with a recovery of another 20 GWh/year of heat from industrial processes.
- The new groundwater cogeneration plant, which will provide clean heat to the Comasina district while ensuring 20% of the heat from renewable sources and about 48% from high-efficiency cogeneration.
3. A Novel Architecture for the Natural Gas System
3.1. Identification of the DH as DR Aggregator for the Natural Gas System
With the liberalization of the natural gas market, which has taken place in different parts of the world, final consumers are free to purchase gas by competitive mechanisms, directly participating in the market (large customers) or freely choosing a retail supplier. In Europe, it started in 2003 and, from that year, a new liberalized market with new companies competing with each other has created more competitive and profitable services and offers. Market rules have been established in these competitive markets so as to guarantee the free competence between participants. In Italy, a new Gas Network Code was approved by the Authority for Electricity and Gas (Acronym CRDG-with resolution no. 108/06) as the contractual instrument between the companies that manage the distribution systems, the retailers and wholesalers. The development of this competitive market brought about the formal separation between the different actors in the gas market. At this moment, the application of the concept of a smart grid to the natural gas system enhances the need to define new roles in order to satisfy new arising necessities, or to redefine existing activities so as to adapt to this novel configuration.
According to previous research developed in this field, applied to the power sector [53], the aggregator has been identified for the smart natural gas network:
- End users: They consume the natural gas and pay the prices established by the supplier (wholesaler for larger consumers, or retailer). In this smart infrastructure, the end user is also able to provide the operator of the grid with DR services, based on the flexibility that end users may have.
- Producers: They explore, investigate and exploit the gas deposits.
- Gas Storage Manager: It is the responsible body for the management of the gas storage facilities.
- Aggregator: It creates blocks of flexible demand, which may be used by the operator of the grid (or any other stakeholder) by grouping smaller end users.
- Transmitter: It is who owns and manages the infrastructures related to the transmission of gas at high pressure and the international interconnections.
- Distributor: It is the manager of the distribution network, which carries the natural gas from the transmission grid to the end users.
- Retailers: They buy large amounts of natural gas in the wholesale market and resell it in smaller packages to the end users.
- Wholesale energy traders: They incorporate natural gas into the system, buying this gas in international markets, to other wholesale energy traders or directly to producers, and resell it to retailers or large end users. Unlike the case of the power grid, transmitters and distributors, together with network operators (at transmission and distribution levels), also buy natural gas for operation purposes (balancing, refilling of tanks, maintenance of the pressure in the pipelines, etc.)
- Transmission System Operator (GSO): It operates the national and regional transmission network, guaranteeing the security of the whole system and the supply to end users according to the technical conditions established by regulation.
- Distribution network operator: This role is similar to that for the GSO but just applicable to a region of the gas network at the distribution level.
- Market operator: It is the body responsible for managing the mechanisms for the energy exchange between the parties (energy traders, producers, retailers, large end users) in the wholesale market.
- The activities stated before are roles that can be independently performed under a smart grid configuration, but not entities. It means that it may be possible that the same body could perform more than one of the identified roles (e.g., the distributor may be also play the role of distribution operator, but not necessarily).
3.2. The Role of the Aggregator
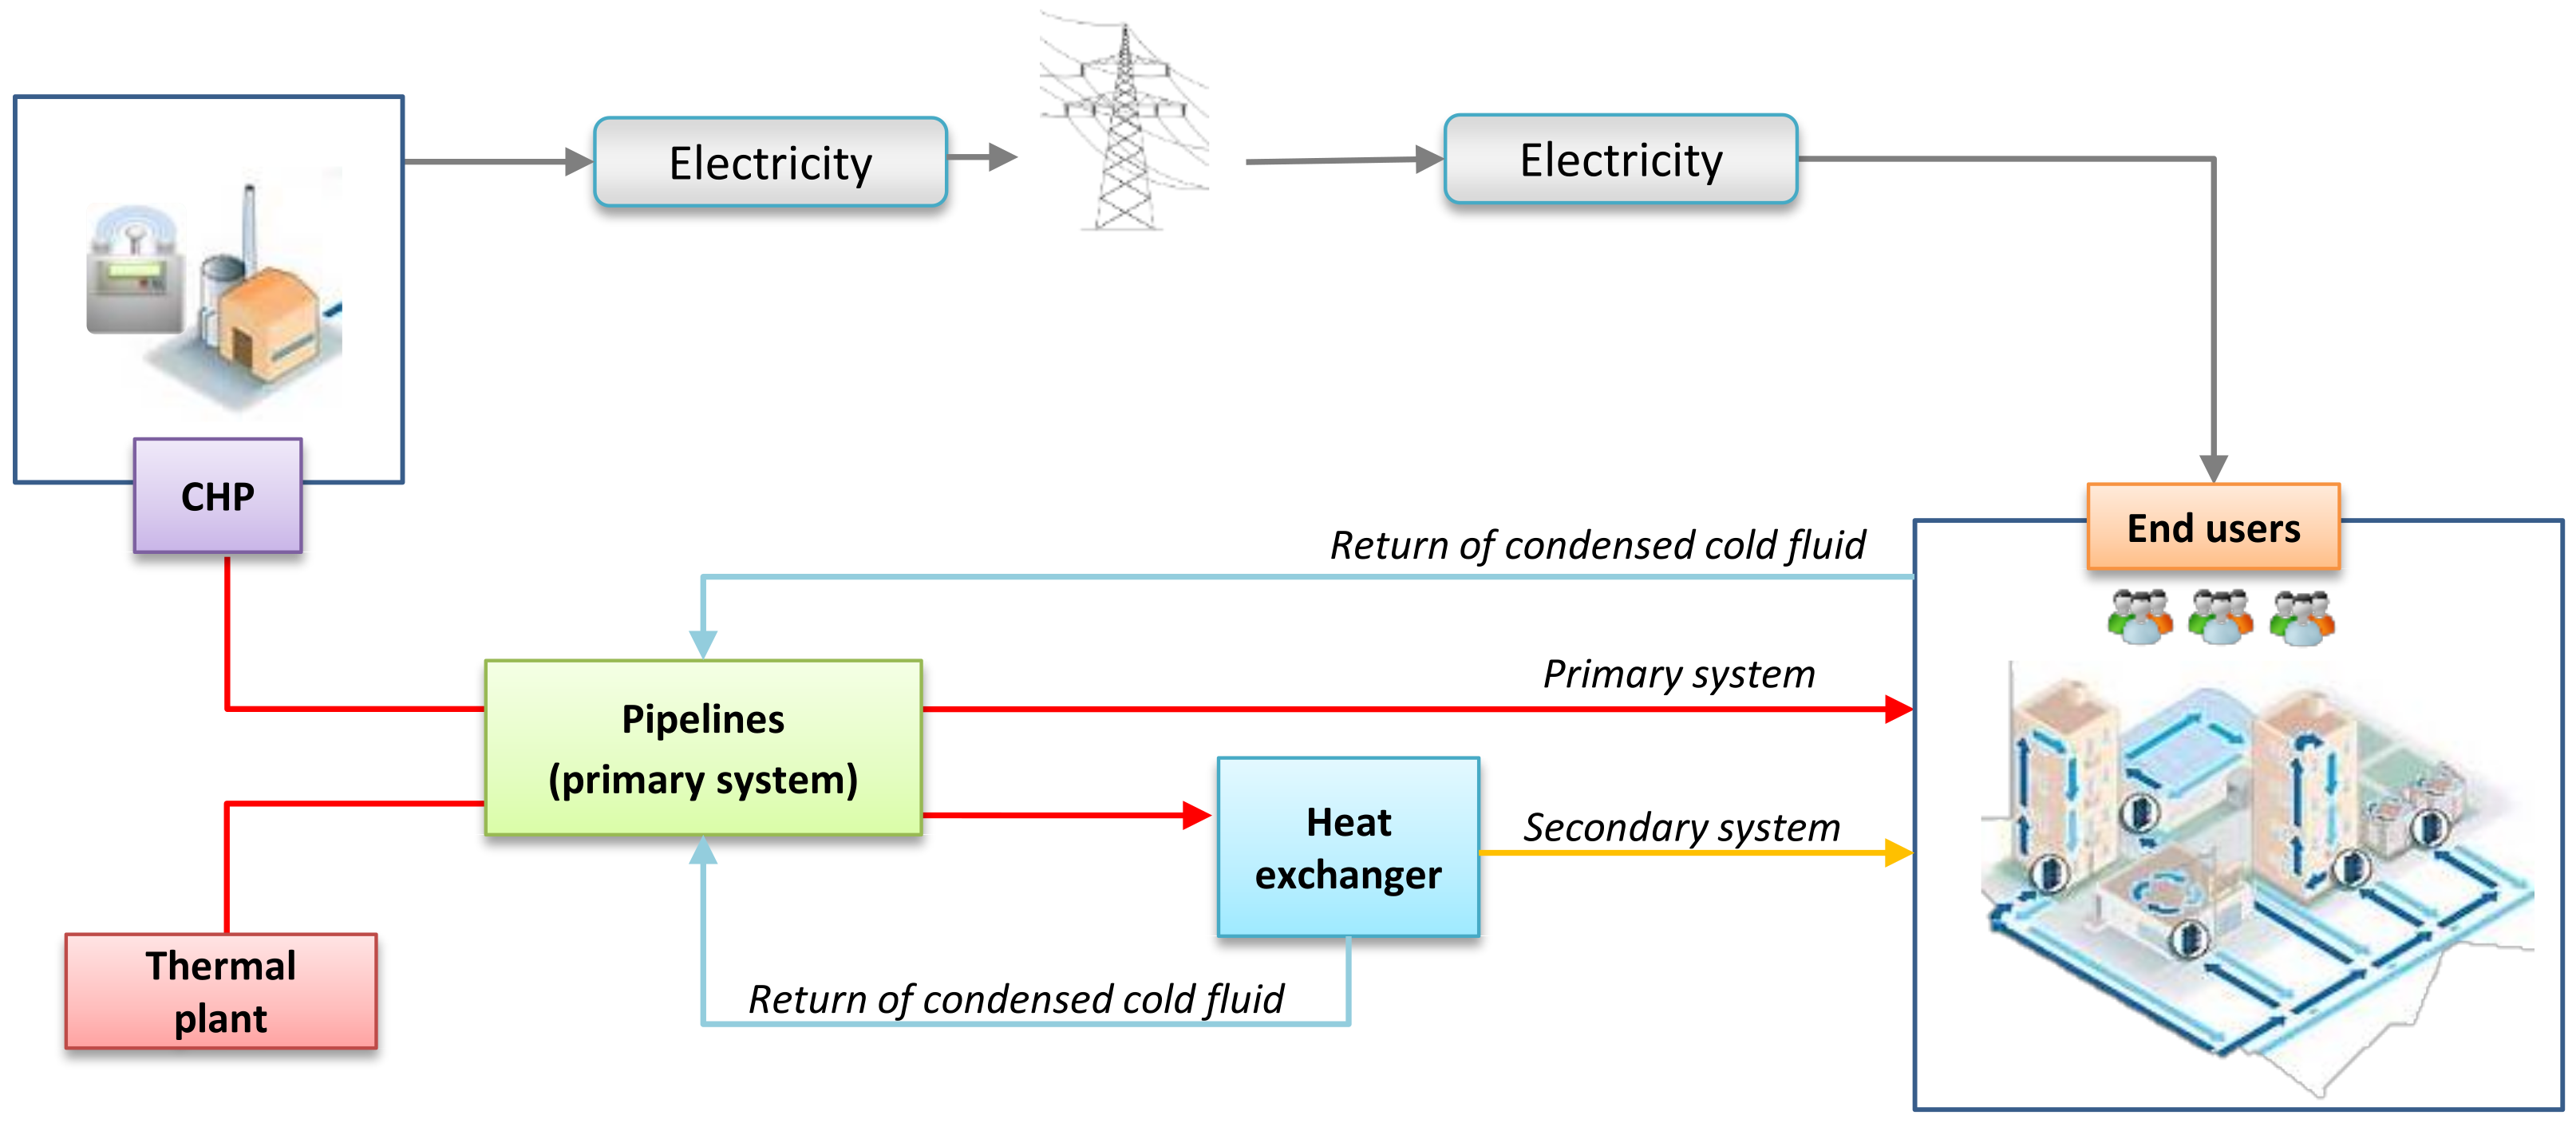
A District Heating system (DHS) is based on the central production of steam, hot water or any other thermal supply by means of any primary energy source (natural gas, coal, solar, geothermic or other) that is later supplied to the final consumers of thermal energy, preventing such consumers from having to perform the energetic transformation in their own facilities.
The working scheme of a DHS is relatively simple, as highlighted in Figure 4. The thermal fluid (frequently steam or hot water) is produced by a thermal plant, usually located at a certain distance from the consumers (e.g., for urban supply, the DH plant is usually outside of the city). Then, the thermal fluid is sent through underground pipelines from the thermal plant to each individual building connected to the DH network. The hot fluid may be supplied to the consumers, who can directly use it (e.g., steam injected in some part of an industrial process) or it could also be used to heat a secondary fluid by means of a heat exchanger. For example, the hot water can be used to feed radiators or to produce sanitary hot water at a lower temperature than the primary system [54]. In this case, condensed steam or cold fluid would be returned to the thermal plant (or an intermediary reheating point) to restart the cycle. When the DH is coupled to a CHP plant, electricity can also be produced, which increases the efficiency of the whole system.
The DH thermal plant can be powered by different kinds of fuels such as natural gas/fossil fuels but also biomass [55] or heat resulting from the incineration of solid urban waste. In some countries such as Russia, Ukraine, Sweden or Switzerland, where the head needs are extremely high, the DH can be fueled by nuclear power [56,57]. On the other hand, renewable energy sources are used more and more as primary energy sources for the DH production, such as geothermal and solar thermal energy (solar DH (http://solar-district-heating.eu; accessed on 18 August 2021)). Another source of primary energy “at low cost” is the use of waste heat from industrial processes (http://www.ecodallecitta.it/notizie/377390/teleriscaldamento-come-si-regola-la-temperatura-dei-termosifoni; accessed on 18 August 2021). The research presented in this document focuses on valorizing the role that DH system managers could play as aggregators of DR resources. Indeed, DH plants that use natural gas as primary fuel could provide DR services to the natural gas system by reducing or increasing their gas consumption if it is required by the gas system operator (GSO). Therefore, this flexibility would be finally given by customers supplied by the thermal fluid produced by the DH plant. This is actually a very interesting approach, which constitutes a significant contribution of this research as it may entail a new business opportunity for this kind of company. At the same time, they help in the operation of the natural gas system under a smart grid configuration.
Aggregators are agents that act as intermediaries between small/middle consumers (who behave as DR providers) and the stakeholders interested in using such flexibility. These stakeholders could be transmission system operators, distribution network operators, retailers or other. For the scope of this research, the gas system operator (GSO) will be the user of DR resources and, therefore, the only DR requester considered.
The aggregator is able to manage flexible gas demand packages of a group of customers, which once aggregated may be offered in significant amounts to the GSO for operation purposes (balancing of the gas network, solution of technical constraints, etc.). This flexible package could be the result of reductions in the gas consumption of customers, but also increments in consumption during periods when the gas system is in surplus. In any case, this management implies the modulation of the gas load consumption but never determines a gas injection into the network.
Aggregators must have the appropriate measurement and management equipment to be able to offer safe and reliable operating services to the GSO. Here, the massive deployment of gas smart meters, which is taking place in some countries as mentioned in Section 2, may be a very positive point so as to help in the further development of the role of aggregator in the natural gas system.
While the GSO can balance the gas in the grid in the wholesale market, aggregators would offer the same service through the increase or the reduction in the demand. In this way, the use of demand resources offered by the aggregators would provide more efficient services than those offered by the wholesaler, since before an event that required a gas increase, the aggregator would manage the demand. It would imply a reduction of the consumed gas, a lower load level of the network (which reduces the risk of congestion) and greater efficiency of the system as a whole. Moreover, DR may imply a decrease in the greenhouse emissions when reducing the net gas consumption.
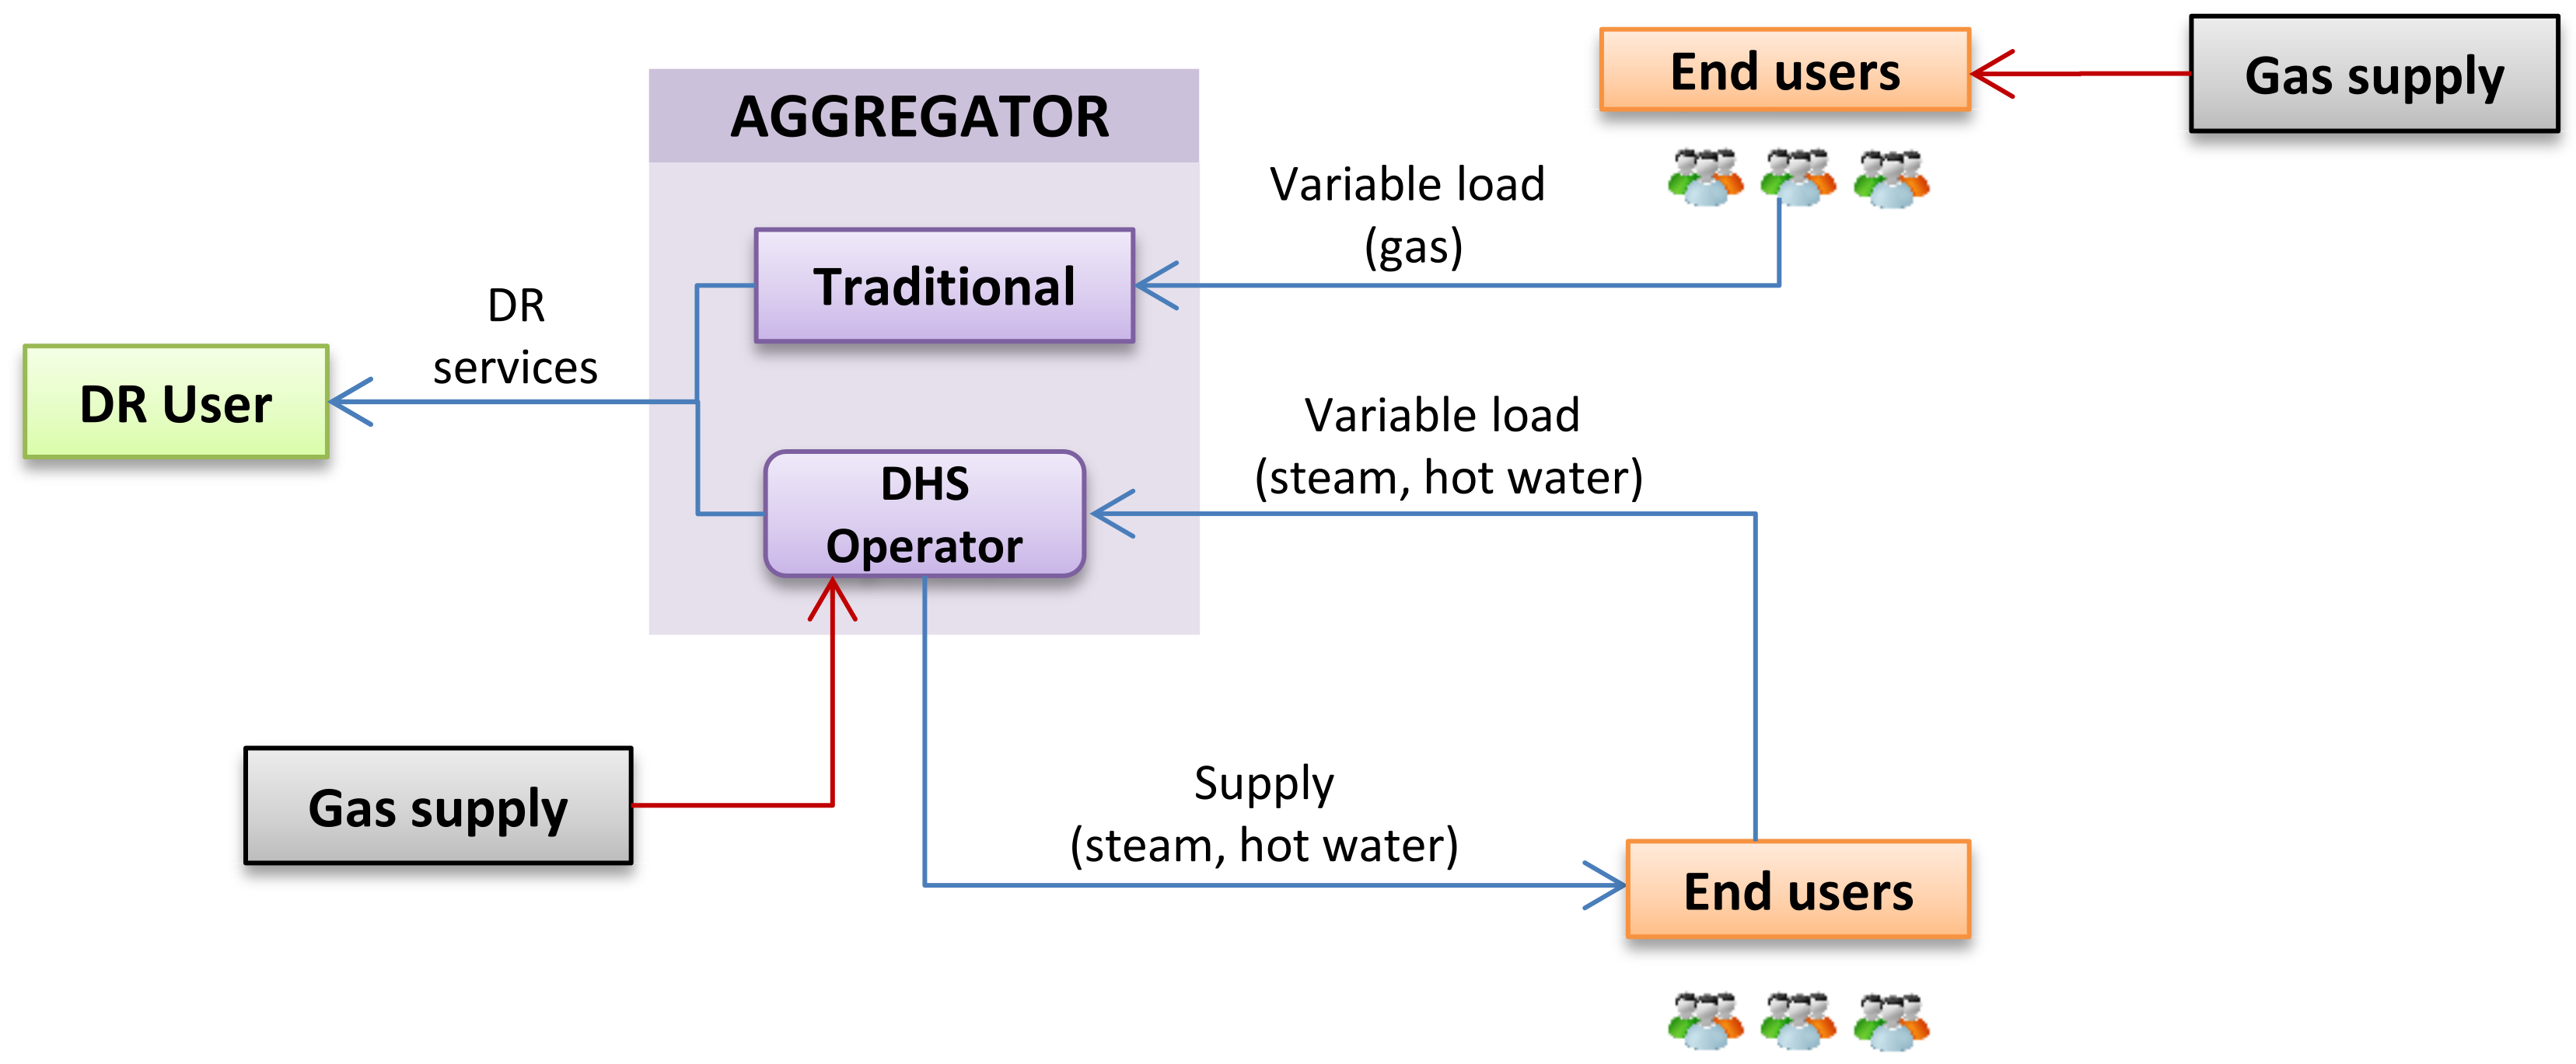
The aggregator of DR resources in the natural gas system has a novel approach, as it is schematically represented in Figure 5. Indeed, the manager of DH systems arises here as a potential aggregator of thermal energy consumers in contrast to the traditional aggregator, who represents and manages the flexibility of medium and small gas customers. Customers grouped under the traditional aggregator are natural gas consumers, which directly use this fuel in a boiler or a burning system for heating purposes. However, the DH system can also play the role of aggregator by managing steam or hot water supplied to final consumers by the DH system, who is the actual consumer of the fuel. Differently to the traditional one, this aggregator would be simultaneously the thermal energy supplier and the manager of the DR resources that may be offered by the supplied customers within its portfolio.
3.3. The Role of the Aggregator as an Agent of the Natural Gas Smart Grid
Considering the natural gas system as a smart energy grid, the different agents involved in the provision or utilization of DR resources will be the following:
- The customer, as “generator” of the DR resource. This agent could reduce or increase the consumption, providing flexibility to the gas system.
- The Gas System Operator (GSO), as the main user of DR resources. The gas operator will use the ability of the customer to manage their consumption in order to solve different problems, which may arise in the daily operation of the natural gas system infrastructure.
- While large customers might directly provide their flexibility, it is not operative in the case of smaller gas consumers. Therefore, it appears here the figure of the aggregator, which is an intermediary between the DR providers and the DR users. Aggregators could be classified into two blocks:
- ○
- When consumers are directly using natural gas, the role of the aggregator will be very similar to this agent in power systems: the aggregator is not supplying the gas to the consumer, but it represents the consumer to the system operator for operation purposes. The aggregator receives the requirement from the GSO and it manages the consumers under its clients’ portfolio in order to create a flexible demand package according to the GSO request.
- ○
- On the other side, the aggregator could also be the manager of a DH system, which is the case we have considered in this research. In this case, the DH system is the actual consumer of natural gas, while final customers are supplied with steam or hot water. Therefore, this manager can play with the downstream heat demand as customers can offer their flexibility not reducing their gas consumption but their steam or hot water needs. Therefore, the DH system will be able to offer to the GSO some flexibility in the natural gas consumption according to the flexibility of the final customers in consuming more or less steam or hot water.
In addition to the GSO, the aggregator and the customer, there are other involved agents. Large customers, which do not require an aggregator for the provision of DR resources to the GSO, could need some assistance in order to identify as well as to assess and to manage the flexibility they may have. Therefore, the need of someone to support large customers in this task arises. This role will be played by specialized entities, which also exist in the electricity sector: Energy Service Companies or ESCOs. The participation of ESCOs is essential for the proper utilization of DR services, as the providers of DR resources (customers) are not usually familiar with this kind of specialized knowledge, which is usually far away from the business they are devoted to. This lack of knowledge tends to make them reluctant to the participation in DR services, so that ESCOs have here an essential role in order to convince them and to demonstrate the benefits that the use of flexibility would mean for their enterprises.
Other entities that may be interested in the utilization of DR resources are the gas traders or suppliers. They may use DR resources in order to compensate for the imbalances between the gas they purchase in the wholesale market and the real-time consumption of the customers they have in their portfolio. However, this is out of the scope of the research presented here.
4. Case Study
The potential of DR resources to be provided by DH aggregators in Italy has been evaluated and it is presented in this section. The Italian case is a good testing ground for this kind of activity as the natural gas network in this country is quite well developed in terms of technology (smart metering roll-out is in progress) and branching on the territory (actually the only Italian region that is not provided with gas is Sardinia). However, despite the good degree of flexibility and meshing of the Italian gas transmission and distribution network, it is possible that supply is not guaranteed on peak periods. For example, according to the Italian GSO (SNAM) congestions of the natural gas network system have affected the reliability of the system in the North-West area of Italy over the past ten years. In fact, the combination of gas demand peaks together with an insufficient availability of gas stocks (gas wells or GLP tanks) brought about the interruption of the gas service in 2004–2005 and 2005–2006 [58]. Moreover, Italy is a country widely hit by earthquakes, which produces damages not only to people but also to the supply infrastructure, resulting in sudden blackouts and interruptions of the energy services such as in 2016 [59].
According to [20], three different services may be provided by consumers following different DR strategies:
- Service 1. Balancing of natural gas in the transmission network. Gas coming into and out of the gas system must be balanced daily. Therefore, the flexibility provided by consumers may be used for this purpose, reducing the difference between the injected and extracted amount of gas.
- Service 2: Maintenance of the storage level. There are strict limits under which underground gas stores must be operated, according to the values technically established. In this context, DR resources could help to limit the consumption of customers in the case of achieving the daily storage bounds.
- Service 3. Solution of technical constraints. They may produce overloads in transmission and distribution pipelines, putting the supply to consumers at risk.
Based on previous studies [19], conducted in the Marches region (central Italy), a case study about the balancing of natural gas in the transmission network through DR resources is presented here.
4.1. District Heating Parameters in Italy
The most recent available information regarding the annual production of thermal energy by means of DH facilities in the different regions of Italy is from 2019, and it has been published by the Italian Manager of Energy Services, GSI [60]. According to that source, the annual production of thermal energy by DH facilities fuelled by fossil fuels (mainly natural gas) for each i region is given in Table 2, divided into cogeneration () and only-heat facilities (). DH facilities are available in northern regions of the country. Diversely, southern and central regions such as Abruzzo, Apulia, Basilicata, Calabria, Campania, Sardinia, Molise and Sicily, do not have any DH facility, which means their potential will be zero.
On the other hand, Table 3 shows the thermal energy supplied by DH facilities per sector and region.
By means of these data, the factor is calculated as the rate of produced thermal energy that is consumed by each σ sector within the region i. Values for this factor, calculated by (2), are summarized, for the different regions and sectors, in Table 4.
is the amount of thermal energy supplied to final consumers within the sector σ in the region i, with σ representing the residential, commercial and industrial sectors.
4.2. Evaluation of the Flexibility Potential per Region
The estimation of the flexibility potential of the thermal energy production in DH facilities fueled by natural gas for the whole Italy, per region, considering that DH operators behave as natural gas aggregators, will be calculated by means of the following expression:
where:
- represents the flexibility potential for each i region, given as the amount of thermal energy produced in DH facilities fueled by natural gas that may be shifted from critical to non-critical periods, according to the gas network operator needs for balancing purposes. This variable is measured in GWh/year.
- is the annual amount of thermal energy produced in DH facilities fuelled by natural gas devoted to cogeneration, for each i region. This variable is measured in GWh/year
- is the annual amount of thermal energy produced in DH facilities fuelled by natural gas devoted to only-heat production, for each i region. This variable is measured in GWh/year
- is the share of flexible power for each σ sector as evaluated in [19].
- is the rate of supplied thermal energy by DH facilities, per each i region and each σ sector.
5. Results
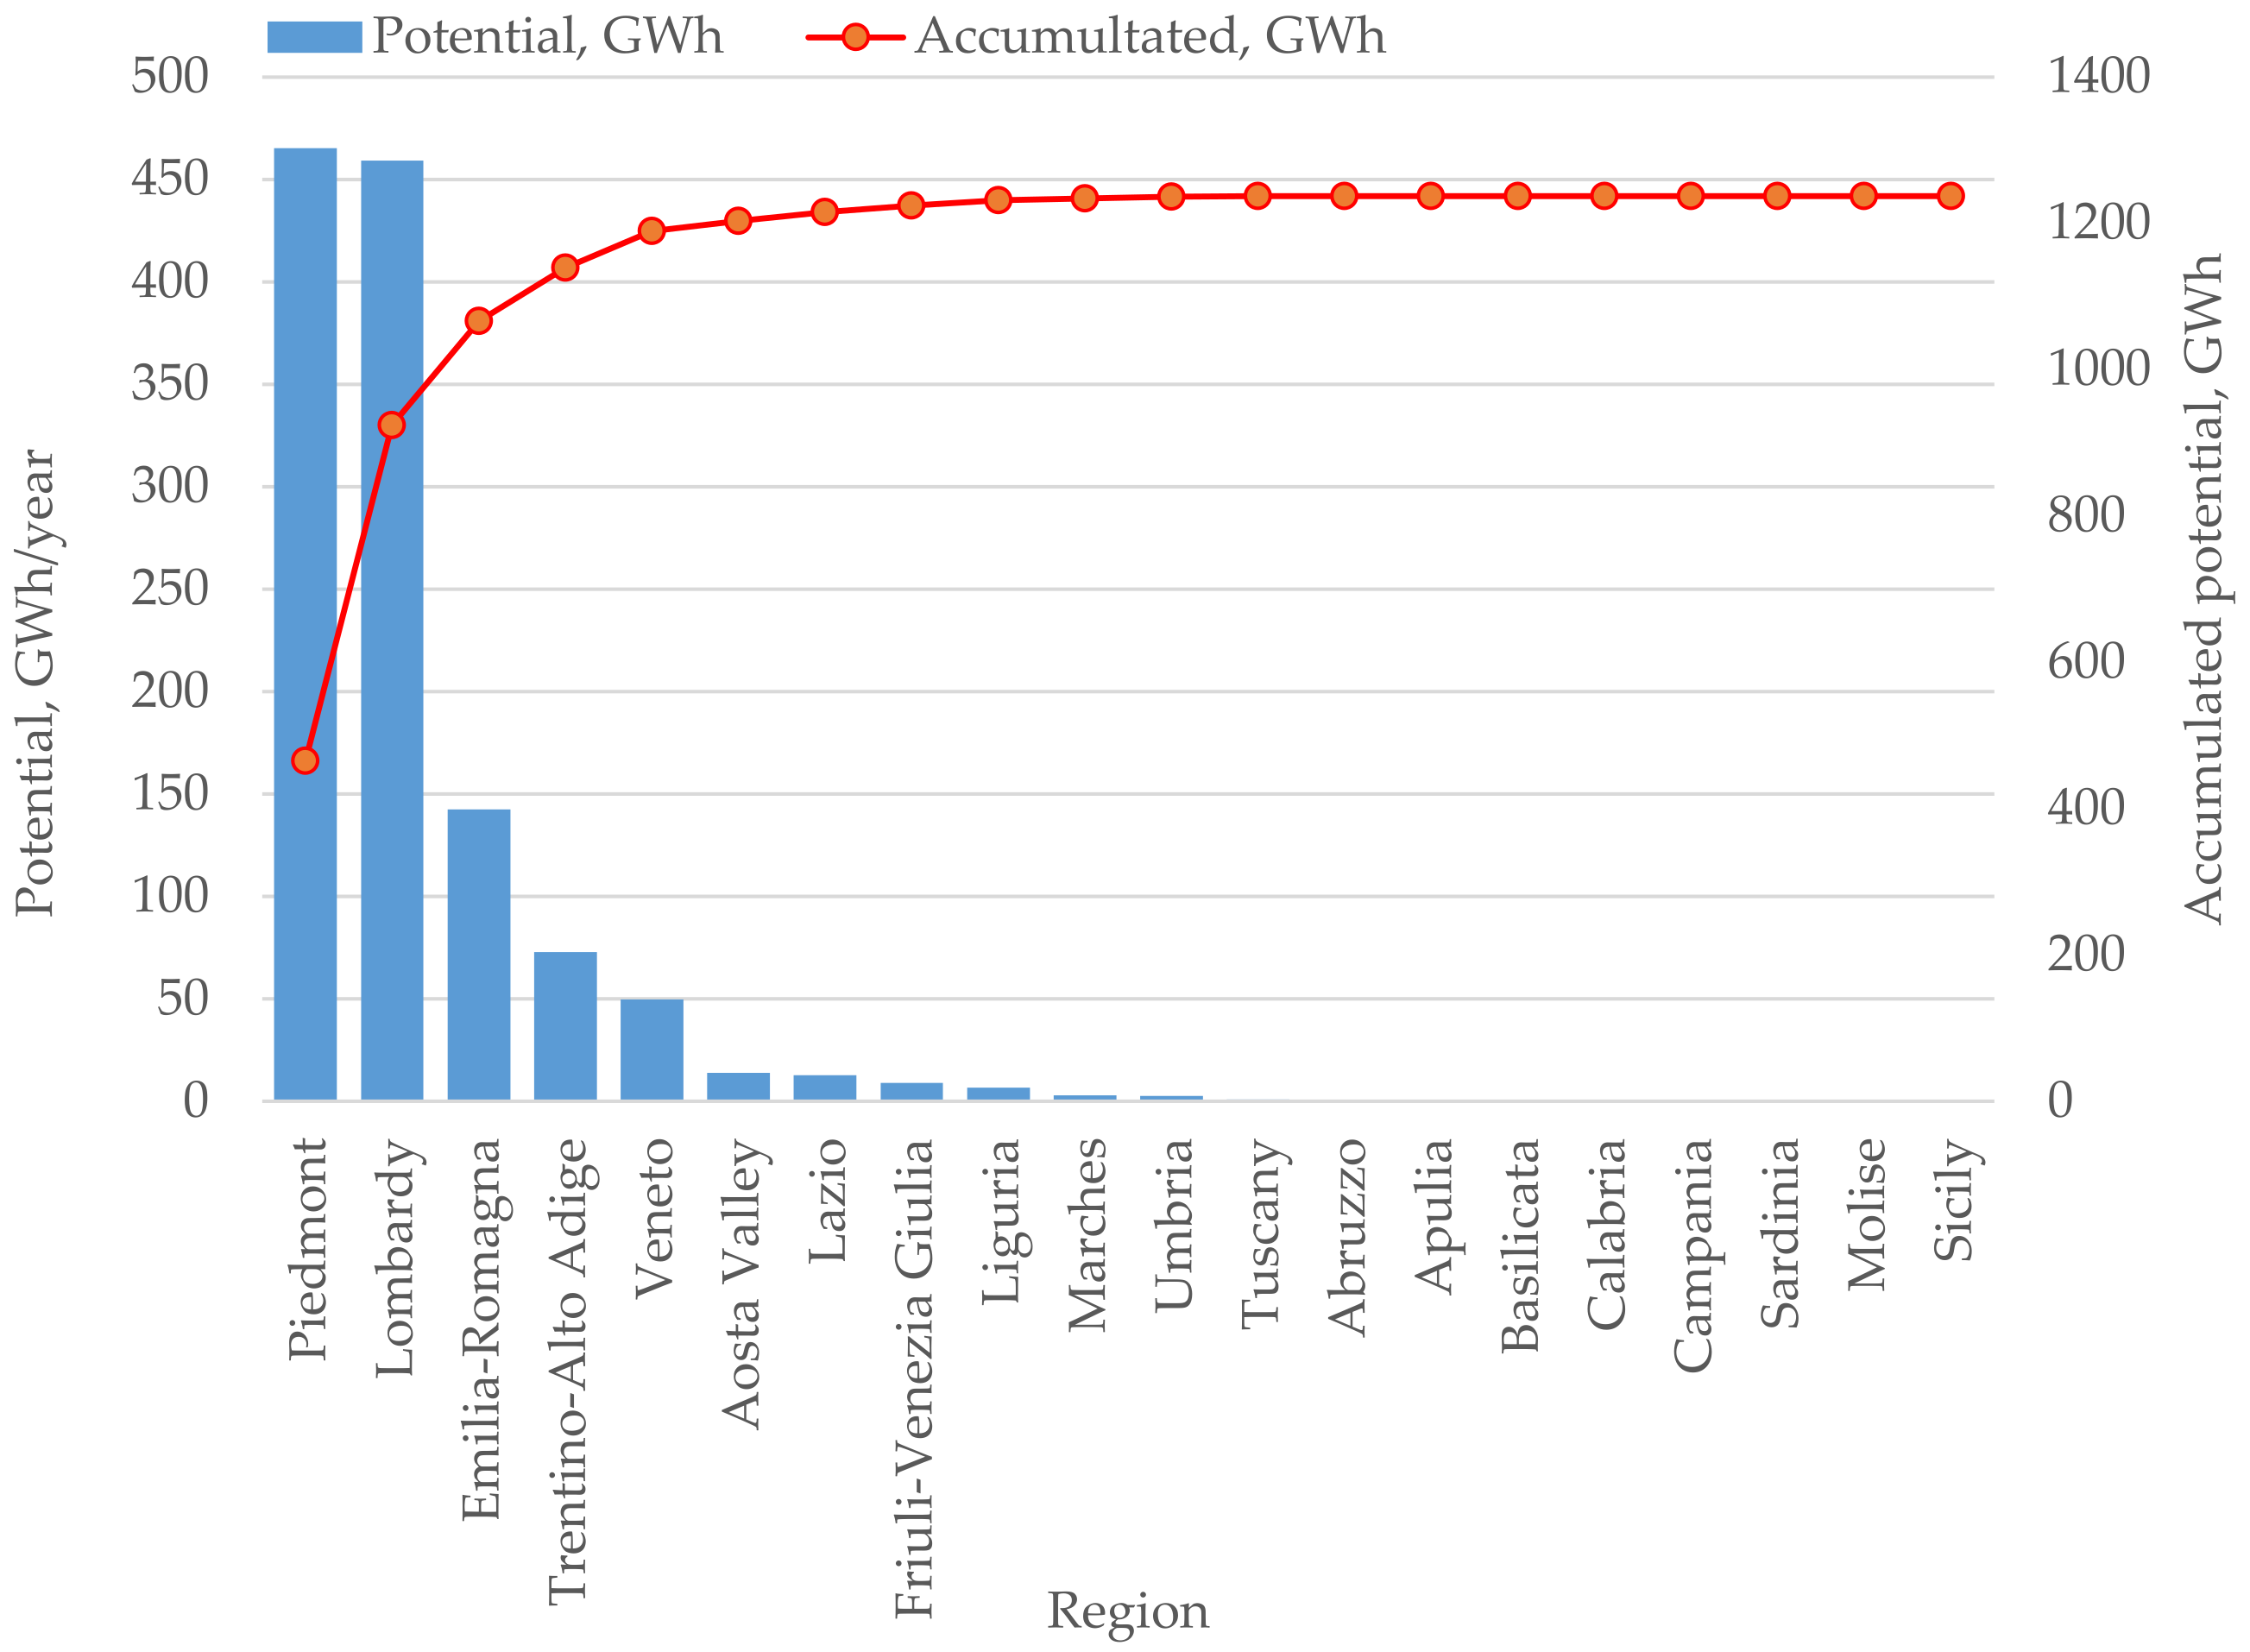
Based on the data mentioned in the previous section and using (2), an estimation of the amount of thermal energy produced by DH facilities that could be shifted by the operators of such infrastructures has been made for each of the Italian regions. Those results are shown in Figure 6.
In general, the industrial sector has a lower impact on DH consumption compared to the commercial and the residential ones. In total, 66% of the thermal energy consumption in regions where DH facilities exist belong to the residential sector, while the industry has a rate lower than 3%. Only in the region of Liguria, the industry has a higher weight with a rate of 40.5%.
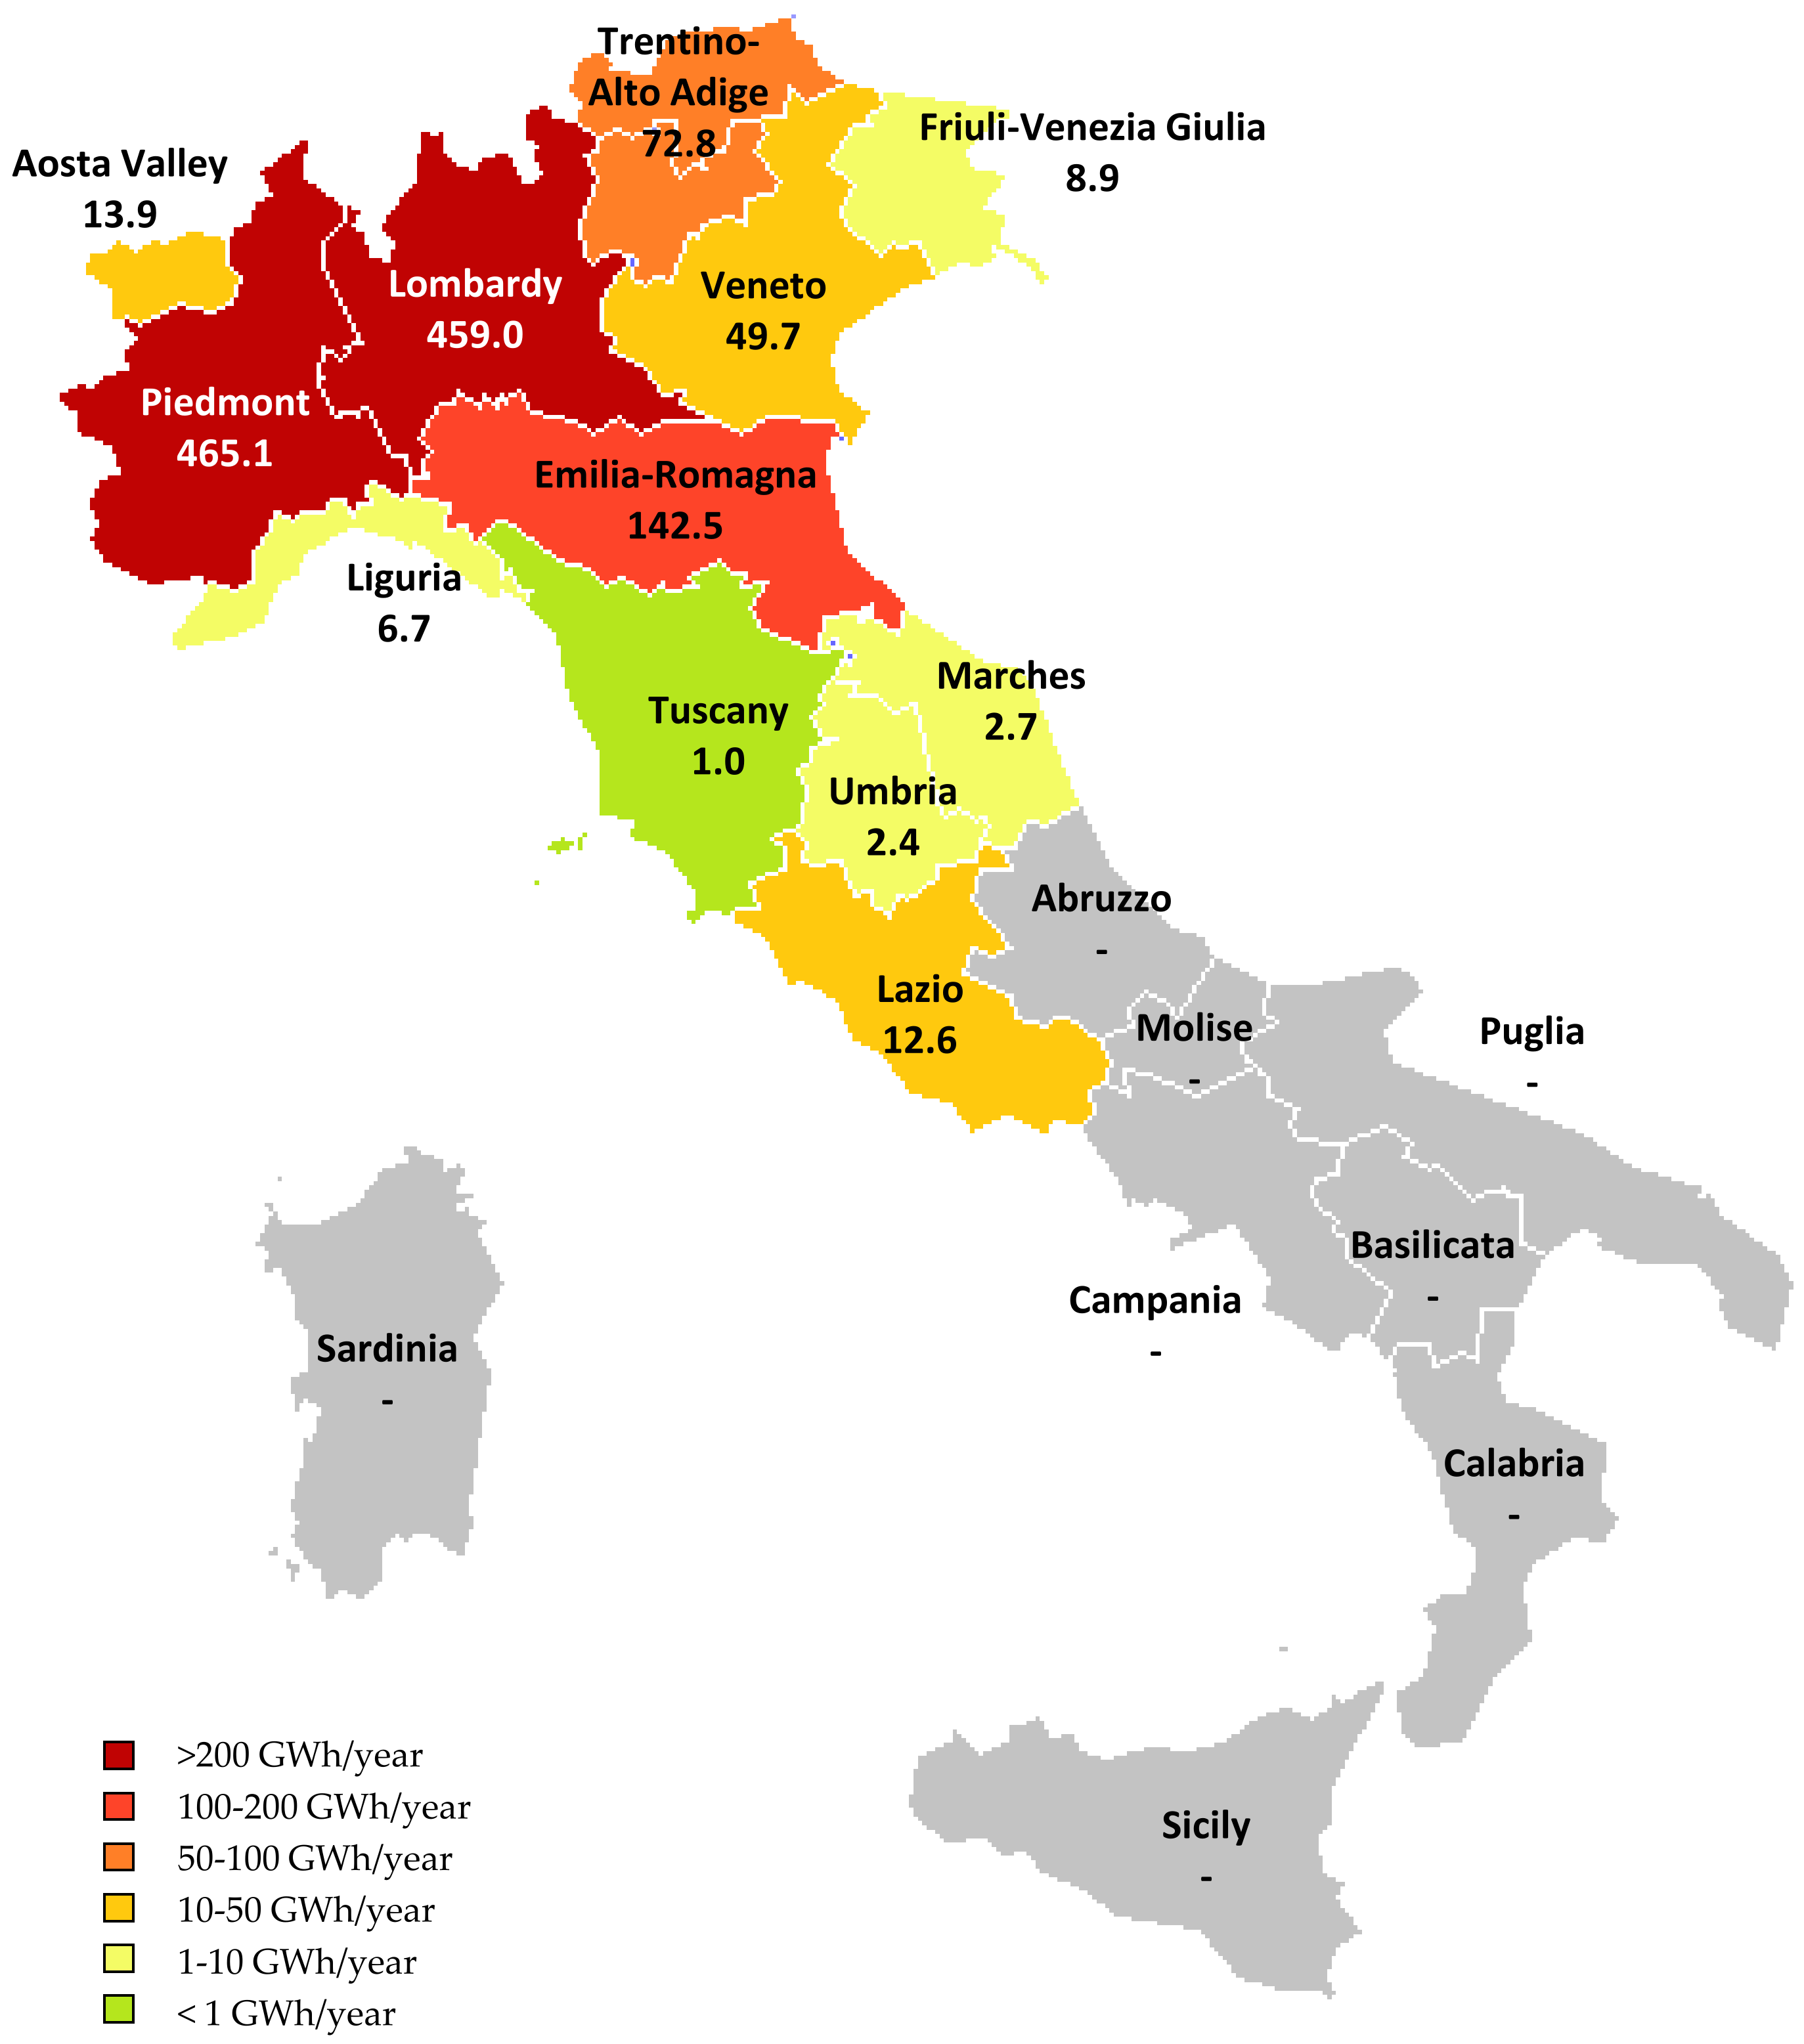
Figure 7 shows the geographical distribution by region of DR resource potential in the natural gas system managed by DHOs, expressed in GWh/year. According to this figure, it can be seen that regions with a higher potential would be those with a higher demand due to an increase of the population and of the commercial activities such as Lombardy and Piedmont. In fact, in these two regions are located the second and the fourth most populated cities of the Italian country: Milan and Turin, respectively [61]. Moreover, the utilization of space heating appliances will also be very intensive, which produces a high consumption of thermal power. Population is also the reason for the high consumption in Lazio due to the high consumption in the city of Rome, where 100% of DH facilities supply the residential sector.
The estimated potential of manageable thermal energy produced in DH systems for the Italian peninsula will be 1237 GWh/year. This means 12.7% of the thermal energy consumption will be provided by DH systems in Italy, which is a significant rate in terms of network operability.
Hypothesis and Limitations
In order to properly interpret the obtained results, the following considerations should be taken into account:
- The flexibility of the different regions has been estimated by considering the rates obtained in a detailed study applied to the region of The Marches. According to that research [19], gas consumers in the studied area have a pattern of consumption that is coincident with the average consumption in that region. Consequently, the obtained results from this extrapolation could be considered representative.
- The values for thermal energy production in DH facilities that have been considered are related to facilities fueled by fossil fuels. Even if some diverse fossil fuels may be used for a minor part of the thermal energy production, most of the primary energy is obtained from natural gas according to [60], so that this approximation could be acceptable for the performed evaluation.
6. Discussion and Conclusions
Energy systems are evolving towards the so-called smart configuration and DR may help to better integrate the different elements in these “intelligent” networks, adjusting the level of consumption to the availability of energy resources in the short term.
DR resources have been successfully used for many years, which has provided major benefits not just in terms of operability but also economic and environmental. However, in spite of the similarities existing between the electricity and natural gas systems, there are few successful experiences of DR applications in the natural gas system. This research has evidenced the large potential that the GSO may use for balancing purposes, which could be provided by DHOs by means of the management of the gas consumption of their facilities. One of the main problems when dealing with DR resources is the dispersion of demand since residential and commercial consumers do not usually have enough entities when considered individually. This fact makes the arising of aggregators essential, who could create larger flexibility packages with enough significance for the GSO in terms of operation.
In line with this idea, a significant contribution of this research is the approach to DH system managers as aggregators of DR resources in natural gas systems. In fact, district heating plants using natural gas as primary fuel may be used for the provision of DR services to the natural gas system if managers reduce or increase their gas consumption when requested by the gas system operator. Therefore, this flexibility would be finally given by customers supplied not by gas but by the steam or hot water produced by the district heating plant. In Europe, district heating systems cover 10% of the energy market, reaching in some countries, such as Finland and Romania, values higher than 60% of their thermal needs. Therefore, this new role of district heating operators may entail a new business opportunity for these kinds of companies while helping in the operation of the natural gas system under a smart grid configuration.
This new role of DHOs has been evaluated for the case of Italy. Thus, the flexibility of thermal energy provided by these kinds of facilities in the different Italian regions has been evaluated based on the case study analyzed by the authors previously in the region of The Marches. Based on that, a potential of 1237 GWh/year (12.7% of the thermal energy consumption provided by DH systems in Italy) has been assessed. The Italian case is a good testing ground for these kinds of activities as the natural gas network in this country is quite well developed in terms of technology and branching on the territory. However, the supply may not be guaranteed on peak periods and the high risk of earthquakes, especially in central areas of the country, may put the natural gas infrastructures at risk. Therefore, the utilization of customers’ flexibility by means of the proper aggregation means may help to solve some of the technical constraints that may appear as a consequence of high demand periods, or even the lack of some pipelines or ancillary facilities.
This research opens the gate to an innovative point of view on the management of natural gas networks by incorporating the provision of DR services by means of DH systems, which could act (as discussed previously) as DR aggregators. There is no doubt that more extensive analyses are necessary, but this could provide some initial evidence of the huge potential that this kind of infrastructure may provide to the natural gas system in terms of operability and efficiency.
Author Contributions
L.M.: conceptualization, methodology, formal analysis, writing—original draft, resources, visualization; M.A.-O.: conceptualization, writing—review and editing, supervision. All authors have read and agreed to the published version of the manuscript.
Funding
This research received no external funding.
Institutional Review Board Statement
Not applicable.
Informed Consent Statement
Not applicable.
Data Availability Statement
Not applicable.
Conflicts of Interest
The authors declare no conflict of interest.
References
- Pepermans, G. European energy market liberalization: Experiences and challenges. Int. J. Econ. Policy Stud. 2019, 13, 3–26. [Google Scholar] [CrossRef]
- Talari, S.; Khajeh, H.; Shafie-khah, M.; Hayes, B.; Laaksonen, H.; Catalao, J.P. Chapter 5: The role of various market participants in blockchain business model. In Blockchain-Based Smart Grids; Academic Press: Amsterdam, The Netherlands, 2020; pp. 75–102. ISBN 978-0-12-817862-1. [Google Scholar]
- Montuori, L.; Alcázar-Ortega, M.; Vargas-Salgado, C.; Mansó-Borrás, I. Enabling the natural gas system as smart infrastructure: Metering technologies for customer applications. In Proceedings of the 2020 Global Mosharaka Congress on Electrical Engineering (GMC-ElecEng 2020), Valencia, Spain, 4–6 September 2020; Volume 1, pp. 96–100. [Google Scholar]
- ALiero, M.S.; Qureshi, K.N.; Pasha, M.F.; Jeon, G. Smart Home Energy Management Systems in Internet of Things networks for green cities demands and services. Environ. Technol. Innov. 2021, 22, 101443. [Google Scholar] [CrossRef]
- Zeinali, M.; Thompson, J.; Khirallah, C.; Gupta, N. Evolution of home energy management and smart metering communications towards 5G. In Proceedings of the 8th International Conference on the Network of the Future (NOF), London, UK, 22–24 November 2017. [Google Scholar]
- Montuori, L.; Alcázar-Ortega, M.; Mansó-Borrás, I.; Vargas-Salgado, C. Communication technologies in smart grids of natural gas: New challenges. In Proceedings of the 2020 Global Mosharaka Congress on Electrical Engineering (GMC-ElecEng 2020), Valencia, Spain, 4–6 September 2020. [Google Scholar]
- Kochanski, M.; Korczak, K.; Skoczkowski, T. Technology Innovation System Analysis of Electricity. Energies 2020, 13, 916. [Google Scholar] [CrossRef] [Green Version]
- European Commission, 2012/148/EU: Commission Recommendation of 9 March 2012 on preparations for the roll-out of smart metering systems. Brussels 2012, 73, 9–22.
- Carmichael, R.; Gross, R.; Hanna, R.; Rhodes, A.; Green, T. The Demand Response Technology Cluster: Accelerating UK residential consumer engagement with time-of-use tariffs, electric vehicles and smart meters via digital comparison tools. Renew. Sustain. Energy Rev. 2021, 139, 110701. [Google Scholar] [CrossRef]
- Helman, U. Chapter 10-Demand response in the US wholesale markets: Recent trends, new models, and forecasts. In Variable Generation Flexible Demand; Academic Press: Cambridge, MA, USA, 2021; pp. 211–257. ISBN 9780128238103. [Google Scholar]
- Marwan, M.; Kamel, F. Demand Side Response to Mitigate Electrical Peak Demand in Eastern and Southern Australia. Energy Procedia 2011, 12, 133–142. [Google Scholar] [CrossRef] [Green Version]
- Grid, N. Demand Side Response (DSR). Available online: https://www.nationalgrid.com/uk/gas-transmission/balancing/demand-side-response-dsr (accessed on 11 July 2021).
- Whitehouse, S.S. S.2649-Energy Infrastructure Demand Response Act of 2018. In Proceedings of the 115th Congress (2017–2018), Washington, DC, USA, 4 November 2018. [Google Scholar]
- Lindeberg, E.; Per, B.; Torsæter, M.; Grimstad, A.-A. Aliso Canyon Leakage as an Analogue for Worst Case CO2 Leakage and Quantification of Acceptable Storage Loss. Energy Procedia 2017, 114, 4279–4286. [Google Scholar] [CrossRef]
- Olive, L.T. A Hitchhiker’s Guide to Gas Demand Response; NERA Economic Consulting: Boston, MA, USA, 2019. [Google Scholar]
- Consolidated Edison Company of New York, Inc. Gas Demand Response-Report on Pilot Performance-2019/2020; ConEdison: New York, NY, USA, 2020. [Google Scholar]
- Speake, A.; Donohoo-Vallett, P.; Wilson, E.; Chen, E.; Christensen, C. Residential Natural Gas Demand Response Potential during Extreme Cold Events in Electricity-Gas Coupled Energy Systems. Energies 2020, 13, 5192. [Google Scholar] [CrossRef]
- Energy Information Administration (EIA). Northeastern Winter Energy Alert. Energy Market Alerts. Available online: https://www.eia.gov/special/alert/east_coast/ (accessed on 27 June 2021).
- Montuori, L.; Alcázar-Ortega, M. Demand response strategies for the balancing of natural gas systems: Application to a local network located in The Marches (Italy). Energy 2021, 225, 120293. [Google Scholar] [CrossRef]
- Montuori, L.; Alcázar-Ortega, M.; Álvarez-Bel, C. Methodology for the evaluation of demand response strategies for the management of natural gas systems. Energy 2021, 234, 121283. [Google Scholar] [CrossRef]
- European Commission. Directive 2012/27/EU of the European Parliament and of the Council. In Official Journal of the European Union; EU Publications Office: Luxembourg, 2012. [Google Scholar]
- Bloomquist, R.G. Geothermal space heating. Geothermics 2003, 32, 513–526. [Google Scholar] [CrossRef] [Green Version]
- Frederiksen, S.; Werner, S. District Heating & Cooling; Studentliteratur: Lund, Sweeden, 2013; pp. 841–848. ISBN 9789144085302. [Google Scholar]
- Werner, S. International review of district heating and cooling. Energy 2017, 137, 617–631. [Google Scholar] [CrossRef]
- Karamanos, P. Cogeneration ad district heating: Constraints and opportunities. J. Energy Dev. 1997, 22, 245–274. [Google Scholar]
- Transparency Market Research. District Heating and Cooling Market-Global Industry Analysis, Size, Share, Growth Trends and Forecast 2016–2024; TMR PvT Ltd.: Albany, NY, USA, 2017. [Google Scholar]
- Lockport Cave, The Holly Manufacturing Company 1858–1916. Available online: https://lockportcave.com/holly-manufacturing/ (accessed on 16 July 2021).
- Iken, J. Renaissance of district heating in the US. Sun Wind. Energy 2010, 10, 210–2013. [Google Scholar]
- Ulloa, P. Potential for Combined Heat and Power and District Heating and Cooling from Waste to Energy Facilities in the U.S.-Learning from the Danish Experience. Master’s Thesis, Columbia University, New York, NY, USA, 2007. [Google Scholar]
- Japan Heat Supply Business Association. District Heating & Cooling Overview. Available online: https://www.jdhc.or.jp/english/en_profile/ (accessed on 22 September 2021).
- International Energy Agency. Japan 2021: Energy Policy Review; IEA Publications: Paris, France, 2021.
- Tsingua University & International Energy Agency. District Energy Systems in China: Options for Optimization and Diversification; IEA Publications: Paris, France, 2017. [Google Scholar]
- Asian Development Bank. Solar District Heating in the People’s Republic of China. Status and Development Potential; ADB: Mandaluyong, Filipinas, 2019. [Google Scholar]
- Xia, J. Low carbon district heating representative from China. In Proceedings of the 17th Symposium for DHC, Nottingham, UK, 6–9 September 2021. [Google Scholar]
- Korea Energy Agency. District Energy 2018 Handbook; KEA: Ulsan, Korea, 2019. [Google Scholar]
- Kim, J.-H.; Kim, S.-Y.; Yoo, S.-H. Economic effects of individual heating system and district heating system in South Korea: An input-output analysis. Appl. Sci. 2020, 10, 5037. [Google Scholar] [CrossRef]
- DESMI. Energy Efficient Pumps and Pump Solutions for District Energy; Desmi: Nørresundby, Denmark, 2017. [Google Scholar]
- Barilli, R. Hera Group development in District Heating: Track records and perspectives. In Proceedings of the 34th Euroheat & Power Congress, Venice, Italy, 25–26 May 2009. [Google Scholar]
- Bennink, D.; Benner, J. District Heating in The Netherlands; CE Delft: Delft, The Netherlands, 2009. [Google Scholar]
- Eurostat. Electricity and Heat Statistics. Available online: https://ec.europa.eu/eurostat/statistics (accessed on 28 June 2021).
- Euroheat & Power. District Energy in Finland. Available online: https://www.euroheat.org/knowledge-hub/district-energy-finland/ (accessed on 21 July 2021).
- Official Statistics of Finland. Production of Electricity and Heat; OSF: Helsinki, Finland, 2021; ISSN 1798-5099. [Google Scholar]
- European Commission. Final National Energy and Climate Plan for Italy; European Parliament: Brussels, Belgium, 2020. [Google Scholar]
- Euroheat & Power. District Energy in Italy. Available online: https://www.euroheat.org/knowledge-hub/district-energy-italy/ (accessed on 21 July 2021).
- Bagaini, A.; Croci, E.; Molteni, T.; Pontoni, F.; Vaglietti, G. Valutazione Economica dei Benefici Sociali Dello Sviluppo del Teleriscaldamento in Italia; Università Bocconi, Centre for Geography, Resources, Environment, Energy and Networks: Milan, Italy, 2020. [Google Scholar]
- Gaudio, G. 1982–2012: 30 Anni di Teleriscaldamento a Tornio; IREN Energia: Turin, Italy, 2012. [Google Scholar]
- Zosseder, K.; Vranjes, A.; Chicco, J.; Singh, R.M.; Goetzl, G. Geothermal Heating and Cooling Networks for Green and LIvable Urban Transformations-Part II. Eur. Now J. 2021. Available online: https://www.europenowjournal.org/2021/05/10/geothermal-heating-and-cooling-networks-for-green-and-livable-urban-transformations-part-ii/ (accessed on 15 September 2021).
- Gestore dei Servizi Energetici SpA. Teleriscaldamento e Teleraffrescamento 2017; GSE: Roma, Italy, 2018. [Google Scholar]
- Teso, L.; Mora, T.D.; Peron, F.; Romagnoni, P. District Heating City of Turin. Year and duration of the renovation: 1982-nowadays. In IEA-Annex 75-Cost-Effective Building Renovation ad District Level Combining Energy Efficiency and Renewables; IEA: Paris, France, 2019. [Google Scholar]
- IREN Group. Strategia: Scenario e Pilastri Strategici. Available online: https://www.gruppoiren.it/strategia (accessed on 22 July 2021).
- A2A Ambiente. Il Sistema Ambiente Energia di Brescia-Il Teleriscaldamento. 2020. Available online: https://a2aambiente.eu/economia-circolare/sistema-ambiente-energia-brescia/teleriscaldamento (accessed on 23 July 2021).
- A2A Calore e Servizi. Milano, Tutti I Numeri Del Teleriscaldamento. Available online: https://www.a2acaloreservizi.eu/teleriscaldamento/impianti-e-reti/area-milano (accessed on 23 July 2021).
- Rodríguez-García, J.; Alcázar-Ortega, M.; Carbonell-Carretero, J.; Álvarez-Bel, C.; Pesantez, P. Análisis Para la Implementación de Redes Inteligentes en Ecuador; C.A.B.: Valencia, Spain, 2016. [Google Scholar]
- Euroheat & Power. District Heating in Buildings; E&P: Brussels, Belgium, 2011. [Google Scholar]
- Montuori, L.; Vargas, C.; Alcázar-Ortega, M. Impact of the throat sizing on the operating parameters in an experimental fixed bed gasifier: Analysis, evaluation and testing. Renew. Energy 2015, 83, 615–625. [Google Scholar] [CrossRef] [Green Version]
- World Nuclear. Nuclear Power in Russia. Available online: http://www.world-nuclear.org/information-library/country-profiles/countries-o-s/russia-nuclear-power.aspx (accessed on 17 April 2017).
- Sugiyama, K.; Shimazu, Y.; Atsushi, K.; Ishitani, N. Nuclear district heating: The Swiss experience. Nippon. Genshiryoku Gakkai-Shi 2006, 48, 119–124. [Google Scholar] [CrossRef]
- Snam Rete GAs, S.p.A. Ten-Year Development Plan of the Natural Gas Transmission Network 2014–2023; SNAM: San Donato, Italy, 2013. [Google Scholar]
- Dolce, M.; Giovinazzi, S.; Iervolino, I.; Nigro, E.; Tang, A. La Gestione Dell’emergenza per i Servizi Essenziali e le Lifelines a Seguito Dell’evento de L’Aquila; Università degli Studi di Napoli “Federico II”: Naples, Italy, 2016. [Google Scholar]
- Verme, M.; Lipari, D.; Liberatore, P. Teleriscaldamento e Teleraffrescamento 2019. In Diffusione Delle Reti ed Energia Fornita in Italia; Gestore dei Servizi Energetici S.p.A.: Roma, Italy, 2021. [Google Scholar]
- Tuttitalia. Comuni Italiani Per Popolazione (Istituto Nazionale di Statistica). Available online: https://www.tuttitalia.it/comuni/popolazione/ (accessed on 25 July 2021).
Figure 1.
Thermal energy rate produced by district heating in Europe, per country (Source: [40]).
Figure 1.
Thermal energy rate produced by district heating in Europe, per country (Source: [40]).

Figure 2.
Number of municipalities per region served by the DH network in Italy (Source: [48]).
Figure 2.
Number of municipalities per region served by the DH network in Italy (Source: [48]).

Figure 3.
District heating heat volume (a) and thermal power installed (b) in each Italian region (Source: [48]).
Figure 3.
District heating heat volume (a) and thermal power installed (b) in each Italian region (Source: [48]).

Figure 4.
District heating scheme.

Figure 5.
Activities of the aggregator.

Figure 6.
Gas demand response potential in district heating facilities operating as aggregators, per region (GWh/year).
Figure 6.
Gas demand response potential in district heating facilities operating as aggregators, per region (GWh/year).

Figure 7.
Geographical distribution of the gas demand response potential in district heating facilities operating as aggregators (GWh).
Figure 7.
Geographical distribution of the gas demand response potential in district heating facilities operating as aggregators (GWh).


Table 1.
Most significant district heating facilities in the United States (Source: Environmental and Energy Study Institute-‘What is District Energy?’ September 2011).
Table 1.
Most significant district heating facilities in the United States (Source: Environmental and Energy Study Institute-‘What is District Energy?’ September 2011).
| Location | DHC Facilities | Characteristics |
|---|---|---|
| 1. St. Paul, MN | Central Business District | It provides heating to more than 80% of St. Paul’s central business district and cooling to more than 60% of the central business district. |
| 2. Houston, TX | Texas Medical left | The largest campus district energy system in the United States that serves the largest medical complex with 6800 patients. |
| 3. Boston, MA | Downtown Boston | DH that uses the steam from a Cambridge power plant to downtown Boston. |
| 4. Detroit, MI | Downtown Detroit | The CHP facility that can generate up to 68 megawatts of electricity and heat over 140 businesses from waste (3300 tons of municipal solid waste per day). |
| 5. Ithaca, NY | Cornell University | In December 2009, Cornell University upgraded its central heating plant with a cogeneration system that cut its greenhouse gas emissions by over 20%. |
| 6. Princeton, NJ | Princeton University | A district energy to provide electricity, steam, and chilled water to power, heat, and cool the 150+ buildings on the Princeton University campus. Princeton’s plant reaches about 80% efficiency. The plant can switch from natural gas to biodiesel when natural gas demand and prices are high. |
| 7. Austin, TX | University of Texas | UT Austin uses CHP and district energy to provide 100 percent of power, heating, and cooling for the 200 buildings on its campus. The campus has not been a load to the Texas electrical grid since 1929. |
| 8. New Orleans, LA | New Orleans Medical left and Downtown | At full build-out, the NORMC District Energy left will have the capability to produce 33,000 tons of chilled water and provide air conditioning to over 12 million square feet of commercial property in the NORMC district and downtown New Orleans. |
| 9. Battle Creek, MI | Battle Creek Veteran’s Affairs Medical left | Nexterra Systems Corp. announced in September 2011 that it signed a $6.9 million contract to deliver a biomass gasification system that will provide heat and power for the US Department of Veterans Affairs Medical left (VAMC) in Battle Creek, Michigan. |
| 10. Cleveland, OH | Downtown Cleveland | Cleveland Thermal’s district energy network includes two plants on opposite ends of Downtown Cleveland, which provide 30 percent of the heating and cooling needs of the city’s business district. |
| 11. Seattle, WA | Central Business District - | Seattle Steam, a privately-owned utility, provides district heat to approximately 200 buildings in Seattle’s Central Business District and First Hill neighborhoods. |
| 12. Fairbanks, AK | University of Alaska Fairbanks | The central utilities system at the University of Alaska Fairbanks provides steam, electricity, and chilled water to 7000 students and over 3 million square feet of facilities. |
| 13. Muncie, IN | Ball State University | Ball State University is in the process of building the nation’s largest closed-loop geothermal energy system to replace its four-aging coal-fired boilers. |
| 14. Iowa City, IA | University of Iowa | The University of Iowa fuels its district energy system with oat hulls (a by-product of cereal-making from the neighboring Quaker Oat facility) that are co-fired with coal and natural gas. |
| 15. Albuquerque, NM | University of New Mexico | The University of New Mexico uses CHP and district energy to provide power, heating, and cooling for its 8 million square feet of facilities. |
| 16. Columbia, MO | University of Missouri | In mid-2012, the University of Missouri completed a large biomass district energy system project that will use 100,000 tons of regionally supplied biomass per year. |
| 17. Los Angeles, CA | University of California LA | The UCLA cogeneration plant is fueled by natural gas and seven percent landfill gas. |
Table 2.
Thermal energy produced by district heating facilities fuelled by fossil fuels (mainly natural gas), per region and type of facility (cogeneration and only-heat), in GWh [60].
Table 2.
Thermal energy produced by district heating facilities fuelled by fossil fuels (mainly natural gas), per region and type of facility (cogeneration and only-heat), in GWh [60].
| Region | Thermal Production by Cogeneration Facilities, , GWh/Year | Thermal Production by Only Heat Facilities, , GWh/Year |
|---|---|---|
| Emilia-Romagna | 629 | 367 |
| Friuli-Venezia Giulia | 34 | 28 |
| Lazio | 60 | 28 |
| Liguria | 20 | 59 |
| Lombardy | 2134 | 1197 |
| Marches | 6 | 13 |
| Piedmont | 2672 | 612 |
| Tuscany | 3 | 4 |
| Trentino-Alto Adige | 282 | 248 |
| Umbria | 16 | 1 |
| Aosta Valley | 34 | 63 |
| Veneto | 195 | 155 |
| Total | 6085 | 2775 |
Table 3.
Thermal energy supplied by district heating facilities, per region and sector, in GWh [60].
Table 3.
Thermal energy supplied by district heating facilities, per region and sector, in GWh [60].
| Region | Residential | Commercial | Industrial |
|---|---|---|---|
| Emilia-Romagna | 516 | 468 | 3 |
| Friuli-Venezia Giulia | 17 | 54 | - |
| Lazio | 68 | - | - |
| Liguria | 18 | 26 | 30 |
| Lombardy | 2437 | 1080 | 145 |
| Marches | 7 | 7 | - |
| Piedmont | 2244 | 574 | 37 |
| Tuscany | 132 | 30 | 3 |
| Trentino-Alto Adige | 711 | 560 | 57 |
| Umbria | 2 | 10 | - |
| Aosta Valley | 76 | 53 | - |
| Veneto | 227 | 118 | 4 |
| Total | 6455 | 2980 | 279 |
Table 4.
Rate of supplied thermal energy by district heating facilities, per region and sector.
| Region | Residential | Commercial | Industrial |
|---|---|---|---|
| Emilia-Romagna | 52.3% | 47.4% | 0.3% |
| Friuli-Venezia Giulia | 23.9% | 76.1% | 0.0% |
| Lazio | 100.0% | 0.0% | 0.0% |
| Liguria | 24.3% | 35.1% | 40.5% |
| Lombardy | 66.5% | 29.5% | 4.0% |
| Marches | 50.0% | 50.0% | 0.0% |
| Piedmont | 78.6% | 20.1% | 1.3% |
| Tuscany | 80.0% | 18.2% | 1.8% |
| Trentino-Alto Adige | 53.5% | 42.2% | 4.3% |
| Umbria | 16.7% | 83.3% | 0.0% |
| Aosta Valley | 58.9% | 41.1% | 0.0% |
| Veneto | 65.0% | 33.8% | 1.1% |
| Total | 66.5% | 30.7% | 2.9% |
Publisher’s Note: MDPI stays neutral with regard to jurisdictional claims in published maps and institutional affiliations. |
© 2021 by the authors. Licensee MDPI, Basel, Switzerland. This article is an open access article distributed under the terms and conditions of the Creative Commons Attribution (CC BY) license (https://creativecommons.org/licenses/by/4.0/).
Share and Cite
MDPI and ACS Style
Montuori, L.; Alcázar-Ortega, M. District Heating as Demand Response Aggregator: Estimation of the Flexible Potential in the Italian Peninsula. Energies 2021, 14, 7052. https://0-doi-org.brum.beds.ac.uk/10.3390/en14217052
AMA Style
Montuori L, Alcázar-Ortega M. District Heating as Demand Response Aggregator: Estimation of the Flexible Potential in the Italian Peninsula. Energies. 2021; 14(21):7052. https://0-doi-org.brum.beds.ac.uk/10.3390/en14217052
Chicago/Turabian StyleMontuori, Lina, and Manuel Alcázar-Ortega. 2021. "District Heating as Demand Response Aggregator: Estimation of the Flexible Potential in the Italian Peninsula" Energies 14, no. 21: 7052. https://0-doi-org.brum.beds.ac.uk/10.3390/en14217052
Note that from the first issue of 2016, this journal uses article numbers instead of page numbers. See further details here.