
Communicating the Values and Benefits of Home Solar Prosumerism


1
Ciberimaginario Group, Department of Communication and Sociology, University Rey Juan Carlos, 28933 Madrid, Spain
2
Department of Economics, Universidad de Alcalá, 28802 Madrid, Spain
*
Author to whom correspondence should be addressed.
Energies 2022, 15(2), 596; https://0-doi-org.brum.beds.ac.uk/10.3390/en15020596
Submission received: 25 November 2021
/
Revised: 5 January 2022
/
Accepted: 12 January 2022
/
Published: 14 January 2022
(This article belongs to the Special Issue Distributed Energy Resources for the Development of the Energy Horizon 2050)
Abstract
:Clearly and accurately communicating the economic, environmental, and social benefits of solar PV prosumerism poses significant challenges. Previous research shows that government policies and public engagement campaigns can positively impact solar prosumerism; however, little is known about the quality and accuracy of information exchanged between rooftop solar installers and potential prosumers. This study addresses part of this gap with a mixed methods approach. First, a multimodal discourse analysis of installation proposals from seven home solar installers in Madrid shows accurate and reasonable financial benefits alongside incongruent social and environmental benefits. Second, the calculated efficiency of the seven proposed solar installations is compared with the efficiency of four different PVSC solar arrays using actual load and generation profiles. The results show that (i) the high variability of actual household demand on the minute-by- minute level significantly decreases self-consumption rate and profitability in comparison with the rates estimated using hourly or monthly, and (ii) the grouping of households into solar communities should significantly increase self-consumption and profitability. Therefore, using minute by minute time series in home solar estimations would reveal an added value and social benefit that is commonly overlooked. We conclude with recommendations for future research and multimodal communication campaigns that balance benefits of individual prosumerism and community solar.
1. Introduction
The touchstone of this study is the Spanish adage, ‘El tiempo cura más que el sol’ (time cures more than the sun). The adage asks us to weigh the curative values of time and sunlight, two common remedies for physical and emotional wounds. Various ‘cures’ have been associated with solar energy during this pivotal moment of COVID-19 pandemic, climate crisis, and the so-called ‘green recovery’. On the broad scale, the deployment of utility scale solar is a lynchpin of the energy transition, with some models showing that achieving net zero will call for an eight-fold increase in installed solar capacity between 2020 (821 TWh) and 2030 (6970 TWh) [1]. Specific national targets for decarbonization are also reliant on utility scale solar [2]. Meanwhile, governments are banking on contributions from individual citizens, with small scale solar and rooftop installations promising individual prosumers and energy communities various economic, social, and environmental benefits [3]. Clearly and accurately communicating these potential benefits poses significant challenges, especially in relation to the unintuitive time variables often used to calculate the benefits of small scale solar.
Previous research has proven that solar prosumerism offers various attractive benefits, yet many of these studies are focused on the United States or northern European countries [4,5,6,7,8]. We maintain that calculating and communicating the potential benefits of home solar installations is especially timely and relevant in Spain, which leads all EU nations with highest accumulated global irradiation, with an average of 1640 kWh/m2 on its horizontal surface [9], and the largest land area highly suitable for solar photovoltaic (PV) installations [10]. Government incentives and top-down energy policies, such as the ‘Law of self-consumption’ have been cited as drivers of Spain’s current rooftop revolution. Yet many questions about the impulse and momentum of the recent surge in small scale installations remain. How do small to medium enterprises and renewable energy cooperatives signal different time frames, including the weight of short-term and long-term benefits to potential prosumers? How can potential financial benefits be supplemented with environmental and social benefits? How might these different communication choices impact public discourse about the timing of energy transitions and the broader EU objectives for grid decentralization, home energy efficiency, and 55% reduction in greenhouse gas emissions by 2030?
This article provides initial answers through a systemic analysis of seven home installation proposals. The proposals offer distinct variables for time (e.g., monthly electricity bills, annual returns, etc.) and various nonfinancial benefits or ‘cures’. These include personalized figures suggesting the installation is equivalent to a certain number of kilometers driven, CO2 emissions avoided, or trees planted. Again, the focus of this analysis is less about the results than the types of information and framings presented to potential prosumers.
To offer clearer context for the messages, frames, and rhetorical strategies surrounding photovoltaic self-consumption (PVSC) proposals, we supplement our qualitative research with a quantitative study using time series data for different household configurations. We calculate the potential minute by minute and hourly efficiency rates for four potential solar installations in Madrid, which are sized according to the monthly averages of daily demand curves. The results show economic benefits and self-consumption rates are highly dependent on the time frames selected. Furthermore, aggregating time to hourly or monthly averages, as seems to be the common practice among solar PV installers, can lead to exaggerated benefits.
While the parameters of our study are fixed on one geographic location, our mixed methods results contribute to the broader field of energy related social science and humanities research [11], especially studies of how certain kinds of online interventions can help solar installers reach a broader segment of the population, build trust, and encourage more proactive consumer behavior [12]. More specifically, our research contributes to the recent studies of how tailored communication campaigns about solar might motivate homeowners to invest in rooftop installations [13,14,15]. Beyond enticing individual prosumers, communication scholars are also examining how rooftop solar programs might build prosocial behaviors and contribute to energy democracy [16]. Finally, analysis of the different communication practices regarding home solar, self-consumption, and prosumerism also adds to broader conversations about how individual actions and citizen agency relate to policy decisions, market forces, and technological innovations [17,18].
For framing the study, Section 2 provides a brief background of solar PV policy in Spain and previous research on energy related media campaigns. Section 3 outlines our qualitative and quantitative methods. Section 4 provides the results of the multimodal discourse analysis of the seven installation proposals and then results of the real-time efficiency study using minute by minute, hourly, and monthly time series data. Finally, in the discussion of Section 5, we make recommendations for further research on specific communication practices related to PVSC and especially studies of how community solar might further increase individual and collective benefits.
2. Background
2.1. Energy Policy and Solar PV in Spain
This section provides a review of Spanish renewable energy policy and the most recent changes related to “solar prosumerism” and “photovoltaic self-consumption” (PVSC), two terms which we use interchangeably, as is common in recent literature on self-consumption in Spain [19,20].
In 1998, Royal Decree (RD) 2818/1998 created a system of Feed-In Tariffs (FIT) for solar PV and the Plan for the Promotion of Renewable Energies (RD 436/2004) continued to encourage development. By 2005, 26 MW of solar PV capacity had been installed. Wind and solar capacity in Spain ramped up after 2005 and then spiked after a RD 661/2007 offered favorable FIT for solar PV developers. A “gold-rush-like situation for investors” [21] ensued after 2007, leading to the development of many solar PV plants or “solar orchards”. However, the FIT mechanism created by RD 661/2007 lacked the agility to reduce renumeration after the target power was exceeded. In addition to the tariff scheme, RD 661/2007 failed to set a quota and did not accurately differentiate between targets for large scale solar plants and small-scale installations. This loophole had allowed utility scale installations to split larger installations into connected solar parks and thereby achieve the highest feed-in tariffs [22]. One installation initiated by RD 661/2007 obtained 0.44 €/kWh for solar PV [9], which was not exceptional at the time. However, during a recent auction, solar PV installers bid an average price of € 0.02447/kWh, which is 80% lower than the average price paid to solar projects in the 2017 auction [23].
Despite the global economic crisis of 2008, solar PV installations in Spain continued to climb [24]. In 2007, newly installed solar PV capacity in Spain reached 544 MW [25]. The next year, 2008, Spain led the world in solar PV installations, with 2708 MW installed [24]. The renewable energy renumeration system proved unsustainable. A tariff deficit—the discrepancy between government spending on subsidies and earnings from electricity taxes and fees—reached record highs.
The Spanish government felt they had no choice but to strip incentives for future solar orchards and even reverse the existing FIT agreements for utility scale PV [21]. In 2011, a shift from a Socialist to a Conservative government delivered the “final blow to the renewable support scheme” [26] p. 6. In 2012, all subsidies for new renewable energy development in Spain were stripped by Royal Decree-Law (RD-L) 1/2012. The following year, RD-L 9/2013 eliminated premium tariffs and reorganized the renumeration system. Then, RD 413/2014 significantly reduced renumeration and incentives for new and existing solar. Finally, RD 900/2015, the infamous “sun tax” [“impuesto al sol”] penalized self-consumption for utility scale and industrial scale installations and eliminated any residential renumeration. Homeowners who had installed solar panels could still use their own generated power and send it to the grid (albeit without compensation). Businesses with rooftop solar would be charged a fee to consume the electricity they produced. RD 900/2015 also increased the bureaucratic and administrative red tape required for new installations, making Spain “one of the most restrictive regulatory systems of any EU member state” [27] p. 784. Following the boom of 2005 to 2010 came a bust around 2012. The reversals and lack of stable regulation created an unattractive market for investors, and renewable energy installations plateaued, as has been well highlighted in previous studies [28].
In hindsight, the Spanish government’s harsh and reactionary attempts to repair the diffusion bubble caused unnecessary harm to the solar industry, especially when compared with the policy adjustments made by other EU countries [29]. Although Spanish households enjoyed more sunshine and solar potential than their European neighbors, it was much less feasible for Spanish homeowners to install rooftop solar compared to homeowners in Italy, Germany, or the UK [30]. Indeed, several studies found the unfavorable regulative framework and the corresponding low or even negative profitability the main reason for the almost complete paralysis of the once booming PV sector in Spain [25,31]. One expert stakeholder later explained, “what could have been a success story in our country … has ended in a scam” [32] p. 5.
In October of 2018, RD-L 15/2018 removed the “sun tax” and outlined new support for self-consumption. Subsequent regulation on collective consumption (RD 244/2019) facilitates shared self-consumption in multifamily buildings, in which many Spaniards live and a majority of which need efficiency retrofitting [33]. Spain has now returned to a leadership position in the global PV market. In 2018, total installed PV capacity in the Spanish energy system was 4714 MW [34]. In 2019, installed PV capacity nearly doubled, reaching 9910 MW and accounting for 6.4% of total electricity demand, just behind EU countries such as Germany (where PV accounts for 9% of total demand), Austria (8.7%) and Italy (7.6%) [35]. In 2020, despite many parts of the country being subject to lockdowns, curfews, and travel restrictions, an estimated 2812 MW of solar PV was installed [36].
Part of the PVSC resurgence in Spain has been sparked by EU policies. Internal market electricity directive 2019/944 [37] makes a specific call to center citizen engagement and create a more even playing field for individual and community ownership of clean energy sources, including home solar [38]. Spain could generate several terawatts (TW) of solar energy as the solar radiation striking the Iberian Peninsula varies between 1.5 kW h m2 in winter and 7 kWh m2 in summer [39]. To reach the goal of 39 GW of installed solar PV by 2030 set out in the national energy and climate plan [40], it seems utility scale power plants will host the majority of solar PV capacity. Of course, the lack of consistency in Spanish legislation could increase capital costs, which can be an important factor for investment decisions and the overall profitability of installations [41]. However, it is significant that, in 2020, 596 MW of solar PV capacity was installed for self-consumption, a 30% increase in PVSC compared to 2019 [42].
Solar promoters envision urban landscapes filled with dark rectangular panels mounted on the russet-colored Spanish tiles. One recent model shows that if solar panels were installed on half of the available, southern facing rooftop space in urban areas and if those were coupled with batteries to cover hourly gaps, Spain’s energy grid could be served by small scale solar year-round [43]. Of course, such an undertaking is technologically feasible, but the political and social challenges of implementing such a plan are considerable. For example, 69% of Spanish residences are either multifamily structures or apartment blocks [44]. For those who live in apartment buildings, installing solar panels on one’s own rooftop requires community approval. Therefore, the social and administrative challenges of gaining permission from neighbors and proper permits continues to be a primary obstacle to the widespread adoption of PVSC in Spain.
Yet the desire for solar continues. During the renewable energy boom from 2005 to 2010, most Spaniards viewed solar PV as the best technology to achieve renewable energy goals [45]. Energy scholars and industry experts now anticipate public support for major decentralization of energy infrastructures, with small scale solar PV having the most significant weight in the future energy mix [46]. In support of this point, one expert has said that in Spain, solar energy “should be one of the main focuses of economic recovery” after the COVID-19 pandemic [47]. In the near term, job creation and decarbonization will likely hinge on solar PV, but will Spaniards engage the physical, social, and technological adjustments that relying on solar requires? Does the recent increase in PVSC indicate a tide shift in the energy transition or merely a trickle of individual, opportune investments? [48].
2.2. Previous Studies of Self-Consumption and Solar PV Efficiency
Previous works analyzing the PVSC sector before the legislative changes of 2018 and 2019 found the unfavorable regulative framework and the corresponding low or even negative profitability to be the main reasons for the contraction of the once booming PV sector [25,31,49]. However, under the new regulative scheme, PVSC is experiencing a new boom [50] and several studies have been published recently that analyze its benefits and profitability. (See Table 1 for a summary of key parameters and assumptions used to evaluate the recent profitability of PVSC in Spain).
Of these studies, three explicitly access the economic profitability of residential PVSC in Spain [20,30,51]. They find it to be an attractive investment, with internal rates of return (IRR) around 5%, which could reach 10% when achieving SC rates of over 75%. Two of these studies [20,30] do not optimize installation size for economic benefit, but rather use previous findings on the average size of a residential PVSC and average share of SC to complete a sensitivity analysis with variables such as line depreciation rate, self-consumption rate, solar irradiation, and installation costs. Their results suggest a high SC rate is key for good economic performance over the lifespan of the installation but do not consider the effect of smaller time periods (i.e., daily, or hourly load or generation curves).

Table 1.
Literature review results: summary of the key findings and modeling parameters of the relevant case studies on the profitability of PVSC in the Spanish context published after RD-L 15/2018 and RD 244/2019. All prices in the table refer to the year of the corresponding study i.e., 2020/2021 according to the year of publication.
| Author, Year | Ref | Approach | Key Findings | Key Parameters | |
|---|---|---|---|---|---|
| Escobar et al., 2020 | [52] | Analyze the profitability of PVSC for different household sizes in several EU countries. Use the average residential PV size and average household consumption profile; do not consider remuneration of excess No optimization, sensitivity analysis varying different parameters | Despite the more favorable new legislative framework, support policies are economically more favorable in other countries | Invest costs: 1350 €/kWp PVsize: 3 kWp Annual demand: 2.16–3.29 MWh Variable part of electr. costs: 12.3 ct€/kWh Feed-in tariff (FIT): 0 ct€/kWh SC-rate: 24.6–37.7% | Depreciation/Interest rate: 4.3% Ann.PV yield: 1550 kWh/kWp Time horizon: 25 y IRR/ NPV: n/a- Electrcity price trend: +5%/y Degradation: 0.5%/y |
| López-Prol et al., 2020 | [20] | Assess the profitability of PV self-consumption for residential and commercial buildings in Spain. Parameters study varying SC rate and other factors, but do not rely on no time series and do not perform any optimization | With current installation costs, residential PVSC obtains positive returns across entire irradiation range, below 5% for horizontal and above 5% for optimally-inclined panels Residential prosumers could obtain 10% profitability by achieving ~75% self-consumption at current installation costs | Invest costs: 1690 €/kWp PVsize: n/a Annual demand: n/a Variable part of electr. costs: 16.4 ct€/kWh Feed-in tariff (FIT): 4.9 ct€/kWh SC-rate: 33% | Depreciation/Interest rate: 6.7% Ann.PV yield: 1460 kWh/kWp Time horizon: 25 y IRR/ NPV: n/a- Electrcity price trend: +2%/y Degradation: 0.8%/y |
| Roldán Fernández et al., 2021 | [51] | Assess the profitability of residential PV self-consumption in Spain. Use hourly average load for a dwelling in Spain | A 1.5–2 kWp PV commercial PVSC kit yields an optimum net billing situation for an average dwelling Mention community SC as an option for increasing profitability of SC installations | Invest costs: 720 fixed + 820 €/kWp PVsize: 1.5 kWp Annual demand: 2.24 MWh Variable part of electr. costs: 12.3 ct€/kWh Feed-in tariff (FIT): 5 ct€/kWh SC-rate: 24–28% | Depreciation/Interest rate: 4% Ann.PV yield: n/a Time horizon: 30 y IRR/ NPV: 12.7%/3073€ Electrcity price trend: +2.5%/y Degradation: 0.5%/y |
| Gallego-Castillo et al. 2021 | [19] | perform regional analysis and optimization of PVSC installations under the new legal framework Use average hourly profiles of final electricity consumption | Use average hourly load curves for Spanish households (1–4 persons per HH, and weekday/weekend) | Invest costs: 720 fixed + 820 €/kWp PVsize: 3 kWp Annual demand: n/a Variable part of electr. costs: 12.3 ct€/kWh Feed-in tariff (FIT): n/a SC-rate: 24.6–37.7% | Depreciation/Interest rate: 4.3% Ann.PV yield: 1550 kWh/kWp Time horizon: 30 y IRR/ NPV: 2.5–6.8%/1102–1808€ Electrcity price trend: +5%/y Degradation: 0.5% |
| Olivieri et al. (2020) | [53] | Case study for university campus | Invest costs: 800 €/kWp PVsize: 80 kWp Annual demand: 117.7 MWh Variable part of electr. costs: variable Feed-in tariff (FIT): variable SC-rate: 58% | Depreciation/Interest rate: 5.0% Ann.PV yield: 1471 kWh/kWp Time horizon: 30 y IRR/ NPV: 13.1%/78,800€ Electrcity price trend: +2%/y Degradation: 0.5% | |
In contrast, Roldán Fernández et al. [51] optimizes a hypothetical PVSC installation for a typical residential dwelling in Spain: using average hourly load curves, they obtain IRR of up to 12.7%. Assumed discount rate and investment time horizon (assumed lifetime) are found to be the most sensitive parameters for economic performance. Gallego-Castillo et al. [19] also investigate PVSC installations on regional scale, optimizing the installations according to regional conditions using average hourly load profiles. They find PVSC to be cost effective in all regions of Spain, even for those without FIT or other remunerations for excess electricity sent to the grid [19]. The use of batteries for storage, while allowing higher rates of self-sufficiency, are found to be uneconomic at current prices, in line with the findings of previous works [54,55]. Ayala-Gilardon et al. [56] also analyze an existing PVSC installation on a detached house in Malaga regarding the impact of different temporal resolutions on SC rates and finds that using hourly loads instead of finer resolution leads to an overestimation of SC rates by 10%. The relevance of time resolution is confirmed by other studies that perform load–generation matching based on simulations, adding a coarser time resolution significant error and to overestimate the load–demand matching [57,58,59]. Finally, the existing research on PVSC in Spain also suggests commercial, industrial, or public buildings can achieve even higher rates of self-consumption, profit, and environmental benefits as the load and demand curves are typically correlated with the hours of solar generation [53,60].
2.3. Energy Communication and the Benefits of PVSC
In addition to buildings from other studies of the PVSC benefits for customers and prosumers in the EU [4,5,6,7,13,15,61,62,63], our approach is indebted to specific studies of media representations of, and public engagement with, renewable energy in Spain. In a review of Spanish media coverage of solar PV during the renewable energy market collapse, Heras-Saizarbitoria [45] found that journalists’ frequent deployment of metaphors like ‘bubble’ shifted public discourse about solar PV technologies. More recently, Bañares et al. [64] analyzed 15 years of television advertising by Spain’s “big three” energy companies: Iberdrola, Endesa, and Naturgy. They found that the marketing campaigns of these massive corporations have evolved to include elements related to sustainability and environmental protection; however, 73.9% of energy related ads focused on energy prices and special offers and, in a follow up survey, 44.2% of consumers said price was the most relevant factor in their decisions about contracting electricity [64]. While the general takeaway from the existing literature is that media and soft marketing strategies shape how the public understands renewable energy infrastructure, energy discourse tends to gravitate towards market trends and financial tradeoffs. Consumers may be concerned about environmental impacts, but they often make decisions based on economic projections. Indeed, default electricity customers are most often persuaded by information regarding individual return on investment and the financial benefits of PVSC [61].
On the one hand, discussions of solar panels as environmental salves and tools to increase energy justice seem to be overwhelmed by drect promotion of ‘economic benefits, pre-dominantly returns to shareholders and to a lesser extent local economic regeneration or growth’ [65] p. 8. With regards to energy poverty and community solar initiatives, activists and organizers may struggle to balance financial costs and benefits as one aspect of the impacts solar PV can have for the community, its historically disadvantaged or underserved citizens, and shared ecosystems [17].
On the other hand, home solar installations remain a primary source of energy ownership and have been shown to have the potential to increase public participation in energy transitions [66]. Prosumers who act collectively in cooperatives, energy communities, and non-profit organizations can facilitate active energy citizenship and autonomous social movement towards decentralized, sustainable, and democratic energy models. An increase in PVSC can also decrease the carbon intensity of the electricity mix, reduce energy dependency, create employment, and promote local autonomy [67].
The potential for PVSC to unlock broader community benefits seems to have a particularly important weight in Spain. Of the 46 prosumer initiatives across the EU recently analyzed by Inês et al. [18], the six Spanish initiatives were ‘the most adamant in defending energy as a common good’ and exceptional in ‘their focus on gender equality’ [p. 7]. Such findings suggest that Spaniards may be at least as, if not more, eager to join initiatives that acknowledge and support the heterogenous benefits of community solar; transforming such attitudes into action remains a challenge. Therefore, returning to our touchstone, our methods aimed at distilling information from these proposals within two broad categories of benefits:
(1) Economic: costs, efficiency, amortization, and profits (i.e., “time”);
(2) Social: environment, community, self-sufficiency, energy democracy (i.e., “cures”).
3. Materials and Methods
3.1. Web Screening and Solicitation of PVSC Proposals
Our screening and selection process began with an internet search in March 2021 using the terms “autoconsumo solar” (solar self-consumption) and “Madrid.”
From the results, we focused on companies and organizations that offered either online calculators for PVSC installations or individualized proposals based on readily available data such as address, average monthly electricity demand, monthly electricity cost, roof angle, and available roof space. We assume this to be first level information that an average customer would be willing to gather during the initial stages of research into PVSC.
For simulation data, we presented information related to a small apartment in the center of Madrid with an average electricity bill of €50–75 (€ value calculated in 2021), average consumption of 205 kWh/month (2.46 MWh/y), and contracted potential 3.0 kW. This hypothetical apartment is one of 12 in a residential building with a flat roof with 30 m2 of space available for a solar installation. After inputting this information into various online tools, we received seven proposals either immediately or via email within a few days. We then uploaded these proposals into Atlas.ti software for coding and content analysis.
3.1.1. Assessment of PVSC Installation Proposals
To further evaluate the influence of time values on self-consumption (SC) rate and other benefits of PVSC, we compared the estimations of PVSC as obtained from web-based dimensioning tools or installer quotes with results obtained from a higher-resolution assessment using minute by minute time series. The evaluation followed a two-step approach:
First, the monthly averages of daily load curves were used to calculate the dimensions for a potential small-scale solar PV installation. This approach considers the seasonal fluctuations of home solar production (i.e., higher kWh in summer, less in winter). These results provide a reference against which we compared the system configurations obtained from PV installers as described in results Section 4.1.
Second, using the minute resolution data, we calculate the performance of different hypothetical PVSC installations and compare the minute-based installations with those offered to potential prosumers. PV generation data is estimated from historical irradiation data for a hypothetical location in the center of Madrid. The generation is estimated for a polycrystalline silicon 5 KWp installation with the panels fixed at an optimum angle and azimuth. The hourly irradiation and PV generation data is obtained from the European Union’s Photovoltaic Geographic Information System [68]. We collected data with hourly resolution from 2011 to 2016 and then calculated the hourly generation average for a year January 1 to December 31. The hourly values were interpolated to obtain production values with minute based resolution. The time series used for the assessment are provided as a data file in the Research Data.
For obtaining the electricity generation values for the individually sized PV installations greater or lesser than the 5 kWp reference, the generation obtained for the 5 kWp installation has been scaled linearly. This avoids the selection of a specific size or brand of PV panel, thus providing more generic results. For annual degradation and system losses we use typical values according to previous literature [30,51,53] (see also Table 1). For the system costs, we gathered end-user prices of PVSC installations of different sizes (between 1.5 and 8 kWp) from commercial suppliers [69,70,71]. We then divided these into the fixed and variable costs, obtaining a fixed and size independent 1000€ installation cost as well as 1200€/kWp for the hardware. This gives the following assumptions when calculating average installation size (all prices/costs are given in €2021 in the following, unless otherwise specified):
- System costs (EUR 1000 fixed installation costs, 1200 €/kWp hardware costs)
- Annual degradation: 0.5%
- System loss: 14%
- Annual generation: 1618 kWh/kWp (based on information provided in [68]).
The economic framework also impacts the profitability of the PVSC system. Before June of 2021, Spanish consumers could select between three tariffs for the small consumer (‘precio voluntario del pequeño consumidor’) or PVPC. These options included: (i) a single period tariff with a fixed price independent of the hour, 2.0 A, (ii) a two-period tariff with a nighttime and a daytime rate, 2.0 DHA (iii) and the electric vehicle tariff, 2.0 DHS. As of 1 June 2021, the three tariff structures were replaced by a single, three period tariff called PVPC 2.0 TD. This new regulated tariff effects approximately 11 million of the 29 million domestic consumers in Spain [72].
Under this new scheme, electricity prices fluctuate according to the day before electricity spot market price for three distinct periods: a nighttime “valley” (horas valle) from 00:00–08:00, a “flat” period (horas llano) from 08:00–10:00 and 14:00–18:00, and “peak” periods (horas punta) from 10:00–14:00 and 18:00–24:00. In addition, the remuneration paid for the excess electricity fed into the grid varies between electricity providers and continues to fluctuate. Our results do not consider these new structures, which have coincided with a global energy crisis and severe swings in the wholesale price of electricity in Spain and across the EU. Again, our primary focus relates to how the information regarding the various benefits is communicated and how self-consumption rates and financial benefits are calculated.
The new tariff structure has not changed the fact that the prosumer in Spain cannot realize a profit; they can only achieve net zero consumption, erasing the variable part of the bill, i.e., the amount paid for consumed electricity. Regardless of the electricity produced by the prosumer and fed into the grid, the fixed part of the bill, i.e., the amount paid monthly per kW of power potential, remains mostly unaffected. In addition, the remuneration paid for the excess electricity fed into the grid varies between providers, with typical values of between 0.05 to 0.08 €/kWh.
Here, we assume the PVSC installation to be subject of a single period fixed tariff and we evaluate the influence of a two-period tariff on the benefits in the sensitivity analysis. Therefore, the following parameters were used for the assessment:
- Variable part of the electricity price (price per kWh): 0.13 €/kWh
- Feed-in remuneration (maximum monthly zero net balance): 0.05 €/kWh
- Depreciation rate: 5%
- Annual electricity price increase (variable part): −0%
- Time horizon for investment: 20 years
3.1.2. Load, Consumption, and Optimization
For time series on the household level, we obtained data from SustData, a publicly available repository of measured household load datasets with minute-by-minute time resolution for several EU countries [73]. Unfortunately, the repository does not currently have minute by minute time series data for Spanish households. Therefore, we relied on measurement data for four different households in Portugal, close to Spain in terms of geography and climate. To avoid creating averages that would ease out the minute-by-minute fluctuations, we downloaded times series values for a full calendar year.
For the dimensioning based on hourly averages where the actual volatility of the load curves is of less relevance, we also created a hypothetical solar community by aggregating the load profiles of four of the households. Table 2 summarizes power uptake values of the four households and the hypothetical solar community, both on minute-by-minute timescale (left) and for the hourly averages by month (right). Substantial discrepancies in terms of standard deviation and peak loads can be observed, while the average values are very similar, indicating a much higher volatility of the power uptake on the minute-by-minute level. Monthly average load curves are provided graphically in the linked Research Data.
The resulting average monthly electricity demand of the different households (HH) is:
HH1: 294 kWh/month (3.65 MWh/y)
HH2: 205 kWh/month (2.46 MWh/y)
HH3: 471 kWh/month (5.65 MWh/y)
HH4: 497 kWh/month (5.96 MWh/y)
For comparison, the average Spanish household electricity demand is 291 kWh/month (3.49 MWh/y), or 225 kWh/month (2.7 MWh/y) for apartments and 467 kWh/month (5.6 MWh/y) for isolated individual dwellings [74]. HH2 corresponds to the household consumption details used for requesting quotes from installers (Section 3.1).
The optimum sizing of the four PVSC installations is based on hourly load curves averaged over each of the twelve calendar months. This requires more effort than the simple input of average monthly consumption data, as it takes into account seasonal variations and the average daily load curve. Many households have electricity meters that allow hourly outputs, and some electricity providers also allow their customers to access and download these data for obtaining their own load profiles. These can then be provided to PV installers for estimating the optimal layout of the installation.
For obtaining the load curve of the hypothetical solar community, the individual demand curves of HH1, HH2, HH3, and HH4 are aggregated, and we assume that, while their production would be linked, they would not coordinate their consumption.
4. Results
4.1. Analysis of PVSC Proposals
Similar to other energy focused content and sentiment analyses [75,76], we sought to identify trends in the ways that selected providers portray the benefits of PVSC. While offering similar products, we expected (H1) the different providers stress different qualities in their proposals for PVSC. Table 3 shows the primary quantitative categories for which we coded.
Total cost of the equipment and installation was included in each of the seven proposals, and ranged from EUR 3925 to EUR 6242, resulting in an average cost of EUR 4967.57. Three of the proposals called for a 10-panel installation to maximize the available rooftop space. The others suggested smaller installations of 4, 4, 5, and 6 panels. The electric potential of these installations ranged from 1.52 kWp to 3.4 kWp. Five of the eight proposals offered information related to annual savings, with the smaller installations projecting EUR 230 of savings per year with EUR 428 per year savings for larger installations. The benefit in terms of sun harvested varies substantially, with values of the annual kWh/kWp (or the Kk factor) varying from 965 kWh to 1560 kWh. The relationships between the size of the installation, potential savings, and self-consumption rate (which is between 32% and 51%) are discussed further in the following section on self-consumption and time series.
While the financial and technological values are of interest, our qualitative study is more focused on the presence or absence of various soft marketing strategies and how and which potential benefits are presented. Two of the proposals were calculated instantly and appeared on their website. The other five were received via a link embedded in an email or as an email attachment. Of the five proposals received via attachment, one came in the form of an Excel spreadsheet. Another arrived in the form of a polished, 11-page PDF document with various charts, tables, and graphics. One proposal attachment was supplemented by a 7-page dossier related to the benefits of PVSC and a link to a YouTube video about solar PV prosumerism. These kinds of supplementary materials and visually engaging texts provide subtle indicators of how PVSC is being marketed and the ways potential prosumers envision their own systems connected to the grid. Indeed, five of the seven specialized quotes show a graphic of solar panels. Four proposals included a graphic showing a single-family house, solar panels, and an electricity pylon. Such graphics subtly reinforce the installation’s connection to the grid and offer reminders that surplus electricity (or ‘excedentes’) will be renumerated as a discount on the monthly electricity bill. The graphics tended to reinforce the idea of the individual customer as part of a technological infrastructure, but they do not necessarily invite considerations of the social or environmental benefits of PVSC.
As shown in Table 3, the most frequently cited nonfinancial benefit communicated to potential PVSC customers was the CO2 emissions that would be avoided by the installation. CO2 emissions reductions appeared in 57% of the proposals, corroborating findings of Herbes and Ramme [76], who found that 44% of websites selling green energy products in Germany also included specific links between solar installations and corresponding CO2 emissions avoided. However, in the case of the PVSC installations in Madrid, the four proposals that offer estimations for CO2 avoided presented significantly different results. One shows that the 2204-kWh annual generation avoids 441 kg of CO2, a second that annual generation of 2512 kWh saves 290.3 kg CO2. These are the lower estimations. The higher estimations suggest 5300 kWh of solar energy production corresponds to 2814 kg of CO2 avoided and a second suggests that, over the projected 25-year lifespan of the PVSC installation, an average of 2957 kg a year will be avoided.
These discrepancies, of up to seven times the CO2 avoided by a solar installation, cannot only be attributed to the different size and output. While allocating CO2 emissions and the methods for completing an impact analysis are still debated [77], in general, the avoided CO2 emissions per kWh will depend on the generation mix of the grid which it serves. In grids where coal and natural gas dominate, PVSC installations avoid greater amounts of CO2, but if most of the electricity is generated by wind, hydro, and solar, the avoided CO2 per kWh of newly installed PVSC will be less impactful. In Spain, the estimated figure for CO2/MWh has been dropping. In 2015, each MWh of electricity in the grid generated an average equivalence of 235 kg of CO2. By 2020, the figure had fallen to 190 kgCO2/MWh [78]. An average of these factors—212.5 kgCO2/MWh or 0.2125 kgCO2/kWh—would result in outputs comparable to the lower estimations in the range of 350 kg of CO2 emissions avoided annually by a home solar installation. However, the proposals that imply savings of approximately seven times the average kg/CO2 seem to assume that the PV electricity generated and fed into the grid would exclusively substitute coal fired power, which, in Spain, is unrealistic.
4.2. Optimum Size and Benefit of PVSC Based on Minute by Minute Calculations
Table 4 resumes the key parameters obtained for the PVSC installations for the four individual households and the hypothetical solar community with our proprietary dimensioning approach that maximizes the net present value (NPV) of the installation. All installations show a positive NPV and an internal rate of return (IRR) of between 11 and 14% with SC-rates of between 61–65% (estimated with hourly time resolution). When compared with the quotes obtained in Section 4.1, the installers suggest significantly larger installations, obtaining lower IRR and longer amortization times. Here, a better knowledge of the criteria applied by the installers when dimensioning the installation would help prosumers to better engage in the design of the installation and to set their priorities. For instance, a focus on IRR and quick amortization will lead to a small installation, because the highest benefit is obtained when all electricity is self-consumed. On the other hand, maximizing the total NPV leads to larger installations, as the electricity sent to the grid and renumerated monthly contributes to the overall savings.
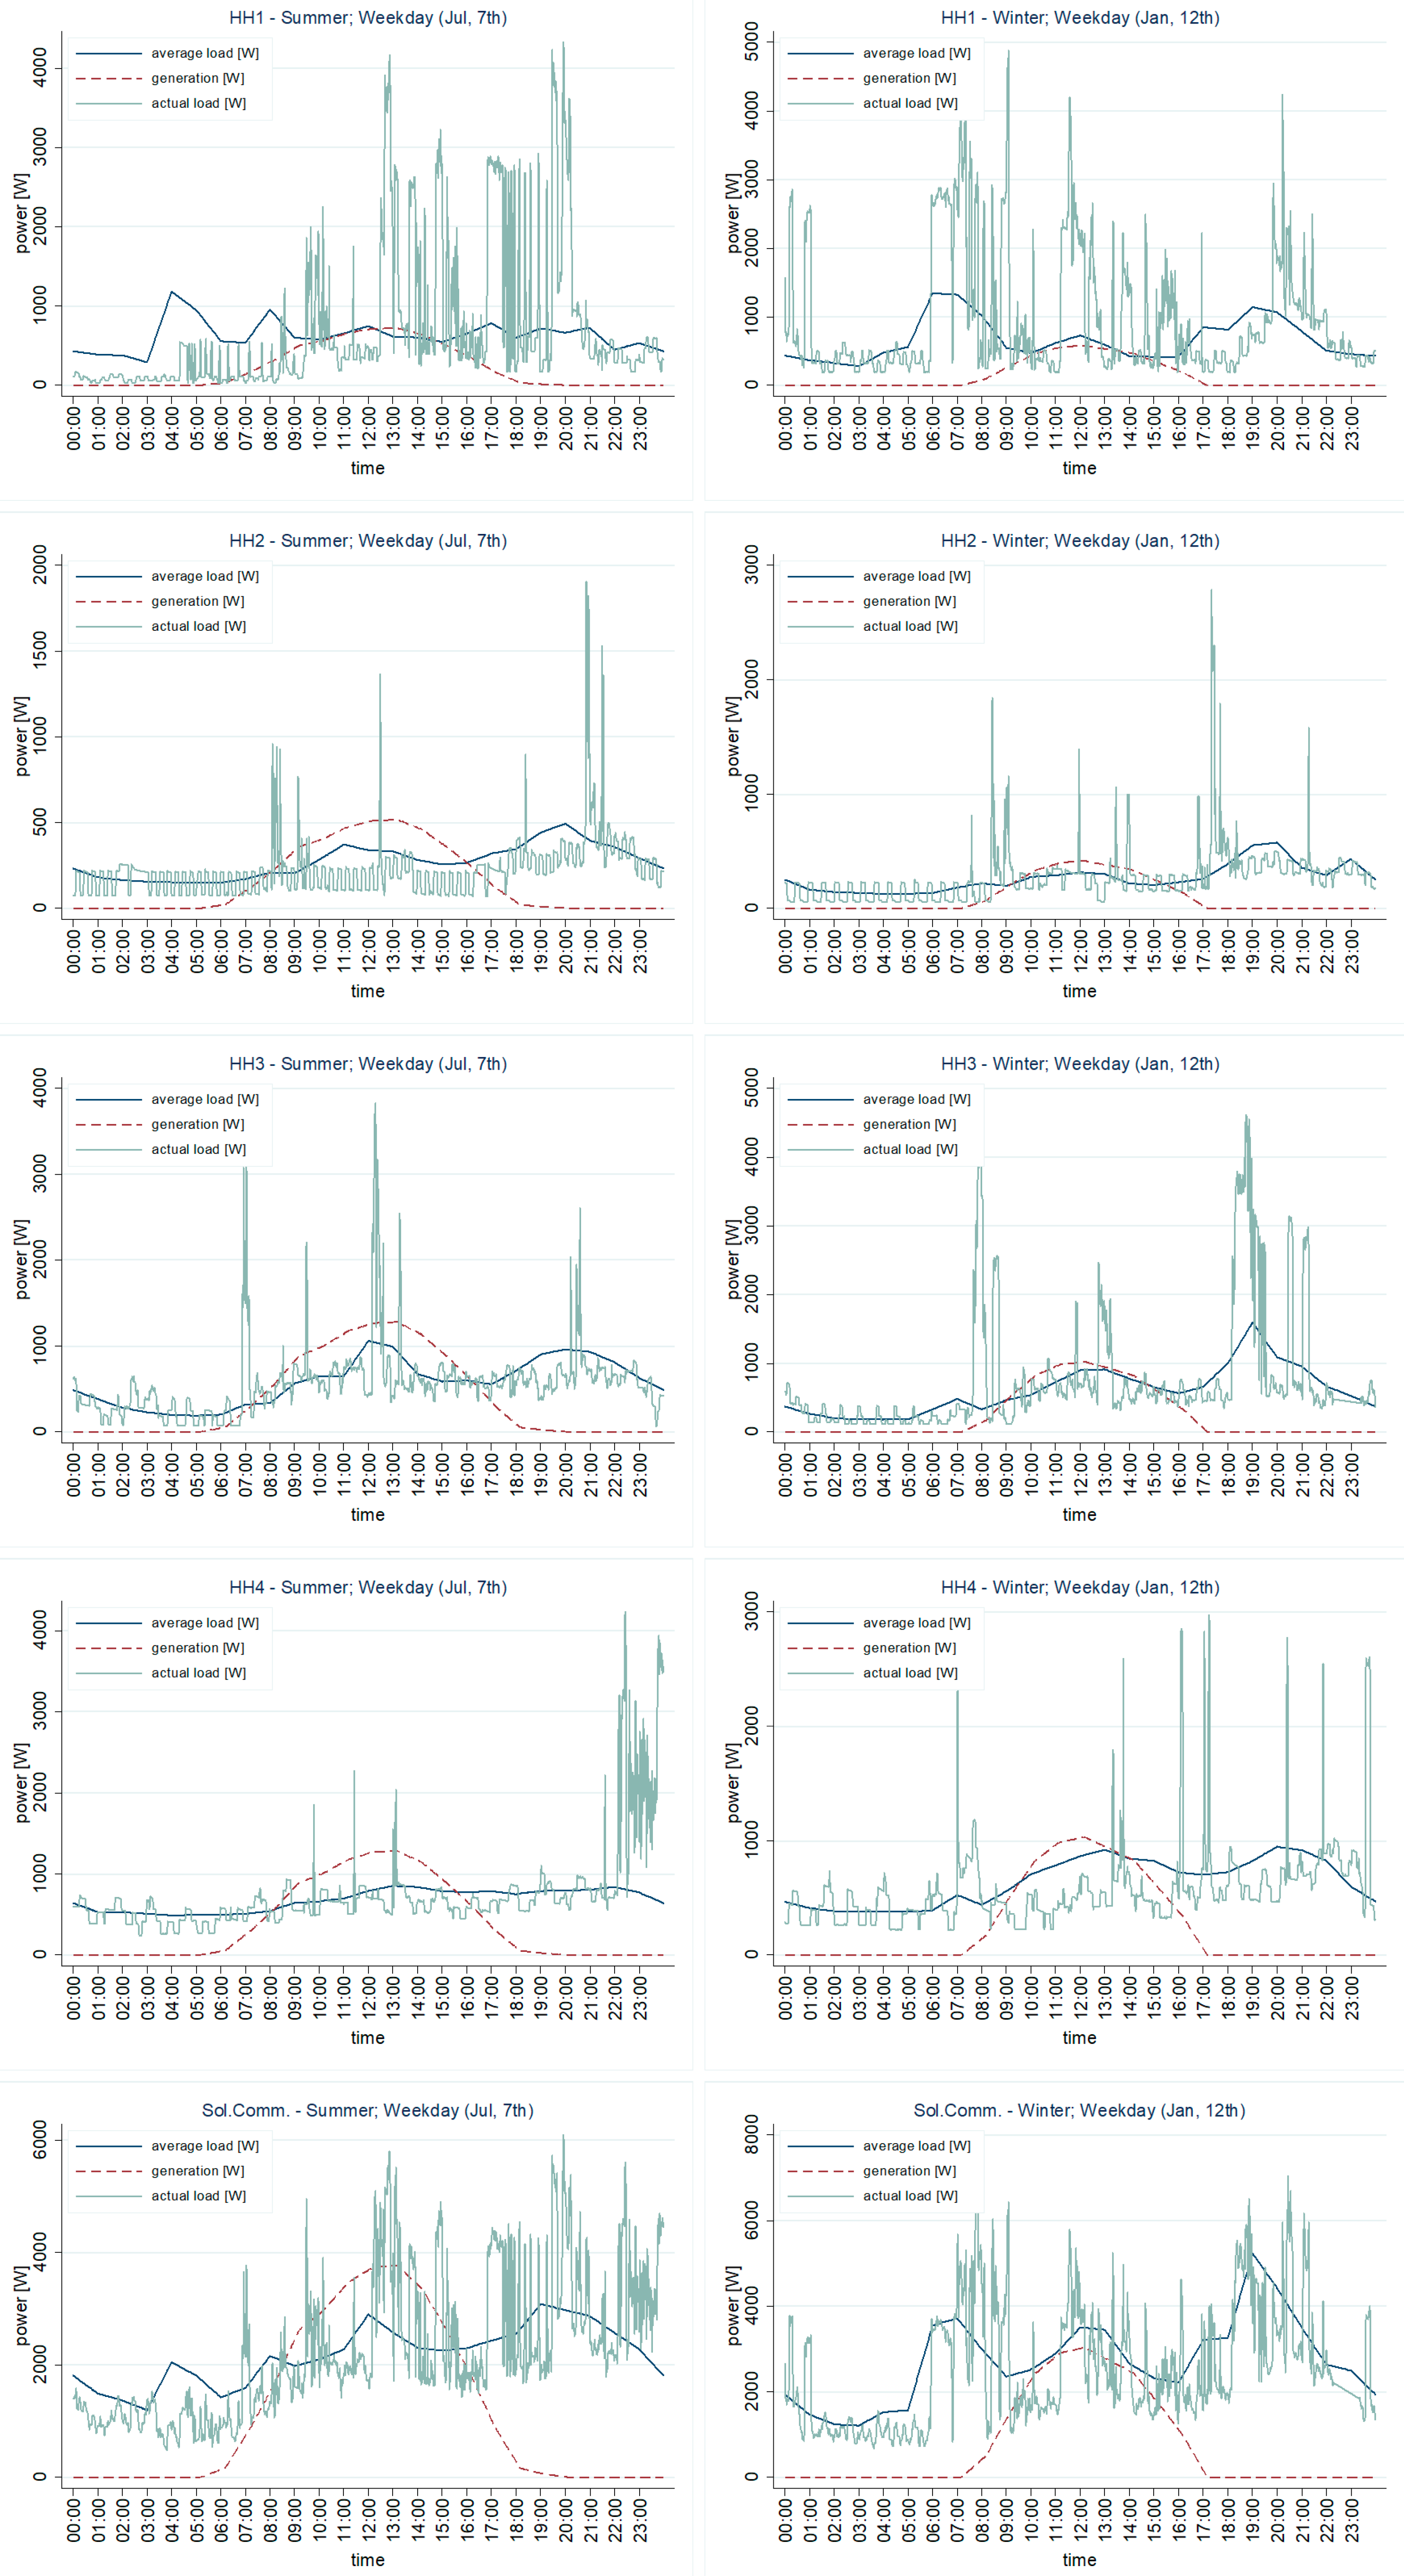
When looking into the differences between time resolutions, the benefits estimated when using a minute-by-minute time resolution are significantly lower than those estimated on an hourly basis. On average, the NPV after 20 years is between 18% and 29% lower than estimated on hourly basis, though the overall profitability is still high, with an IRR of 11–13%. The reason for this is that the load profiles fluctuate much more than the average daily load curves suggest. Frequent load demand peaks exceed the PV power generated and require taking electricity from the grid, even in times of full generation. These peaks are followed by dips of low demand where the generated electricity is not self-consumed but would be injected into the grid. Minute by minute fluctuations significantly reduce the amount of SC, and, thus, the profitability of the installations. Figure 1 shows the load and generation curves for two different days, one summer and one winter weekday. The hourly load averaged over the corresponding month is shown in solid dark blue, and the actual load by minute in light grey. Following the hourly average, the minute-by-minute loads show a high variability and strong peaks that exceed the PV generation power by far.
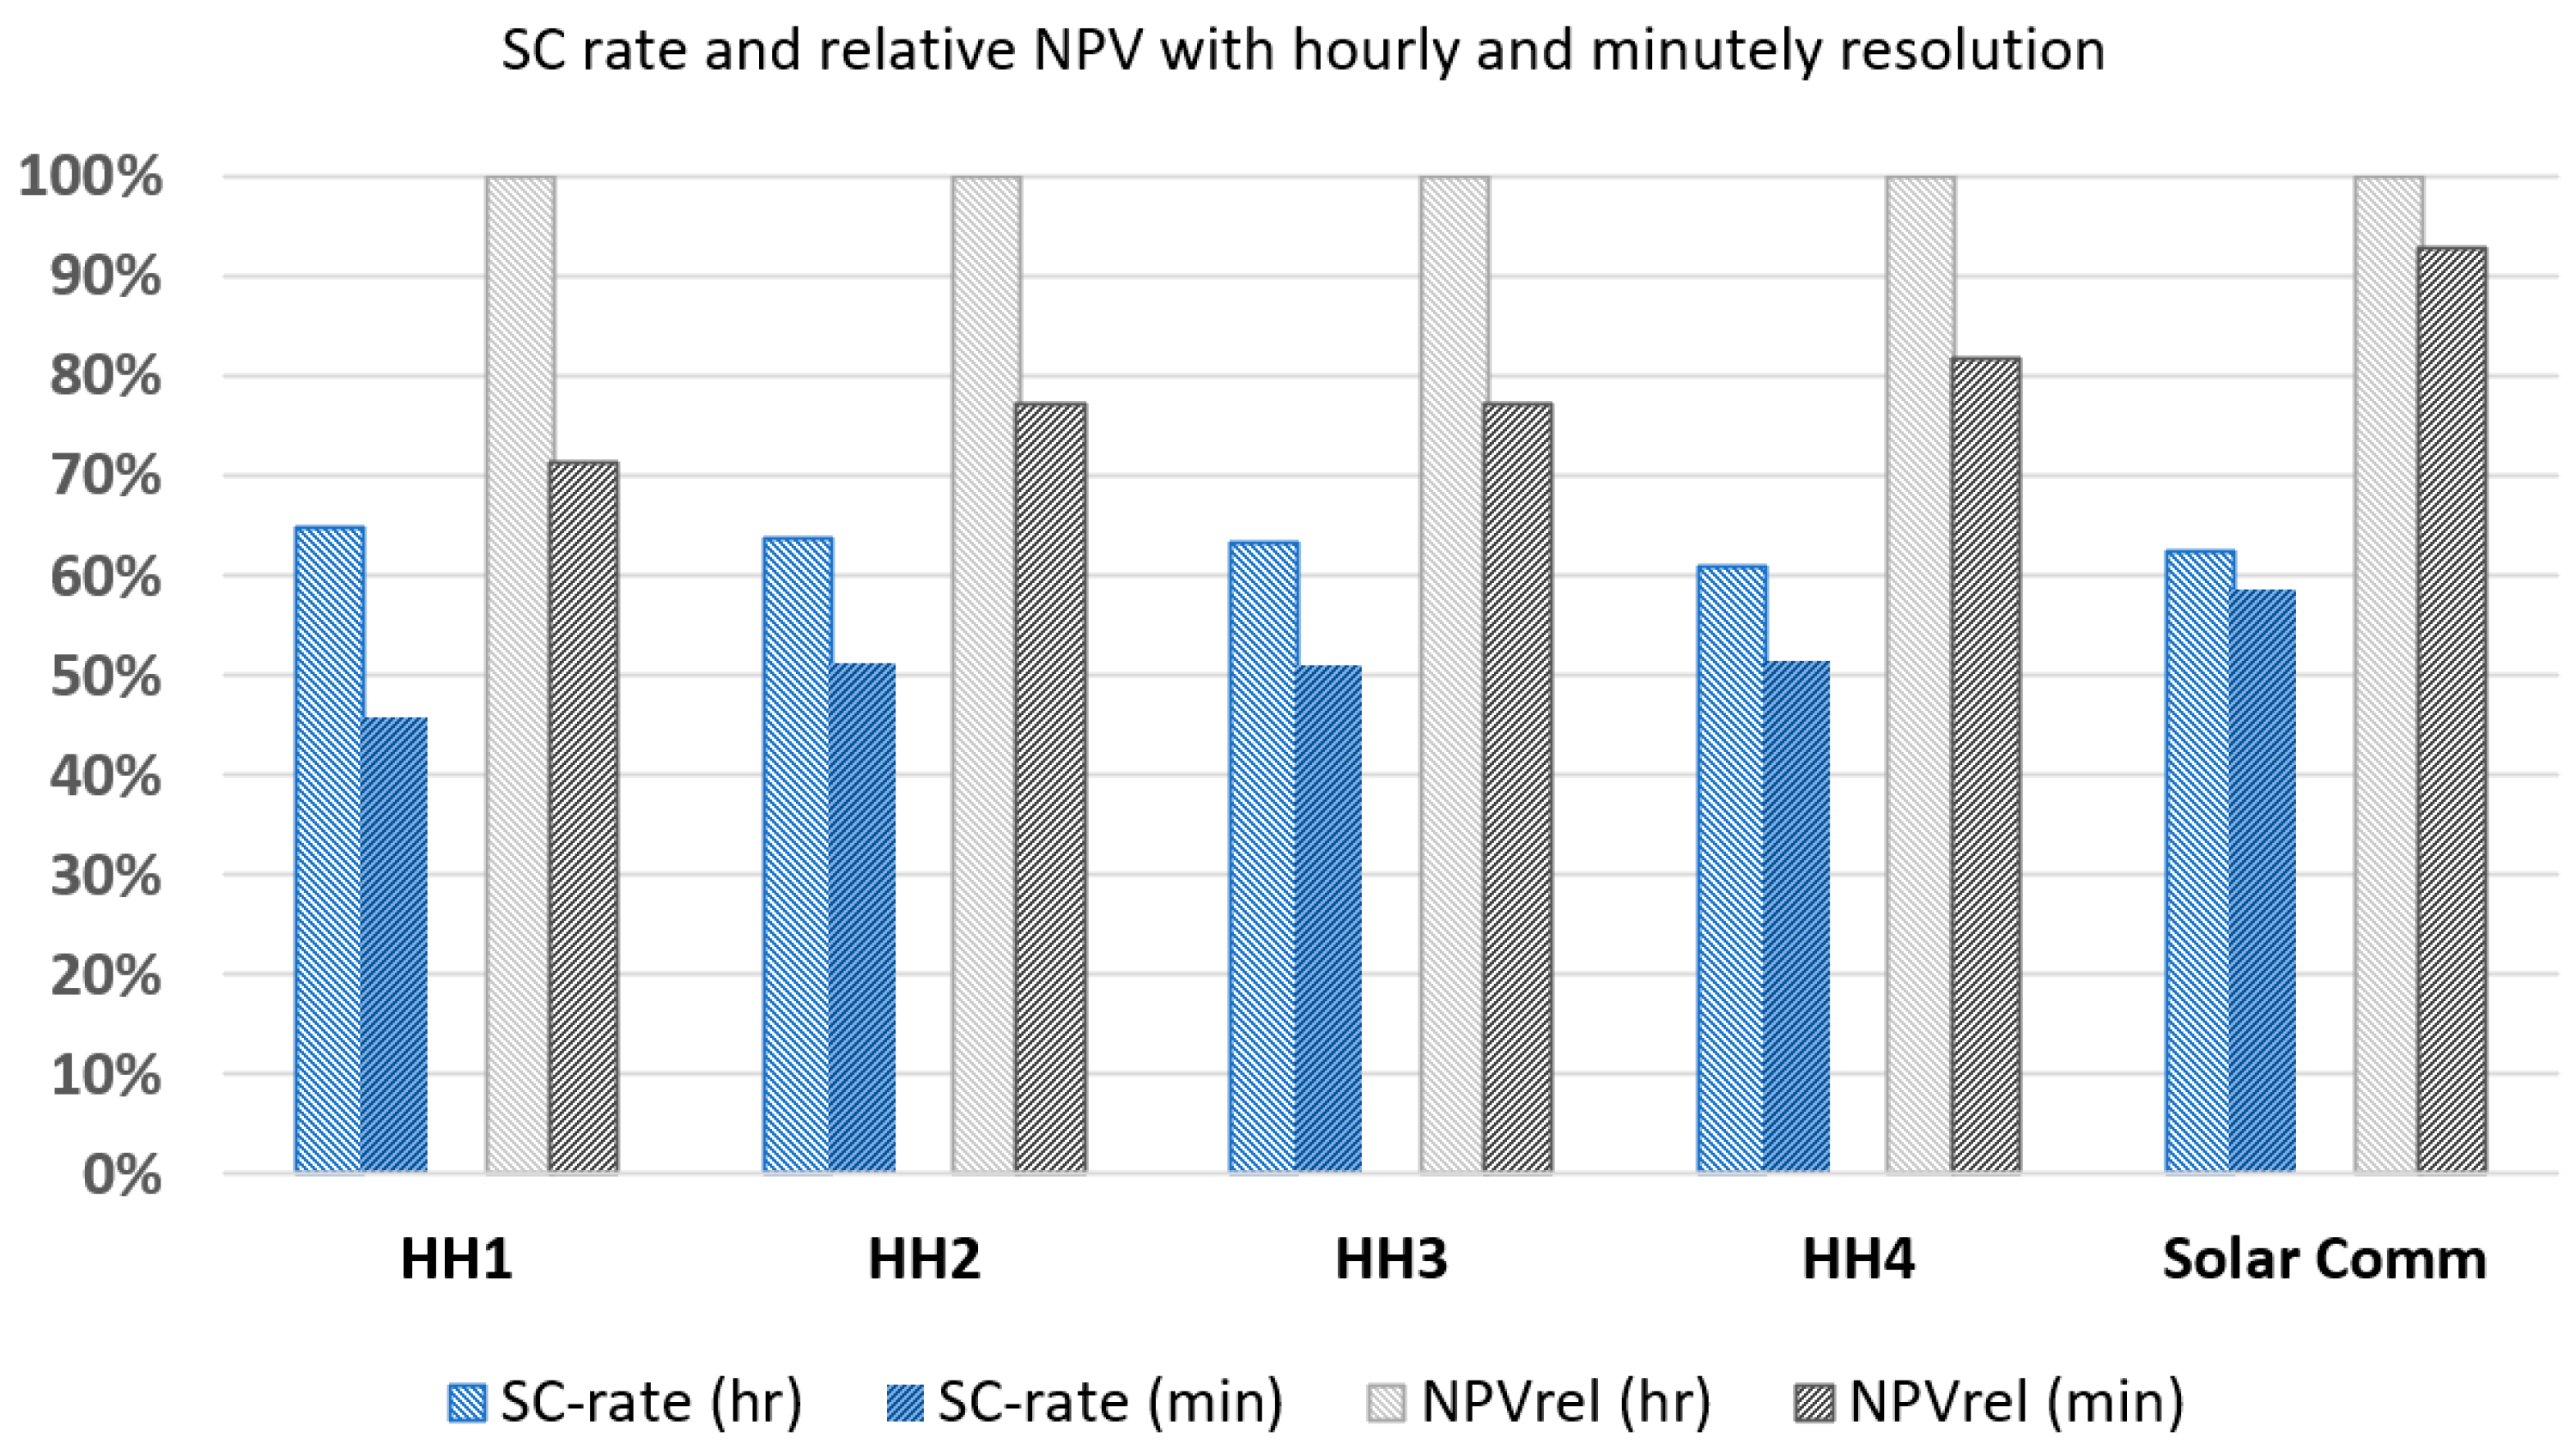
However, when grouping the households together as a solar community, these spikes ease out and the minute-by-minute load follows the average hourly load much better. In fact, the four-unit solar community shows the least discrepancy between the minute based and hourly SC rate, with the hourly at 62.3% and minute-based figures showing 58.5%. Figure 2 provides the SC rates and relative NPV (actual NPV when considering real consumption values on minute level relative to the NPV estimated based on hourly averages) obtained for the four households individually and when grouping them together as a solar community. The actual SC rate (minute resolution) for the solar community is 6% lower than estimated, in comparison to 15.6–19.3% for the individual household installations. Correspondingly, the NPV after 20 years for the solar community is EUR 6282 (7.2% less than estimated on hourly basis), while the sum of the NPV for the four households when installing individual SC systems would be only EUR 4899 (20% lower than estimated on hourly basis, and 22% lower than within the solar community). Installation costs vary only marginally (EUR 8871 for the solar community versus EUR 8538 for individual installations). Thus, joining the households in a solar community improves the economic and environmental benefits and should also improve the social benefits of PVSC and the new EU figure of citizen energy communities [79,80,81,82].
5. Conclusions
Photovoltaic self-consumption (PVSC) has an important role to play in various transition pathways across the EU, and especially in Spain. This paper has investigated some of the benefits or ‘cures’ attributed to home solar installations and how different time series impact calculations of installation size and self-consumption rates. While our study has been limited by the relatively modest sample size of seven PVSC installation proposals and four households with minute resolution time series data, several key trends have been revealed.
Our results show that PVSC promoters and providers often explain benefits in financial terms of costs, savings, and amortization. We would hope that providers might offer supplemental information about their methodology for calculating installation size, self-consumption, and annual savings. Only one of the seven proposals provided links to a web page and short video that shows how they calculate monthly load curves and annual production. If offering such information was a standard practice, potential prosumers could better gauge the economic and technical conditions of PVSC. Another calculation that must be clearer and more transparent relates to the display of CO2 emissions avoided. Two of the four proposals that did provide this information seemed to exaggerate the emissions avoided by an order of magnitude. PVSC promises to generate clean energy and avoid emissions; clearer information about CO2 emissions would give potential prosumers a more accurate understanding of their installation’s environmental impact. Further research should examine how potential prosumers respond to supplementary information about environmental benefits such as CO2 emissions avoided and the corresponding figures such as ‘trees planted’.
It does seem that any single solar installer, organization, or type of information can shift public opinion about PVSC on its own, but we do anticipate further clarification about the expected benefits of small scale solar from more diverse sources. For instance, in 2020, the national Institute for Energy Diversification and Efficiency (IDAE) published a guide for PVSC installers that outlines the different procedures and typical benefits, including an average of 30% self-consumption [83]. Meanwhile, the consumer advocacy group Organization of Consumers and Users (OCU) offers forums where members can share the details of their specific installations, costs, and renumeration schemes and they also publish general analysis in accessible articles such as “How much savings are generated by installing solar panels?” [84]. The availability of information from multiple outlets in multimodal styles should allow potential prosumers to better gauge and compare between installers and providers.
Our quantitative results have also shown that dimensioning a PVSC installation based on monthly average consumption data leads to an overestimation of potential financial value. Knowledge of the actual load profiles as well as daily and seasonal fluctuations are required to enable a proper layout and a realistic estimation of the future benefits. High fluctuations (peaks) in demand cannot be covered by the SC installation, especially when designed for maximum self-consumption (SC). Using minute resolution time series, the SC rates on individual household level are 18.9–35.7% lower than estimated when using hourly load curves. The overestimation of self-consumption rate impacts the calculation of financial benefits and the optimized size and design for PVSC.
As public facing, multimodal texts, we expect organizations prepared to install solar panels in an individual home or residential building to offer accurate information and to simultaneously simplify the complexity of energy technologies and networks [12]. Of course, it also seems unfair to fault the providers for failing to make this kind of detailed calculations, as the data has been gathered from their approximate proposals based on limited information. It could be that the providers’ primary concern is presenting the interested customer with the maximum possible benefit; in other words, they display a general estimate of what can be achieved with home solar installations rather than what a more detailed analysis shows is more likely to occur. At the same time, they could be genuinely unaware or unable to provide the more detailed analysis based. Without access to the equations that the providers use to determine optimal installation size and self-consumption rates, it is difficult to draw clear conclusions about their results.
What is clear is that the differences between monthly averages to minute-by-minute production and consumption data shows that small or even undersized installations have the highest IRR, since the remuneration of excess electricity is comparatively low and maximum return is obtained when all solar power produced is self-consumed. For small scale installations of 2.3–2.9 Wp per kWh of monthly average electricity demand, economic return of above 10% can be obtained in central Spain. However, calculating with the minute-by-minute data also suggests that slightly larger installations which cover individual demand and earn renumerations for excess electricity can have a greater net present value (NPV), of between 28% and 48%, respectively. The differences between internal rate of return (IRR), NPV, and amortization rates might also be better communicated to potential prosumers.
Yet the most significant finding from the minute- based time resolution suggests an even greater benefit for grouping individual homes or multi-family buildings into solar communities. These connection installations of four or more residences would help to ease spikes in demand and obtain the most significant benefits in terms of SC, IRR, and NPV. Our strongest recommendation for solar installers is to supplement the individual proposals generated online with information about how to speak to one’s neighbors or community members about shared self-consumption.
Therefore, questions to be answered by subsequent research include: How do potential prosumers respond to different kinds of community and environmental benefits? Furthermore, what kinds of communications practices and marketing campaigns can further facilitate the development of renewable energy communities organized around shared solar? Of course, such questions open one of greatest challenges related to “time” and “sol”: accurately and organically communicating complex ideas and systems such as PVSC and its relationship to the electricity grid is often a slow process; however, as the carbon clock ticks away and the sun’s rays continue to heat our carbon cluttered atmosphere, it is also clear that time is of the essence and that we must act quickly and efficiently to maximize the resources we still have available.
Author Contributions
Conceptualization, D.W. and J.F.P.; methodology, D.W. and J.F.P.; writing—original draft preparation D.W.; writing—review and editing, D.W. and J.F.P.; project administration, D.W.; funding acquisition, D.W. All authors have read and agreed to the published version of the manuscript.
Funding
Daniel Wuebben and Jens Peters are Marie Skłodowska-Curie fellows in the GOT Energy Talent Program (grant agreement No 754382). As such, they receive funding from the European Union’s Horizon 2020 research and innovation programme. The content of this article does not reflect the official opinion of the European Union. Responsibility for the information and views expressed herein lies entirely with the authors.
Data Availability Statement
Supplemental graphs and tables from the time series calculations are available online at 10.5281/zenodo.4737761 (accessed on 10 January 2022).
Conflicts of Interest
The authors declare no conflict of interest.
References
- International Energy Agency. Renewable Power—Analysis; International Energy Agency: Paris, France, 2021. [Google Scholar]
- EU Clean Energy for All Europeans Package. Available online: https://ec.europa.eu/energy/topics/energy-strategy/clean-energy-all-europeans_en (accessed on 4 March 2021).
- Parag, Y.; Sovacool, B.K. Electricity Market Design for the Prosumer Era. Nat. Energy 2016, 1, 1–6. [Google Scholar] [CrossRef]
- Palm, J.; Eidenskog, M.; Luthander, R. Sufficiency, Change, and Flexibility: Critically Examining the Energy Consumption Profiles of Solar PV Prosumers in Sweden. Energy Res. Soc. Sci. 2018, 39, 12–18. [Google Scholar] [CrossRef]
- Galvin, R. I’ll follow the Sun: Geo-Sociotechnical Constraints on Prosumer Households in Germany. Energy Res. Soc. Sci. 2020, 65, 101455. [Google Scholar] [CrossRef]
- Öhrlund, I.; Stikvoort, B.; Schultzberg, M.; Bartusch, C. Rising with the Sun? Encouraging Solar Electricity Self-Consumption among Apartment Owners in Sweden. Energy Res. Soc. Sci. 2020, 64, 101424. [Google Scholar] [CrossRef]
- Zapata Riveros, J.; Kubli, M.; Ulli-Beer, S. Prosumer Communities as Strategic Allies for Electric Utilities: Exploring Future Decentralization Trends in Switzerland. Energy Res. Soc. Sci. 2019, 57, 101219. [Google Scholar] [CrossRef]
- Rooftop Solar for All: Closing the Gap between the Technically Possible and the Achievable. Energy Res. Soc. Sci. 2021, 80, 102203. [CrossRef]
- Girard, A.; Gago, E.J.; Ordoñez, J.; Muneer, T. Spain’s Energy Outlook: A Review of PV Potential and Energy Export. Renew. Energy 2016, 86, 703–715. [Google Scholar] [CrossRef]
- Perpiña Castillo, C.; Batista e Silva, F.; Lavalle, C. An Assessment of the Regional Potential for Solar Power Generation in EU-28. Energy Policy 2016, 88, 86–99. [Google Scholar] [CrossRef]
- Ingeborgrud, L.; Heidenreich, S.; Ryghaug, M.; Skjølsvold, T.M.; Foulds, C.; Robison, R.; Buchmann, K.; Mourik, R. Expanding the Scope and Implications of Energy Research: A Guide to Key Themes and Concepts from the Social Sciences and Humanities. Energy Res. Soc. Sci. 2020, 63, 101398. [Google Scholar] [CrossRef]
- Barrios-O’neill, D.; Schuitema, G. Online Engagement for Sustainable Energy Projects: A Systematic Review and Framework for Integration. Renew. Sustain. Energy Rev. 2016, 54, 1611–1621. [Google Scholar] [CrossRef]
- Endrejat, P.C.; Güntner, A.V.; Ehrenholz, S.; Kauffeld, S. Tailored Communication Increases the Perceived Benefits of Solar Energy. Energy Policy 2020, 144, 111714. [Google Scholar] [CrossRef]
- Colasante, A.; D’Adamo, I.; Morone, P. Nudging for the Increased Adoption of Solar Energy? Evidence from a Survey in Italy. Energy Res. Soc. Sci. 2021, 74, 101978. [Google Scholar] [CrossRef]
- Kratschmann, M.; Dütschke, E. Selling the Sun: A Critical Review of the Sustainability of Solar Energy Marketing and Advertising in Germany. Energy Res. Soc. Sci. 2021, 73, 101919. [Google Scholar] [CrossRef]
- Cozen, B.; Endres, D.; Peterson, T.R.; Horton, C.; Barnett, J.T. Energy Communication: Theory and Praxis Towards a Sustainable Energy Future. Environ. Commun. 2018, 12, 289–294. [Google Scholar] [CrossRef]
- Brown, D.; Hall, S.; Davis, M.E. What Is Prosumerism for? Exploring the Normative Dimensions of Decentralised Energy Transitions. Energy Res. Soc. Sci. 2020, 66, 101475. [Google Scholar] [CrossRef]
- Campos, I.; Marín-González, E. People in Transitions: Energy Citizenship, Prosumerism and Social Movements in Europe. Energy Res. Soc. Sci. 2020, 69, 101718. [Google Scholar] [CrossRef]
- López Prol, J.; Steininger, K.W. Photovoltaic Self-Consumption Is Now Profitable in Spain: Effects of the New Regulation on Prosumers’ Internal Rate of Return. Energy Policy 2020, 146, 111793. [Google Scholar] [CrossRef]
- Gallego-Castillo, C.; Heleno, M.; Victoria, M. Self-Consumption for Energy Communities in Spain: A Regional Analysis under the New Legal Framework. Energy Policy 2021, 150, 112144. [Google Scholar] [CrossRef]
- Gómez, A.; Dopazo, C.; Fueyo, N. The “Cost of Not Doing” Energy Planning: The Spanish Energy Bubble. Energy 2016, 101, 424–436. [Google Scholar] [CrossRef]
- De La Hoz, J.; Martín, H.; Ballart, J.; Có, F.; Es Graells, M. Evaluating the New Control Structure for the Promotion of Grid Connectedphotovoltaic Systems in Spain: Performance Analysis of the Period 2008–2010. Renew. Sustain. Energy Rev. 2008, 19, 541–554. [Google Scholar] [CrossRef]
- Diego Rosell, A. PV Magazine. 2021. Available online: https://www.pv-magazine.com/2021/1/page/15/ (accessed on 1 January 2022).
- Alonso, P.M.; Hewitt, R.; Pacheco, J.D.; Bermejo, L.R.; Jiménez, V.H.; Guillén, J.V.; Bressers, H.; de Boer, C. Losing the Roadmap: Renew. Energy Paralysis in Spain and Its Implications for the EU Low Carbon Economy. Renew. Energy 2016, 89, 680–694. [Google Scholar] [CrossRef]
- Del Río, P.; Mir-Artigues, P. Support for Solar PV Deployment in Spain: Some Policy Lessons. Renew. Sustain. Energy Rev. 2012, 16, 5557–5566. [Google Scholar] [CrossRef]
- Gürtler, K.; Postpischil, R.; Quitzow, R. The Dismantling of Renew. Energy Policies: The Cases of Spain and the Czech Republic. Energy Policy 2019, 133, 110881. [Google Scholar] [CrossRef]
- Ibarloza, A.; Heras-Saizarbitoria, I.; Allur, E.; Larrea, A. Regulatory Cuts and Economic and Financial Performance of Spanish Solar Power Companies: An Empirical Review. Renew. Sustain. Energy Rev. 2018, 92, 784–793. [Google Scholar] [CrossRef]
- Mir-Artigues, P.; Cerdá, E.; del Río, P. Analyzing the Impact of Cost-Containment Mechanisms on the Profitability of Solar PV Plants in Spain. Renew. Sustain. Energy Rev. 2015, 46, 166–177. [Google Scholar] [CrossRef]
- López Prol, J. Regulation, Profitability and Diffusion of Photovoltaic Grid-Connected Systems: A Comparative Analysis of Germany and Spain. Renew. Sustain. Energy Rev. 2018, 91, 1170–1181. [Google Scholar] [CrossRef]
- Escobar, P.; Martínez, E.; Saenz-Díez, J.C.; Jiménez, E.; Blanco, J. Profitability of Self-Consumption Solar PV System in Spanish Households: A Perspective Based on European Regulations. Renew. Energy 2020, 160, 746–755. [Google Scholar] [CrossRef]
- Mir-Artigues, P.; del Río, P.; Cerdá, E. The Impact of Regulation on Demand-Side Generation. The Case of Spain. Energy Policy 2018, 121, 286–291. [Google Scholar] [CrossRef]
- Gabaldón-Estevan, D.; Peñalvo-López, E.; Solar, D.A. The Spanish Turn against Renew. Energy Development. Sustainability 2018, 10, 1208. [Google Scholar] [CrossRef] [Green Version]
- Monzón-Chavarrías, M.; López-Mesa, B.; Resende, J.; Corvacho, H. The NZEB Concept and Its Requirements for Residential Buildings Renovation in Southern Europe: The Case of Multi-Family Buildings from 1961 to 1980 in Portugal and Spain. J. Build. Eng. 2021, 34, 101918. [Google Scholar] [CrossRef]
- Blanco-Díez, P.; Díez-Mediavilla, M.; Alonso-Tristán, C. Review of the Legislative Framework for the Remuneration of Photovoltaic Production in Spain: A Case Study. Sustainability 2020, 12, 1214. [Google Scholar] [CrossRef] [Green Version]
- Masson, G.; Kaizuka, I. IEA PVPS Report—Trends in Photovoltaic Applications 2020; International Energy Agency: Paris, France, 2020; Available online: https://iea-pvps.org/trends_reports/trends-in-pv-applications-2020/ (accessed on 15 October 2021).
- Unión Española Fotovoltaica Informe Anual: Oportunidad Para La Sostenibilidad Energía Solar Fotovoltaica. 2021. Available online: https://www.unef.es/es/recursos-informes (accessed on 1 November 2021).
- European Commission Directive (EU). 2019/944 of the European Parliament and of the Council of 5 June 2019 on Common Rules for the Internal Market for Electricity and Amending Directive 2012/27/EU. Off. J. Eur. Union 2019, 158, 125–199. [Google Scholar]
- Lowitzsch, J.; Hoicka, C.E.; van Tulder, F.J. Renew. Energy Communities under the 2019 European Clean Energy Package—Governance Model for the Energy Clusters of the Future? Renew. Sustain. Energy Rev. 2020, 122, 109489. [Google Scholar] [CrossRef]
- Montoya, F.G.; Aguilera, M.J.; Manzano-Agugliaro, F. Renew. Energy Production in Spain: A Review. Renew. Sustain. Energy Rev. 2014, 33, 509–531. [Google Scholar] [CrossRef]
- Ministerio para la Transición Ecológica y el Reto Demográfico Borrador Actualizado Del Plan Nacional Integrado de Energía y Clima 2021–2030. 2020. Available online: https://www.miteco.gob.es/es/prensa/pniec.aspx (accessed on 11 November 2021).
- Bódis, K.; Kougias, I.; Jäger-Waldau, A.; Taylor, N.; Szabó, S. A High-Resolution Geospatial Assessment of the Rooftop Solar Photovoltaic Potential in the European Union. Renew. Sustain. Energy Rev. 2019, 114, 109309. [Google Scholar] [CrossRef]
- Unión Española Fotovoltaica. El Autoconsumo Muestra Su Resiliencia y Avanza Un 30%—UNEF. Available online: https://unef.es/2021/01/el-autoconsumo-muestra-su-resiliencia-y-avanza-un-30/?utm_source=rss&utm_medium=rss&utm_campaign=el-autoconsumo-muestra-su-resiliencia-y-avanza-un-30 (accessed on 8 March 2021).
- Gomez-Exposito, A.; Arcos-Vargas, A.; Gutierrez-Garcia, F. On the Potential Contribution of Rooftop PV to a Sustainable Electricity Mix: The Case of Spain. Renew. Sustain. Energy Rev. 2020, 132, 110074. [Google Scholar] [CrossRef]
- Ibañez Iralde, N.S.; Pascual, J.; Salom, J. Energy Retrofit of Residential Building Clusters. A Literature Review of Crossover Recommended Measures, Policies Instruments and Allocated Funds in Spain. Energy Build. 2021, 252, 111409. [Google Scholar] [CrossRef]
- Heras-Saizarbitoria, I.; Cilleruelo, E.; Zamanillo, I. Public Acceptance of Renewables and the Media: An Analysis of the Spanish PV Solar Experience. Renew. Sustain. Energy Rev. 2011, 15, 4685–4696. [Google Scholar] [CrossRef]
- Sorman, A.H.; García-Muros, X.; Pizarro-Irizar, C.; González-Eguino, M. Lost (and Found) in Transition: Expert Stakeholder Insights on Low-Carbon Energy Transitions in Spain. Energy Res. Soc. Sci. 2020, 64, 1–19. [Google Scholar] [CrossRef]
- Santiago, I.; Moreno-Munoz, A.; Quintero-Jiménez, P.; Garcia-Torres, F.; Gonzalez-Redondo, M.J. Electricity Demand during Pandemic Times: The Case of the COVID-19 in Spain. Energy Policy 2021, 148, 111964. [Google Scholar] [CrossRef]
- Sovacool, B.K. How Long Will It Take? Conceptualizing the Temporal Dynamics of Energy Transitions. Energy Res. Soc. Sci. 2016, 13, 202–215. [Google Scholar] [CrossRef] [Green Version]
- López Prol, J.; Steininger, K.W. Photovoltaic Self-Consumption Regulation in Spain: Profitability Analysis and Alternative Regulation Schemes. Energy Policy 2017, 108, 742–754. [Google Scholar] [CrossRef]
- CNMC. Informe de Supervisión Del Mercado Minorista de Electricidad. Report IS/DE/027/20; CNMC: Madrid, Spain, 2020. [Google Scholar]
- Roldán Fernández, J.M.; Burgos Payán, M.; Riquelme Santos, J.M. Profitability of Household Photovoltaic Self-Consumption in Spain. J. Clean. Prod. 2021, 279, 123439. [Google Scholar] [CrossRef]
- Escobar, P.; Martínez, E.; Saenz-Díez, J.C.; Jiménez, E.; Blanco, J. Modeling and Analysis of the Electricity Consumption Profile of the Residential Sector in Spain. Energy Build. 2020, 206, 109269. [Google Scholar] [CrossRef]
- Olivieri, L.; Caamaño-Martín, E.; Sassenou, L.-N.; Olivieri, F. Contribution of Photovoltaic Distributed Generation to the Transition towards an Emission-Free Supply to University Campus: Technical, Economic Feasibility and Carbon Emission Reduction at the Universidad Politécnica de Madrid. Renew. Energy 2020, 162, 1703–1714. [Google Scholar] [CrossRef]
- Mulder, G.; Six, D.; Claessens, B.; Broes, T.; Omar, N.; Mierlo, J. Van The Dimensioning of PV-Battery Systems Depending on the Incentive and Selling Price Conditions. Appl. Energy 2013, 111, 1126–1135. [Google Scholar] [CrossRef]
- Schopfer, S.; Tiefenbeck, V.; Staake, T. Economic Assessment of Photovoltaic Battery Systems Based on Household Load Profiles. Appl. Energy 2018, 223, 229–248. [Google Scholar] [CrossRef]
- Ayala-Gilardón, A.; Sidrach-de-Cardona, M.; Mora-López, L. Influence of Time Resolution in the Estimation of Self-Consumption and Self-Sufficiency of Photovoltaic Facilities. Appl. Energy 2018, 229, 990–997. [Google Scholar] [CrossRef]
- Cao, S.; Sirén, K. Impact of Simulation Time-Resolution on the Matching of PV Production and Household Electric Demand. Appl. Energy 2014, 128, 192–208. [Google Scholar] [CrossRef]
- Luthander, R.; Widén, J.; Nilsson, D.; Palm, J. Photovoltaic Self-Consumption in Buildings: A Review. Appl. Energy 2015, 142, 80–94. [Google Scholar] [CrossRef] [Green Version]
- Jiménez-Castillo, G.; Rus-Casas, C.; Tina, G.M.; Muñoz-Rodriguez, F.J. Effects of Smart Meter Time Resolution When Analyzing Photovoltaic Self-Consumption System on a Daily and Annual Basis. Renew. Energy 2021, 164, 889–896. [Google Scholar] [CrossRef]
- Talavera, D.L.; De La Casa, J.; Muñoz-Cerón, E.; Almonacid, G. Grid Parity and Self-Consumption with Photovoltaic Systems under the Present Regulatory Framework in Spain: The Case of the University of Jaén Campus. Renew. Sustain. Energy Rev. 2014, 33, 752–771. [Google Scholar] [CrossRef]
- Stauch, A.; Gamma, K. Cash vs. Solar Power: An Experimental Investigation of the Remuneration-Related Design of Community Solar Offerings. Energy Policy 2020, 138, 111216. [Google Scholar] [CrossRef]
- Stikvoort, B.; Bartusch, C.; Juslin, P. Different Strokes for Different Folks? Comparing pro-Environmental Intentions between Electricity Consumers and Solar Prosumers in Sweden. Energy Res. Soc. Sci. 2020, 69, 101552. [Google Scholar] [CrossRef]
- Tibbits, T.N.D.; Beutel, P.; Grave, M.; Karcher, C.; Oliva, E.; Siefer, G.; Wekkeli, A.; Schachtner, M.; Dimroth, F.; Bett, A.W.; et al. “Counting the Sun”: A Dutch Public Awareness Campain on PV Performance. In Proceedings of the 29th European Photovoltaic Solar Energy Conference and Exhibition, Amsterdamn, The Netherlands; 2014; p. 4161. Available online: https://www.eupvsec-proceedings.com/proceedings?paper=31622 (accessed on 1 September 2021).
- Beriain Bañares, A.; Santos Silva, M.F.; Rodríguez Rodríguez, S. Green but Ignored? The Irrelevance of Television Advertisements on Energy Sustainability in Spain and Its Impact on Consumer Perceptions. Energy Res. Soc. Sci. 2021, 73, 1–10. [Google Scholar] [CrossRef]
- Nolden, C.; Barnes, J.; Nicholls, J. Community Energy Business Model Evolution: A Review of Solar Photovoltaic Developments in England. Renew. Sustain. Energy Rev. 2020, 122, 109722. [Google Scholar] [CrossRef]
- Romero-Rubio, C.; de Andrés Díaz, J.R. Sustainable Energy Communities: A Study Contrasting Spain and Germany. Energy Policy 2015, 85, 397–409. [Google Scholar] [CrossRef]
- Zafrilla, J.E.; Arce, G.; Cadarso, M.Á.; Córcoles, C.; Gómez, N.; López, L.A.; Monsalve, F.; Tobarra, M.Á. Triple Bottom Line Analysis of the Spanish Solar Photovoltaic Sector: A Footprint Assessment. Renew. Sustain. Energy Rev. 2019, 114, 109311. [Google Scholar] [CrossRef]
- JRC Photovoltaic Geographical Information System (PVGIS)—European Commission. Available online: https://re.jrc.ec.europa.eu/pvg_tools/en/#PVP (accessed on 5 March 2021).
- Autosolar Energy Solutions. Available online: https://autosolar.es/kits-solares-conexion-red/ (accessed on 5 April 2021).
- Selectra Kit Solar. Available online: https://selectra.es/autoconsumo/info/instalacion/kit-solar (accessed on 5 April 2021).
- SolarPlak Solar Online Store. Available online: https://solarplak.es/kits-solares-autoconsumo (accessed on 5 April 2021).
- Voluntary Price for the Small Consumer (PVPC)|Red Eléctrica de España. Available online: https://www.ree.es/en/activities/operation-of-the-electricity-systemvoluntary-price-small-consumer-pvpc (accessed on 23 November 2021).
- Pereira, L.; Quintal, F.; Gonçalves, R.; Jardim Nunes, N. SustData: A Public Dataset for ICT4S Electric Energy Research. In Proceedings of the 2nd International Conference on ICT for Sustainability (ICT4S 2014), Stockholm, Sweden, 24–27 August 2014. [Google Scholar] [CrossRef] [Green Version]
- IDEA. Consumos Del Sector Residencial en España Resumen de Información Básica; Instituto para la Diversificación y Ahorro de la Energía: Madrid, Spain, 2011. [Google Scholar]
- D’Agostino, A.L.; Sovacool, B.K.; Trott, K.; Ramos, C.R.; Saleem, S.; Ong, Y. What’s the State of Energy Studies Research: A Content Analysis of Three Leading Journals from 1999 to 2008. Energy 2011, 36, 508–519. [Google Scholar] [CrossRef]
- Herbes, C.; Ramme, I. Online Marketing of Green Electricity in Germany-A Content Analysis of Providers’ Websites. Energy Policy 2014, 66, 257–266. [Google Scholar] [CrossRef]
- Levihn, F. CO2 Emissions Accounting: Whether, How, and When Different Allocation Methods Should Be Used. Energy 2014, 68, 811–818. [Google Scholar] [CrossRef]
- Red Eléctrica de España Inventory of CO2 Emissions of Red Eléctrica de España, S.A.U.; Scope and Methodology; 2017. Available online: https://www.ree.es/sites/default/files/04_SOSTENIBILIDAD/Documentos/inventory_of_CO2_emissions_REE_scope_and_methodology_2013_v2.pdf (accessed on 1 September 2021).
- Seyfang, G.; Park, J.J.; Smith, A. A Thousand Flowers Blooming? An Examination of Community Energy in the UK. Energy Policy 2013, 61, 977–989. [Google Scholar] [CrossRef]
- Islar, M.; Busch, H. “We Are Not in This to Save the Polar Bears!”—The Link between Community Renew. Energy Development and Ecological Citizenship. Innovation 2016, 29, 303–319. [Google Scholar] [CrossRef]
- Bauwens, T. Explaining the Diversity of Motivations behind Community Renew. Energy. Energy Policy 2016, 93, 278–290. [Google Scholar] [CrossRef]
- Wuebben, D.; Romero-Luis, J.; Gertrudix, M. Citizen Science and Citizen Energy Communities: A Systematic Review and Potential Alliances for SDGs. Sustainability 2020, 12, 10096. [Google Scholar] [CrossRef]
- Instituto para la Diversificación y Ahorro de la Energía (IDAE). Guia Profesional de Tramitación Del Autoconsumo; Instituto para la Diversificación y Ahorro de la Energía (IDAE): Madrid, Spain, 2020. [Google Scholar]
- Gamaza, R. Seis Preguntas Clave Para El Autoconsumo Solar. Available online: https://www.facua.org/es/noticia.php?Id=15149 (accessed on 17 December 2021).
Figure 1.
Load and generation curves for two arbitrarily picked working days, one in winter and one in summer. Dark blue line: daily demand curve averaged over the whole month; light grey: actual demand with minute resolution for the given day; red dotted: PV generation. The high fluctuation in actual demand becomes evident when comparing wth the average daily demand curve, with numerous sharp peaks significantly exceeding the PV generation power, thus requiring additional grid electricity. These peaks are not visible when using hourly average values, leading to an overestimation of PVSC benefits. Additional figures for weekend days are provided in the Research Data.

Figure 2.
Self consumption rate (SC-rate) and net present value (NPV) for the four households individually (HH1–HH4) and as solar community (Solar Comm), both with houly (hr) and minute by minute (min) time resolution. The overestimation of both SC-rate and NPV when applying hourly time resolution is evident, with the actual benefit (darker columns) being between 18% and 29% lower than estimated based on hourly values. For the solar community, the discrepancy is noteworthily lower than for the individual households.

Table 2.
Summary statistics of the power uptake (in Watts) of the individual households (HH1–HH4) and the solar community (Solar Comm), where all four households are grouped together.
Table 2.
Summary statistics of the power uptake (in Watts) of the individual households (HH1–HH4) and the solar community (Solar Comm), where all four households are grouped together.
| Minute by Minute | Hourly Average by Month | |||||||||
|---|---|---|---|---|---|---|---|---|---|---|
| Obs | Mean | Std. Dev. | Min | Max | Obs | Mean | Std. Dev. | Min | Max | |
| HH1 | 694,433 | 379.5 | 677.0 | 0.0 | 6900.6 | 288 | 400.9 | 304.9 | 45.2 | 1649.3 |
| HH2 | 518,857 | 278.9 | 327.0 | 2.1 | 4326.7 | 288 | 281.1 | 119.2 | 130.8 | 671.9 |
| HH3 | 563,495 | 641.1 | 713.7 | 4.0 | 5023.2 | 288 | 645.2 | 347.2 | 177.4 | 1919.5 |
| HH4 | 684,242 | 683.8 | 613.7 | 4.4 | 5050.4 | 288 | 680.1 | 193.1 | 369.5 | 1193.4 |
| Solar Comm | 442,208 | 2017.0 | 1338.3 | 39.9 | 13,282.3 | 288 | 2083.7 | 774.5 | 768.1 | 5238.2 |
Table 3.
Data collected from actual solar PV installation proposals for a midsize apartment in Madrid solicited from home solar providers and installers in March 2021. (* We inserted a common Kk factor of 1500 KWh/KWp to calculate annual production where it was not provided. ** We divided the proposed 10-year savings of 3370 € to an average of 337 € annually to provide clearer comparisons with other providers.)
| Size/ Panels | Total Cost € | Potential | Price | Annual Production kWh | Kk Factor kWh/kWp | Self-Consumption % | Amortize | Savings/Year | Benefits: Trees, CO2, km Driven | |
|---|---|---|---|---|---|---|---|---|---|---|
| Non-Profits | ||||||||||
| A | 10 | 5693 € | 4.4 kWp | 1293 €/kWp | 4500 | 1000 | 8 | |||
| B | 4 * | 4290 € | 1.52 kWp | 2822 €/kWp | 2204 | 1450 | 51% | 13 | 230 € | 441 kg/year |
| Small Businesses | ||||||||||
| C | 10 | 5024 € | 3.4 kWp | 1477 €/kWp | 5300 | 1558 | 401,53 € | 2814 kg/year or 2.34388 km in car | ||
| D | 5 | 4668 € | 1.67 kWp | 2795 €/kWp | * 2512 | 1500 * | 38.8 | 337 € ** | 290.3 kg/year or 398 trees planted | |
| E | 10 | 6242 € | 5175 | 166 trees planted or 260,000 km in car | ||||||
| F | 6 | 4931 € | 2.28 kWp | 2162 €/kWp | * 3420 | 1500 * | 35% | 10.24 | 428 € | 2957 kg/per year |
| G | 4 | 3925 € | 1.76 kWp | 2230 €/kWp | 2187 | 1242 | 32% | 249 € |
Table 4.
Optimum size, installation costs and economic return estimated for the households (HH1–HH4) and the solar community (Solar Comm) under consideration of different time resolutions (minute and hour). SC-rate = self-consumption rate; SS-rate = self-sufficiency rate; IRR20 = internal rate of return, 20 y perspective; NPV20 = net present value, 20 y perspective. The table further highlights the value and benefits of community solar. * The required roof area for the estimated size of the PV installation without shade.
| Household | HH1 | HH2 | HH3 | HH4 | Solar Com | |||||
|---|---|---|---|---|---|---|---|---|---|---|
| Electr. demand | 294 kWh | 205 kWh | 471 kWh | 497 kWh | 1466 kWh | |||||
| (85–645) | (165–242) | (433–510) | (436–601) | (1199–1886) | ||||||
| Time res. | 1 h | 1 min | 1 h | 1 min | 1 h | 1 min | 1 h | 1 min | 1 h | 1 min |
| Opt. size [kWp] | 1.04 | 0.98 | 2.36 | 2.73 | 7.39 | |||||
| Inst. Cost [€] | 1252 € | 1176 € | 2835 € | 3275 € | 8871 € | |||||
| Roof area [m2] * | 5.48 | 5.15 | 12.40 | 14.33 | 38.81 | |||||
| SC-rate [%] | 64.8% | 45.8% | 63.7% | 51.2% | 63.3% | 51.0% | 60.8% | 51.3% | 62.3% | 58.5% |
| SS rate [%] | 31.1% | 21.9% | 41.0% | 33.0% | 42.9% | 34.5% | 45.1% | 38.1% | 42.3% | 39.8% |
| Benefit (1st year; €/y) | 166 € | 146 € | 160 € | 144 € | 385 € | 347 € | 436 € | 402 € | 1194 € | 1158 € |
| IRR20 [%] | 13.7% | 11.2% | 14.2% | 12.1% | 14.1% | 12.1% | 13.7% | 12.2% | 14.0% | 13.3% |
| NPV20 [€] | 892 € | 636 € | 893 € | 689 € | 2139 € | 1651 € | 2357 € | 1924 € | 6564 € | 6094 € |
| Amortization (y) | 9 | 11 | 9 | 10 | 9 | 10 | 9 | 10 | 9 | 9 |
Publisher’s Note: MDPI stays neutral with regard to jurisdictional claims in published maps and institutional affiliations. |
© 2022 by the authors. Licensee MDPI, Basel, Switzerland. This article is an open access article distributed under the terms and conditions of the Creative Commons Attribution (CC BY) license (https://creativecommons.org/licenses/by/4.0/).
Share and Cite
MDPI and ACS Style
Wuebben, D.; Peters, J.F. Communicating the Values and Benefits of Home Solar Prosumerism. Energies 2022, 15, 596. https://0-doi-org.brum.beds.ac.uk/10.3390/en15020596
AMA Style
Wuebben D, Peters JF. Communicating the Values and Benefits of Home Solar Prosumerism. Energies. 2022; 15(2):596. https://0-doi-org.brum.beds.ac.uk/10.3390/en15020596
Chicago/Turabian StyleWuebben, Daniel, and Jens F. Peters. 2022. "Communicating the Values and Benefits of Home Solar Prosumerism" Energies 15, no. 2: 596. https://0-doi-org.brum.beds.ac.uk/10.3390/en15020596
Note that from the first issue of 2016, this journal uses article numbers instead of page numbers. See further details here.