
Techno-Economic Analysis of Utility-Scale Solar Photovoltaic Plus Battery Power Plant

Department of Electrical and Electronic Engineering, Faculty of Engineering, University of Mauritius, Réduit 80837, Mauritius
*
Author to whom correspondence should be addressed.
Energies 2021, 14(23), 8145; https://0-doi-org.brum.beds.ac.uk/10.3390/en14238145
Submission received: 2 November 2021
/
Revised: 29 November 2021
/
Accepted: 1 December 2021
/
Published: 5 December 2021
(This article belongs to the Special Issue Solar Photovoltaics and Solar Power Plants)
Abstract
:Decarbonizing the global power sector is a key requirement to fight climate change. Consequently, the deployment of renewable energy (RE) technologies, notably solar photovoltaic (PV), is proceeding rapidly in many regions. However, in many of these regions, the evening peak is predominantly being served by fossil-fired generators. Furthermore, as the evening peak is projected to increase in the coming years, there are plans to install more fossil-fired peaking generators. A cleaner alternative is to enable solar PV plants to provide clean power after sunset by pairing them with large-scale lithium-ion batteries to provide evening peak generation. In this work, we performed a techno-economic analysis of a solar PV plus battery (PVB) power plant using the island of Mauritius as a case study. We assessed the impacts of the battery size, inverter loading ratio (ILR), tracking type, and curtailment on the levelized cost of electricity (LCOE). The main results show that the LCOE of utility-scale PVB systems are comparable to that of fossil-fired peaking generators for this case study. Tracking was shown to exacerbate the clipping loss problem and its benefits on LCOE reduction decrease as the ILR increases. The availability of the PVB system to serve the evening peak was found to be high. The curtailment analysis also showed that planners must not rely solely on storage, but rather should also improve grid flexibility to keep PVB integration affordable. Overall, the practical insights generated will be useful to utility planners in charting their generation expansion strategy.
1. Introduction
The Paris Agreement, a legally binding international treaty on climate change, was adopted by 196 parties in December 2015. Its objective is to limit the increase in the global average temperature to well below 2 °C above pre-industrial levels and to pursue efforts to limit the temperature to 1.5 °C above pre-industrial levels [1]. Decarbonizing the power sector using renewable energy (RE) sources is a key component in meeting the objective of the Paris Agreement. This is because the global power sector, still highly reliant on fossil fuels, is the largest emitter of carbon dioxide (CO2), accounting for nearly 40% of emissions across the energy sector [2]. Consequently, many countries have drawn strategies and set targets for the decarbonization of their power sectors. For those countries and regions that have good solar energy potential, solar photovoltaic (PV) power has become a key element of their decarbonization strategy, thanks largely to the significant decline in prices of PV modules over the last decade (a fall of 93% since 2010 [3]). However, while a significant portion of the daytime electricity demand could potentially be served by cheap solar PV, in the absence or low availability of firm renewables, the evening peak would still predominantly be served by generators running on fossil fuels such as natural gas, heavy fuel oil, and diesel. Furthermore, it is expected that in many countries and regions, the evening peak demand will increase further over the years, which could prompt the installation of more fossil-fired generation, contradicting the essence of the Paris Agreement. Clearly, a more sustainable solution is required to serve the evening peak and techno-economic analysis of potential solution technologies need to be prioritized.
With the significant decline in costs of lithium-ion batteries over the recent years [4], utility-scale solar PV systems that are paired with lithium-ion batteries are becoming more common. For example, solar PV plus battery (PVB) systems have been deployed in the USA [5], China [6], and French islands [7], amongst other locations. The key advantage of the PVB plant is the possibility to provide clean solar energy after sunset to meet the evening peak. As the efforts to decarbonize our energy system intensify to mitigate the impacts of climate change, PVB as a peaking generator can become an indispensable candidate in the generation expansion plans of those regions which are relying on solar PV to achieve their decarbonization targets. Consequently, it is vital that the techno-economic features of PVB systems be analyzed to gain key insights in their applicability.
Denholm et al. [8] described the different configurations of PVB and assessed their cost/benefit ratio. These configurations are summarized in Table 1 below. The authors concluded that direct current (DC) coupling can increase the benefit/cost ratio of the PV plus storage systems and their economic deployment can be bolstered by further cost declines.
DiOrio et al. [9] presented a model to assess the configuration of PVB power plants and they concluded that such plants are economically viable under certain conditions, with the configurations impacting flexibility and performance. Roy et al. [10] performed a technical feasibility assessment between a utility-scale PV plus battery energy storage system and a natural gas-fired peaker plant from the point of view of capacity factor and lifetime cost of operation. The conclusion is that PV plus storage can provide a high-capacity factor over the evening peak period and at a lower lifetime cost of operation compared to a gas peaker. Agyekum [11] performed a techno-economic comparative analysis of PV and PVB systems, and concluded that fixed-axis PVB systems are not economically viable in Ghana. However, single and dual axis tracking systems could have a significant impact on the technical and economic performance of the plants. Perkins [12] compared the levelized cost of energy (LCOE) of PVB and PV plus combustion of bio-crude and biogas from biomass and concluded that solar PV plus biomass, albeit a niche solution, provides dispatchable RE generation that is competitively priced and expected to be cheaper than PV plus battery for the foreseeable future. Motivated by the significant drop in the price of PV modules over the recent years, Gordon et al. [13] proposed and evaluated an unconventional combination of solar PV and molten-salt thermal storage. Laajimi and Go [14] studied the profitability of zinc bromide flow batteries combined with large-scale solar PV for Malaysia. They conclude that storage as investment is not generally financially profitable in their context and only those systems that have a small ratio of storage to PV output are profitable. Kosmadakis et al. [15], performed simulations for six small scale (7.44 kWp of PV capacity) PVB configurations in Greece and the LCOE ranged from 0.17 to 0.24 €/kWh, indicating a declining trend in the cost of electricity generated by such systems. Luerssen et al. [16] evaluated the levelized cost of storage (LCOS) of electricity and thermal energy storage for PV-powered cooling applications. They concluded that thermal energy storage has a better potential for more energy-intensive application. Al-Khori et al. [17] performed a techno-economic comparison between a PVB and a PV plus solid oxide fuel cell (PV-SOFC) for natural gas processing plants. The LCOE for the PV-BESS was determined to be 0.16 USD/kWh, while that of the PV-SOFC was 0.11 USD/kWh, leading to the conclusion that PV-SOFC is the more economical option. Recently, using a price-taker dispatch algorithm, Schleifer et al. [18] investigated how the value of PVB could evolve up to 2050 in the US power market. Their analysis provided several important insights relevant to mature markets of developed countries. However, the authors also point out that their study did not consider the impact of battery size and inverter loading ratio (The inverter loading ratio (ILR), also known as the DC to alternating current (AC) ratio, refers to the ratio of total DC capacity of the PV array to the total AC capacity of the inverters.).
Bullich-Massagué et al. [19] reviewed the most appropriate energy storage technologies for large scale PV plants and the grid services the PV plants must or can provide with energy storage requirements. Importantly, they also discussed the advantages and disadvantages of the different location of the energy storage within the PV plant, that is, alternating current (AC) and DC coupling. They concluded that the best energy storage locations depend on the specific application, but that more research is necessary to arrive at reliable conclusions. Lo Franco et al. [20] made an efficiency comparison between DC and AC coupling for a large-scale PV-BESS power plant and demonstrated that the DC-coupling configuration has a higher efficiency. Edoo and Ah King [21], as part of their analysis of the technical challenges and solutions to integrate more RE in the island power system of Mauritius, recommended the assessment of DC-coupled solar PVB. The advantages of the DC-coupled PVB are the reduced round-trip losses and the ability to accept otherwise clipped energy in PV systems with high inverter loading ratios. In contrast, the disadvantages of the independent coupling configuration include lower round-trip efficiency and the challenge of charging the independent battery system exclusively with variable renewable energy (VRE).
This work focusses on the techno-economic assessment of the DC-coupled PVB system using the case study of the island of Mauritius, which ratified the Paris Agreement in 2016. There is presently a paucity of research dealing with in-depth parametric analysis of the techno-economic performance of PVB systems, and this work intends to fill that gap. Specifically, the objectives of this paper are to:
- Assess the impacts of design parameters such as ILR, battery size, and type of tracking on the levelized cost of energy (LCOE) of the PVB system.
- Determine whether the PVB installation can provide an adequate capacity factor for the evening peak.
- Quantify the impacts of curtailment on the LCOE of the PVB. This is an important aspect because many power grids, having already integrated relatively large amounts of VRE, are finding it challenging to accept further increases. Thus, in some cases, operators are resorting to curtailment when the integration limits are reached.
- Compare the LCOE of selected configurations of PVB with that of conventional generation used for peaking in the case of Mauritius and determine whether PVB is a viable candidate generation technology for generation planning in the island.
In this work, LCOE is chosen as the key metric for assessment of viability of the system, as it is a widely used first order measure by which power generation technologies can be compared [3]. Consequently, the results will be particularly relevant to utility planners and government policy makers who have to select the most effective generation technology as part of their generation expansion planning.
Following this introduction, Section 2 describes the materials and methods, namely, the site selected for the study and the meteorological, technical, cost, and financial data, as well as the software employed for simulation of the PVB systems. Section 3 presents the results of the simulation exercises and discusses their implications. Finally, in Section 4, the conclusions are presented, the limitations are discussed, and future work directions are provided.
2. Materials and Methods
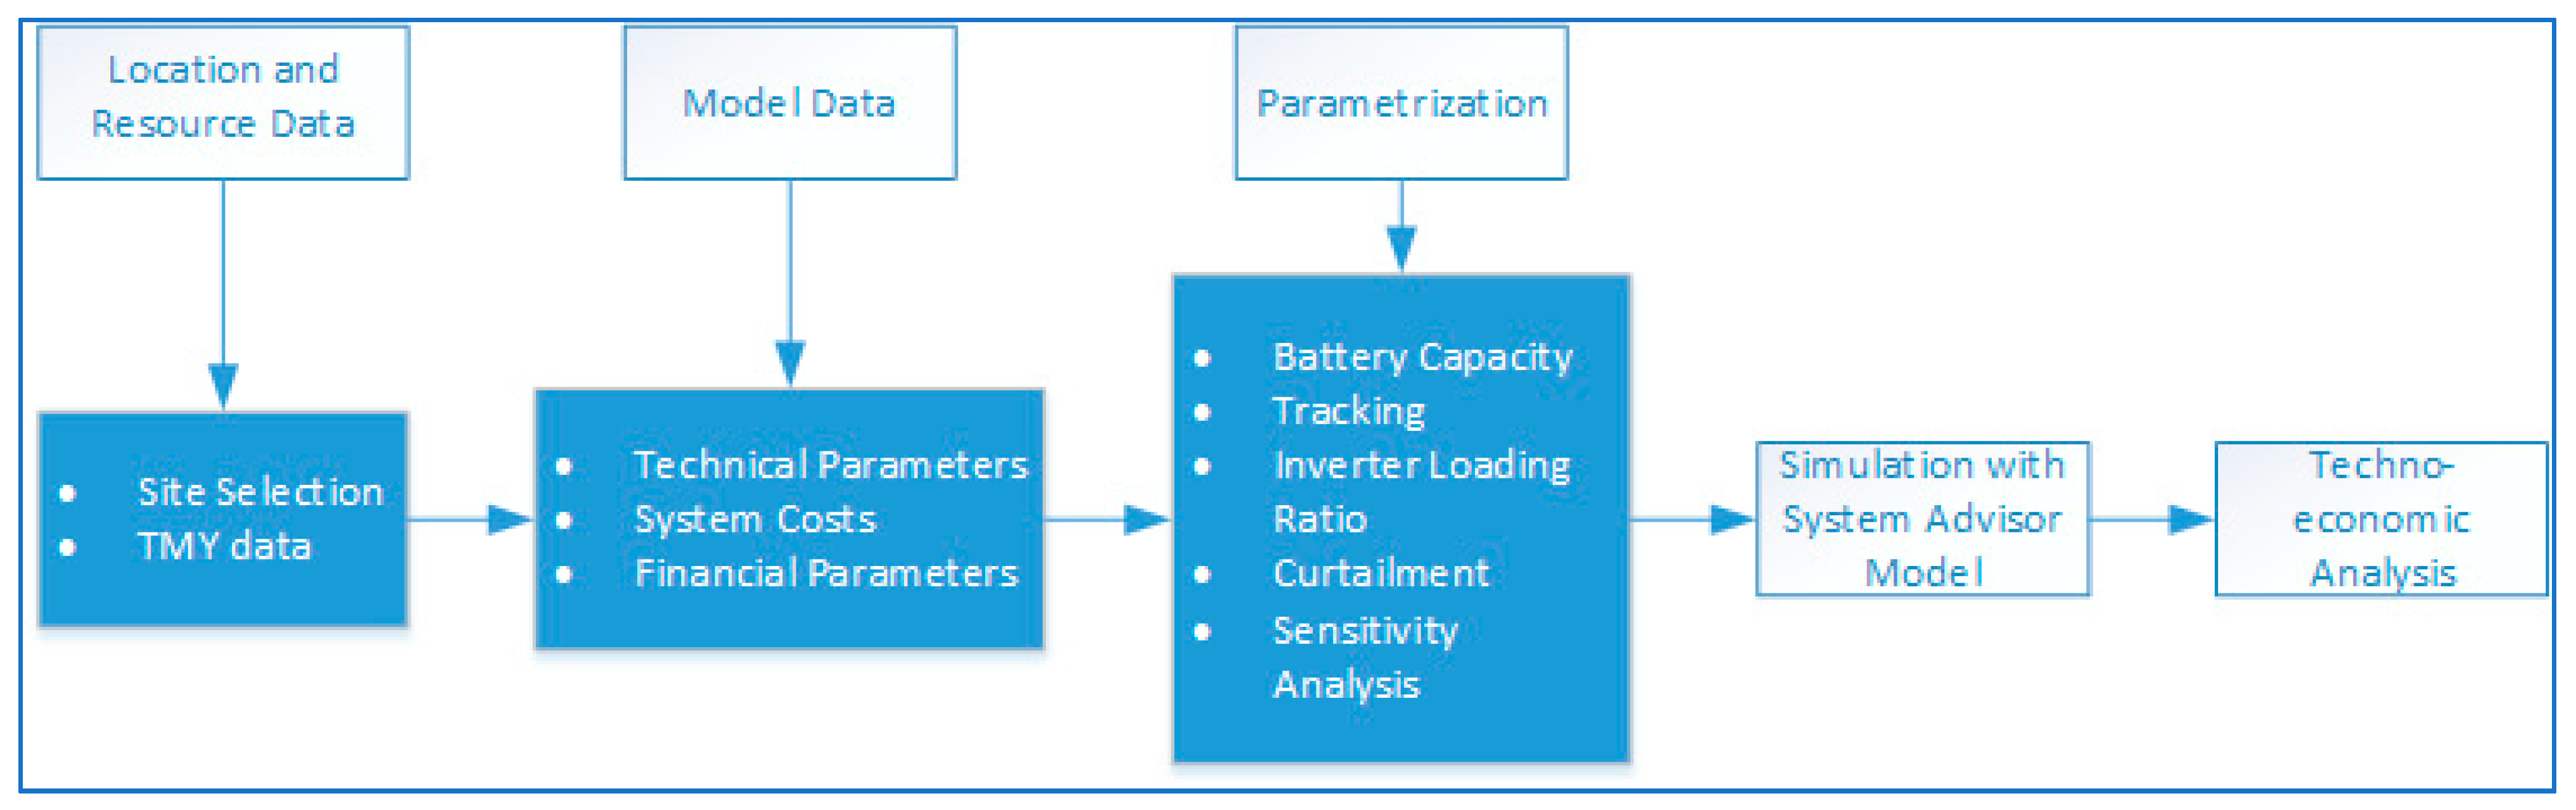
In this study, the System Advisor Model (SAM) (National Renewable Energy Laboratory, Golden, CO, USA), Version 2020.11.29 [22], has been used to simulate the PV plus battery plant and analyze its technical and economic performance. SAM is a free software developed by the National Renewable Energy Laboratory. SAM has been used in a large number of studies for many types of renewable energy projects, such as the techno-economic analysis of PV systems [11], to explore the value of adding batteries to a net-zero energy PV system [23]; the techno-economic analysis of concentrated solar power (CSP) in Tanzania [24], Iran [25], and Saudi Arabia [26]; and the economic viability of CSP under different regulatory regimes in Spain [27], for example. Therefore, SAM is recognized as a dependable software. Figure 1 summarizes the analytical framework that was employed in this study. The different steps are described in detail in the next sections.
2.1. Site Selection
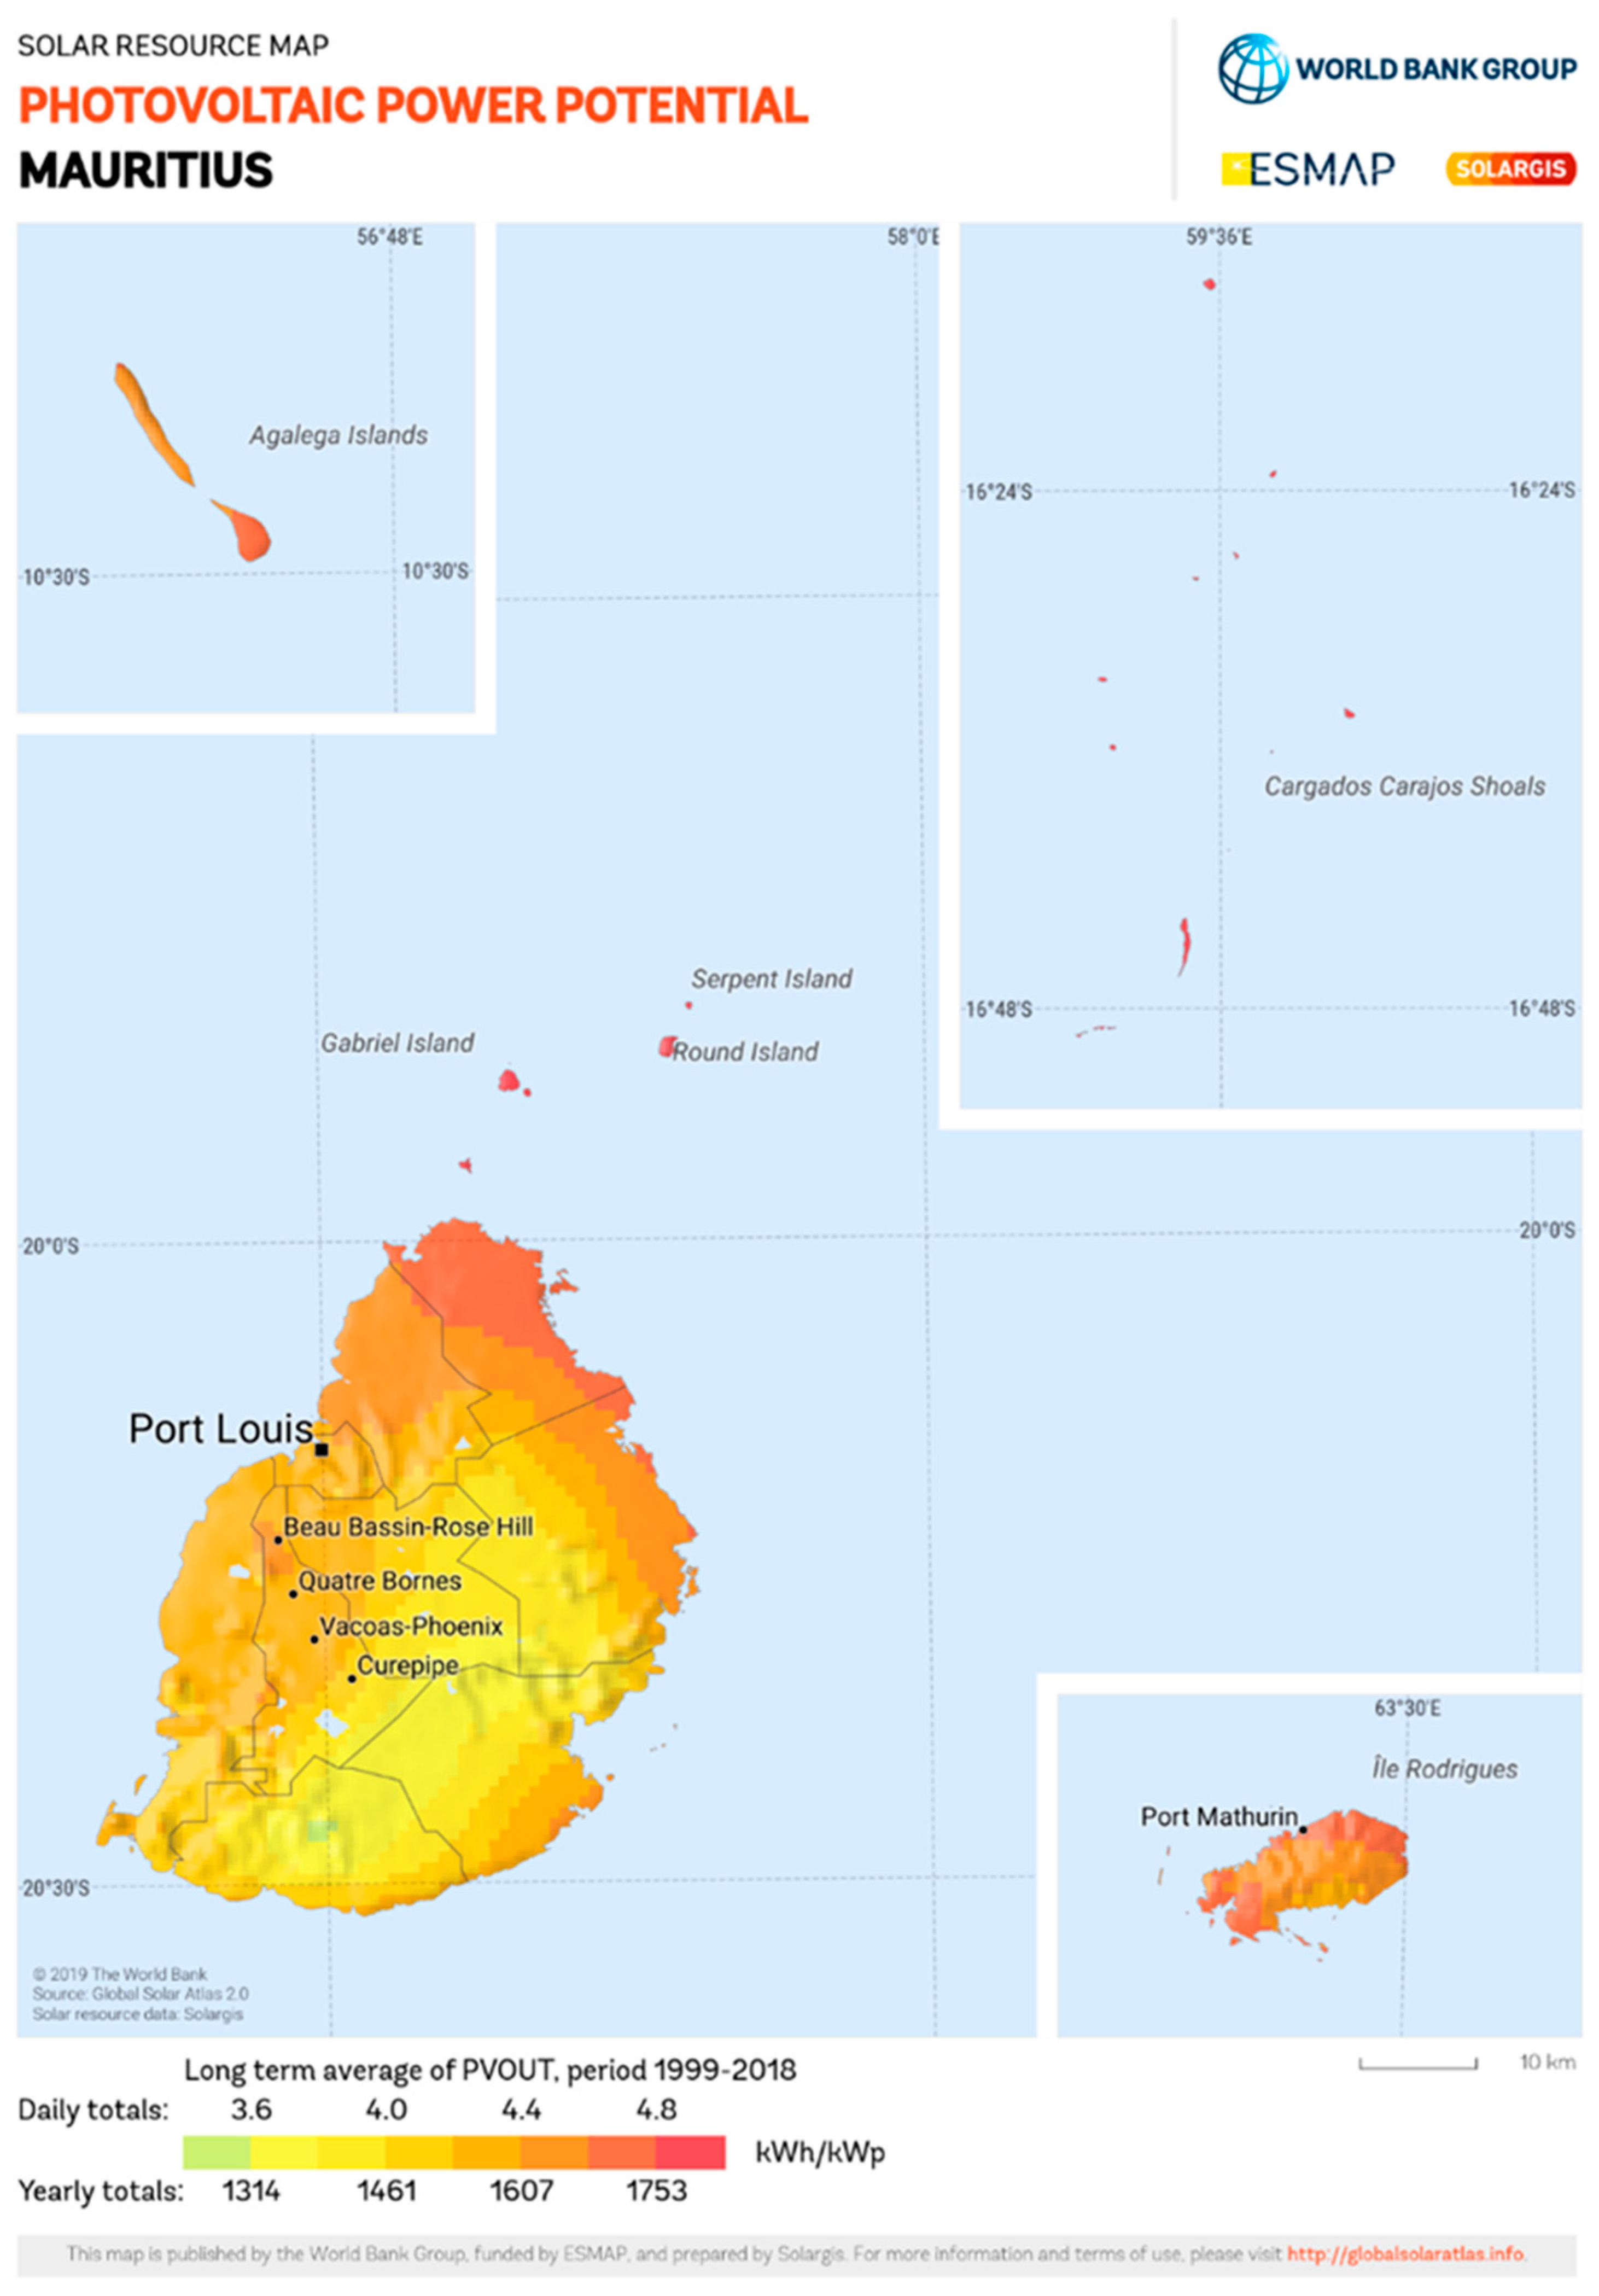
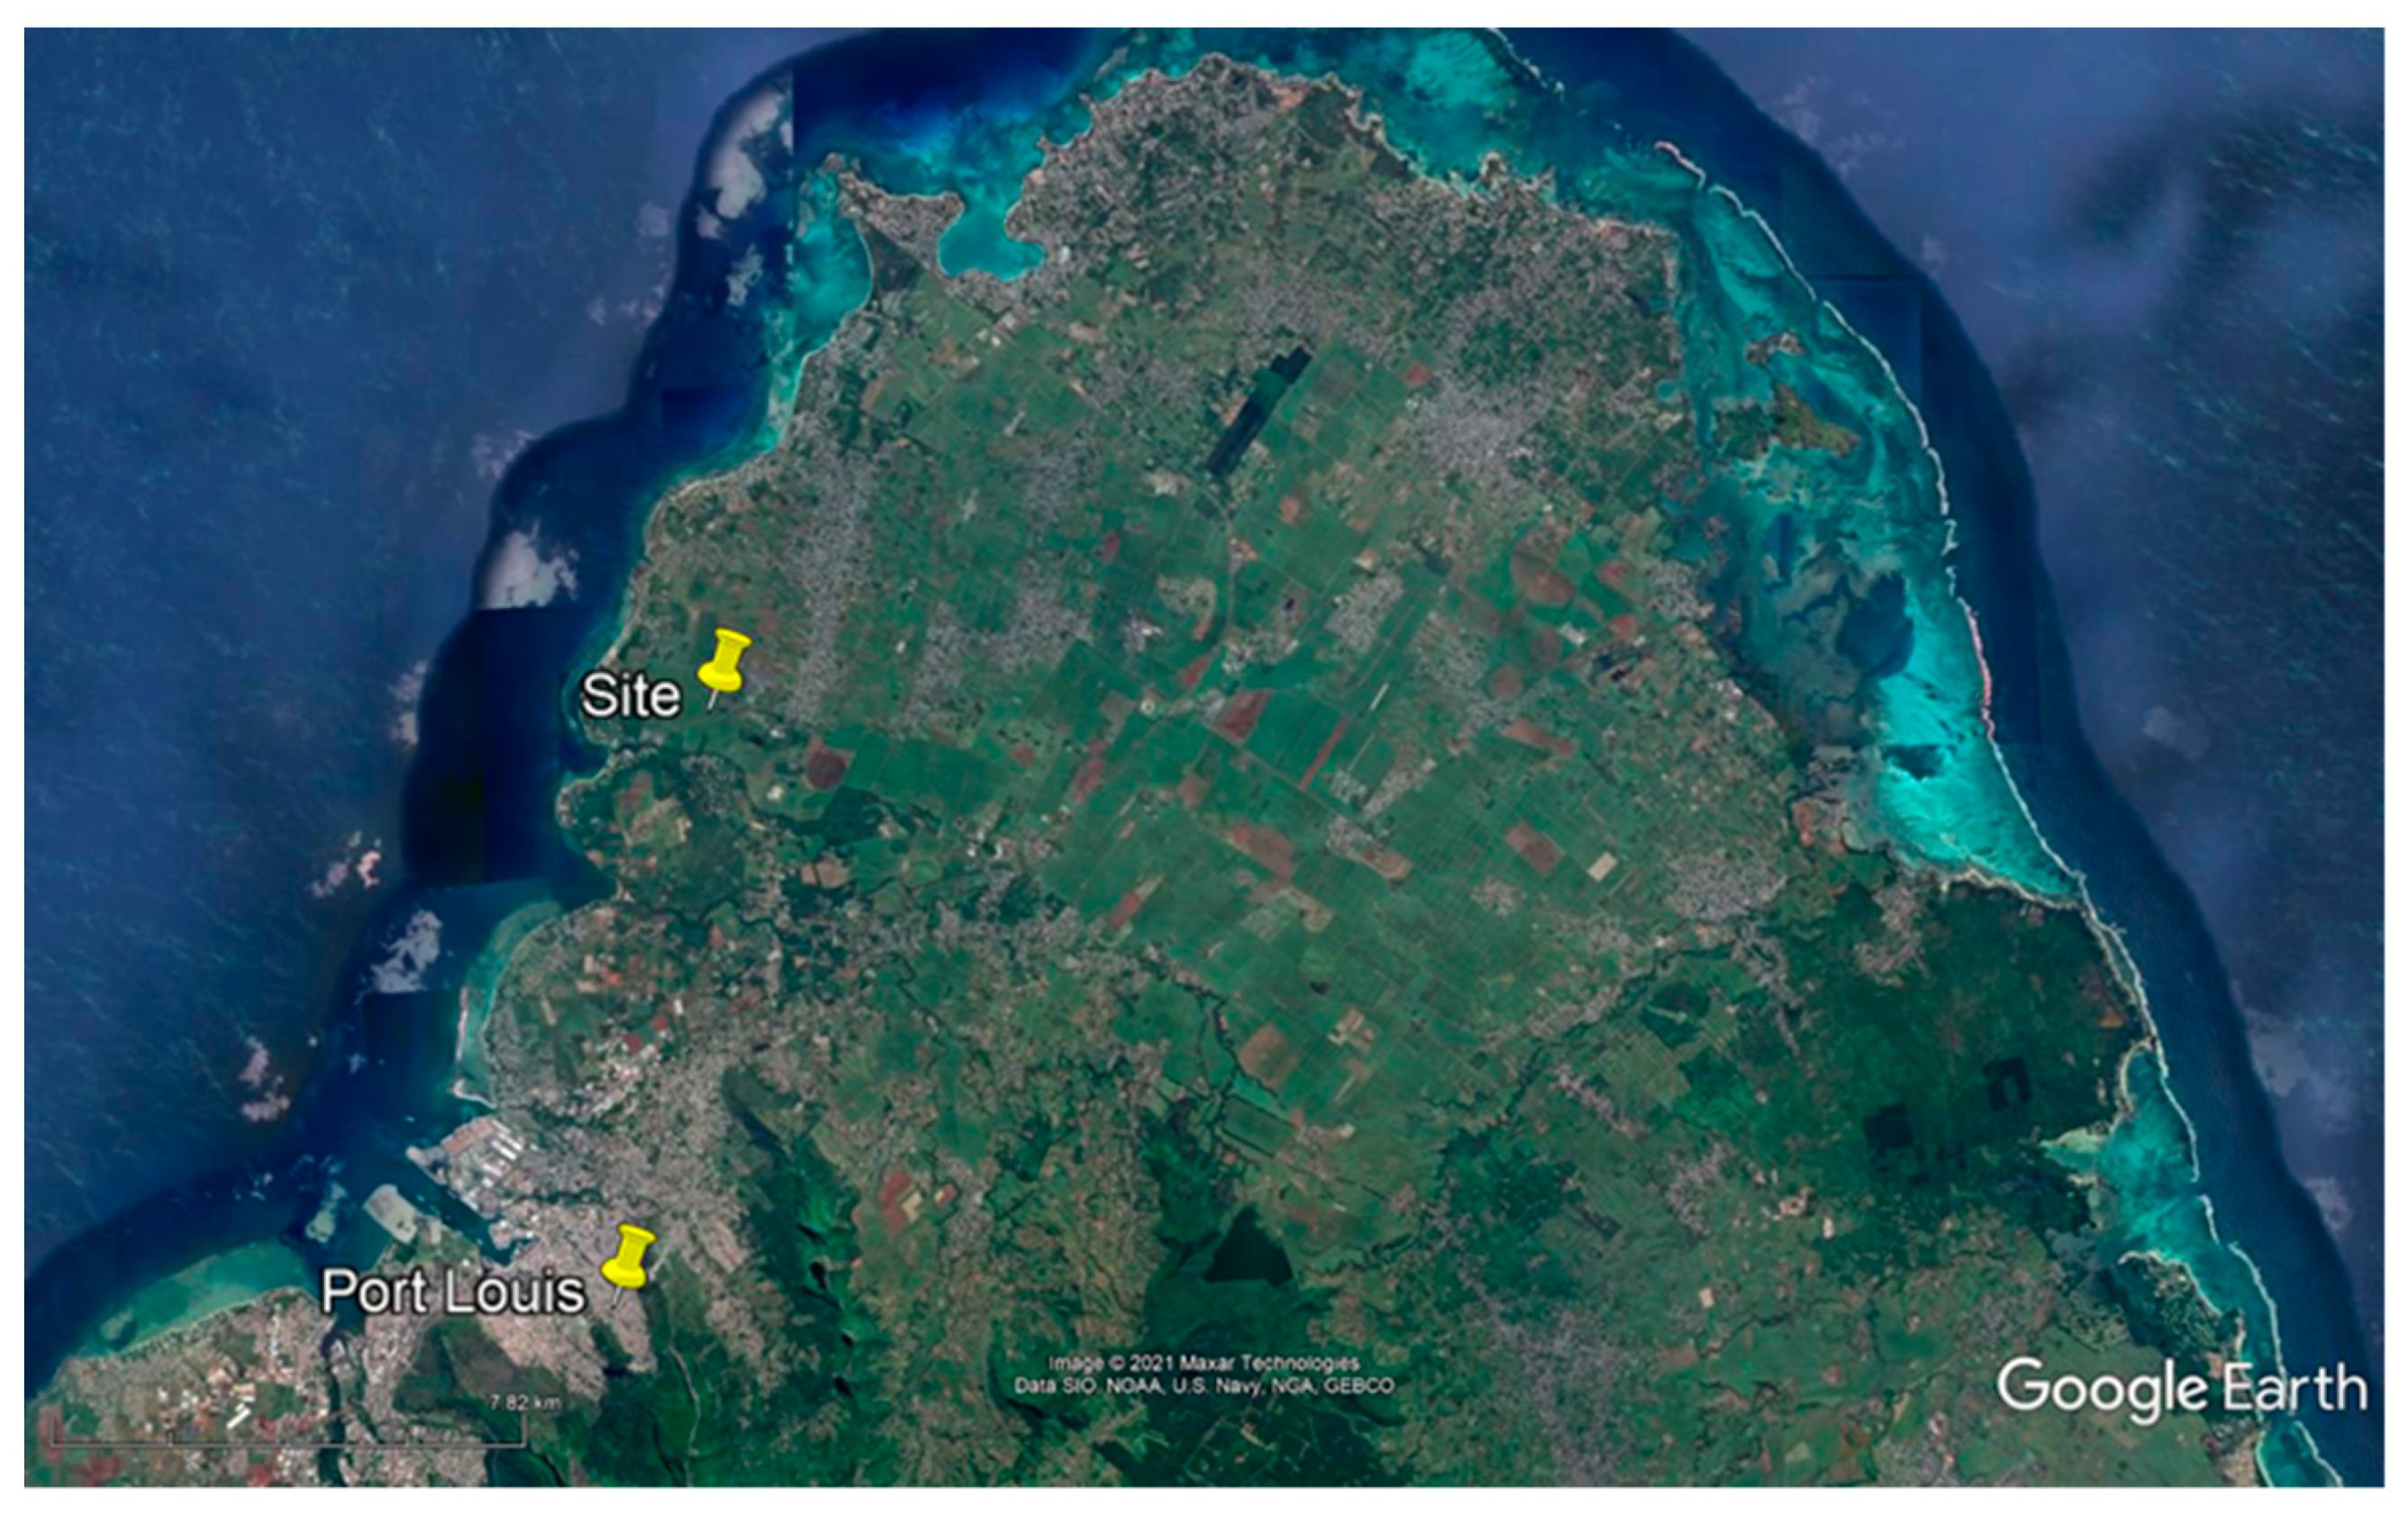
The island of Mauritius (hereafter Mauritius) is situated about 2000 km off the southeast coast of the African continent, east of Madagascar [28], and has a surface area of 1964 km2 [29]. Being located near the tropic of Capricorn, between latitudes 19°58.8′ S and 20°31.7′ S and longitudes 57°18.0′ E and 57°46.5′ E [28], Mauritius enjoys a sunny climate all year round [30]. As shown in Figure 2, the electricity generation potential from PV on the island is good, with an average practical PV potential of 1536 kWh/kWp/year [31]. For this work, as shown in Figure 3, the chosen site will be in the north of the island (latitude −20.076, longitude 57.538 and elevation 30 m), near the village of Solitude, which is located about 10 km north of Port-Louis, the capital of the country. In fact, the site is very close to that of an independent power producer (IPP) utility-scale PV plant, so this study will provide a good idea of the economic viability of a project on a site that is chosen by a developer. From Figure 3, the satellite imagery, it is worth noting that near the site, there are still large areas with good solar potential available for PV and PVB projects.
2.2. Meteorological Data
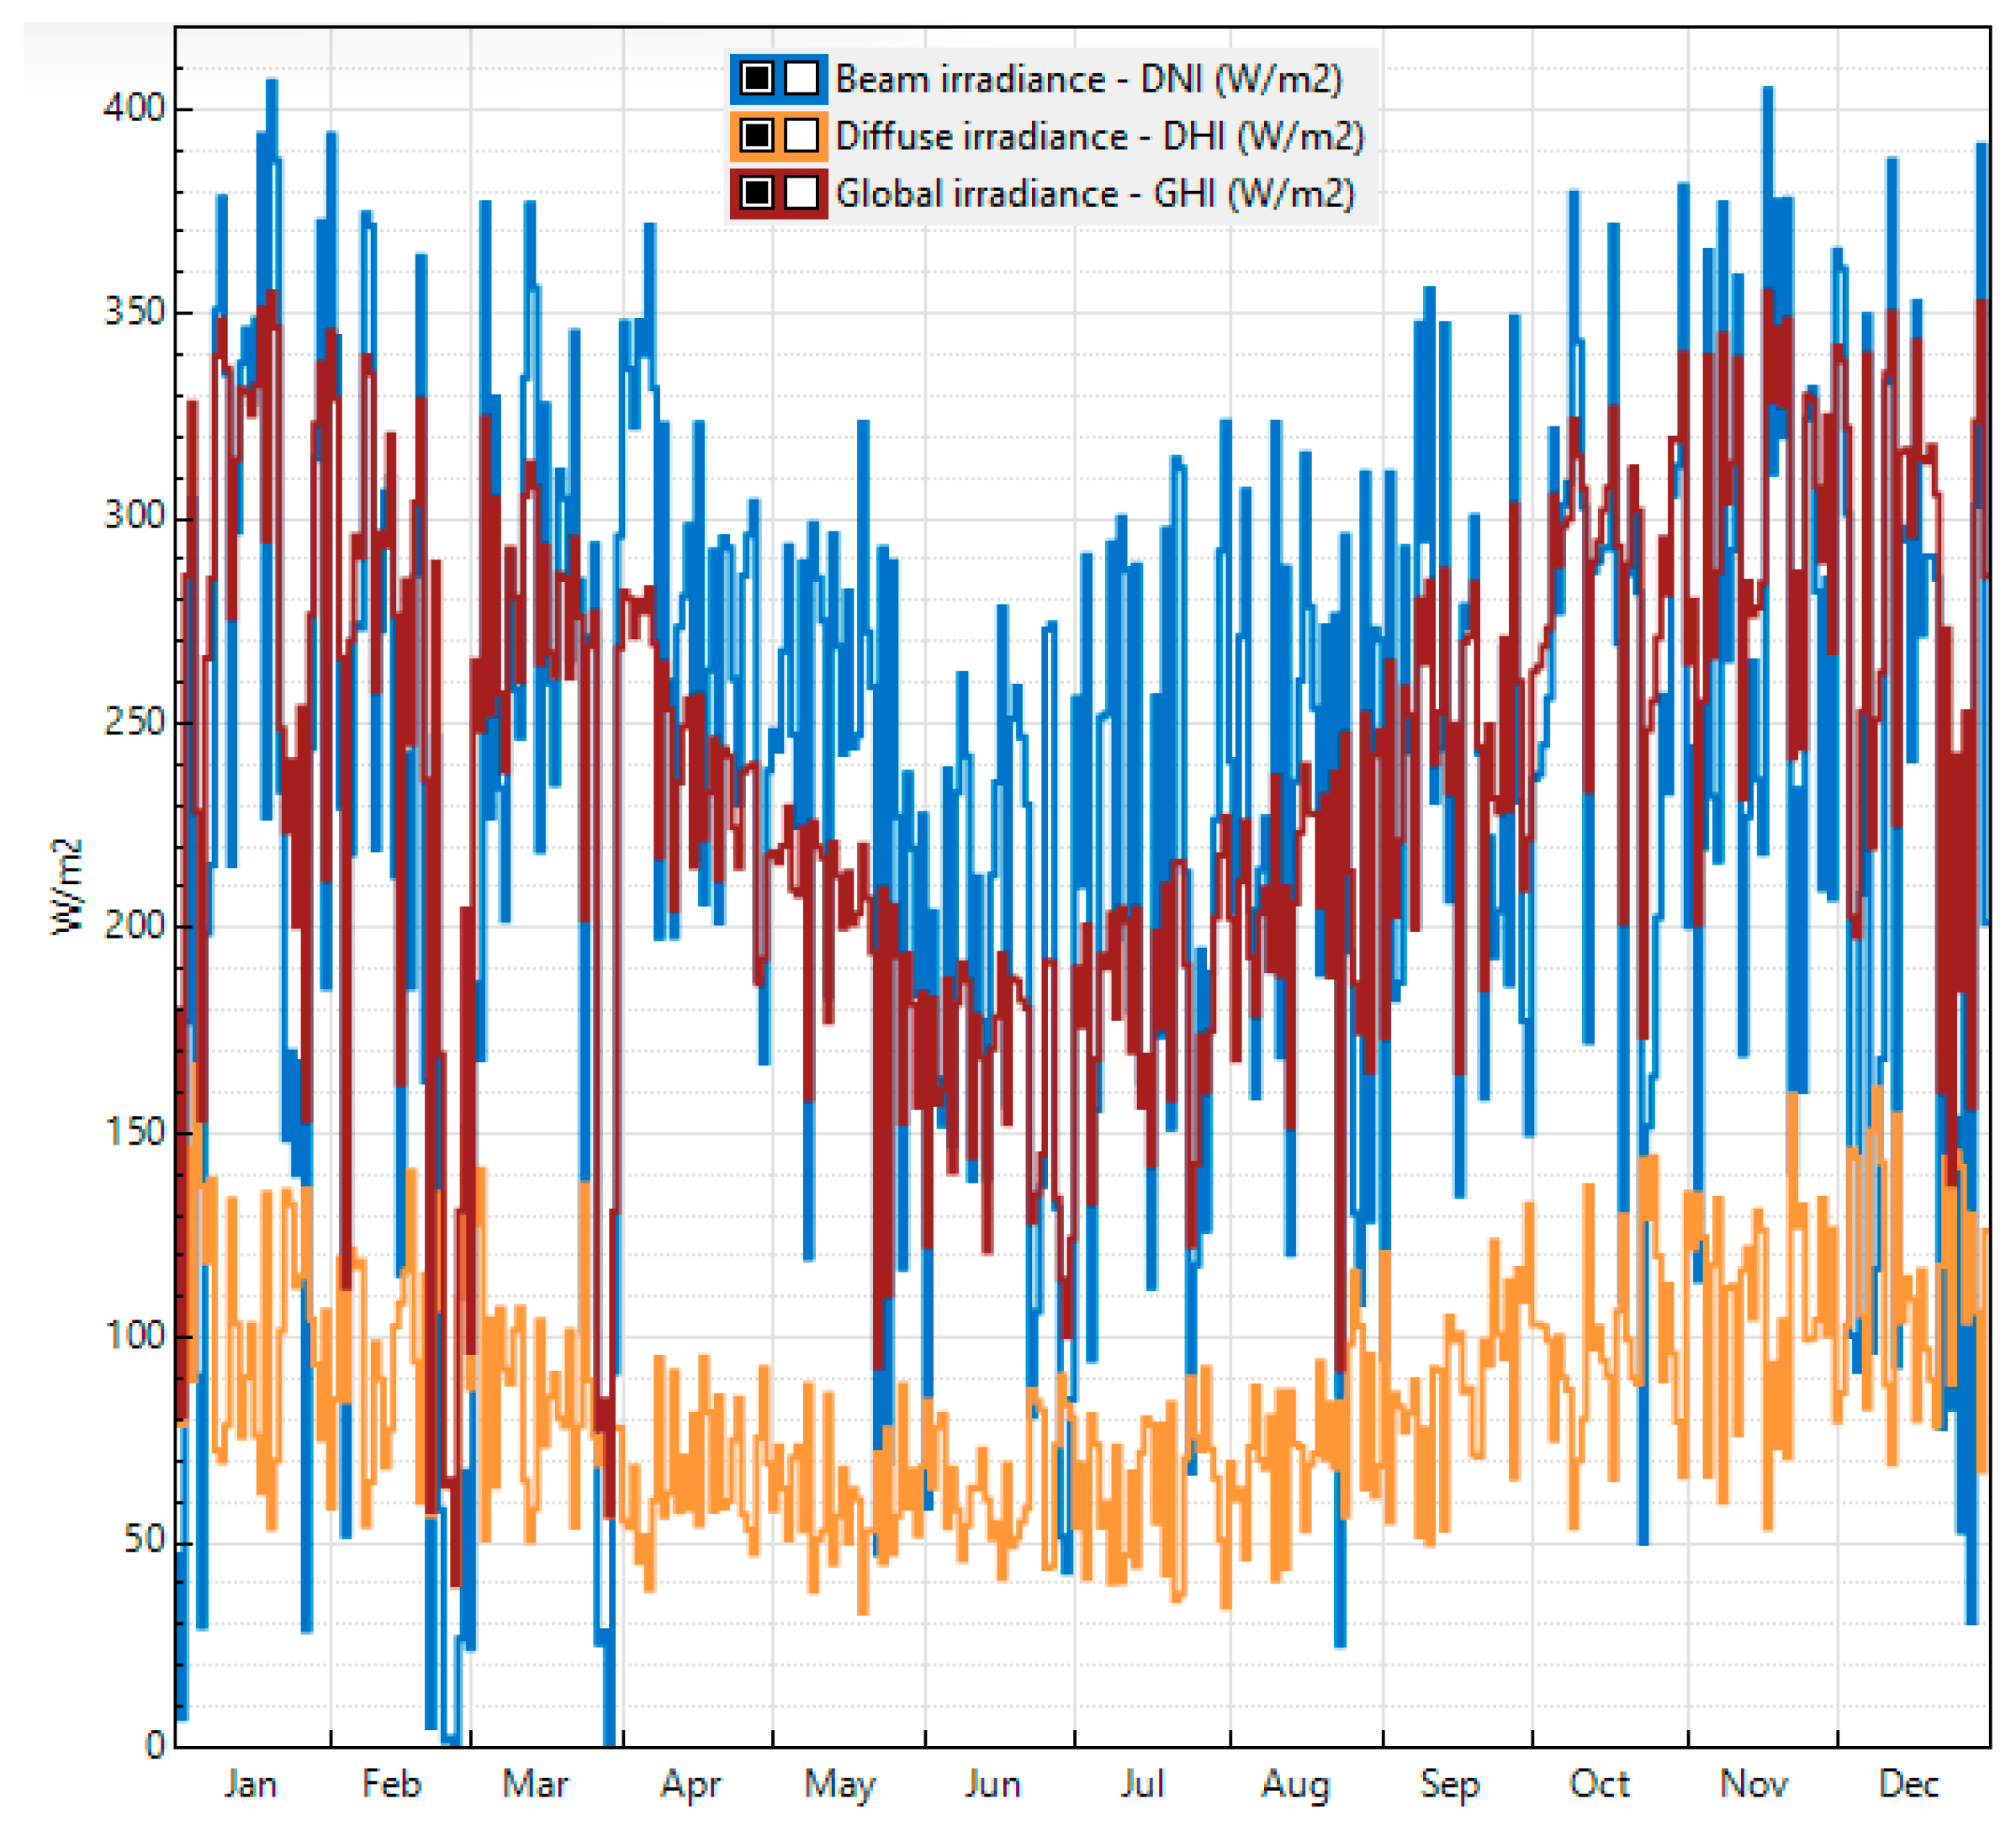
A key input to SAM is the weather file, which contains hourly data for a one-year period. SAM uses this hourly data to calculate the quantity of electricity generated by the system in each year of the specified analysis period taking into consideration any degradation rate specified [22]. Given that this study aims to investigate the performance of the PV plus battery storage over the whole duration of a power purchase agreement (PPA), i.e., 20 years, the weather file must provide data that is representative of a “typical” year. Consequently, a typical meteorological year (TMY) file for the chosen site derived from years 2007 to 2016 was downloaded from the European Commission PV Geographical Information System website [34]. The daily values of the global horizontal irradiance (GHI), the diffuse horizontal irradiance (DHI), and direct normal irradiance (DNI) from the TMY are shown in Figure 4.
2.3. Technical Parameters
Setting up the PV plus battery model requires selecting appropriate values for several technical parameters. In this section, the setting of the key parameters will be discussed. In this work, we attempted to simplify the analysis by making design assumptions based on local practical considerations. For instance, the total inverter AC capacity is limited to a maximum of 15 MW because the Mauritian utility has limited the AC capacity of the IPP PV plants to 15 MW. In the model, due to the choice of inverters, the total AC capacity has been set to 14.63 MWac.
To reflect the interconnection method locally, the losses for transformer no load, load, and transmission have been changed from the default 0% to the values shown in Table 2. Furthermore, the system availability losses have been changed from the default 0% to a constant 1% to incorporate the fact that outages on the plant’s transmission lines do happen and affect the output of the plant.
The choice of battery technology was Lithium iron phosphate batteries (LFP) because of their longer lifetime and lower costs compared to the more widely used lithium nickel manganese cobalt. In addition, LFP has a better safety profile due to its very good thermal stability, but has a lower energy density due to lower cell voltage [4].
The BESS parameters were selected as follows. Based on the objective of providing peaking capacity after sunset, we define the battery bank power from the AC side and set it equal to the total inverter AC rating i.e., 14.63 MWac. Due to DC/AC conversion, this results in a slight oversizing of the maximum DC discharge power to 15.14 MWdc. The battery bank energy capacity is also defined on the AC side and, furthermore, the default minimum (15%) and maximum (95%) charge limits have been used. To cater for the DC/AC conversion, SAM scales up the capacity, whereas for the minimum and maximum charging limits, oversizing of 25% was required. For this work, the duration of storage was varied from a minimum of 1 h to a maximum of 5 h.
One important aspect is the degradation of the battery due to usage and time. This was incorporated in the model by using SAM’s built-in degradation model. Using the results derived, battery bank replacement was scheduled when the capacity drops to 80% at the end of year 10. Hence, the battery capacity is augmented by 22% the following year.
Regarding the operation of the PV plus battery system, the charging of the battery will be from the PV plant only and performed in priority over export to grid. If the available PV output is higher than the battery maximum charging power, the extra power will be exported to the grid. For very high ILR, this extra power available may even exceed the inverter input capacity, which will result in part of the available generation being “clipped” or lost. Once the battery is completely charged, the power from the PV plant is sent to the grid up to the inverters input limit. As before, any available PV power above the total inverter capacity is “clipped” or lost.
2.4. System Costs and Financial Parameters
The economic parameters for the system are shown in Table 3. The cost for the equipment and maintenance has been left either as default SAM values or taken from [4] and [35]. As per [35], the global capacity weighted-average total installed costs of projects commissioned in 2019 was USD 995/kW. In [36], capex for utility-scale solar PV plants in Mauritius for 2018 was determined to range from USD 1100/kW to USD 1250/kW. From 2018 to 2019, the global weighted average of total installed cost dropped by 17.6% [35]. However, the impact of the COVID-19 pandemic on the global solar PV component market is not yet clear.
The costs of the PV module, inverter, and balance of system (fixed-tilt system) have been left at the default SAM values of USD 0.38/Wdc, USD 0.06/Wdc, and USD 0.20/Wdc, respectively. The balance of system cost for the single-axis tracking system is set at USD 0.27/Wdc. For the installer margin and overhead, contingency, permitting and environmental studies, engineering and developer overhead, grid interconnection, land preparation, and transmission, the default SAM values were retained. As for the maintenance cost, a figure of USD 9.5/kWdc-yr [35] was selected for the fixed tracking system and USD 12/kWdc-yr for the single axis system (25% higher than fixed axis system).
The battery is, by far, the most significant cost component of the plant. There are several technical sources providing battery costs [4,37,38]. For this work, the capital, replacement, and O&M costs for the LFP batteries are from [4], since the figures therein appear more appropriate for a small developing country.
PV plants generally require replacement of the inverters after 10–12 years. In this study, we make allowance for this and other equipment replacement by specifying in the major equipment replacement reserve a sum of $0.250/Wdc of installed capacity to be performed in year 12 (both the rate and year of replacement are SAM default values).
The discount rate and internal rate of return (IRR) are key financial parameters since they have a significant impact on the results. For this work, based on the investigation in [36], a nominal IRR and discount rate of 8.25% is assumed for the local context, while the inflation rate is assumed to be 2%. The analysis period is set as 20 years, given that this is the duration of PPA in Mauritius, and there is a corporate tax of 15%. The debt service coverage ratio has been set at 1.3 and the annual interest rate has been set at 5.4%. Depreciation is straight-line over the PPA duration.
Based on the cost parameters selected for the model, the total installed cost per kW for the PV system was determined to be USD 1097/kWdc for the fixed-tilt system and USD 1181/kWdc for the single-axis system. The figures are within the range expected for Mauritius and, therefore, the model is adequate.
3. Results and Discussion
3.1. Base Case
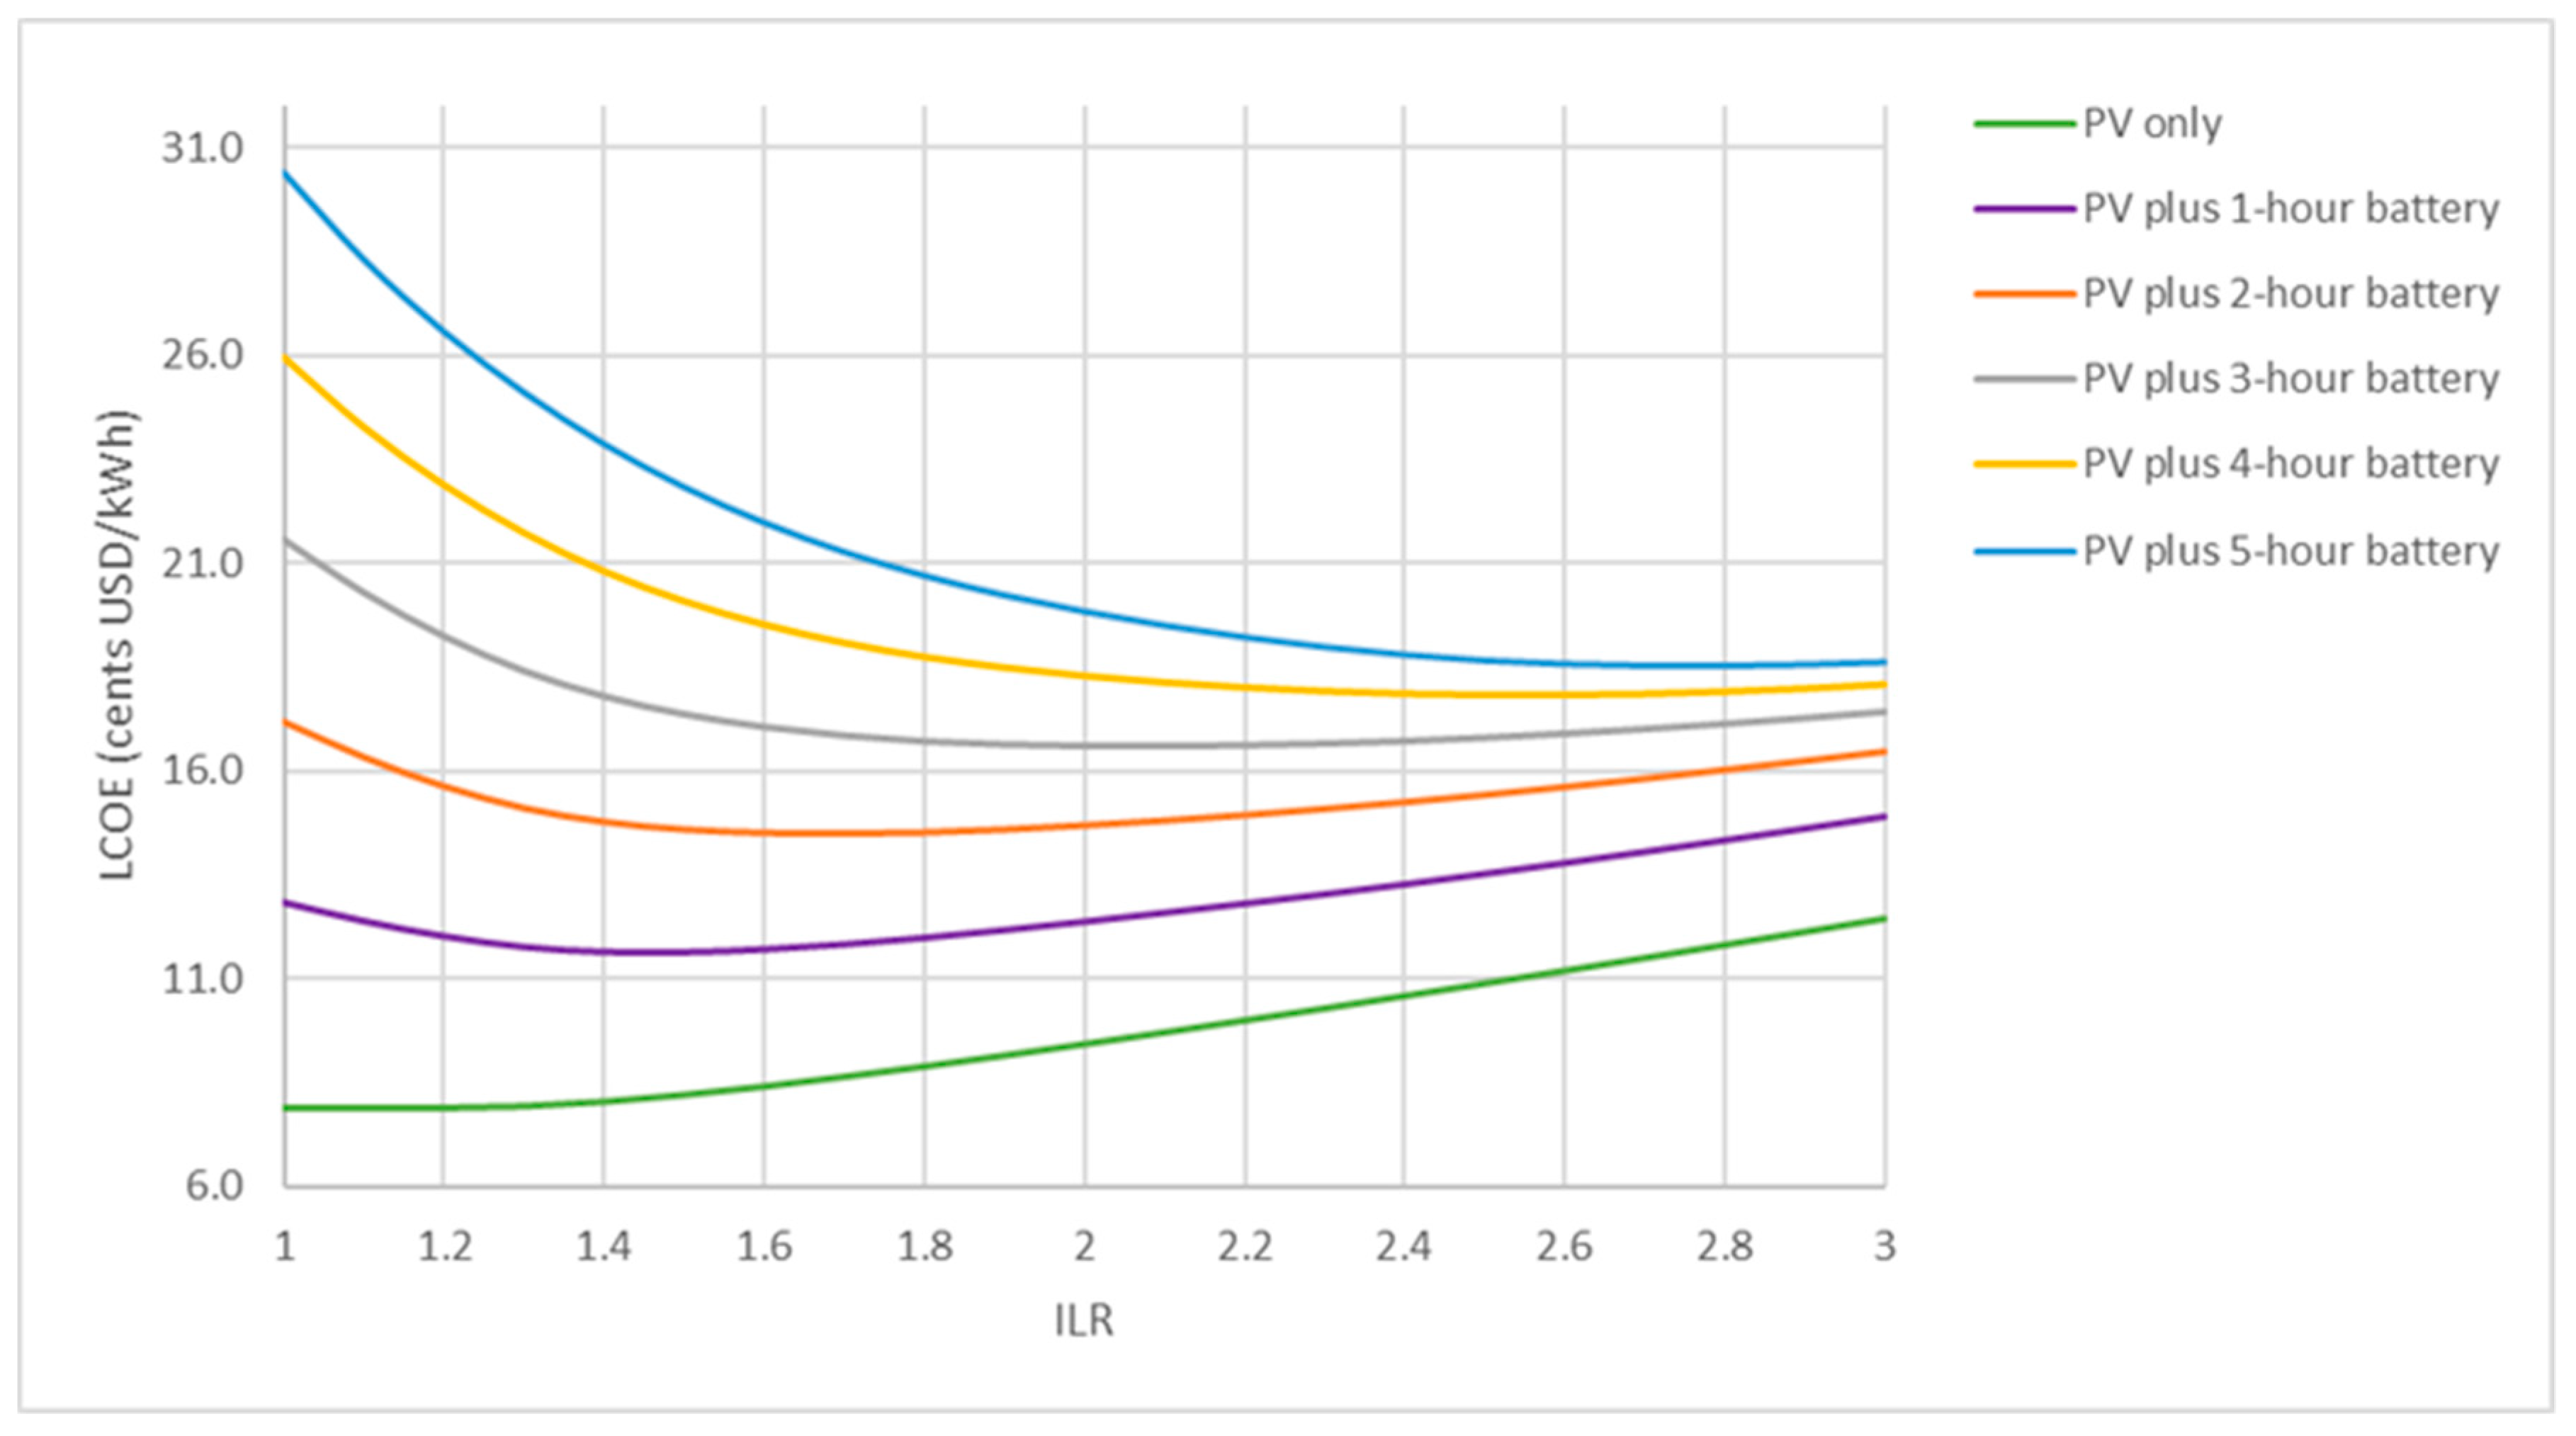
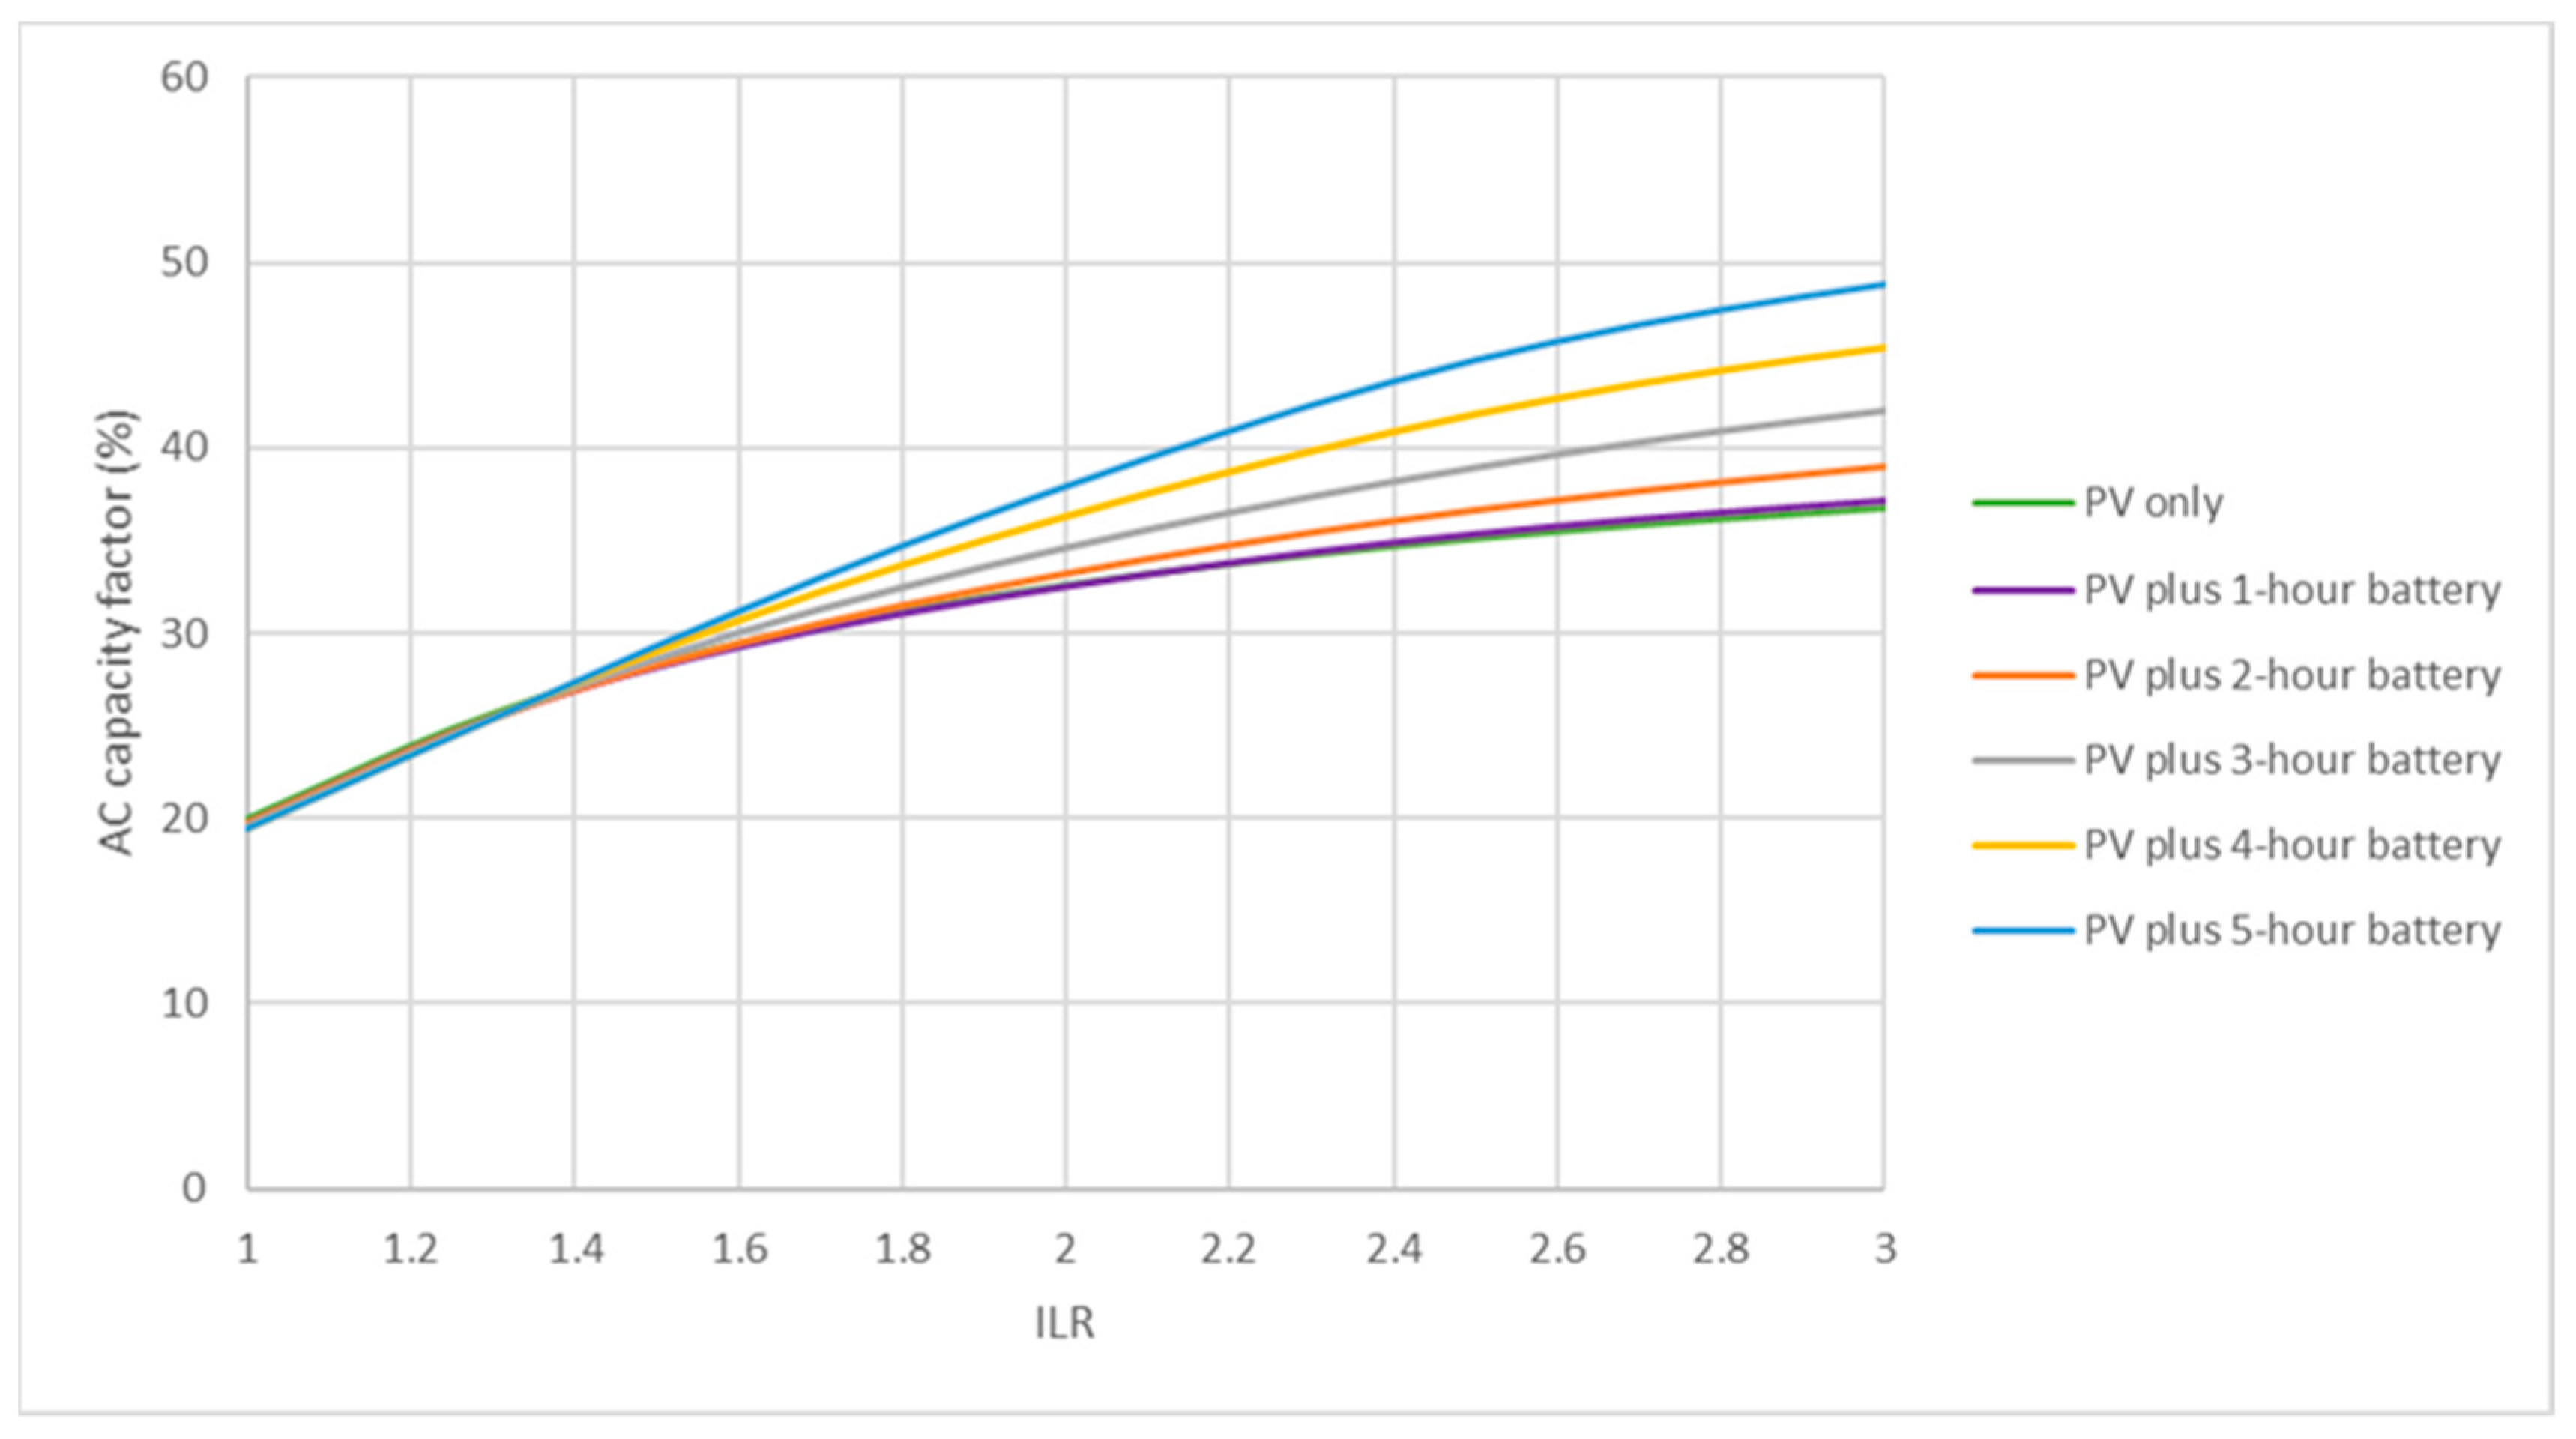
The base case consists of the simulation of the fixed-tilt PVB and varying the ILR from 1.0 to 3.0 in steps of 0.1. The simulation was performed for LFP storage durations of 1 to 5 h in steps of 1 h. The variation of the LCOE with the ILR and storage duration is shown in Figure 5, the AC capacity factor in Figure 6, and the annual inverter clipping loss in Figure 7. At the outset, it is readily apparent that PV plus battery with higher storage durations always have higher LCOE than PV plus lower duration storages. Clearly, this is due to the increasing total cost of batteries as the duration increases.
For a given battery duration, as the ILR increases, there is a decrease in LCOE until a minimum is reached, after which the LCOE increases with the ILR. The initial decrease in LCOE occurs as long as the increase in generation is higher than the increase in plant costs. When the increase in generation no longer exceeds the increase in costs, the LCOE increases. The ILR at which the minimum occurs is higher for larger battery sizes. It should be noted that the decrease in LCOE with increasing ILR is more prominent in the larger battery configurations. The minimums for each storage duration are shown in Table 4.
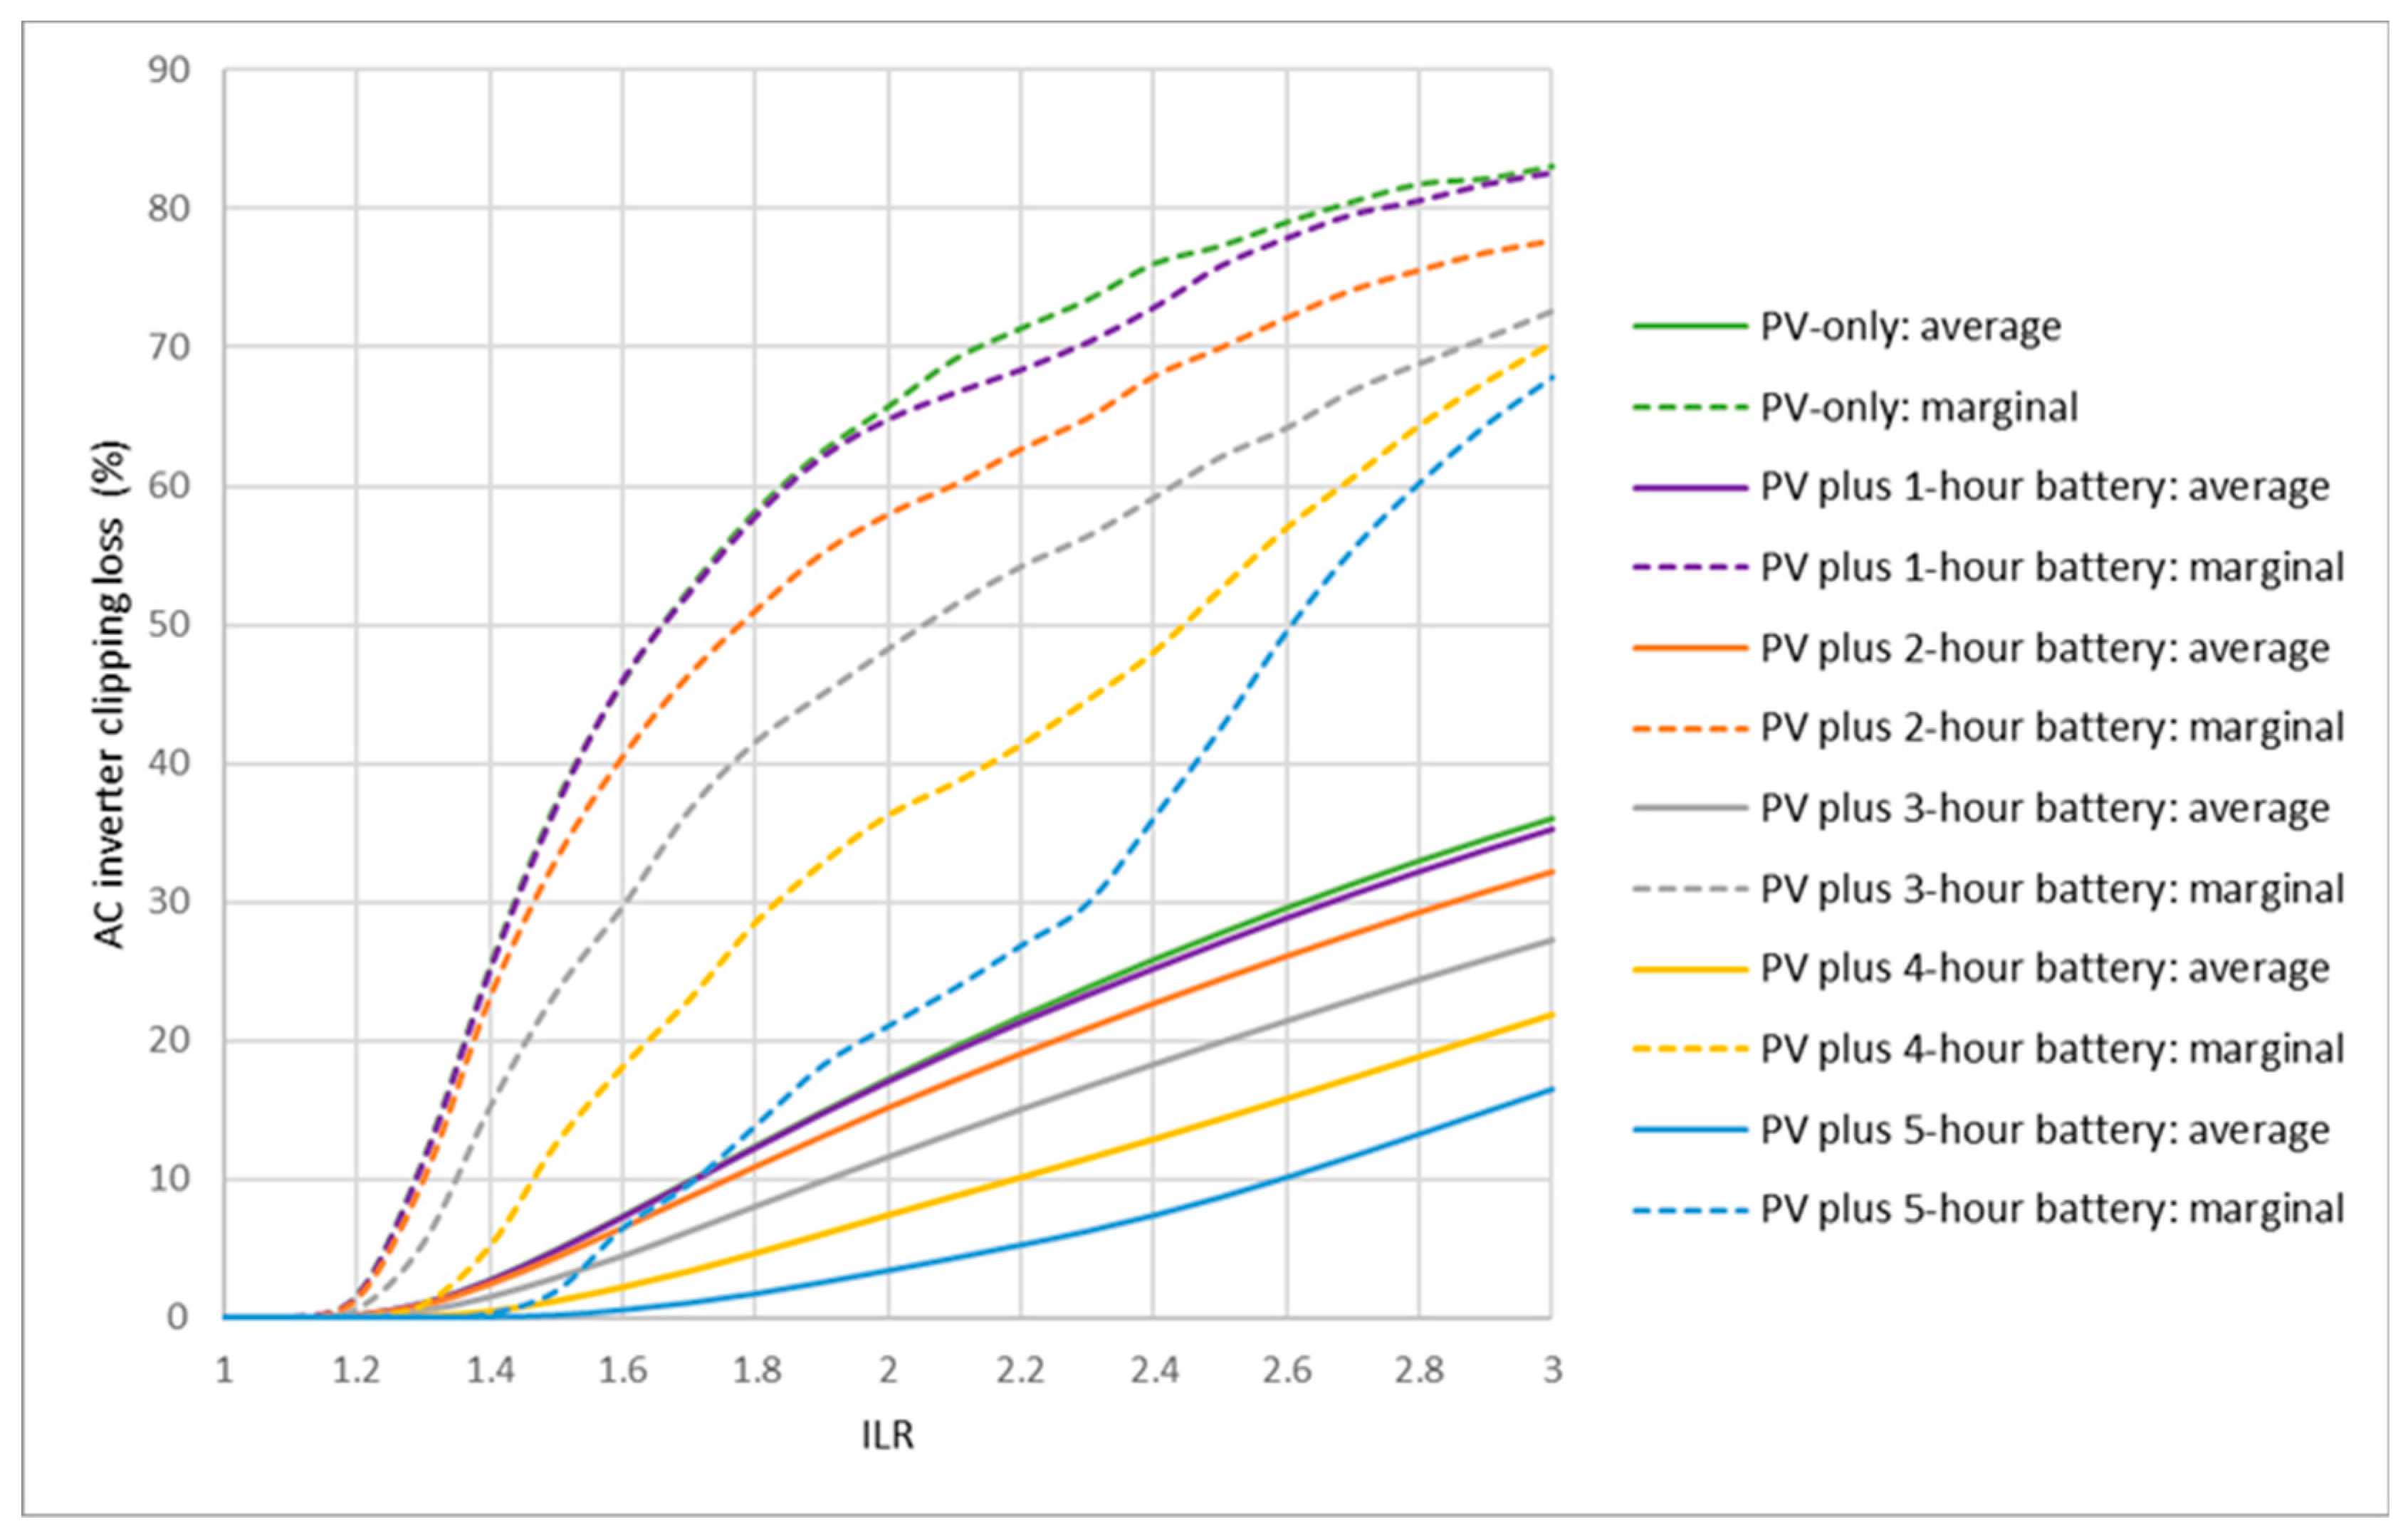
The variation of LCOE with ILR does not paint a complete picture. To gain better comprehension, it is also necessary to analyze the AC clipping loss. As shown in Figure 7, as expected, the annual inverter average clipping loss increases with increasing ILR. The storage duration naturally affects the clipping loss rate, as higher storage duration decreases the clipping loss as shown in Figure 7. Based on the results shown in Figure 5, Figure 6 and Figure 7, at first glance it appears reasonable to assume that for, say, storage durations of 3 to 5 h, it is better to choose the maximum ILR because the LCOE is at or very near the minimum, generation is at a maximum, and the average clipping loss rate is at a relatively moderate level (less than 27%). However, if one considers the marginal clipping loss, a different picture emerges. By determining the clipping loss for each increment of PV module capacity added, one can determine the marginal clipping loss as a percentage of the generation potential of that incremental module capacity. Figure 7 shows that, for a PV plus battery capacity of 3 h, for example, at an ILR of 1.9, the annual AC clipping loss is 9.8%, but the marginal clipping loss has already reached 45%. This means that the extra module capacity added to increase the ILR from 1.8 to 1.9 (around 1.6 MWdc) essentially generates at only 55% of its available potential. Clearly, this is a serious disadvantage to building a plant with a very high ILR in a small island such as Mauritius where space is limited.
Consequently, for this work, to enable the effective use of the scarce land resource, the selected ILR will be the one that returns the lowest LCOE without causing the marginal clipping loss to exceed 30%. The threshold of 30% has been chosen to provide a reasonable trade-off between the benefits and costs of oversizing the ILR. Based on this criterion, the selected LCOE would be as presented in Table 5:
Comparing the figures in Table 4 and Table 5 shows that the constraint of limiting the marginal clipping loss does not significantly increase LCOE, but the selected ILR is lower or equal, which reduces generation or leaves it unchanged, respectively. From the buyer’s point of view, the utility in this case, reduced generation is not necessarily a bad thing (The utility can ensure that IPPs keep their plant ILRs within the desired limits by stating so explicitly in the PPA or implicitly by limiting the annual AC capacity factor). This is because during the day, utilities would rather buy solar PV electricity at much lower cost from traditional PV plants, which in this case costs only 7.9 cents USD per kWh compared to 11.6 cents USD per kWh for the cheapest PV plus battery system.
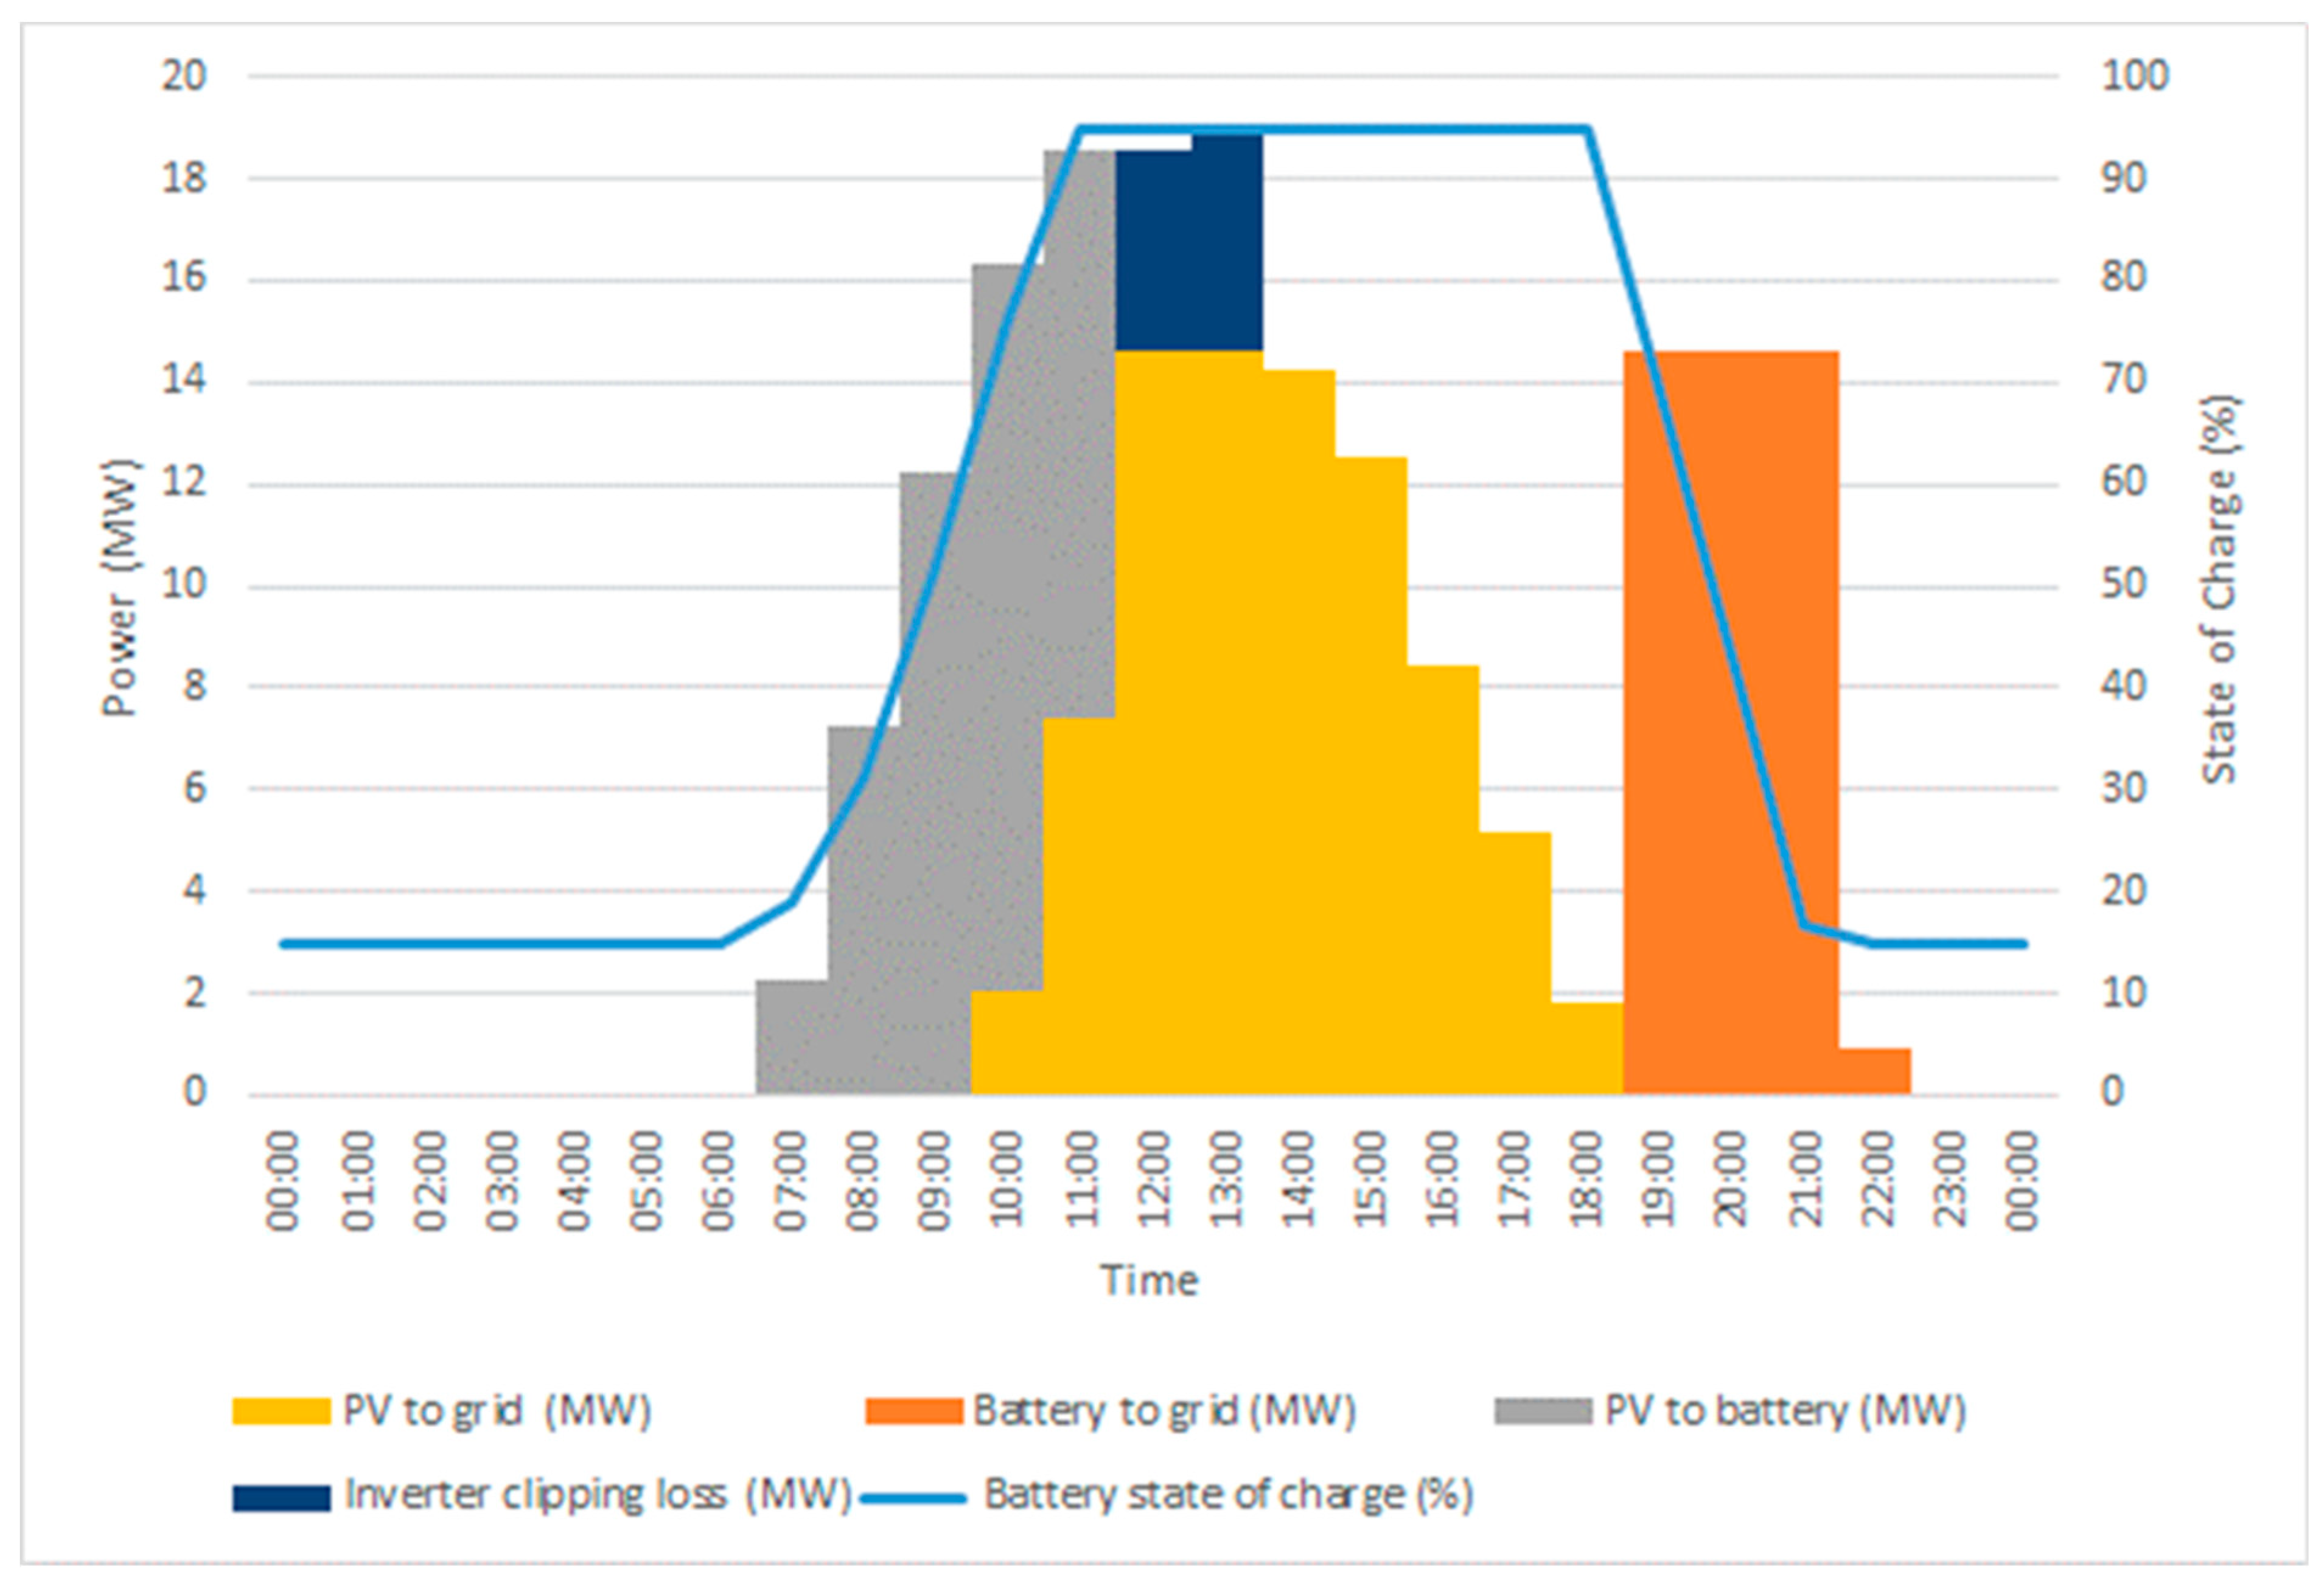
In contrast to some advanced jurisdictions, in Mauritius and in many developing countries, there is not yet any rule mandating the minimum duration of storage to serve the peak demand. Therefore, the choice of the duration of storage will depend on the utility, which generally will state its requirement in a competitive bidding exercise. To benefit from a lower LCOE, the utility may be tempted to go for lower duration storage with a larger number of plants to ensure that there is enough storage duration to go through the evening peak. From the perspective of VRE integration, however, such a strategy may not be optimal because, firstly, it requires that the system be able to accommodate more VRE during the day. It must be recognized, however, that the output of the PVB system can be required to be less variable than a PV-only plant, as the battery can be used for smoothing and ramping of the PV output. Nevertheless, the conventional generation fleet must still be able to make space for the PVB plant. Secondly, the utility must buy more expensive PV generation backed by storage than what is necessary to serve the evening peak. Figure 8, showing the power generation profile of a system with a storage duration of 3 h, ILR of 1.6, and fixed tilt, illustrates this point. To benefit from battery storage during the evening peak, there is a need to integrate a relatively large amount of PV generation during the day, because it is this substantial day-time generation that drives down the LCOE of the PV plus battery systems by spreading the capital cost over a greater number of kWhs. Without this generation, the LCOE would be much higher, which then raises the issue of the impact of curtailment on the LCOE of the system (see Section 3.4).
Nonetheless, the results show that the LCOE for all PV plus battery plants are lower than those for fossil fired generation, which were determined to be USD 218/MWh (21.80 cents USD/kWh) for heavy fuel oil units [36] and, for dispatch factors of 85 and 50%, were estimated to be USD 0.20 and 0.29/kWh, respectively, for a 100 MW liquefied natural gas (LNG) fired CCGT plant [39], both being in Mauritius. In the present case, even when making the safe assumption of the selection of 4-h storage paired with the PV plant, the LCOE of 18.8 cent USD/kWh is lower than that of the fossil-fired generators, which is an extremely important result.
3.2. Effect of Single Axis Tracking on Performance of the PV Plus Battery System
SAM provides four types of tracking [22] and in this work, one (single) axis tracking has been employed. In the single axis tracking mode, the PV modules rotate on an axis from east in the morning to west in the evening to track the daily movement of the sun across the sky. Tracking has the main advantage of increasing the electricity generation from 22 to 56% [40], thus bringing down the LCOE. However, tracking has the drawback of increasing the capital outlay due to the higher cost of racking and support structures and motors, as well as increasing the maintenance cost. Recently, however, it has been noted that the installation costs of utility-scale PV systems with tracking are almost equal those of fixed-axis systems [40]. In Mauritius, to our knowledge, only one of the ten utility-scale installations on the island employs tracking. This is probably due to the perceived relative unreliability of such systems in the context of the cyclone-prone climate of the island. However, modern single axis tracking systems can sustain 3-s wind gusts greater than 220 km/h [41,42] and, therefore, there arguably appears to be no valid reason not to use them.
The simulation results are shown in Table 6, keeping in mind that the percentage marginal clipping losses are below 30%. Clearly, tracking brings a reduction of the LCOE for all storage durations. Reductions in LCOE range from 13.6% for the 1-h system, to 10% for the 5-h system. Furthermore, for all durations except the 5-h system, the energy generation is higher with a smaller PV installed capacity. The conclusion is that tracking renders the PV plus storage system even more competitive/viable compared to fossil-fired peaking units.
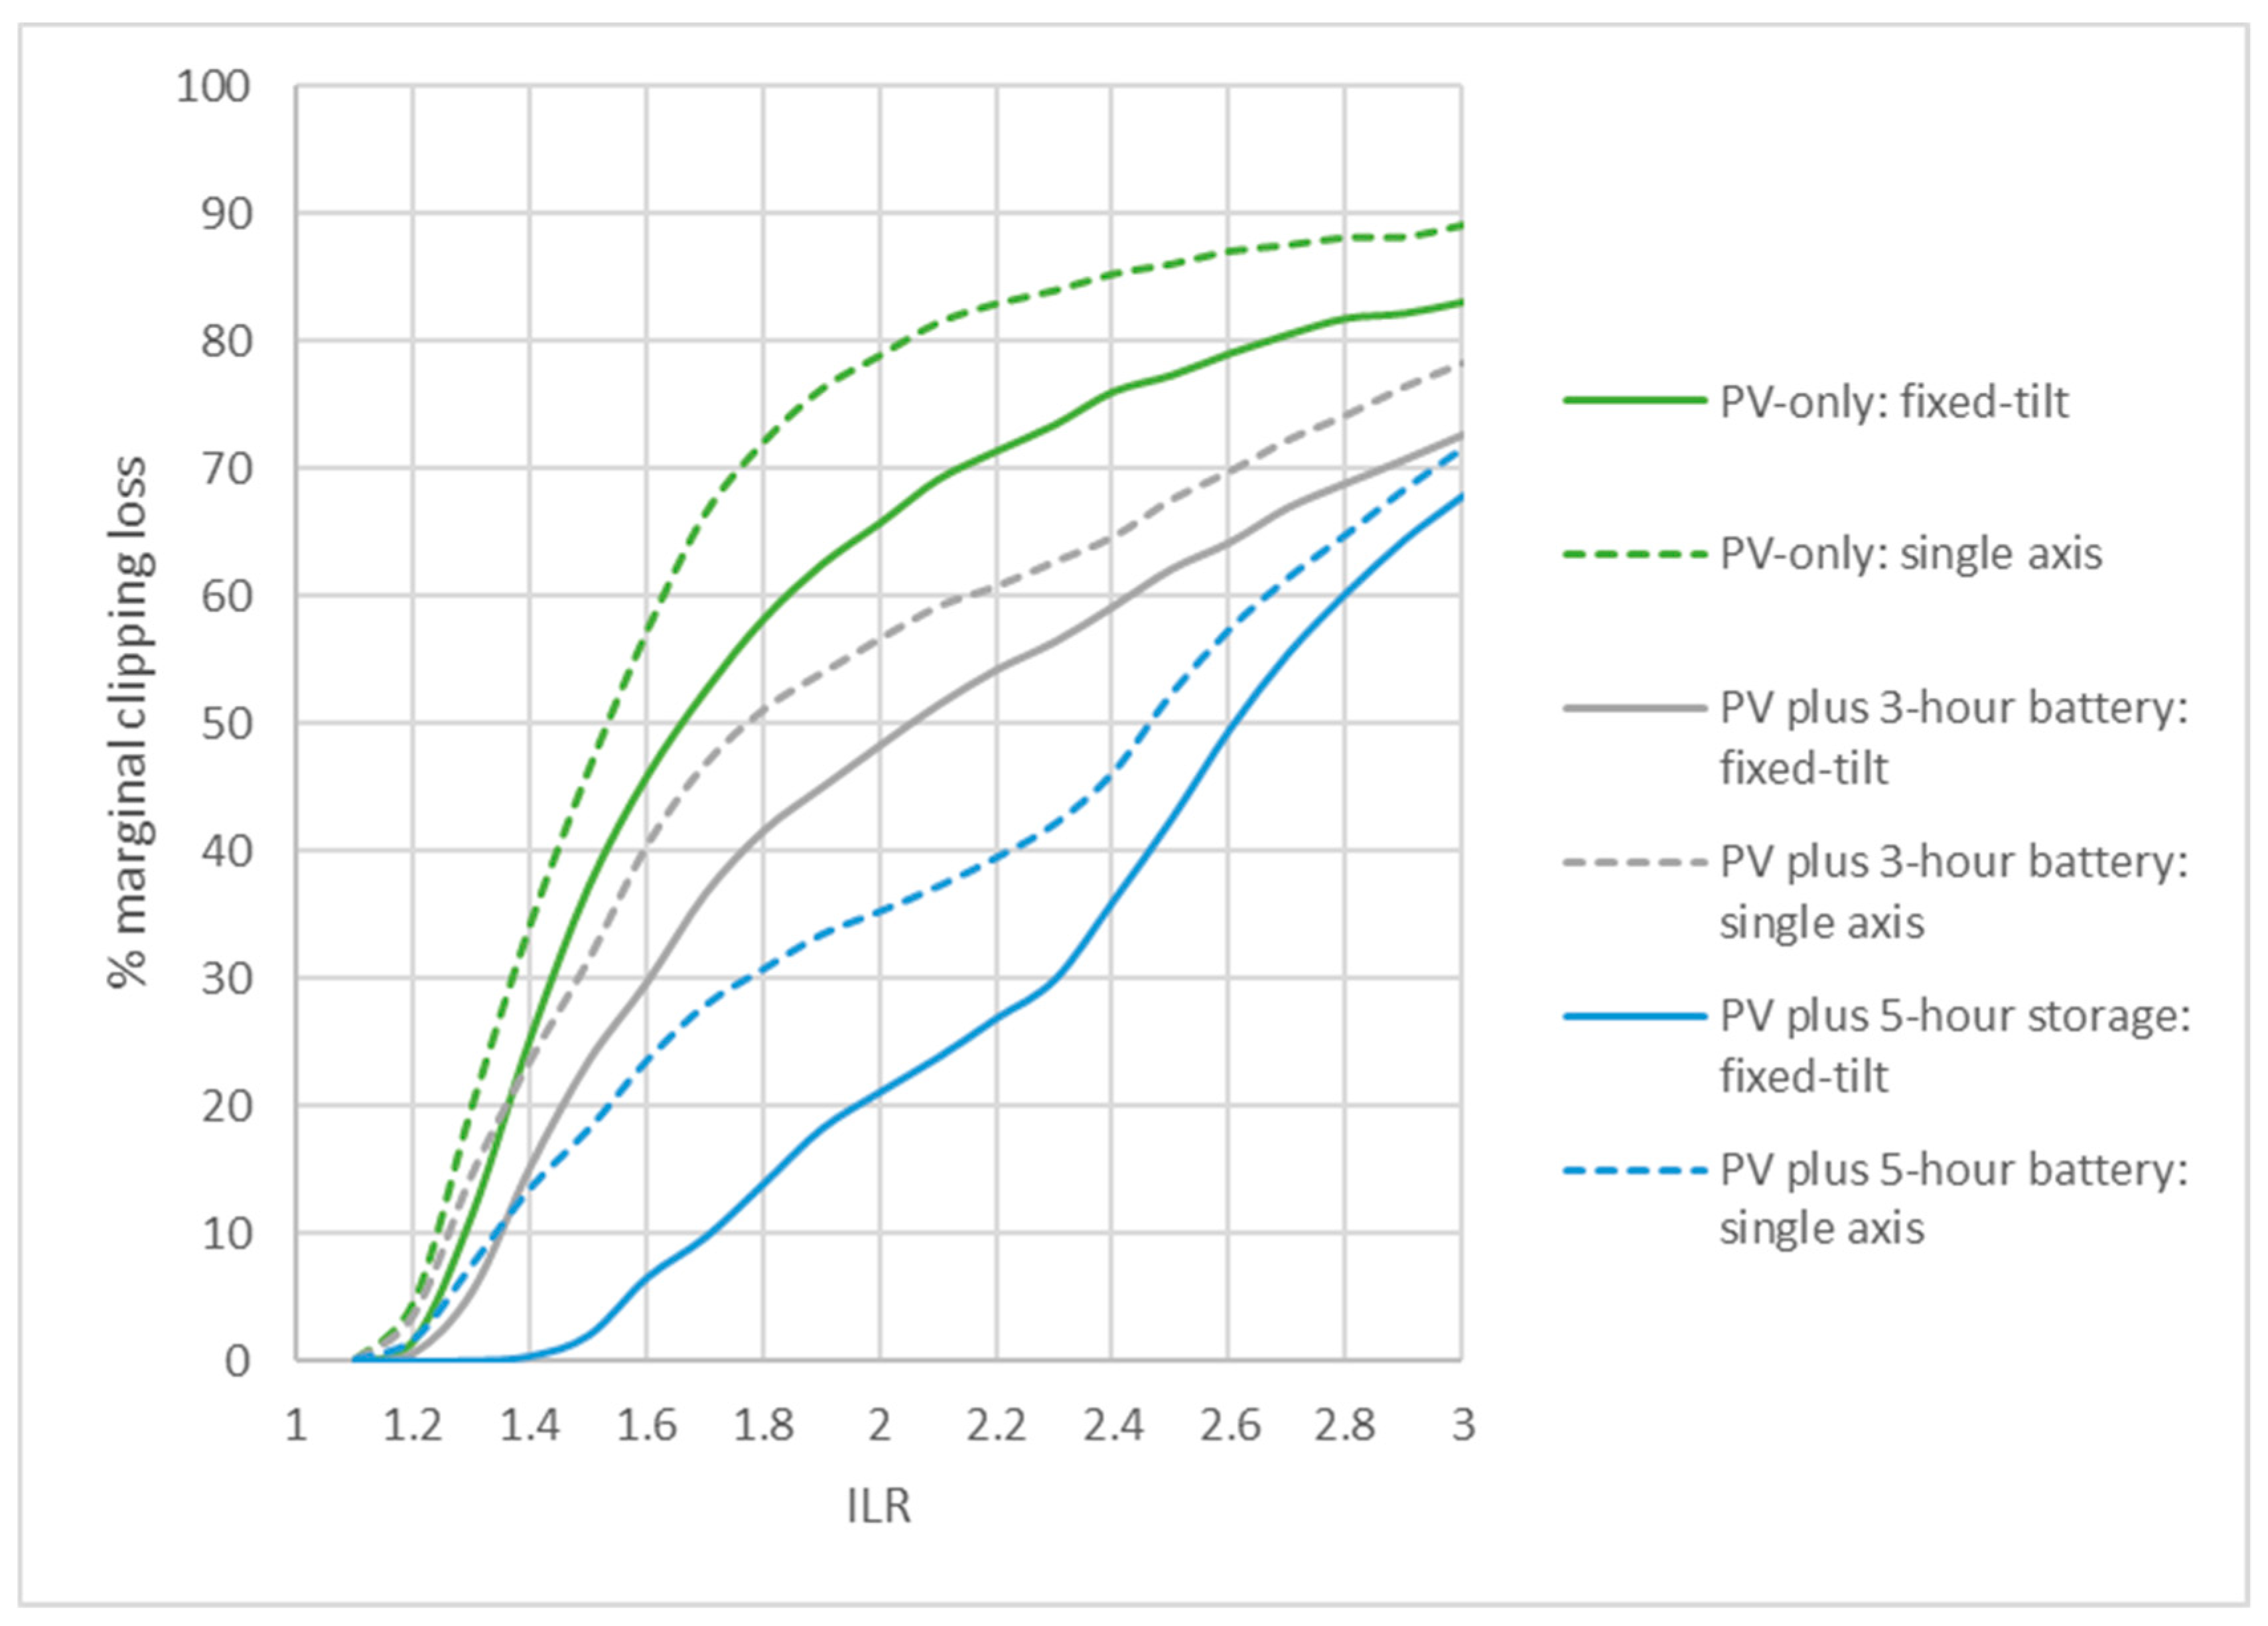
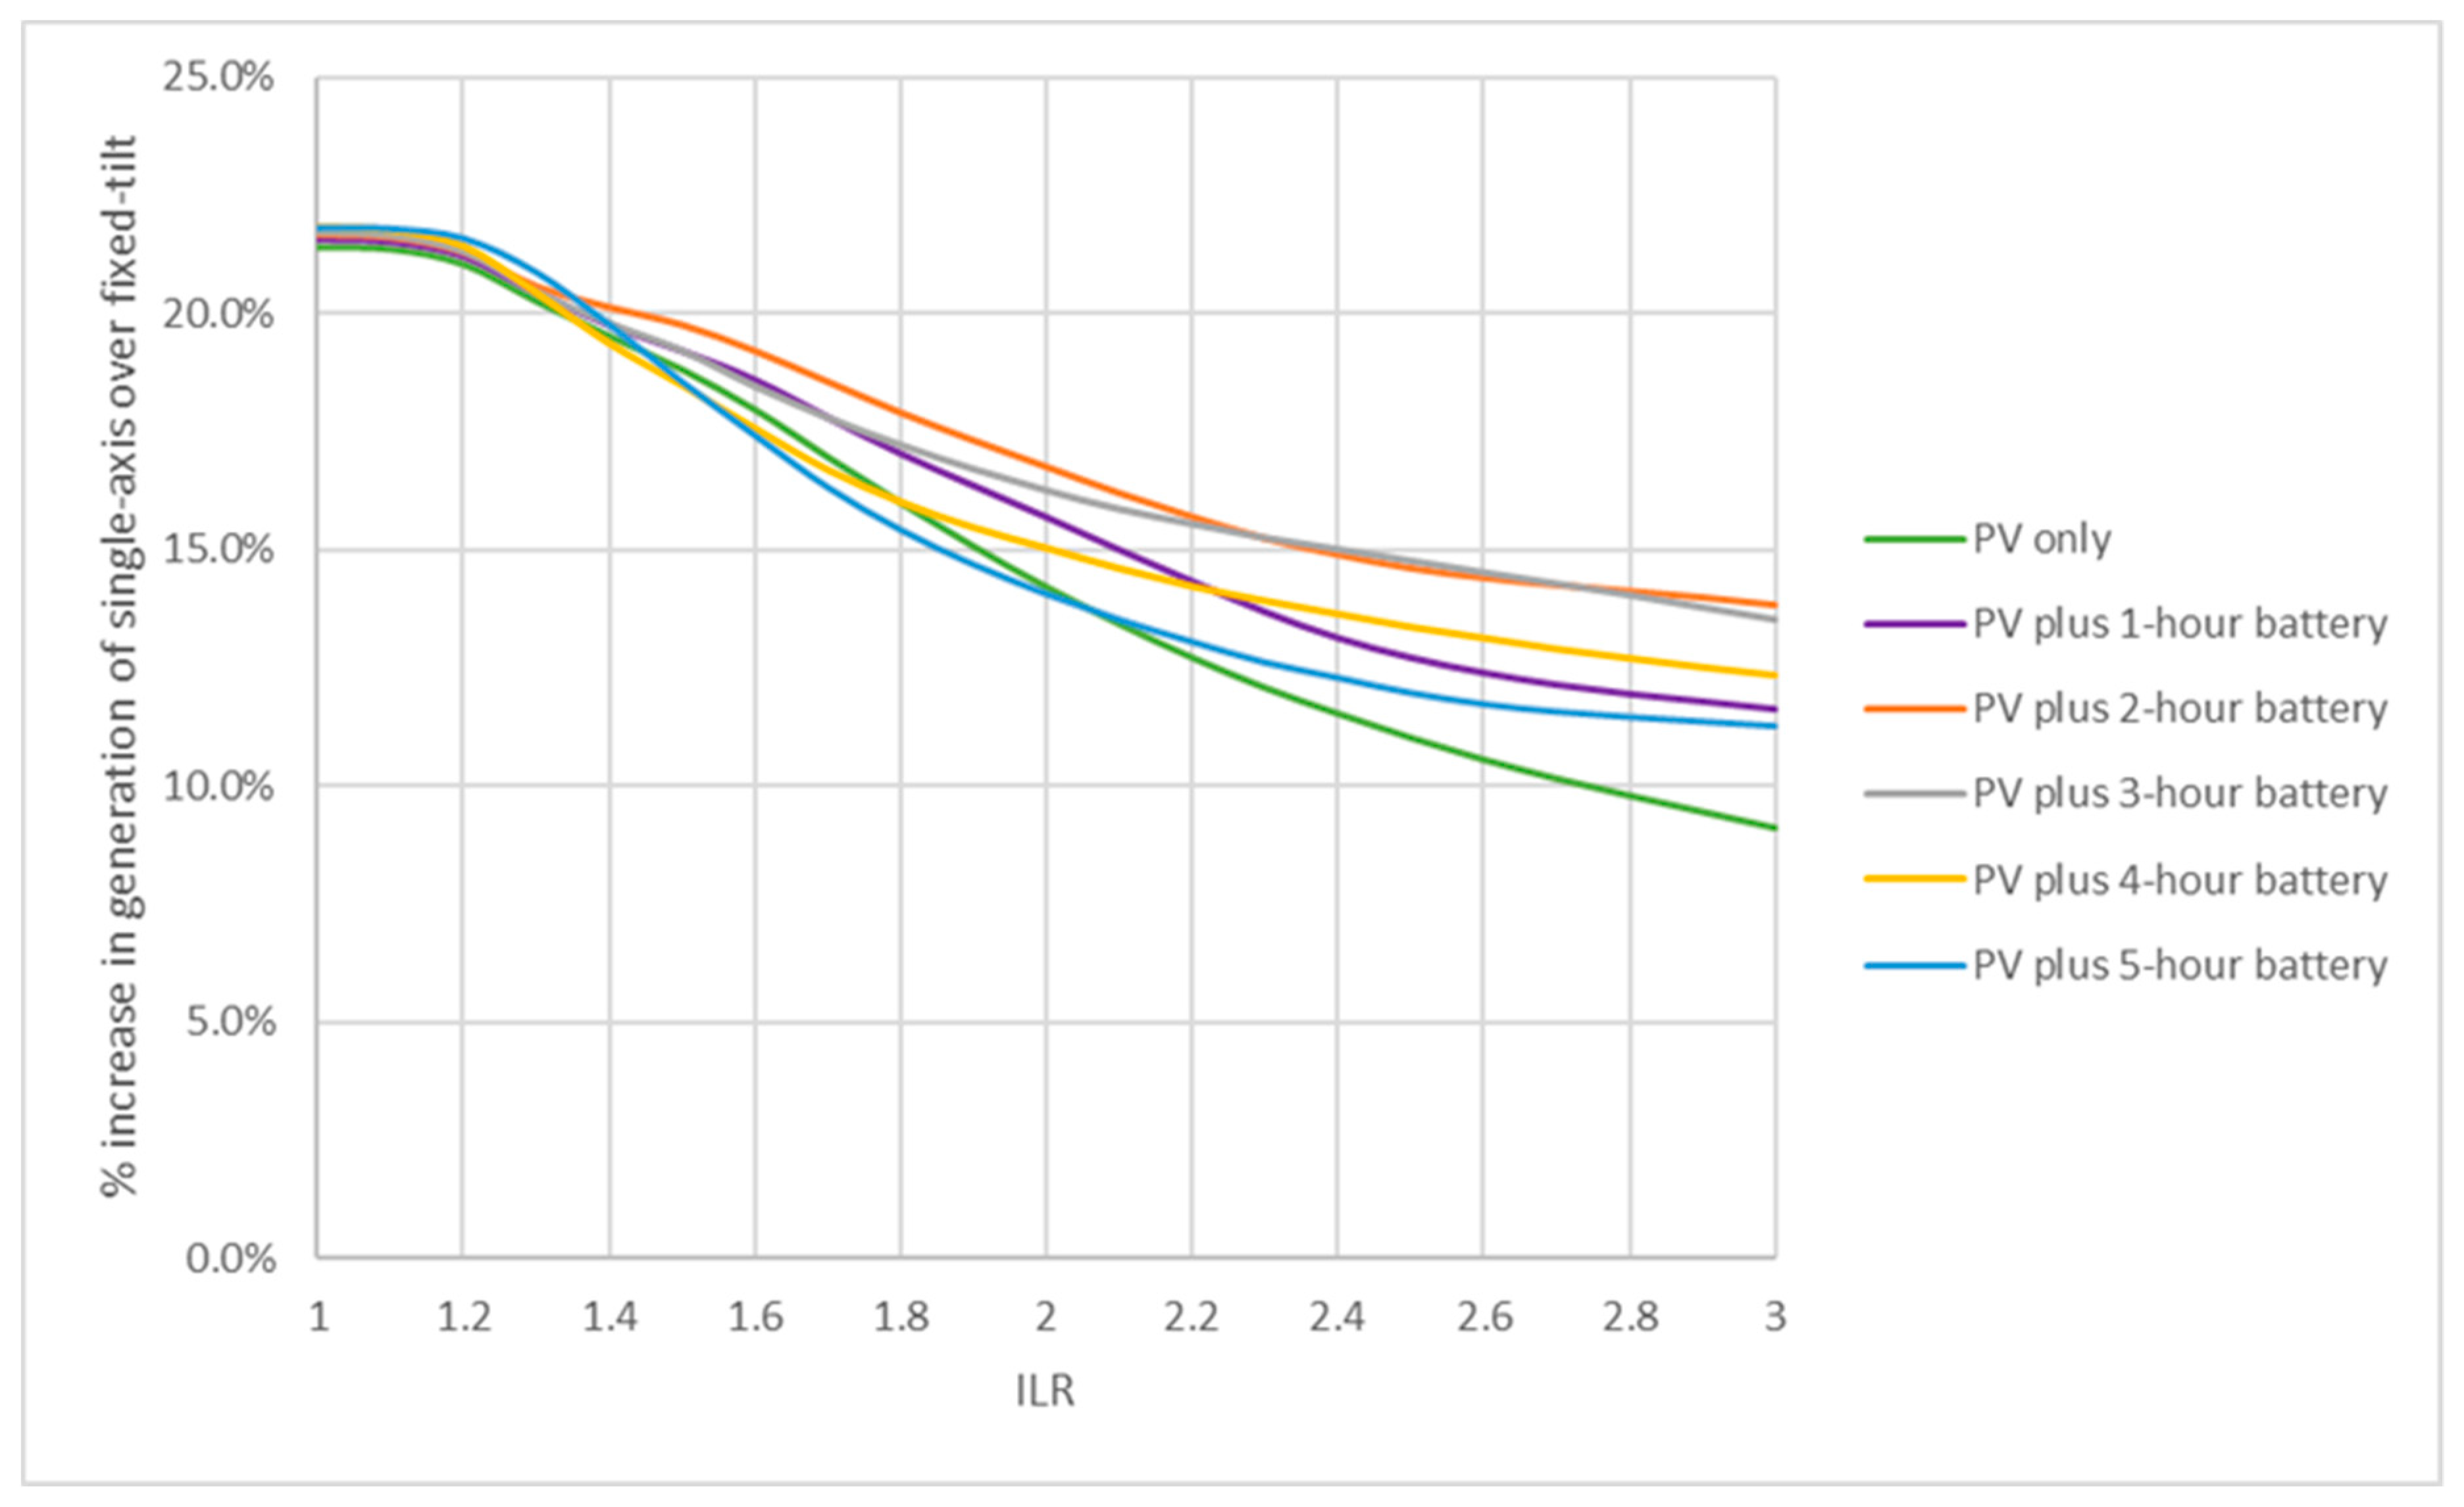
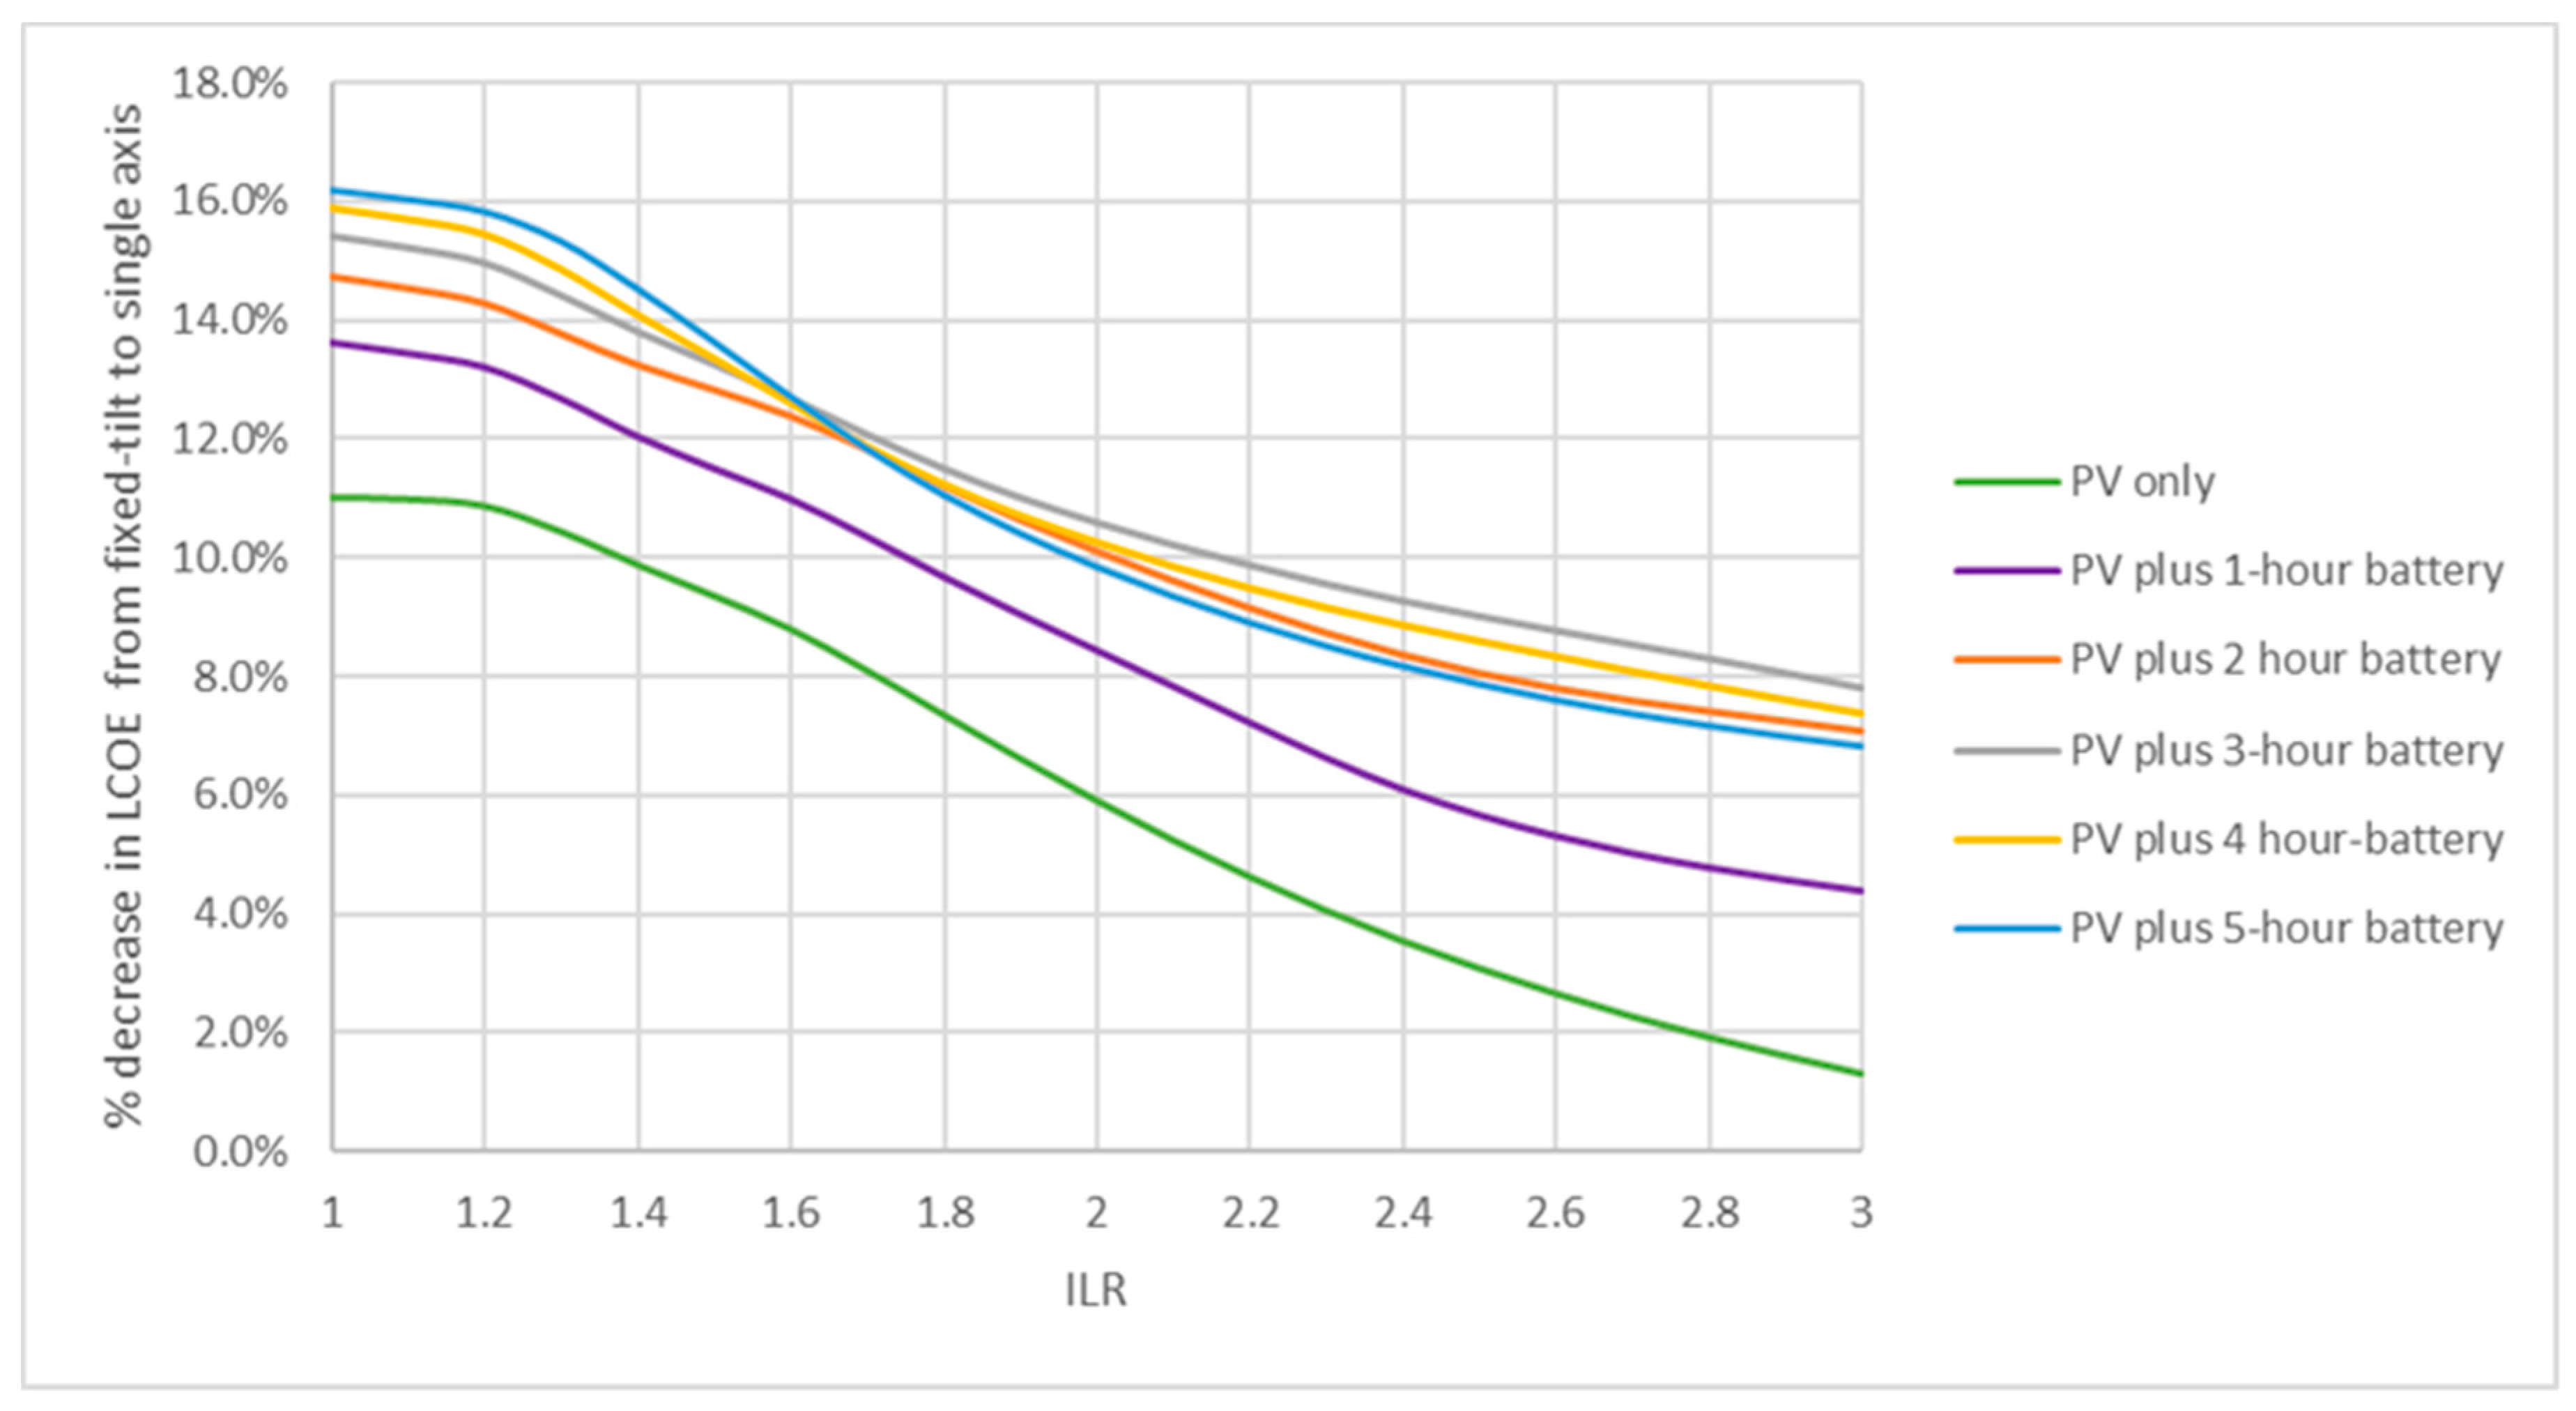
It is worth noting that tracking compounds the clipping loss problem. Hence, as shown in Figure 9 (not all systems are shown), for the single axis tracking the marginal clipping loss increases more rapidly and reaches the 30% limit at a lower ILR. Furthermore, for plants with the same storage capacity, the extra generation and LCOE improvement brought by tracking steadily drops with increasing ILR, as shown in Figure 10 and Figure 11, respectively. Therefore, the decision to implement tracking must be taken while also considering other factors, most importantly the ILR and the site solar radiation characteristics.
3.3. Capacity to Serve the Peak Demand
As this work assumes that the battery is charged only with the co-located PV plant, which is a variable resource, the capacity for the system to provide the rated power for the rated duration during the evening peak warrants some investigation. To quantify that capacity, the following metric called the equivalent availability factor (EAF), adapted from [10], is used:
The 80% in the denominator is required because the battery is discharged only to a minimum of 15% and charged to a maximum of 95%, hence 20% capacity remains unused. The simulation results of EAF for the selected configuration of fixed tilt and single axis tracking systems with the different battery capacities are given in Table 7. For all battery capacities, the EAF remains high at a minimum of 95.7%, which means that the BESS can reliably provide the peaking capacity. This good EAF can be explained by the higher than unity ILRs being considered and the fact that the practical potential of PV output in Mauritius is a daily average of 4.21 kWh/kWp [31]. For the fixed axis system, there is almost no variation in EAF across the range, whereas for the single axis tracking system, the EAF drops slightly for systems with storage greater than 2 h. This is probably because the ILR for the fixed axis systems is always higher than in the single axis system (except for 2-h systems) and therefore, even on a cloudy day, the system with a higher ILR could be able to better charge the battery. To gain better understanding of this aspect, P50/P90 simulations could be performed in future works. To achieve EAFs approaching 100%, the battery should be allowed to charge from the grid when on the rare occasions it is forecasted that the solar PV contribution will be insufficient to charge the batteries fully. This underscores the importance of having a dependable forecasting system.
3.4. Effect of Curtailment
Since curtailment results in a decrease in energy generation, it will cause the LCOE to increase. Therefore, it is necessary to understand the quantitative impacts of curtailment on the LCOE of a PV plus battery plant, all the more so because island power systems have greater limitations in integrating VRE.
As a uniform PPA price has been assumed in this work, the time of curtailment is immaterial. However, since it is expected that the most challenging conditions would arise with the combination of high PV generation during midday and low demand, the following four scenarios have been defined to vary the amount of curtailment:
- Scenario I:
- Curtailment on Sundays from 10:00 to 14:00 during the winter season (mid-May to mid-October)
- Scenario II:
- Same as Scenario I plus Saturdays from 10:00 to 14:00 during the winter season.
- Scenario III:
- Same as scenario II plus Sundays from 10:00 to 14:00 during summer.
- Scenario IV:
- Saturdays and Sundays from 10:00 to 14:00 during the whole year.
To increase the effectiveness of the batteries to abate curtailment, for this section only, the charging schedule has been modified to start with the beginning of curtailment. Note that the curtailed energy is not remunerated. The effect of the curtailment scenarios on the curtailment rate and LCOE is given in Table 8 and Table 9.
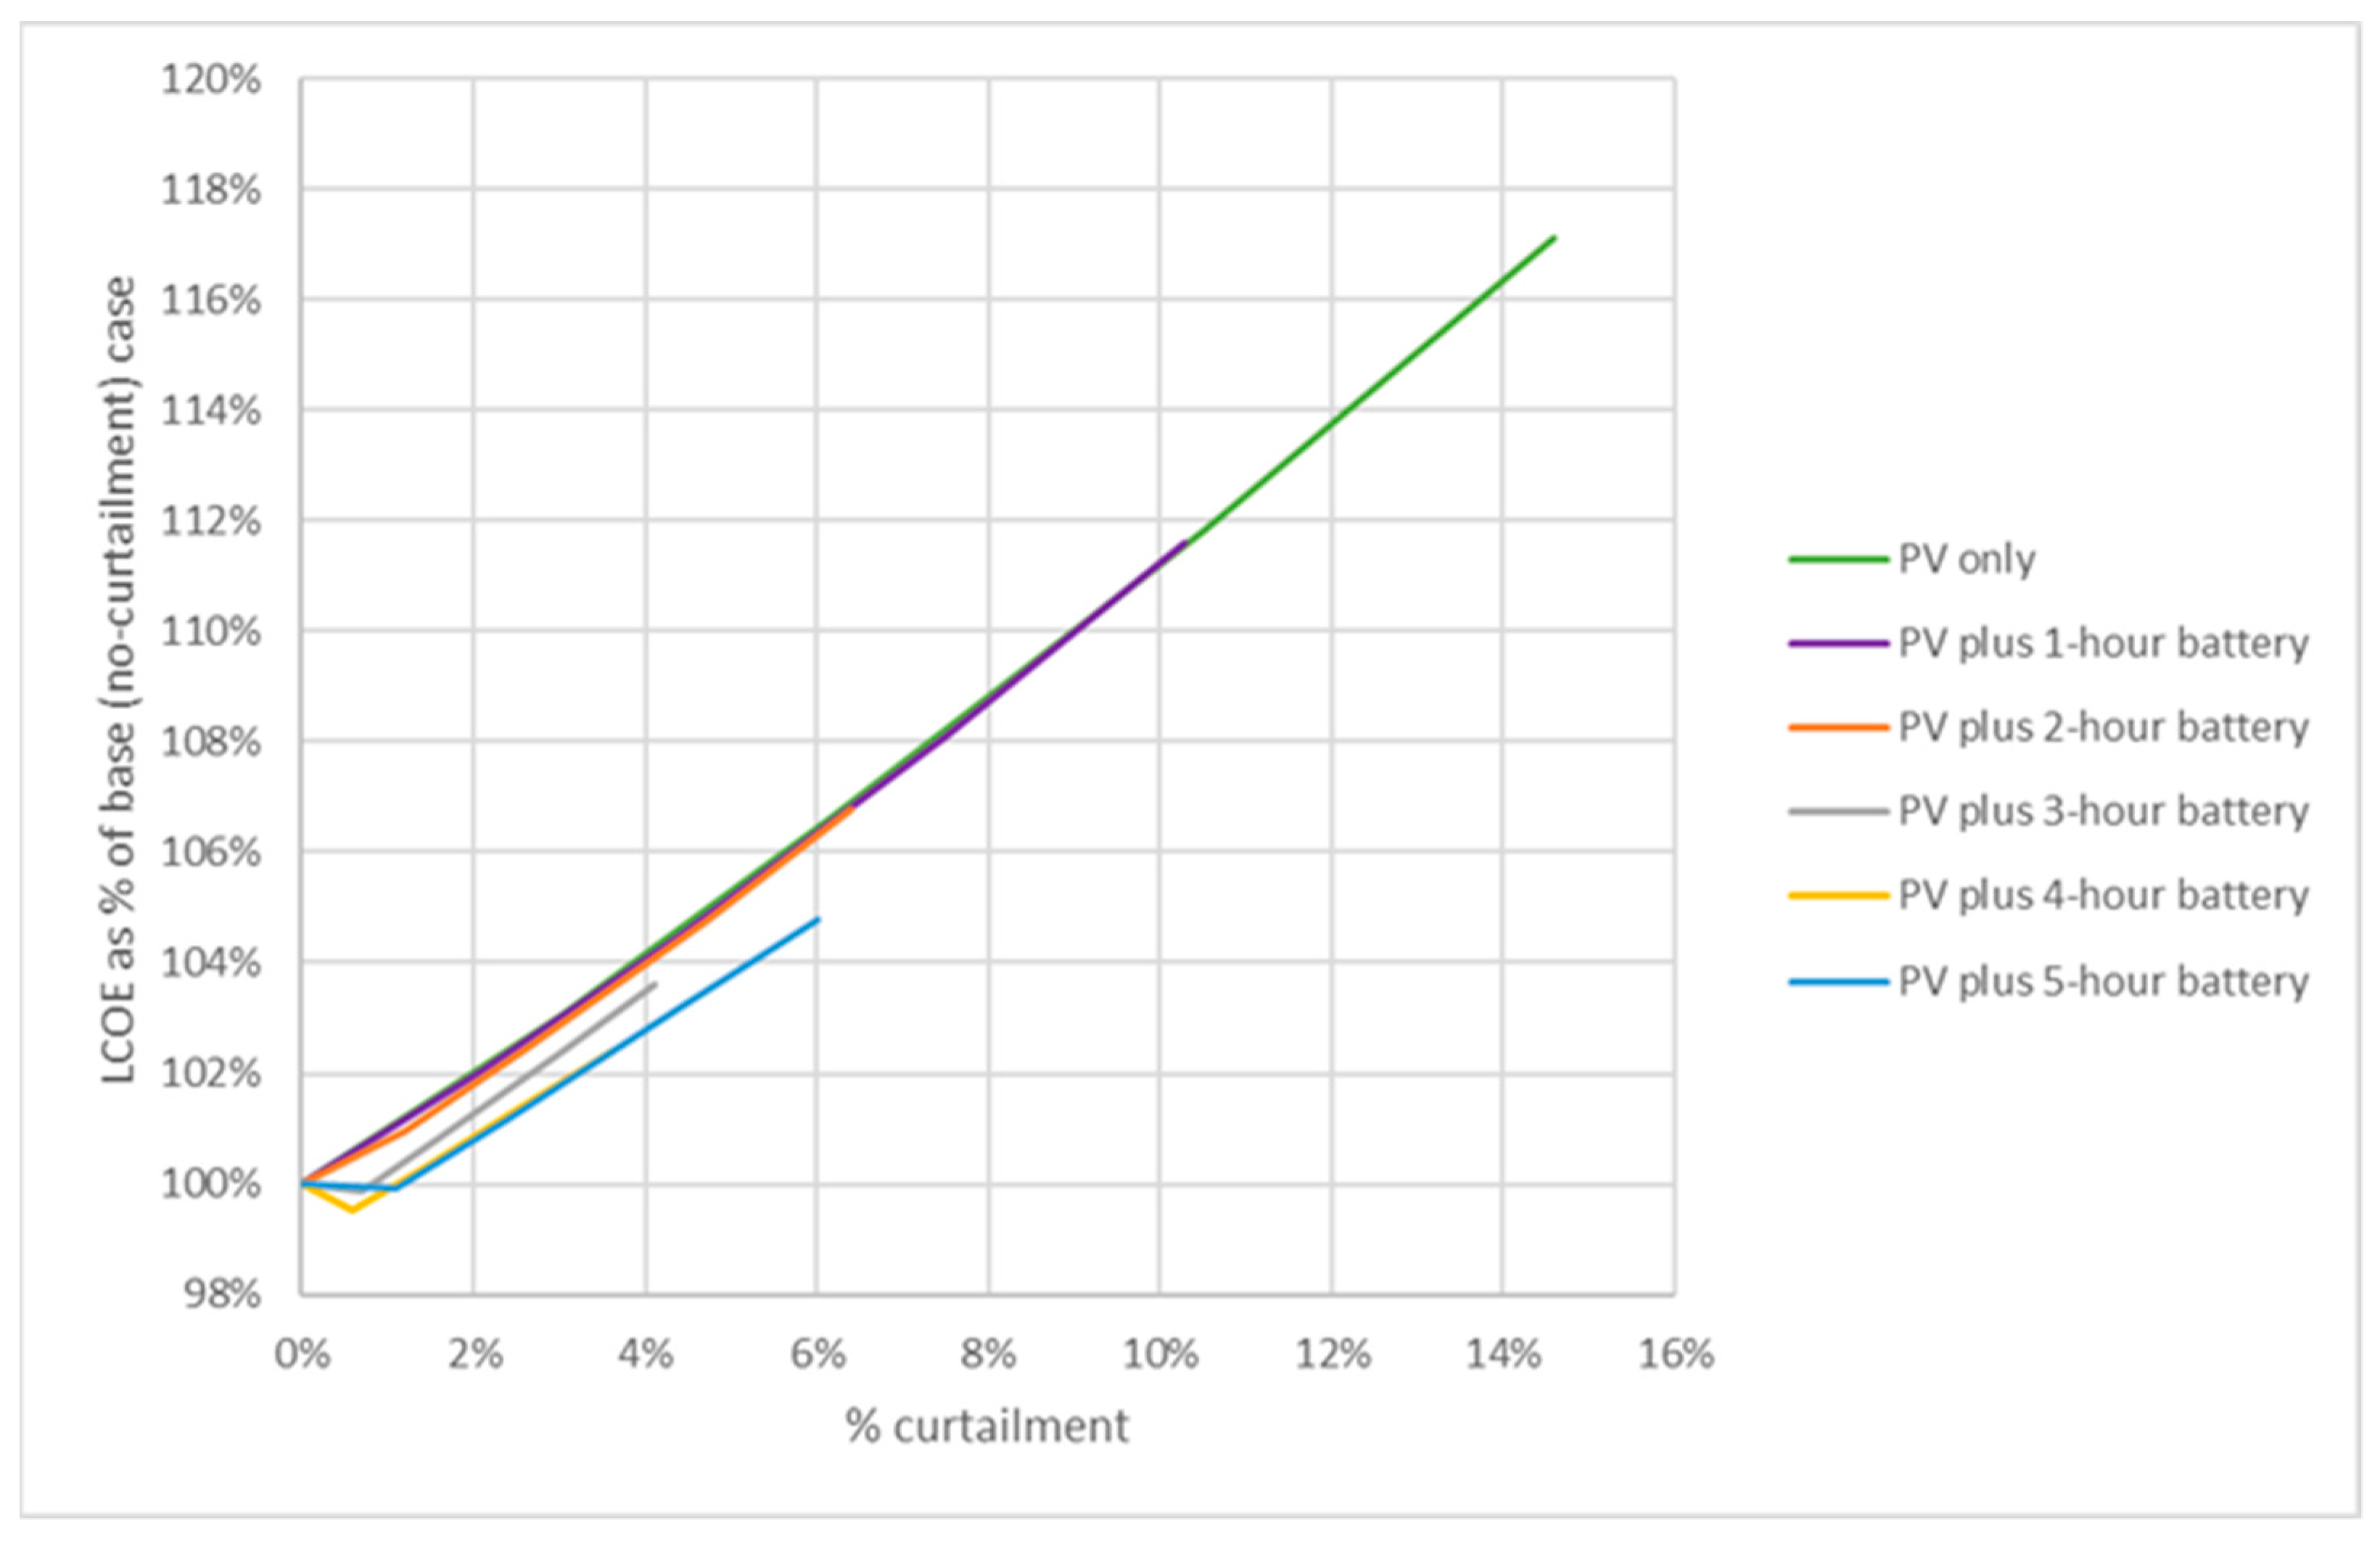
The relationship between percentage increase in LCOE versus increase in percentage curtailment is shown in Figure 12.
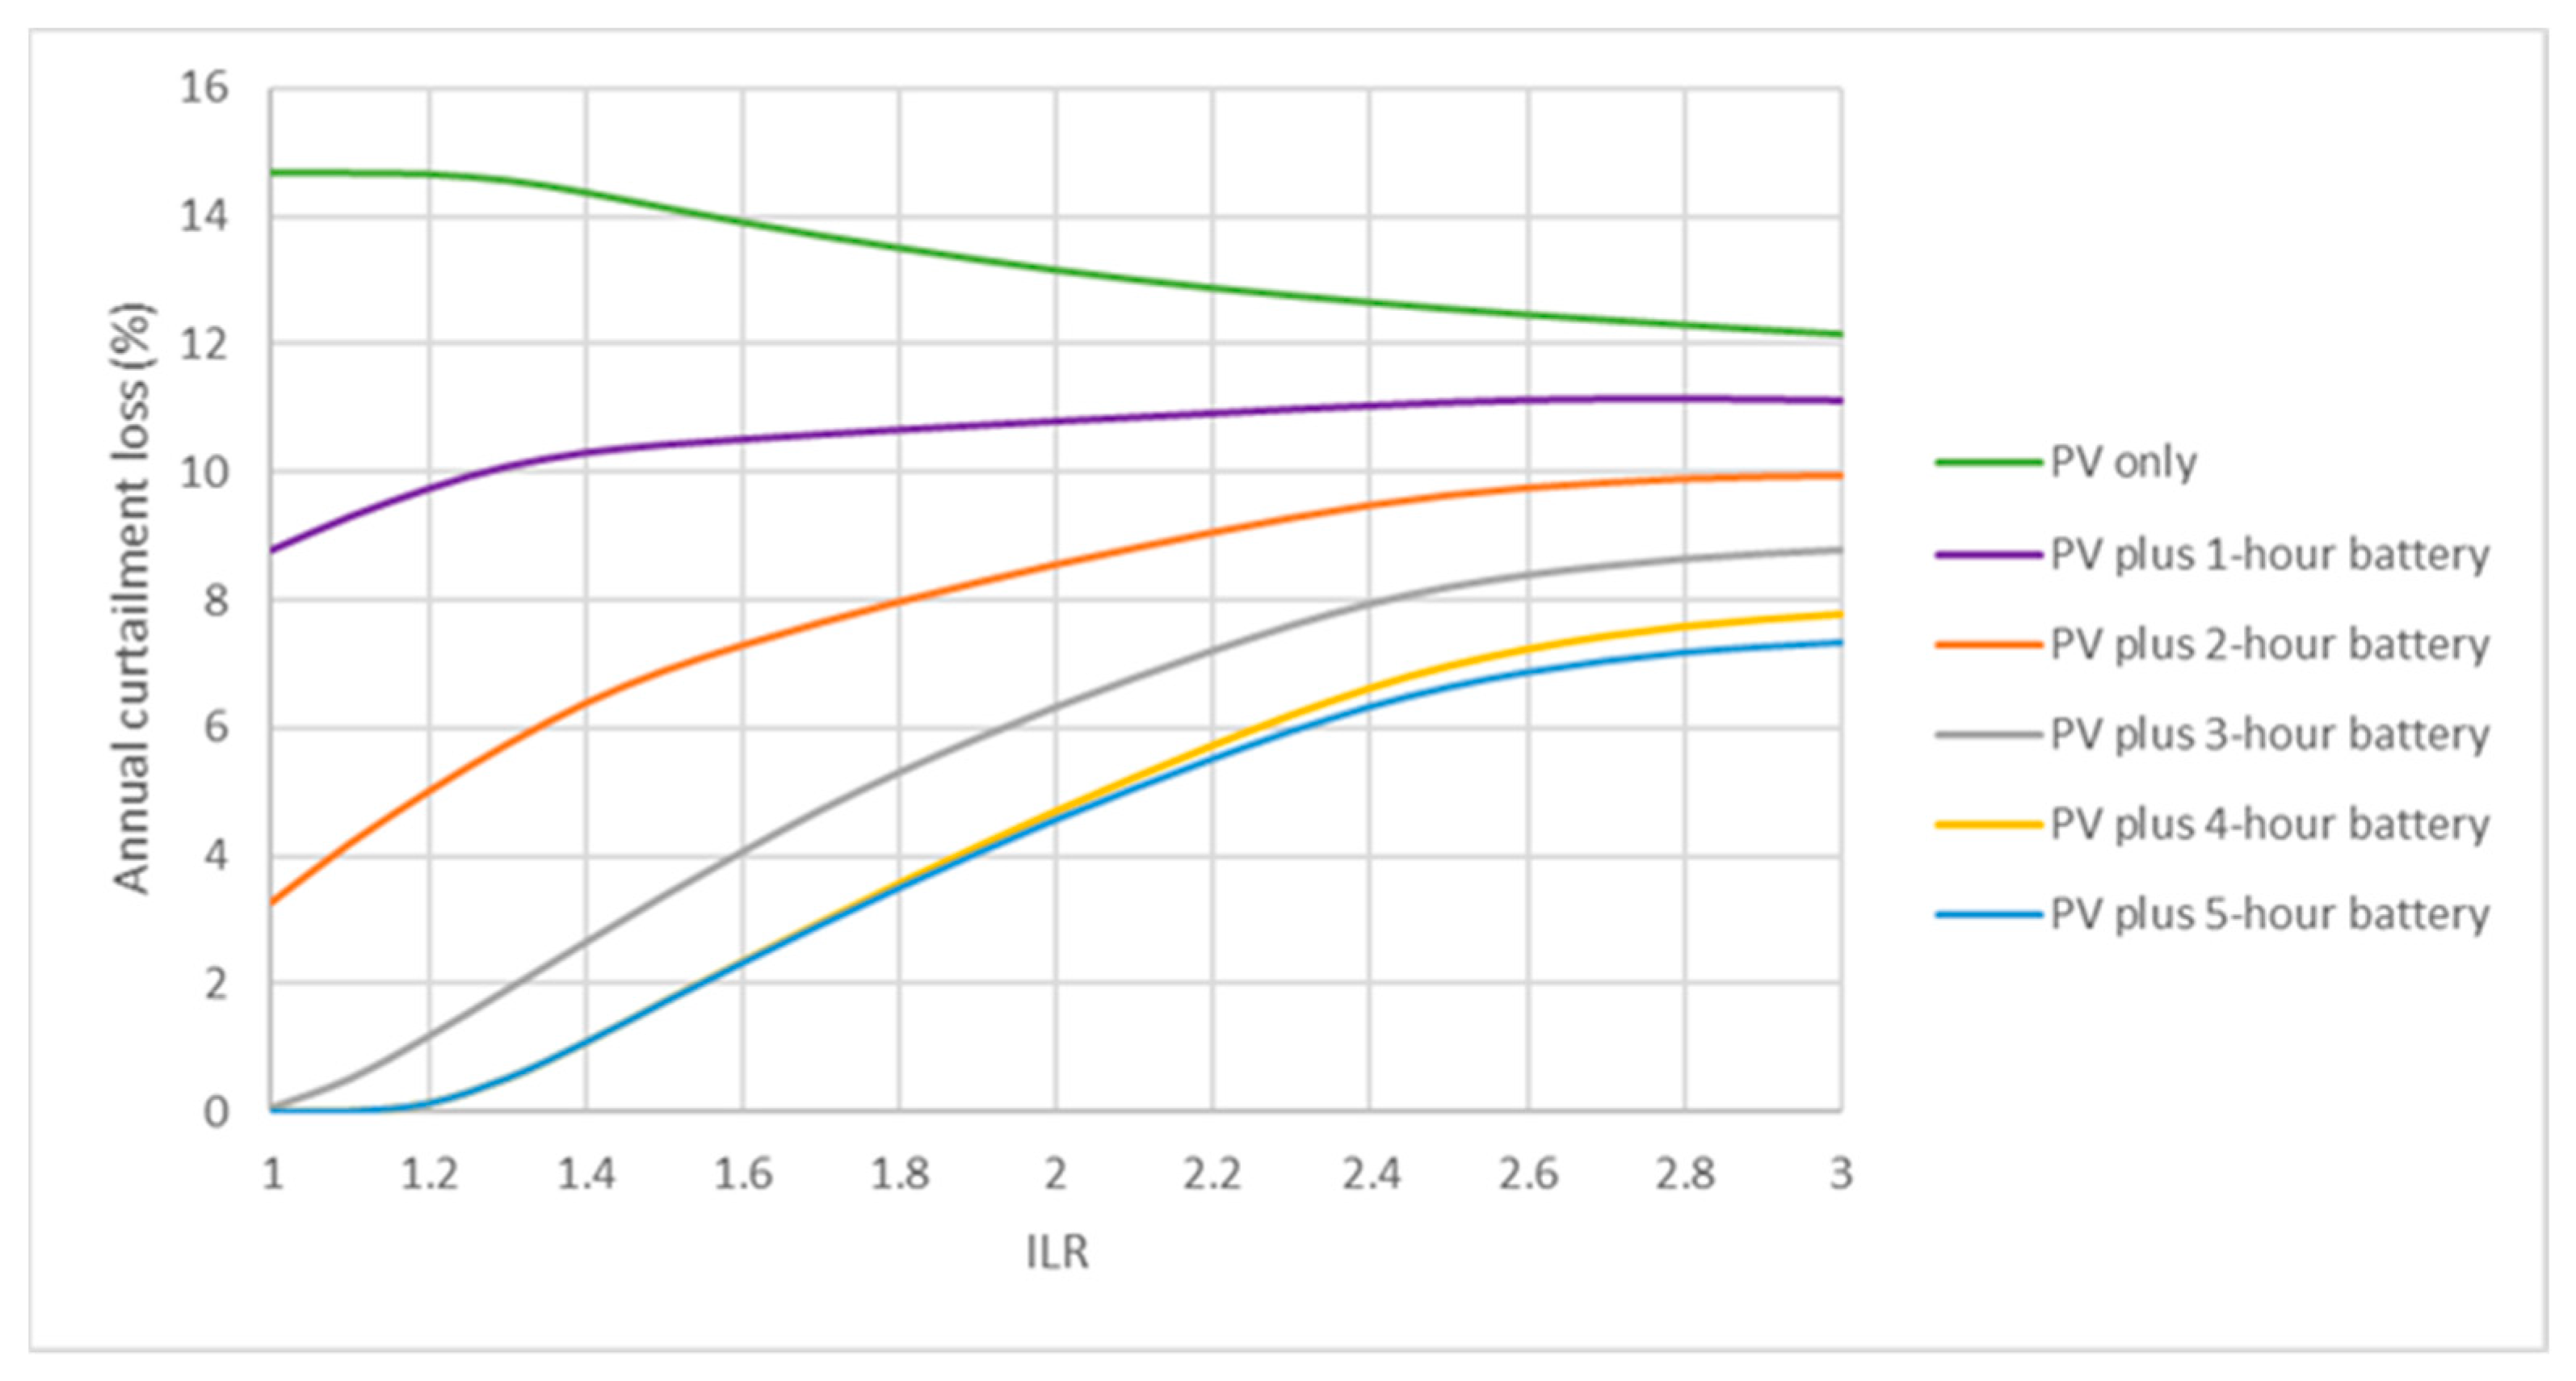
Clearly, for all practical cases, there is direct proportionality between the increase in LCOE and the amount of curtailment. Consequently, a key factor in keeping the LCOE of the PVB power plant acceptable is the capacity of the grid to accept the maximum electricity from the power plant, specifically, the non-dispatchable portion of the electricity production. This also shows that, at its current costs, storage technologies paired with VRE cannot on their own decarbonize the grid. Rather, it is vital to enhance the conventional generation fleet’s flexibility to maximize the integration of VRE, which in the case of PVB plants, will decrease the overall LCOE. Nonetheless, it is worth noting that, as expected, increasing storage capacities decreases the curtailment loss. Figure 13 shows how increased battery durations decrease the percentage curtailment significantly, especially at the low to moderately high ILRs. The minimal difference in curtailment reduction between the 4 and 5-h systems can be explained by the fact that the curtailment period is 4 h long. Hence, a 5-h system is excessive from the perspective of curtailment reduction.
3.5. Sensitivity Analysis
To ensure the robustness of the conclusions of this work, a sensitivity analysis has been performed. The sensitivity analysis reveals what impact changes to technical and financial parameters have on the LCOE of the PVB power plant. In addition to the parameters available in SAM, it was also resolved to study the impact of the variation of the solar resource, namely the GHI. This was motivated by the fact that while the simulations using the TMY data from [33] show that the yield of the modeled fixed-tilt PV system is around 1748 kWh/kWp, local solar PV developers usually use the figure of 1600 kWh/kWp as a reference figure. Furthermore, the ESMAP practical average PV yield is around 1536 kWh/kWp [31]. Consequently, to study the impact of variation of GHI, the hourly DHI and DNI values have been reduced by 10% in the TMY file, since SAM uses the DHI and DNI to determine the GHI. This modification reduces the daily average GHI from 5.68 kWh/m2/day to 5.11 kWh/m2/day i.e., a decrease of 10%. The sensitivity analyses have been performed for both fixed and single axis setups for the ILRs selected in Section 3.1 and Section 3.2.
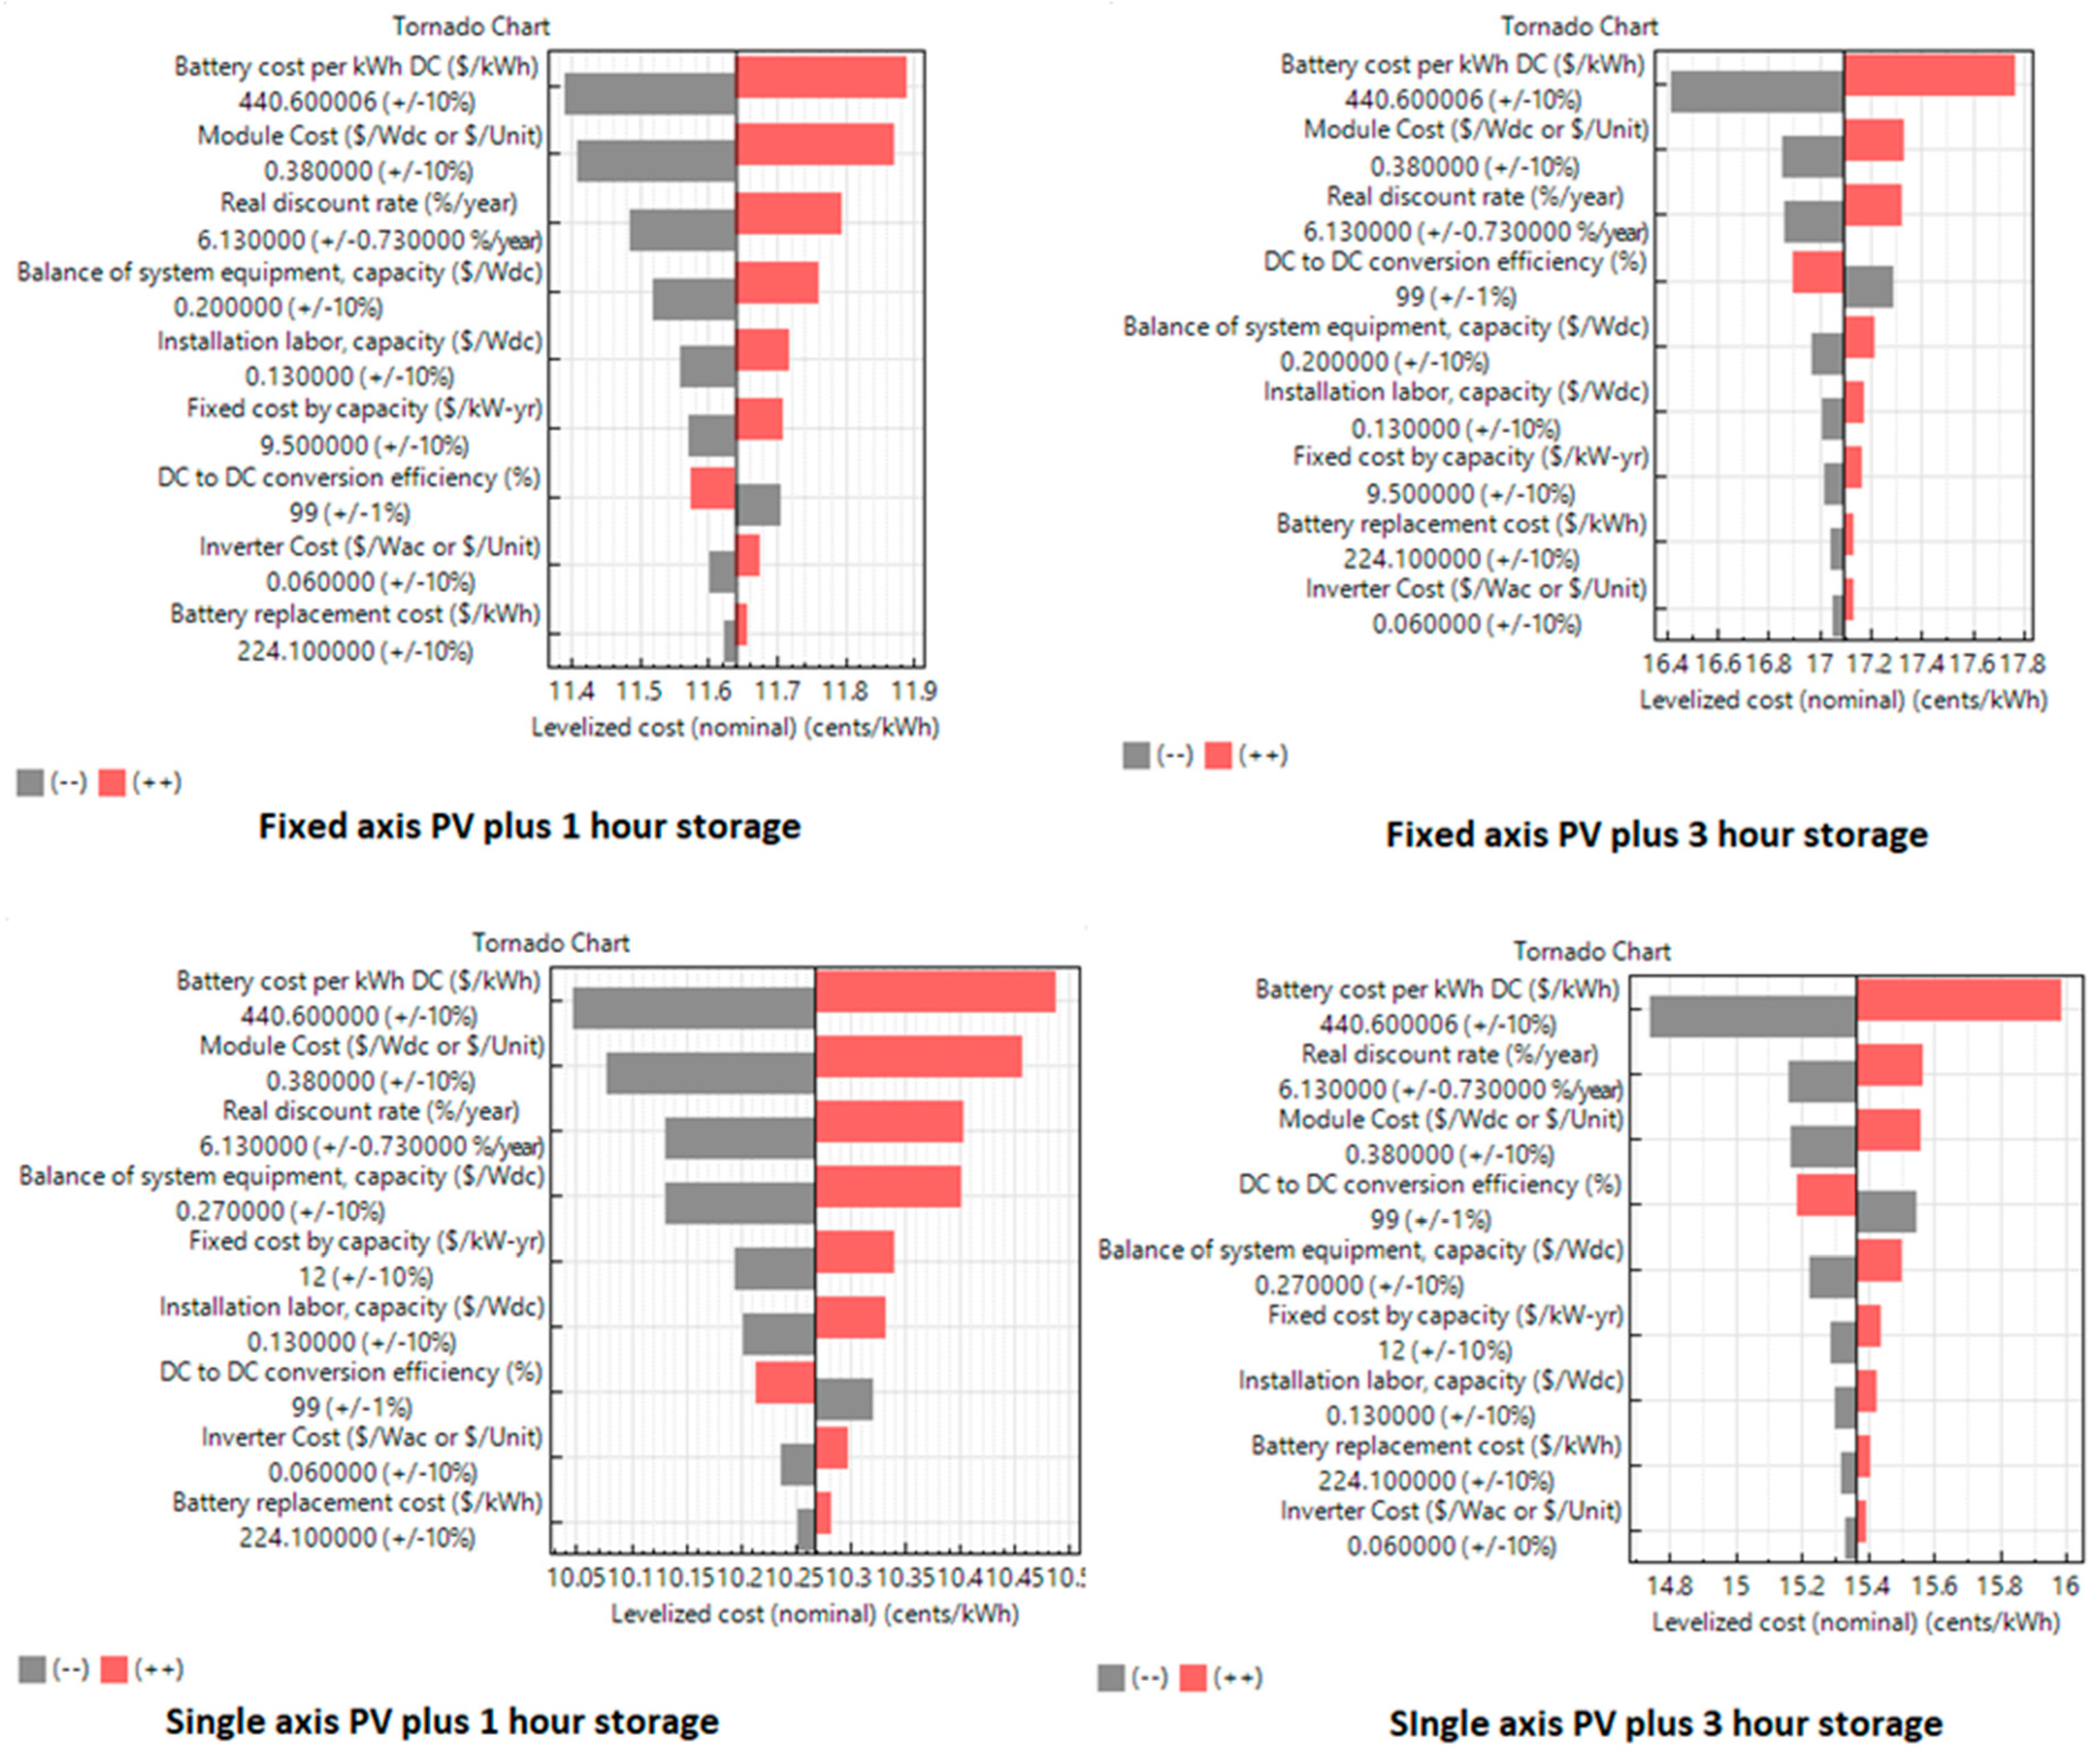
The simulation for the fixed-tilt PV only system with the modified irradiance produces a yield of 1581 kWh/kW, which is the desired outcome for this GHI sensitivity analysis. Table 10 shows the impact of a 10% decrease in GHI on the LCOE and generation for both fixed tilt and 1-axis tracking. The increase in LCOE for the PV plus battery plant is around 8 to 9%. Even with these increases, the PV plus battery solution with no tracking is lower or at least competitive with the fossil-fired generation used for peaking and intermediate generation stated in Section 3.1 and Section 3.2. The sensitivity analysis results are shown in Figure 14 (only 1 and 3-h systems shown).
Clearly the cost per kWh of the battery has the most significant impact on the LCOE. Furthermore, the importance of the battery cost increases with systems of longer storage duration, as expected. Yet, even when the cost of the battery is assumed to be 10% above the reference value, the LCOE is still within the bounds of the acceptable for a power system that has ambitious decarbonization objectives. The sensitivity analysis also demonstrates that the viability of the DC-coupled solar plus storage system will hinge heavily on the cost of lithium-ion batteries. The second most important parameter is the cost of the PV module, and it is closely followed by the real discount rate.
4. Conclusions
Thanks to the declining costs of lithium-ion batteries, utility-scale PVB has become a realistic power generation option in many power systems. Pairing batteries with a PV plant can provide such services as smoothing, ramping, arbitrage, and peaking capacity. In this work, we investigated the techno-economic aspects of the peaking ability of the PVB system. We focused on the DC-coupled variant, as its variable ILR offers design options for reducing the LCOE.
Using the SAM software, models of the DC-coupled solar PV plus battery plants were simulated to gain important insights into techno-economic performance. First, one key relationship demonstrated was that the LCOE of the PVB declined with increasing ILR and reached a minimum point that occurred at different ILRs for different battery sizes. Furthermore, for longer battery durations, the LCOE is, as expected, higher across the whole ILR range compared to systems with smaller batteries. However, it was shown that configuring the PVB is not a simple matter of choosing the ILR at which the minimum LCOE occurs. Indeed, to gain a better picture of how the additional PV module capacity is being used with increasing ILR, a new metric called the marginal clipping loss was defined. It calculates the increase in clipping loss due to an additional block of module capacity as a percentage of the potential generation of that additional block of module capacity. Using the marginal clipping loss, it is shown that having a large ILR is not necessarily better, even though the prices of PV modules are much more affordable now and modern inverters allow such high ILRs. This is because the marginal clipping loss increases very rapidly with ILR, leading to unproductive land use. Thus, use of the marginal clipping loss metric allows us to set a practical limit to the ILR of a plant and ensure more effective land use, while still enjoying reduction of LCOE with higher ILRs. The effective use of land is a key requirement in territories where space is a premium, for example, on islands.
It is also shown that while tracking improves LCOE, it also tends to exacerbate the clipping loss problem and its benefits on LCOE reduction are reduced, as ILR increases. Hence, the decision to implement tracking should be weighted very carefully considering the chosen ILR and the site solar radiation characteristic. The capacity of the PVB to serve the peak was investigated and it was found that, due to the good solar resource and relatively high ILRs, all configurations had high availabilities that could be further increased by allowing charging from the grid during off-peak period. Hence, PVB systems can be relied on as much as conventional generation for supplying the evening peak.
To understand the impact of curtailment on the LCOE of the PVB, four scenarios with increasing amounts of curtailment were defined. It is shown that LCOE increases in a directly proportional manner with the amount of curtailment. Thus, at the present costs, electricity storage alone is not sufficient to reduce the LCOE of PVB systems. Power generation flexibility still has a critical role to play, and policy makers and planners must take this into account so as not to be locked in an inflexible system dominated by fossil energy.
Sensitivity analyses show that battery costs have the most significant impact on LCOE. Given that it is expected that the cost of lithium-ion battery technology will decline further over the next years [4,37,38], it is safe to expect that PVB systems will become even more competitive. Finally, for the case of Mauritius, the LCOE of the selected configurations of PVB systems has become competitive with fossil-fired peaking generation. This has important implications for the power generation expansion strategy for the island. Moreover, given that many territories, in particular small island developing states, share similar physical and economic characteristics as Mauritius, this last conclusion will most likely be applicable for these countries too.
For the context of Mauritius, this study is a novel addition, given that others have considered only mature generation types [30,36,43]. In the broader context, to the best of our knowledge, compared to other works, this study goes into greater detail in the impact of design parameters on the techno-economic performance of PVB. However, one possible limitation of this work is the use of hourly data instead of more accurate sub-hourly intervals. This will have some impact on the energy figures and the LCOE, but the conclusions drawn are not expected to change.
The practical insights generated will be useful to utility planners and policy makers for planning their generation expansion strategy and in specifying the requirements of PVB plants in competitive bidding exercises. Furthermore, the simple analytical framework used in this work can be readily employed in other regions to critically assess the economic viability of the PVB system.
Further works should be focused on using commercial-grade data with smaller time resolution (subhourly) to obtain a more accurate assessment of energy generated and impact on the batteries. In the same vein, it would be worthwhile to model the smoothing and ramping functionalities the co-located BESS can provide to complement the output of the PV plant. This would be very interesting, as such services would help the integration of VRE such as PV. As noted earlier, P50/P90 studies simulations should be performed in situations where projects are being firmed up. Concerning the constraint of limited land availability on islands, an important area of research is the synergistic combination of rooftop PV and electric vehicles, as this will help in decarbonization of the transport sector as well. Finally, as shown by the curtailment analysis, the LCOE goes up with increasing curtailment. It is important to extend this analysis further to the situation where there can be no export at all to the grid during daytime. This situation will arise in power systems that are saturated with solar PV. Thus, the PVB would provide peak generation only. In that case, the analysis must consider the possibility of PV plants having ILRs less than unity to reduce the LCOE to acceptable levels, while also checking the impact on availability to serve the evening peak. This last research idea has, to the best of our knowledge, not yet been explored.
Author Contributions
Conceptualization, N.E. and R.T.F.A.K.; methodology, N.E. and R.T.F.A.K.; validation, N.E. and R.T.F.A.K.; formal analysis, N.E. and R.T.F.A.K.; investigation, N.E. and R.T.F.A.K.; writing—original draft preparation, N.E. and R.T.F.A.K.; writing—review and editing, N.E. and R.T.F.A.K.; visualization, N.E. and R.T.F.A.K.; supervision, R.T.F.A.K. All authors have read and agreed to the published version of the manuscript.
Funding
This research was partly funded by the Mauritius Higher Education Commission through the part-time MPhil/PhD Scholarship.
Data Availability Statement
TMY data was obtained from European Commission PV GIS group. https://re.jrc.ec.europa.eu/pvg_tools/en/tools.html#TMY (accessed on 9 October 2020).
Acknowledgments
The authors are also grateful for the time of the two reviewers, who made valuable comments that helped improve the quality of the manuscript.
Conflicts of Interest
The authors declare no conflict of interest. The funder had no role in the design of the study; in the collection, analyses, or interpretation of data; in the writing of the manuscript, or in the decision to publish the results.
References
- The United Nations. Paris Agreement; The United Nations: New York, NY, USA, 2015. [Google Scholar]
- IEA. The Role of CCUS in Low-Carbon Power Systems 2020; International Energy Agency: Paris, France, 2020. [Google Scholar]
- IRENA. Renewable Power Generation Costs 2020; International Renewable Energy Agency: Abu Dhabi, United Arab Emirates, 2020. [Google Scholar]
- IRENA. Electricity Storage and Renewables: Costs and Market to 2030; International Renewable Energy Agency: Abu Dhabi, United Arab Emirates, 2017. [Google Scholar]
- IEEFA. Solar-Plus-Storage Projects Spreading across the U.S. n.d. Available online: https://ieefa.org/solar-plus-storage-projects-spreading-across-the-u-s/ (accessed on 15 April 2021).
- PV Magazine. Chinese 202 MW/MWh Solar-Plus-Storage Project. 2020. Available online: https://www.pv-magazine.com/2020/05/20/chinese-202-mw-mwh-solar-plus-storage-project/ (accessed on 15 April 2021).
- Energy Storage News. France’s Island Territories Get Solar-Plus-Storage At Average Price below € 100/Mwh in Latest Auction. 2021. Available online: https://www.energy-storage.news/news/frances-island-territories-get-solar-plus-storage-at-average-price-below-10 (accessed on 15 April 2021).
- Denholm, P.L.; Margolis, R.M.; Eichman, J.D. Evaluating the Technical and Economic Performance of PV Plus Storage Power Plants; National Renewable Energy Laboratoty (NREL): Golden, CO, USA, 2017. [CrossRef]
- DiOrio, N.; Denholm, P.; Hobbs, W.B. A model for evaluating the configuration and dispatch of PV plus battery power plants. Appl. Energy 2020, 262, 114465. [Google Scholar] [CrossRef]
- Roy, S.; Sinha, P.; Ismat Shah, S. Assessing the Techno-Economics and Environmental Attributes of Utility-Scale PV with Battery Energy Storage Systems (PVS) Compared to Conventional Gas Peakers for Providing Firm Capacity in California. Energies 2020, 13, 488. [Google Scholar] [CrossRef] [Green Version]
- Agyekum, E.B. Techno-economic comparative analysis of solar photovoltaic power systems with and without storage systems in three different climatic regions, Ghana. Sustain. Energy Technol. Assess. 2021, 43, 100906. [Google Scholar] [CrossRef]
- Perkins, G. Techno-economic comparison of the levelised cost of electricity generation from solar PV and battery storage with solar PV and combustion of bio-crude using fast pyrolysis of biomass. Energy Convers. Manag. 2018, 171, 1573–1588. [Google Scholar] [CrossRef]
- Gordon, J.M.; Fasquelle, T.; Nadal, E.; Vossier, A. Providing large-scale electricity demand with photovoltaics and molten-salt storage. Renew. Sustain. Energy Rev. 2021, 135, 110261. [Google Scholar] [CrossRef]
- Laajimi, M.; Go, Y.I. Energy storage system design for large-scale solar PV in Malaysia: Techno-economic analysis. Renewables 2021, 8, 3. [Google Scholar] [CrossRef]
- Kosmadakis, I.E.; Elmasides, C.; Koulinas, G.; Tsagarakis, K.P. Energy unit cost assessment of six photovoltaic-battery configurations. Renew. Energy 2021, 173, 24–41. [Google Scholar] [CrossRef]
- Luerssen, C.; Gandhi, O.; Reindl, T.; Sekhar, C.; Cheong, D. Levelised Cost of Storage (LCOS) for solar-PV-powered cooling in the tropics. Appl. Energy 2019, 242, 640–654. [Google Scholar] [CrossRef]
- Al-Khori, K.; Bicer, Y.; Koç, M. Comparative techno-economic assessment of integrated PV-SOFC and PV-Battery hybrid system for natural gas processing plants. Energy 2021, 222, 119923. [Google Scholar] [CrossRef]
- Schleifer, A.H.; Murphy, C.A.; Cole, W.J.; Denholm, P.L. The evolving energy and capacity values of utility-scale PV-plus-battery hybrid system architectures. Adv. Appl. Energy 2021, 2, 100015. [Google Scholar] [CrossRef]
- Bullich-Massagué, E.; Cifuentes-García, F.-J.; Glenny-Crende, I.; Cheah-Mañé, M.; Aragüés-Peñalba, M.; Díaz-González, F.; Gomis-Bellmunt, O. A review of energy storage technologies for large scale photovoltaic power plants. Appl. Energy 2020, 274, 115213. [Google Scholar] [CrossRef]
- Lo Franco, F.; Morandi, A.; Raboni, P.; Grandi, G. Efficiency Comparison of DC and AC Coupling Solutions for Large-Scale PV+BESS Power Plants. Energies 2021, 14, 4823. [Google Scholar] [CrossRef]
- Edoo, M.N.; Ah King, R.T.F. New insights into the technical challenges of the Mauritius long term energy strategy. Energy 2020, 195, 116975. [Google Scholar] [CrossRef]
- NREL. System Advisor Model 2021. Available online: https://sam.nrel.gov/ (accessed on 17 March 2021).
- Heine, K.; Thatte, A.; Tabares-Velasco, P.C. A simulation approach to sizing batteries for integration with net-zero energy residential buildings. Renew. Energy 2019, 139, 176–185. [Google Scholar] [CrossRef]
- Aly, A.; Bernardos, A.; Fernandez-Peruchena, C.M.; Jensen, S.S.; Pedersen, A.B. Is Concentrated Solar Power (CSP) a feasible option for Sub-Saharan Africa?: Investigating the techno-economic feasibility of CSP in Tanzania. Renew. Energy 2019, 135, 1224–1240. [Google Scholar] [CrossRef]
- Hirbodi, K.; Enjavi-Arsanjani, M.; Yaghoubi, M. Techno-economic assessment and environmental impact of concentrating solar power plants in Iran. Renew. Sustain. Energy Rev. 2020, 120, 109642. [Google Scholar] [CrossRef]
- Kassem, A.; Al-Haddad, K.; Komljenovic, D. Concentrated solar thermal power in Saudi Arabia: Definition and simulation of alternative scenarios. Renew. Sustain. Energy Rev. 2017, 80, 75–91. [Google Scholar] [CrossRef]
- San Miguel, G.; Corona, B. Economic viability of concentrated solar power under different regulatory frameworks in Spain. Renew. Sustain. Energy Rev. 2018, 91, 205–218. [Google Scholar] [CrossRef]
- Wikipedia. Mauritius. 2021. Available online: https://en.wikipedia.org/wiki/Mauritius (accessed on 17 March 2021).
- The Commonwealth n.d. Available online: https://thecommonwealth.org/our-member-countries/mauritius (accessed on 13 October 2019).
- Ministry of Energy and Public Utilities. Mauritius Renewable Energy Roadmap 2030; Ministry of Energy and Public Utilities: Port Louis, Mauritius, 2019.
- World Bank. ESMAP. In Global Photovoltaic Power Potential by Country; World Bank: Washington, DC, USA, 2020. [Google Scholar]
- Global Solar Atlas 2.0, A Free, Web-Based Application Developed and Operated by the Company Solargis S.R.O. On Behalf of the World Bank Group, Utilizing Solargis Data, With Funding Provided by the Energy Sector Management Assistance Program (ESMAP). n.d. Available online: https://globalsolaratlas.info/download/mauritius (accessed on 17 March 2021).
- Google Earth Pro. Mauritius n.d. Available online: https://www.google.com/earth/versions/#earth-pro (accessed on 17 March 2021).
- European Commission. European Commission PV GIS. 2021. Available online: https://re.jrc.ec.europa.eu/pvg_tools/en/tools.html#TMY (accessed on 9 October 2020).
- IRENA. Renewable Power Generation Costs in 2019; International Renewable Energy Agency: Abu Dhabi, United Arab Emirates, 2020. [Google Scholar]
- Shea, R.P.; Ramgolam, Y.K. Applied levelized cost of electricity for energy technologies in a small island developing state: A case study in Mauritius. Renew. Energy 2019, 132, 1415–1424. [Google Scholar] [CrossRef]
- Hayward, J.A.; Graham, P.W. Electricity Generation Technology Cost Projections n.d:36; CSIRO: Victoria, Australia, 2017.
- Cole, W.; Frazier, A. Cost Projections for Utility-Scale Battery Storage: 2020 Update; National Renewable Energy Laboratory (NREL): Golden, CO, USA, 2020. [CrossRef]
- WorleyParsons RSA (Pty) Ltd. Assessing the Potential of Using Liquefied Natural Gas (LNG) for Electricity Generation in Mauritius; WorleyParsons: Bellville, South Africa, 2014. [Google Scholar]
- Seme, S.; Štumberger, B.; Hadžiselimović, M.; Sredenšek, K. Solar Photovoltaic Tracking Systems for Electricity Generation: A Review. Energies 2020, 13, 4224. [Google Scholar] [CrossRef]
- High Efficiency Real-Time 200 kw 500 kw 1 MW 2 MW Tracking Solar Tracker n.d. Available online: https://www.alibaba.com/product-detail/High-Efficiency-Real-time-200kw-500kw_62535878914.html?spm=a2700.pc_countrysearch.main07.122.5c1b1fadm9wTuw (accessed on 22 March 2021).
- Mini Mechanical Ground And Roof Mounting 0.08 Kwh/D Solar Photovoltaic Tracker. 2021. Available online: https://www.alibaba.com/product-detail/Mini-Mechanical-Ground-And-Roof-Mounting_1600118203119.html?spm=a2700.details.0.0.6382433eUVWLUh (accessed on 22 March 2021).
- Carnegie Clean Energy. High Penetration Renewable Energy Roadmap for the Republic of Mauritius; Mauritius Research Council: Quatre Bornes, Mauritius, 2017. [Google Scholar]
Figure 1.
The analytical framework for this study.

Figure 2.
Long-term average PV output of the island of Mauritius, 1999–2018 [32].
Figure 2.
Long-term average PV output of the island of Mauritius, 1999–2018 [32].

Figure 3.
Site location and northern part of Mauritius island [33].
Figure 3.
Site location and northern part of Mauritius island [33].

Figure 4.
Daily GHI, DNI, DHI at Solitude, Mauritius.

Figure 5.
Variation of LCOE with ILR for fixed-tilt system.

Figure 6.
Variation of AC capacity factor with ILR for fixed-tilt systems.

Figure 7.
Variation of annual AC inverter average and marginal clipping loss for fixed-tilt systems.
Figure 7.
Variation of annual AC inverter average and marginal clipping loss for fixed-tilt systems.

Figure 8.
Power generation profile for fixed-tilt system with storage of 3 h and ILR = 1.6.

Figure 9.
Comparison of % marginal clipping loss between fixed and single axis tracking.

Figure 10.
Percentage increase in generation of single over fixed tilt.

Figure 11.
Percentage decrease in LCOE brought by single axis tracking over fixed tilt.

Figure 12.
Relationship between percentage increase in LCOE versus percentage increase in curtailment for fixed-tilt systems.
Figure 12.
Relationship between percentage increase in LCOE versus percentage increase in curtailment for fixed-tilt systems.

Figure 13.
Variation of curtailment rate with ILR for different battery capacities for Scenario IV (fixed tilt).
Figure 13.
Variation of curtailment rate with ILR for different battery capacities for Scenario IV (fixed tilt).

Figure 14.
Sensitivity analyses results.


Table 1.
PV Plus Storage Configurations.
| Type of Coupling | Co-Located | Point of Common Coupling | Energy Stored |
|---|---|---|---|
| Independent | No | None | Grid (could include PV via market) |
| AC-coupled | Yes | Transmission/feeder | Grid or PV |
| DC-coupled | Yes | DC side of inverter | Grid or PV |
| DC tightly coupled | Yes | DC side of inverter | Only PV |
Table 2.
Key technical parameters.
| Parameter | Value | Parameter | Value |
|---|---|---|---|
| Location | −20.076, 57.538 | Backtracking | Enable |
| Resource data | European Commission PV GIS | Self-shading | Standard (non-linear) |
| PV Capacity | Depends on ILR | Module orientation | Portrait |
| PV Module | YL310D-30b | Average annual soiling loss | 5% (default value) |
| Inverter | SC750CP-US | Total DC power loss | 4.40% (default value) |
| DC to AC Ratio (ILR) | 1 to 3 | AC Wiring loss | 1% (default value) |
| Tracking | Fixed and 1 axis | Transformer no load and load losses | 0.0367% and 0.343%, respectively |
| Tilt | 0° for 1 axis and equal to location’s latitude for fixed tilt | Transmission loss | 0.02% |
| Azimuth | 0° | System availability (AC) loss | 1% |
| Ground coverage ratio | 0.35 for 1 axis and 0.40 for fixed | Annual DC degradation rate | 0.5%/year (default) |
| Tracker rotation limit | 45° |
Table 3.
Capital cost parameters.
| Parameter | Value | Parameter | Value |
|---|---|---|---|
| Module cost | 0.38 $/Wdc | Engineering and developer overhead | 0.08 $/Wdc |
| Inverter cost | 0.06 $/Wdc | Grid interconnection | 0.03 $/Wdc |
| BOS equipment cost | 0.20 $/Wdc (fixed axis) 0.27 $/Wdc (single axis) | Land costs | USD 14,164.15/acre (for a lease period of 20 years) |
| Installation labor | 0.13 $/Wdc (single axis) | Land prep. & transmission cost | 0.02 $/Wdc |
| Installer margin and overhead | 0.06 $/Wdc | Battery DC capacity cost | 440.6 $/kWh and 85.2 $/kW |
| Contingency | 3% | Battery replacement cost (after 10 years) | 224.1 $/kWh |
| Permitting and environmental studies cost | 0.01 $/Wdc |
Table 4.
Minimum LCOE and corresponding generation with ILR for fixed-tilt system.
| Battery Duration (h) | ILR at Minimum LCOE | Annual Generation—Year 1 (GWh) | LCOE Cents USD/kWh |
|---|---|---|---|
| 0 | 1.0 | 25.6 | 7.9 |
| 1 | 1.4 | 34.5 | 11.6 |
| 2 | 1.6 | 37.7 | 14.5 |
| 3 | 2.0 | 44.3 | 16.6 |
| 4 | 2.3 | 51.0 | 17.9 |
| 5 | 2.6 | 58.6 | 18.6 |
Table 5.
Selected ILR as constrained by marginal clipping loss for fixed-tilt system.
| Battery Duration (h) | Selected ILR | Annual Generation—Year 1 (GWh) | LCOE Cents USD/kWh |
|---|---|---|---|
| 0 | 1.0 | 25.6 | 7.9 |
| 1 | 1.4 | 34.5 | 11.6 |
| 2 | 1.4 | 34.5 | 14.8 |
| 3 | 1.6 | 38.5 | 17.1 |
| 4 | 1.8 | 43.1 | 18.8 |
| 5 | 2.3 | 54.2 | 19.0 |
Table 6.
Selected ILR with single axis.
| Battery Duration (h) | Selected ILR | Annual Generation—Year 1 (GWh) | LCOE Cents USD/kWh |
|---|---|---|---|
| 0 | 1.0 | 31.1 | 7.0 |
| 1 | 1.3 | 39.3 | 10.3 |
| 2 | 1.4 | 41.4 | 12.8 |
| 3 | 1.4 | 41.6 | 15.4 |
| 4 | 1.5 | 44.1 | 17.4 |
| 5 | 1.7 | 49.1 | 18.8 |
Table 7.
EAF for battery during peak.
| Equivalent Availability Factor | |||||
|---|---|---|---|---|---|
| Battery Size | 1-h Battery | 2-h Battery | 3-h Battery | 4-h Battery | 5-h Battery |
| Fixed tilt system | 96.3% | 96.6% | 96.5% | 96.3% | 96.4% |
| Single axis system | 96.2% | 96.6% | 96.3% | 96.0% | 95.7% |
Table 8.
Impact of curtailment on LCOE for fixed-tilt PV plus battery systems.
| Storage Duration | ILR | Metric | Base Case | Scenario I | Scenario II | Scenario III | Scenario IV |
|---|---|---|---|---|---|---|---|
| 0 | 1.0 | Curtailed energy | 0.0% | 3.0% | 6.2% | 10.6% | 14.7% |
| LCOE (cents USD) | 7.9 | 8.1 | 8.4 | 8.8 | 9.2 | ||
| LCOE as % of base | 100% | 103.0% | 106.6% | 111.8% | 117.1% | ||
| 1-h | 1.4 | Curtailed energy | 0.0% | 2.1% | 4.4% | 7.5% | 10.3% |
| LCOE (cents USD) | 11.6 | 11.9 | 12.2 | 12.6 | 13.0 | ||
| LCOE as % of base | 100% | 102.1% | 104.5% | 108.1% | 111.6% | ||
| 2-h | 1.4 | Curtailed energy | 0.0% | 1.2% | 2.6% | 4.7% | 6.4% |
| LCOE (cents USD) | 14.8 | 14.9 | 15.1 | 15.5 | 15.8 | ||
| LCOE as % of base | 100% | 100.7% | 102.0% | 104.7% | 106.8% | ||
| 3-h | 1.6 | Curtailed energy | 0.0% | 0.7% | 1.6% | 3.0% | 4.1% |
| LCOE (cents USD) | 17.1 | 17.1 | 17.2 | 17.5 | 17.7 | ||
| LCOE as % of base | 100% | 99.9% | 100.8% | 102.3% | 103.6% | ||
| 4-h | 1.8 | Curtailed energy | 0.0% | 0.6% | 1.4% | 2.6% | 3.6% |
| LCOE (cents USD) | 18.8 | 18.7 | 18.8 | 19.1 | 19.2 | ||
| LCOE as % of base | 100% | 99.5% | 100.3% | 101.4% | 102.4% | ||
| 5-h | 2.3 | Curtailed energy | 0.0% | 1.1% | 2.4% | 4.4% | 6.0% |
| LCOE (cents USD) | 19.0 | 19.0 | 19.2 | 19.6 | 19.9 | ||
| LCOE as % of base | 100% | 99.9% | 101.2% | 103.2% | 104.8% |
Table 9.
Impact of curtailment on LCOE for single-axis PV plus battery systems.
| Storage Duration | ILR | Metric | Base Case | Scenario I | Scenario II | Scenario III | Scenario IV |
|---|---|---|---|---|---|---|---|
| 0 | 1.0 | Curtailed energy | 0.0% | 2.3% | 4.7% | 8.5% | 12.0% |
| LCOE (cents USD) | 7.0 | 7.2 | 7.4 | 7.7 | 8.0 | ||
| LCOE as % of base | 100% | 102.3% | 105.0% | 109.3% | 113.6% | ||
| 1-h | 1.3 | Curtailed energy | 0.0% | 1.5% | 3.1% | 5.8% | 8.1% |
| LCOE (cents USD) | 10.3 | 10.4 | 10.6 | 10.9 | 11.2 | ||
| LCOE as % of base | 100% | 101.5% | 103.2% | 106.2% | 109.0% | ||
| 2-h | 1.4 | Curtailed energy | 0.0% | 0.8% | 1.8% | 3.6% | 5.0% |
| LCOE (cents USD) | 12.8 | 12.9 | 13.0 | 13.3 | 13.5 | ||
| LCOE as % of base | 100% | 100.7% | 101.7% | 103.7% | 105.4% | ||
| 3-h | 1.4 | Curtailed energy | 0.0% | 0.2% | 0.5% | 1.5% | 2.1% |
| LCOE (cents USD) | 15.4 | 15.4 | 15.4 | 15.6 | 15.7 | ||
| LCOE as % of base | 100% | 100.1% | 100.5% | 101.5% | 102.3% | ||
| 4-h | 1.5 | Curtailed energy | 0.0% | 0.1% | 0.3% | 0.9% | 1.4% |
| LCOE (cents USD) | 17.4 | 17.4 | 17.4 | 17.5 | 17.6 | ||
| LCOE as % of base | 100% | 99.7% | 99.8% | 100.5% | 100.9% | ||
| 5-h | 1.7 | Curtailed energy | 0.0% | 0.3% | 0.6% | 1.6% | 2.4% |
| LCOE (cents USD) | 18.8 | 18.7 | 18.8 | 19.0 | 19.1 | ||
| LCOE as % of base | 100% | 99.8% | 100% | 100.9% | 101.7% |
Table 10.
Impact of 10% decrease in GHI on LCOE and generation.
| PV Only | PV Plus 1 h | PV Plus 2 h | PV Plus 3 h | PV Plus 4 h | PV Plus 5 h | ||
|---|---|---|---|---|---|---|---|
| Fixed axis | LCOE of base case (cents USD) | 7.9 | 11.6 | 14.8 | 17.1 | 18.8 | 19.0 |
| % variation LCOE from base case | +11% | +9% | +9% | +8% | +8% | +8% | |
| Energy generated (GWh of year 1) in base case | 25.6 | 34.5 | 34.5 | 38.5 | 43.1 | 54.2 | |
| % variation energy generated from base case | −10% | −8% | −8% | −7% | −8% | −8% | |
| Single axis | LCOE of base case (cents USD) | 7.0 | 10.3 | 12.8 | 15.4 | 17.4 | 18.8 |
| % variation LCOE from base case | +10% | +10% | +8% | +9% | +8% | +8% | |
| Energy generated (GWh of year 1) in base case | 31.1 | 39.3 | 41.4 | 41.6 | 44.1 | 49.1 | |
| % variation energy generated from base case | −10% | −8% | −7% | −8% | −8% | −8% |
Publisher’s Note: MDPI stays neutral with regard to jurisdictional claims in published maps and institutional affiliations. |
© 2021 by the authors. Licensee MDPI, Basel, Switzerland. This article is an open access article distributed under the terms and conditions of the Creative Commons Attribution (CC BY) license (https://creativecommons.org/licenses/by/4.0/).
Share and Cite
MDPI and ACS Style
Edoo, N.; Ah King, R.T.F. Techno-Economic Analysis of Utility-Scale Solar Photovoltaic Plus Battery Power Plant. Energies 2021, 14, 8145. https://0-doi-org.brum.beds.ac.uk/10.3390/en14238145
AMA Style
Edoo N, Ah King RTF. Techno-Economic Analysis of Utility-Scale Solar Photovoltaic Plus Battery Power Plant. Energies. 2021; 14(23):8145. https://0-doi-org.brum.beds.ac.uk/10.3390/en14238145
Chicago/Turabian StyleEdoo, Nawaz, and Robert T. F. Ah King. 2021. "Techno-Economic Analysis of Utility-Scale Solar Photovoltaic Plus Battery Power Plant" Energies 14, no. 23: 8145. https://0-doi-org.brum.beds.ac.uk/10.3390/en14238145
Note that from the first issue of 2016, this journal uses article numbers instead of page numbers. See further details here.