
Evaluation of the Radar Speed Cameras and Panels Indicating the Vehicles’ Speed as Traffic Calming Measures (TCM) in Short Length Urban Areas Located along Rural Roads


Abstract
:1. Introduction
- Vehicle going straight and pedestrian crossing the road (51%);
- Vehicle turning left and pedestrian crossing the road at the exit (17%) or the entry (3%) of the crossing;
- Vehicle turning right and pedestrian crossing the road at the exit (12%) or the entry (4%) of the crossing;
- Vehicle going straight and pedestrian in (3%) or adjacent to (6%) the road.
2. Materials and Methods
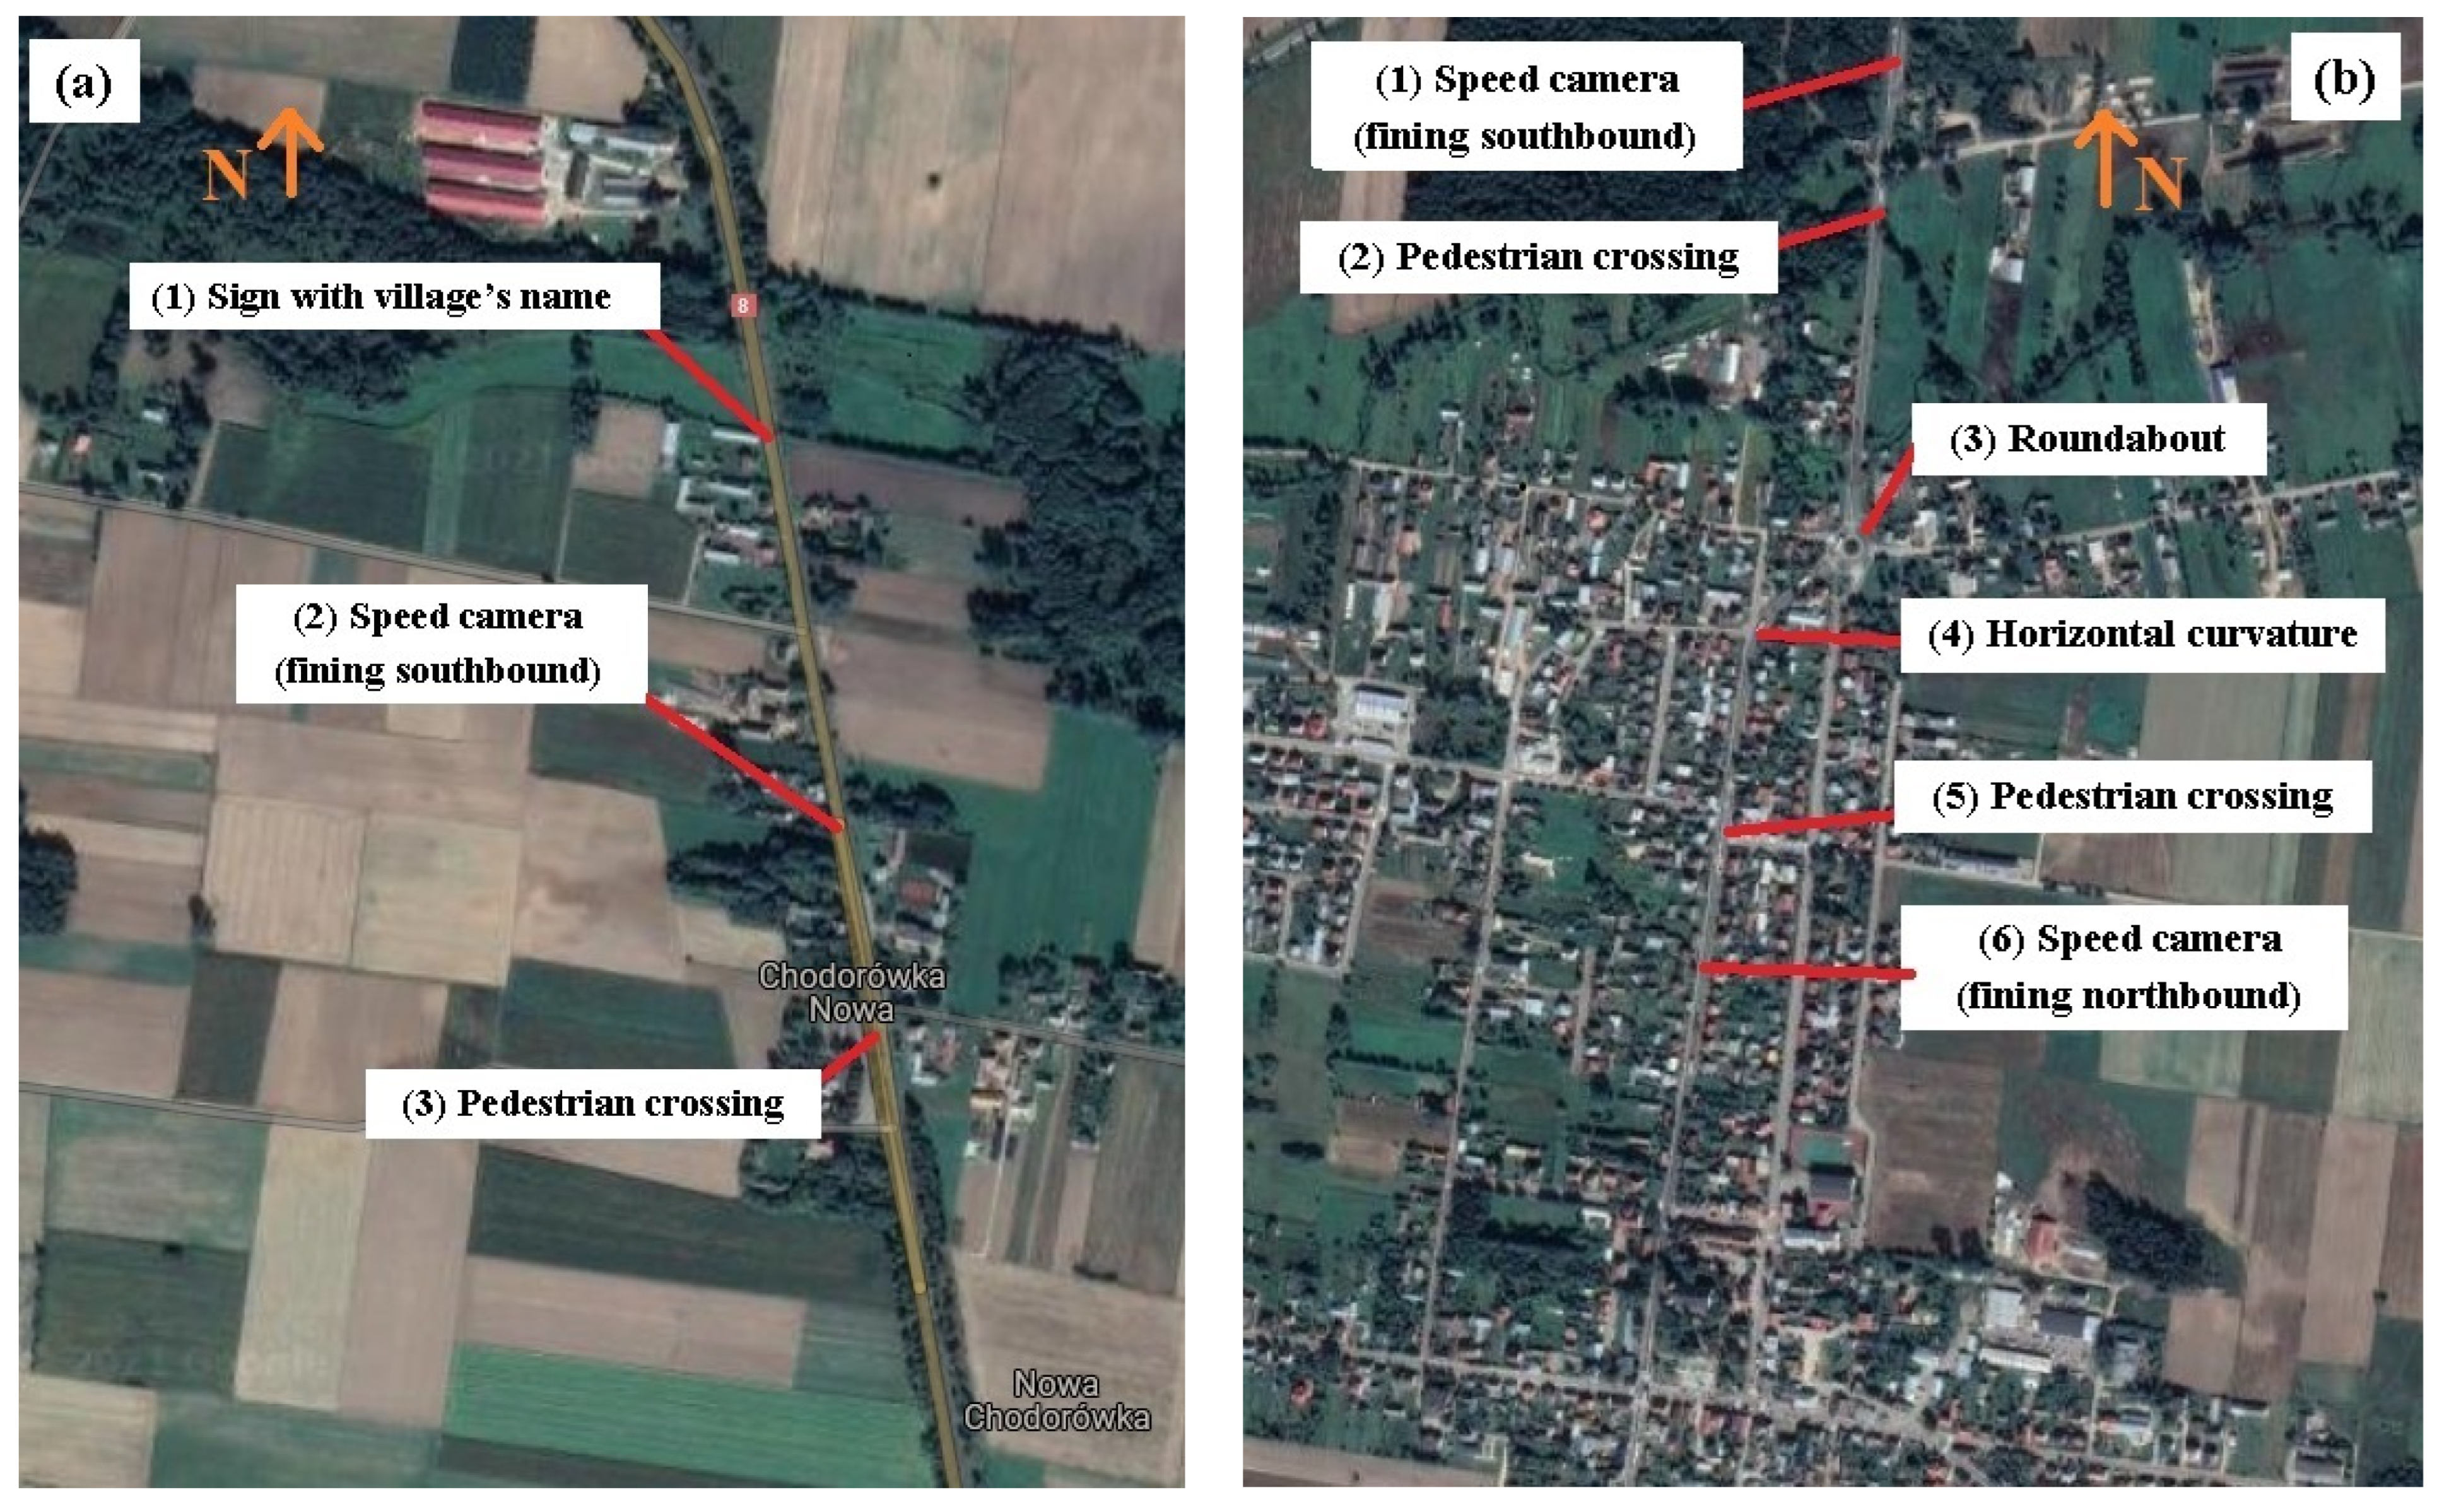
2.1. Villages in Poland
- A sign with the village name (1);
- Radar speed camera, fining vehicles going southbound (2);
- Pedestrian crossing (3).
- Speed camera (fining vehicles southbound) (1), 30 m south from the sign with the village name;
- Pedestrian crossing (2), 60 m away from the speed camera in point 1;
- Roundabout (3);
- Horizontal curvature (4);
- Pedestrian crossing (5), 210 m south from the horizontal curvature, which creates a physical deflection influencing vehicles’ speed;
- Speed camera faced northbound (6), 120 m from the crosswalk in point 5.
2.2. Villages in Spain
- Signs and panels indicating that the speed limit is 50 km/h and the presence of a speed camera (1) and (2);
- Traffic lights with a pedestrian crossing and a pushbutton (3);
- Radar speed camera faced to control vehicles northbound (4);
- Traffic lights with pedestrian crossing and a pushbutton (5);
- Signs and panels indicating that the speed limit is 50 km/h and the presence of a speed camera (6) and (7).
- A panel indicating the presence of traffic light (1);
- A panel indicating the speed of each vehicle (with a speed limit of 50 km/h) for vehicles going southbound (2);
- Traffic lights with a pedestrian cross walk and a pushbutton (3);
- Pedestrian crossing (4);
- Traffic lights warning about the presence of traffic lights (5);
- A panel indicating the speed of each vehicle (with a speed limit of 50 km/h) for vehicles going northbound (6).
3. Results and Discussion
3.1. Results in Chodorówka Nowa (Poland)
3.2. Results in Suchowola (Poland)
3.3. Results in Arrankudiaga (Spain)
3.4. Results in Arrespalditza/Respaldiza (Spain)
3.5. Discussion
4. Conclusions
Author Contributions
Funding
Institutional Review Board Statement
Informed Consent Statement
Data Availability Statement
Conflicts of Interest
References
- Llopis-Castelló, D.; Findley, D.J. Influence of calibration factors on crash prediction on rural two-lane two-way roadway segments. J. Transp. Eng. A Syst. 2019, 145, 040190241–040190249. [Google Scholar] [CrossRef]
- Shad, S.A.R.; Ahmad, N. Road infrastructure analysis with reference to traffic stream characteristics and accidents: An application of benchmarking based safety analysis and sustainable decision-making. Appl. Sci. 2019, 9, 2320. [Google Scholar] [CrossRef] [Green Version]
- European Commission. Annual Statistical Report on Road Safety in the EU 2020; European Road Safety Observatory: Brussels, Belgium, 2021. [Google Scholar]
- European Commission. Facts and Figures—Pedestrian; European Road Safety Observatory: Brussels, Belgium, 2020. [Google Scholar]
- European Commission. Road Safety Thematic Report—Pedestrians; European Road Safety Observatory: Brussels, Belgium, 2021. [Google Scholar]
- Hall, J.W.; Smith, K.L.; Titus-Glover, L.; Wambold, J.C.; Yager, T.J.; Rado, Z. Guide for Pavement Friction; Contractor’s Final Report for NCHRP-Project 01-43; Transportation Research Board: Washington, DC, USA, 2009. [Google Scholar]
- Chen, Y.; Li, Y.; King, M.; Shi, Q.; Wang, C.; Li, P. Identification methods of key contributing factors in crashes with high number of fatalities and injuries in China. Traffic Inj. Prev. 2016, 17, 878–883. [Google Scholar] [CrossRef]
- Pérez-Acebo, H.; Gonzalo-Orden, H.; Rojí, E. Skid resistance prediction for new two-lane roads. Proc. Inst. Civ. Eng. Transp. 2019, 172, 264–273. [Google Scholar] [CrossRef]
- Treat, J.R.; Tumbas, N.S.; McDonald, S.T.; Shinar, D.; Hume, R.D. Tri-Level Study of the Causes of Traffic Accidents: Executive Summary; Technical Report No. DOT HS-805 099; National Technical Information Services: Bloomington, IN, USA, 1979. [Google Scholar]
- European Commission. Road Safety Thematic Report—Speeding; European Road Safety Observatory: Brussels, Belgium, 2021. [Google Scholar]
- Rosén, E.; Sander, U. Pedestrian fatality risk as a function of car impact speed. Accid. Anal. Prev. 2009, 41, 536–542. [Google Scholar] [CrossRef] [PubMed]
- Hesjesvol, I.; Hoye, A. Pedestrian Crossing Options. Handbook of Road Safety Measures. Available online: https://www.tshandbok.no/del-2/3-trafikkregulering/doc663/ (accessed on 15 February 2021).
- Yue, L.; Abdel-Aty, M.; Wu, Y.; Zheng, O.; Yuan, J. In-depth approach for identifying crash causation patterns and its implications for pedestrian crash prevention. J. Saf. Res. 2020, 73, 119–132. [Google Scholar] [CrossRef]
- Populer, M.; Chalanton, I.M. Focant, N. Ongevallen met Voetgangers op of in de Buurt van Lichtengeregelde Voetgangersoversteekplaatsen; VIAS Institute: Brussels, Belgium, 2018. [Google Scholar]
- Dupriez, B.; Houdmont, A. Gedetailleerde Analyse van Ongevallen in het Brussels Hoofdstedelijk Gewest (2000–2005); D/2009/0779/87; Brussels Mobility: Brussels, Belgium, 2009. [Google Scholar]
- International Transport Forum—OECD. Speed and Crash Risk. Research Report; International Traffic Safety Data and Analyses Group: Paris, France, 2018. [Google Scholar]
- The Polish General Police Headquarters. Road Accidents in Poland in 2019; Traffic Department: Warsaw, Poland, 2020. [Google Scholar]
- Paszkowski, J.; Hermann, M.; Richter, M.; Szarata, A. Modelling the effects of traffic-calming introduction to volume-delay functions and traffic assignment. Energies 2021, 14, 3726. [Google Scholar] [CrossRef]
- Ziolkowski, R.; Dziejma, Z. Investigations of the dynamic travel time information impact on drivers’ route choice in an urban area—A case study based on the city of Bialystok. Energies 2021, 14, 1645. [Google Scholar] [CrossRef]
- Solowczuk, A. Effect of traffic calming in a downtown district of Szczecin, Poland. Energies 2021, 14, 5838. [Google Scholar] [CrossRef]
- Loprencipe, G.; Moretti, L.; Pantuso, A.; Banfi, E. Raised pedestrian crossing: Analysis of their characteristics on a road network and geometric sizing proposal. Appl. Sci. 2019, 9, 2844. [Google Scholar] [CrossRef] [Green Version]
- Lockwood, I.M. ITE Traffic Calming Definitios. ITE J. 1997, 67, 22–24. [Google Scholar]
- Ewing, R.H. Traffic Calming: State of the Practice (FHWA-RD-99-135); Institute of Transportation Engineers (ITE) & Federal Highway Administration (FHWA): Washington, DC, USA, 1999. [Google Scholar]
- Harvey, T. A Review of Current Traffic Calming Techniques; University of Leeds: Leeds, UK, 2013. [Google Scholar]
- Gonzalo-Orden, H.; Rojo, M.; Pérez-Acebo, H.; Linares, A. Traffic calming measures and their effect on the variation of speed. Transp. Res. Proc. 2016, 18, 349–356. [Google Scholar] [CrossRef]
- Kveladze, I.; Agerholm, N. Visual analysis of speed bumps using floating car dataset. J. Locat. Based Serv. 2018, 12, 119–139. [Google Scholar] [CrossRef]
- Ziolkowski, R. Speed management efficacy on national road—Early experiences of sectional speed system functioning in Podlaskie Voivodship. Transp. Probl. 2018, 13, 5–12. [Google Scholar] [CrossRef] [Green Version]
- Pérez-Sansalvador, J.C.; Lakouari, N.; García-Díaz, J. Pomares Hernández, S.E. The effect of speed humps in instantaneous traffic emissions. Appl. Sci. 2020, 10, 1592. [Google Scholar] [CrossRef] [Green Version]
- Torres, J.; Cloutier, M.S.; Bergeron, J.; St-Denis, A. They installed a speed bump: Children’s perception of traffic calming measures around elementary schools. Child. Geogr. 2020, 18, 477–789. [Google Scholar] [CrossRef]
- Pérez-Acebo, H.; Ziolkowski, R.; Linares-Unamunzaga, A.; Gonzalo-Orden, H. A series of vertical deflections, a promising calming measure: Analysis and Recommendations for Spacing. Appl. Sci. 2020, 10, 3368. [Google Scholar] [CrossRef]
- Jasiuniene, V.; Cygas, D. Analysis of older pedestrian accidents: A case study of Lithuania. Balt. J. Road Bridge Eng. 2020, 15, 147–160. [Google Scholar] [CrossRef]
- Petru, J.; Krivda, V. The transport of oversized cargoes from the perspective of sustainable transport infrastructure in cities. Sustainability 2021, 13, 5524. [Google Scholar] [CrossRef]
- Almoshaogeh, M.; Abdulrehman, R.; Haider, H.; Alharbi, F.; Jamal, A.; Alarifi, S.; Shafiquzzaman, M. Traffic accident risk assessment framework in Qassim, Saudi Arabia: Evaluating the impact of speed cameras. Appl. Sci. 2021, 11, 6682. [Google Scholar] [CrossRef]
- Szagala, P.; Olszewski, P.; Czajewski, W.; Dabkowski, P. Active signage of pedestrian crossing as a tool in road safety measurements. Sustainability 2021, 13, 9405. [Google Scholar] [CrossRef]
- Obregón-Biosca, S.A. Speed humps and speed tables: Externalities on vehicle speed, pollutant emissions and fuel consumption. Results Eng. 2020, 5, 100089. [Google Scholar] [CrossRef]
- Panis, L.I.; Broekx, D.; Becks, C. Impact of 30 km/h Zone Introduction on Vehicle Exhaust Emissions in Urban Areas. In Proceedings of the European Transport Conference (ETC), Strasbourg, France, 18 September 2006. [Google Scholar]
- Da Silva, F.N.; Custódio, R.A.L.; Martins, H. Low Emission Zone: Lisbon’s Experience. J. Traffic Logist. Eng. 2014, 2, 133–139. [Google Scholar] [CrossRef] [Green Version]
- De Vlieger, I.; De Keukeleere, D.; Kretzschmar, J. Environmental effects of driving behaviour and congestion related to passenger cars. Atmos. Environ. 2000, 34, 4649–4655. [Google Scholar] [CrossRef]
- Liimatainen, H. Measures for Energy Efficient and Low Emission Private Mobility. In Affordable and Clean Energy. Encyclopedia of the UN Sustainable Development Goals; Filho, W.L., Azul, A.M., Brandli, L., Salvia, A.L., Wall, T., Eds.; Springer International Publishing: Cham, Switzerland, 2020; pp. 1–12. [Google Scholar] [CrossRef]
- Tang, J.; McNabola, A.; Mistear, B. The potential impacts of different traffic management strategies on air pollution and public health for a more sustainable city: A modelling case study from Dublin, Ireland. Sustain. Cities Soc. 2020, 60, 102229. [Google Scholar] [CrossRef]
- Beckx, C.; Panis, L.I.; De Vlieger, I.; Wets, G. Influence of Gear-Changing Behavior on Fuel Use and Vehicular Exhaust Emissions. In Highway and Urban Environment. Alliance for Global Sustainability Bookseries; Morrison, G.M., Rauch, S., Eds.; Springer: Dordrecht, The Netherlands, 2007; Volume 12. [Google Scholar] [CrossRef] [Green Version]
- Wang, M.M.; Daamen, W.; Hoogendorrn, S.; Aren, B. Estimating acceleration, fuel consumption, and emissions from macroscopic traffic flow data. Transp. Res. Rec. 2011, 2260, 123–132. [Google Scholar] [CrossRef]
- Abdi, A.; Rad, H.B.; Azimi, E. Simulation and Analysis of Traffic Flow for Traffic Calming. Proc. Inst. Civ. Eng. Munic. Eng. 2017, 170, 16–28. [Google Scholar] [CrossRef]
- Mackie, A.M.; Ward, H.A.; Walker, R.T. Urban Safety Project, Part 3: Overall Evaluation of Area Wide Schemes; TRRL Report 263; Transport and Road Research Laboratory: Crowthorne, UK, 1990. [Google Scholar]
- Sołowczuk, A.; Kacprzak, D. Identification of the determinants of the effectiveness of on-road chicanes in transition zones to villages subject to a 70 km/h speed limit. Energies 2020, 13, 5244. [Google Scholar] [CrossRef]
- Solowczuk, A.B.; Kacprzak, D. Identification of the determinants of the effectiveness of on-road chicanes in the village transitition zones subject to a 50 km/h speed limit. Energies 2021, 14, 4002. [Google Scholar] [CrossRef]
- Urban Traffic Areas—Part 7—Speed Reducers; Vejdirektoratet-Vejregeludvalget: Copenhagen, Denmark, 1991.
- Traffic Calming Guidelines; Devon County Council Engineering & Planning Department: Devon, UK, 1992.
- Sayer, I.A.; Parry, D.I. Speed Control Using Chicanes—A Trial at TRL; TRL Project Report PR 102; Transport Research Laboratory: Crowthorne, UK, 1994. [Google Scholar]
- Sayer, I.A.; Parry, D.I.; Barker, J.K. Traffic Calming—An Assessment of Selected On-Road Chicane Schemes TRL Report 313; Transport Research Laboratory: Crowthorne, UK, 1998. [Google Scholar]
- Crevier, C. Les Aménagements en Modération de la Circulation, Étude et Applications; École de Technologie Supérieure Université Du Québec: Montréal, QC, Canada, 2007. [Google Scholar]
- Directives for the Design of Urban Roads. RASt 06 Road and Transportation Research Association; Working Group Highway Design FGSV: Köln, Germany, 2006. [Google Scholar]
- Safe Road Design Manual. Amendments to the WB Manual; Transport Rehabilitation Project ID PO75207; Consulting Services for Safe Road Design: Loan, Sweden, 2011. [Google Scholar]
- Hernández, E.; Abadía, X.; París, A.C. Criterios de Movilidad ZONAS 30; Fundación RACC: Barcelona, Spain, 2007. [Google Scholar]
- Guidelines for Traffic Calming; City of Sparks, Public Works; Traffic Division: Reno, NV, USA, 2007.
- Berger, W.J.; Linauer, M. Speed Reduction at City Limits by Using Raised Traffic Islands; Institut fuer Verkehrswesen (Institute for Transport Studies), Universitaet fuer Bodenkultur A-1190: Vienna, Austria, 1998. [Google Scholar]
- Prato, C.G.; Rasmussen, T.K.; Kaplan, S. Risk Factors Associated with Crash Severity on Low-Volume Rural Roads in Denmark. J. Transp. Saf. Secur. 2014, 6, 1–20. [Google Scholar] [CrossRef]
- Vahl, H.G.; Giskes, J. Traffic Calming through Integrated Urban Planning; Amarcande: Paris, France, 1990. [Google Scholar]
- Seneci, F.; Avesani, F.; Bonomi, I. Piani Particolareggiati per Mobilita’ Ciclabile e Pedonale e Sicurezza Stradale; Comune di Bassano del Grappa: Verona, Italy, 2012. [Google Scholar]
- Sadeghi-Bazargani, H.; Saadati, M. Speed Management Strategies; A Systematic Review. Bull. Emerg. Trauma 2016, 4, 126–133. [Google Scholar] [PubMed]
- González, D.D. Evaluación de las Zonas 30 en Europa y Definición de una Zona 30 Revisada. Ph.D. Thesis, Universitat Politècnica de Catalunya, Barcelona, Spain, 2012. [Google Scholar]
- Bahar, G.B. Guidelines for the Design and Application of Speed Humps; Institute of Transportation Engineers: Washington, DC, USA, 2007. [Google Scholar]
- Hallmark, S.L.; Peterson, E.; Fitzsimmons, E.; Hawkins, N.; Resler, J.; Welch, T. Evaluation of Gateway and Low-Cost Traffic-Calming Treatments for Major Routes in Small Rural Communities; Institute for Transportation, Iowa State University: Ames, IA, USA, 2007. [Google Scholar]
- Ellebjerg, L. Noise Control through Traffic Flow Measures—Effect and Benefits; Raport 151; Danish Road Institute: Hedehusene, Denmark, 2007. [Google Scholar]
- Daniels, S.; Martensen, H.; Schoeters, A.; Van de Berghe, W.; Papadimitrou, E.; Ziakopoulos, A.; Kaiser, S.; Aigner-Breuss, E.; Soteropoulos, A.; Wijnen, W.; et al. A systematic cost-benefit analysis of 29 road safety measures. Accid. Anal. Prev. 2019, 133, 105292. [Google Scholar] [CrossRef]
- Gonzalo-Orden, H.; Pérez-Acebo, H.; Unamunzagas, A.L.; Arce, M.R. Effects of traffic calming measures in different urban areas. Transp. Res. Proc. 2018, 33, 83–90. [Google Scholar] [CrossRef]
- Pérez-Acebo, H.; Otxoa-Muñoz, X.; Marquina-Llaguno, M.; Gonzalo-Orden, H. Analysis of the efficiency of traffic lights turning red in case of exceeding speed limit. Ing. Investig. 2021, 41, e86047. [Google Scholar] [CrossRef]
- Pérez-Acebo, H.; Otxoa-Muñoz, X.; Marquina-Llaguno, M.; Gonzalo-Orden, H. Evaluation of the Efficiency of Traffic Lights Turning Red in Case of Exceeding Speed Limit with Previous Panels Indicating the Speed. In Proceedings of the XIV Congreso de Ingenieria del Transporte (CIT 2021), University of Burgos, Burgos, Spain, 6–8 July 2021; pp. 2987–2999. [Google Scholar] [CrossRef]
- Hernández, H.; Alberdi, E.; Pérez-Acebo, H.; Álvarez, I.; García, M.J.; Eguía, E.; Fernández, K. Managing traffic data through clustering and radial basis functions. Sustainability 2021, 13, 2846. [Google Scholar] [CrossRef]
- Pérez-Acebo, H.; Gonzalo-Orden, H.; Findley, D.J.; Rojí, E. Modeling the international roughness index performance on semi-rigid pavements in single carriageway roads. Constr. Build. Mater. 2021, 272, 121665. [Google Scholar] [CrossRef]
- Diputación Foral de Bizkaia. Evolución del Tráfico en las Carreteras de Bizkaia—Trafikoaren Bilakaera Bizkaiko Errepideetan 2018; Departamento de Desarrollo Económico y Territorial: Bilbao, Spain, 2020. [Google Scholar]
- Diputación Foral de Álava. Estudio de Tráfico. 2018. Red de Carreteras del Territorio Histórico de Álava—2018. Trafiko Azterketa. Arabako Lurralde Historikoaren Errepide-Sarea; Departamento de Infraestructuras Viarias y Movilidad: Vitoria-Gasteiz, Spain, 2020. [Google Scholar]
- Ziółkowski, R. Speed Profile as a tool to estimate traffic calming measures efficiency. J. Civ. Eng. Archit. 2014, 8, 1585–1592. [Google Scholar]
- Ziółkowski, R. Influence of Traffic Calming Measures on Drivers’ Behaviour. In 9th International Conference Environmental Engineering: Selected Papers; Vilnius Gediminas Technical University Press Technika: Vilnius, Lithuania, 2014. [Google Scholar] [CrossRef] [Green Version]
- Ziółkowski, R. Effectiveness of Automatic Section Speed Control System Operating on National Roads in Poland. Promet-Traffic Transp. 2019, 31, 435–442. [Google Scholar] [CrossRef] [Green Version]


| Total Number of Road Crashes | Total Number of Fatalities | Fatalities Per Million | Pedestrian Fatalities | |||||||||
|---|---|---|---|---|---|---|---|---|---|---|---|---|
| Country | 2010 | 2019 | Change (%) | 2010 | 2019 | Change (%) | 2010 | 2019 | Change (%) | 2010 (% of the Total) | 2019 (% of the Total) | Change (%) |
| Poland | 38,832 | 30,288 | −22.0 | 3908 | 2909 | −25.6 | 103 | 77 | −25.2 | 1236 (31.6) | 793 (27.3) | −35.8 |
| Spain | 85,503 | 104,080 | +21.7 | 2479 | 1755 | −29.2 | 53 | 37 | −30.2 | 471 (19.0) | 381 (21.7) | −19.1 |
| Points | S1 Entrance | S2 Radar | S3 Crosswalk | N3 Crosswalk | N2 Radar | N1 Exit |
|---|---|---|---|---|---|---|
| Vm (km/h) | 64.5 | 48.6 | 54.4 | 51.7 | 49.5 | 64.6 |
| V85 (km/h) | 72 | 54 | 60 | 58 | 54 | 76 |
| Vmax (km/h) | 96 | 64 | 76 | 84 | 65 | 99 |
| Total number | 200 | 200 | 200 | 200 | 200 | 200 |
| Vehicles with v > 50 km/h (number) | 196 | 69 | 166 | 111 | 101 | 178 |
| Vehicles with v > 50 km/h (%) | 98 | 34.5 | 83 | 55.5 | 50.5 | 89 |
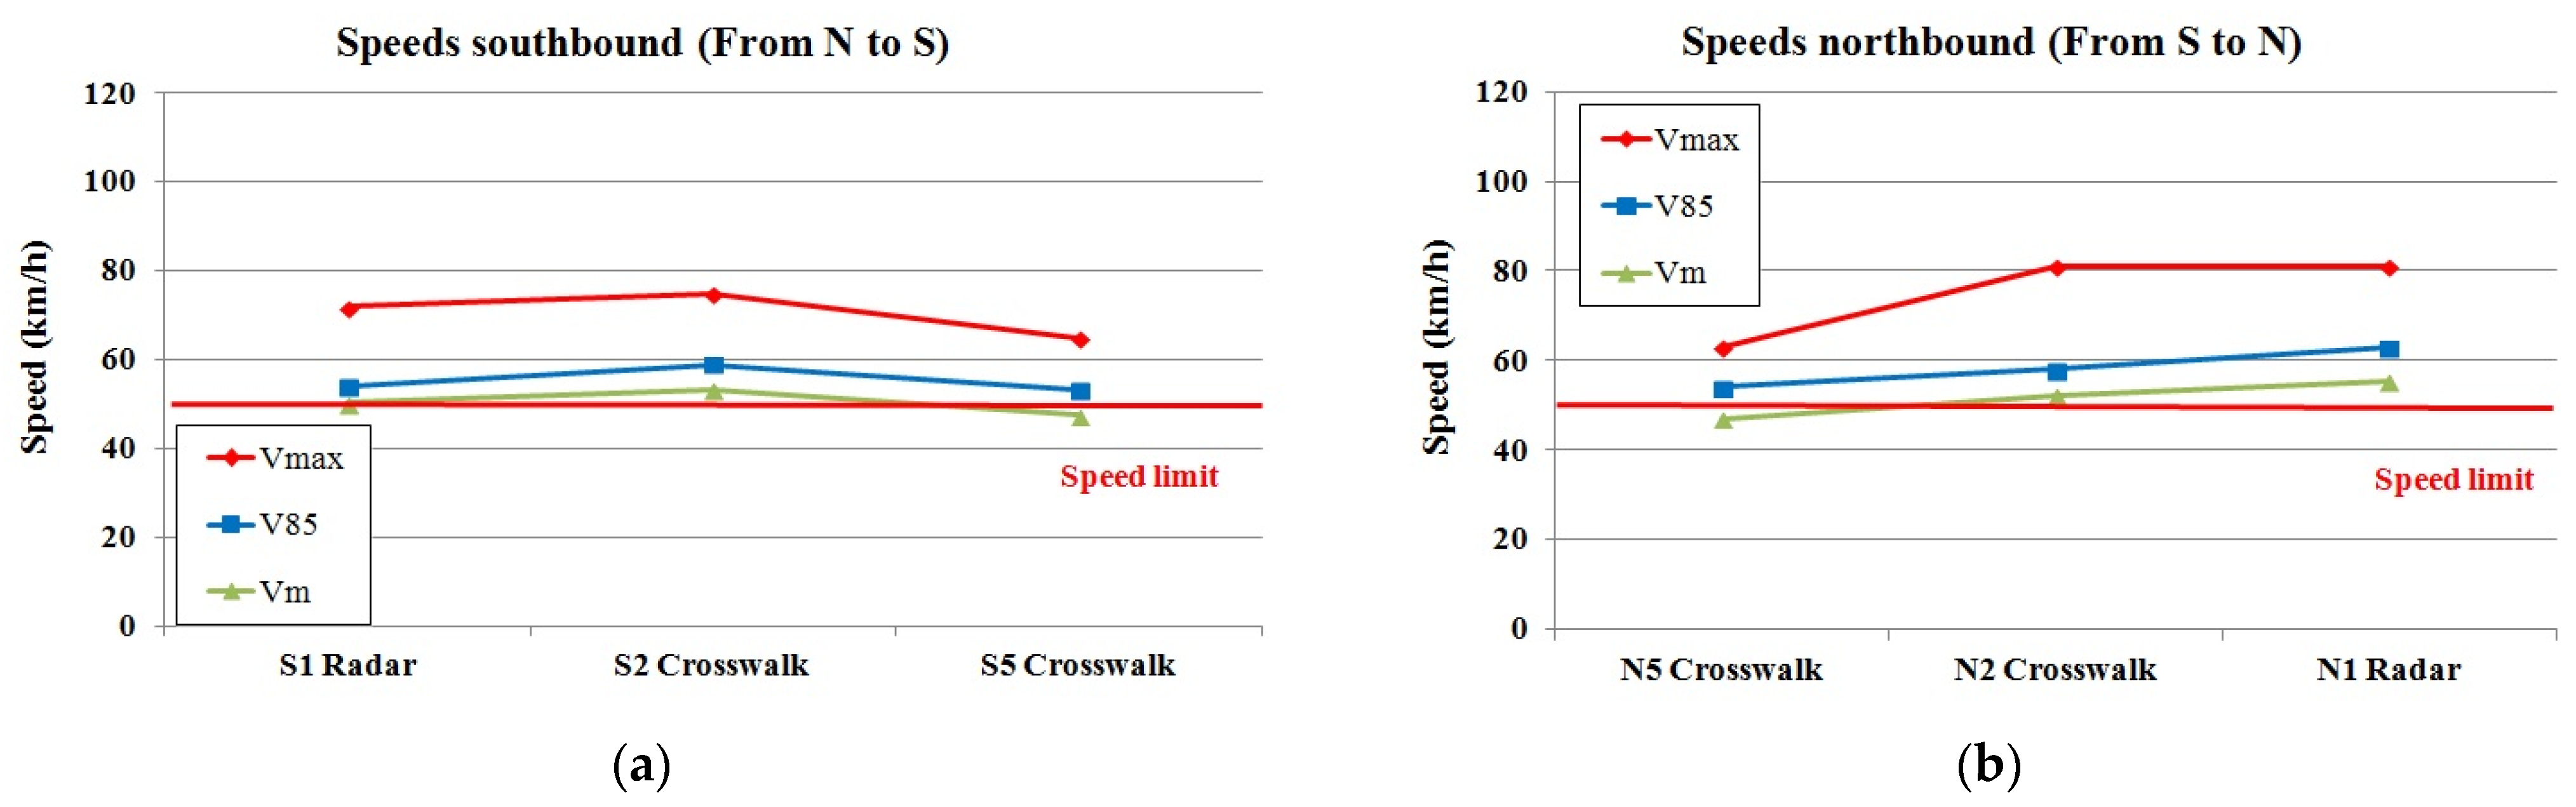
| Points | S1 Radar | S2 Crosswalk | S5 Crosswalk | N5 Crosswalk | N2 Crosswalk | N1 Radar |
|---|---|---|---|---|---|---|
| Vm (km/h) | 50.3 | 53.2 | 47.4 | 47.1 | 52.1 | 55.3 |
| V85 (km/h) | 54 | 59 | 53 | 54 | 58 | 63 |
| Vmax (km/h) | 72 | 75 | 65 | 63 | 81 | 81 |
| Total number | 200 | 200 | 200 | 200 | 200 | 200 |
| Vehicles with v > 50 km/h (number) | 102 | 128 | 58 | 78 | 125 | 143 |
| Vehicles with v > 50 km/h (%) | 51 | 64 | 29 | 39 | 62.5 | 71.5 |
| Points | N5 Crosswalk | N4 Radar | N3 Crosswalk | S3 Crosswalk | S5 Crosswalk |
|---|---|---|---|---|---|
| Vm (km/h) | 50.9 | 45.9 | 46.0 | 49.7 | 54.4 |
| V85 (km/h) | 59 | 51 | 54 | 59 | 63 |
| Vmax (km/h) | 124 | 64 | 77 | 88 | 108 |
| Total number | 4047 | 794 | 4685 | 4615 | 4551 |
| Vehicles with v > 50 km/h (number) | 2187 | 141 | 1485 | 2332 | 3290 |
| Vehicles with v > 50 km/h (%) | 54.0 | 17.8 | 31.7 | 50.5 | 72.3 |
| Points | S2 Panel | S3 Crosswalk + Traffic Lights | S4 Crosswalk | N6 Panel | N4 Crosswalk | N3 Crosswalk + Traffic Lights |
|---|---|---|---|---|---|---|
| Vm (km/h) | 68.6 | 48.5 | 43 | 63.9 | 46.7 | 52.1 |
| V85 (km/h) | 77 | 61 | 51 | 79 | 56 | 65 |
| Vmax (km/h) | 112 | 112 | 92 | 117 | 91 | 113 |
| Total number | 200 | 1729 | 1483 | 211 | 1723 | 1951 |
| Vehicles with v > 50 km/h (number) | 196 | 690 | 255 | 168 | 539 | 1083 |
| Vehicles with v > 50 km/h (%) | 98 | 39.9 | 17.2 | 79.6 | 31.3 | 55.5 |
Publisher’s Note: MDPI stays neutral with regard to jurisdictional claims in published maps and institutional affiliations. |
© 2021 by the authors. Licensee MDPI, Basel, Switzerland. This article is an open access article distributed under the terms and conditions of the Creative Commons Attribution (CC BY) license (https://creativecommons.org/licenses/by/4.0/).
Share and Cite
Pérez-Acebo, H.; Ziolkowski, R.; Gonzalo-Orden, H. Evaluation of the Radar Speed Cameras and Panels Indicating the Vehicles’ Speed as Traffic Calming Measures (TCM) in Short Length Urban Areas Located along Rural Roads. Energies 2021, 14, 8146. https://0-doi-org.brum.beds.ac.uk/10.3390/en14238146
Pérez-Acebo H, Ziolkowski R, Gonzalo-Orden H. Evaluation of the Radar Speed Cameras and Panels Indicating the Vehicles’ Speed as Traffic Calming Measures (TCM) in Short Length Urban Areas Located along Rural Roads. Energies. 2021; 14(23):8146. https://0-doi-org.brum.beds.ac.uk/10.3390/en14238146
Chicago/Turabian StylePérez-Acebo, Heriberto, Robert Ziolkowski, and Hernán Gonzalo-Orden. 2021. "Evaluation of the Radar Speed Cameras and Panels Indicating the Vehicles’ Speed as Traffic Calming Measures (TCM) in Short Length Urban Areas Located along Rural Roads" Energies 14, no. 23: 8146. https://0-doi-org.brum.beds.ac.uk/10.3390/en14238146