
Mapping Bio-CO2 and Wind Resources for Decarbonized Steel, E-Methanol and District Heat Production in the Bothnian Bay


LUT School of Energy Systems, Lappeenranta-Lahti University of Technology LUT, 53851 Lappeenranta, Finland
*
Author to whom correspondence should be addressed.
Energies 2021, 14(24), 8518; https://0-doi-org.brum.beds.ac.uk/10.3390/en14248518
Submission received: 30 November 2021
/
Revised: 10 December 2021
/
Accepted: 15 December 2021
/
Published: 17 December 2021
(This article belongs to the Special Issue Progress in Power-to-Gas Energy Systems)
Abstract
:Hydrogen is a versatile feedstock for various chemical and industrial processes, as well as an energy carrier. Dedicated hydrogen infrastructure is envisioned to conceptualize in hydrogen valleys, which link together the suppliers and consumers of hydrogen, heat, oxygen, and electricity. One potential hydrogen valley is the Bay of Bothnia, located in the northern part of the Baltic Sea between Finland and Sweden. The region is characterized as having excellent wind power potential, a strong forest cluster with numerous pulp and paper mills, and significant iron ore and steel production. The study investigates the hydrogen-related opportunities in the region, focusing on infrastructural requirements, flexibility, and co-operation of different sectors. The study found that local wind power capacity is rapidly increasing and will eventually enable the decarbonization of the steel sector in the area, along with moderate Power-to-X implementation. In such case, the heat obtained as a by-product from the electrolysis of hydrogen would greatly exceed the combined district heat demand of the major cities in the area. To completely fulfil its district heat demand, the city of Oulu was simulated to require 0.5–1.2 GW of electrolyser capacity, supported by heat pumps and optionally with heat storages.
1. Introduction
Industrial clusters are locations where various companies perform their individual activities, while also co-operating and sharing risks and resources between each other, thus increasing the operation efficiency and profitability. Decarbonization of these industrial clusters leads to a host of new technological challenges, but also a broad field of opportunities for renewable power generation, widespread use of hydrogen (H2), Power-to-X products, intelligent heating, and electrification.
Hydrogen initiatives have recently been gathering interest. The global hydrogen valley platform currently lists 36 distinct hydrogen valley projects [1], including the Basque Hydrogen Corridor (BH2C) project that aims to invest 2.9 BEUR between 2020 and 2030 to create a hydrogen ecosystem in the Basque Country in Spain [2]. Another 1 BEUR H2 investment project is envisioned for the Zuid-Holland/Rotterdam region in the Netherlands. The Rotterdam port has also been associated with carbon capture use and storage (CCUS) projects [3]. Yet, another Netherlandic project, NortH2, aims to produce 4 GW of offshore wind power by 2030 that would be used for producing green hydrogen, and upscaling that to 10 GW by 2040 [4].
The Bay of Bothnia is another interesting industrial cluster location with a strong presence from the pulp and paper industry and steel, cement, and traditional power and heat production. The majority of industrial sectors and population centres from the region are concentrated on the coastal regions as illustrated in Figure 1. The initial motivation for this research was inspired by the interest of local industrial actors in the area, which is also reflected in the ongoing activities.
The available volume of biogenic CO2 emissions from the pulp and paper sector sets the region apart from other similar industrial clusters. Thus, the application of BECCUS (bioenergy with carbon capture and utilization/storage) would offer tremendous opportunities for decreasing emission levels. Moreover, pulp mills also consume a variety of chemicals, which could be linked with Power-to-X. With the steel industry working as another driver for Power-to-X implementation, the Bothnian Bay could have a major role in pioneering upcoming technologies and cross-industry cooperation.
Recently, the BotH2nia initiative was set in motion, facilitating communication and cooperation with different actors and projects in the area [5]. Additionally, the current status and plans related to hydrogen activities were mapped in a questionnaire study which included 37 companies from the Bothnian Bay area [6]. According to the study, hydrogen adoption is still considered to be in a very early stage, although some first concrete actions are planned for demonstration plants related to steel production and synthetic fuel manufacturing. The availability of hydrogen and its high cost is considered to be a major obstacle according to potential users.
The cost gap between fossil and electrolytic hydrogen could partly be narrowed by a reduction in electrolyser capital expenditures, which is expected to occur in phases, with increased deployment of the technology and more efficient manufacturing techniques. Still, low-cost electricity remains an essential ingredient [7]. During the last decade, solar and wind power generation costs have decreased to a level where they can outperform fossil generation [8]. In the Bothnian Bay region, low-cost wind power could become the dominant power production method in a relatively short timeframe.
The cost-competitiveness of electrolytic hydrogen can be improved even further by efficiently utilizing the by-products of electrolysers [9,10]. For instance, the integration of electrolysis with low-grade heat utilization has been demonstrated in small pilot projects in Germany and Denmark [11]. On a more theoretical scale, Böhm et al. [12] analysed the sector coupling potential of hydrogen generation and district heating by performing a survey on the technological status and development of electrolysers and district heat systems. Additionally, the study summarized the findings from an expert survey into a SWOT (strengths, weaknesses, opportunities and threats) analysis. One conclusion of the paper was that there are many potential synergies with coupling district heat and hydrogen generation, but the application of electrolysers as a heat source is not typically taken into account by the district heat industry. The study also highlighted the need for developing effective planning tools for mapping the demand for hydrogen, heat, and oxygen–which coincides exceptionally well with the topic of this work.
A related but different heat integration concept is to utilize high-temperature electrolysers (i.e., solid oxide electrolyser cells) that have been proposed to be linked with an external heat source, which provides heat at 700–900 °C and thus increases the efficiency of the electrolyser [13,14,15].
For synthesis products beyond hydrogen, Ikäheimo et al. [16] performed a simulation of the power and district heat system of Northern European countries, concluding that excess heat from power-to-ammonia systems could significantly contribute to district heat generation. Residual heat from electrolysers was not investigated, although its potential in future low-temperature district heat networks (i.e., 4th generation networks [17]) was acknowledged. Regional imbalance was also noted to exist between the district heat demand and potential locations of ammonia production plants. In other studies, the operation principle and optimal application of hydrogen and CO2 storages have also been found to be important for profitability of Power-to-X [18,19].
Electrolysers also produce oxygen as a by-product, which is widely used in the pulp and paper industry [20] and in healthcare applications [21]. Saxe and Alvfors [22] already evaluated the link between pulp and paper mills and electrolysers back in 2007 and concluded that oxygen utilization could potentially have an even bigger effect for profitability than mere heat utilization.
GIS (geographic information system) framework has been widely used before in energy-related research topics [23], such as mapping and identification of district heat grid expansion sites [24,25]. Further examples include utilization of CO2 emission data to identify industrial excess heat sources [26]. Welder et al. [27] combined GIS tools with mixed integer linear programming to optimize hydrogen-based energy infrastructure containing cavern storages, wind turbines and hydrogen pipelines. Different implementation strategies for CO2-related transport infrastructure have also been studied [28].
Although the potential for coupling hydrogen production with district heat has been acknowledged in previous studies, few have delved into energy balance investigations and regional matching of electricity production capacity, CO2 resources, and hydrogen demand. Intelligent placement of electrolysers could therefore have an impact on the cost-efficiency of hydrogen production. Pilot projects and demonstrations in promising sites are an essential element of commercializing sustainable hydrogen production.
The aim of the work is to perform a regional decarbonization assessment on the Bothnian Bay area, highlighting the key industries at the core of the transition. Specifically, the focus is on the conceptualization of hydrogen supply and demand, as well as its potential links to the heating sector. The study includes two detail levels: a high-level overview of the area, which focuses on electricity generation and its use, and a more detailed region-specific study concentrating on the heat sector. Three configurations are presented for integrating electrolyser systems within the existing energy infrastructure. This study illustrates the massive scale of transition that is about to take place in wind power generation and local consumption of electricity for the decarbonization of steel and implementation of Power-to-X. Proper understanding of the links and scales between these resources, demands, and potentials is a vital first step for their implementation. Moreover, the methodology developed for this analysis will also serve in future studies in other regions.
2. Materials and Methods
This study’s methodology combines various databases and statistics, GIS tools, and computer simulations. The details are outlined in the following sections, which have been categorized into hydrogen-related aspects, power generation, and heat systems.
2.1. Hydrogen Production and Use
In this work, the electricity demand of electrolysis is assumed to be 53 MWhel per ton of hydrogen, which corresponds to about 62% efficiency when defined for lower heating value of hydrogen. Two primary uses for hydrogen are included in the analysis: steel industry and Power-to-X. Although Power-to-X could be used to produce a variety of different products, this work uses a simplified approach and considers e-methanol as the only final product. Methanol (MeOH) could be used directly as a fuel, but also as a feedstock in numerous products, such as olefins, resins, or gasoline [29].
2.1.1. Steel Industry
Decarbonization of steel manufacturing can be achieved with the commercial HYBRIT-process, which utilizes direct hydrogen reduction instead of coal as the reducing agent. Total electricity demand of the process is estimated to be 3.5 MWh for one tonne of steel, with hydrogen production being responsible for about 75% of the total demand [30]. Two alternative values are presented for the total electricity demand of steel. Low demand is associated with converting existing steel mills into decarbonized processes, whereas the high demand scenario assumes that all iron ore obtained from the Kiruna mine in Sweden is processed to sponge iron.
Currently, the studied region has active steel mills in Tornio, Luleå, and Raahe. Additionally, a new steel mill is being planned for Boden. The Tornio mill uses an electric arc furnace and requires about 3.5 TWh of electricity annually [31], whereas the other existing mills are traditional blast furnace mills. Conversion of the Raahe mill to the HYBRIT process is expected to require about 9 TWh of electricity, and Luleå about 8 TWh, based on their respective crude steel production capacities [32]. Together, the low demand scenario amounts to about 21 TWh of annual electricity demand, consisting of the demand of existing facilities.
The regional electricity demand would be much higher if all of the iron ore mined in Kiruna were to be refined into sponge iron. The Swedish government-owned mining company LKAB has estimated that 55 TWh of renewable electricity would be required annually once the six planned sponge iron refining sites are online in 2045. Existing iron ore pelletization capacity would be dismantled in phase with the deployment of the new sponge iron processing facilities, the first of which is scheduled to be in operation already in 2030 [33,34]. The planned actions would radically increase the electricity consumption of the region, requiring significant investments in power production and transmission capacity.
2.1.2. Power-to-X and Carbon Sources
Power-to-X can produce fuels, products, and chemicals. Thus, the decarbonization of aviation, road transport, and numerous manufacturing sectors could be possible by using Power-to-X. One strong product candidate for Power-to-X is methanol, which is currently used widely in chemical manufacturing.
Two estimates are presented for the possible extent of e-methanol production in this work, both of which are based on the availability of CO2 from industrial point sources the region. The available CO2 quantities from the region are identified from the European pollutant release and transfer register [35], which has been complemented by manual additions based on recent news and company press releases. Figure 2 shows the projected CO2 emissions from various sectors in the region. Facilities close to each other have been aggregated into a single symbol in the illustration.
The viable sectors for CO2 capture were assumed to be the pulp and paper sector, and the cement industry. These sectors were considered to be relatively stable in the foreseeable future, preserving their current CO2 volumes. The power sector, which also includes combined heat and power, was excluded as a potential CO2 source because it was assumed to have lower full load utilization hours compared to industrial units, thus being less desirable for CO2 capture.
The high estimate for e-methanol potential is simply based on capturing all current emissions from the accepted sectors, whereas the lower potential assumes that only about 35% of the available emissions would be captured. For reference, the low e-methanol potential approximately corresponds to capturing the flue gas emissions from the largest pulp mill in the area. Alternatively, the same CO2 quantity could also be obtained from about four mid-sized pulp mills from the region. By contrast, the high estimate for methanol production is unlikely to be realized completely, as it would require equipping all local pulp and paper sites with CO2 capture devices. Furthermore, the emissions from pulp mills are typically divided into different process sections, e.g., the power boiler, bark recovery boiler, and lime kiln.
This work uses stoichiometric ratios to estimate the product yield and required inputs for e-methanol production. The methanol synthesis input mass ratio of hydrogen to carbon dioxide is assumed to be 0.137, and methanol yield is estimated as 0.728 kgMeOH/kgCO2. CO2 capture is used to obtain carbon for the methanol synthesis with an assumed CO2 capture efficiency of 90%. The process requires heat, about 3.0–6.5 MJ/kgCO2 [36,37]. In this paper, an optimistic value of 3.6 MJ/kgCO2 is used. Auxiliary electricity consumption for CO2 capture is assumed to be 250 kWh/tCO2 [37]. Methanol synthesis is assumed to generate 430 kWh/tMeOH of additional heat, while also requiring 170 kWh/tMeOH electricity input [38,39].
2.2. Wind Power Generation Potential
In practice, the availability of electricity is another likely bottleneck for hydrogen and e-methanol production. For this reason, the regional potential of wind energy is identified by investigating the declared wind park power capacities from the Finnish [40] and the Swedish [41] perspective. Only onshore wind projects were included in the investigation, although the area has potential for offshore deployment.
The wind production data is geographically tracked in the most accurate GADM (Database of Global Administrative Areas) level available, corresponding to municipal accuracy for Sweden (GADM 2) and Finland (GADM 4). The municipalities in the studied region were allocated into twelve different groups, as illustrated in Figure 3.
The annual production of wind turbines is estimated by assuming 2600 annual full load hours, equivalent to a capacity factor of 29.7%. In reality, both the local wind conditions and the specifications of the wind turbine affect the capacity factor.
This work presents the wind data projections in three different time frames:
- Current active turbines that have already been commissioned;
- Short-term capacity additions (occurring roughly during the next 5 years);
- Long-term capacity (coming online over the next 5–15 years).
The original wind power data from Finland is classified into six different groups: already commissioned wind turbines (class 6), but also projections about future wind power capacity based on turbines that are under construction, permitted sites, sites currently in various permitting and planning phases (classes 1–5), and identified projects that are in the early development phase (class 0). In this work, class 6 was classified into current capacity, classes 1–5 to short-term capacity, and class 6 into long-term capacity.
For Sweden, the original data is similarly divided into different classes. Commissioned turbines were included in current capacity, whereas short-term capacity included projects which were classified either as already permitted and approved, or as having an ongoing permitting process. The long-term capacity was assumed to include the class which was defined as “postponed or cancelled”. Although not all postponed sites are guaranteed to realize exactly as envisioned, the data serves as an initial estimate for the long-term capacity. The data for Sweden also contains projects which have been denied a permit, or which have an ongoing appeal process, but these were not included in the analysis of this work.
The long-term capacity will likely also include sites which have not yet been identified. Furthermore, the production of existing sites could also be increased by adding new turbines or upgrading them. Thus, the long-term capacity was increased by extrapolating the cumulative capacity of existing and short-term cases. The amount of extrapolation was estimated using a parameter termed in this work as the wind power density (WPD). It is calculated by dividing the installed wind power capacity in kilowatts and the total area in square kilometres. Denmark can be calculated to have a WPD value of about 144 kW/km2, and Germany reaches 175 kW/km2. A recent report on the Finnish energy system presents a maximum wind power potential of 54 GW in Finland [42], corresponding to a WPD value of 160 kW/km2. The long-term scenario was assumed to have a conservative WPD of 100 kW/km2 for the whole Bothnian Bay region. The long-term capacity of all nodes was increased stepwise by a fixed amount until one of the two conditions is fulfilled:
- The wind power density of an individual node exceeds 150 kW/km2, after which the node is excluded from further capacity additions;
- The total wind power generation in the region reaches 39 GW, which corresponds to average WPD of 100 kW/km2 for the whole studied domain.
Overall, the extrapolation procedure was responsible for about 87% of the additional capacity, with the remaining 13% coming from data of already identified and potential wind projects. The resulting capacity estimates are highly dependent on the two WPD limits assumed. The WPD value of node 7 already exceeds 500 in the short-term case, so the local limit of WPD could potentially be adjusted much higher than what was assumed in this work. The current methodology does not account for differences in wind conditions between the regions, while also neglecting other land use such as farming, housing, recreational use, or reindeer herding. The methodology also favours regions which are less saturated due to the relatively low WPD limit. These aspects could lead to significant deviations between the predicted and actual capacity distributions. A more realistic estimate would require customization of local WPD limits for each region individually. Additionally, the estimate for the total wind power capacity in the region should also be verified by alternative methods.
2.3. Heat Supply and Demand
The Bothnian Bay area is located partially inside the Artic Circle, so considerable heating is required during the winter, while there is less demand during the summer. As there is significant variation in heat demand over the year, it is investigated how the potential heat production by electrolysis matches to the district heat demand in the area. Methanol synthesis also results in the generation of additional heat, while CO2 capture systems require heat. These systems are studied on an annual level, but not with the hourly accuracy as with electrolysis heat.
As in [43], it is assumed that all losses of electrolysis are converted to heat, and that the electrolyser is cooled with a water stream which reaches an outlet temperature of 50 °C. This residual heat is then primed to higher temperatures by using a heat pump.
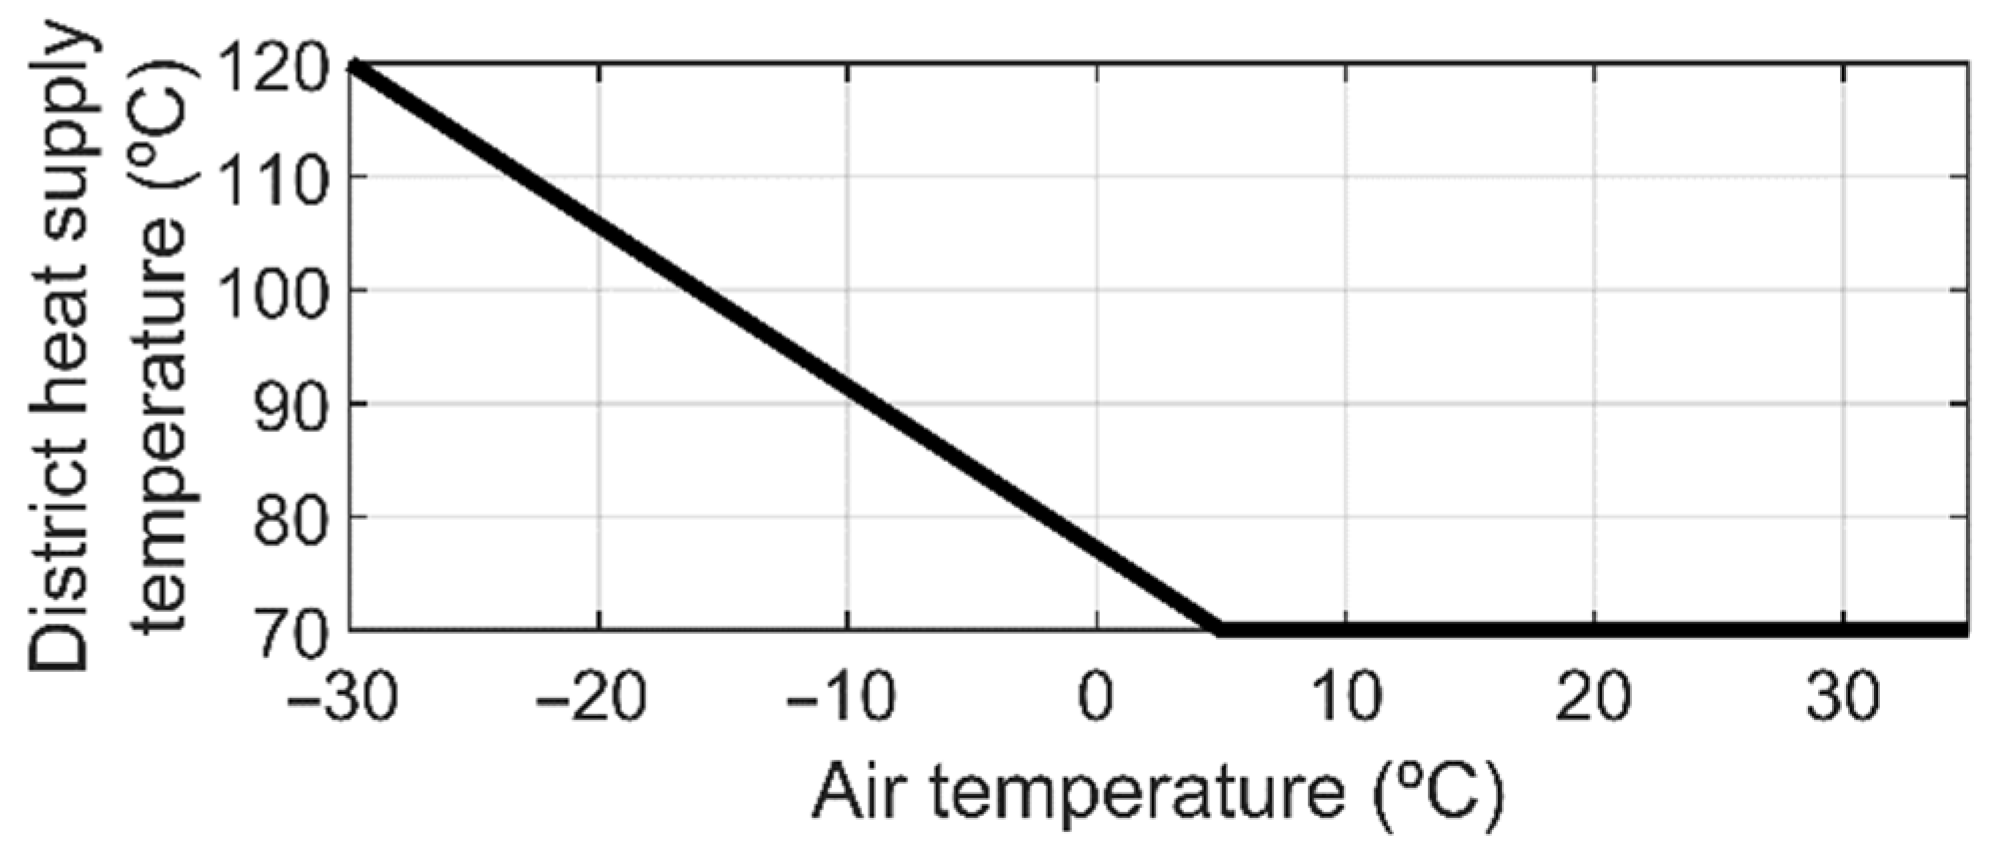
As an example configuration, district heat demand of the city of Oulu in Finland is studied. Oulu is one of the most populous cities in the region, which makes it highly interesting for district heat coupling with electrolysers. The overall annual heat demand, 1541 GWh, is obtained from the data of the local district heat companies [44]. The supply temperature of district heat is obtained from [45] as a function ambient temperature, as presented in Figure 4.
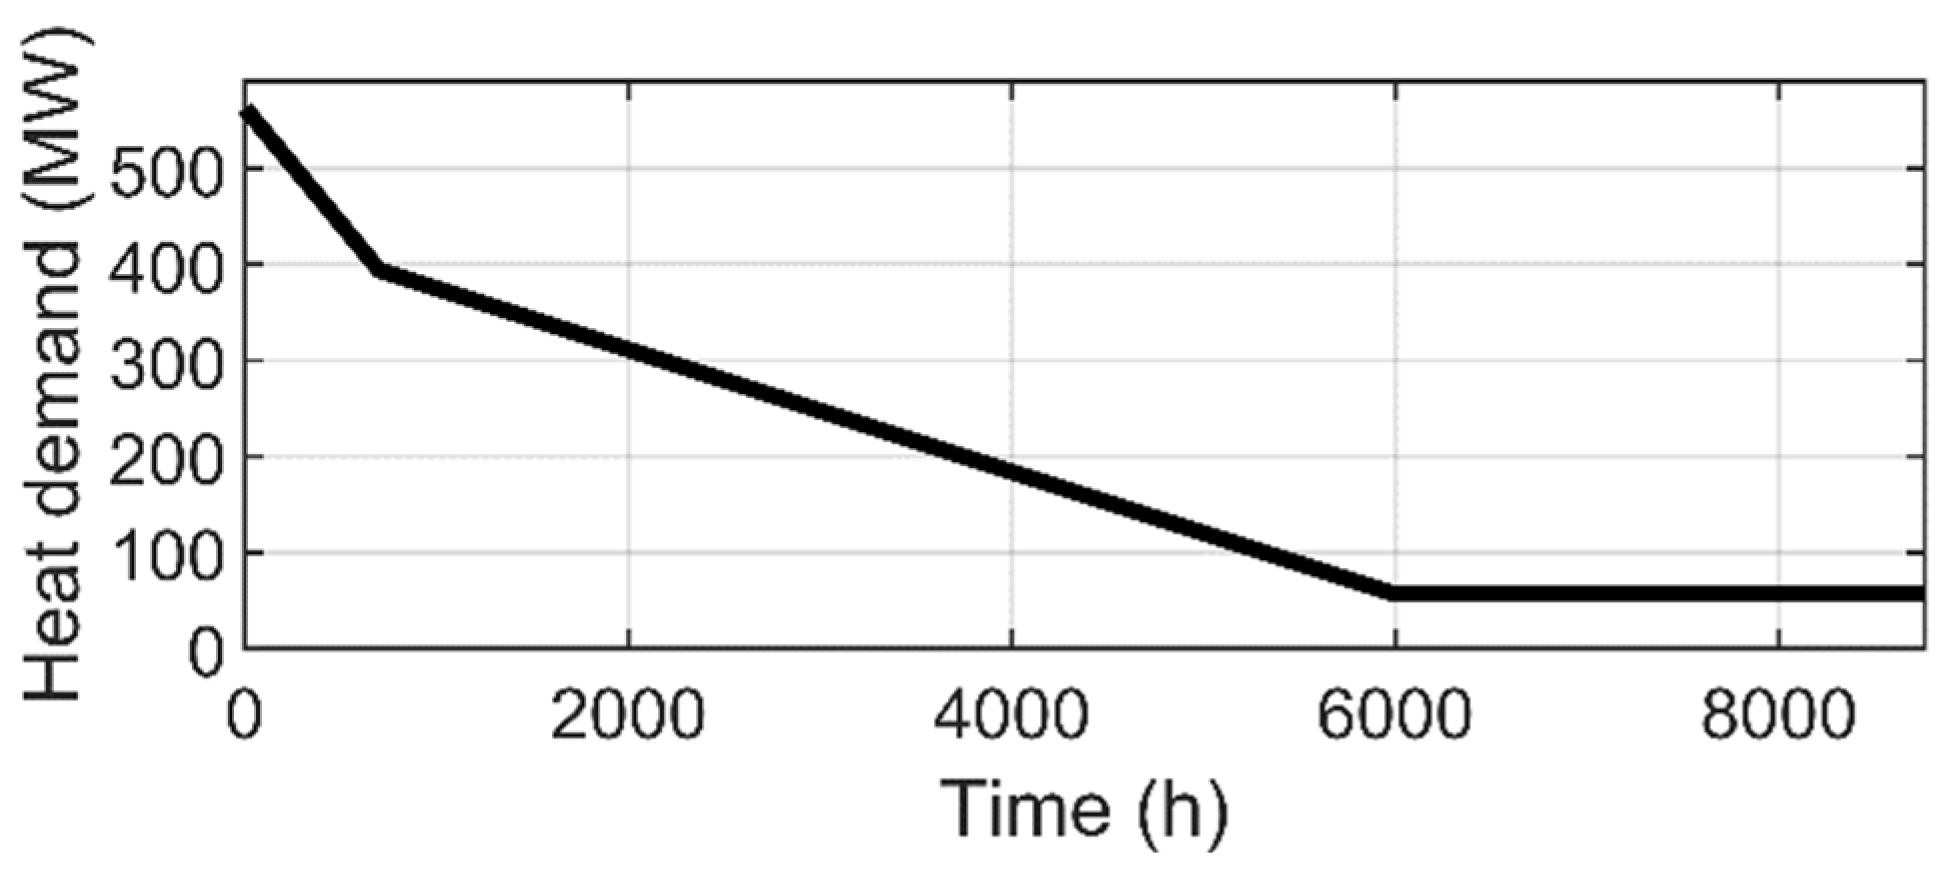
The required heat power is also assumed to be a function of ambient temperature. The duration curve in Figure 5 is simplified from [46], and it is distributed on an hourly basis by the ambient temperature. The basic form of the duration curve is fixed by setting the 6000-h heat power to 10% of the maximum, the 700 h mark to 70%, and assuming linear increase between the fixed points. The peak power is then iteratively adjusted to match the annual heat energy demand.
Waste heat from electrolysis is used as a heat source for heat pump, which produces district heat. The coefficient of performance (COP) of the heat pump is defined by first calculating the idealized Carnot heat pump COP () from the condensing (Tcond) and evaporation (Tevap) temperatures of the heat pump
which is then multiplied by a constant efficiency factor η to obtain the real COP
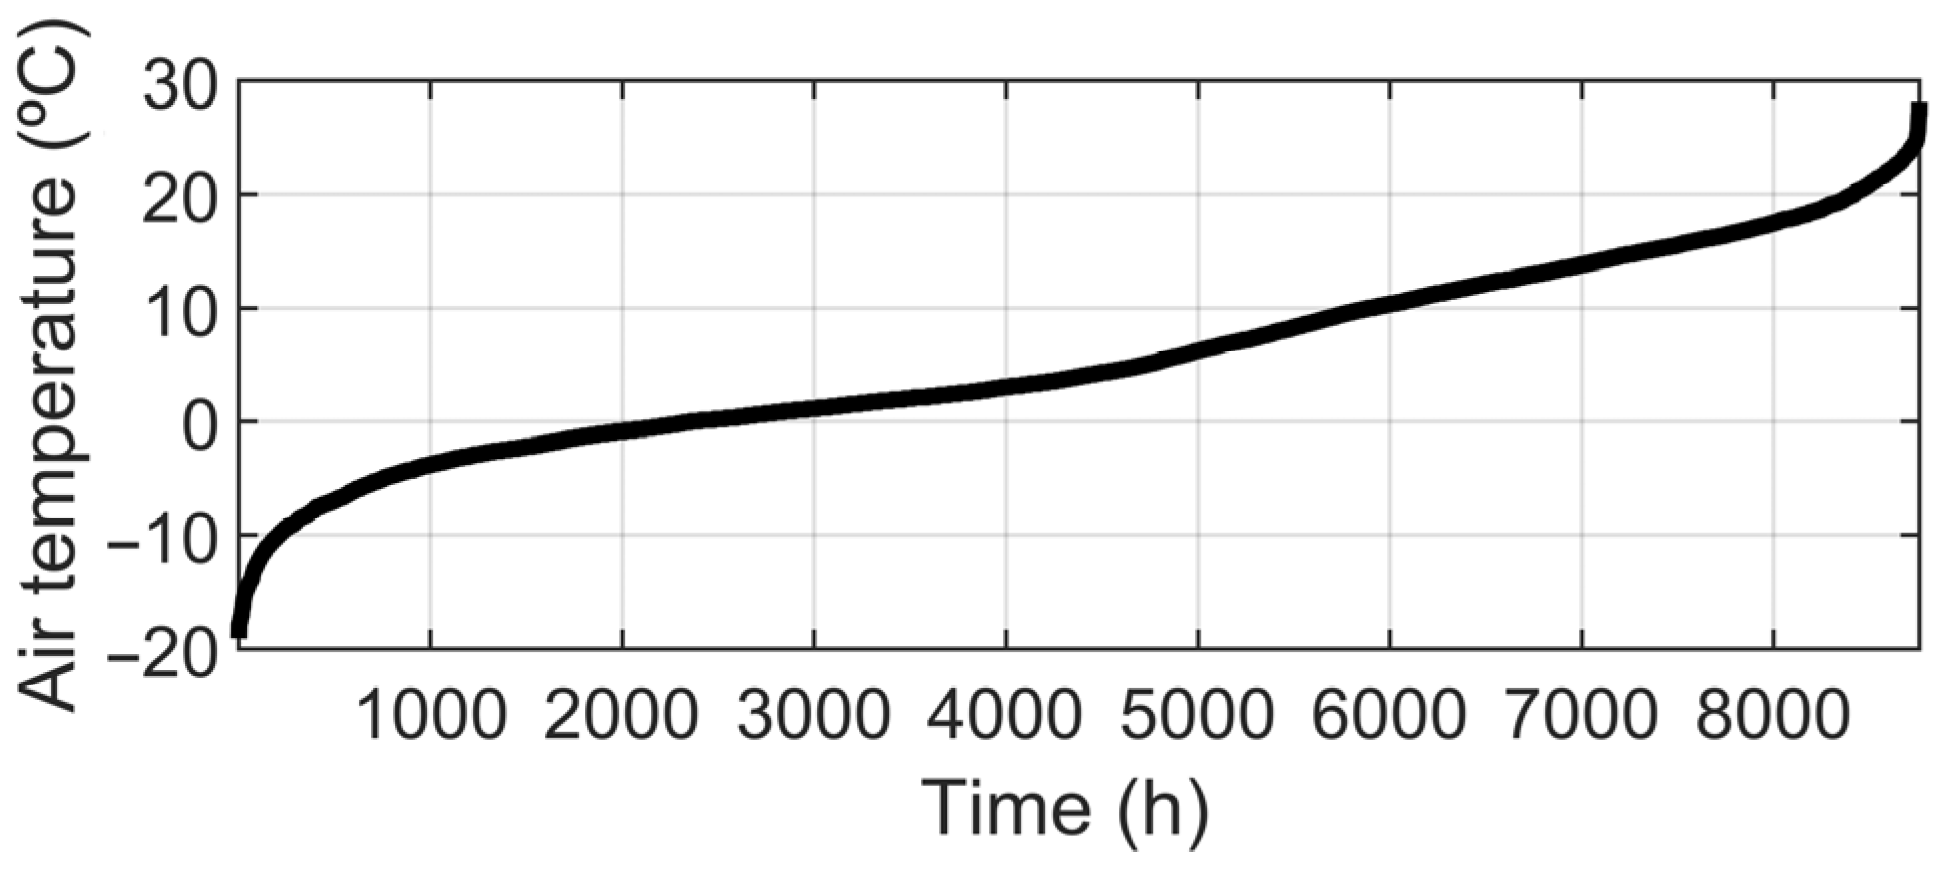
This simplified approach is chosen as detailed mass flow rate and inlet temperature for return flow of the district heat are not available, but the model is still capable to consider variations of ambient and district heat temperatures. The duration curve of air temperature is presented in Figure 6. An efficiency factor (η) of 50% is used, as it has been shown accessible in large scale [47].
As the heat demand varies heavily in time, there might be a demand for thermal energy storage (TES) to balance heat production from the electrolyser and heat pump, depending on the system configuration. TES is modelled with charge and discharge efficiencies of 90%, and an hourly heat loss that is proportional to stored energy. The value of the heat loss, 0.005%, is selected such that the annual efficiency of TES is approximately 80%, which is comparable to values in the review by [49]. The required TES capacity is obtained as a result of the simulation.
Although the Oulu region was in focus in this work, an estimate for the total district heat demand for all the major cities is also obtained by using the per capita district heat demand from Oulu as a benchmark (7.4 MWh/capita). The population centres that were included in the analysis are presented Figure 7.
System Configurations
Several scenarios are used to distinguish the different possible heating system design principles.
- ElVar: Electrolyser and heat pump capacity at Oulu is matched with peak thermal power demand, so that district heat demand can be fulfilled solely with an electrolyser and a heat pump. Electrolyser operation is adjusted down during low heat demand. TES is not needed.
- ElFix: Annual heat demand is to be met by electrolyser and a TES. The electrolyser operates at its nominal power at all times, and excess heat is delivered to TES. During high heat demand, TES is discharged.
- ElWind: Annual heat demand is to be met by electrolyser and a TES. The electrolyser runs on wind power, and excess heat is delivered to TES.
This is not an exhaustive list covering all options. Rather, it illustrates some of the ultimate options for how to operate the electrolyser and provide heat, and also the upper and lower end of required TES. A block diagram of the simulation procedure is presented in Figure 8.
3. Results
The study first evaluates the renewable electricity generation potential in the region, which is then reflected against the demand side. Lastly, the heat-related investigations are presented.
3.1. Wind Power Generation Potential
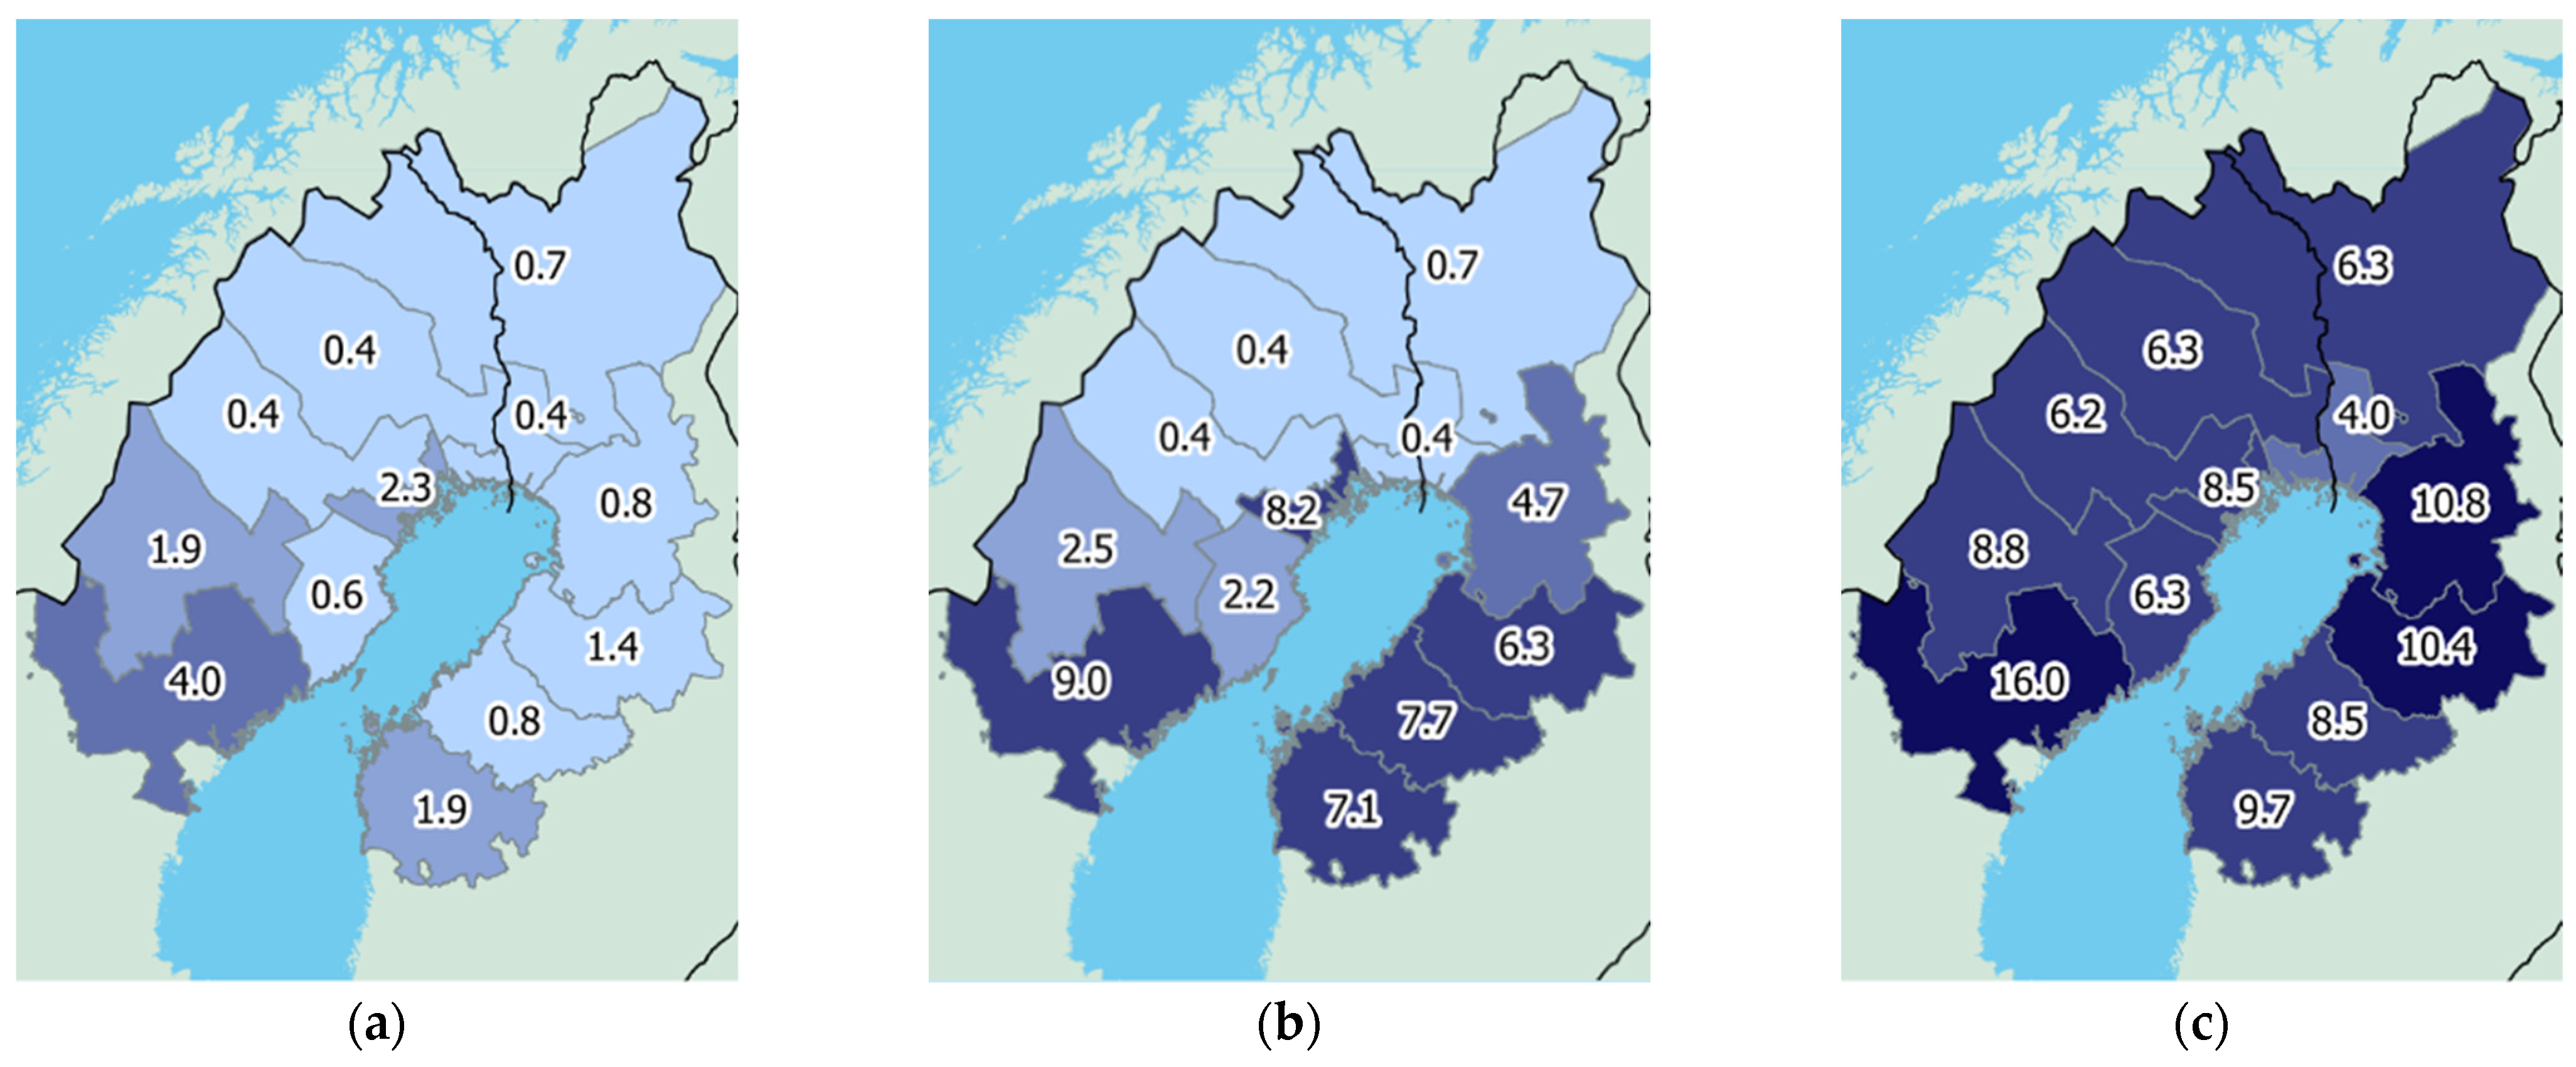
The amount of renewable electricity available in the region is related to the maximum potential for Power-to-X. Estimation of the total cumulative installed capacity and annual production is given in Table 1, whereas the regional distribution of the capacity is shown in Figure 9. The estimated growth in wind power potential is vast, with capacity tripling in the short term and sextupling in the long term. From a statistical perspective, the long-term capacity could be even higher, but practical reasons could also limit the potential to lower amounts.
3.2. Electricity Demand Development
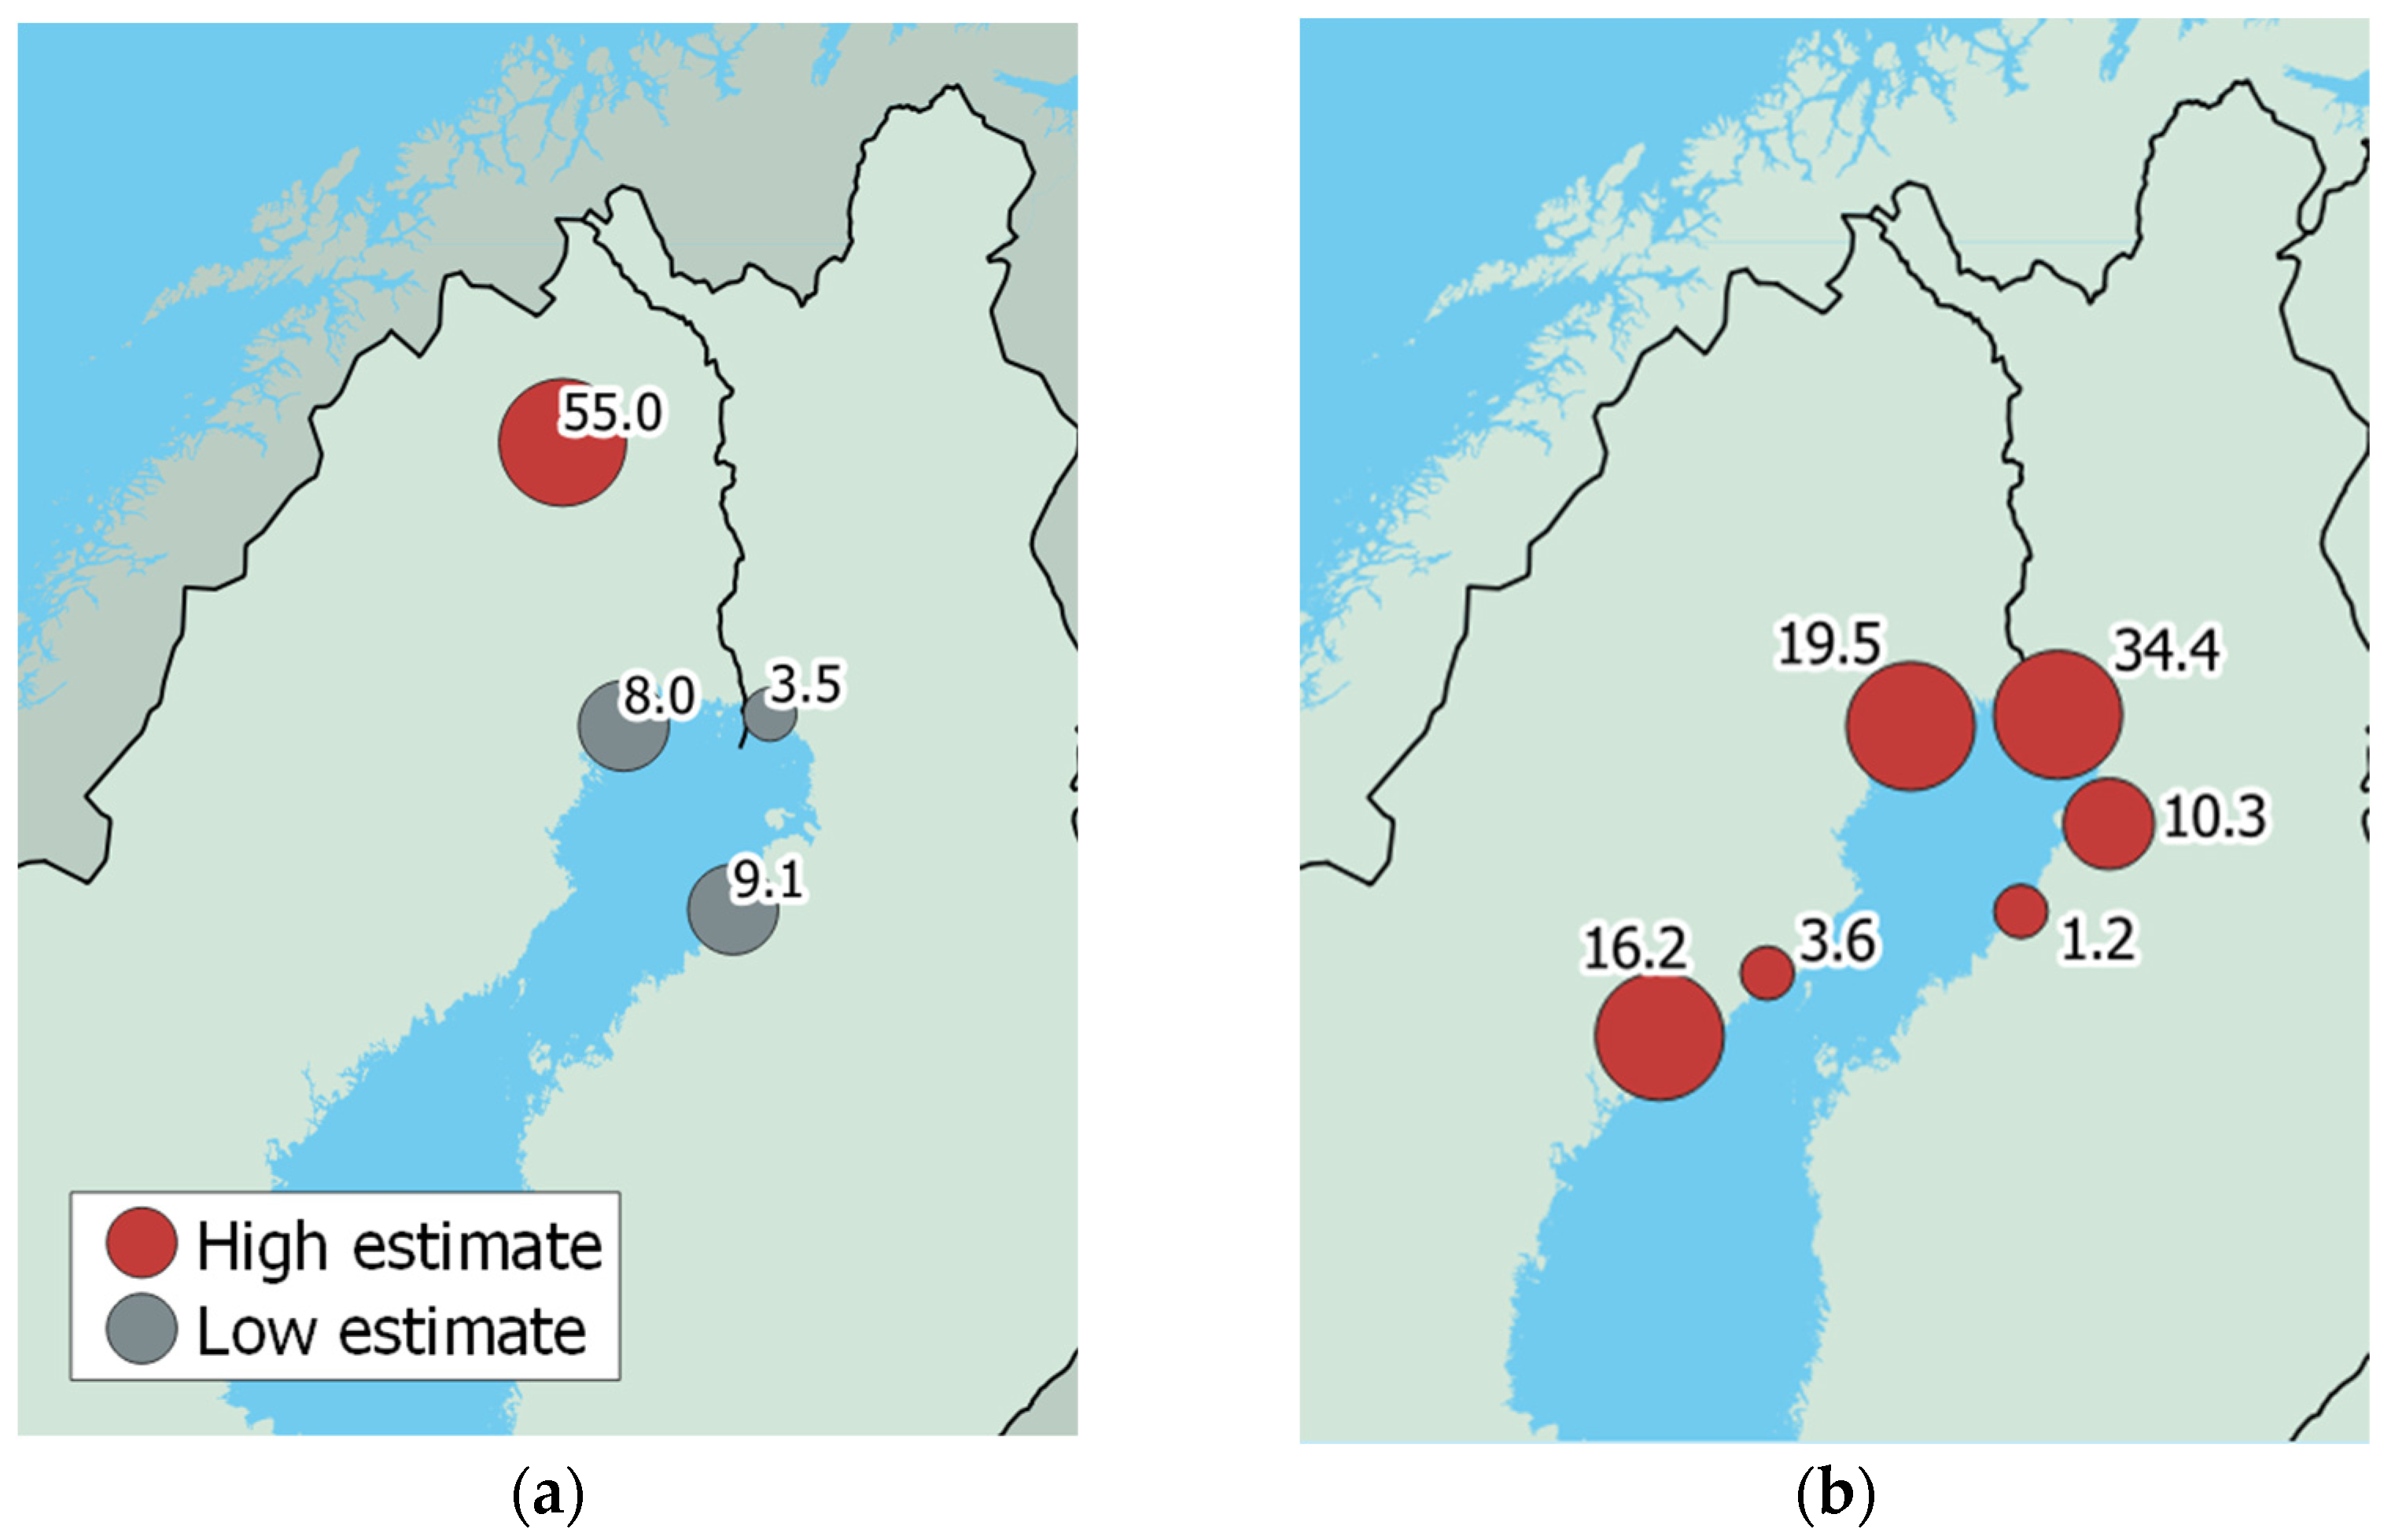
The electricity demand for steel decarbonization in the low and high estimates are presented in Figure 10a, whereas the projected electricity demand for methanol production in the high estimate is visible in Figure 10b. As there are numerous viable configurations for reaching the low estimate for methanol production, it is not illustrated here. The low estimate for Power-to-Methanol would essentially require selecting some sites in Figure 10b so that the total amounts to 30 TWh.
The resulting electricity and heat balances for the whole Bothnian Bay region are shown in Table 2. The estimated electricity production in the long-term scenario would not be enough for both high steel and high Power-to-X demand, but other combinations would be possible (e.g., high steel demand with low Power-to-X demand, or vice versa). The resulting excess heat would greatly exceed its demand in all examined cases. The additional electricity consumption required for application of heat pumps would be quite modest compared to overall electricity demand for hydrogen generation.
If the total district heat demand of the major cities in the region were to be covered completely by electrolysers supported by heat pumps, about 11.5 TWh of electricity would be converted into hydrogen. This represents roughly half of the steel industry’s low demand.
3.3. Regional Insights
Regional results focus on the city of Oulu in Finland. The necessary capacities of electrolysers, heat pumps and thermal energy storages are listed in Table 3. These configurations could completely and independently fulfil the local district heat demand of the region. Even though electrolysers would not likely be practical as the only source of heat, it illustrates the requirements and performance of the configuration. The obtained results are based on simulations for one year, and different weather conditions could lead to slightly different outcomes.
In contrast to electrolyser capacity, the highest capacity for the heat pump compressor is required in ElVar, 162 MW. Even though the maximum electrolyser capacity is higher in ElWind, a compressor capacity of 128 MW is already adequate. This might be due to better COP when the wind power production is peaking, during which heat is stored to TES. With the fixed electrolyser operation in ElVar, compressor capacity of 76 MW is needed.
The charging and discharging behaviour of ElFix and ElWind differ clearly, as ElWind requires higher charging and discharging rates, 386 MW and 595 MW at the maximum, respectively, while ElFix can manage with 127 MW and 352 MW, respectively.
In the case of ElVar, no TES is needed. ElWind requires 291 GWh of storage to supply heat throughout the year. ElFix needs 53% larger TES, 446 GWh. The capacity of the storage is fivefold to the world’s largest water-based TES planned to Vantaa, which will have a capacity of 90 GWh [50].
The main values regarding the annual performance of the system are presented in Table 4. With the current assumptions for charge and discharge efficiency, and heat loss, the annual efficiency of TES is 79.0% and 82.2% for cases ElFix and ElWind. TES share describes the amount of heat delivered to the district heat network via TES. The rest is supplied directly with the heat pump. TES share is the highest in ElWind, 35.8%, and 29.5% for ElFix.
The annual production of hydrogen is smallest in ElVar, 2.30 TWh. In ElFix and ElWind, 2.68 TWh and 2.72 TWh is produced, respectively. The difference between cases is probably due to heat losses of TES, which requires higher total heat generation by heat pump and electrolyser, which increases the required electrolyser power and consequently hydrogen production. The 18% difference in hydrogen production between ElVar and ElWind can be considered significant. However, the total H2 production quantities are still quite modest compared to the demand of the Raahe steel mill, for instance. Raahe mill would require about 6.75 TWh electricity for hydrogen production or about 4.2 TWh of hydrogen if the estimations presented in this work are correct. Thus, the demand of H2 could greatly exceed the production in these heat-coupled electrolyser scenarios.
Another important aspect is to compare the local electricity consumption to the available wind power in Oulu region. As seen in Table 5, the current annual production of 2.2 TWh is not sufficient, but the short-term estimate is already over double the demand, also leaving room for other electricity uses. For the local wind power potential estimation, node 9 and the neighbouring node 10 were both included (cf. Figure 3). The local growth of wind power potential in Oulu region is greater than the average for the whole Bothnian Bay.
To summarize, matching the local heat demand with hydrogen production results in small and insufficient supply of hydrogen for other sectors. Conversely, if the hydrogen production is dimensioned according to available CO2 for e-methanol production, an oversupply of 2 TWh of heat occurs. Similarly, using all projected wind electricity would result in 5–7 TWh of excess heat in Oulu.
The dynamical behaviour of TES is presented in Figure 11 for ElFiX and ElWind. Due to variation of both ambient temperature and wind production, there is more variation from charge to discharge in case ElWind. In addition, there seems to be more wind during the winter than during the summer, as the demand for seasonal storage is smaller than in ElFix. In ElFix, the strong seasonal variation is much clearer, and there are less occasions when TES operation is switched from charge to discharge or the other way round.
4. Discussion
Wind capacity is growing strongly in the short term in the Bothnian Bay region: ongoing projects in various stages of development could increase the cumulative capacity to 19 GW from the current capacity of 6 GW. Long-term wind capacity could in turn increase to nearly 40 GW, but the results should be verified and amended in future studies by using more sophisticated evaluation methodologies. The drastic increase in wind power is likely reflected in development needs for energy storage and transmission infrastructure, which would need to be developed and extended for electricity, hydrogen, or both.
Steel appears to be an important driver for implementing electrolytic hydrogen generation in the region. Nearly 55 TWh of renewable electricity would be required annually if all locally mined iron ore is processed to sponge iron according to existing company visions. Obtaining such amounts of electricity would necessitate harnessing a large portion of future wind power potential for hydrogen production. Sweden is, on a global scale, a minor player in iron mining or steel production, and yet hydrogen demand from the steel industry plays a dominant role in this regional study. Thus, it seems probable that a large portion of future global steel-related hydrogen production cannot be reliably linked with heat utilization, simply because there is not enough local demand for heat.
The potential volume for applying BECCUS in the region is vast, but CO2 utilization aspects are likely limited by available electricity—particularly in the upper end of utilization visions. Biogenic CO2 emissions from the pulp and paper sector currently amount to 10 Mt annually, which would require about 85 TWh of electricity if all were to be converted to methanol. In practice, it is not likely that all available capacities would be implemented. As both steel decarbonization and Power-to-X systems compete for the same electricity resources, some local compromises in implementation scale and timeline are likely. The availability of electricity and local wind power resources can therefore be considered a bottleneck, especially since the demand for electricity also increases in other applications, such as electric vehicles. The market demand for Power-to-X products was not evaluated in depth in this work, but it is likely not a limiting factor for manufacturing. For instance, the estimated methanol production potential in the Bothnian Bay area corresponds to 100–200% of the combined biofuel use in Sweden and Finland when compared in terms of thermal energy content of the liquids. As the potential customer sectors for methanol and other Power-to-X products would not be limited only to blending in road transport, market uptake can be expected to be much larger.
Ideally, hydrogen production should be integrated with district heat or similar uses for maximal energy efficiency. However, local heat demand can be satisfied already with a moderately sized electrolyser, which would then not be adequate for producing the necessary hydrogen volumes for decarbonizing other sectors. As a case example, if the district heat demand of the city of Oulu was produced by heat pump and electrolyser, the hydrogen production would cover only roughly a third of the demand of Raahe steel mill if it were converted to the carbon neutral HYBRIT process. From another perspective, decentralizing hydrogen production to the major cities in the region would enable all of those cities to meet their district heat demand primarily on electrolyser residual heat which would otherwise have no apparent use. Excess heat would likely be formed eventually as the hydrogen production volumes increase, but the first crucial pilots could be implemented with heat integration, increasing system efficiency and profitability. Another important aspect is the utilization of the oxygen that is formed as a by-product.
One open question is how well the operation profile of the electrolyser compares to wind power, heat demand and hydrogen demand. Heat demand and wind power vary significantly, while the demand for hydrogen might be rather stable. Therefore, some storage or balance mechanism is likely required for either hydrogen or heat, or both. In this study, the modelled heat scenarios are somewhat ultimate examples, as no other production methods for heat or hydrogen were considered. Hydrogen pipe network could balance the feed even though some of the electrolysers were to operate flexibly according to the heat demand. Similarly, some other stable heat sources would likely be available, which would decrease the required TES capacity.
Future studies should therefore focus on a more holistic overview of the dynamic performance of the system, including aspects of both electricity and heat availability and demand. It is likely this would require a more detailed analysis of the existing and future energy infrastructure, which is also related to energy transmission between neighbouring countries. The determination of oxygen market volumes could also be worthwhile, given the large number of pulp and paper mills in the area.
Author Contributions
Conceptualization, H.K., E.I. and T.T.; Data curation, H.K. and E.I.; Investigation, H.K. and E.I.; Methodology, H.K., E.I. and T.T.; Project administration, H.K.; Supervision, T.T.; Writing—original draft, H.K. and E.I.; Writing—review and editing, H.K. and T.T. All authors have read and agreed to the published version of the manuscript.
Funding
This research was funded by P2XEnable project (p2xenable.fi) provided by Business Finland grant number 8797/31/2019. The APC was funded by LUT University.
Institutional Review Board Statement
Not applicable.
Informed Consent Statement
Not applicable.
Data Availability Statement
Not applicable.
Conflicts of Interest
The authors declare no conflict of interest.
References
- Mission Innovation Hydrogen Valley Platform. Available online: https://www.h2v.eu/ (accessed on 17 November 2021).
- Basque Hydrogen Corridor. Available online: https://bh2c.es/en/ (accessed on 17 November 2021).
- Porthos–CO2 Reduction through Storage Beneath the North Sea. Available online: https://www.porthosCO2.nl/en/ (accessed on 17 November 2021).
- NortH2–Kickstarting the Green Hydrogen Economy. Available online: https://www.north2.eu/en/ (accessed on 17 November 2021).
- BotH2nia–CLIC Innovation. Available online: https://clicinnovation.fi/project/both2nia/ (accessed on 17 November 2021).
- Sulasalmi, P.; Kärkkäinen, M.-L.; Fabritius, T. Hydrogen Study of the Bay of Bothnia. 2021. University of Oulu. Available online: https://www.businessoulu.com/media/2019/vetywebinaari/hydrogen-study-of-the-bay-of-bothnia-final-report.pdf (accessed on 17 November 2021).
- IRENA. Green Hydrogen Cost Reduction: Scaling up Electrolysers to Meet the 1.5 °C Climate Goal. International Renewable Energy Agency; International Renewable Energy Agency: Abu Dhabi, United Arab Emirates, 2020. [Google Scholar]
- IRENA. Renewable Power Generation Costs in 2019. International Renewable Energy Agency; International Renewable Energy Agency: Abu Dhabi, United Arab Emirates, 2020. [Google Scholar]
- Parra, D.; Patel, M.K. Techno-Economic Implications of the Electrolyser Technology and Size for Power-to-Gas Systems. Int. J. Hydrogen Energy 2016, 41, 3748–3761. [Google Scholar] [CrossRef]
- Tsupari, E.; Kärki, J.; Vakkilainen, E. Economic Feasibility of Power-to-Gas Integrated with Biomass Fired CHP Plant. J. Energy Storage 2016, 5, 62–69. [Google Scholar] [CrossRef]
- Buttler, A.; Spliethoff, H. Current Status of Water Electrolysis for Energy Storage, Grid Balancing and Sector Coupling via Power-to-Gas and Power-to-Liquids: A Review. Renew. Sustain. Energy Rev. 2018, 82, 2440–2454. [Google Scholar] [CrossRef]
- Böhm, H.; Moser, S.; Puschnigg, S.; Zauner, A. Power-to-Hydrogen & District Heating: Technology-Based and Infrastructure-Oriented Analysis of (Future) Sector Coupling Potentials. Int. J. Hydrogen Energy 2021, 46, 31938–31951. [Google Scholar] [CrossRef]
- Buttler, A.; Koltun, R.; Wolf, R.; Spliethoff, H. A Detailed Techno-Economic Analysis of Heat Integration in High Temperature Electrolysis for Efficient Hydrogen Production. Int. J. Hydrogen Energy 2015, 40, 38–50. [Google Scholar] [CrossRef]
- Min, G.; Park, Y.J.; Hong, J. Thermodynamic Analysis of a Solid Oxide Co-Electrolysis Cell System for Its Optimal Thermal Integration with External Heat Supply. Energy Convers. Manag. 2020, 225, 113381. [Google Scholar] [CrossRef]
- Gruber, M.; Weinbrecht, P.; Biffar, L.; Harth, S.; Trimis, D.; Brabandt, J.; Posdziech, O.; Blumentritt, R. Power-to-Gas through Thermal Integration of High-Temperature Steam Electrolysis and Carbon Dioxide Methanation–Experimental Results. Fuel Process. Technol. 2018, 181, 61–74. [Google Scholar] [CrossRef]
- Ikäheimo, J.; Kiviluoma, J.; Weiss, R.; Holttinen, H. Power-to-Ammonia in Future North European 100% Renewable Power and Heat System. Int. J. Hydrogen Energy 2018, 43, 17295–17308. [Google Scholar] [CrossRef]
- Lund, H.; Werner, S.; Wiltshire, R.; Svendsen, S.; Thorsen, J.E.; Hvelplund, F.; Mathiesen, B.V. 4th Generation District Heating (4GDH). Energy 2014, 68, 1–11. [Google Scholar] [CrossRef]
- Gorre, J.; Ruoss, F.; Karjunen, H.; Schaffert, J.; Tynjälä, T. Cost Benefits of Optimizing Hydrogen Storage and Methanation Capacities for Power-to-Gas Plants in Dynamic Operation. Appl. Energy 2020, 257, 113967. [Google Scholar] [CrossRef]
- Astiaso Garcia, D.; Barbanera, F.; Cumo, F.; Di Matteo, U.; Nastasi, B. Expert Opinion Analysis on Renewable Hydrogen Storage Systems Potential in Europe. Energies 2016, 9, 963. [Google Scholar] [CrossRef] [Green Version]
- Kuparinen, K.; Vakkilainen, E.; Ryder, P. Integration of Electrolysis to Produce Hydrogen and Oxygen in a Pulp Mill Process. Appita 2016, 69, 81–88. [Google Scholar]
- Maggio, G.; Squadrito, G.; Nicita, A. Hydrogen and Medical Oxygen by Renewable Energy Based Electrolysis: A Green and Economically Viable Route. Appl. Energy 2022, 306, 117993. [Google Scholar] [CrossRef]
- Saxe, M.; Alvfors, P. Advantages of Integration with Industry for Electrolytic Hydrogen Production. Energy 2007, 32, 42–50. [Google Scholar] [CrossRef]
- Resch, B.; Sagl, G.; Törnros, T.; Bachmaier, A.; Eggers, J.-B.; Herkel, S.; Narmsara, S.; Gündra, H. GIS-Based Planning and Modeling for Renewable Energy: Challenges and Future Research Avenues. IJGI 2014, 3, 662–692. [Google Scholar] [CrossRef]
- Petrovic, S.N.; Karlsson, K.B. Danish Heat Atlas as a Support Tool for Energy System Models. Energy Convers. Manag. 2014, 87, 1063–1076. [Google Scholar] [CrossRef] [Green Version]
- Nielsen, S.; Möller, B. GIS Based Analysis of Future District Heating Potential in Denmark. Energy 2013, 57, 458–468. [Google Scholar] [CrossRef] [Green Version]
- Persson, U.; Möller, B.; Werner, S. Heat Roadmap Europe: Identifying Strategic Heat Synergy Regions. Energy Policy 2014, 74, 663–681. [Google Scholar] [CrossRef]
- Welder, L.; Ryberg, D.S.; Kotzur, L.; Grube, T.; Robinius, M.; Stolten, D. Spatio-Temporal Optimization of a Future Energy System for Power-to-Hydrogen Applications in Germany. Energy 2018, 158, 1130–1149. [Google Scholar] [CrossRef]
- Karjunen, H.; Tynjälä, T.; Hyppänen, T. A Method for Assessing Infrastructure for CO 2 Utilization: A Case Study of Finland. Appl. Energy 2017, 205, 33–43. [Google Scholar] [CrossRef]
- Simon Araya, S.; Liso, V.; Cui, X.; Li, N.; Zhu, J.; Sahlin, S.L.; Jensen, S.H.; Nielsen, M.P.; Kær, S.K. A Review of The Methanol Economy: The Fuel Cell Route. Energies 2020, 13, 596. [Google Scholar] [CrossRef] [Green Version]
- Vogl, V.; Åhman, M.; Nilsson, L.J. Assessment of Hydrogen Direct Reduction for Fossil-Free Steelmaking. J. Clean. Prod. 2018, 203, 736–745. [Google Scholar] [CrossRef]
- Tekniikka ja Talous. Tämä Sähkösyöppö Kuluttaa 3,5 TWh/v-4 % Koko Suomen Sähkönkulutuksesta. Available online: https://www.tekniikkatalous.fi/uutiset/tama-sahkosyoppo-kuluttaa-3-5-twh-v-4-koko-suomen-sahkonkulutuksesta/d30cc904-3c00-37d9-8797-bb01f23da998 (accessed on 28 November 2021).
- SSAB. Annual Report 2020. Available online: https://mb.cision.com/Main/980/3309155/1388946.pdf (accessed on 28 November 2021).
- LKAB. HYBRIT: SSAB, LKAB and Vattenfall First in the World with Hydrogen-Reduced Sponge Iron. Available online: https://www.lkab.com/en/news-room/press-releases/hybrit-ssab-lkab-and-vattenfall-first-in-the-world-with-hydrogen-reduced-sponge-iron/?aid=16447 (accessed on 28 November 2021).
- LKAB. Annual and Sustainability Report 2020. Available online: https://www.lkab.com/en/SysSiteAssets/documents/finansiell-information/en/annual-reports/lkab_2020_annual_and_sustainability_report.pdf (accessed on 28 November 2021).
- European Pollutant Release and Transfer Register (E-PRTR). Database Version v17. 2019. Available online: https://www.eea.europa.eu/ds_resolveuid/4fd0ddc476b94f2f99ecc79a81a2abdc (accessed on 8 January 2020).
- Rabensteiner, M.; Kinger, G.; Koller, M.; Hochenauer, C. Pilot Plant Study of Aqueous Solution of Piperazine Activated 2-Amino-2-Methyl-1-Propanol for Post Combustion Carbon Dioxide Capture. Int. J. Greenh. Gas Control. 2016, 51, 106–117. [Google Scholar] [CrossRef]
- Hwang, H.; Han, J.-H.; Lee, I.-B. Technoeconomic Feasibility Study of Monoethanolamine-Based CO2 Capture System Deployment to Be Retrofitted to an Existing Utility System in a Chemical Plant. Ind. Eng. Chem. Res. 2013, 52, 18334–18344. [Google Scholar] [CrossRef]
- Szima, S.; Cormos, C.-C. Improving Methanol Synthesis from Carbon-Free H2 and Captured CO2: A Techno-Economic and Environmental Evaluation. J. CO2 Util. 2018, 24, 555–563. [Google Scholar] [CrossRef]
- Pérez-Fortes, M.; Schöneberger, J.C.; Boulamanti, A.; Tzimas, E. Methanol Synthesis Using Captured CO2 as Raw Material: Techno-Economic and Environmental Assessment. Appl. Energy 2016, 161, 718–732. [Google Scholar] [CrossRef]
- Finnish Wind Power Association. FWPA Project List. 2021. Available online: https://tuulivoimayhdistys.fi/en/wind-power-in-finland/projects-under-planning (accessed on 17 November 2021).
- VBK. County Administrative Board of Västra Götaland County. Vindbrukskollen. Available online: https://vbk.lansstyrelsen.se/ (accessed on 9 November 2021).
- Roques, F.; Le Thieis, Y.; Aue, G.; Spodniak, P.; Pugliese, G.; Cail, S.; Peffen, A.; Honkapuro, S.; Sihvonen, V. Enabling Cost-Efficient Electrification in Finland. In Sitran Studies 194; Sitra: Helsinki, Finland, 2021. [Google Scholar]
- Michailos, S.; Walker, M.; Moody, A.; Poggio, D.; Pourkashanian, M. A Techno-Economic Assessment of Implementing Power-to-Gas Systems Based on Biomethanation in an Operating Waste Water Treatment Plant. J. Environ. Chem. Eng. 2021, 9, 104735. [Google Scholar] [CrossRef]
- Energiateollisuus. Kaukolämpötilasto. 2019. [Google Scholar]
- Hiltunen, P.; Syri, S. Highly Renewable District Heat for Espoo Utilizing Waste Heat Sources. Energies 2020, 13, 3551. [Google Scholar] [CrossRef]
- Flores, J.F.C.; Lacarrière, B.; Chiu, J.N.W.; Martin, V. Assessing the Techno-Economic Impact of Low-Temperature Subnets in Conventional District Heating Networks. Energy Procedia 2017, 116, 260–272. [Google Scholar] [CrossRef]
- Ahrens, M.U.; Foslie, S.S.; Moen, O.M.; Bantle, M.; Eikevik, T.M. Integrated High Temperature Heat Pumps and Thermal Storage Tanks for Combined Heating and Cooling in the Industry. Appl. Therm. Eng. 2021, 189, 116731. [Google Scholar] [CrossRef]
- Finnish Meteorological Institute. Observation Data. Available online: https://www.ilmatieteenlaitos.fi/havaintojen-lataus (accessed on 9 November 2021).
- Yang, T.; Liu, W.; Kramer, G.J.; Sun, Q. Seasonal Thermal Energy Storage: A Techno-Economic Literature Review. Renew. Sustain. Energy Rev. 2021, 139, 110732. [Google Scholar] [CrossRef]
- Vantaan Energia. Maailman Suurin Lämmön Kausivaraso Vantaalle. Available online: https://www.vantaanenergia.fi/fossiiliton-2026/maailman-suurin-lammon-kausivarasto-vantaalle/ (accessed on 30 November 2021).
Figure 1.
Location of the Bothnia Bay and the study focus area.

Figure 2.
Distribution of the largest emitters of CO2 from the region (data from [35]).
Figure 2.
Distribution of the largest emitters of CO2 from the region (data from [35]).

Figure 3.
Allocation of municipalities into twelve calculation groups.

Figure 4.
Supply temperature of district heat varies as a function of ambient temperature. Reproduced from [45].
Figure 4.
Supply temperature of district heat varies as a function of ambient temperature. Reproduced from [45].

Figure 5.
Duration curve of the district heat demand. Data simplified from [46].
Figure 5.
Duration curve of the district heat demand. Data simplified from [46].

Figure 6.
Duration curve of air temperature in Oulu 2020 [48].
Figure 6.
Duration curve of air temperature in Oulu 2020 [48].

Figure 7.
Major cities in the region that were included in the district heat estimation.

Figure 8.
Block diagram of the heat balance simulation.

Figure 9.
(a) Annual wind power production (TWh) from current turbines; (b) corresponding production when the short-term capacity additions are included; (c) production with long-term assumptions.
Figure 9.
(a) Annual wind power production (TWh) from current turbines; (b) corresponding production when the short-term capacity additions are included; (c) production with long-term assumptions.

Figure 10.
(a) Steel electricity demand (TWh); (b) Power-to-Methanol electricity demand (TWh) if all selected carbon sources were utilized.
Figure 10.
(a) Steel electricity demand (TWh); (b) Power-to-Methanol electricity demand (TWh) if all selected carbon sources were utilized.

Figure 11.
State of charge of TES and charge/discharge rates in cases ElFix and ElWind.


Table 1.
Estimated wind power capacities in the Bothnian Bay region.
| Time Frame | Cumulative Capacity (GW) | Annual Production (TWh) |
|---|---|---|
| Current | 6 | 16 |
| Short term | 19 | 50 |
| Long term | 39 | 102 |
Table 2.
Summary of electricity and heat balances in the Bothnian Bay area.
| Electricity Demand Scenario | High | Low |
|---|---|---|
| Electricity Production Scenario | Long Term | Short Term |
| Electricity | ||
| Regional wind power generation (TWh) | 102 | 50 |
| Steel electricity demand (TWh) | 55 | 21 |
| e-Methanol electricity demand (TWh) | 85 | 30 |
| Heat pump compressor demand (TWh) | 7 | 3 |
| C O2 capture demand (TWh) | 3 | 1 |
| Synthesis demand (TWh) | 1 | 0.4 |
| Electricity balance (TWh) | −50 | −5 |
| Heat | ||
| Heat from heat pumps (TWh) | 54 | 20 |
| Heat from methanol synthesis (TWh) | 3 | 1 |
| CO2 capture heat demand (TWh) | 11 | 4 |
| Regional district heat demand (TWh) | 5 | 5 |
| Heat balance (TWh) | +41 | +12 |
Table 3.
Required capacities for producing district heat for Oulu.
| Case | Electrolyser Capacity | Compressor Size | Max. Charge | Max. Discharge | TES Capacity |
|---|---|---|---|---|---|
| (MW) | (MW) | (MW) | (MW) | (GWh) | |
| ElVar | 1078 | 162 | - | - | - |
| ElFix | 494 | 76 | 127 | 352 | 446 |
| ElWind | 1232 | 128 | 386 | 595 | 291 |
Table 4.
Annual performance of the heating system.
| Case | TES Efficiency | TES Share | H2 Production | Average COP | Electricity Demand |
|---|---|---|---|---|---|
| (%) | (%) | (TWh) | (-) | (TWh) | |
| ElVar | - | - | 2.30 | 7.4 | 3.98 |
| ElFix | 79.0 | 29.5 | 2.68 | 7.4 | 4.60 |
| ElWind | 82.2 | 35.8 | 2.72 | 7.4 | 4.66 |
Table 5.
Estimated wind power capacities in the Oulu region.
| Time | Cumulative Capacity (GW) | Annual Production (TWh) |
|---|---|---|
| Current | 0.9 | 2.2 |
| Short term | 4.2 | 11.0 |
| Long term | 8.2 | 21.2 |
Publisher’s Note: MDPI stays neutral with regard to jurisdictional claims in published maps and institutional affiliations. |
© 2021 by the authors. Licensee MDPI, Basel, Switzerland. This article is an open access article distributed under the terms and conditions of the Creative Commons Attribution (CC BY) license (https://creativecommons.org/licenses/by/4.0/).
Share and Cite
MDPI and ACS Style
Karjunen, H.; Inkeri, E.; Tynjälä, T. Mapping Bio-CO2 and Wind Resources for Decarbonized Steel, E-Methanol and District Heat Production in the Bothnian Bay. Energies 2021, 14, 8518. https://0-doi-org.brum.beds.ac.uk/10.3390/en14248518
AMA Style
Karjunen H, Inkeri E, Tynjälä T. Mapping Bio-CO2 and Wind Resources for Decarbonized Steel, E-Methanol and District Heat Production in the Bothnian Bay. Energies. 2021; 14(24):8518. https://0-doi-org.brum.beds.ac.uk/10.3390/en14248518
Chicago/Turabian StyleKarjunen, Hannu, Eero Inkeri, and Tero Tynjälä. 2021. "Mapping Bio-CO2 and Wind Resources for Decarbonized Steel, E-Methanol and District Heat Production in the Bothnian Bay" Energies 14, no. 24: 8518. https://0-doi-org.brum.beds.ac.uk/10.3390/en14248518
Note that from the first issue of 2016, this journal uses article numbers instead of page numbers. See further details here.