
Central and Eastern European CO2 Market—Challenges of Emissions Trading for Energy Companies

1
SGH Warsaw School of Economics, Collegium of Business Administration, Institute of Markets and Competition, al. Niepodległości 162, 02-554 Warsaw, Poland
2
GreenX Utility, Smardzewska 17/27, 60-161 Poznań, Poland
*
Author to whom correspondence should be addressed.
Energies 2021, 14(4), 1051; https://0-doi-org.brum.beds.ac.uk/10.3390/en14041051
Submission received: 12 January 2021
/
Revised: 8 February 2021
/
Accepted: 10 February 2021
/
Published: 17 February 2021
(This article belongs to the Special Issue Economic and Policy Challenges of the Energy Transition in CEE Countries)
Abstract
:The aim of this article was to identify challenges of emissions trading that the Polish and CEE Central and Eastern Europe energy industry will face, as well as to indicate key implications for the competitiveness of the companies from the energy sector resulting from that trading. The EU Emissions Trading Scheme (ETS) is the emissions trading system, which results from the EU policy concerning climate change. It is a tool for reducing greenhouse gas emissions (GHG). The system regulates an annual allocation of the allowances. The price of CO2 emission allowances is subject to constant fluctuations because it depends on various macroeconomic factors as well as is an effect of proprietary trading by global investment banks. Polish energy companies have an increasing share in the emission of CO2 in the European market. This is due to the fact that other European countries are rapidly moving away from fossil fuel-fired sources. The cost per MWh related to CO2 price has been growing in the last 10 years from ca. 5 up to 30 EUR/MWh at the beginning of 2021. From an electric power utilities perspective, the ability to set up a proper strategy in trading CO2 will be crucial to be competitive in the wholesale power market. The higher price of CO2 (and electric power) at the domestic market in relation to more green (more renewable energy sources RES in energy mix) surrounding countries translates into a worse competitive position.
1. Introduction
The EU ETS is the emissions trading system, which results from the EU policy concerning climate change [1]. It is the key tool for reducing greenhouse gas emissions (GHG). It contributes to achieving the EU’s target of cutting GHG emissions [2].
The system regulates an annual allocation of the allowances. Under it the European Union has committed to reducing GHG emissions successively in subsequent periods: Phase I (2005–2007), phase II (2008–2012), phase III (2013–2020), and IV (2021–2030). The emissions trading system has been widely discussed in the scientific literature [3,4,5,6,7,8,9,10]. The authors introduced the present status and process of changing the EU Emissions Trading Scheme (ETS) and the market mechanisms and instruments for CO2 EA [3,4,5,6,7,8,9,10]. In some of those articles, the models have been built to predict behavior and changes in this market [3,4,8,9,10]. Some take the perspective of the post-Kyoto agreement [3]. The addressees of the research are also different: Some research is aimed at decision-makers creating institutional operating conditions [3,7,9]. Others take a more entrepreneurial point of view, regarding corporate CO2 strategies [5,6].
The EU ETS functions in the 31 countries of the European Economic Area (EEA). It limits emissions from nearly 11,000 power plants and manufacturing installations as well as over 500 aircraft operators flying between EEA’s airports. According to the EU Commission, it covers around 39% of the EU’s GHG emissions [2].
The EU ETS system is now in phase III which has different rules than phases I and II. First of all, the previous national caps system on emissions was replaced by a single EU-wide cap. As a result, the primary method of allowances’ allocation is auctioning, instead of the free allocation used before. Enterprises have to buy emission allowances on the market according to their demand. The total number of allowances is limited every year so that allowances have a price that is valued by the market. According to the EU administration, “Trading brings flexibility that ensures emissions are cut where it costs least to do so. A robust carbon price also promotes investment in clean, low-carbon technologies” [2].
The importance of trading CO2 emissions is directly related to the cost of electricity at the wholesale market. For example, when a coal-fired power plant produces electricity, the cost of CO2 at the beginning of 2021 is almost half of the price. In the long run, very high electricity prices translate into the worse competitive position of the whole country’s economy. So-called heavy industries like steel production, car production, or manufacturing, in general, will change the location of the factories [11].
The share of Polish emissions in the EU is growing, while at the same time the total volume of emissions is decreasing. It is caused by the fact that, while other countries such as Germany, the Netherlands, and Italy are moving away from fossil fuel-fired sources, emissions in Poland have seen little change. As a result of that, the Polish and Central and Eastern Europe CEE energy industry will face several challenges concerning emissions trading. This article aimed to identify these challenges faced by the Polish and CEE energy industries. Until now, the majority of articles have mainly taken into account the prospect of decision-makers, which could be identified with a macro perspective [4]. This paper aimed to contribute to the existing knowledge concerning the EU emissions trading system bearing in mind the perspective of energy companies from CEE, i.e., the micro context. Therefore, in the beginning, a literature review was conducted to identify the current research on CO2 emissions allowance (CO2 EA) trading. Then, the CO2 emissions market was analyzed and a critical analysis of literature was carried out to isolate the factors that can affect the trading conditions and the price of CO2 EA. Finally, the case study of PKN Orlen, which is the biggest company in the CEE region, listed on the Fortune 500, was examined. This paper aimed to contribute to the existing knowledge concerning the EU emissions trading system, taking into account the perspective of companies.
2. CO2 Emissions—Poland and CEE Countries
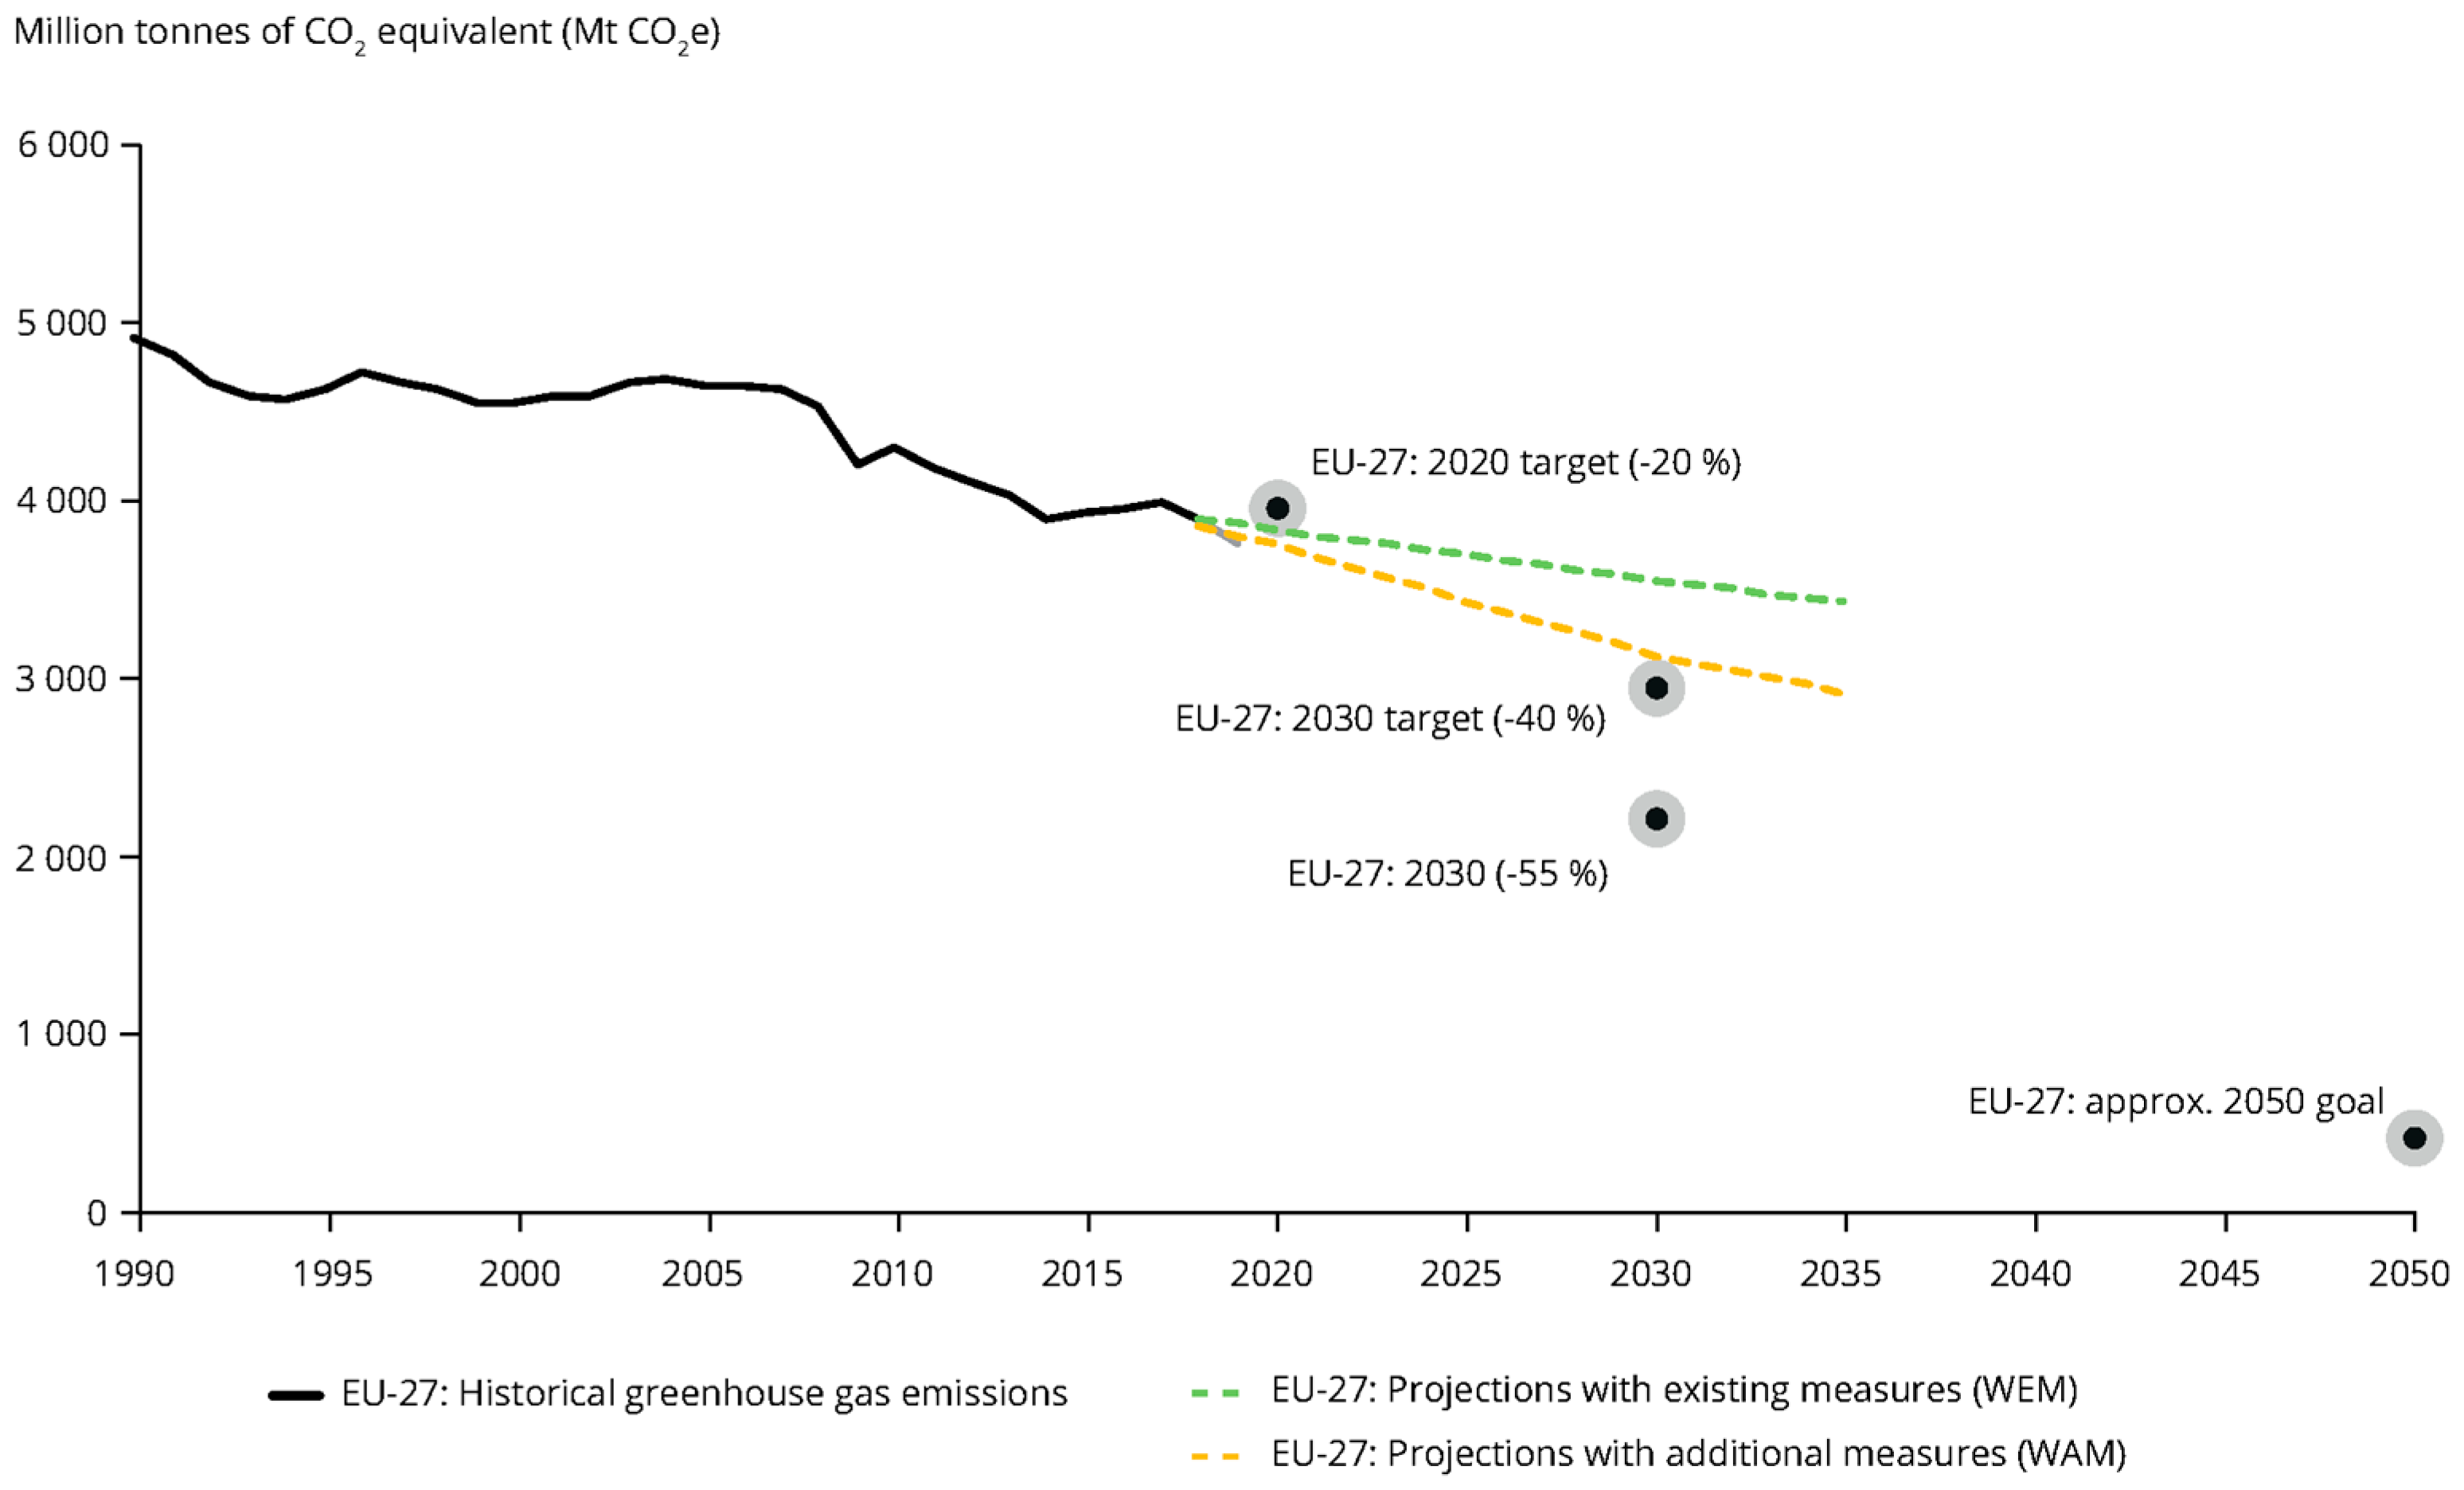
As part of the European Green Deal, the commission proposed in September 2020 to raise the 2030 greenhouse gas emission reduction target, including emissions and removals, to at least 55% compared to 1990. The commission has a plan to come forward with the proposals by June 2021. The previous target for 2030 GHG emissions was to cut them by 40% [2].
Figure 1 shows greenhouse gas emission targets and trends for EU countries according to MMR (Monitoring Mechanism Regulation)projections [12]. In the nearest future, further reductions in greenhouse gas emissions are expected partially because of the COVID-19 crisis; however, increased energy efficiency and renewable energy use are required across all sectors.
Poland, the largest economy of Central Eastern Europe is one of the European Union’s largest emitters of carbon dioxide, following countries such as Germany, the United Kingdom, France, and Italy.
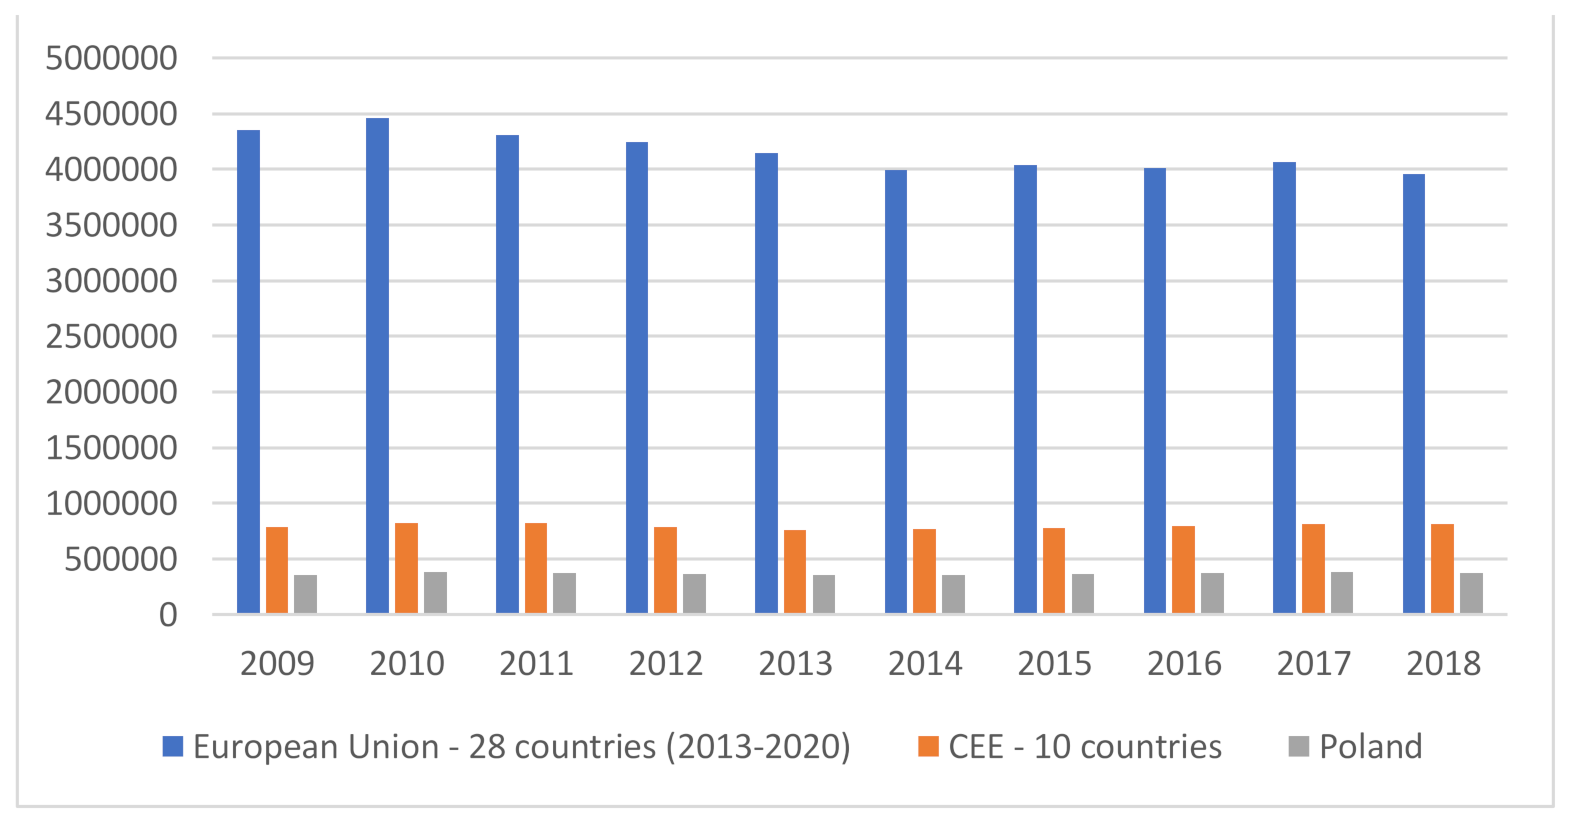
Figure 2 illustrates the emissions of the EU as well as CEE countries and Poland [13]. It has to be mentioned that the rate of reduction of EU emission has slowed down in the period 2014–2018 compared to previous years.
The EU-28 is the abbreviation of the European Union (EU) which consists of a group of 28 countries (Belgium, Bulgaria, Czech Republic, Denmark, Germany, Estonia, Ireland, Greece, Spain, France, Croatia, Italy, Cyprus, Latvia, Lithuania, Luxembourg, Hungary, Malta, Netherlands, Austria, Poland, Portugal, Romania, Slovenia, Slovakia, Finland, Sweden, and the United Kingdom). CEE is the abbreviation for a group of countries which consist of Bulgaria, the Czech Republic, Estonia, Hungary, Lithuania, Latvia, Poland, Romania, Slovenia, and Slovakia.
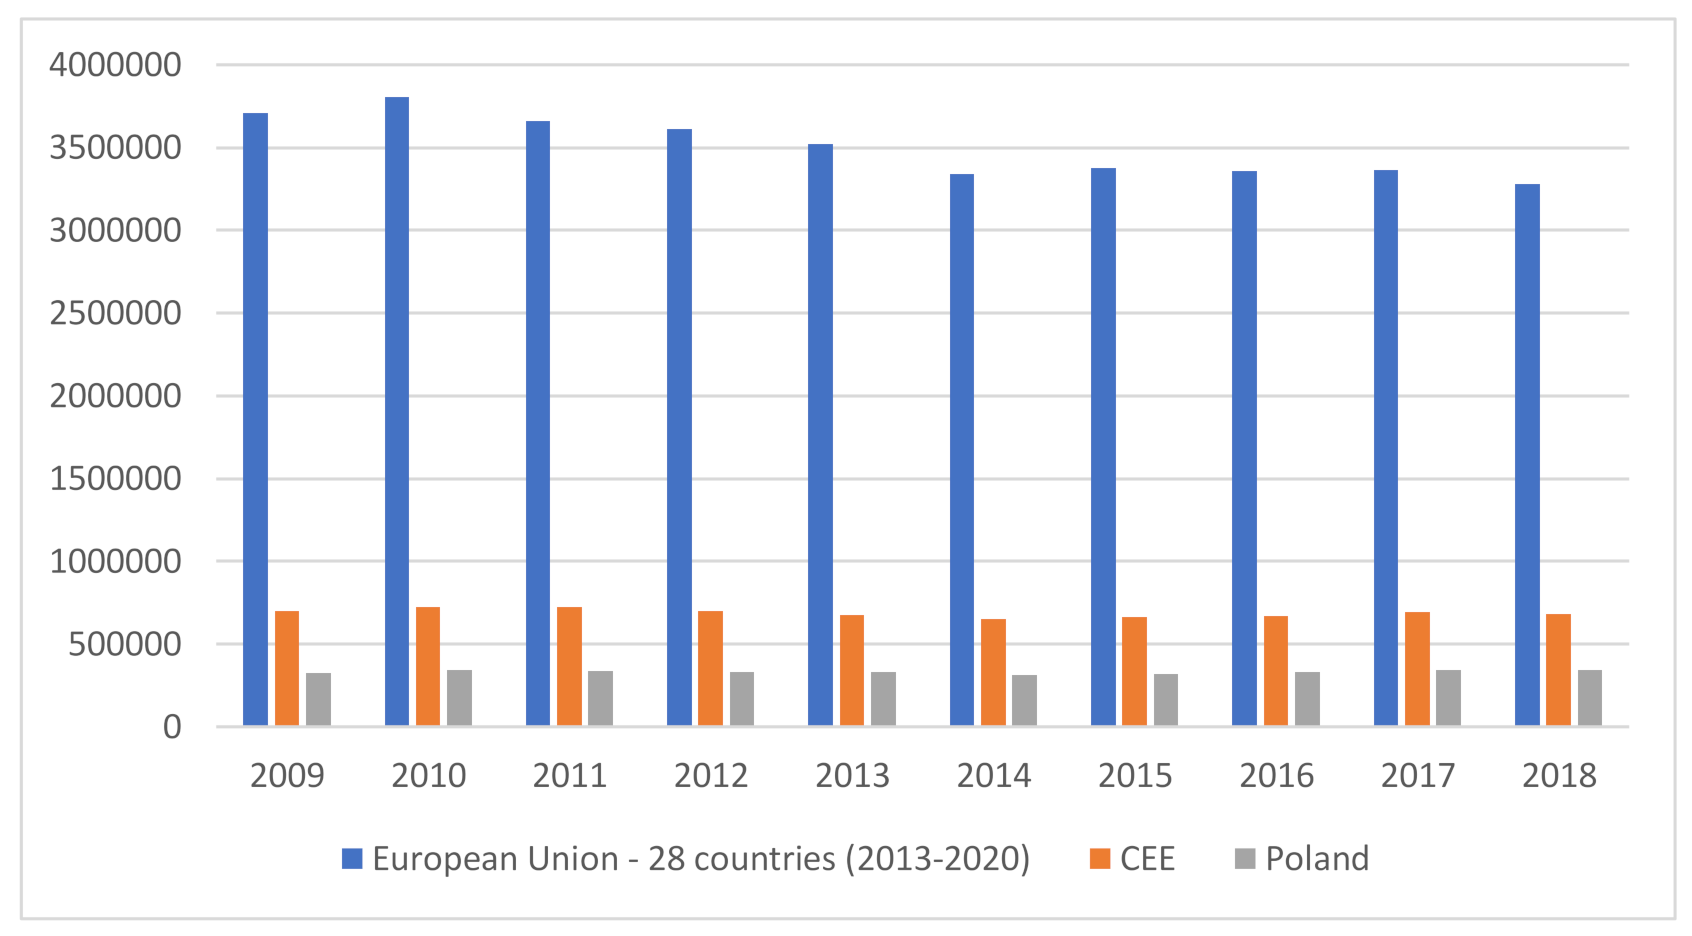
The most significant sector in terms of emissions is commercial power engineering: Commercial power plants, combined heat and power plants, and heating plants. Figure 3 and Table 1 depicts greenhouse gas emissions from the energy sector in UE, CEE and Poland.
In 2018, the 30 highest emitting power plants alone were responsible for emitting 30% of the total combustion emissions. The top-emitting power plants are located mainly in Poland and Germany. The largest emitter of all the EU ETS installations is the lignite-fired power plant in Bełchatów, Poland, which emitted 38.3 MtCO2 in 2018 [14].
The power plants from CEE countries that were among the 30 highest emitting power plants in the EU in 2018 are listed in the Table 2 [14].
Polish power plants, including Kozienice (hard coal), Połaniec (hard coal), Turów (lignite), Rybnik (hard coal) and Opole (hard coal), as well as Bełchatów (lignite), account for 23% of the emissions from this top 30 list of installations [14]. Most of the biggest emitters in the EU are already planned to be decommissioned by the end of 2040. As mentioned earlier, the EU Commission plans to achieve a zero net carbon footprint by 2050 [2]. The shift from fossil fuels to green electricity will take decades. However, Germany, which has consistently been the EU’s biggest emitter of carbon dioxide (CO2) emissions, has a long-term strategy to decrease emissions faster than other neighboring countries, and especially faster than Poland. From an economic perspective, it means that Germany will gain a more competitive advantage because of the cheaper electricity for final customers (business users). A long-term strategy for electric utilities should be focused on how to decrease emissions (average per MWh and in total) in the shortest time possible. From the buyers’ perspective, it is very important to do the pricing of the emission allowances. The accurate forecast of the CO2 prices is one of the most important things in large scale utilities that have exposure to CO2 prices.
3. CO2 Emissions Allowance (CO2 EA) Trading—Literature Review
In order to identify all the challenges faced by the Polish and CEE energy industries, the literature review had two goals: To diagnose the CO2 emissions market in Poland and CEE countries, as well as to identify determinants for the price of the CO2 emission allowances.
Understanding the classification of emission allowances and emission allowance prices and the methods of their modeling, and above all, the determinants that researchers introduced into the models (considering them important) is of fundamental importance for understanding the challenges faced by the Polish and EU energies industries.
Therefore, the literature review conducted below is aimed at identifying in the existing studies all kinds of factors that have an impact on emission allowance prices. Every single factor identified in this way may pose a potential challenge for companies in the energy sector. What is more, some of the factors may have been underestimated or not taken into account at all when considering the competitiveness of companies in this sector.
3.1. Classification of Emission Allowances and Emission Allowance Prices
Benz and Trück [15] indicated that the emission allowances are not the “normal goods”, i.e., classical resources. Demand (the price) for the “normal goods” depends on the profit that is expected from the usage of those goods. However, allowance price depends directly on the expected market deficiency resulting from the imbalance of current demand and supply. That is why CO2 emission allowances are specified rather as “factors of production”. Companies may decide to change the method of production to reduce CO2 emissions and thus control their demand (and have a real impact on the price of emission allowances, i.e., less demand–lower allowance price). It means that companies have a significant impact on market liquidity and price dynamics.
It should be remembered that the annual numbers of allowances are limited according to the EU Directives. As there is a ban for intertemporal banking of allowances, they become worthless at the end of each ban period.
The emissions hence become either an asset or a liability for the obligation to deliver allowances to cover those emissions. Accordingly, it seems more adequate to compare the right to emit CO2 with other operating materials or commodities than with a traditional equity share [15].
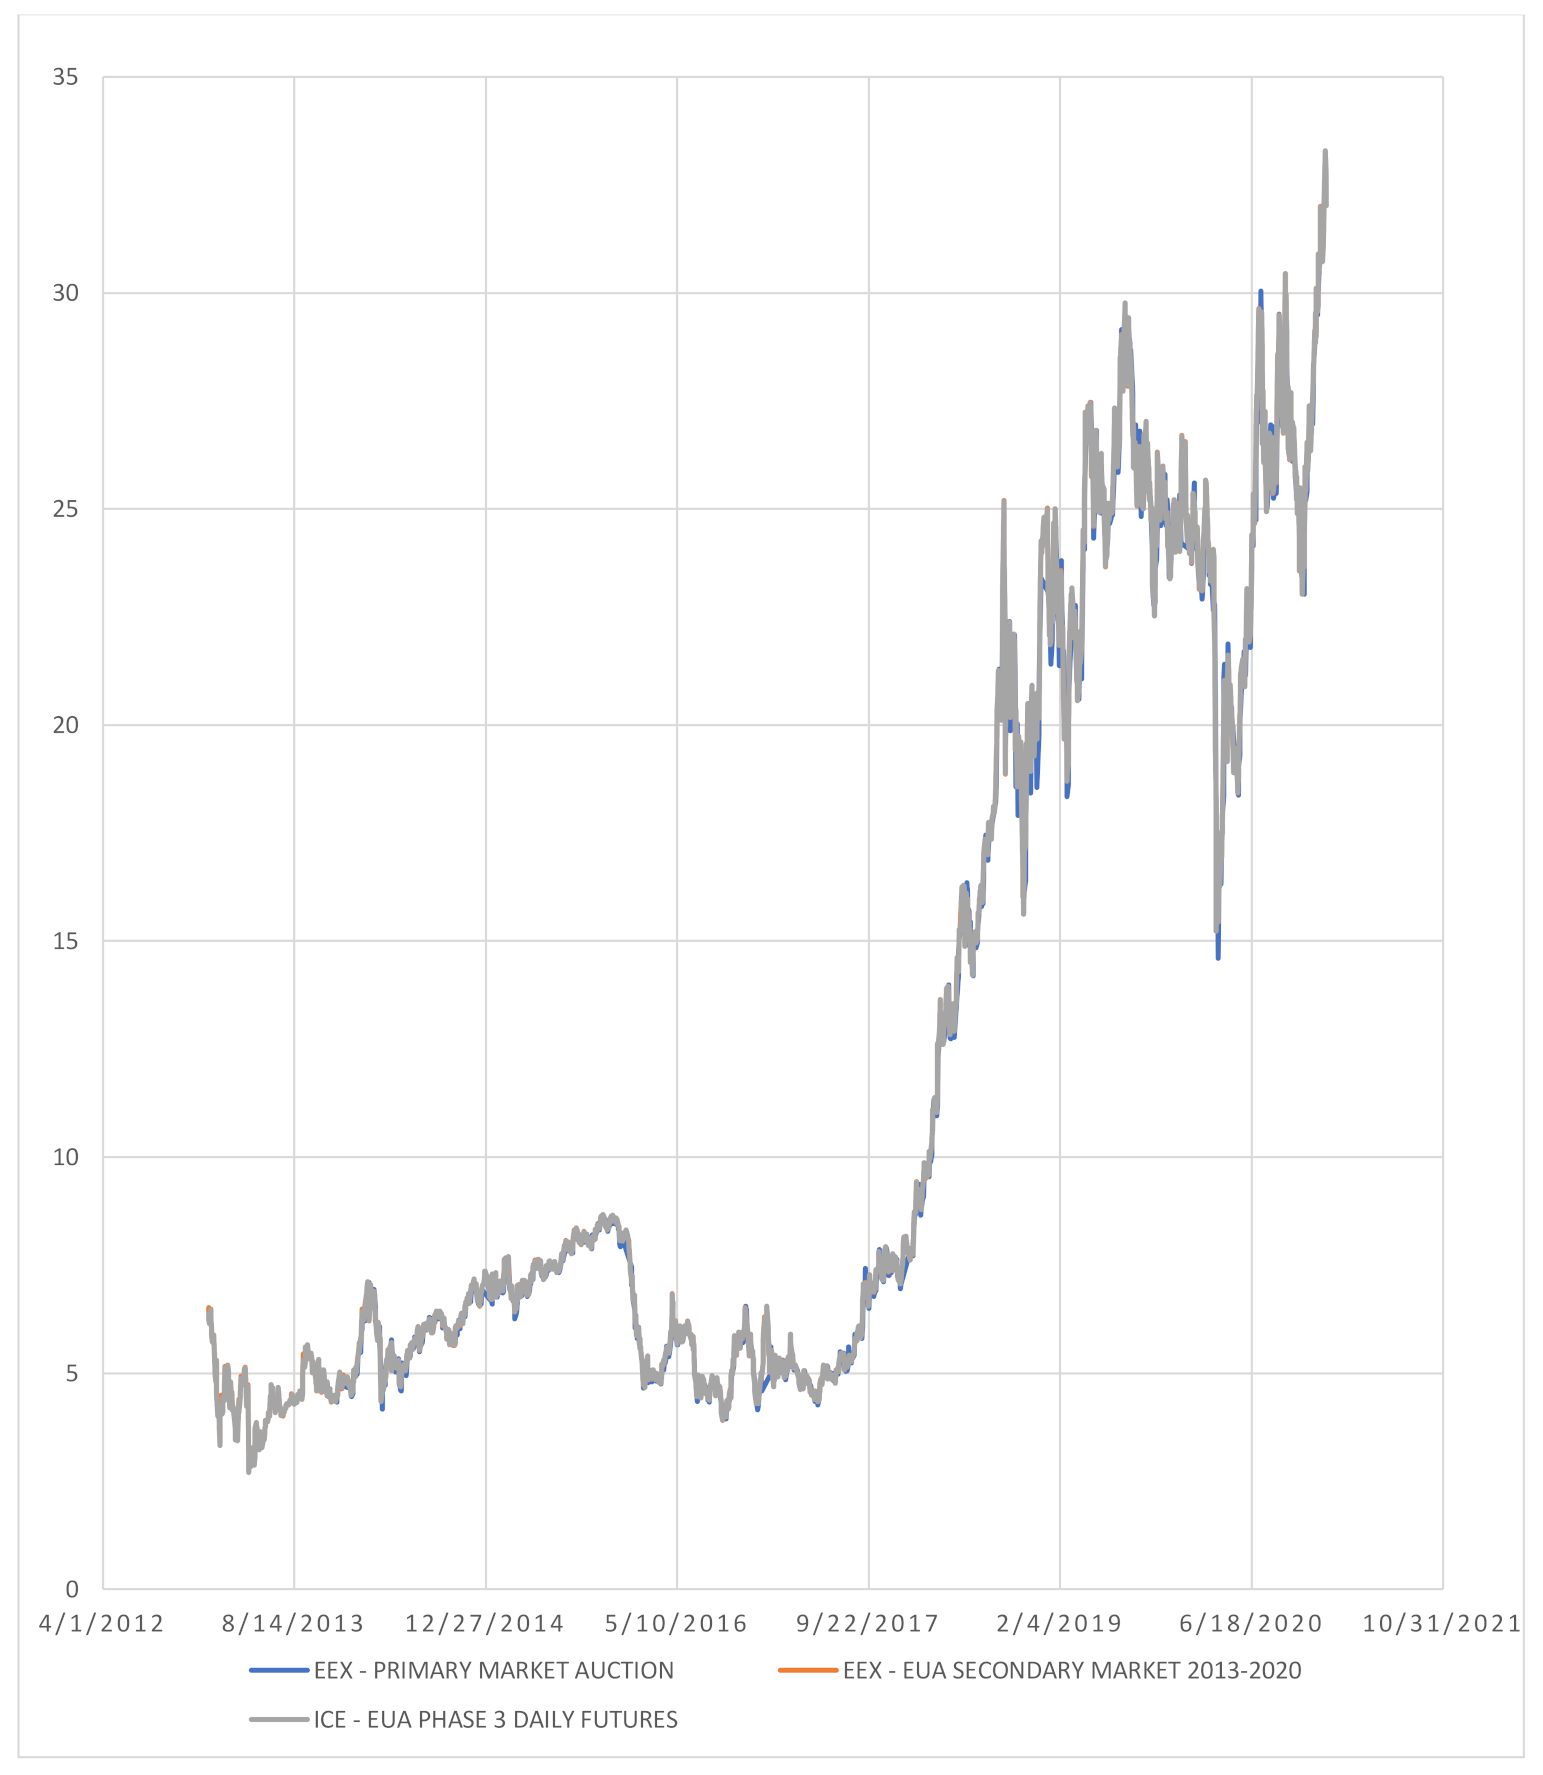
The prices of emission allowances are subject to constant fluctuations. Until 2018 (years 2012–2017), these fluctuations were in the range between 2 to 10 EUR. There was a sharp increase in the prices in 2018—up to 25 EUR. In the years 2019–2020, prices have shown a much greater amplitude of fluctuations—between 15 and 30 EUR. Details of the prices of CO2 emission allowances in 2012–2020 are shown in Figure 4.
EU allowances (EUAs) are expected to average 37.86 in 2021 and 41.61 EUR/t in 2022 [17]. In 2030 expected prices are 80 and 120 EUR/t in 2040.
As the emission allowances are an important factor of production, the prediction of their prices is crucial for many industries—both in short and in long terms. Unfortunately, according to Borak et al. [18], the literature on the EU-ETS and price behavior or hedging with CO2 spot or futures contracts is very sparse.
In the literature, we can find various models regarding directly or indirectly the CO2 emission allowance price. Two main types of models can be distinguished: Models in which the CO2 emission allowance is a determinant influencing the broadly understood energy market [19], and models where the main goal is to analyze the CO2 emission allowance price and the determinants that influence this price [20,21].
According to Bariss et al. [22] integration of energy supply within the European system aims at improving the security of power supply, but at the same time, it makes forecasting the CO2 emission (both amount and price) more complicated.
Bariss et al. [22] estimated the carbon market effect (including CO2 emissions allowance) on power prices by the method of multiple regression analysis. In those models, the CO2 emission allowance price is characterized as a “vary changing variable” so the monthly average of a daily closing price has been taken to the model. In addition, Daskalakis et al. [23] indicated that emission allowance spot prices are likely to be characterized by jumps and non-stationarity.
Boersen and Scholtens [24] investigated how electricity markets are related to CO2 emission allowance prices. They used the generalized autoregressive conditional heteroskedasticity (GARCH) model.
Criqui et al. [25] analyzed the operation of a tradable emission permit market between states in a competitive environment, the price of the permit, and the marginal abatement costs exchanges level. The POLES (Prospective Outlook on Long-term Energy Systems ) model was used. Authors confronted their research with the MIT’s Joint Program on the Science and Policy of Global Change [26], within which the general equilibrium model of global economic activity, energy use, and carbon emissions were analyzed with the usage of the emissions prediction and policy assessment (EPPA) model. In this article, two models (POLEC and EPA) were compared.
It is worth mentioning that many other researchers also constructed models for describing the emission allowance price dynamics. For example, Chesney and Taschini [27] used the model with the assumption of the potential presence of asymmetric information in the market; Benz and Trück [15] used a regime-switching model to describe the dynamics emission allowance spot prices; Chang-Yi Li et al. [20] used a regime-switching jump-diffusion model (RSJM) with a hidden Markov chain to capture not only a volatility clustering feature but also the dynamics of the spot EUA returns; Paolella and Taschini [28] used a parametric GARCH model for the analysis of emission allowance spot market returns; Carmona and Hinz [29] developed a risk-neutral reduced-form model for allowance futures prices; Isenegger et al. [30] developed models for the pricing of exotic option contracts based on observed carbon spot and futures prices. They used the standard of the GARCH model.
The above-mentioned models differ significantly from each other. They use different assumptions, different determinants (drivers), and thus different databases. They are based on a variety of econometric tools. Their goals are also varied. In the next section, groups of determinants and drivers that affect the price of CO2 emissions are identified.
3.2. Determinants for the Price of the CO2 Emission Allowances
Costs of CO2 are directly correlated with wholesale energy prices for countries based on fossil-fuels. The higher purchasing cost of CO2 means a higher cost of electricity at power exchanges. The emissivity of the generating units concerned then manifests itself in increasing CO2 costs. For example, lignite power plants emit approx. 1100, hard coal power plants approx. 930–950, and gas power plants approx. 500–600 kg/MWh. The higher the share of coal in the energy mix, the higher the purchase costs of CO2, and therefore of electricity. When adopting a long-term strategy, one should take into account the development of emission allowance prices until 2030 and 2040.
The most frequently mentioned determinants that affect CO2 emission allowance price are those connected with the electricity and resources related to the production of energy [22]. According to Boersen and Scholtens [24], nine sectors are the subject of the EU ETS (i.e., are involved in CO2 emission), but 70% of the permits go to combustion installations, mainly in the energy sector. That is why the main important determinants are those connected with electricity production, especially with the costs, such as supply and demand for energy or the prices of natural resources (coal, oil, gas).
Boersen and Scholtens [24] stated that not only are the prices of natural resources important, but also the switching possibilities between gas and coal for electricity generation.
Technologies used to produce energy in the local and regional markets are also of great importance. For example, the price of CO2 emission allowance significantly affects the production of one MWh of energy produced from hard coal, lignite, or gas, but not using the solar, biomass, or wind technology [22].
The price of CO2 emission allowance depends strictly on the demand for such emissions, and this directly depends on macroeconomic factors. The higher the global economic growth, the greater the gross domestic product growth, the decrease in unemployment, the increase in investment, etc., the higher the demand for CO2 emissions. Such research was conducted by Barassi and Spagnolo [31]. They provided some empirical evidence on the causality links between per capita CO2 emissions and economic growth both in the short and long term.
There is no consensus among researchers whether the weather affects the emission and the price of CO2 emission. Convery and Redmund [32] suggested that weather was not a major factor, in contrast with for example Rickels et al. [33] and Alberola et al. [34]. For them, low temperatures determine the demand for power, as well as for CO2 emission allowance.
Not only market factors, such as energy production costs or production factors prices, affect the prices of CO2 emission. Institutional factors are equally important determinants. Benz and Trück [9] categorize the principal determinants for market and institutional ones (policy and regulatory issues). The supply of CO2 allowances depends on policymakers and their political decisions.
For some researchers [35] due to the strong financialization of the market, the CO2 emission allowance becomes a financial instrument and their prices depend on the situation on the financial market. Since the financial crisis of 2007–2008, the majority of the investment banks do not trade physical energy commodities as they used to do before. However, they are allowed to trade financial products such as CO2 emissions.
Taking into account the case of Poland, Krawiec [36] analyzed the monthly reports of the National Center for Balancing and Management of Emissions for 2013–2016. The analysis showed that the most common growth factors in the price of allowances in Poland were:
- -
- Increase in prices of energy carriers;
- -
- Increase in electricity prices;
- -
- Good situation on financial markets;
- -
- Favorable macroeconomic situation;
- -
- The approaching end of the billing period;
- -
- Plans to increase emission reductions (tightening reduction targets);
- -
- Lower supply of energy from renewable sources;
- -
- Reduction of subsidy for renewable energy;
- -
- Higher costs of reducing CO2 emissions (including replacement costs low-emission);
- -
- Weather conditions (e.g. extreme temperatures, such as hot summers, cold winters) translating into the demand for electricity (cooling/heating);
- -
- The introduction of backloading options/introduction of MSR (Market Stability Reserve);
- -
- Reduction of the number of auctions;
- -
- Delay in issuing free allowances/reduction of the pool of free allowances.
In conclusion, the drivers that affect the price of CO2 emission allowance can be divided into the following groups:
- -
- Electricity production costs;
- -
- Energy price;
- -
- Fossil fuel price;
- -
- Technologies for power production;
- -
- Demand and supply of electricity;
- -
- Macroeconomic factors;
- -
- Financial factors;
- -
- Institutional issues (policy and regulatory issues);
- -
- Weather condition.
A complete analysis of the groups of factors and individual drivers that determine the CO2 emission allowances price is presented in Table 3.
The literature analysis identified the main factors that influence the price changes of both energy and CO2 EA prices. The analysis of those factors can constitute the basis for identifying the challenges faced by both Polish and Eastern European energy companies. The inclusion of those factors in the companies’ strategies may determine the competitiveness of these companies in the European market. However, this analysis prompted several reflections:
- (1)
- Most of the factors can be classified as external ones, i.e., those to which the company has to adapt; however, there is no great possibility of influencing them. Such determinants include especially those related to macroeconomic and institutional factors;
- (2)
- It draws attention to the fact that although the drivers include those related to the weather, climate change—one of the main problems of the modern world—was not directly among the problems considered to energy prices and CO2 EA prices. This factor seems to be definitely underestimated;
- (3)
- It is also characteristic that many drivers/events that lead to the displayed price development are characterized not by a predictable factor, but rather by a “black swan” factor. The COVID-19 pandemic has shown this. The pandemic lockdown has unexpectedly changed energy demand. Such “black swans” can also be violent weather phenomena related to climate change, political phenomena related, e.g., to trade wars between superpowers on world markets, or technological changes. This is an extremely difficult challenge for companies in the energy sector.
4. Case Study of PKN Orlen
PKN Orlen, which is listed at Global 500, is the largest capital group in the “oil and gas” sector that comes from Central and Eastern Europe. In 2019, company revenues amounted to 28,977 million USD and the profit reached 1120.5 million USD [61].
The ORLEN Group operates on six home markets which are Poland, the Czech Republic, Germany, Lithuania, Slovakia, and Canada. The concern is vertically integrated and is exposed to fluctuations in prices of several energy commodities that include crude oil, petroleum products, natural gas, CO2, electricity, coal, property rights, biomass.
Currently, PKN ORLEN owns combined heat and power units in Płock and Włocławek. Additionally, it has taken over the energy company “Energa”, as well as its plans of acquiring Lotos [62] and PGNiG [63] in the nearest future. From the managerial point of view, these acquisitions will be an important step to build a single multi-utility group with a strong position in Europe and global coverage. Taking into account the pan-European market, several key financial hubs where transactions on the CO2 market are made can be distinguished. The most important of them are London, Amsterdam, and Geneva, followed by Dusseldorf and Frankfurt. As presented above, Polish energy companies and especially PKN ORLEN have an increasing share in the emission of CO2 in the European market. Due to the fact that other countries, such as Germany, the Netherlands, and Italy, are rapidly moving away from fossil fuel-fired sources, the share of the Polish energy sector will increase in the nearest future. It can be predicted that in the years 2030-2035 it will reach over 20% and after 2040 it will be nearly 30–40% of the EU ETS market [16].
As part of its strategy, PKN Orlen will seek to cut the carbon dioxide (CO2) emissions from its current refining and petrochemical assets by 20% and emissions of CO2/MWh from power generation by 33% by 2030, as well as it has aspirations to achieve emission neutrality by 2050 [63].
In the nearest future, PKN ORLEN will have an emission efficiency of 30–40 million tons of allowances per year. With a cost of 30 EUR/tone, the total portfolio may reach 1.2 or 2.5 billion EUR if the issue price in 2030 is 60 EUR/tone. The key issue that should be addressed by the group is how to manage the first-degree margin in the case of generation (gas, coal) and how to buy emission allowances in the cheapest way.
The key players on the market of allowances for emitting carbon dioxide and other greenhouse gases market can be divided into two categories: Utilities and investment banks. This market has a kind of duality. Firstly, one can distinguish the physical CO2 emission allowances (property rights) that the issuers have to surrender each year. Secondly, there is a whole financial market based on SPOT quotations for physical allowances. It has to be mentioned that there are two main exchanges for these allowances which are intercontinental exchange (ICE) and European energy exchange (EEX). Additionally, there is an over-the-counter OTC market with investment banks. Large investment banks may have open positions reaching even 300–500 million tons of allowances, which is roughly the same as the 10-year demand for allowances of PKN Orlen or Polska Grupa Energetyczna SAPGE. From the point of view of energy companies operating in the region of Central and Eastern Europe, it is difficult to gain a competitive advantage in purchasing allowances without the presence of key hubs. For example, large Polish energy groups should have trading companies at least in London, Amsterdam, and Geneva. That is why a huge challenge for PKN ORLEN will be to create such a business entity.
From PKN ORLEN and other Polish energy groups’ perspective, managing the trade and purchase of emission allowances will become key factors affecting their profitability. The indicator that measures the profit of a coal plant is the generation margin called a market spread or clean dark spread (CDS). Coal plant generation margins, commonly referred to as clean dark spread (CDS) or clean spark spread, are driven by the premium of power prices over plant variable operating costs. Variable costs are driven by coal and carbon prices as well as the cost of CO2 emissions. It means that the cost of CO2 emissions is a crucial factor affecting the margin of Polish energy groups.
Typically, the commercial strategy of energy groups is based on the simultaneous sale of electricity and the purchase of emission allowances and fuel. However, there are strategies for delaying or accelerating the purchase of emission allowances. For example, it is possible to purchase 10% of the portfolio of emission allowances a few months earlier if the price is low enough. It has to be mentioned that energy companies in the majority of cases realize these actions through dedicated trading companies, such as Enea Trading Sp. z o.o. in Poland. Each trading company has departments that deal with financial risk as well as a trading department that is divided into individual boards. In most cases, the trader has a trading specialization (commodity), such as coal, natural gas, CO2, and electricity. From a risk management perspective, asset-backed trading should be separated from proprietary trading, which is necessary from the point of view of asset management. This is due to several factors. Firstly, when trading for own account, the trader should anticipate the movements of the competition as well as forecast prices. It has to be underlined that there are psychological differences between speculative trade seeking hedging or speculative gains and trade that has non-speculative reasons [64]. Secondly, the goal of the proprietary trading team is to gain knowledge about competitors on the market and to predict prices. As a result thanks to speculative trading, better forecasts can be built for teams trading capital group assets.
To conclude, after the acquisitions, PKN ORLEN should centralize its commercial activities for the entire group, including Lotos and PGNiG in one trading company. Considering the fact the company operates in the area of crude oil and natural gas, the trading company (or trading branch) should be registered for example in Geneva which remains a trading hub for crude oil. Another crucial issue for PKN ORLEN will be to predict the changes in the price of emission allowances for the needs of trading because these prices are the key factor affecting generation margin.
5. Conclusions
Summarizing this article, it should be stated that the role and importance of emissions trading for companies emitting CO2 grows with the increase in the cost per MWh. There are three major challenges related to emission trading from electric power utility points of view: Pricing models, qualified traders, location, and organizational structure, as well as lobbying staff.
First of all, as was highlighted in the article, pricing models are an important issue. Major price drivers are linked to regulations given by the European Commission. Pricing the CO2 market is mostly related to financial derivatives of pricing models. As discussed in the article, predicting the changes of the price of emission allowances for the needs of trading is a very complex process that requires the identification of many determinates that affect this price as well as a quick reaction to their changes. That is why future research should focus on statistical methods such as the latent root analysis to identify the components affecting the allowance price.
Secondly, one of the most important aspects is the human factor. Traders who have a deep understanding of the market and experience in carbon emissions trading are a key point for being successful in hedging margins in the electricity market. There are not many potential employees in the CEE region who are familiar at the same time with proprietary trading and hedging strategies in this particular commodity.
The third challenge is directly related to environmental product trading hubs in Europe and organizational structure. As was highlighted, there is more than one trading location which important in CO2 trading. The company should be located at least in Geneva, London, and Amsterdam with small local originators. The organizational structure should be smart and flexible to respond fast. Having a team of experienced staff in the CO2 area can be decisive in gaining a competitive advantage for energy companies.
Author Contributions
Conceptualization, D.C.-M., D.K. and M.S.-L.; methodology, D.C.-M., M.S.-L., validation, D.C.-M., D.K. and M.S.-L., formal analysis, D.C.-M., D.K. and M.S.-L.; investigation, D.K., M.S.-L.; writing—original draft preparation, D.C.-M., D.K. and M.S.-L.; All authors have read and agreed to the published version of the manuscript.
Funding
This research received no external funding.
Data Availability Statement
Not applicatable.
Conflicts of Interest
The authors declare no conflict of interest.
References
- EU ETS Handbook, European Commission. 2010. Available online: https://ec.europa.eu/clima/sites/clima/files/docs/ets_handbook_en.pdf (accessed on 20 November 2020).
- EU Commission, Report on the Functioning of the European Carbon Market, Brussels. 2020. Available online: https://ec.europa.eu/clima/sites/clima/files/news/docs/com_2020_740_en.pdf (accessed on 20 November 2020).
- Anger, N. Emission trading beyond Europe: Linking schemes in a Post-Kyoto World. Energy Econ. 2006, 30, 2028–2049. [Google Scholar] [CrossRef]
- Benz, E.; Trück, S. Modeling the price dynamics of CO2 emission allowances. Energy Econ. 2009, 31, 4–15. [Google Scholar] [CrossRef]
- Christiansen, A.; Arvanitakis, A.; Tangen, K.; Hasselknippe, H. Price determinants in the EU emissions trading scheme. Clim. Policy 2019, 5, 15–30. [Google Scholar] [CrossRef]
- Egenhofer, C. The making of the EU emissions trading scheme: Status, prospects and implications for business. Eur. Manag. J. 2007, 25, 453–463. [Google Scholar] [CrossRef]
- Uhrig-Homburg, M.; Wagner, M. Derivative instruments in the EU emissions trading scheme: An early market perspective. Energy Environ. 2008, 19, 635–655. [Google Scholar] [CrossRef]
- Carmona, R.; Fehr, M.; Hinz, J.; Porchet, A. Market design for emission trading schemes. SIAM Rev. 2010, 52, 403–452. [Google Scholar] [CrossRef] [Green Version]
- Jiménez-Rodríguez, R. What happens to the relationship between EU allowances prices and stock market indices in Europe? Energy Econ. 2019, 81, 13–24. [Google Scholar] [CrossRef]
- Chevallier, J.; Nguyen, D.K.; Reboredo, J.C. A conditional dependence approach to CO2-energy price relationships. Energy Econ. 2019, 81, 812–821. [Google Scholar] [CrossRef]
- Guðbrandsdóttir, N.H.; Haraldsson, H.O. Predicting the price of EU ETS carbon credits. Syst. Eng. Procedia 2011, 1, 481–489. [Google Scholar] [CrossRef] [Green Version]
- European Environment Agency. Available online: https://europa.eu/european-union/about-eu/agencies/eea_pl (accessed on 20 November 2020).
- Eurostat Database. Available online: https://ec.europa.eu/eurostat/data/database (accessed on 16 February 2020).
- Healy, S.; Graichen, V.; Graichen, J.; Nissen, C.; Gores, S.; Siemons, A. Trends and projections in the EU ETS in 2019, The EU Emissions Trading System in Numbers, European Topic Centre on Climate Change Mitigation and Energy. 2019. Available online: https://www.eionet.europa.eu/etcs/etc-cme/products/etc-cme-reports/etc-cme-report-3-2019-trends-and-projections-in-the-eu-ets-in-2019 (accessed on 20 November 2020).
- Benz, E.; Trück, S. CO2 emission allowances trading in Europe—Specifying a new class of assets. Probl. Perspect. Manag. 2006, 4, 30–40. [Google Scholar]
- CIRE. Available online: https://www.cire.pl (accessed on 20 November 2020).
- Reuters. Available online: https://www.reuters.com/article/us-eu-carbon-poll-idUSKBN2711HK (accessed on 25 November 2020).
- Borak, S.; Härdle, W.K.; Trück, S.; Weron, R. Convenience Yields for CO2 Emission Allowance Futures Contracts; SFB 649 Discussion Paper, No. 2006; SSRN: Rochester, NY, USA, 2006. [Google Scholar]
- Paramati, S.R.; Mo, D.; Gupta, R. The effects of stock market growth and renewable energy use on CO2 emissions: Evidence from G20 countries. Energy Econ. 2017, 66, 360–371. [Google Scholar] [CrossRef]
- Chang-Yi, L.; Son-Nan, C.; Shih-Kuei, L. Pricing derivatives with modeling CO2 emission allowance using a regime-switching jump diffusion model: With regime-switching risk premium. Eur. J. Financ. 2016, 22, 887–908. [Google Scholar]
- Seifert, J.M.; Uhrig-Homburg, M.; Wanger, M. Dynamic behavior of CO2 spot prices. J. Environ. Econ. Manag. 2008, 56, 180–194. [Google Scholar] [CrossRef]
- Bariss, U.; Avenitis, E.; Junghans, G.; Blumberga, D. CO2 emission trading effect on baltic electricity market. Energy Procedia 2016, 95, 58–65. [Google Scholar] [CrossRef] [Green Version]
- Daskalakis, G.; Psychoyios, D.; Markellos, R.N. Modeling CO2 Emission allowance prices and derivatives: Evidence from the European trading scheme. J. Bank. Financ. 2009, 33, 1230–1241. [Google Scholar] [CrossRef]
- Boersen, A.; Scholtens, B. The relationship between European electricity markets and emission allowance futures prices in phase II of the EU (European Union) emission trading scheme. Energy 2014, 74, 585–594. [Google Scholar] [CrossRef]
- Criqui, P.; Silvana, M.; Laurent, V. Marginal abatement costs of CO2, emission reductions, geographical flexibility and concrete ceilings: An assessment using the POLES model. Energy Policy 1999, 27, 585–601. [Google Scholar] [CrossRef]
- Ellerman, A.D.; Decaux, A. Analysis of Post-Kyoto CO2 Emissions Trading Using Marginal Abatement Curves; Joint Program Report Series Report 40; Massachusetts Institute of Technology: Cambridge, MA, USA, 1998; pp. 1–24. [Google Scholar]
- Chesney, M.; Taschini, L. The endogenous price dynamics of emission allowances and an application to CO2 option pricing. Appl. Math. Financ. 2012, 19, 447–475. [Google Scholar] [CrossRef] [Green Version]
- Paolella, M.; Taschini, L. An econometric analysis of emission trading allowances. J. Bank. Financ. 2008, 32, 2022–2032. [Google Scholar] [CrossRef] [Green Version]
- Carmona, R.; Hinz, J. Risk-neutral models for emission allowance prices and option valuation. Manag. Sci. 2011, 57, 1453–1468. [Google Scholar] [CrossRef] [Green Version]
- Isenegger, P.; Wyss, R.; Marquardt, S. The Valuation of Derivatives on Carbon Emission Certificates; Working Paper; Swiss CFA Society: Zug, Switzerland, 2013. [Google Scholar]
- Barassi, M.; Spagnolo, N. Linear and non-linear causality between CO2 emissions and economic growth. Energy J. 2012, 233, 23–38. [Google Scholar] [CrossRef]
- Convery, F.J.; Redmond, L. Market and price developments in the European Union emissions trading scheme. Rev. Environ. Econ. Policy 2007, 1, 88–111. [Google Scholar] [CrossRef]
- Rickels, W.; Georlich, D.; Oberst, G. Explaining European Emission Allowance Price Dynamics: Evidence from Phase; Kiel Working Paper No. 1650; Kiel Institute for the World Economy: Kiel, Germany, 2010. [Google Scholar]
- Alberola, E.; Chevallier, J.; Cheze, B. Price drivers and structural breaks in European carbon prices 2005–2007. Energy Policy 2008, 36, 787–797. [Google Scholar] [CrossRef]
- Lovcha, Y.; Perez-Laborda, A.; Sikora, I. The Determinants of CO2 Prices in the EU ETS System; Working Papers 2072/376031; Universitat Rovira i Virgili: Tarragona, Spain, 2019. [Google Scholar]
- Krawiec, W. Determinanty cen uprawnień do emisji CO2 na rynku europejskim w latach 2013–2016. Finanse, Rynki Finansowe Ubezpieczenia 2017, 2, 231–239. [Google Scholar] [CrossRef]
- Chung, C.; Jeong, M.; Young, J. The price determinants of the EU Allowance in the EU emissions trading scheme. Sustainability 2018, 10, 4009. [Google Scholar] [CrossRef] [Green Version]
- Böing, F.; Regett, A. Hourly CO2 emission factors and marginal costs of energy carriers in future multi-energy systems. Energies 2019, 12, 2260. [Google Scholar] [CrossRef] [Green Version]
- Hammoudeh, S.; Nguyen, D.K.; Sousa, R.M. Energy prices and CO2 emission allowance prices: A quantile regression approach. Energy Policy 2014, 70, 201–206. [Google Scholar] [CrossRef] [Green Version]
- Bredin, D.; Muckley, C. An emerging equilibrium in the EU emissions trading scheme. Energy Econ. 2011, 33, 353–362. [Google Scholar] [CrossRef]
- Reinaud, J. CO2 Allowance & Electricity Price Interaction; IEA: Paris, France, 2007. [Google Scholar]
- Bunn, D.W.; Fezzi, C. Interaction of European Carbon Trading and Energy Prices; Working Paper No. 63; FEEM: Milano, Italy, 2007. [Google Scholar]
- Keppler, J.H.; Mansanet-Bataller, M. Causalities between CO2, electricity, and other energy variables during phase I and phase II of the EU ETS. Energy Policy 2010, 38, 3329–3341. [Google Scholar] [CrossRef] [Green Version]
- Sadorsky, P. Correlations and volatility spillovers between oil prices and the stock prices of clean energy and technology companies. Energy Econ. 2012, 34, 248–255. [Google Scholar] [CrossRef]
- García-Martos, C.; Rodríguez, J.; Sánchez, M.J. Modelling and forecasting fossil fuels, CO2 and electricity prices and their volatilities. Appl. Energy 2013, 101, 363–375. [Google Scholar] [CrossRef] [Green Version]
- Mansanet-Bataller, M.; Pardo, A.; Valor, E. CO2 prices, energy and weather. Energy J. 2007, 28, 67–86. [Google Scholar] [CrossRef]
- Chevallier, J. Carbon futures and macroeconomic risk factors: A view from the EU ETS. Energy Econ. 2009, 31, 614–625. [Google Scholar] [CrossRef]
- Lin, B.; Jia, Z. Impacts of carbon price level in carbon emission trading market. Appl. Energy 2019, 239, 157–170. [Google Scholar] [CrossRef]
- Tucki, K.; Orynycz, O.; Świć, A.; Mitoraj-Wojtanek, M. The development of electromobility in poland and EU States as a tool for management of CO2 emissions. Energies 2019, 12, 2942. [Google Scholar] [CrossRef] [Green Version]
- Wagner, M.W.; Uhrig-Homburg, M. Futures price dynamics of CO2 emission certificates—An empirical analysis. J. Deriv. 2006, 17, 73–88. [Google Scholar]
- Hintermann, B. Allowance price drivers in the first phase of the EU ETS. J. Environ. Econ. Manag. 2010, 59, 43–56. [Google Scholar] [CrossRef] [Green Version]
- Gorenflo, M. Futures price dynamics of CO2 emission allowances. Empir. Econ. 2013, 45, 1025–1047. [Google Scholar] [CrossRef]
- Dasgupta, S.; Laplante, B.; Mamingi, N. Pollution and capital markets in developing countries. J. Environ. Econ. Manag. 2001, 42, 310–335. [Google Scholar] [CrossRef]
- Niblock, S.; Harrison, J. Do dynamic linkages exist among European carbon markets? Int. Bus. Econ. Res. J. 2012, 11, 33–44. [Google Scholar] [CrossRef] [Green Version]
- Ozturk, I.; Acaravci, A. The long-run and causal analysis of energy, growth, openness and financial development on carbon emissions in Turkey. Energy Econ. 2013, 36, 262–267. [Google Scholar] [CrossRef]
- Shahbaz, M.; Hye, Q.M.A.; Tiwari, A.K.; Leitão, N.C. Economic growth, energy consumption, financial development, international trade and CO2 emissions in Indonesia. Renew. Sustain. Energy Rev. 2013, 25, 109–121. [Google Scholar] [CrossRef] [Green Version]
- Zhang, Y. The impact of financial development on carbon emissions: An empirical analysis in China. Energy Policy 2011, 39, 2197–2203. [Google Scholar] [CrossRef]
- Conrad, C.; Rittler, D.; Rotfuss, W. Modeling and explaining the dynamics of European Union allowance prices at high-frequency. Energy Econ. 2012, 34, 316–326. [Google Scholar] [CrossRef] [Green Version]
- De Perthuis, C.; Trotignon, R. Governance of CO2 markets: Lessons from the EU ETS. Energy Policy 2014, 75, 100–106. [Google Scholar] [CrossRef] [Green Version]
- Kim, H.; Kim, M.; Kim, H.; Park, S. Decomposition analysis of CO2 emission from electricity generation: Comparison of OECD countries before and after the financial crisis. Energies 2020, 13, 3522. [Google Scholar] [CrossRef]
- Fortune. 2020. Available online: https://fortune.com/fortune500/ (accessed on 23 December 2020).
- EU Commission. Available online: https://ec.europa.eu/commission/presscorner/detail/en/IP_20_1346 (accessed on 27 December 2020).
- PKN ORLEN. Available online: https://www.orlen.pl/EN/InvestorRelations/Pages/default.aspx (accessed on 27 December 2020).
- Barberis, N. Psychology-based models of asset prices and trading volume. In Handbook of Behavioral Economics: Applications and Foundations; Elsevier: Amsterdam, The Netherlands, 2018; Volume 1, pp. 79–175. [Google Scholar]
Figure 1.
Greenhouse gas emission targets and trends for the EU-28 Member States (EU-28 and after 2020 EU-27) according to MMR (Monitoring Mechanism Regulation)projections (million tonnes of CO2). Source: European Environment Agency (EEA) (2020).
Figure 1.
Greenhouse gas emission targets and trends for the EU-28 Member States (EU-28 and after 2020 EU-27) according to MMR (Monitoring Mechanism Regulation)projections (million tonnes of CO2). Source: European Environment Agency (EEA) (2020).

Figure 2.
Greenhouse gases—total (CO2, N2O in CO2 equivalent, CH4 in CO2 equivalent, HFC in CO2 equivalent, PFC in CO2 equivalent, SF6 in CO2 equivalent, NF3 in CO2 equivalent) (thousand tonnes of CO2). Source: Own calculations based on Eurostat database (2020).
Figure 2.
Greenhouse gases—total (CO2, N2O in CO2 equivalent, CH4 in CO2 equivalent, HFC in CO2 equivalent, PFC in CO2 equivalent, SF6 in CO2 equivalent, NF3 in CO2 equivalent) (thousand tonnes of CO2). Source: Own calculations based on Eurostat database (2020).

Figure 3.
Greenhouse gases—energy (CO2, N2O in CO2 equivalent, CH4 in CO2 equivalent, HFC (Hydrofluorocarbon) in CO2 equivalent, PFC (Perfluorocarbons) in CO2 equivalent, SF6 in CO2 equivalent, NF3 in CO2 equivalent) in thousand tonnes. Source: own calculations based on Eurostat database (2020).
Figure 3.
Greenhouse gases—energy (CO2, N2O in CO2 equivalent, CH4 in CO2 equivalent, HFC (Hydrofluorocarbon) in CO2 equivalent, PFC (Perfluorocarbons) in CO2 equivalent, SF6 in CO2 equivalent, NF3 in CO2 equivalent) in thousand tonnes. Source: own calculations based on Eurostat database (2020).

Figure 4.
The prices of CO2 emission allowances in 2012–2020 (EUR/t). Source: own analysis based on the data from CIRE, https://www.cire.pl/ [16].
Figure 4.
The prices of CO2 emission allowances in 2012–2020 (EUR/t). Source: own analysis based on the data from CIRE, https://www.cire.pl/ [16].


Table 1.
Greenhouse gases—total and in energy sector (CO2, N2O in CO2 equivalent, CH4 in CO2 equivalent, HFC in CO2 equivalent, PFC in CO2 equivalent, SF6 in CO2 equivalent, NF3 in CO2 equivalent) in thousand tonnes.
Table 1.
Greenhouse gases—total and in energy sector (CO2, N2O in CO2 equivalent, CH4 in CO2 equivalent, HFC in CO2 equivalent, PFC in CO2 equivalent, SF6 in CO2 equivalent, NF3 in CO2 equivalent) in thousand tonnes.
| Year | 2010 | 2011 | 2012 | 2013 | 2014 | 2015 | 2016 | 2017 | 2018 |
|---|---|---|---|---|---|---|---|---|---|
| Total | |||||||||
| EU | 4464 048 | 4308 864 | 4244 734 | 4145 286 | 3990 237 | 4033 917 | 4013 970 | 4063 118 | 3953 006 |
| CEE | 18% | 19% | 18% | 18% | 19% | 19% | 20% | 20% | 20% |
| Poland | 8% | 9% | 9% | 9% | 9% | 9% | 9% | 9% | 9% |
| Energy | |||||||||
| EU | 3807 924 | 3657 507 | 3614 453 | 3521 931 | 3337 425 | 3377 394 | 3356 515 | 3362 611 | 3279 195 |
| CEE | 19% | 20% | 19% | 19% | 20% | 20% | 20% | 21% | 21% |
| Poland | 9% | 9% | 9% | 9% | 9% | 9% | 10% | 10% | 10% |
Source: Own calculations based on Eurostat database (2020).
Table 2.
Power plants from CEE countries that were among the 30 highest emitting power plants in the EU in 2018.
Table 2.
Power plants from CEE countries that were among the 30 highest emitting power plants in the EU in 2018.
| Power Plant | Fuel | Installed Capacity 2018 (MV) | Verified Emissions 2018 Mt CO2 | Verified Emissions 2018 vs. 2017 (%) |
|---|---|---|---|---|
| Bełchatów (PL) | Lignite | 5472 | 38.3 | 2% |
| Kozienice (PL) | Hard coal | 2941 | 9.7 | −13% |
| Maritsa East 2 (BG) | Lignite | 1604 | 9.6 | −9% |
| Połaniec (PL) | Hard coal | 1882 | 8.2 | 17% |
| Narva (EE) | Oil Shale | 1369 | 7.8 | −7% |
| Opole (PL) | Hard coal | 1532 | 7.5 | 19% |
| Turów (PL) | Lignite | 1488 | 6.9 | −3% |
| CEZ a.s. (CZ) | Lignite | 930 | 5.5 | −2% |
| Oddział w Rybniku (PL) | Hard coal | 1790 | 5.2 | −19% |
| Mátrai Eromu ZRt (HU) | Lignite, Natural Gas | 950 | 5.2 | −9% |
Source: Healy; Graichen; Graichen; Nissen; Gores; Siemons. Trends and projections in the EU Emissions Trading Scheme (ETS) in 2019, the EU Emissions Trading System in numbers, and European Topic Centre on Climate Change Mitigation and Energy, 2019.
Table 3.
Determinants and drivers of the CO2 emission allowances price according to conducted literature review.
Table 3.
Determinants and drivers of the CO2 emission allowances price according to conducted literature review.
| Group of Determinants | Drivers | Example of References |
|---|---|---|
| Electricity production costs | Price of technologies Price of resources Marginal energy carrier costs | Bariss et al. [22] Boersen and Scholtens [24] Chung et al. [37] Böing and Regett [38] |
| Energy price | Global and local relations between energy supply and energy demand Local energy taxes | Hammoudeh [39] Bredin and Muckley [40] Reinaud [41] Bunn [42] Keppler [43] Sadorsky [44] García–Martos et al. [45] |
| Fossil fuel price | Price of carbon Price of oil Price of gas The switching possibilities between gas and coal for electricity generation | Bariss et al. [22] Boersen and Scholtens [24] Mansanet–Bataller, Pardo, Valor [46] Chevallier and Carbon [47] Rickels et al. [33] Convery and Redmund [32] Chung et al. [38] Seifert et al. [21] Lin and Jia [48] |
| Technologies for power production | Share of electricity production technologies (fossil fuel versus hydro, nuclear, wind, solar, biomass) Electromobility Investments in the energy sector | Bariss et al. [22] Tucki et al. [49] |
| Demand and supply of electricity | Internal (regional or local) demand and supply of electricity The seasonal and daily variations of supply and demand | Bariss et al. [22] Seifert et al. [21] Wagner and Uhrig–Homburg [50] |
| Macroeconomic factors | Economic indicators, e.g., GDP, consumption, unemployment rate, investments, stock market growth | Barassi and Spagnolo [31] Hintermann [51] Chung et al. [38] Seifert et al. [21] Benz and Trück [4] Paramati [19] |
| Financial factors | Relationship between spot and futures prices returns from various financial investments financialization of the market, e.g., Nordpool and APX-UK spot prices | Benz and Trück [4] Lovcha et al. [35] Gorenflo [52] Dasgupta et al. [53] Niblock and Harrison [54] Ozturk and Acaravci [55] Shahbaz et al. [56] Zhang [57] |
| Institutional issues (policy and regulatory issues) | State subsidy schemes for power–law system regulations, transaction costs, certified emission reduction, emission of CO2 rate, uncertainties in international agreements, market stability reserve, decisions of the European Commission (e.g., on National Allocation Plans), explicit trading rules (e.g., intertemporal trading), the linkage of the EU ETS with the market of project-based mechanisms | Ellerman et al. [26] Chung et al. [38] Seifert et al. [21] Krawiec [36] Boersen and Scholtens [24] Conrad et al. [58] Benz and Trück [4] De Perthuis and Trotignon [59] Kim et al. [60] |
| Weather | Atmospheric conditions: Temperature, precipitation, windiness (wind force) | Rickels et al. [33] Alberola et al. [34] Hintermann [52] Seifert et al. [21] |
Source: Own study.
Publisher’s Note: MDPI stays neutral with regard to jurisdictional claims in published maps and institutional affiliations. |
© 2021 by the authors. Licensee MDPI, Basel, Switzerland. This article is an open access article distributed under the terms and conditions of the Creative Commons Attribution (CC BY) license (http://creativecommons.org/licenses/by/4.0/).
Share and Cite
MDPI and ACS Style
Ciesielska-Maciągowska, D.; Klimczak, D.; Skrzek-Lubasińska, M. Central and Eastern European CO2 Market—Challenges of Emissions Trading for Energy Companies. Energies 2021, 14, 1051. https://0-doi-org.brum.beds.ac.uk/10.3390/en14041051
AMA Style
Ciesielska-Maciągowska D, Klimczak D, Skrzek-Lubasińska M. Central and Eastern European CO2 Market—Challenges of Emissions Trading for Energy Companies. Energies. 2021; 14(4):1051. https://0-doi-org.brum.beds.ac.uk/10.3390/en14041051
Chicago/Turabian StyleCiesielska-Maciągowska, Dorota, Dawid Klimczak, and Małgorzata Skrzek-Lubasińska. 2021. "Central and Eastern European CO2 Market—Challenges of Emissions Trading for Energy Companies" Energies 14, no. 4: 1051. https://0-doi-org.brum.beds.ac.uk/10.3390/en14041051
Note that from the first issue of 2016, this journal uses article numbers instead of page numbers. See further details here.