1. Introduction
Interest in developing clean and efficient internal combustion engines is still significant into reducing CO
2 and pollutant emissions from the transport sector, with reference to both spark-ignition and compression-ignition technologies [
1].
With specific focus on the latter technology, diesel engines still remain the most competitive solution for several applications, such as light-duty and heavy-duty transport and agricultural machines, and, therefore, research efforts in improving their environmental impact are still ongoing.
Recently developed technologies to reduce CO
2 and pollutant emissions from diesel engines include downsizing [
2], alternative fuels [
3], advanced combustion [
4,
5] and injection systems [
6], control algorithms [
7,
8,
9,
10], innovative ATS (after-treatment systems) [
11], and recovery of thermal energy [
12].
Among the previous solutions, model-based control of the performance, combustion, and emission formation processes will surely provide a significant contribution in the future for several reasons. First, this technique is suitable to be integrated with the V2X (vehicle-to-everything) and autonomous driving systems [
8,
13,
14,
15]. As a matter of fact, a model-based controller can allow a real-time engine optimization to be realized, also exploiting the traffic information and knowledge of the vehicle driving mission in advance by means of look-ahead functions [
14]. Secondly, an onboard engine control is particularly attractive in hybrid electric powertrains, whose market is significantly increasing in the last few years, since the engine operating point can also vary significantly during the vehicle mission as a consequence of the optimization of the power split. Therefore, it is of crucial importance to limit the pollutant emissions and optimize the engine combustion process in conjunction with the optimization of the energy flows that are delivered by the powertrain. Finally, model-based engine controllers will be enhanced by the increasing the computational performance of the vehicle control units, providing significant benefits, especially for diesel engines, whose management is typically more complex than that of spark ignition engines.
An example of the advantage of integrating a model-based engine combustion controller with a vehicle energy management supervisor, featuring a look-ahead function, has recently been demonstrated for heavy-duty vehicles within the IMPERIUM H2020 European collaborative research project [
8,
15]. Within that project, a fuel consumption reduction of 20% was achieved in heavy-duty trucks, meeting, at the same time, the requirements in terms of legal emission limits.
Nitrogen oxide (NO
x) emissions represent, together with soot emissions, one of the major pollutants emitted by diesel engines, and, therefore, several control techniques have been proposed over the years to meet the emission standards. On the one hand, advanced ATS systems were developed, [
16]. On the other hand, several techniques for the reduction of the in-cylinder NO
x levels were also studied.
The acronym ’NO
x’ is referred to the sum of NO (nitrogen monoxide) and NO
2 (nitrogen dioxide) emissions [
17]. The in-cylinder NO
x formation is based on several mechanisms: considering conventional diesel combustion, NO
x mainly derives from the thermal mechanism [
18] and the prompt mechanism [
19]. In general, the former contribution is the predominant one. The thermal formation was described by the super-extended Zeldovich mechanism [
18], and it is enhanced by the high temperatures and O
2 concentration in the burned gases. Therefore, the engine parameters that affect the previously mentioned quantities can be exploited for in-cylinder NO
x control.
Currently, in-cylinder NOx formation in diesel engines is mainly controlled by means of Exhaust Gas Recirculation (EGR) [
17], which reduces both the temperature levels and O
2 concentration in the burned gases. However, the main drawback of EGR is that it leads to higher soot formation and a lower combustion efficiency. EGR systems can be of the high pressure (HP-EGR) or low pressure (LP-EGR) types, depending on the position in which the exhaust gas is taken for recirculation (i.e., upstream or downstream from the turbine, respectively). In normal production engines, the EGR system is managed by the air-path controller inside the engine control unit (ECU). In particular, the air-path controller typically adjusts the EGR valve position and the turbocharger controller device, such as the rack position for a VGT (Variable Geometry Turbine), in order to achieve optimal set points of the intake air mass (or of the intake O
2 level) and boost pressure, respectively. These targets are identified offline, through an extensive experimental activity, to achieve an optimal trade-off between NO
x/soot emissions and engine performance [
20,
21]. Then, they are stored in look-up tables as functions of the engine speed and load and used as reference for the air-path controller. Feed-forward and PI/PID controllers are typically adopted to this purpose in production engines [
21]. More recently, an innovative air-path controller has also been presented in [
21], which exploits model predictive control (MPC) to simultaneously optimize NO
x/soot emissions and fuel consumption in a 2 L diesel engine that is equipped with a HP/LP-EGR system and a VGT. An MPC controller can realize a real-time optimization of the actuator positions, by exploiting a model of the system. In the controller that was proposed in [
21], the main engine metrics, including emissions, were modeled by polynomial functions. In that study, the controller acted on the position of the HP-EGR/LP EGR valves and of the VGT rack, and it was tested on an engine model. The authors found that the MPC controller outperformed the reference controller in terms of pollutant emissions and fuel consumption, with a required sampling time of the order of 20 ms. Another example of innovative air-path controller that is based on MPC is provided in [
22] for a diesel engine that features an HP-EGR system. In that study, the controller acted on the EGR valve position, throttle valve position, VGT position, and fueling rate in order to optimize the engine performance and pollutant formation in real-time. Additionally, in that case, the main engine metrics, including emissions, were modeled by polynomial functions. The controller was tested on a mean value engine model over some driving cycles, and it was found to be effective in achieving the emission constraints.
With reference to the previously mentioned air-path controllers, the relatively low response of the EGR and VGT systems in transient operation can determine a certain deviation between the desired levels of boost pressure or intake oxygen and the actual ones, due to dynamic effects, such as turbo-lag or emptying/filling of the gas inside the pipes. Therefore, they cannot realize a cycle-by-cycle NOx control. Instead, this can be achieved by alternative control techniques.
The realization of a Miller cycle through variable valve actuation (VVA) provides a first technique to reduce in-cylinder temperatures. This approach, alone or in conjunction with EGR [
23], can theoretically modulate the NO
x formation cycle-by-cycle by modifying the intake valve closure timing, but it requires the installation of a VVA system, with the related production costs.
The control of NO
x by means of the adjustment of the injection parameters represents an alternative solution. In particular, it is well known [
24] that the injection timing is closely correlated to the in-cylinder peak temperatures and, therefore, to the thermal NO
x formation, for a given EGR level. Therefore, a NO
x control algorithms which, in addition to the adoption of conventional EGR, also adjusts the injection timing in real-time during engine operation, is potentially capable of guaranteeing a very accurate NO
x control in transient conditions, also compensating for EGR deviations with respect to the desired levels. For example, if, during load transients, the EGR level is lower than the set-point, then a compensation of the additional NO
x levels can be quickly realized by temporarily delaying the main injection timing. Moreover, an approach of this type can also be coupled with the ATS system management: for example, the engine-out NO
x levels can be modulated, by acting on the injection timing, as a function of the actual efficiency of the ATS, so as to always meet the tailpipe emission constraints.
Because the modulation of the injection timing affects the engine thermal efficiency to a great extent, a torque (or BMEP, i.e., brake mean effective pressure) controller has to be associated with the NOx controller, in order to adjust the fuel quantity in real time on the basis of the actual value of the start of injection. As a matter of fact, for a given BMEP target, the fuel quantity must be adjusted when the injection timing is modified, in order to compensate for the variation in of thermal efficiency.
An approach of this type requires an accurate and fast model to estimate the engine-out NOx levels and the BMEP on a cycle-by-cycle basis. This model can be used within a control loop, which defines the values of the injected fuel mass and of the start of injection of the main pulse in order to reach the targets of NOx emissions and of BMEP within each engine cycle.
Several modeling approaches can be found in the literature for this purpose, and they can be classified in three categories: phenomenological models, empirical/semi-empirical models, and black-box models.
Phenomenological methods implement physical and chemical models to predict NO
x formation. They usually require thermodynamic models (e.g., [
25]) that are based on the total energy conservation equation [
26]. Several examples can be found in the literature [
25,
27,
28,
29,
30]. Most of these models implement the Zeldovich mechanism, and they require the estimation of in-cylinder burned gas temperatures using thermodynamic sub-models. The main drawback of phenomenological models is that they are quite computationally demanding, and they cannot be implemented on normal production ECUs. Moreover, the accuracy on the NO
x emission prediction is extremely dependent on the accuracy in the estimated mass of the charge: an error of 5% can lead to a NO
x prediction error of approximately 98% [
31].
Empirical and semi-empirical methods typically implement simple correlations to predict the NO
x levels. The main difference is that empirical methods exploit input variables that can be directly measured, while semi-empirical methods can include input variables that have to be estimated by sub-models. The combustion phasing (MFB50) provides an example, which is closely correlated to the NO
x formation, but it does not derive from a direct measurement. Semi-empirical models are very suitable for real-time model-based algorithms, since they are implementable in ECUs from the computational effort point of view. Moreover, they can be developed improving their robustness with respect to input variables with high measurement uncertainty (e.g., avoiding the use of the trapped air mass as input quantity), so as to achieve a better performance when coupled with sensors that were installed in normal production engines. Some examples of semi-empirical approaches can be found in [
32,
33,
34].
Finally, black-box methods typically include artificial intelligent systems, such as artificial neural networks. These approaches have also been adopted as fast and control-oriented tools for predicting emissions [
35,
36,
37,
38]. These methods are also suitable for control purposes, but, in general, they require a higher number of calibration points than semi-empirical models, since they lack physical consistency.
When considering the previous discussion, a control algorithm for BMEP and engine-out NO
x levels was previously developed and tested offline for a 3.0 dm
3 diesel engine in [
7].
The present investigation is the continuation of the previous study, and it is focused on the improvement of that controller, and on its implementation and assessment on the engine at the test bench. In particular, the previous controller has been upgraded in this study by integrating a recent semi-empirical NO
x model [
34]. In fact, the NO
x formation model used in [
7] was based on the estimation of the burned gas temperature, which was obtained by a three-zone thermodynamic model. It was found that that approach was highly sensitive to the accuracy in the estimated trapped mass and, therefore, it turned to be less robust with respect to the measurement uncertainties of the input variables.
In this paper, a specific investigation was also carried out in order to check the effect of the engine thermal state on the accuracy of the controller in transient operation.
2. Materials and Methods
2.1. Engine and Experimental Setup
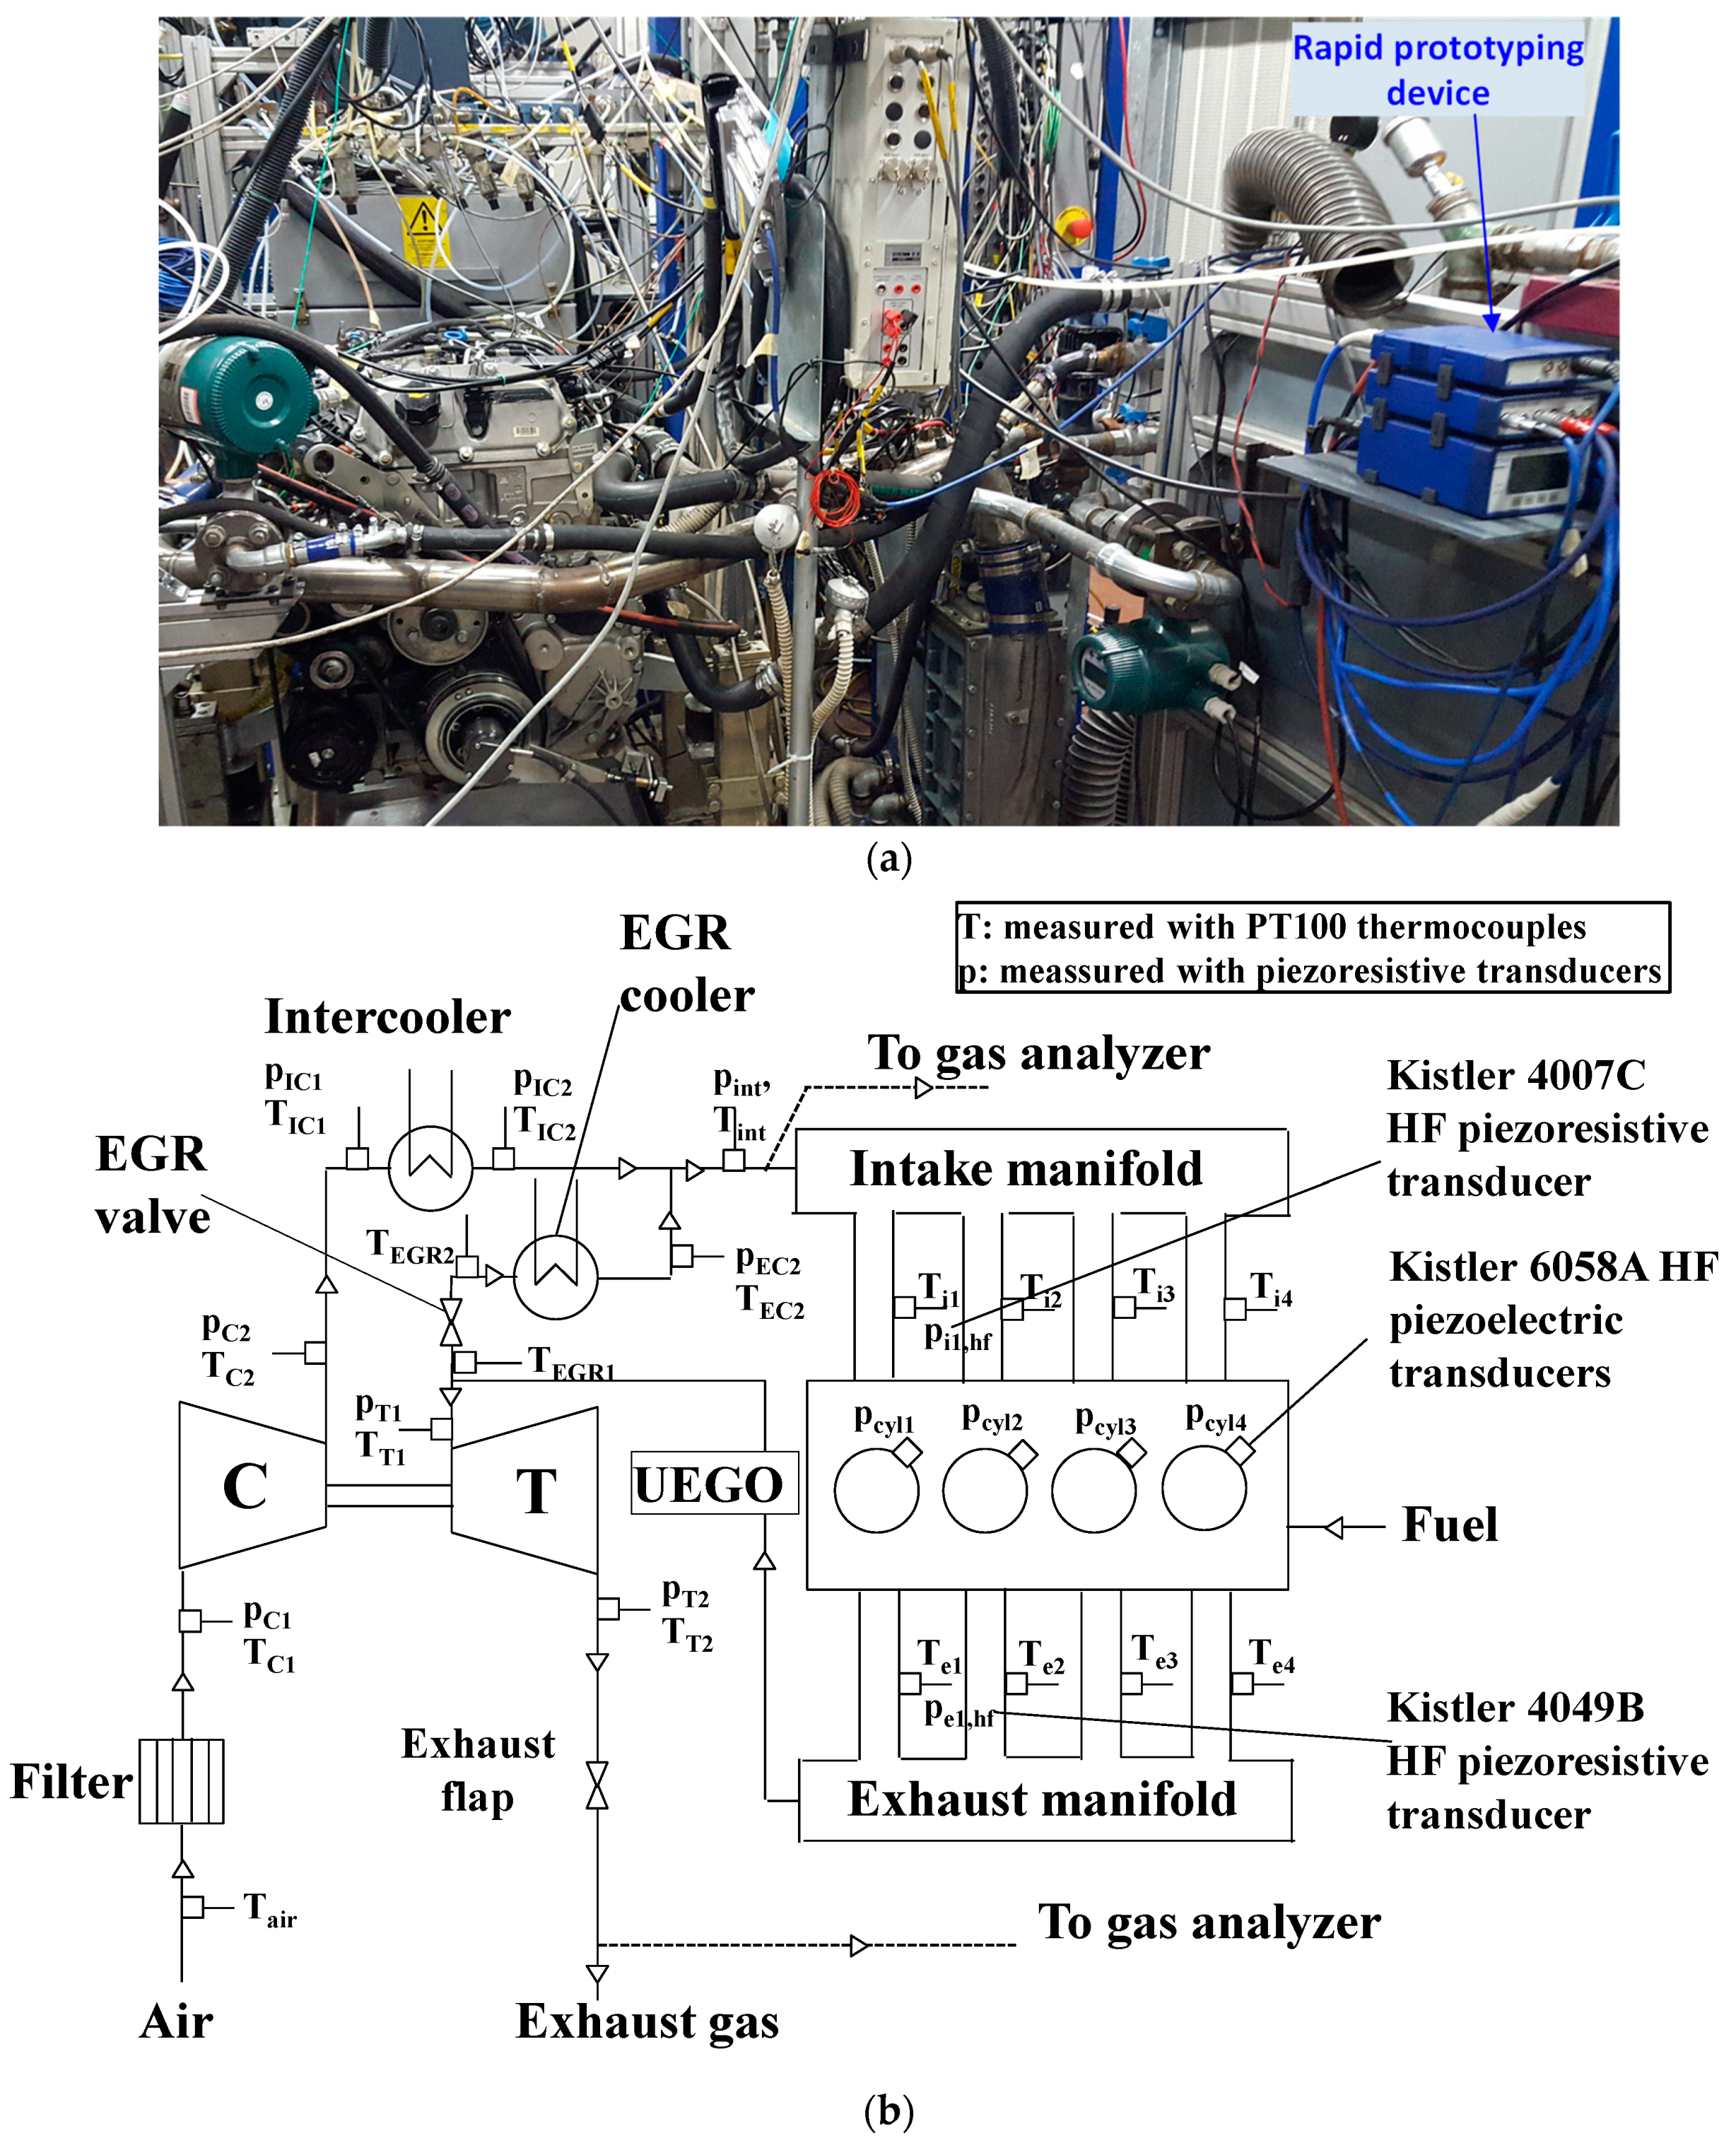
The controller was tested on a Euro VI FPT F1C 3.0 dm3 diesel engine. The engine featured a VGT turbocharger, an HP-EGR system, four valves per cylinder, a common rail injection system, and it is characterized by a compression ratio of 17.5. The test acquisition was performed at a dynamic test bench at the Politecnico di Torino.
Figure 1a shows a picture of the engine and of the test bench, while
Figure 1b reports the engine scheme with the related sensors.
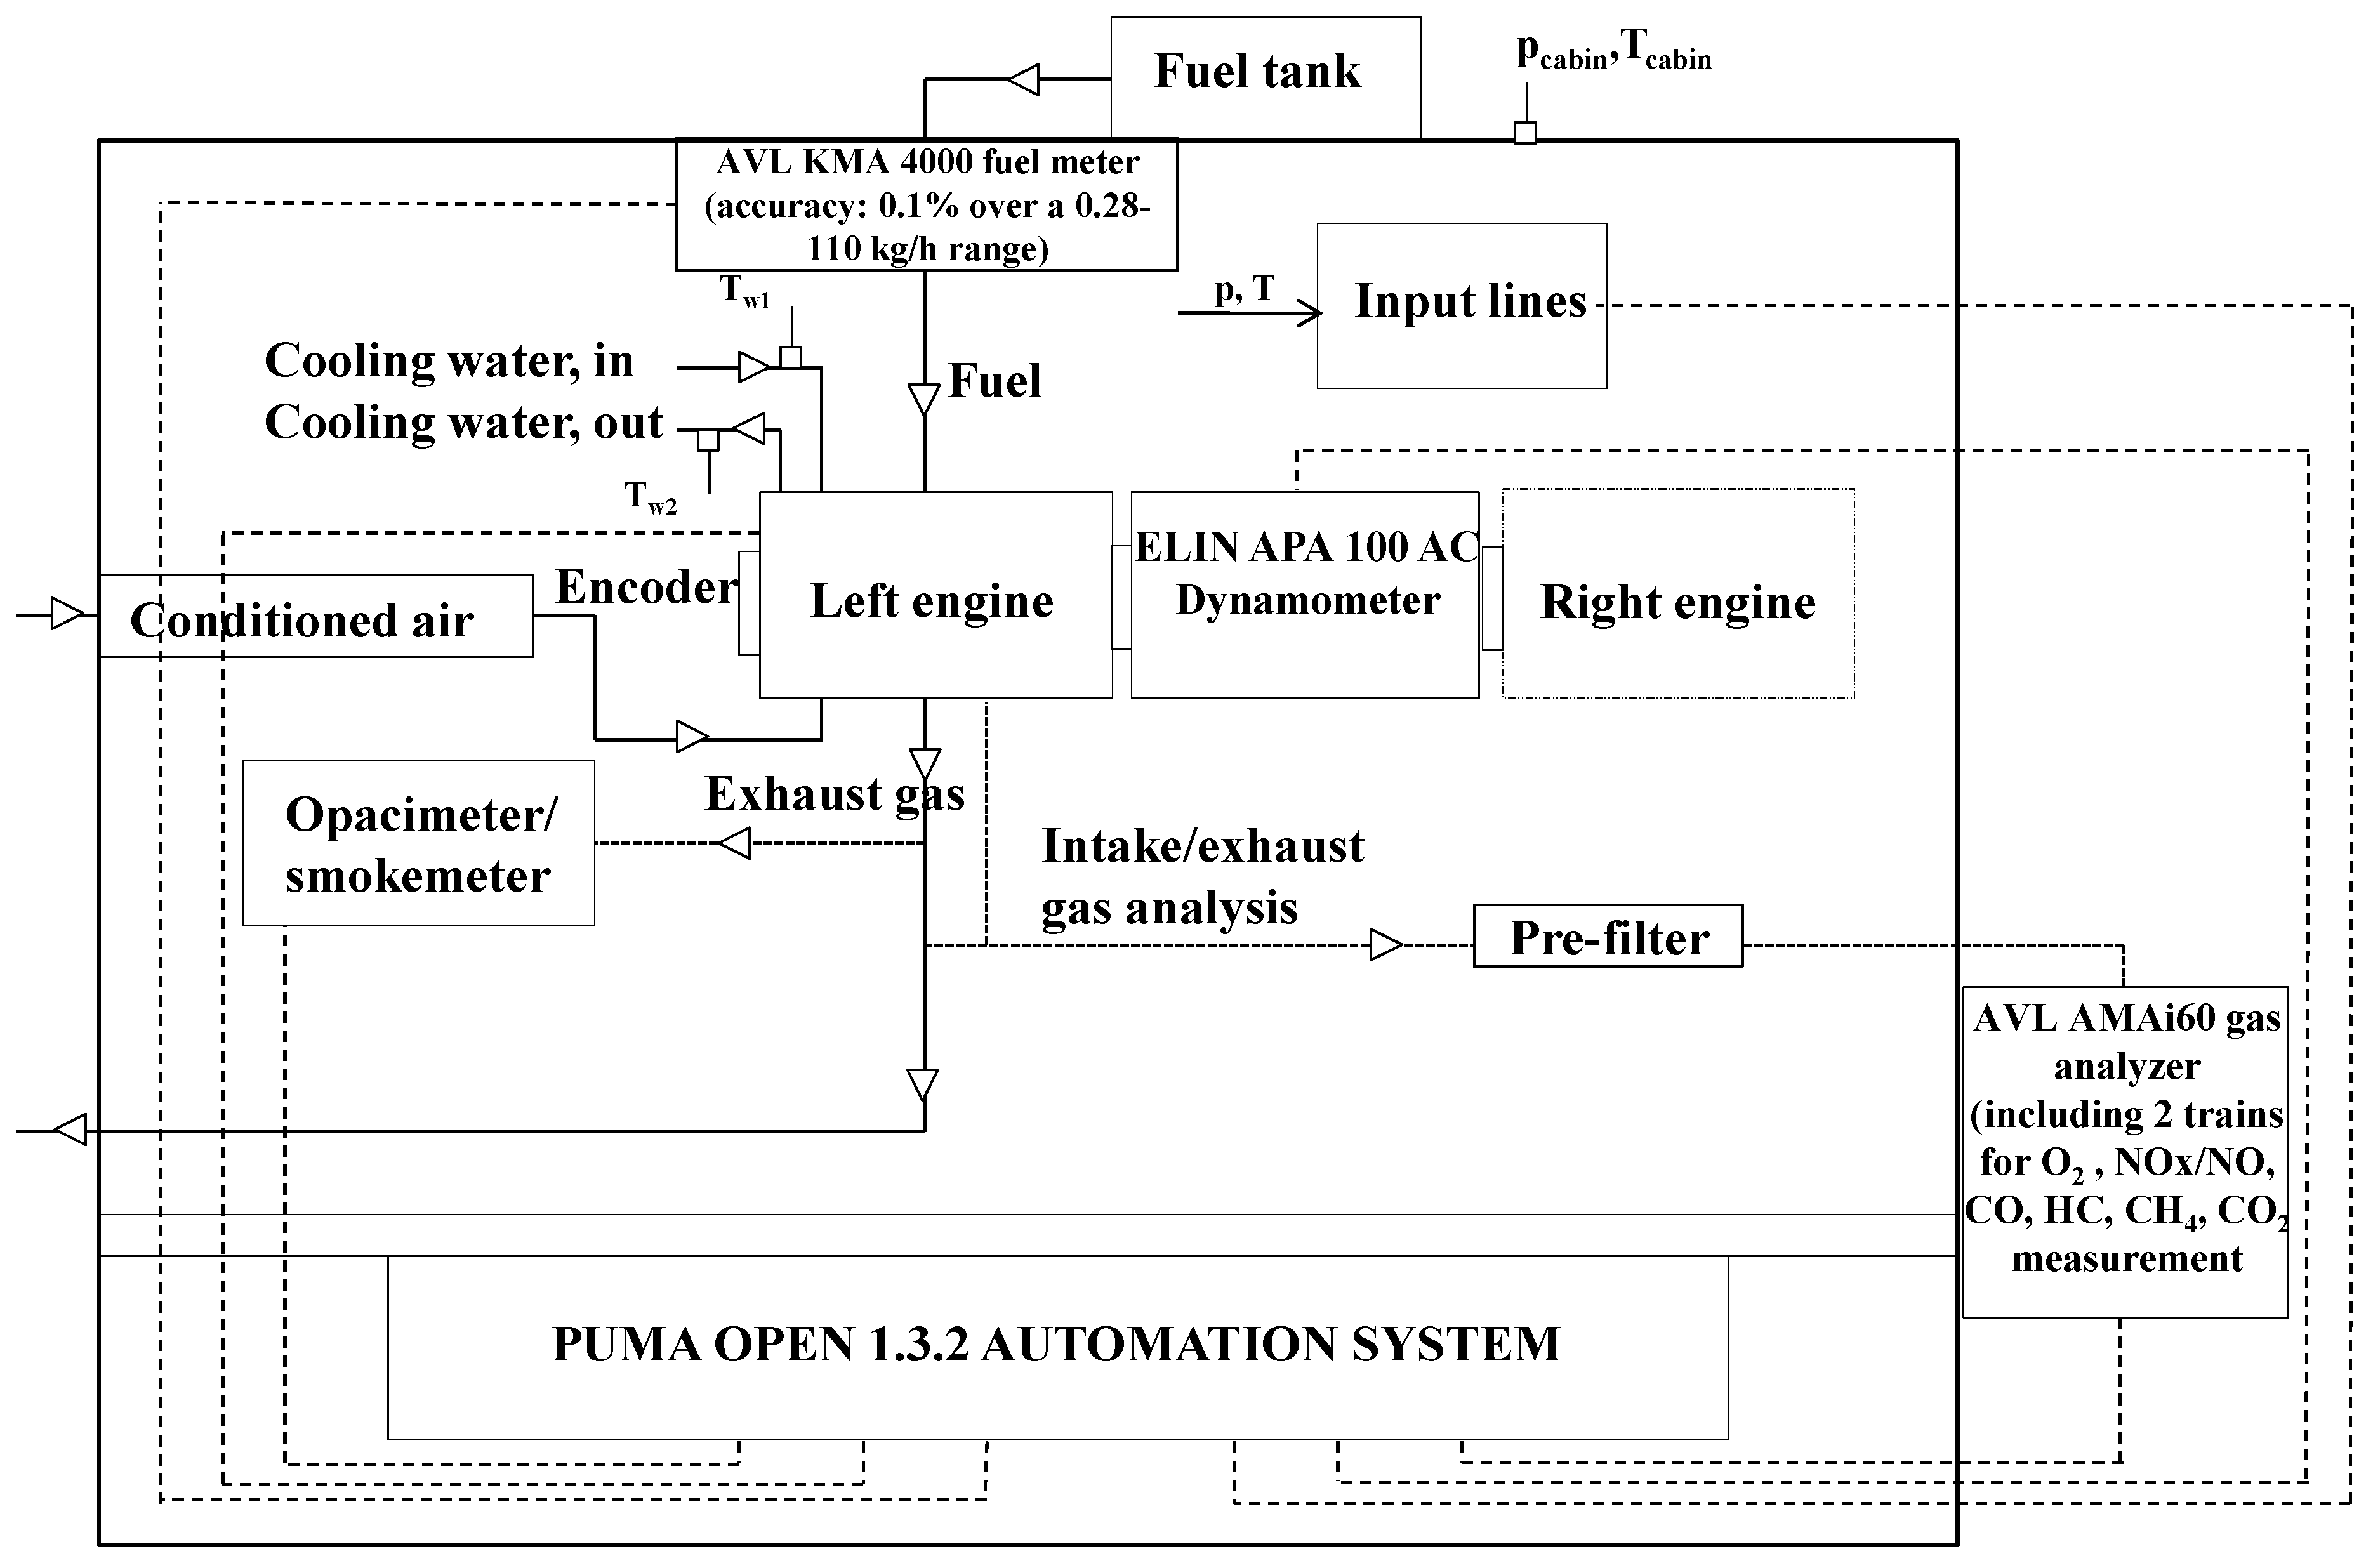
Figure 2 reports the main components of the dynamic test rig.
Further details on the engine and test bench specifications can be found in [
34]. However, an important novelty with respect to the previous activities described in [
34] is the use of a lambda sensor unit (LSU, which is typically installed at the engine exhaust) in the intake manifold, which allowed for the intake oxygen percentage to be determined. The measurement of this quantity is of great importance for a correct estimation of the NO
x levels.
An ‘ES910’ device that was manufactured by ETAS (Stuttgart, Germany), equipped with a Freescale PowerQUICCTM III MPC8548 processor with 800 MHz clock and 512 MByte of DDR2-RAM, was adopted to implement the control algorithm on the engine. This device is connected to the ECU (engine control unit) via ETK communication, and it is capable of replacing the standard ECU functionalities.
Conventional diesel fuel was adopted, with a cetane number of 53.1 and a lower heating value of 43.4 MJ/kg.
2.2. Experimental Tests
Both the stationary and transient test were acquired.
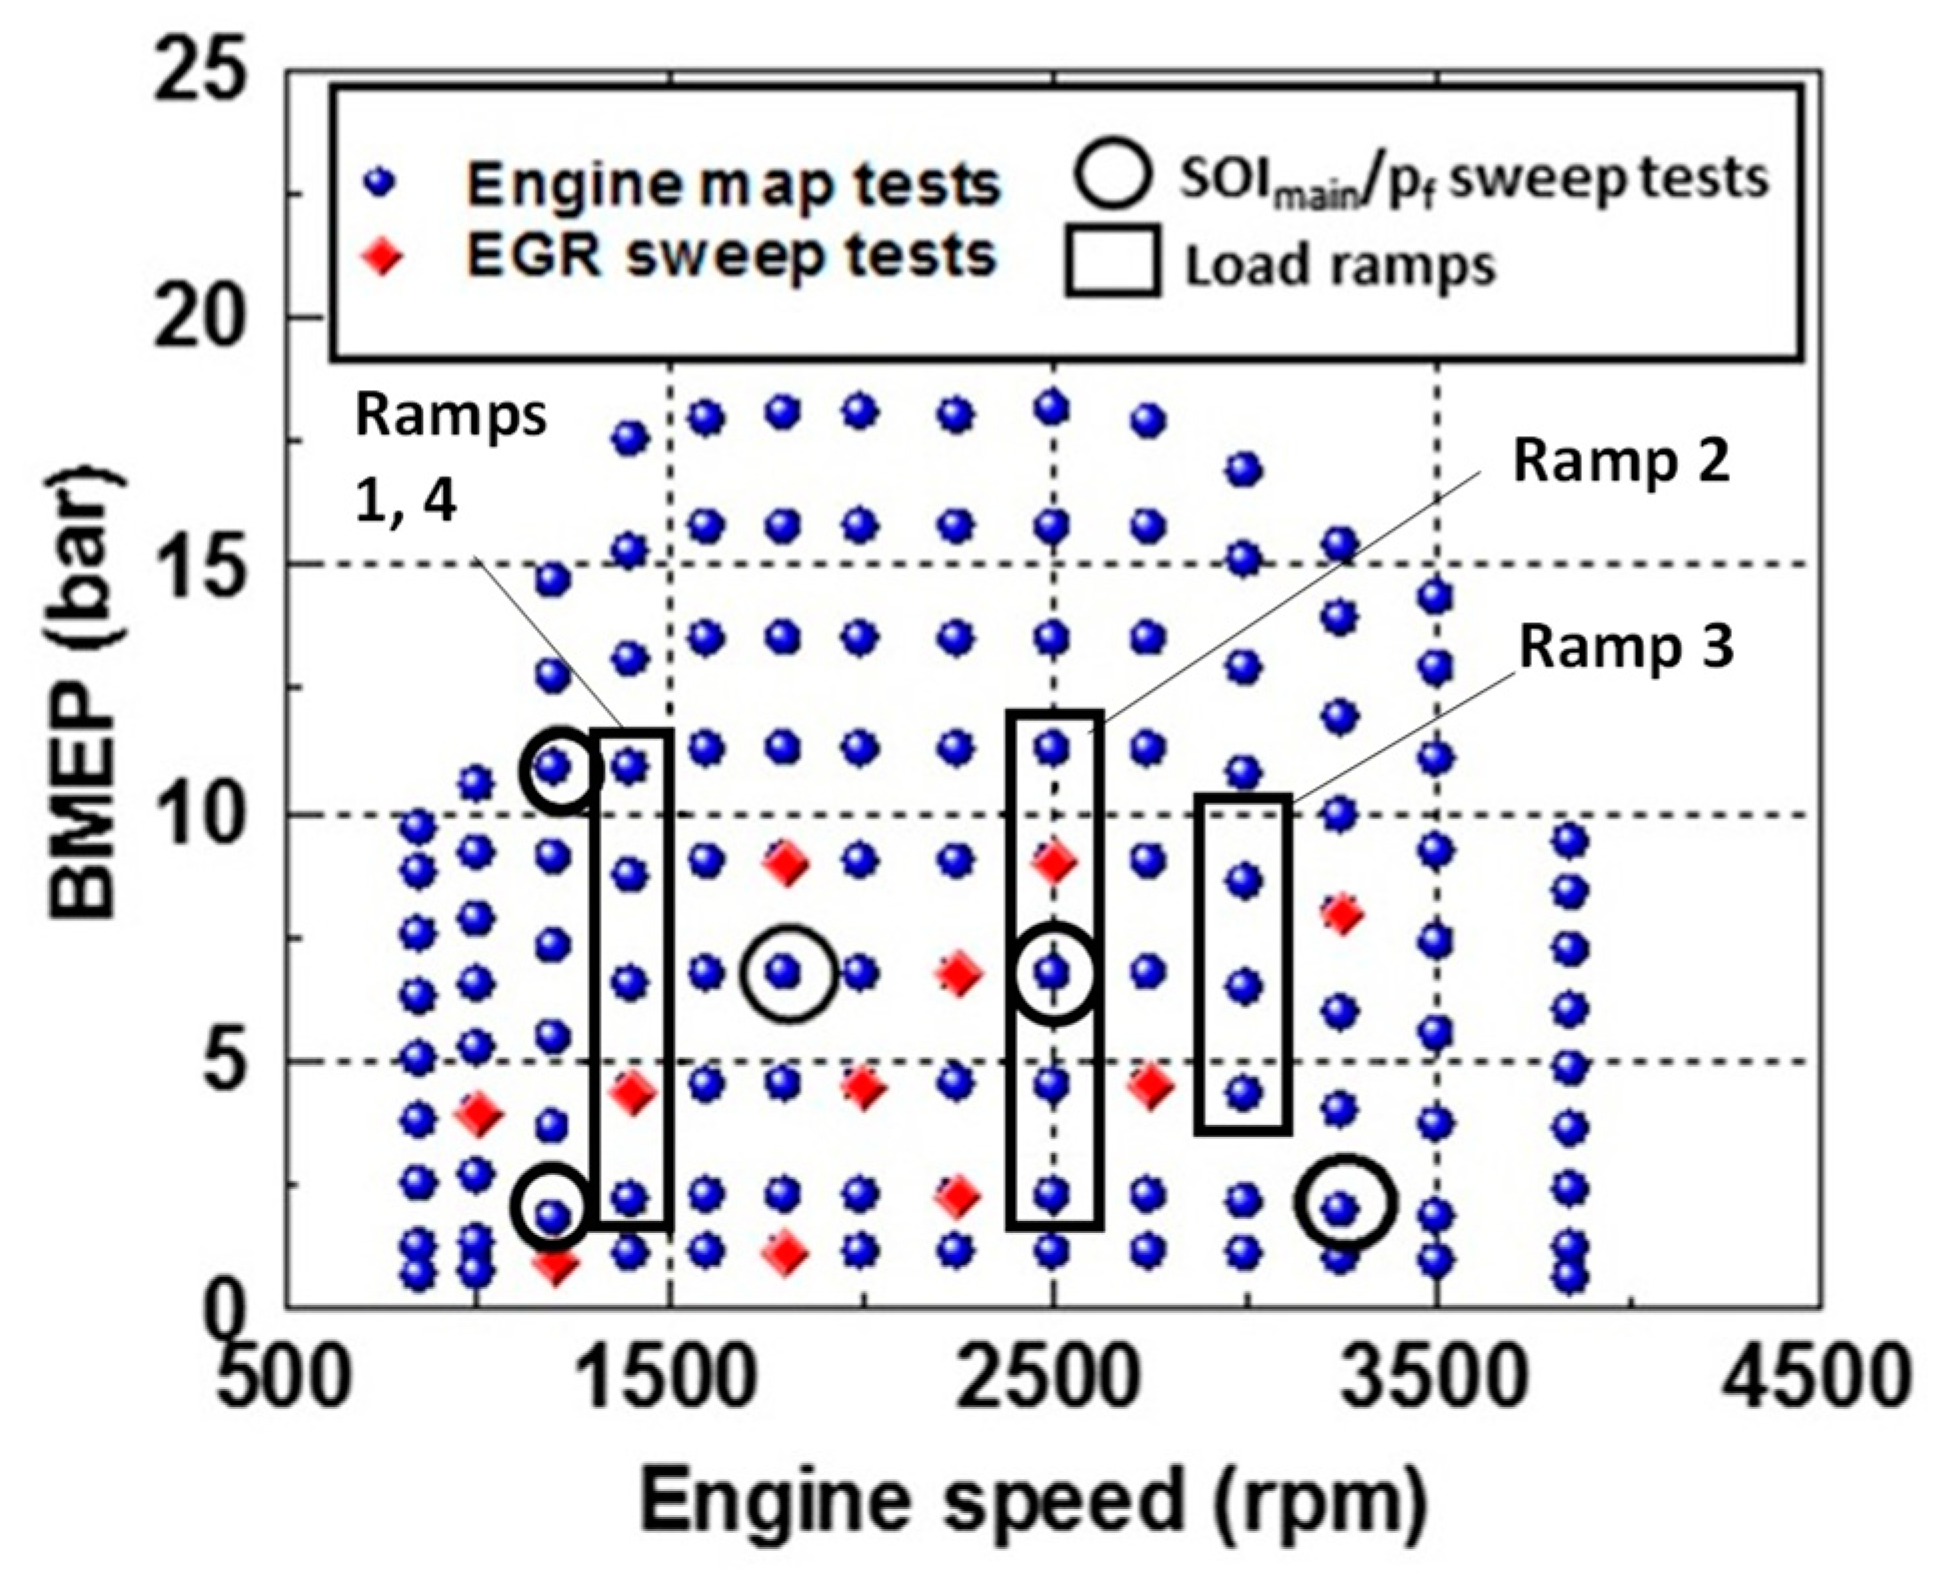
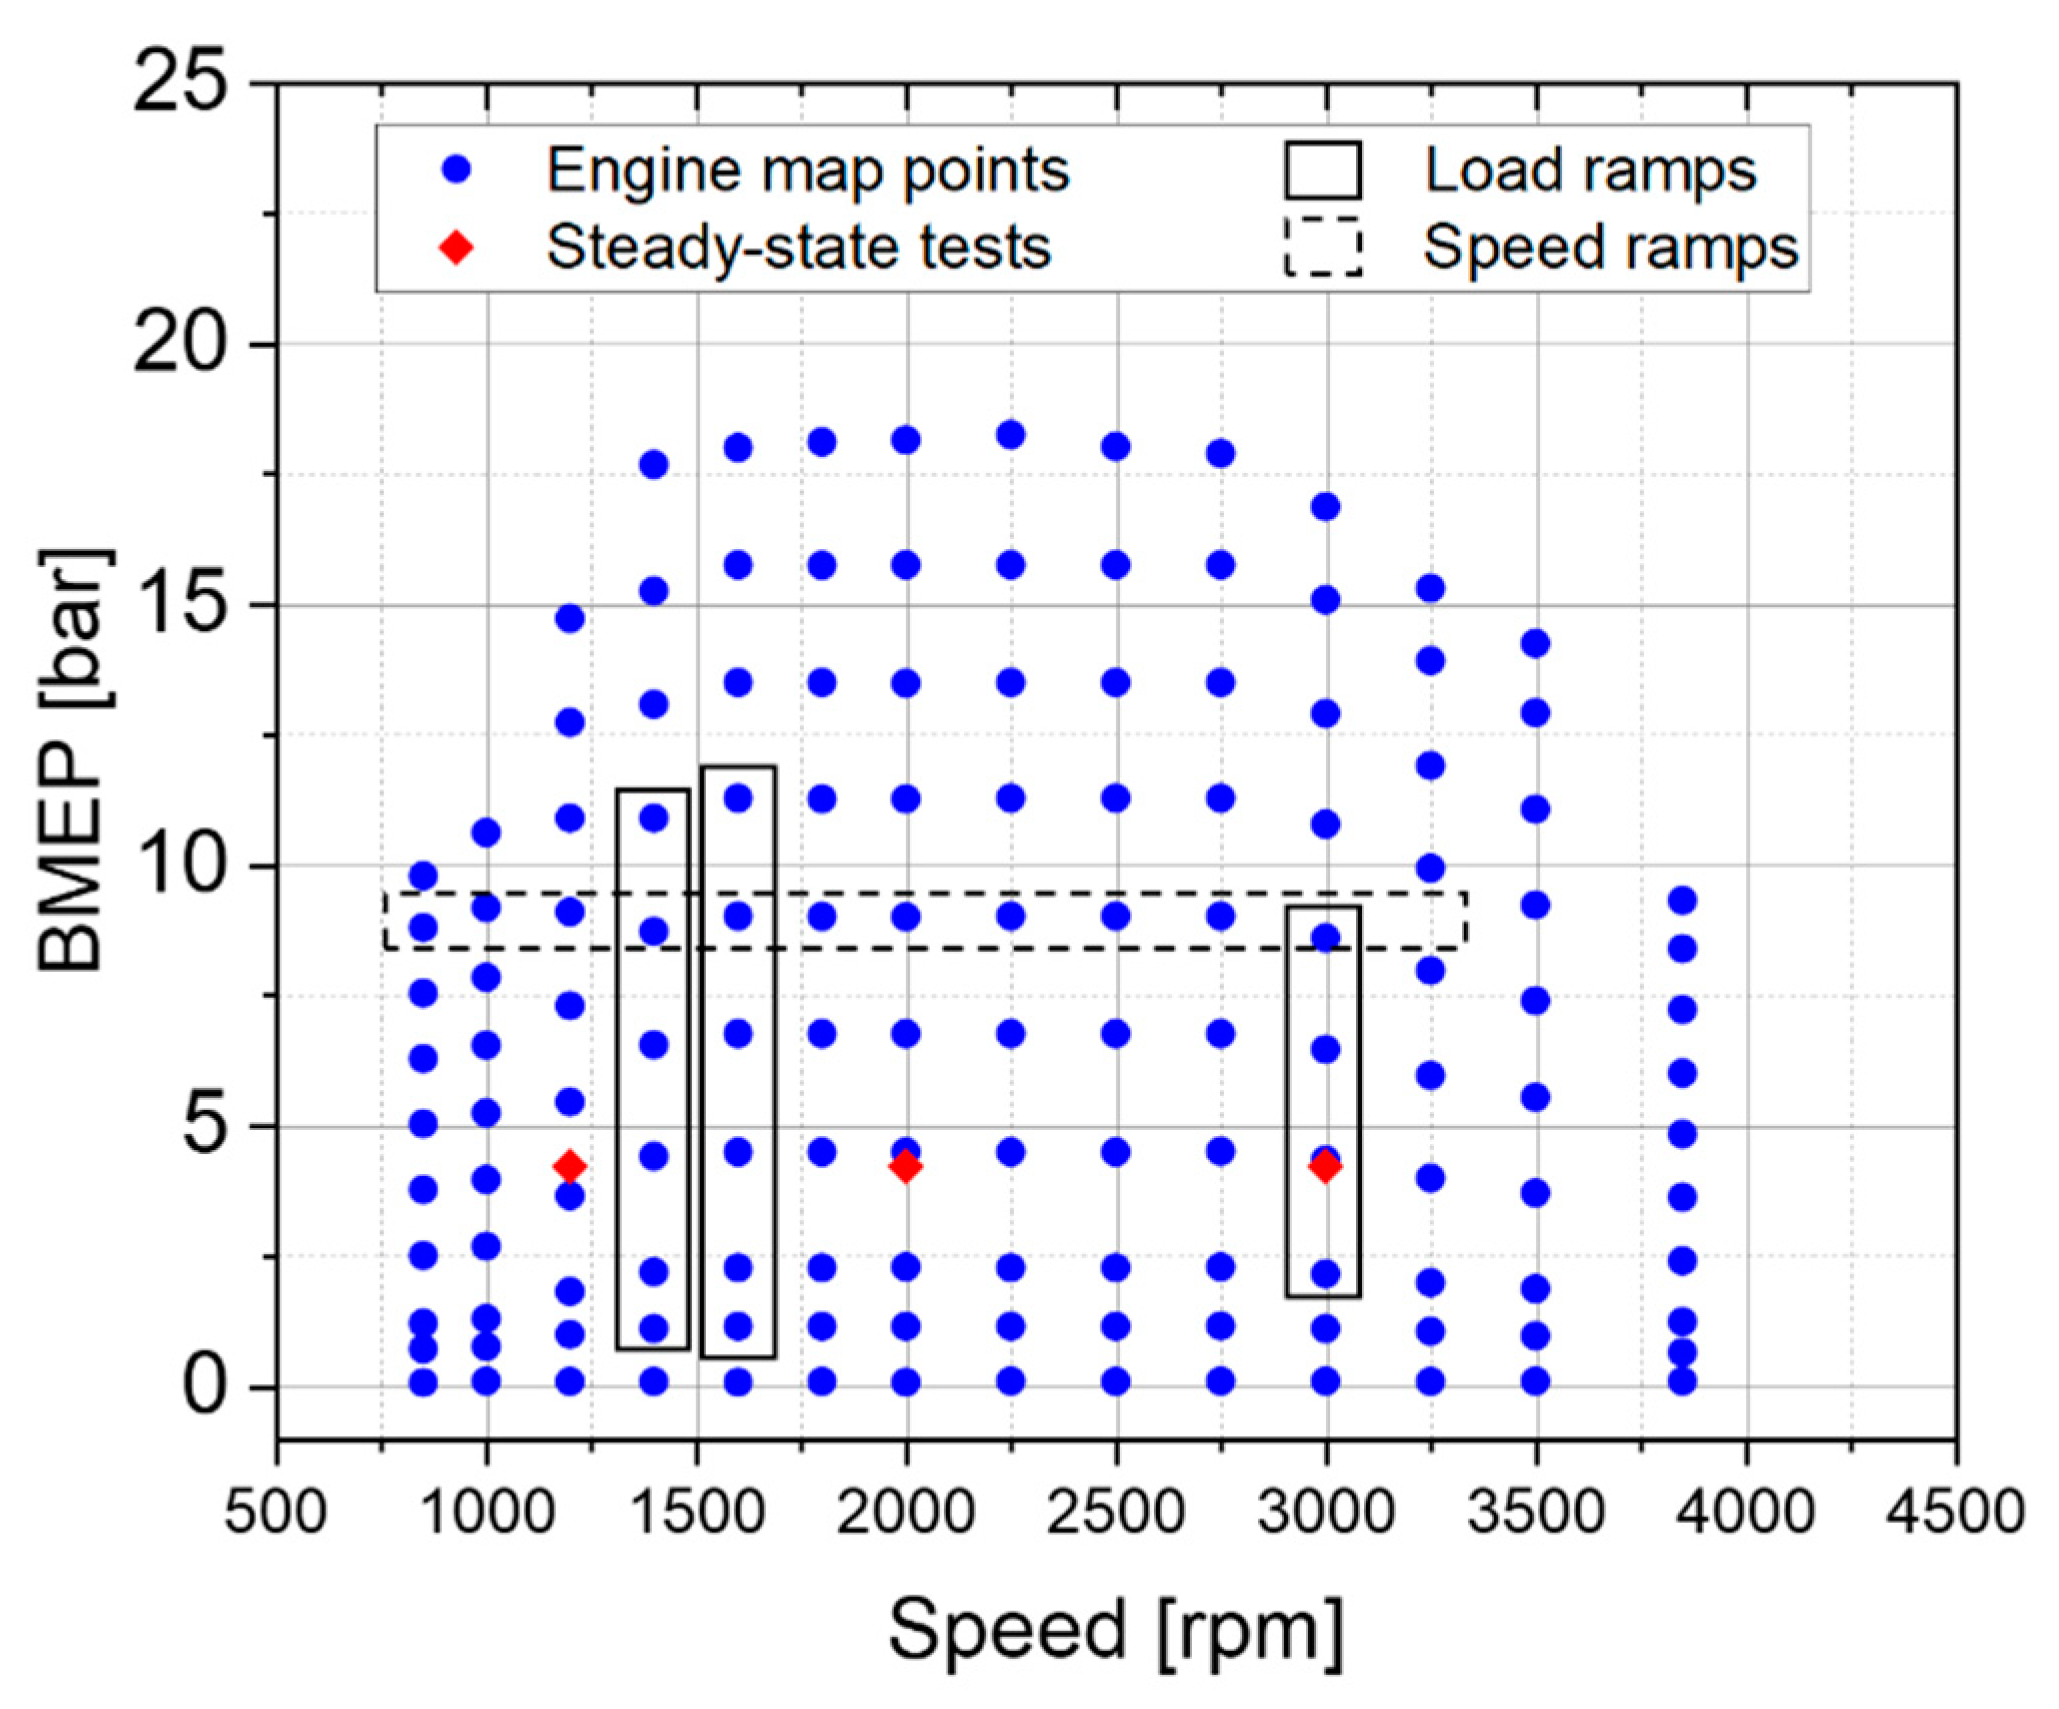
The stationary tests were mainly exploited for the calibration of the combustion model and for the tuning of the intake oxygen sensor. They are shown in
Figure 3 and include:
An engine map, which is constituted by 123 points.
EGR-sweep tests, for 11 fixed operating points. The EGR rate was varied in the (0–50%) range. A total number of 162 tests was acquired.
Full-factorial sweep tests, in which the injection pressure (pf) and main injection timing (SOImain) were varied at five fixed operating points. A total number of 125 tests was acquired. The SOImain was varied of ±6 deg with respect to the baseline value of each engine point, while the pf was varied of ±20% with respect to the baseline value.
The steady-state tests were performed in warmed engine conditions, with a coolant temperature at an engine inlet equal to 85 °C.
The functionality of the controller was validated over four different load ramps, which are also indicated in
Figure 3:
Load ramp #1 (at N = 1400 rpm): the controller was enabled or disabled, for a given NOx target. The NOx target is defined by a map, as a function of the engine load and speed. The initial coolant temperature was around 65 °C.
Load ramp #2 (at N = 2500 rpm): the controller was enabled, setting several NOx targets. In particular, target variations of ±20% and ±40% with respect to the baseline case were set. The initial coolant temperature was around 65 °C.
Load ramp #3 (at N = 3000 rpm): the controller was enabled or disabled, for the given NOx target defined by the map. The initial coolant temperature was around 65 °C.
Load ramp #4 (at N = 1400 rpm): this ramp was a repetition of load ramp #1, but with longer stabilization times after each load variation, and with an initial coolant temperature of around 85 °C. Additionally, in this case, the controller was enabled or disabled, for the given NOx target defined by the map.
The load ramp test #4 has been designed to verify to what extent the engine thermal state affected the accuracy of the model-based BMEP/NOx controller. In fact, over the ramp #1, the engine was running at a lower coolant temperature than that of the warm steady-state tests over which the model was tuned and, moreover, it featured short stabilization times after each load variation, so that the engine was not able to reach a stabilized thermal state, similar to that of the steady-state warm points. Instead, over the load ramp #4 an initial coolant temperature of 85 °C was set, and longer stabilization times were adopted after each load variation, so as to allow the engine to reach thermal conditions that are as close as possible to those of the warm steady-state points. Therefore, by comparing the accuracy of the controller over the load ramps #1 and #4, it was possible to check the effect of the engine thermal state on the accuracy of the controller.
Concerning the choice of the engine speed, originally the authors had planned to include speed values of 1400 rpm, 2500 rpm, and 3500 rpm in order to uniformly cover the engine map. However, it was finally decided not to investigate high speed conditions (i.e., N = 3500 rpm) for safety reasons. Therefore, a lower speed (N = 3000 rpm) was finally selected.
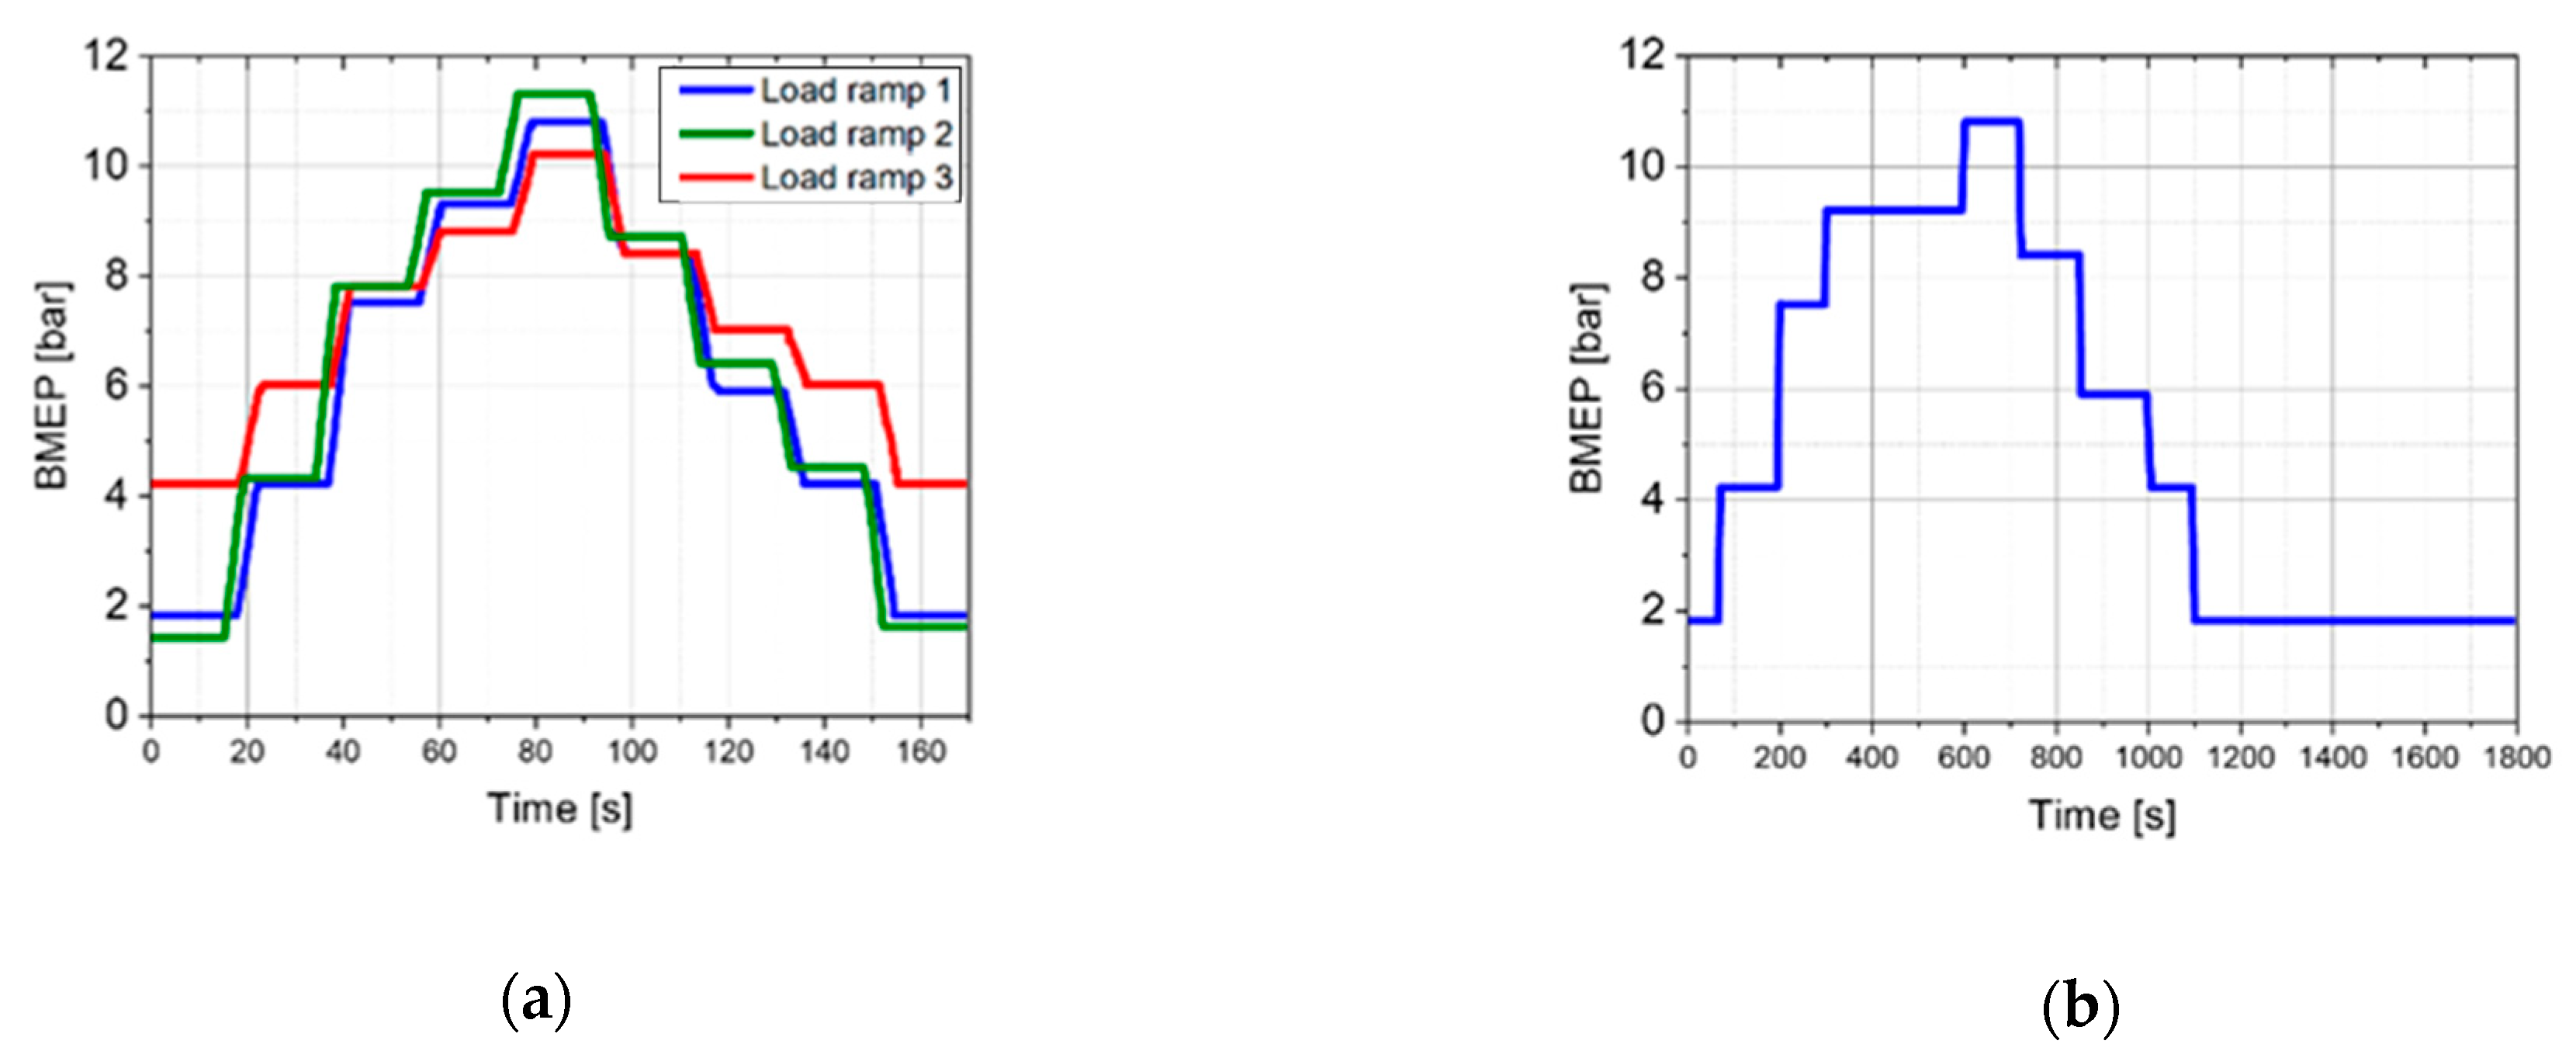
Figure 4a shows the baseline load ramps (with controller disabled) in terms of BMEP variation over time, while
Figure 4b reports the repeated load ramp #1 with increased stabilization time.
Table 1 reports a summary of the experimental tests.
2.3. Uncertainty Analysis
The uncertainty was evaluated according to the recommended practices that were reported in [
39].
With reference to the measured NO
x levels, its relative uncertainty is of the order of 2.5–3.3%. The details of the calculation procedure are reported in [
34]. The NO
x levels were measured by means of a chemiluminescence detector (CLD), included in the gas analyzer. The device featured two measurement ranges (low-NO
x/high-NO
x), which were calibrated using reference calibration tanks with a NO
x concentration of 150 ppm and 1000 ppm in the span gas, respectively.
The maximum declared error of the torque meter is ± 0.3% of FSO (525 Nm), being equal to 1.575 Nm. The related expanded uncertainty, assuming a coverage factor of 2, is 1.819 Nm, which corresponds to an expanded uncertainty of BMEP that is equal to 0.0762 bar for the engine that is considered in this paper.
2.4. Model-Based BMEP/NOx Controller
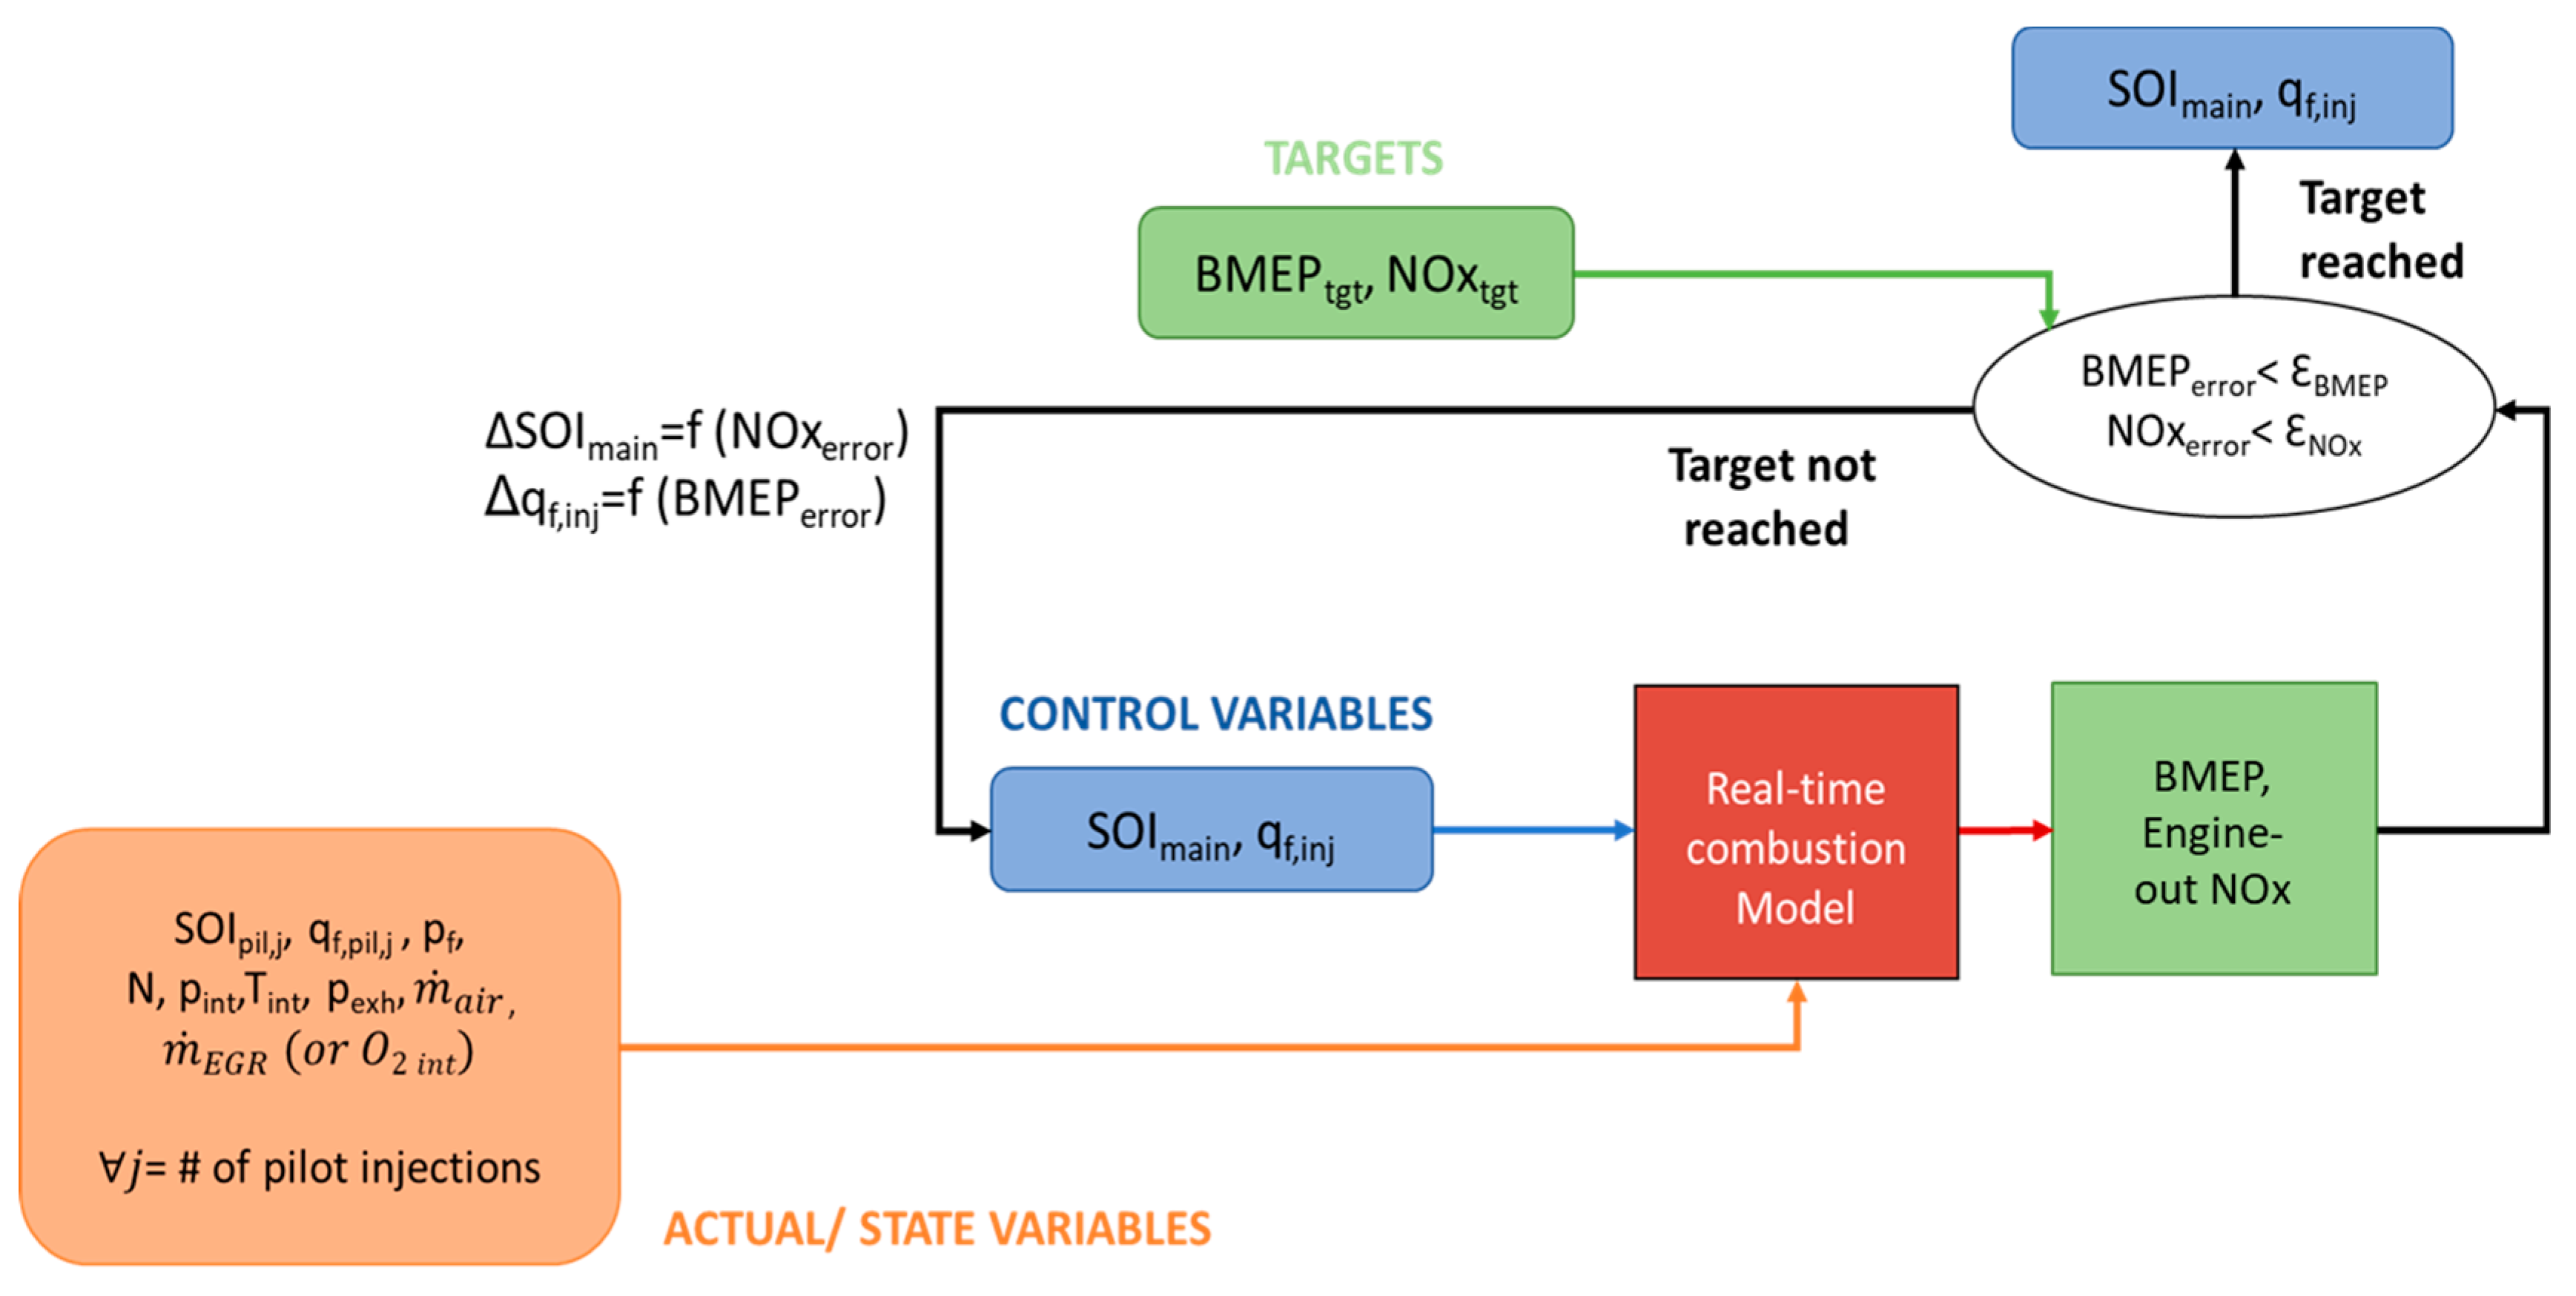
Figure 5 reports the conceptual scheme of the control algorithm.
BMEP and NO
x targets are given as inputs to the controller, which adjusts the control variables (i.e., the injected fuel quantity ‘q
f,inj’ and SOI
main), through an iterative loop, until the error between the BMEP and NO
x values that are predicted by the combustion model and the targets is below pre-defined thresholds, which are indicated as ɛ
BMEP and ɛ
NOx. The iterative loop is entirely completed within a single engine firing. Additional details are reported in [
7].
The choice of controlling the NOx emissions by acting on SOImain can allow a cycle-by-cycle NOx control to be realized, which can be very effective, especially in transient operation.
The controller requires several state values that are provided by the ECU or by sensors installed on the engine, such as the injection timing and quantity of the pilot pulses (SOI
pil, q
f,pil), intake pressure/temperature (p
int/T
int), the air mass flow rate (
), the injection pressure (p
f), the exhaust manifold pressure (p
exh), and the engine speed (N), as shown in
Figure 5. The latter quantity was acquired by a high frequency piezoresistive pressure sensor that was installed in the exhaust manifold.
Another important input variable for the controller, which affects the accuracy of the NO
x prediction to a great extent [
34], is the intake manifold oxygen concentration (O
2). In this study, an LSU lambda sensor was installed in the intake manifold for its direct measurement.
In general, if an oxygen sensor is not available, then the O
2 concentration can be evaluated using a linear equation of the type O
2 =
f(X
r/
λ) [
40], where X
r represents the EGR rate and
λ indicates the relative air-to-fuel ratio. In the latter case, the EGR mass flow rate (
) is also needed (as reported in
Figure 5), and this quantity is generally provided by the ECU through maps or embedded models.
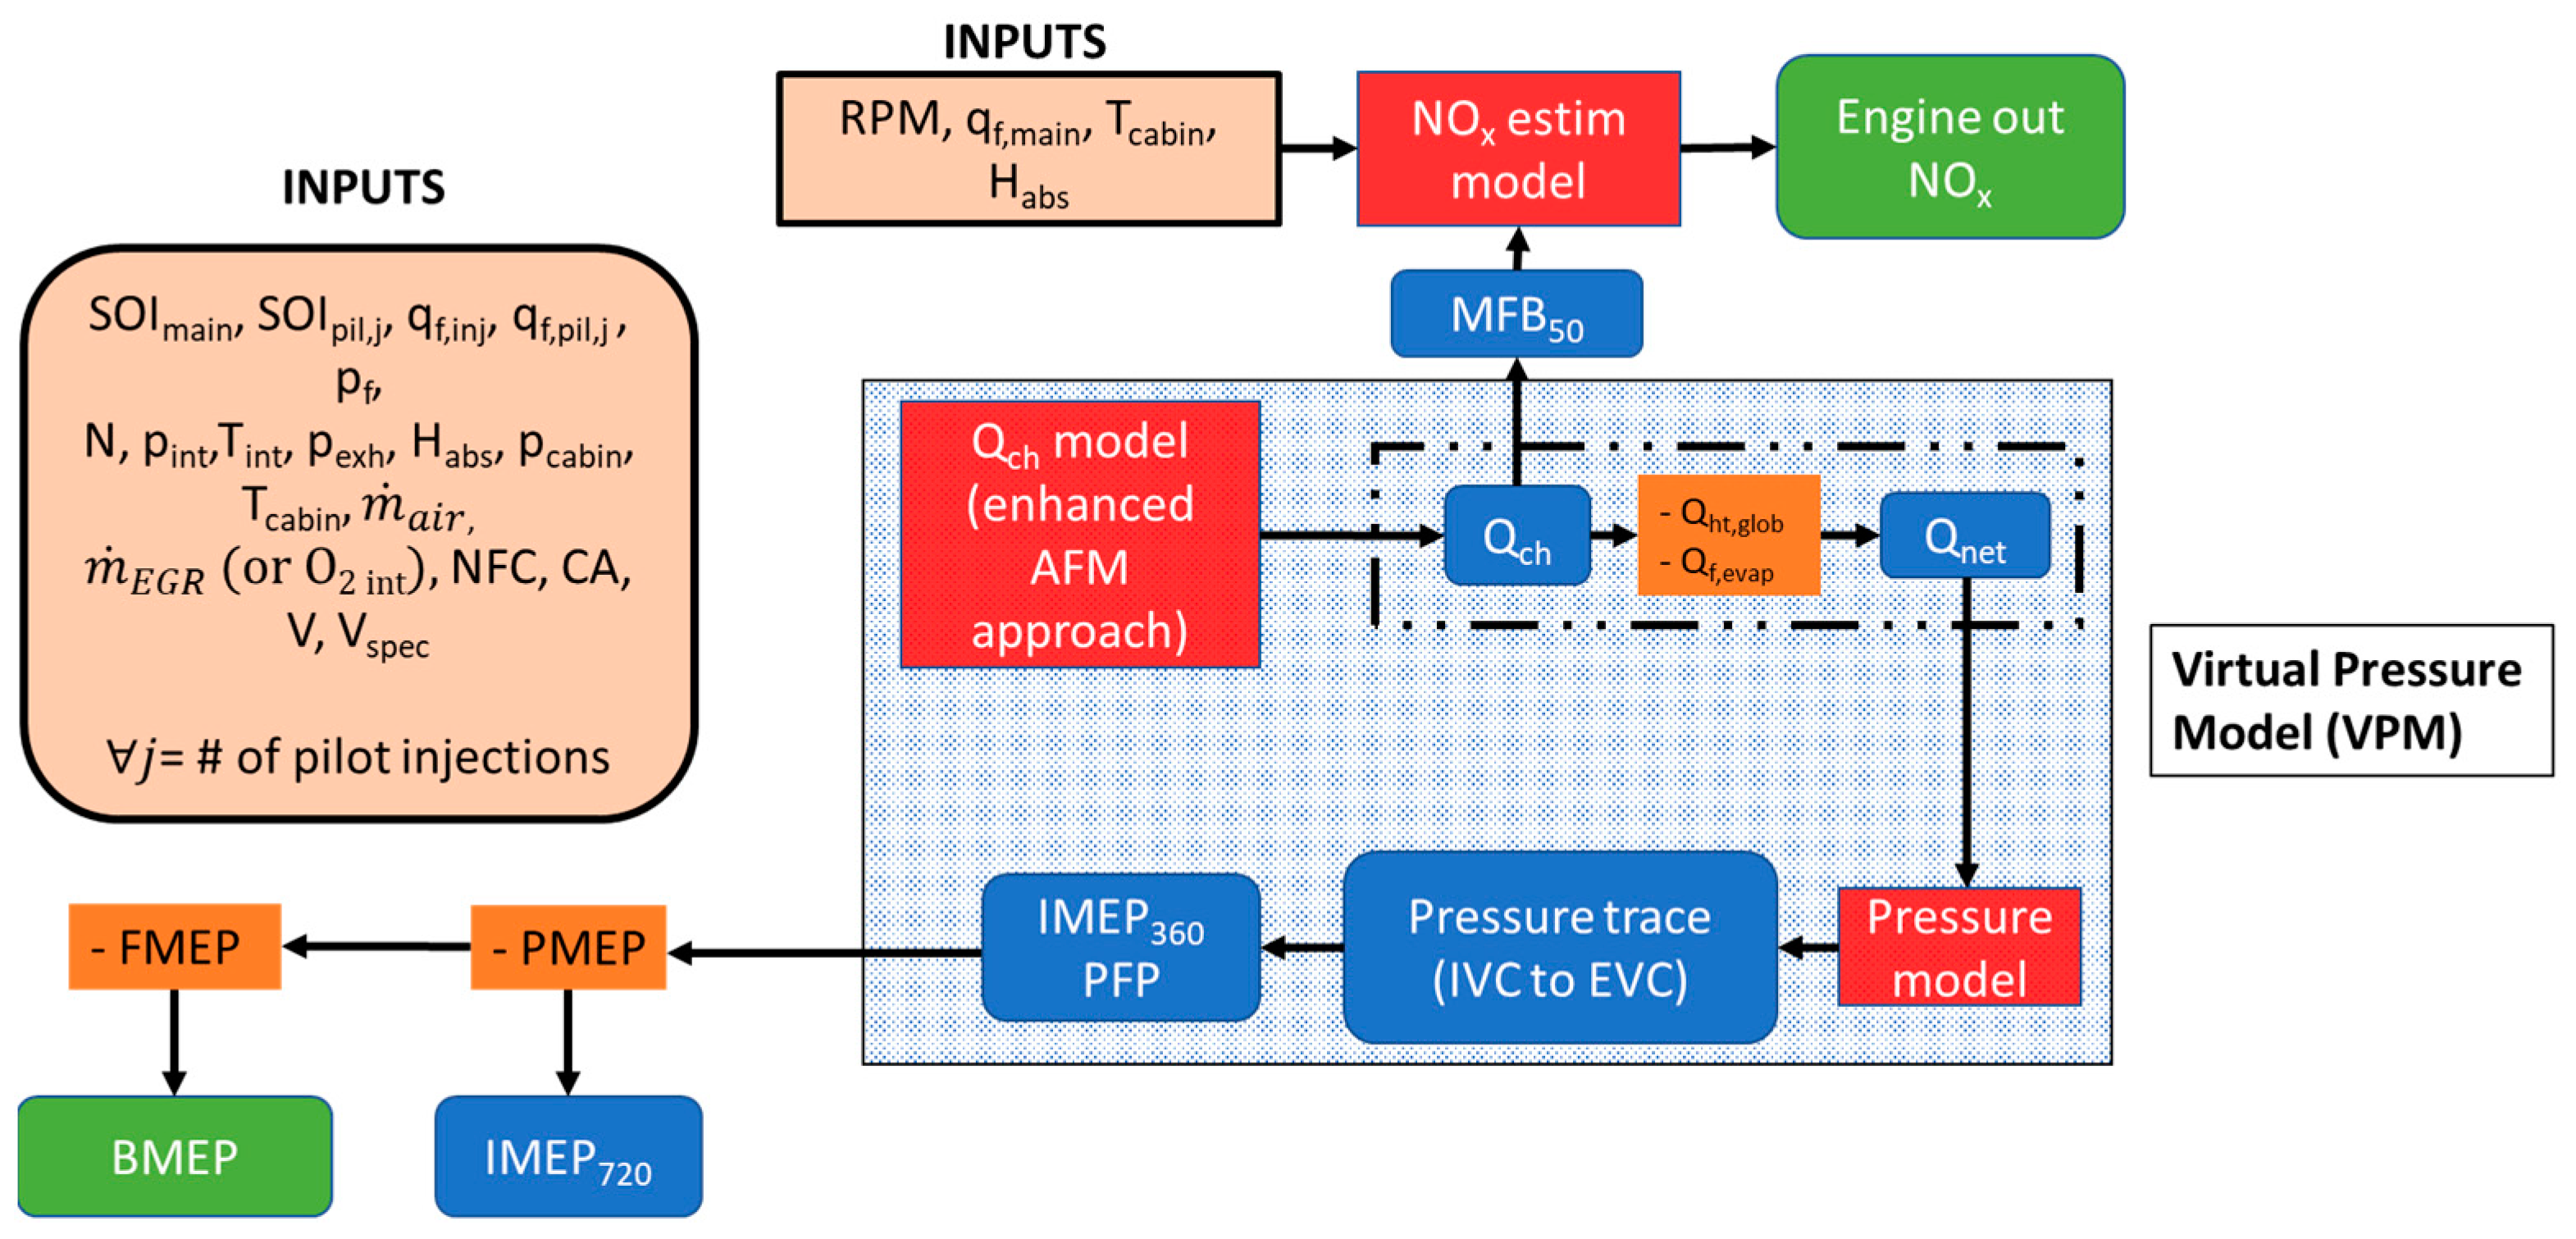
The combustion model description can be found in [
7,
41], and its scheme is described in
Figure 6.
A novelty of the controller adopted in this paper consists in the integration of a recently developed NO
x model, which was adopted in order to improve robustness and it is described in [
34].
2.5. Implementation of the Model-based Controller Through Rapid Prototyping
For safety reasons, the developed BMEP/NO
x controller has been preliminary tested with offline simulations by means of ‘MiL’ (Model-in-the-Loop), prior to its implementation on the engine. The description of the ‘MiL’ activity is reported in detail in [
42].
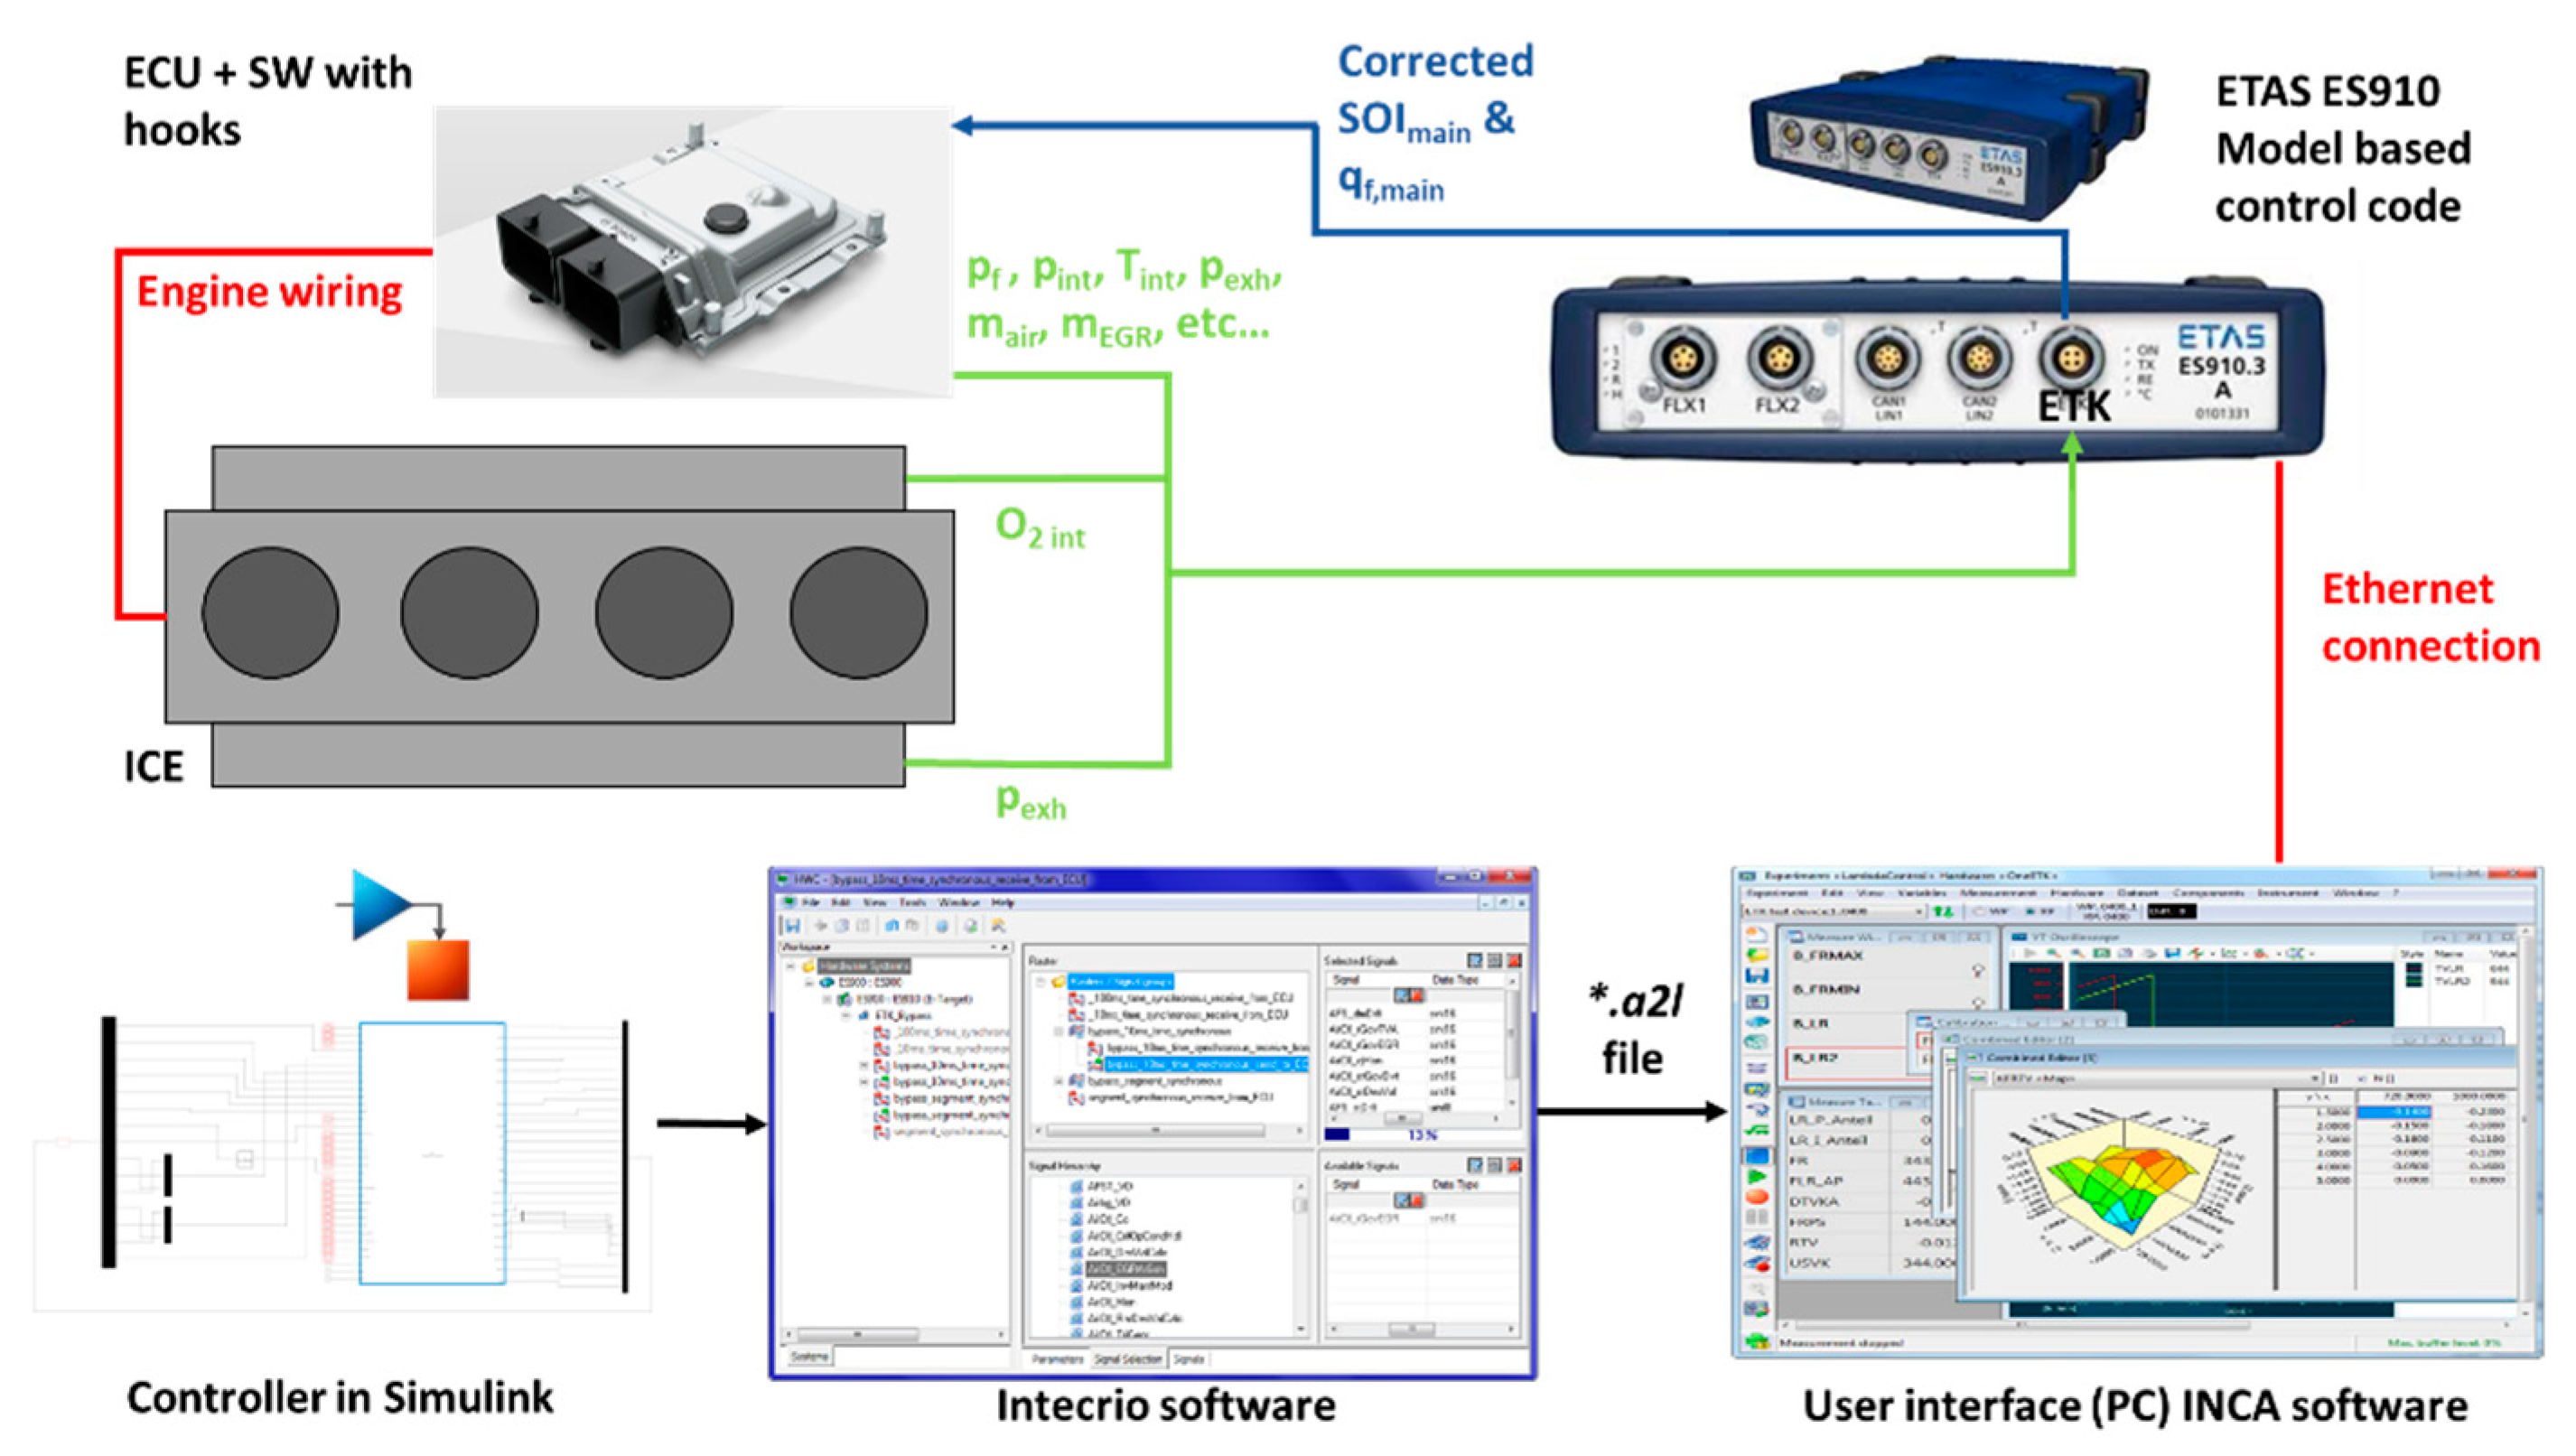
The functionalities of the BMEP/NOx controller on the real engine were then verified by means of the ‘ETAS ES910’ module. The procedure for the implementation of the controller can be summarized, as follows.
First, the script of the controller, which is developed in the Simulink environment, is uploaded on the ETAS ES910 module device by means of the ETAS Intecrio RP (Rapid Prototyping) software, which generates an “a2l” file that can be read by the ECU through the ETAS INCA software. The ETAS ES910 device receives the input signals that are needed by the controller either from the ECU (via ETK) or from external sensors that are installed on the engine. Subsequently, the controller estimates the optimal values of SOI
main and q
f,inj and sends them to the ECU through ETK communication (
Figure 7).
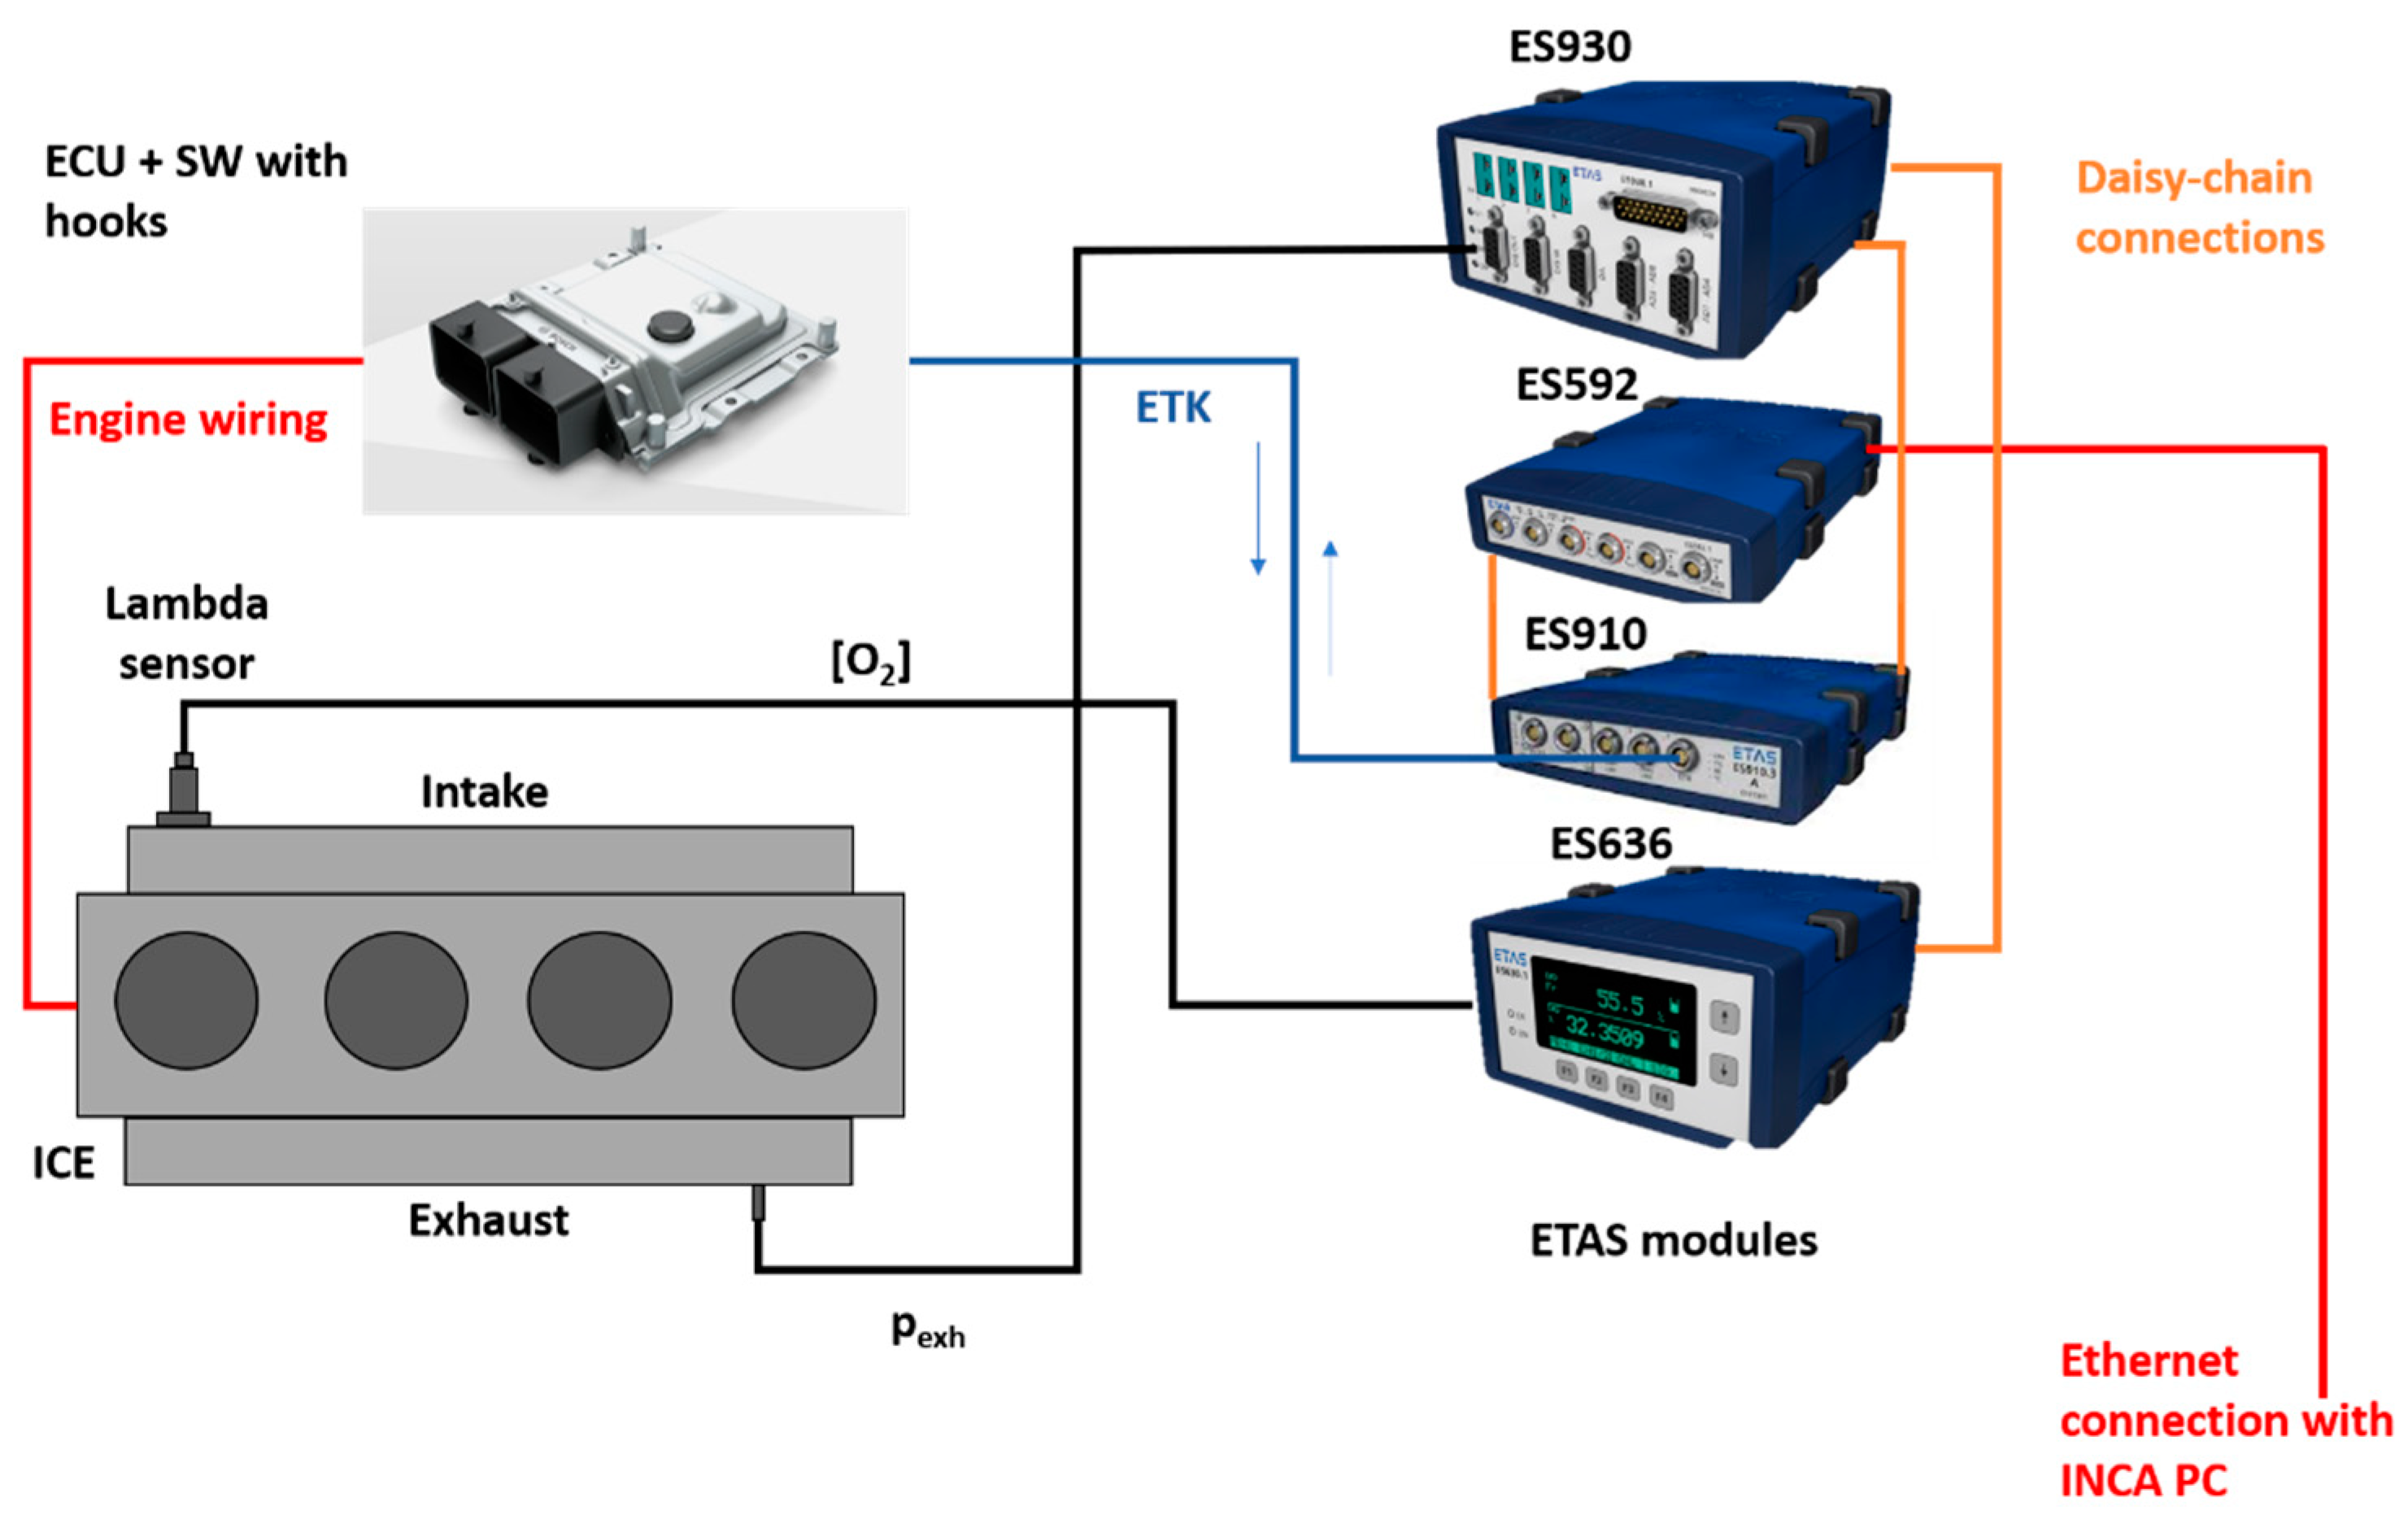
Figure 8 shows a detail of the different ETAS modules that were installed for the rapid prototyping tests, as well as their connection.
In particular:
The ES910 module was used to execute the script of the developed BMEP/NOx controller and to by-pass the baseline ECU values of SOImain/pf via ETK.
The ES930 module is an input/output module that was used to acquire the exhaust pressure signal that is measured by the piezoresistive sensor installed in the exhaust manifold, and to make it available for the ES910 device. The raw signal was filtered by means of a FIR (Finite Input Response), with sampling frequency of 100 Hz, before being passed to the ETAS ES910 device.
The ES592 module allowed for the communication (via Ethernet) between the ETAS ES910 module and the INCA software installed on the test bench PC.
The ES636 module was used to acquire the signal of the intake oxygen concentration measured by the LSU lambda sensor, and to make it available for the ES910 device through the connection with the ES930 module. Its display was used for the calibration of the LSU lambda sensor.
The figure shows how the different ETAS modules were connected according to a daisy-chain configuration, which was necessary for the correct acquisition of the needed variables.
It was verified that the computational time that is required by the controller on the ETAS ES910 device is of the order of 300–400 μs per iteration, which is compatible with a cycle-by-cycle control.
3. Results and Discussion
3.1. Accuracy of the Combustion Model
Details regarding the accuracy of the combustion model and of the NO
x model are shown in [
7] and [
34], respectively.
By summarizing, the model is able to predict BMEP with a RMSE (Root Mean Square Error) of about 0.15 bar and the engine-out NO
x levels with a RMSE of about 44 ppm, when the steady-state conditions that are shown in
Figure 3 are considered.
3.2. Calibration of the Intake O2 Sensor
A preliminary calibration of the intake oxygen sensor was carried out.
The calibration of the oxygen span concentration was made on the basis of the value taken from the exhaust gas analyzer when the engine was not running (i.e., 20.6 %). A pressure compensation was also made by selecting this option from the ETAS ES636 module (see
Figure 8), so as to take the effect of the intake manifold pressure into account. The tuning procedure was carried out at three selected key-points in terms of speed and BMEP, i.e., 1200 × 4, 2000 × 4, and 3000 × 4 rpm × bar.
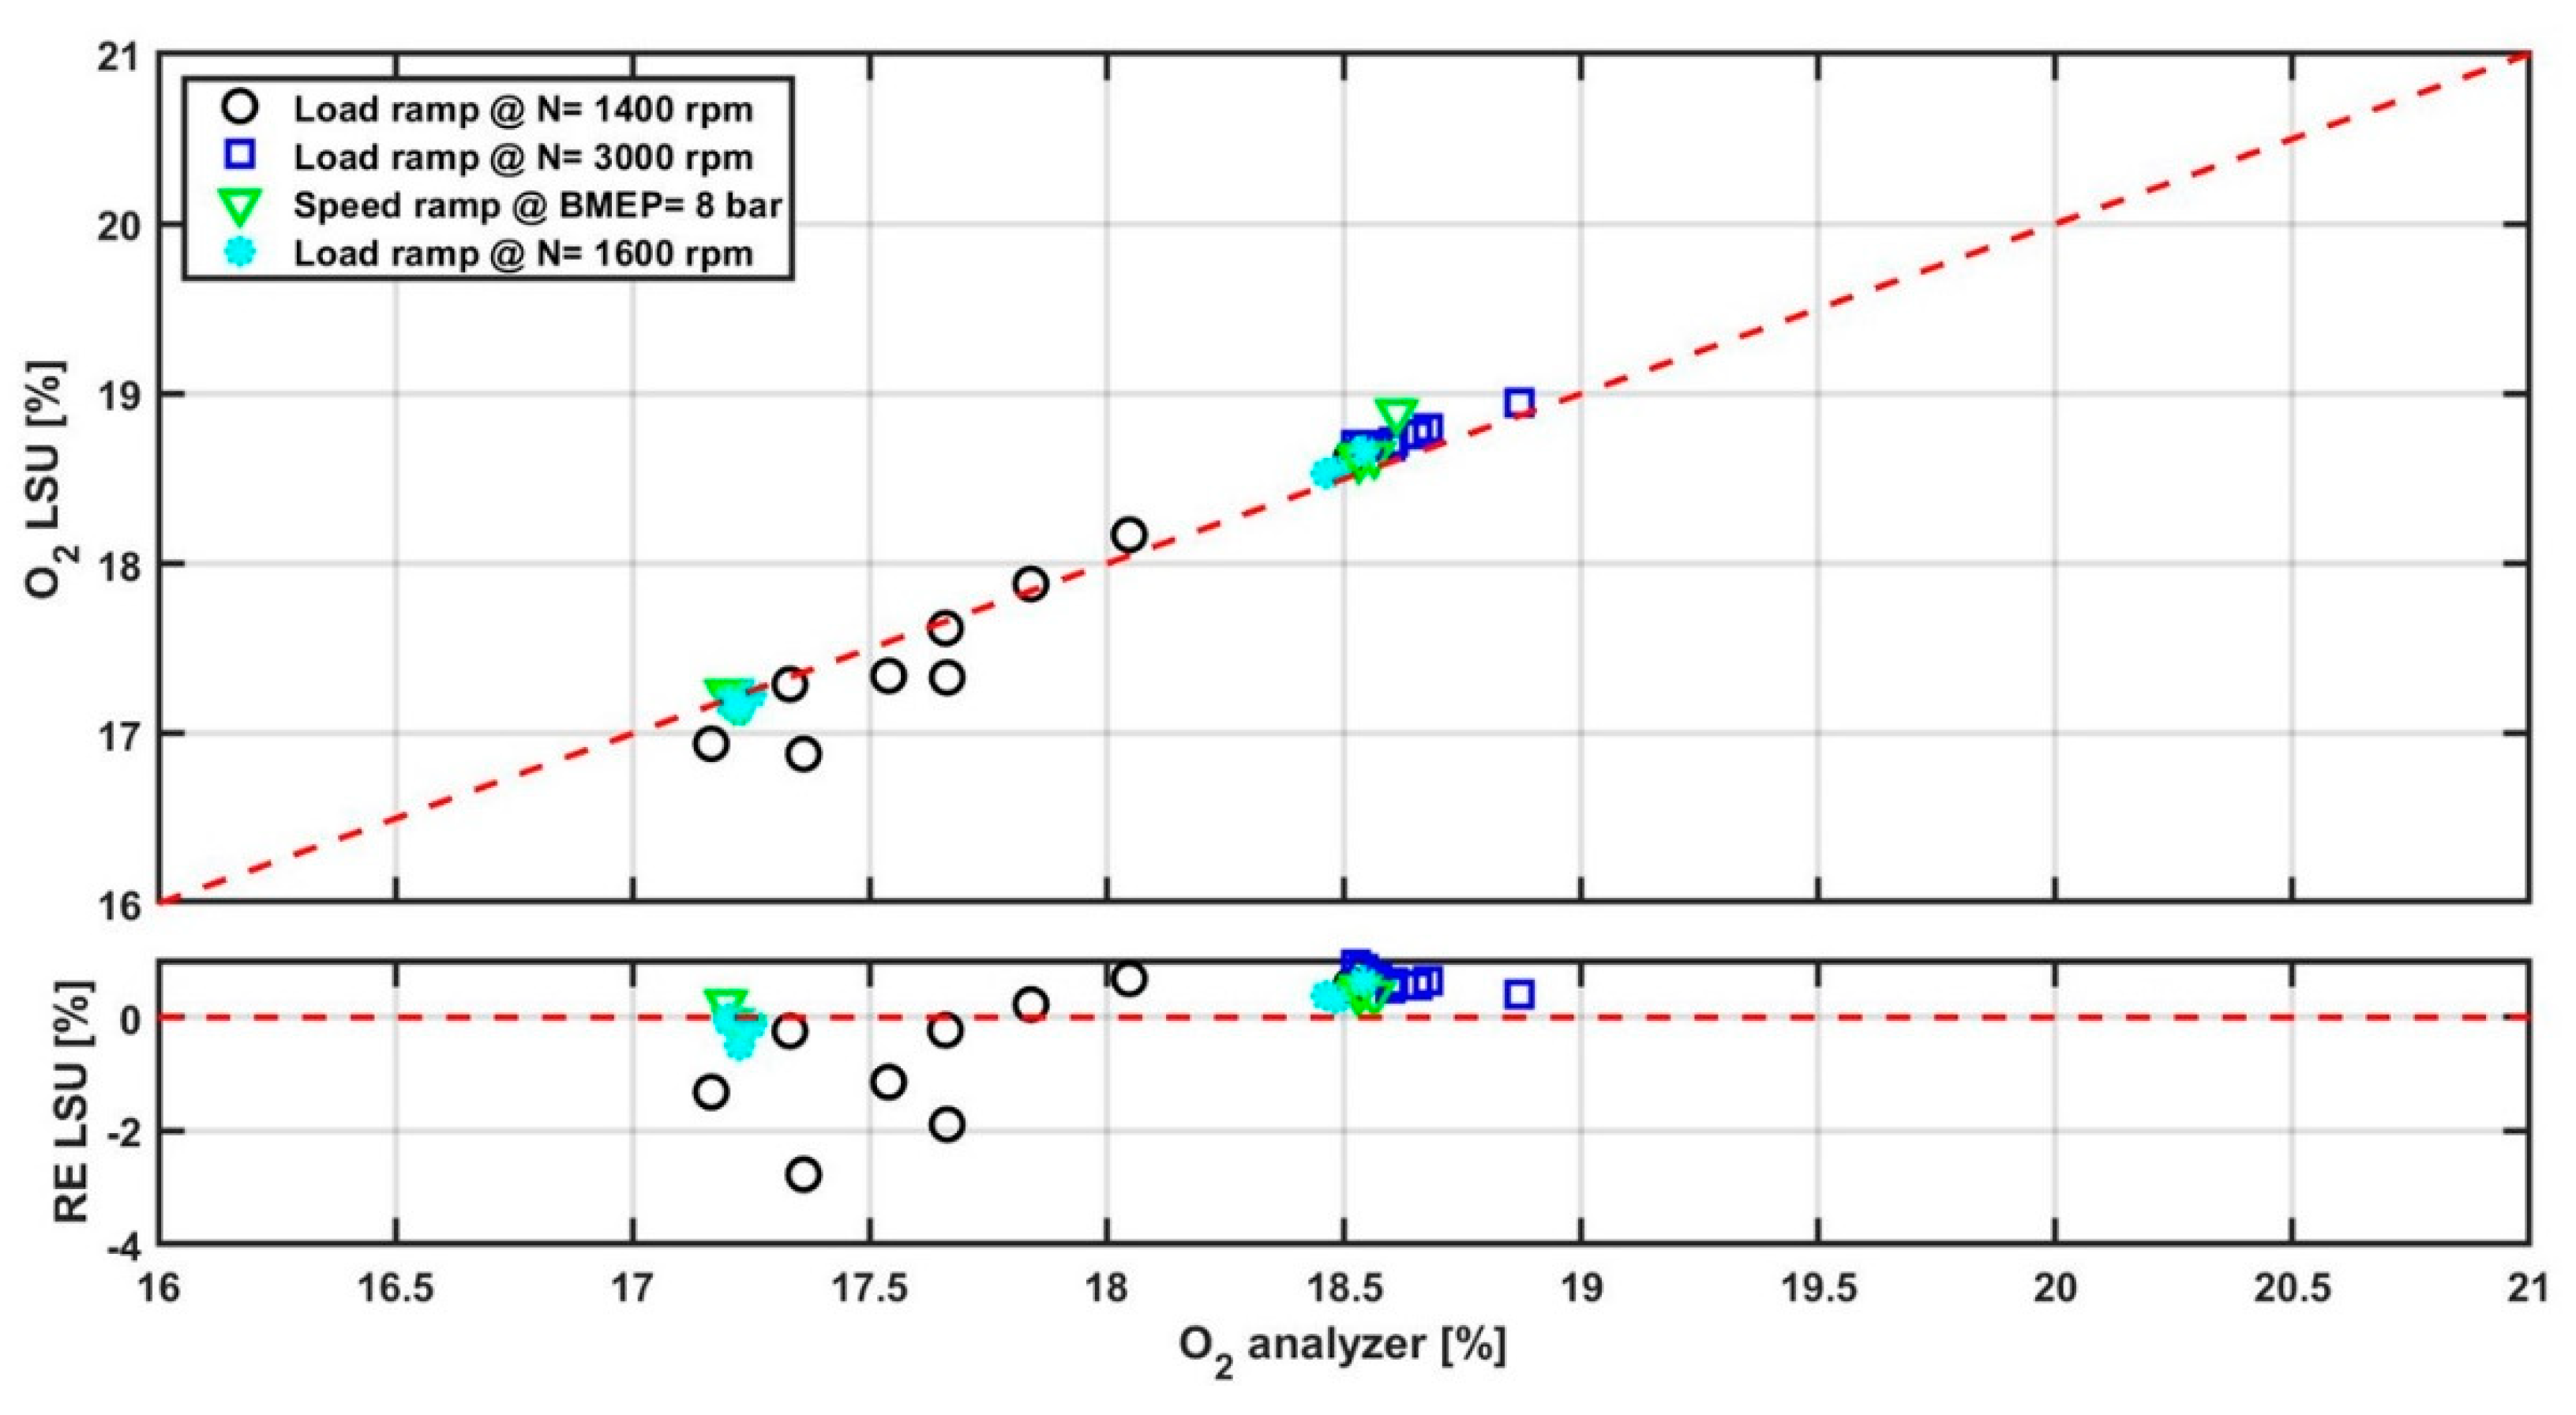
Transients tests (which are shown in
Figure 9) were also performed in order to verify the functionality of the calibrated oxygen sensor and to check its accuracy in comparison with the values read by the oxygen sensor of the test cell (which features the highest accuracy). It is worthwhile noting that additional tests (i.e., a load ramp at N = 1600 rpm and a speed ramp test at BMEP = 9 bar) were used for the validation of the intake O
2 sensor, but they not used for the validation of the controller in the subsequent section.
Figure 10 presents the results for the different ramps. The bottom part of the figure also reports the relative error of the LSU lambda sensor, which was calculated according to the equation:
where
indicates the O
2 concentration measured by the test cell gas analyzer (considered to be a reference) and
indicates the O
2 concentration that was measured by the LSU lambda sensor installed in the intake manifold. The raw O
2 concentration from the test cell analyzer was measured on a dry basis; therefore, it had to be corrected into a wet one in order to be compared with that of the LSU sensor, which is measured on a wet basis.
It can be noted that the most of the points feature an error in a range between −2% and 0. The O2 measurement is more accurate at high O2 percentages, since the LSU sensor was calibrated with an oxygen level of 20.6%.
3.3. Testing of the Model-Based Controller Through Rapid Prototyping
This section reports the main results concerning the functionality of the controller over the load ramps that are specified in
Section 2 and reported in
Figure 3.
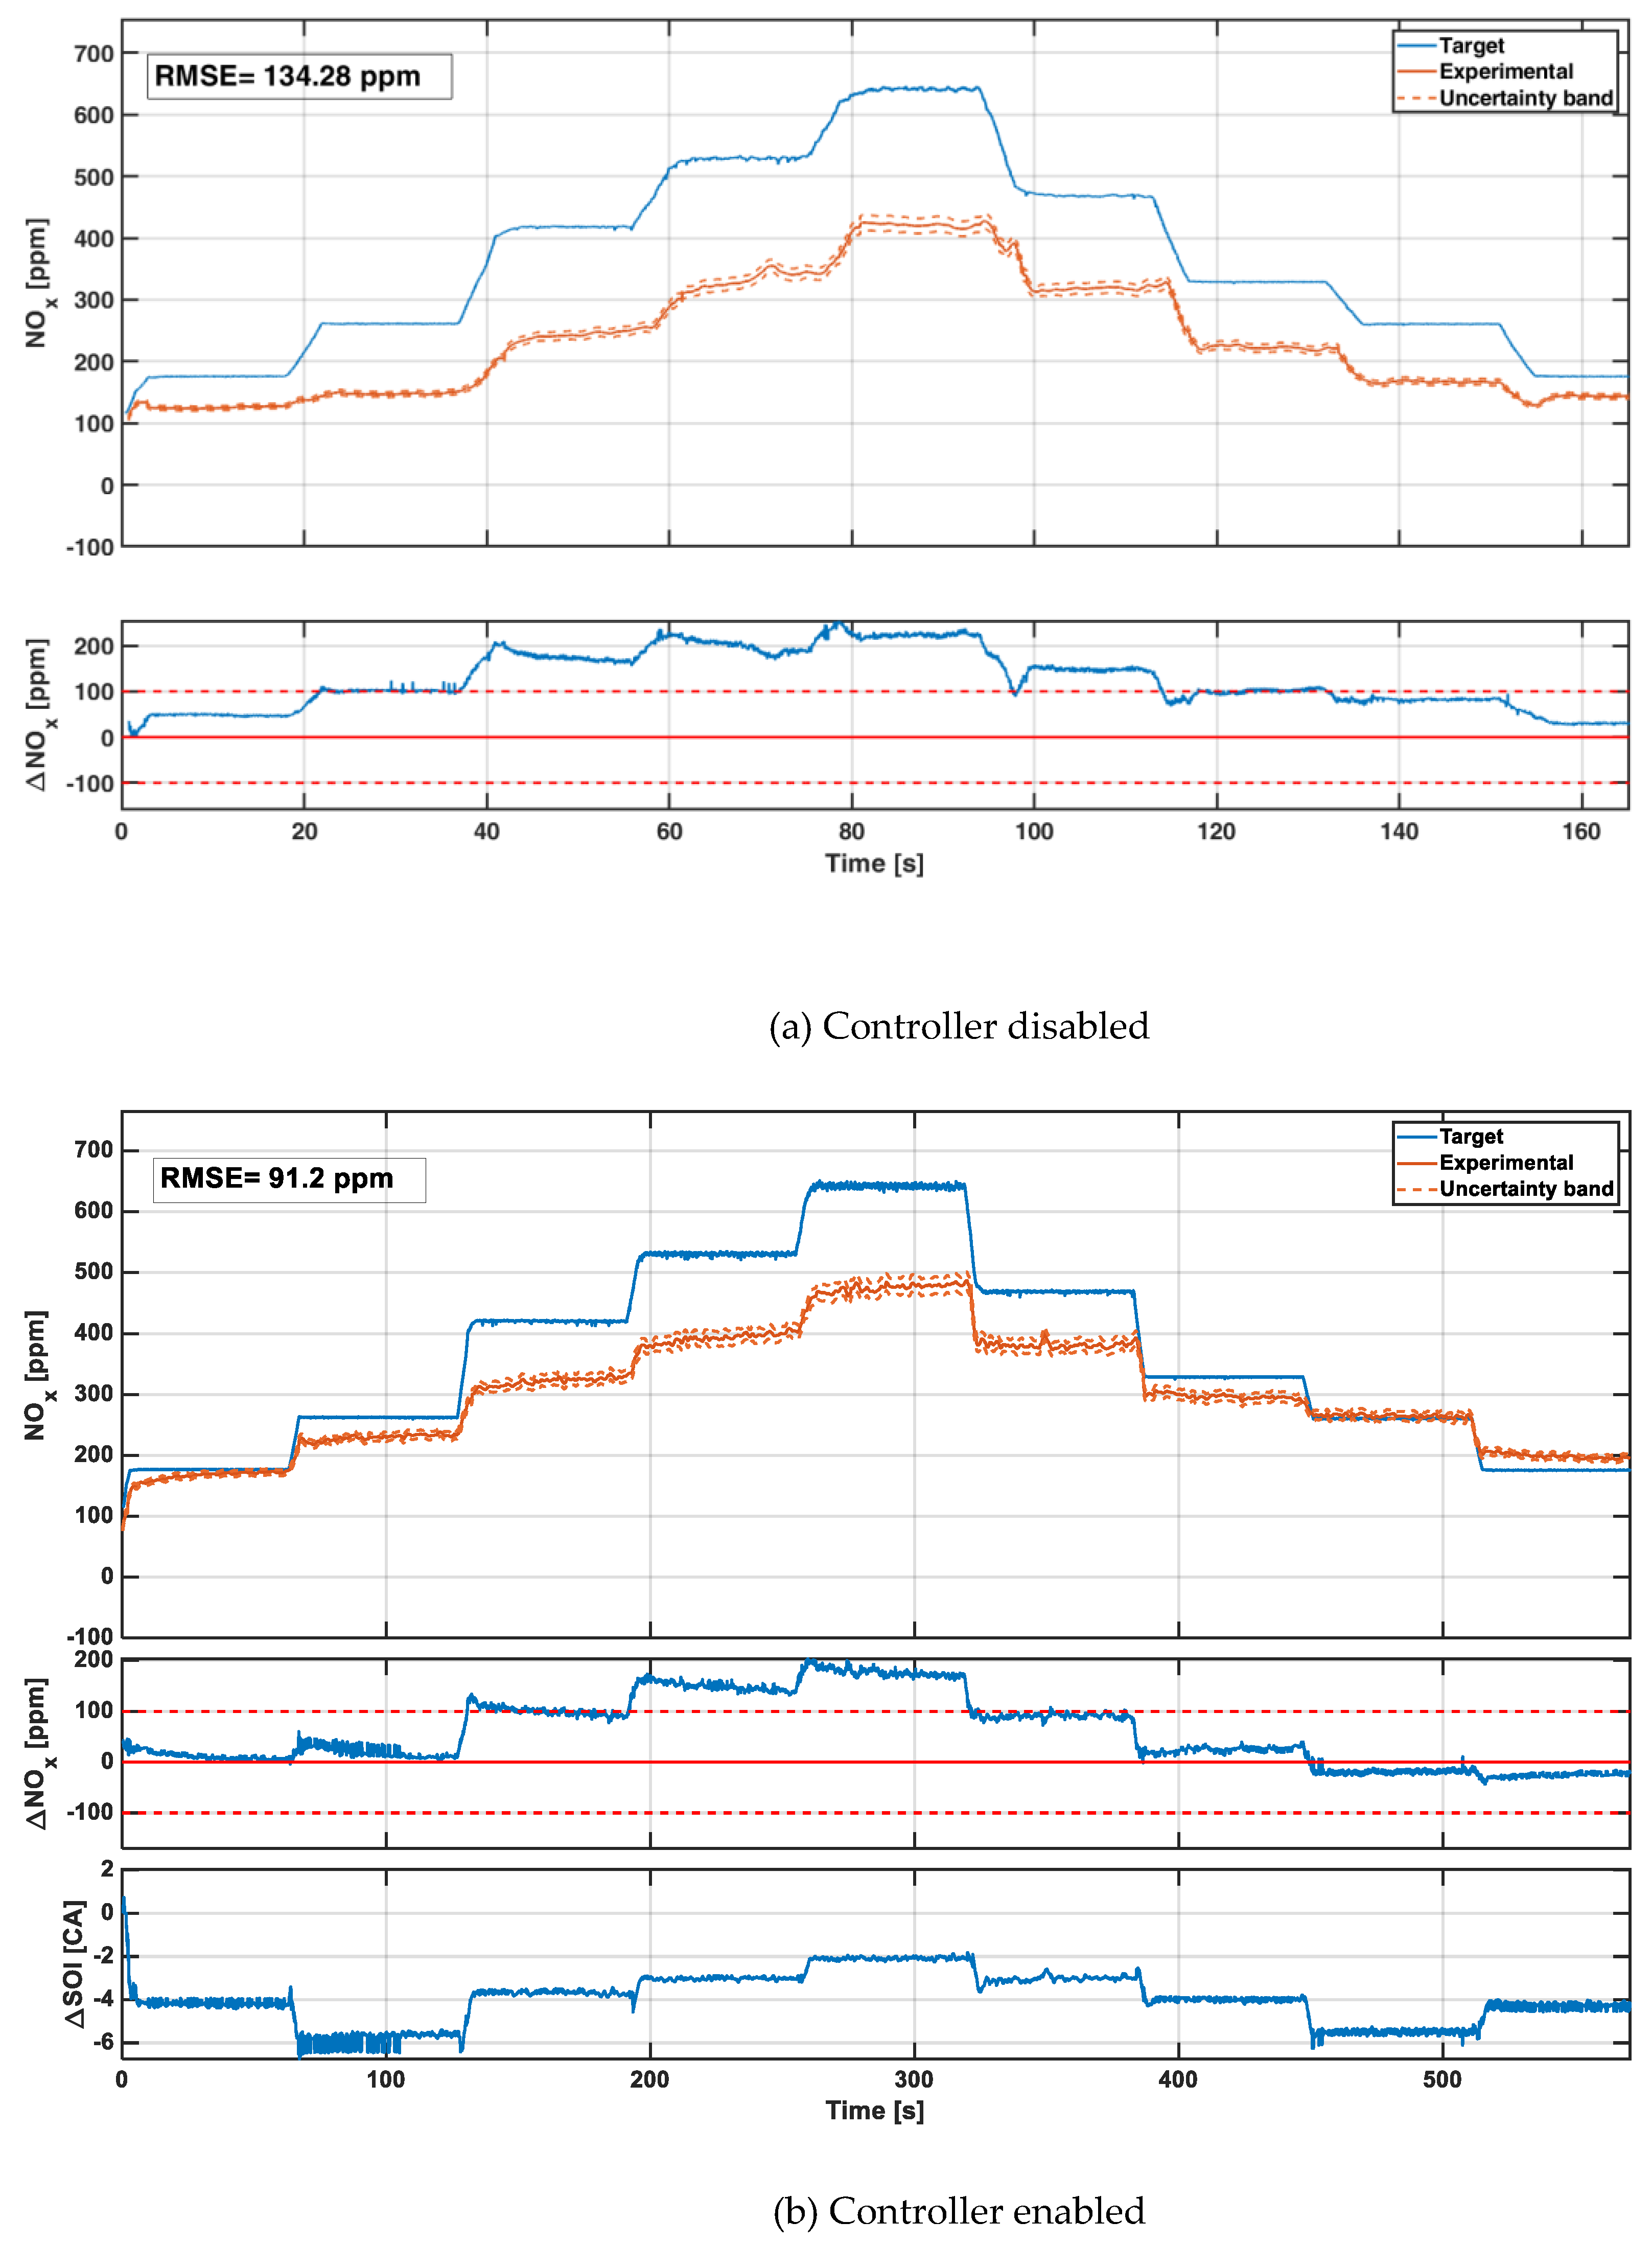
In particular,
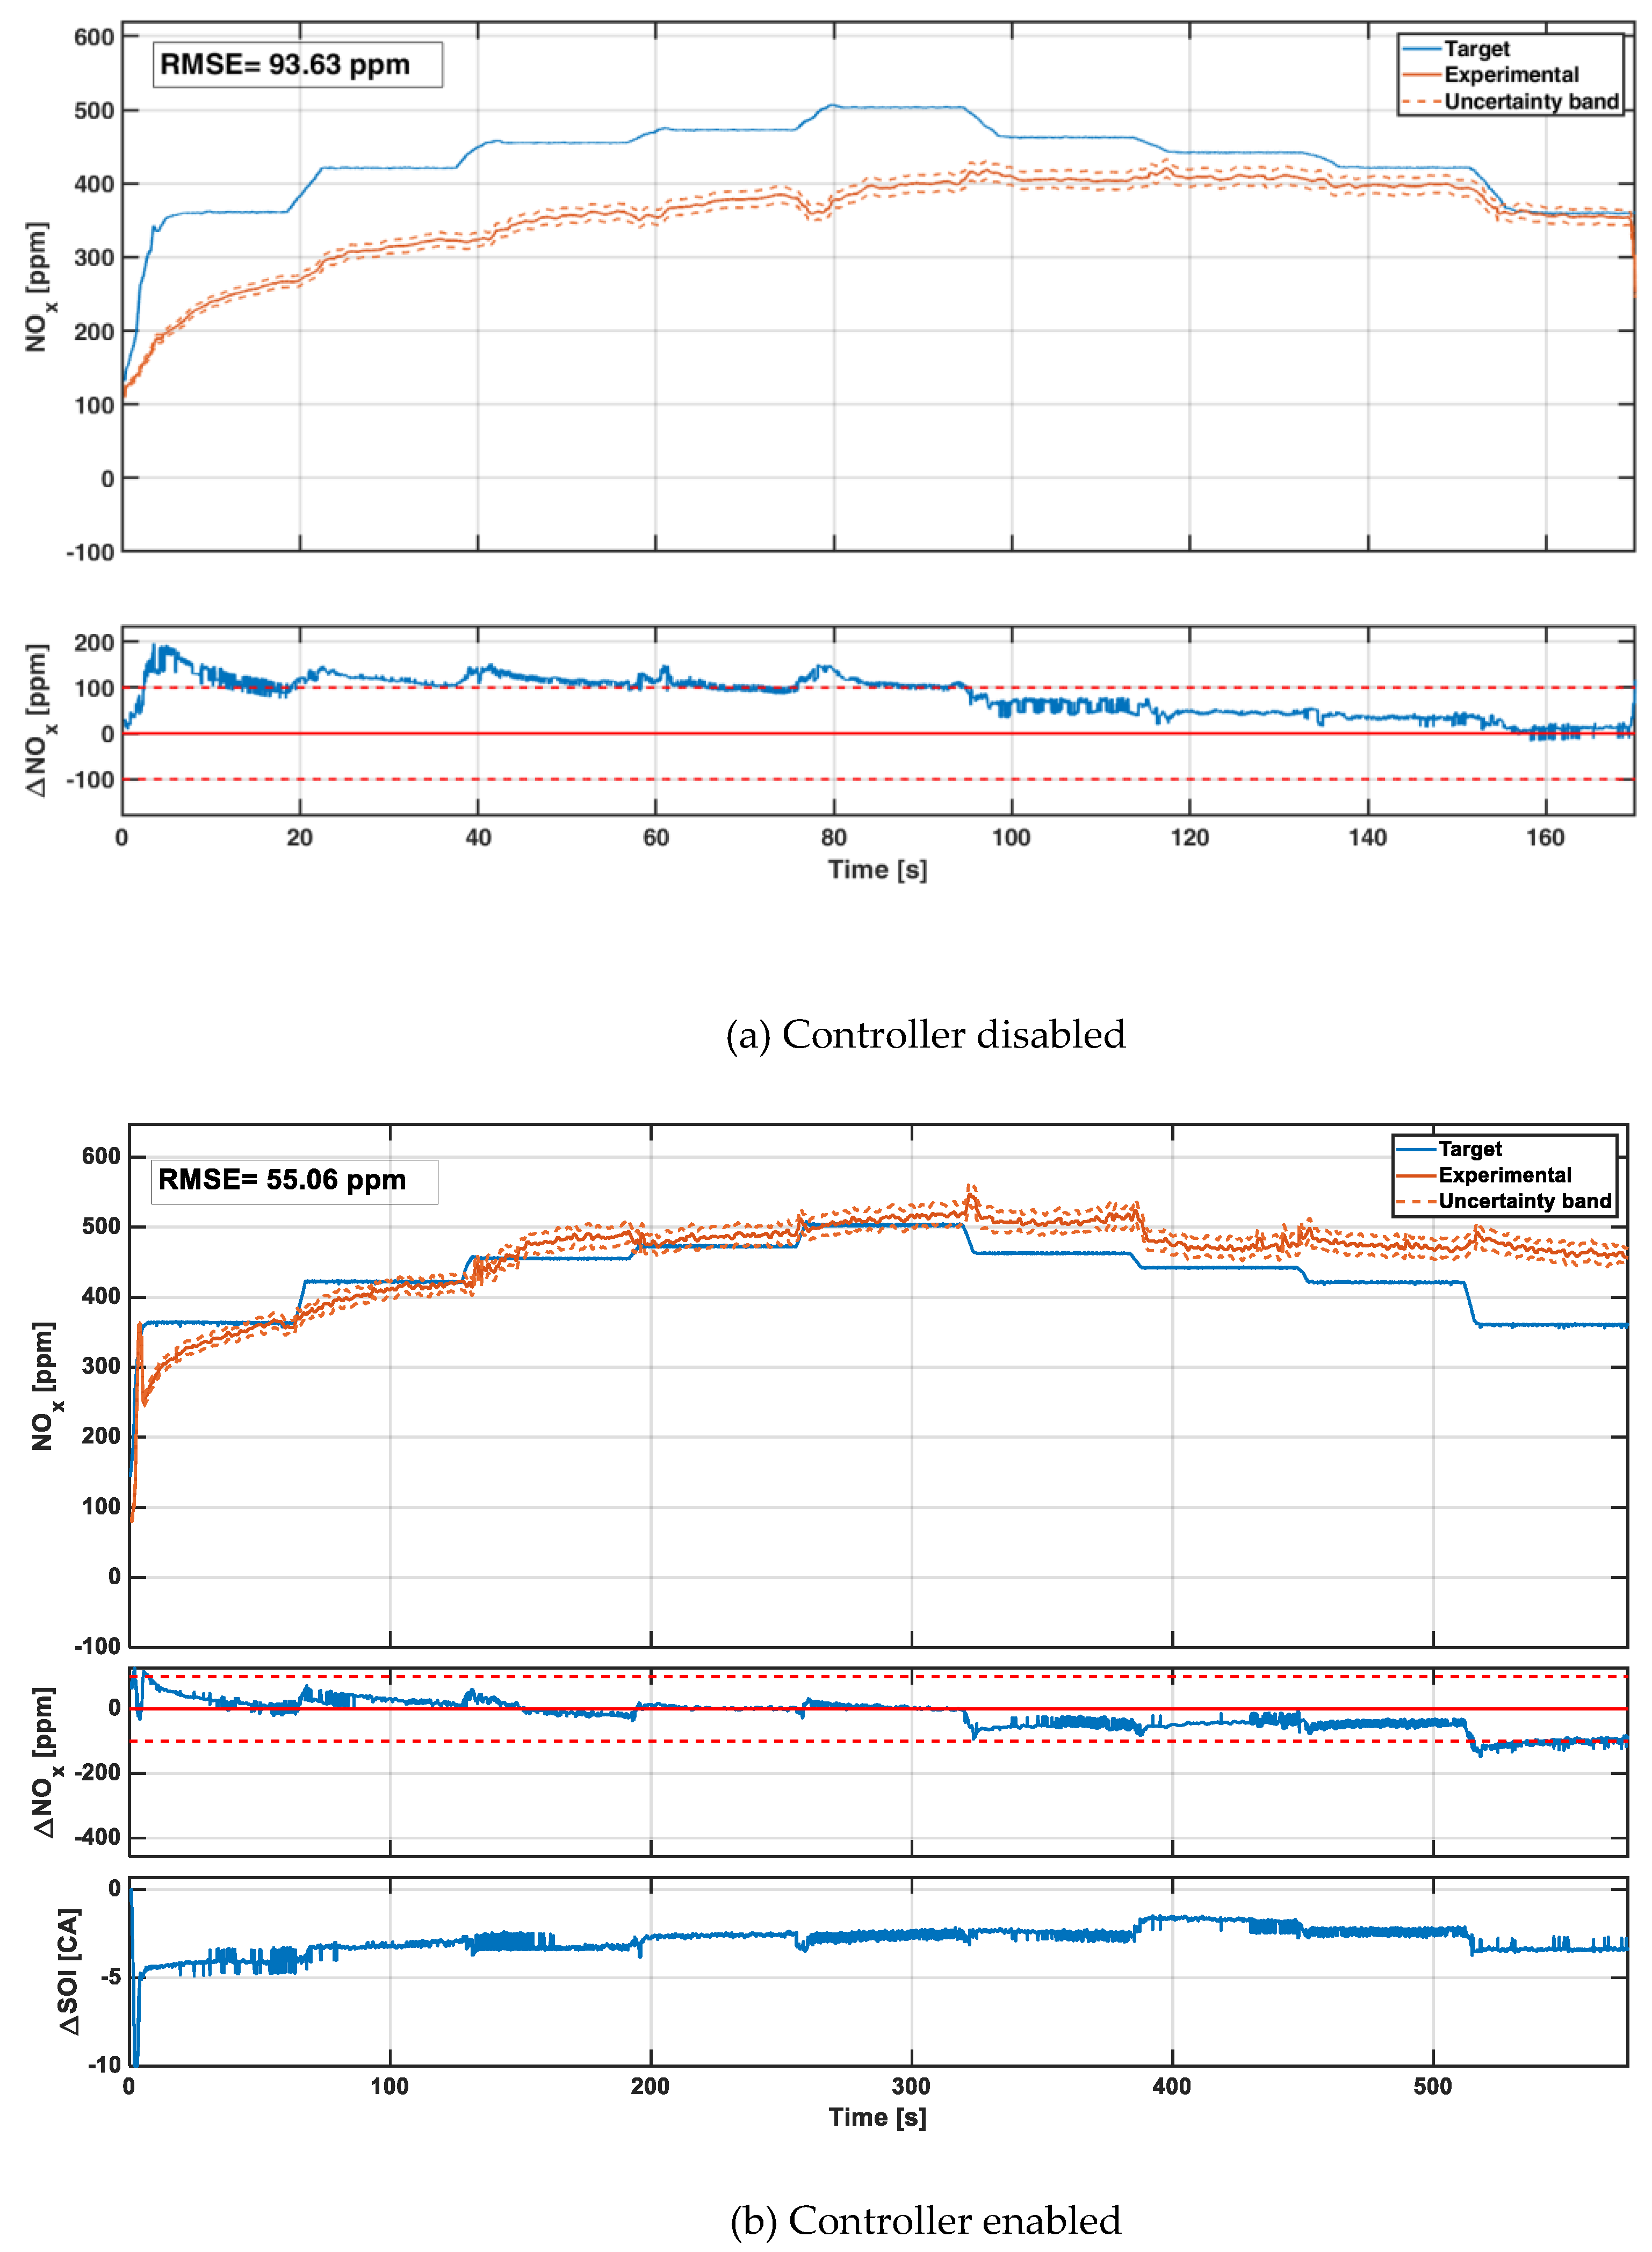
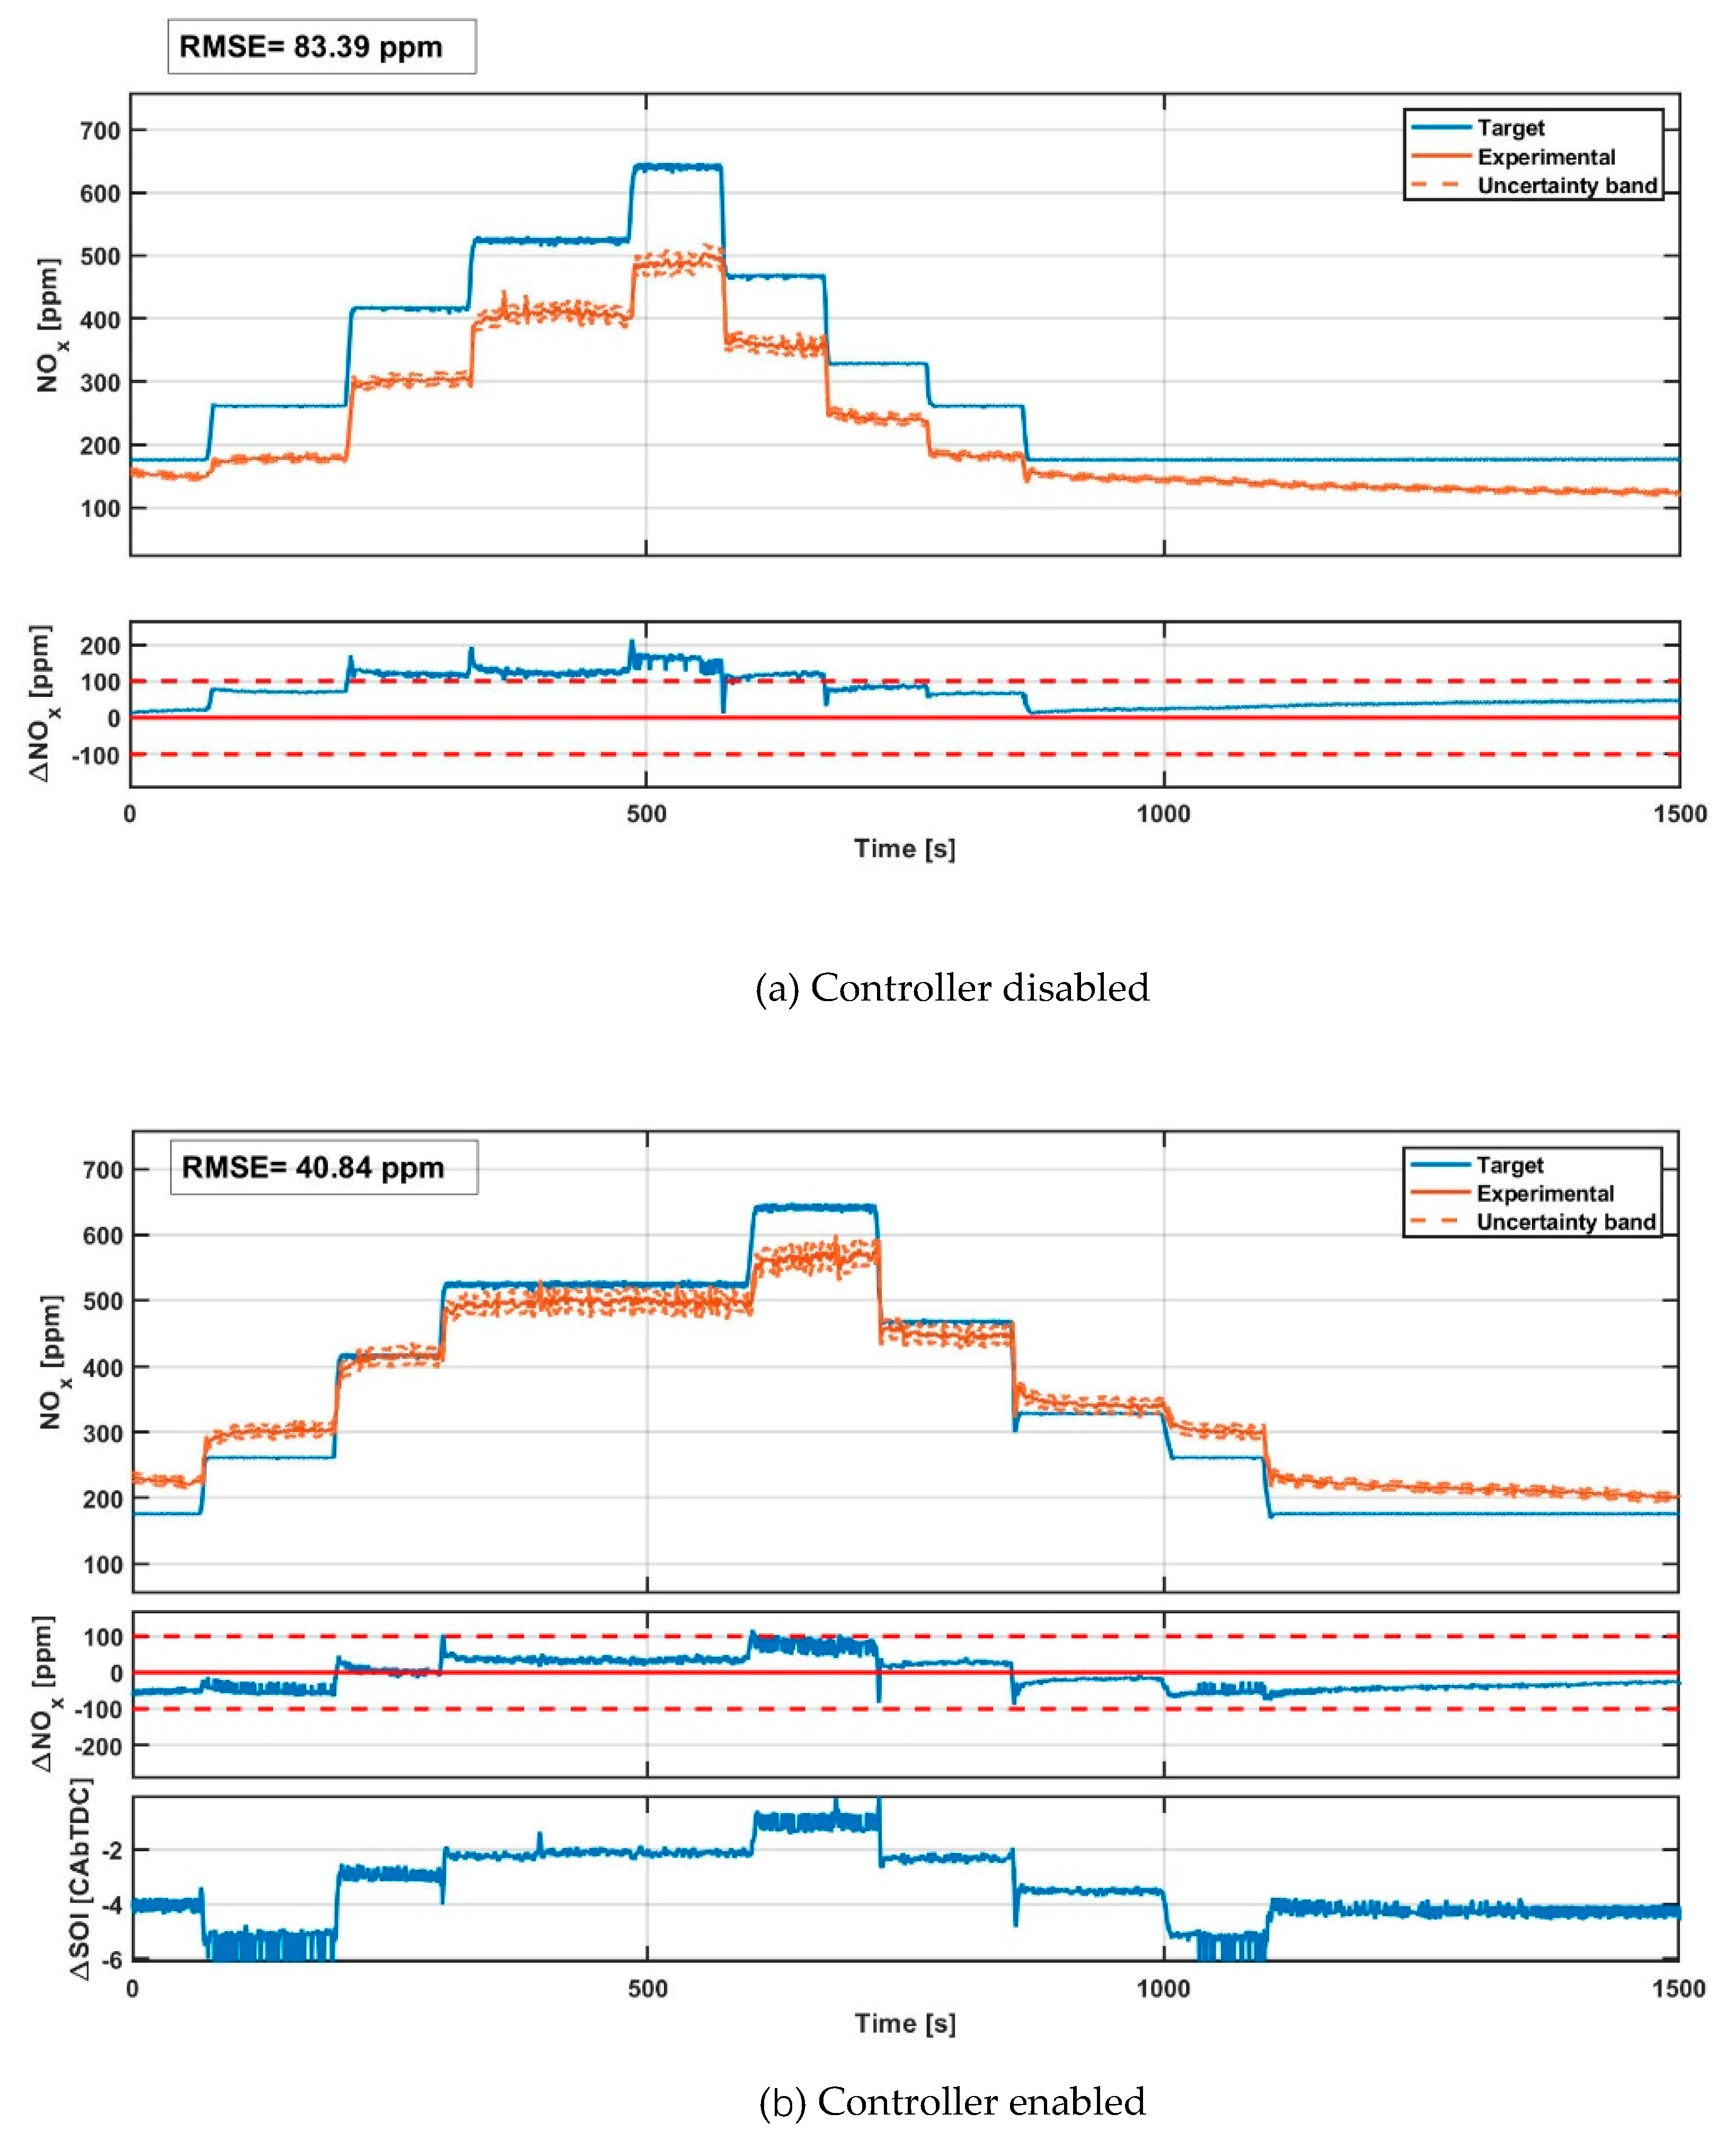
Figure 11 reports, for the load ramp #1 at N = 1400 rpm, the target and measured NO
x emissions when the controller is either not enabled (
Figure 11a) or enabled (
Figure 11b). As previously stated, the NO
x target was defined by means of a map (in which the inputs are the load and speed of the engine). This map was derived while using the NO
x levels that are emitted by the engine under steady-state warmed conditions with baseline engine calibration. The experimental NO
x level shown in the chart was derived from the test bench gas analyzer.
Figure 11b also reports the SOI
main deviation (ΔSOI), with respect to the baseline value, when the controller is enabled. The RMSE between the target and actual NO
x levels is also reported above the figures. The uncertainty band was also added around the experimental NO
x trends.
Figure 11 shows that the activation of the controller allows obtaining a general improvement in the emitted NO
x levels, with respect to the desired targets, especially at medium-low loads. However, an error peaking at about 150 ppm occurs around the middle part of the ramp test. It will later be clarified that this error is partly due to model prediction error, and partly due to engine thermal state effects on NO
x formation.
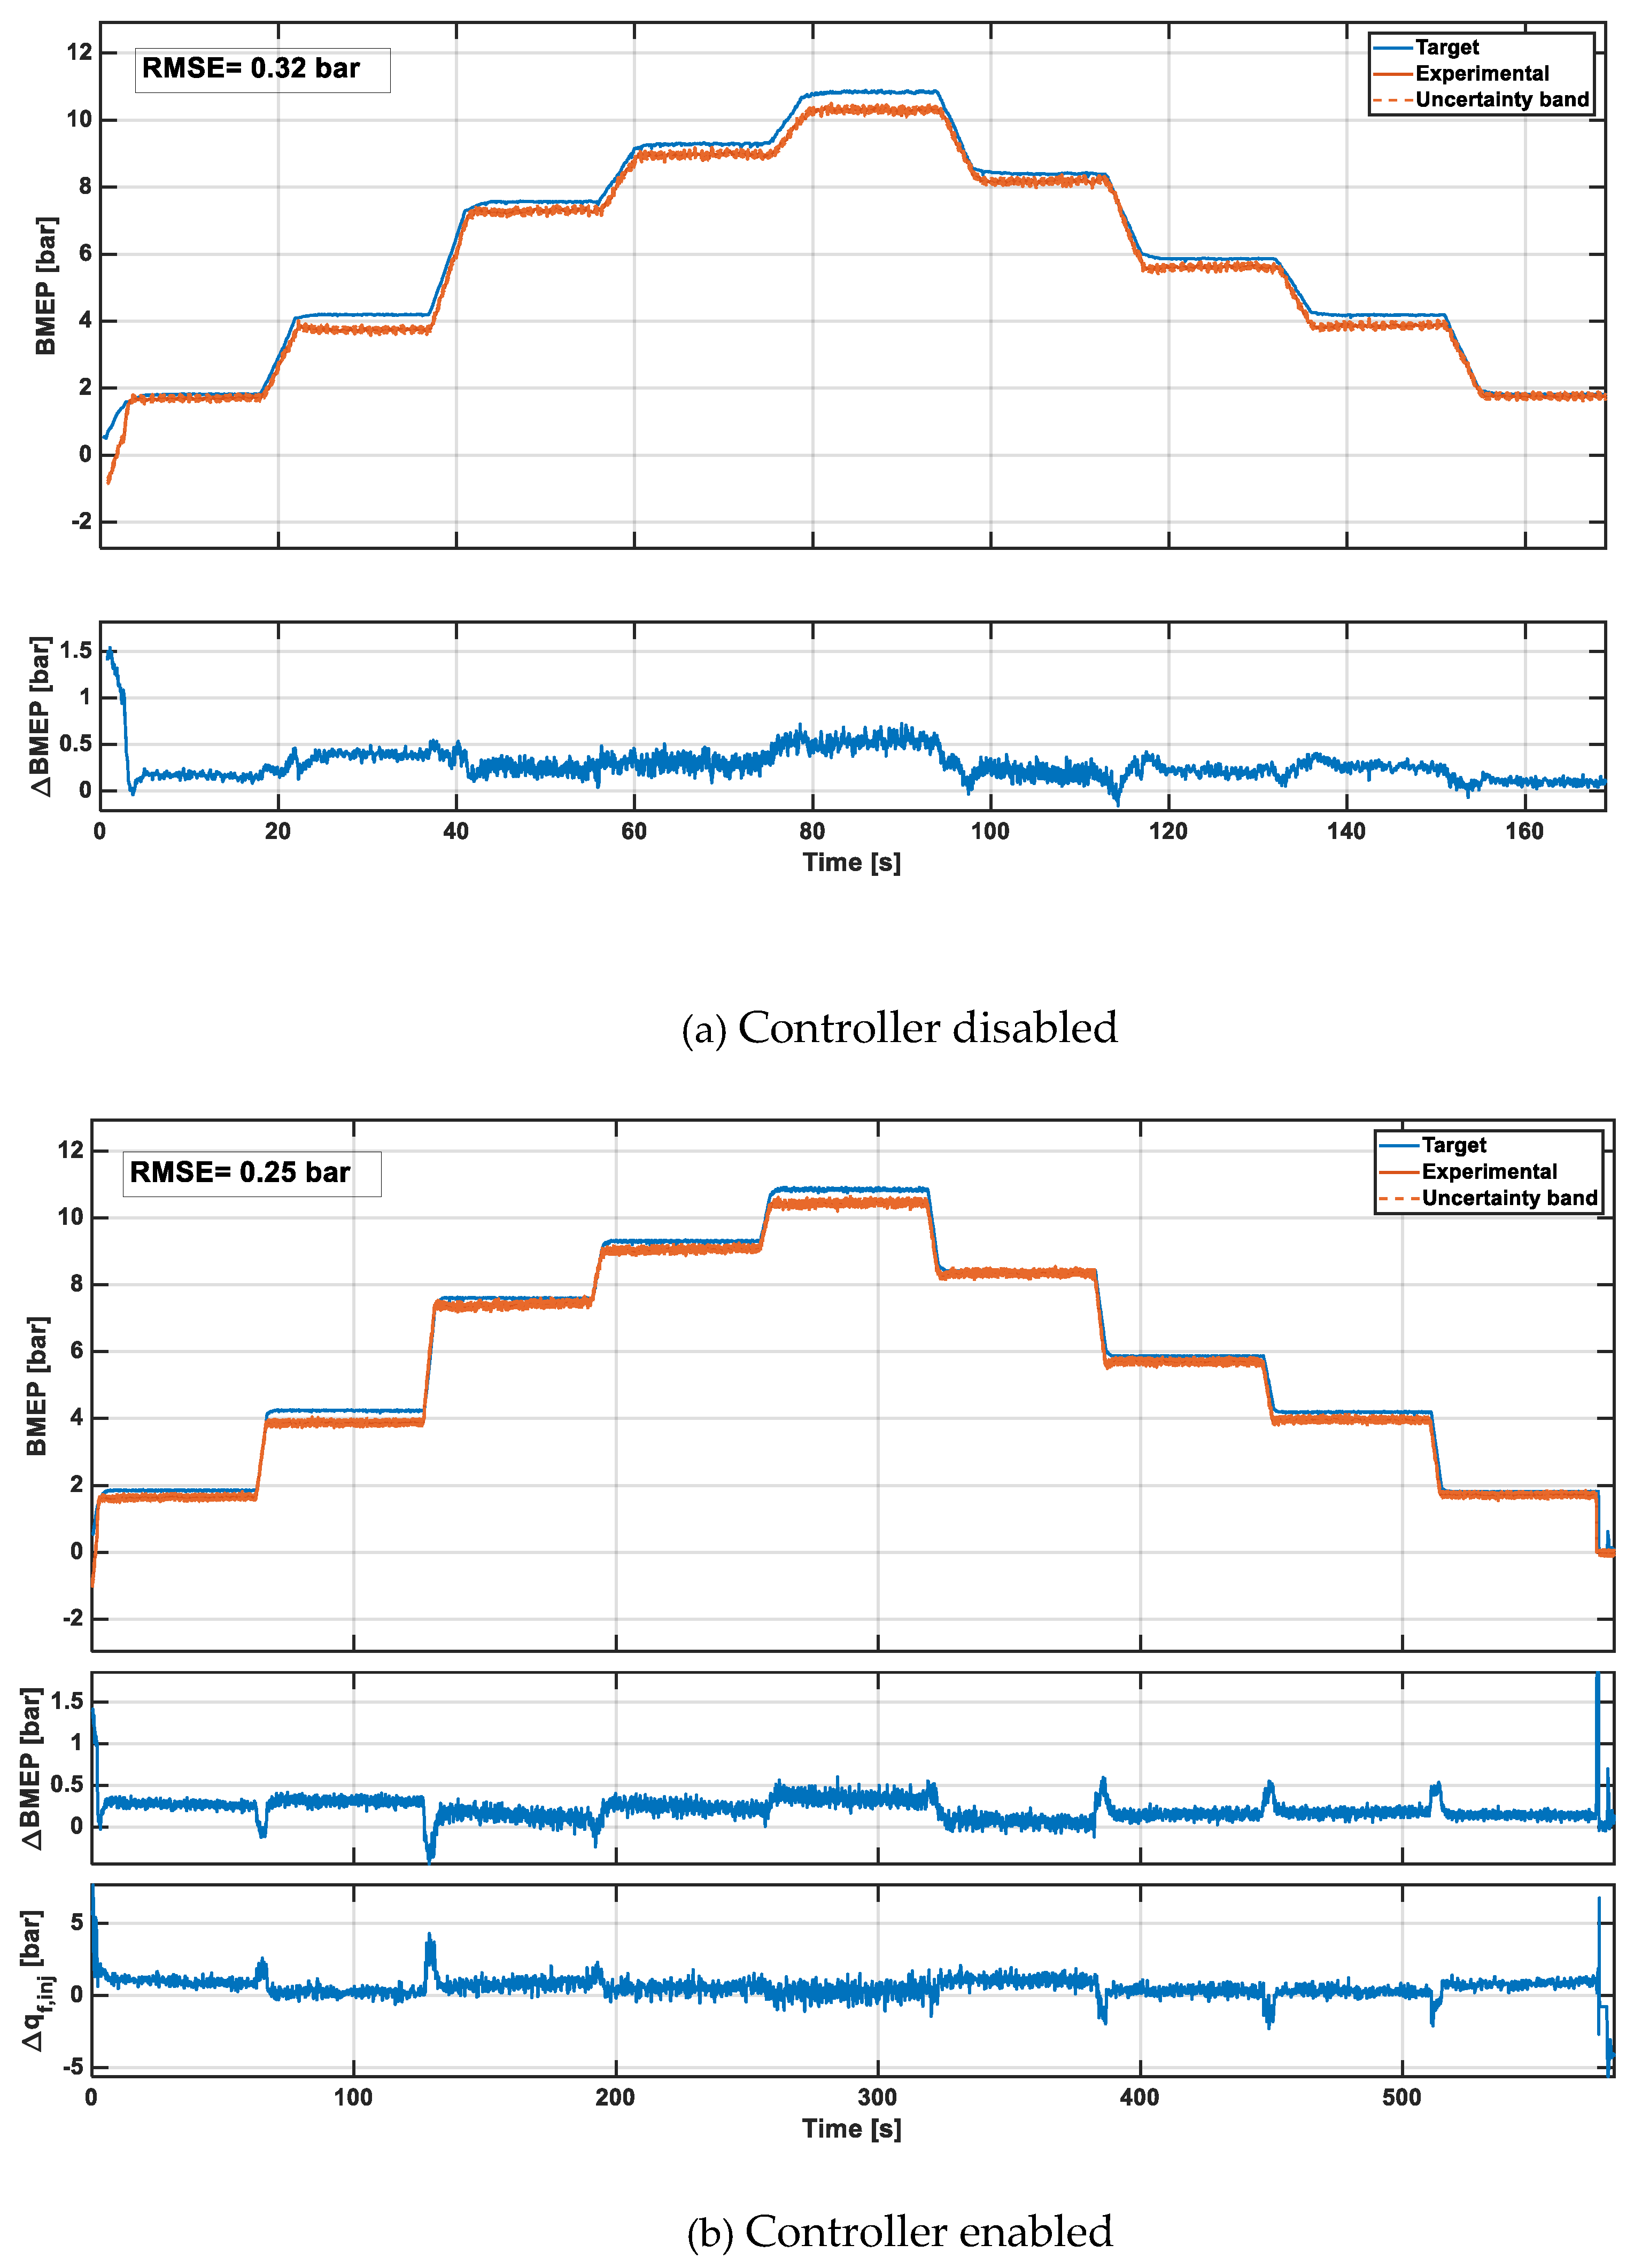
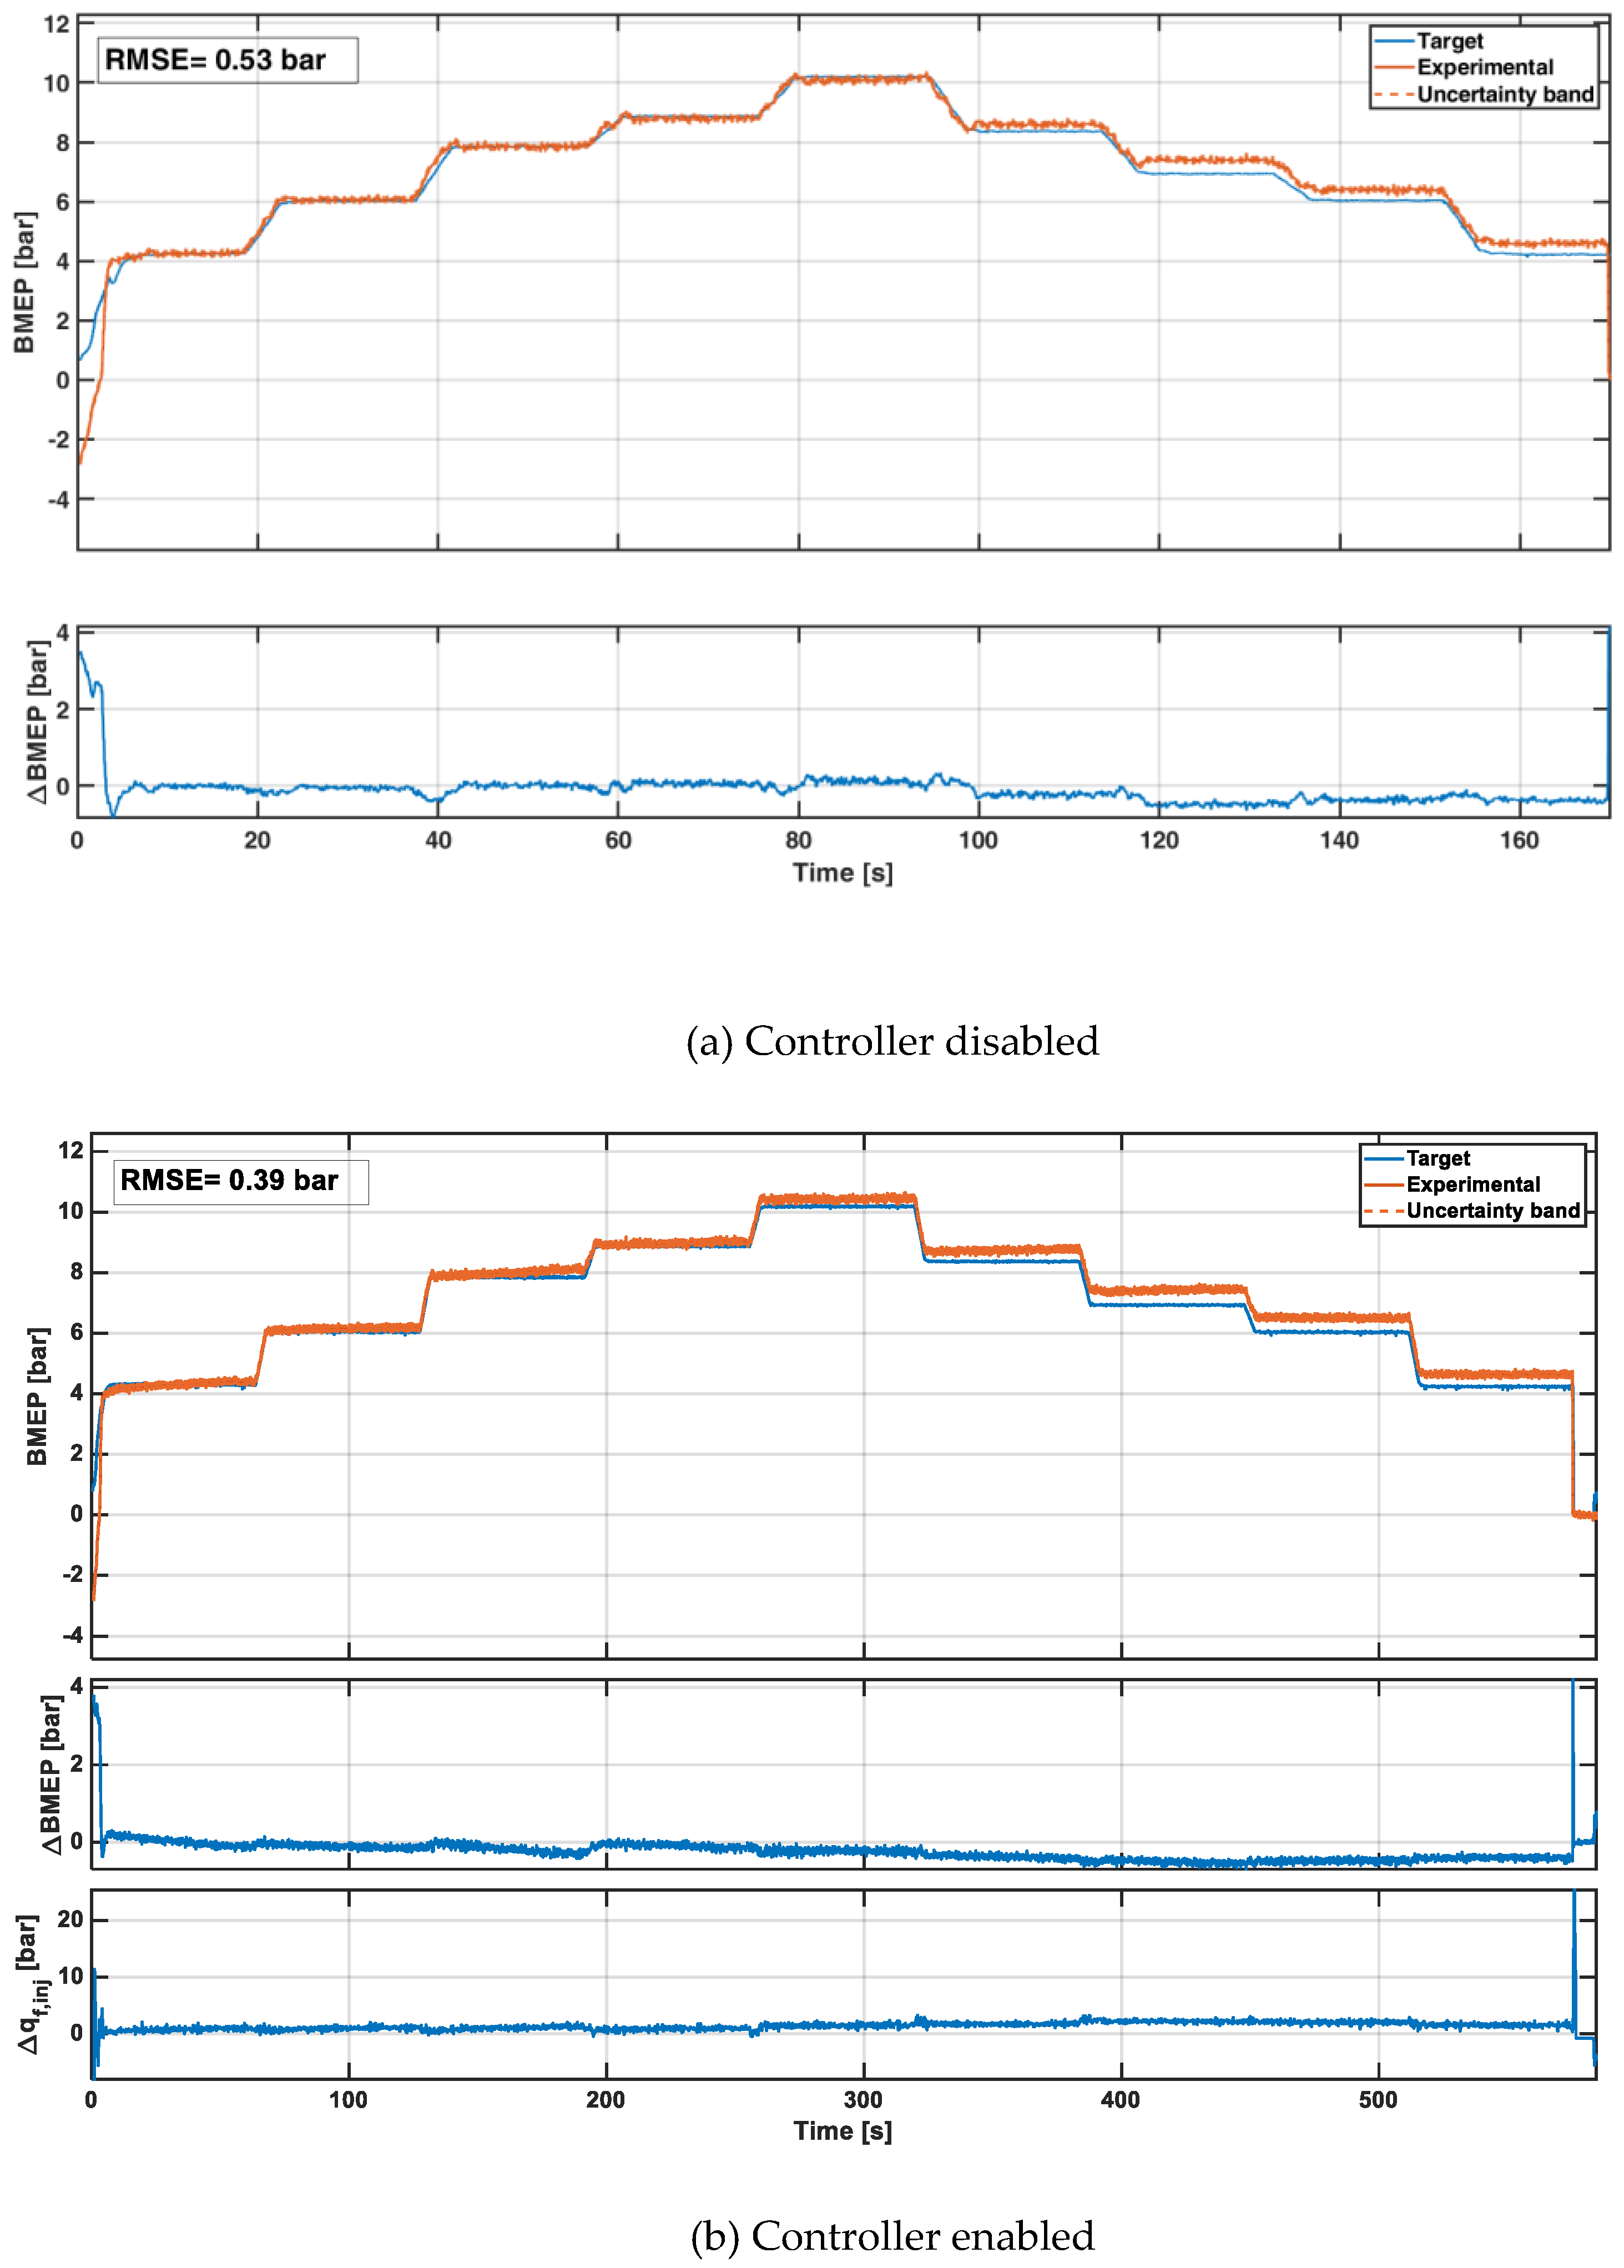
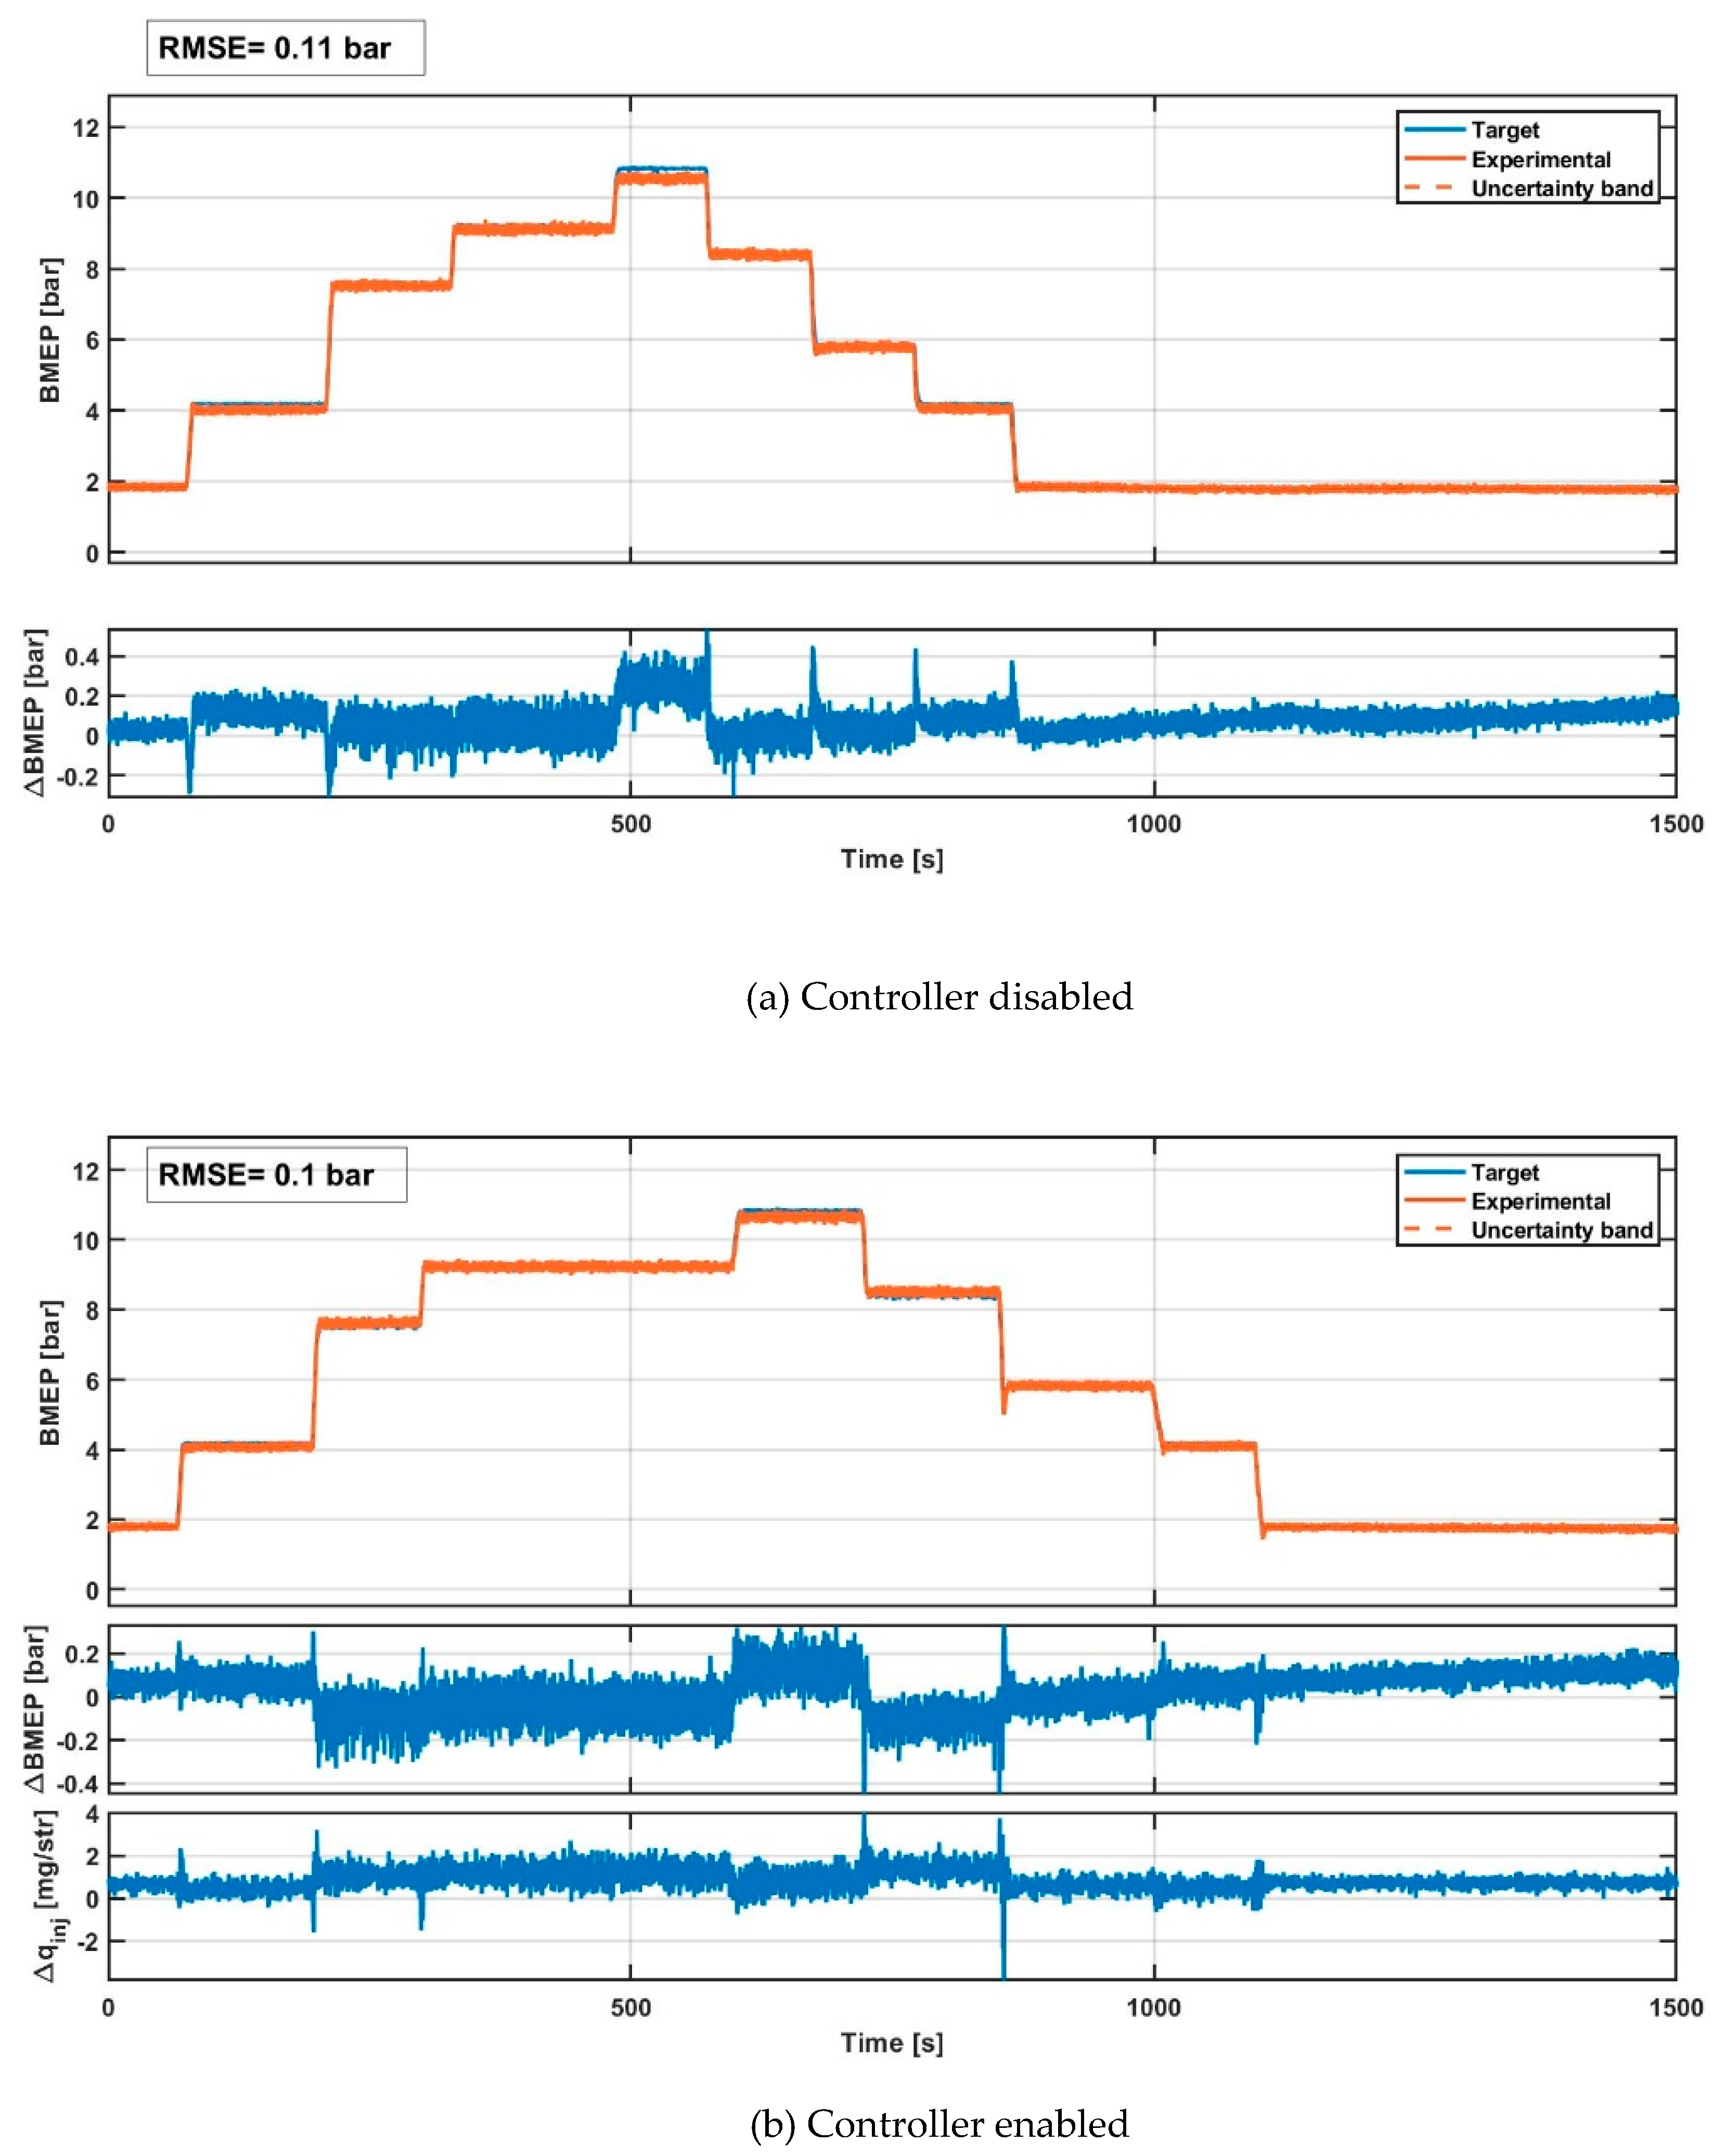
For the same ramp test,
Figure 12 reports the target and experimental BMEP values when the controller is either not enabled (
Figure 12a) or enabled (
Figure 12b).
Figure 12b also reports the q
f,inj deviation (Δq
f,inj), with respect to the setpoint value, when the controller is enabled. The RMSE values are also reported above the figures. The uncertainty band was also added around the experimental BMEP trends.
It can be seen that the BMEP control is very accurate. When the controller is activated, the value of the RMSE is, in fact, reduced from 0.32 bar to 0.25 bar.
The same results are also reported, in
Figure 13 and
Figure 14, for the load ramp #3 at N = 3000 rpm.
In contrast to the results obtained for the load ramp #1, NOx emission control is more accurate for the load ramp #3. A reasonable explanation for this result is that the transient thermal effects (that are not handled by the current version of the combustion model) are more significant at lower speed conditions (i.e., at N = 1400 rpm). Therefore, in those conditions, the NOx levels that are emitted by the engine deviate significantly from the corresponding steady-state points in warm conditions. Furthermore, the BMEP control remains very accurate also for this load ramp test at N = 3000 rpm.
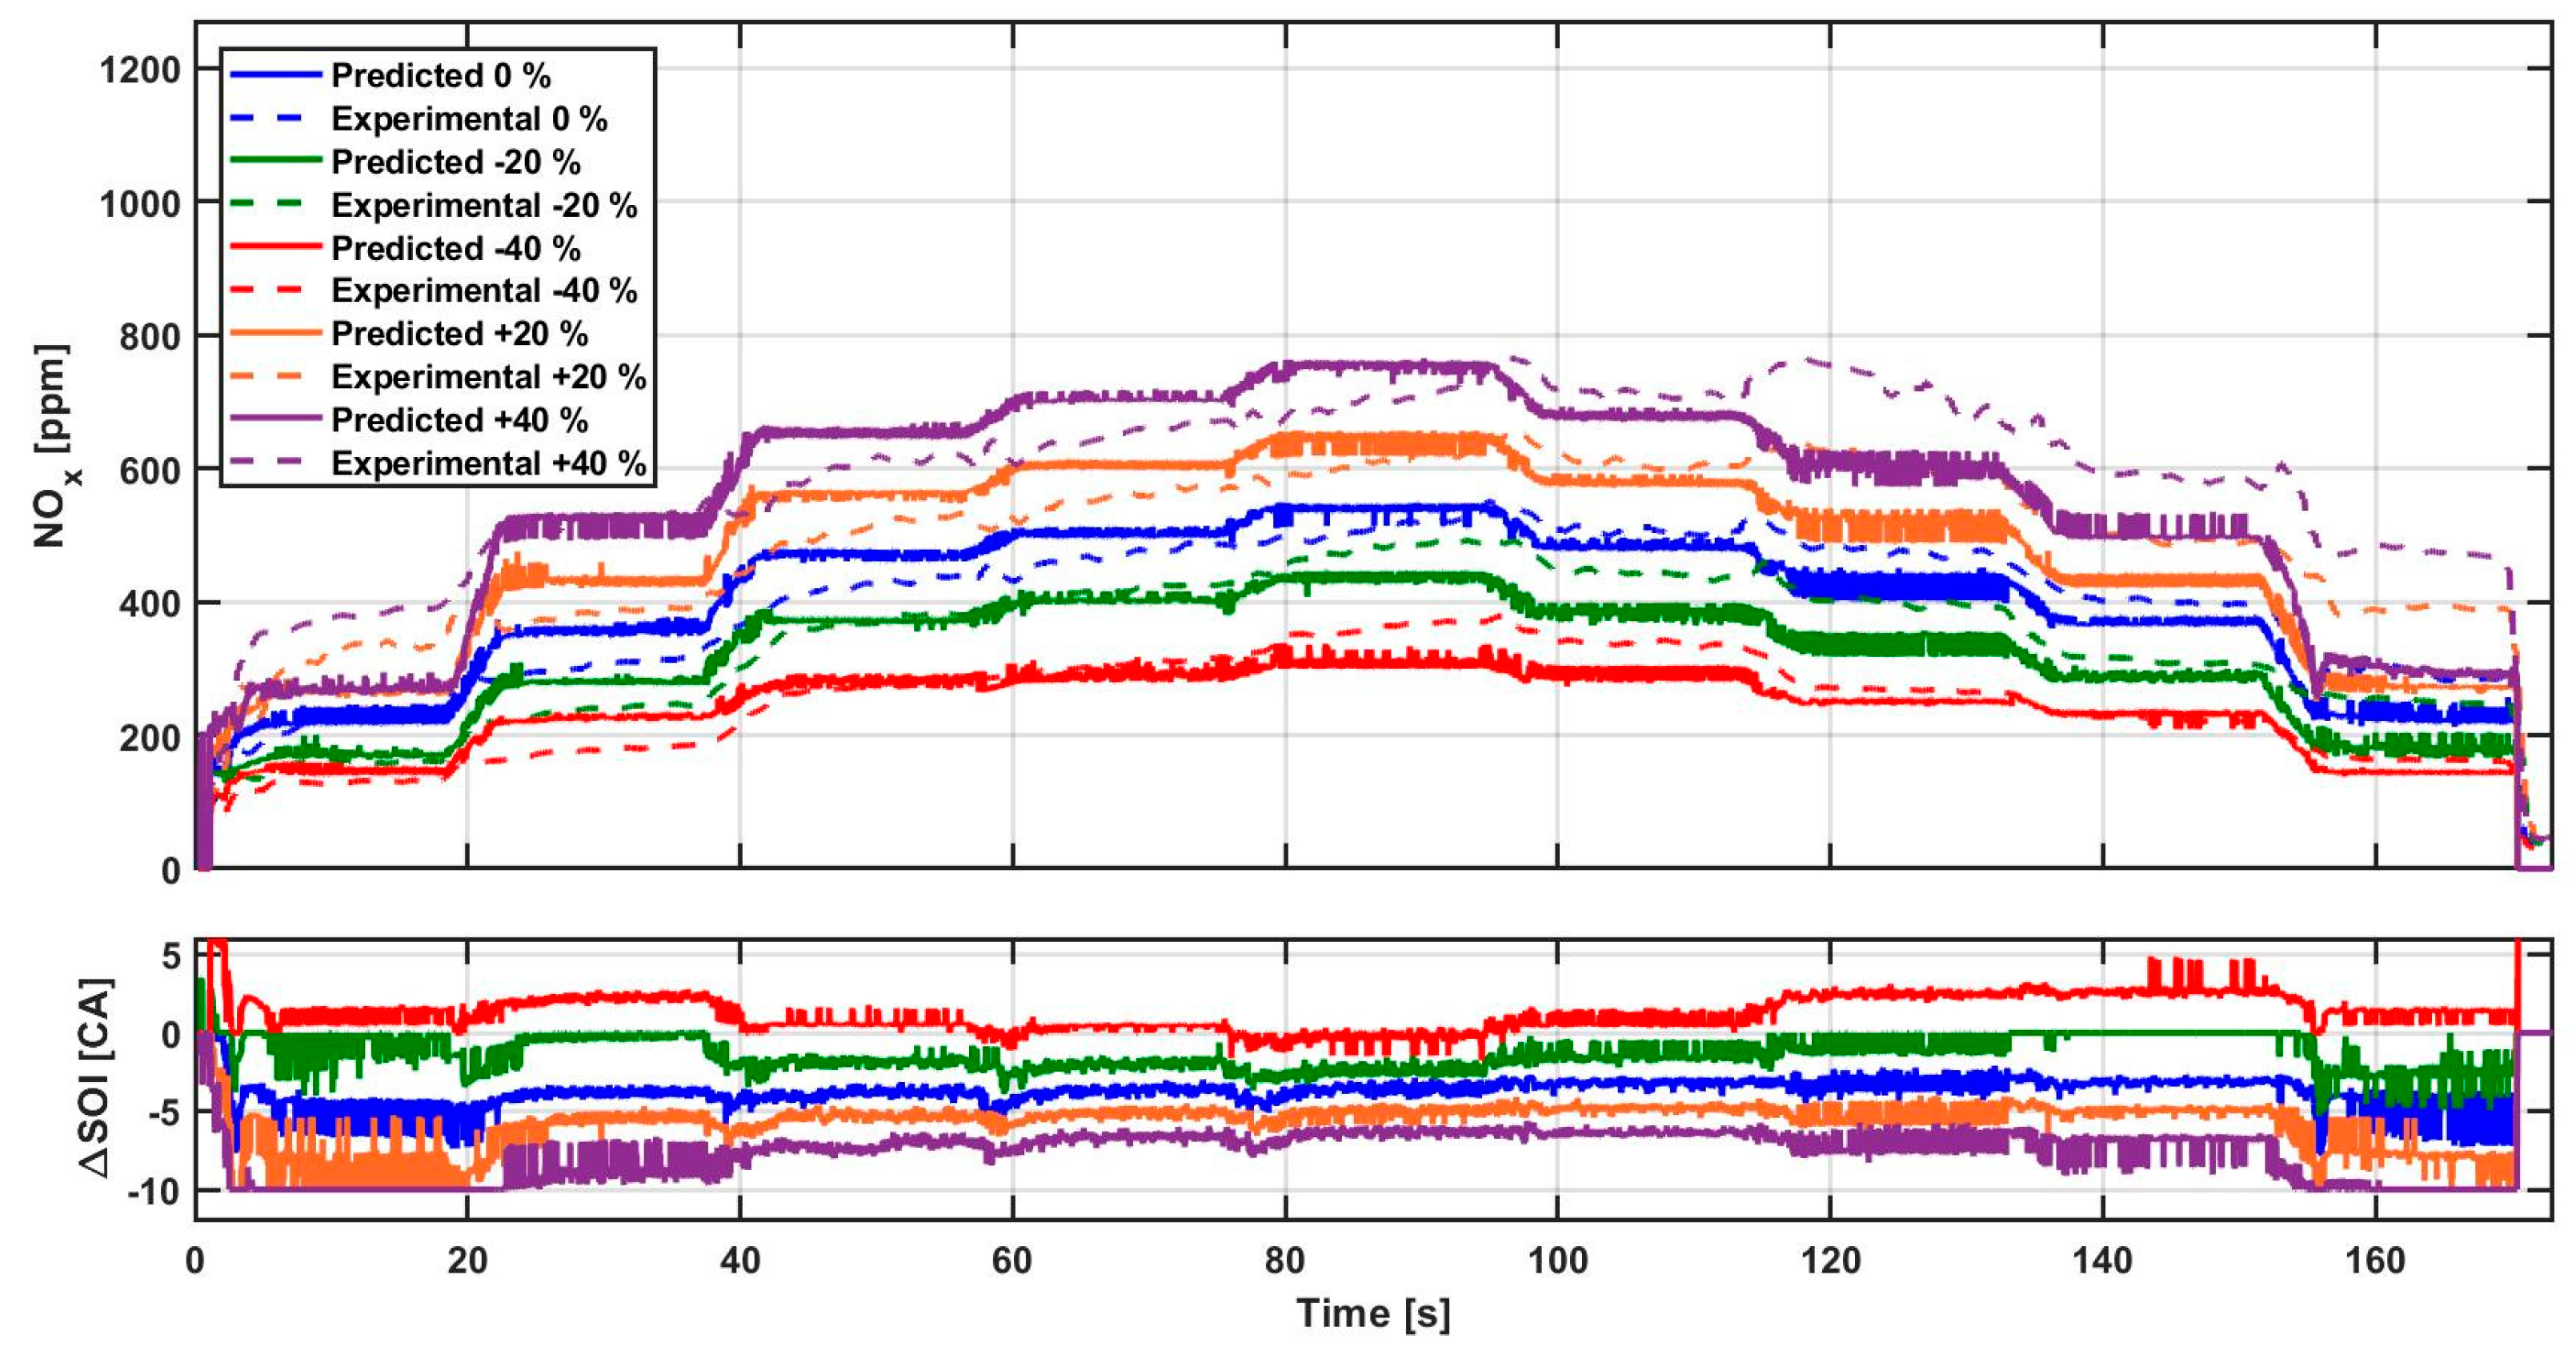
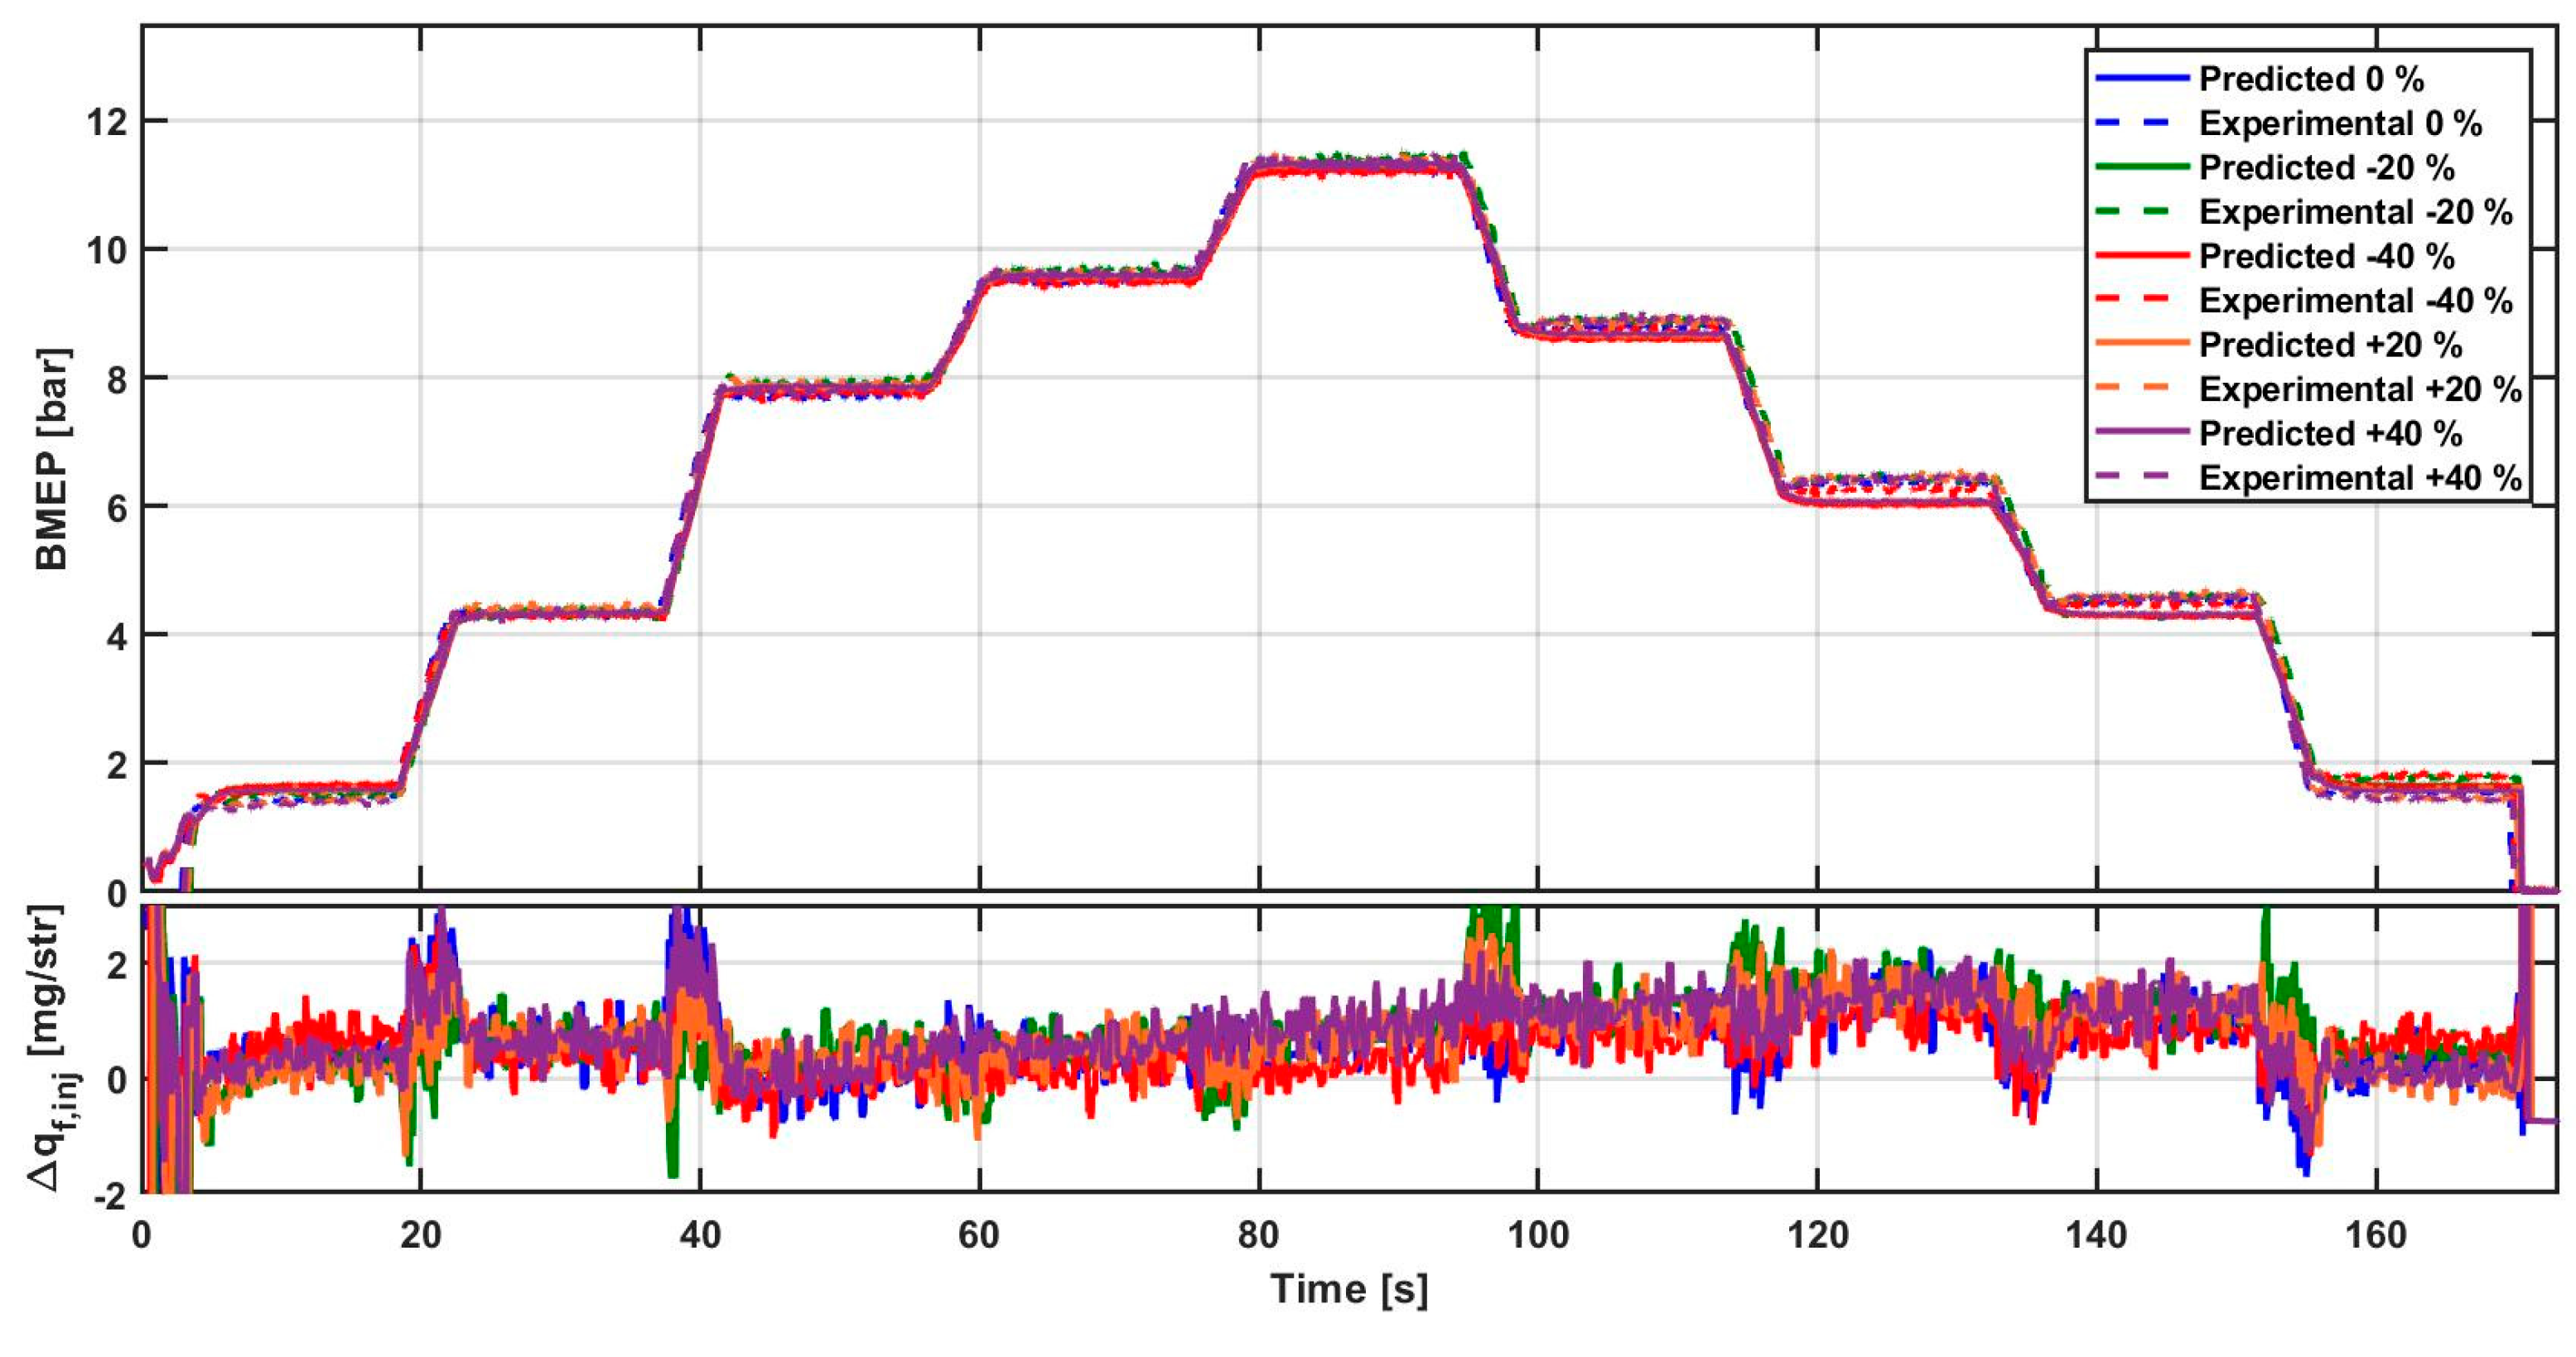
Figure 15 shows the results of the tests that were performed over the load ramp #2 at N = 2500 rpm (see
Section 2). In particular, different levels of NO
x target values (i.e., map target value and ±20%/±40% variations from map target values) were set at constant BMEP target.
Figure 15 reports the target (solid lines) and measured values (dashed lines) of NO
x emissions and the SOI
main corrections with respect to the setpoint values.
The results indicate that the controller works properly, since, when a higher concentration of NOx is demanded, SOImain is progressively advanced, and vice-versa.
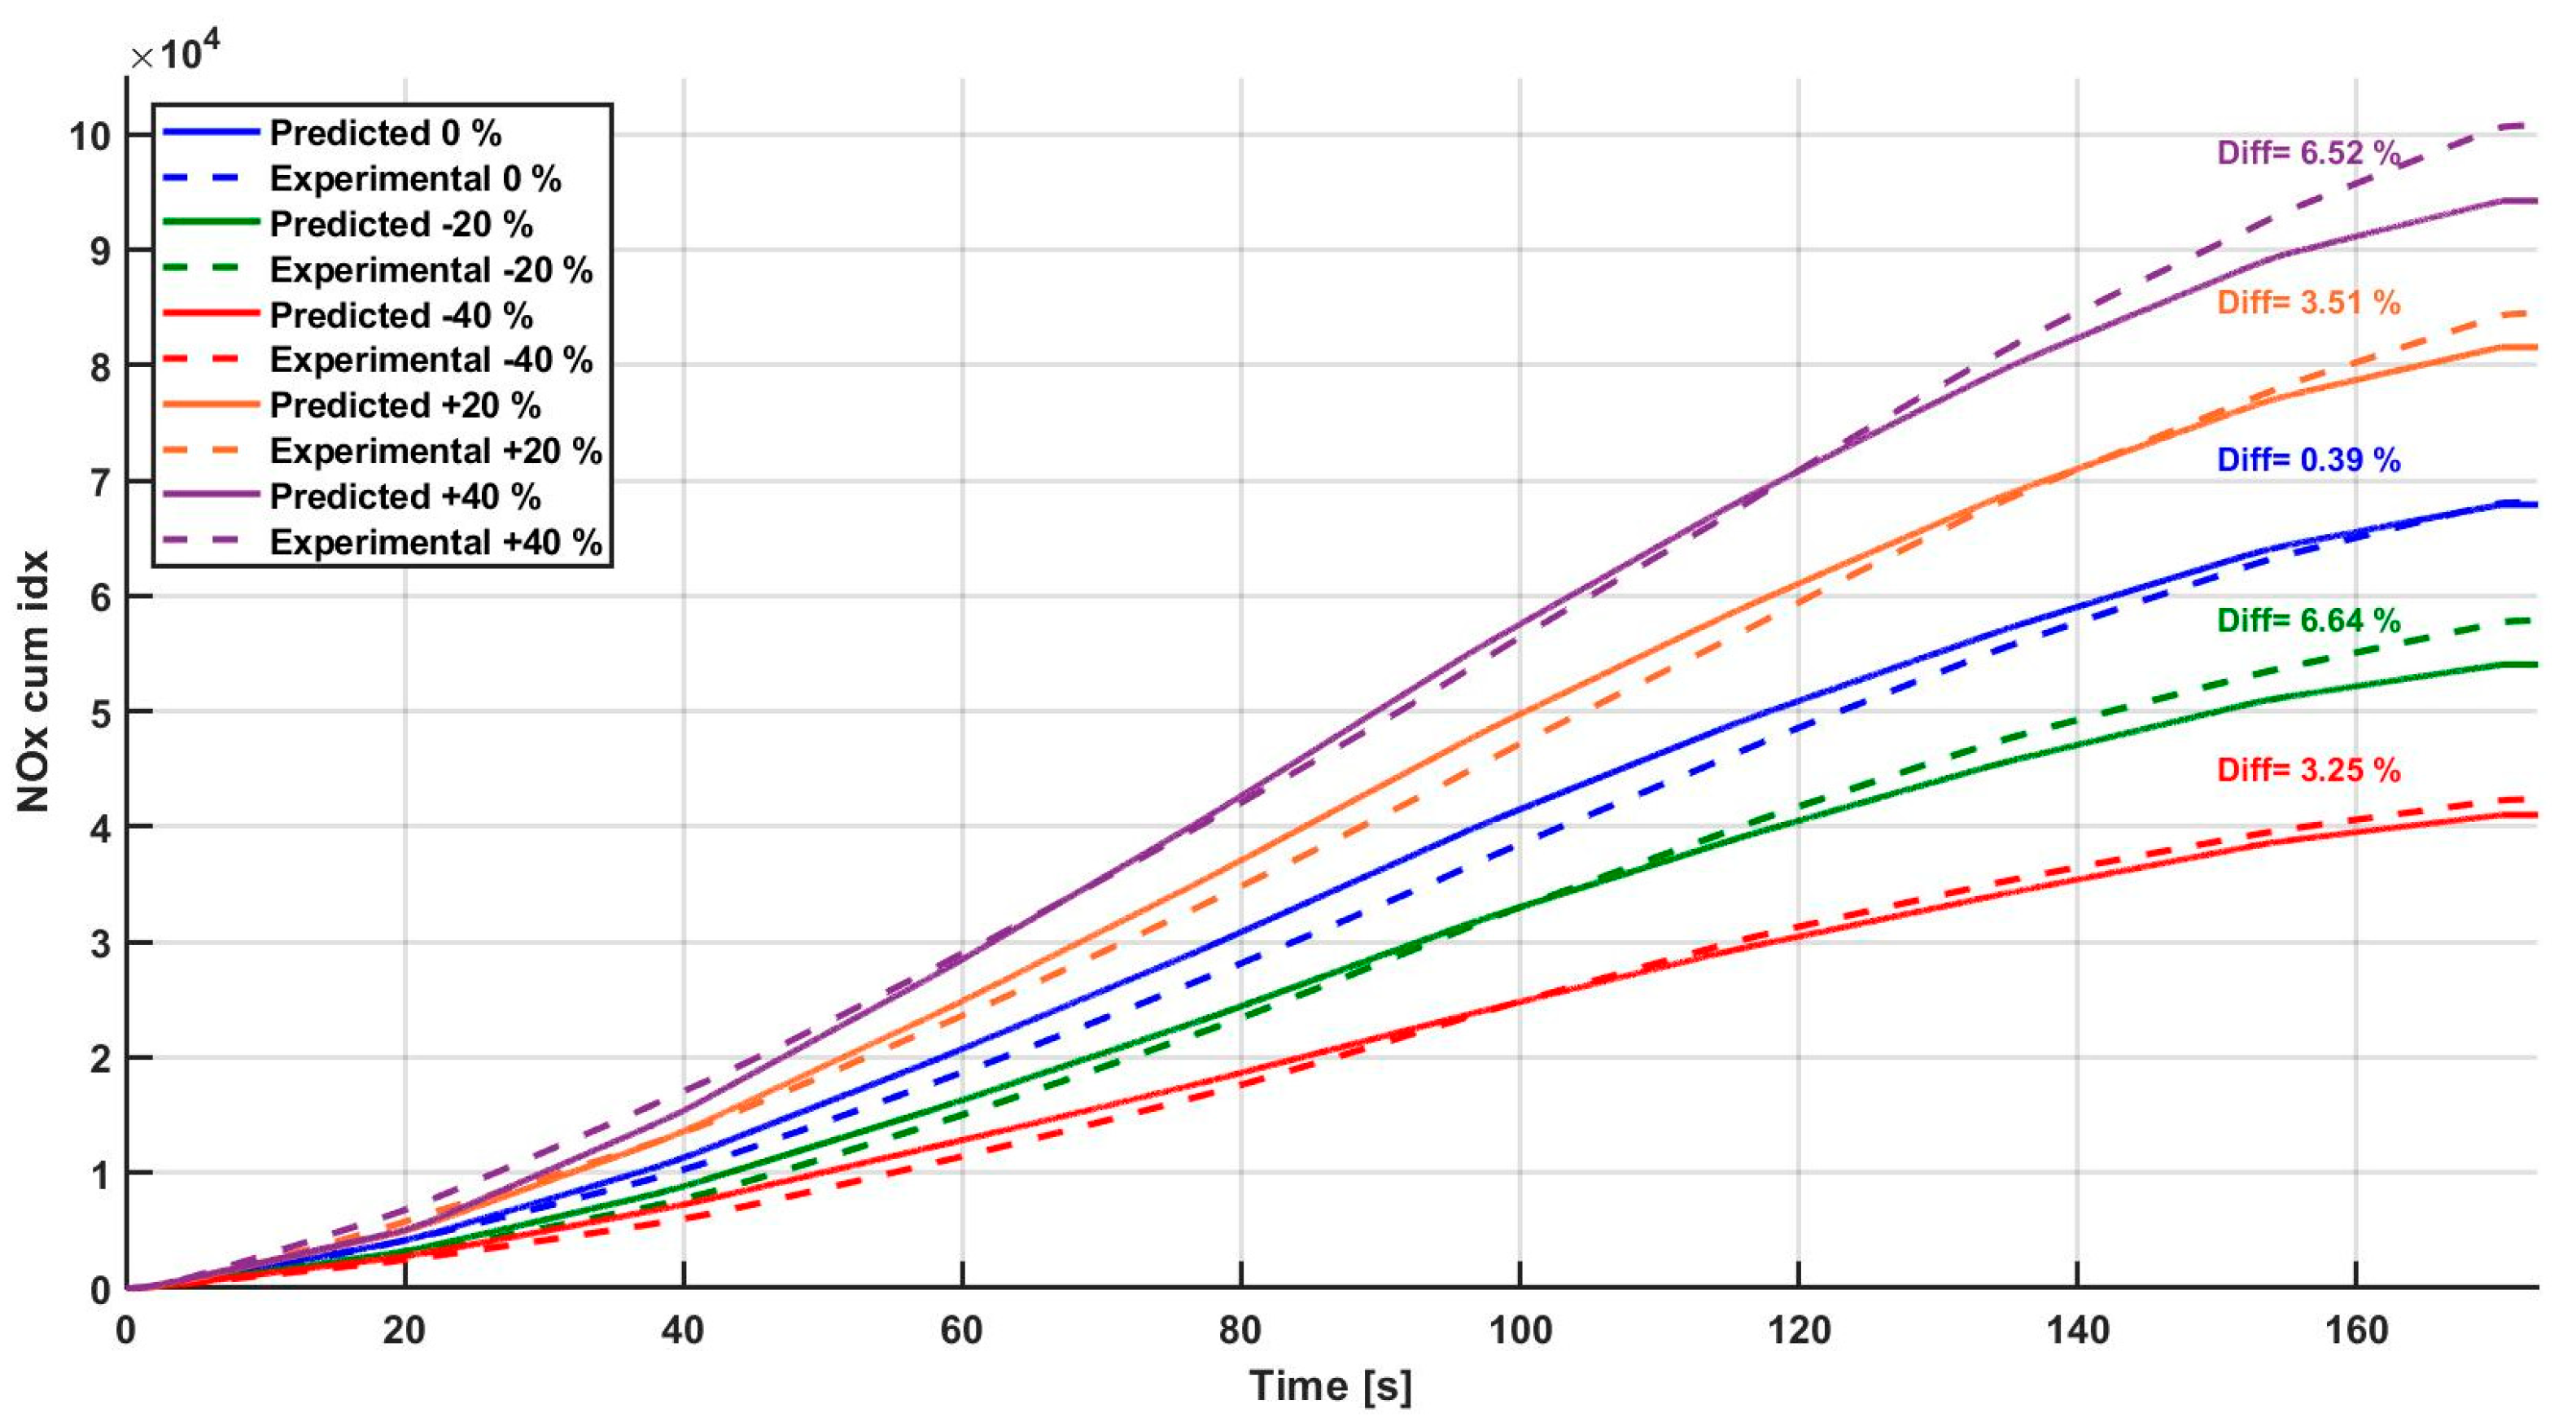
Figure 14 shows the simulated and experimental trends of the cumulative NO
x emission index, as well as the relative errors in the final value of the curves. The results confirm the proper behavior of the controller.
With reference to the results of
Figure 16,
Table 2 reports the experimental cumulative NO
x reduction or increase, with respect to the nominal case, for the different targets. The results indicate that the target request is matched with a satisfactory degree of accuracy.
Figure 17 reports the target (solid lines) and measured values (dashed lines) of BMEP and the corrections of injected fuel quantities with respect to the ECU values.
3.4. Effect of the Engine Thermal State
The engine thermal state has an important impact on the NOx formation: a warm-up test, in fact, leads to an increase in the emitted NOx levels.
A new load ramp was added (i.e., ramp #4), which was basically a repetition of the load ramp test #1 at N = 1400 rpm (i.e., the test in which the controller showed the lowest accuracy in terms of NOx, see Fig. 11) by setting a much longer stabilization time between the different engine load conditions, in order to verify to what extent controller predictive capability is affected by the engine thermal state. The target of coolant temperature to be reached by the test bench controller was set at 85 °C over the entire ramp. Moreover, the engine was warmed before the start of the test, so that the initial coolant temperature was also equal to 85 °C.
Figure 18b shows that the accuracy in the NO
x control is much better than that obtained for the test that was reported in
Figure 11b, as the average RMSE has whittled down from about 91 ppm to 41 ppm. It is also interesting to note that, during the second part of the test (in the interval between 1100 s and 1400 s), the NO
x emitted by the engine feature a decreasing trend, at fixed values of the control parameters (SOI
main, q
f,inj). During this phase, the error in the NO
x control progressively decreases over time. The alignment between the target and experimental levels is better at the end of the transient, when the engine thermal state is expected to be closer to that corresponding to the steady-state conditions, in which the combustion model was calibrated.
Therefore, this means that the engine thermal state has an appreciable impact on the NOx emissions, and its effect should be carefully considered in order to correctly estimate and control NOx emissions, especially in transient operation. For example, such parameters as the coolant temperature, or the oil temperature, could be potentially used as model variables to take the engine thermal state effect on NOx formation into account.
Finally,
Figure 19 shows the target and experimental values of BMEP for the considered load ramp test with controller disabled (a) and controller enabled (b).
Figure 19b also reports the q
f,inj deviation (Δq
f,inj), with respect to the setpoint value, when the controller is enabled.
The results presented in
Figure 19 show that the effect of the engine thermal state on the accuracy of the BMEP controller is less significant, at least for the considered tests.
3.5. Discussion on Onboard Controller Implementation and Future Work
The previously reported results indicate the good potential of the developed controller. However, several aspects should be carefully considered before proceeding to its implementation on a commercial vehicle.
First, it was verified that the model-based controller requires a computational time of 300–400 μs per iteration, which is compatible with a cycle-by-cycle control, when it runs on the ES910 device. However, the ES910 device is more powerful than a standard ECU. If the computational performance of the ECU is not sufficient to implement the combustion model, a simpler and less demanding model, such as a neural network, should be considered. The neural network could be trained to mimic the outcomes of the combustion model, according to a meta-modeling approach, where the calibration dataset is generated by the combustion model itself, used as a virtual engine.
The effect of the engine thermal state on NOx formation, which is not negligible, especially at medium-low speeds, is another aspect that was discussed in this work. This suggests the need of a further improvement of the combustion model in order to enhance the controller accuracy.
In addition, as previously reported, an important input variable for the controller, which affects the accuracy of the NO
x prediction to a great extent [
34], is the intake manifold oxygen concentration. In this study, an LSU lambda sensor was installed in the intake manifold for its direct measurement. If an intake oxygen sensor was installed on a commercial engine, aspects, such as the variation of the accuracy over time, possible drifts, and durability, should be carefully examined. Moreover, the installation of such a sensor would lead to additional engine production costs, and a cost/benefit analysis should be carried out. An alternative approach could be represented by the development and adoption of an intake O
2 model which is accurate enough at both steady-state and transient conditions, and it is fast enough to be implemented in the ECU.
In view of a potential implementation of the controller on a commercial vehicle, attention should also be paid to several practical aspects, such as a correct management of the input and output variables of the controller to improve its robustness. As far as the input variables are concerned, a saturation of the values that are sent to the controller is highly recommended, in order to manage possible failures in their acquisition and avoid calculation errors during the on-road running. Cut-off and gear shifting phases, during which the fuel quantity is set at zero, also have to be correctly managed, so as to avoid potential sources of errors, such as infinite values of the air-to-fuel ratio. Limitations in the range of the output control variables (i.e., SOImain and qf,inj) are highly recommended, in order to avoid engine operating conditions that could be dangerous for engine safety (e.g., excessive peak firing pressure if injection timing is too advanced) or could lead to excessive pollutant emissions (e.g., excessive soot levels if injection timing is too delayed).
The coupling of the combustion controller with other engine/vehicle sub-systems, such as the cruise controller or the boost controller, should also be carefully handled. For example, possible instabilities may occur when the torque controller is coupled with the cruise control system, since both of them act on the injected fuel quantity.
Finally, it should also be considered that the impact of the controller on other pollutant emissions (especially soot), or on the long-term engine operations, needs to be evaluated before its implementation.
Therefore, a high number of bench and road-tests needs to be performed in order to identify and solve potential problems in view of the implementation of the controller on the vehicle.
On the basis of the previous discussion, future research activities will include:
an assessment of the computational time of the controller when implemented on an ECU and a development of a neural network-based model that replicates the results of the physical combustion model, but it requires a much shorter computational time;
the improvement of the combustion and NOx model, so as to take into account the engine thermal state;
a development of an intake O2 model that is characterized by a satisfactory degree of accuracy at steady-state and transient conditions, but it is suitable to be deployed on an ECU; and,
an investigation of the impact of the controller on other pollutant emissions (especially soot) or on the long-term engine operations, and the development of compensation strategies if needed.


 ,
, 


