Article

Real-Time Emission Prediction with Detailed Chemistry under Transient Conditions for Hardware-in-the-Loop Simulations

1
Teaching and Research Area Mechatronics in Mobile Propulsion, RWTH Aachen University, Forckenbeckstraße 4, 52074 Aachen, Germany
2
Loge Polska Sp. z o.o., Waly Dwernickeigo 117/121, 42-200 Czestochowa, Poland
3
Thermodynamics and Thermal Process Engineering, Brandenburg University of Technology, Siemens-Halske-Ring 8, 03046 Cottbus, Germany
*
Author to whom correspondence should be addressed.
Submission received: 30 November 2021 / Revised: 16 December 2021 / Accepted: 28 December 2021 / Published: 31 December 2021

Abstract

:
The increasing requirements to further reduce pollutant emissions, particularly with regard to the upcoming Euro 7 (EU7) legislation, cause further technical and economic challenges for the development of internal combustion engines. All the emission reduction technologies lead to an increasing complexity not only of the hardware, but also of the control functions to be deployed in engine control units (ECUs). Virtualization has become a necessity in the development process in order to be able to handle the increasing complexity. The virtual development and calibration of ECUs using hardware-in-the-loop (HiL) systems with accurate engine models is an effective method to achieve cost and quality targets. In particular, the selection of the best-practice engine model to fulfil accuracy and time targets is essential to success. In this context, this paper presents a physically- and chemically-based stochastic reactor model (SRM) with tabulated chemistry for the prediction of engine raw emissions for real-time (RT) applications. First, an efficient approach for a time-optimal parametrization of the models in steady-state conditions is developed. The co-simulation of both engine model domains is then established via a functional mock-up interface (FMI) and deployed to a simulation platform. Finally, the proposed RT platform demonstrates its prediction and extrapolation capabilities in transient driving scenarios. A comparative evaluation with engine test dynamometer and vehicle measurement data from worldwide harmonized light vehicles test cycle (WLTC) and real driving emissions (RDE) tests depicts the accuracy of the platform in terms of fuel consumption (within 4% deviation in the WLTC cycle) as well as NOx and soot emissions (both within 20%).

Graphical Abstract

1. Introduction

The upcoming EU7 emission regulations increase the challenges in powertrain development by requiring on-road emission testing under different ambient conditions and distances, as well as a large number of emission species to be considered at further lowered limits [1,2,3].
The required CO2 emissions reduction to limit global warming entails considerable costs for vehicle manufacturers. Original equipment manufacturers (OEMs), Tier 1 suppliers, and engineering companies are challenged to invest in innovative and efficient technologies. These technologies usually result in a significant increase in the complexity of the hardware, the embedded software, and the large number of calibration parameters. However, cost minimization conflicts with the need for technology development to fulfill both legal and customer requirements [4,5]. Consequently, advanced simulation and virtualization methodologies are emerging as viable alternatives to pursue technological innovation while reducing development costs and time.

1.1. Motivation for HiL-Based Simulations

Front-loading powertrain hardware testing tasks in a virtualized environment has become a commonly used technique that enables seamless system testing [6,7,8]. The ability to pre-test the interactions between the various components of a powertrain system is of fundamental importance. A simulation of the interfaces between multiple sub-systems and hardware in a closed-loop testing environment is a suitable method to disclose performance shortfalls and estimate the maturity level of models and control strategies [9]. System optimization and function development in an early stage represent an advantage of X-in-the-loop (XiL) simulations. The reliability of development iterations increases when prototype hardware starts to be included in the development tasks, since its complex dynamics effect the overall system balance [10,11]. In model-in-the-loop (MiL) systems, the plant and the relevant control functions are completely virtualized. In HiL platforms, the control system, as well as sensors and actuators, are available as real hardware. HiL is particularly useful when accurate simulation models are not yet available for all relevant control functions and hardware components. HiL test rigs allow for control unit validation and calibration using the targeted ECU or multiple control units. Thereby, based on HiL results, only relevant variants can be selected for further chassis dynamometer or on-road tests, leading to a reduction of time and costs [12].

1.2. Challenges in Virtual ECU Calibration

In the context of the ECU development and calibration, particular attention is required for the selection of the modeling approaches to be used. In fact, replacing any powertrain component with a model requires technical expertise for the accurate modeling, the framework set-up, and the measurement data management. Further, the balance between accuracy and real-time (RT) capability of the models is crucial to ensure proper interactions with the hardware in the testing environment. In light of this, it is a clear necessity to select a proper powertrain modeling approach and the best-practice simulation tools in order to fulfil the desired level of accuracy and time targets in conjunction with the current project milestones [10,13].
Engine and emission models are the core of HiL-based virtual calibration test beds. Consequently, there is a need to continue the development of modeling techniques and to make further progress in representing the real physics of the engine. However, the need to optimize time and costs, and therefore to accelerate the development process, necessitates the investigation of more practical approaches for model calibration and simulation. For HiL-based applications, various modeling approaches are actively used in research and industry depending upon the requested level of detail. The simplification of 1D detailed models to RT-capable solutions for transient simulations is an established practice [14,15,16]. The potential of the crank-angle resolved combustion models in conjunction with a 0D air path has been demonstrated [14,17,18]. Furthermore, one approach allowed the execution of detailed models in RT, while fully preserving the predictivity of combustion and emission models as a proof-of-concept for virtual calibration applications [19,20]. Physics-based mean value approaches have been used to predict the engine behavior throughout the operational driving cycle while enhancing its adaptability through the use of multi-scale or mixed modeling accuracy [21,22]. The implementation of computationally inexpensive algorithms, and the search for lean approaches to optimize the model calibration effort, emissions prediction, and processes, are actual topics of research [23,24,25,26,27,28,29]. On the other hand, the integration of chemistry-based simulation processes to improve accuracy and to enhance the extrapolation capability in extreme ambient conditions has made its way also in both research and industrial applications [30,31,32,33].
Current limitations of these state-of-the-art approaches include the high demand for measurement data needed to calibrate the models, with a particular focus on transient cycles. Consequently, the accuracy of the simulation framework is penalized by the limited amount of available data, especially at early stages of a project. Moreover, the accuracy is dependent on the complexity of the models, which is inevitably linked to the calibration effort. Finally, the extrapolation capability of chemistry- and physical-based models is penalized by their high computational demand, limiting the RT capability to perform HiL-based simulations. In the context of the research project Co-Simulation Platform Connecting Chemistry and Powertrain Dynamics to Traffic Simulation (ConneCDT) [34,35], the work presented here focuses on the application of tabulated chemistry data for emissions prediction in the MiL/HiL platform to enhance the synergies of HiL simulations and chemistry for transient emissions assessments.
The article is structured as follows: first, a data-efficient calibration of a mean value engine air path model is presented; next, the parametrization of the chemistry-based combustion model using only steady-state conditions is displayed. Consequently, the combustion model and the air path model have been integrated in the complete powertrain framework in co-simulation for the prediction of combustion processes; finally, the time- and data-efficient framework is tested for its performance and emission prediction capability in driving cycles. The focus is on the prediction capability of the models based on the steady-state parametrization in transient simulations, showing their prospective for virtual calibration applications.

2. Real-Time Powertrain Models

In the following sections, the reference engine, vehicle, and fuel are described first, followed by the selected modeling approaches for the air path and combustion.

2.1. Reference Powertrain, Vehicle, and Fuel

The reference diesel engine used for the calibration of the plant models is a Euro 6b, 4-cylinder, 2.0 L direct injection, compression ignition (CI) engine with both high-pressure (HP) and low-pressure (LP) exhaust gas recirculation (EGR) systems. The engine layout with the sensor location is depicted in Figure 1. The available sensors allowed for the measurement of pressures, temperatures, mass flows, and species concentrations in the exhaust gases.
The reference vehicle is a D-segment passenger car with 1500 kg curb weight. The vehicle is equipped with a 6-speed manual transmission and a Rear Wheel Drive (RWD). The specifications are listed in Table 1 and Table 2. Table 3 lists the properties of the fuel used during the measurements.

2.2. Engine Air Path and Powertrain Modeling

The Automotive Simulation Model (ASM) for diesel applications from dSPACE is used as the basis to simulate the air path, including the turbocharger, in close interaction with a model for in-cylinder combustion and pollutant formation. Figure 2 depicts the schematics of the engine air path model.
The model consists of a mean value approach that combines physical equations and map-based solutions depending on the necessities. The Simulink-based model is characterized by a white-box approach based on physical relations for a good extrapolation capability. The customization of the model is achieved by a full access to every available component. Certain subsystems include alternative approaches with different depths of accuracy and, consequently, require variable effort for calibration. This enables the necessary modifications and integration, such as the LP-EGR line and a customizable turbocharger model. The driver, the driveline, and the engine aftertreatment (EAT) models have been described in previous work [24]. For the sake of completeness, an overview of the structure of the air path model will be provided in the following sections. Table 4 briefly describes the modeling approach for each component with some remarks to be considered for the validation of the results.
The air path model includes a throttle, HP-EGR and LP-EGR systems, and an exhaust throttle valve. The three-way valve of the reference engine has been modeled by the LP exhaust throttle to give correct back pressure values in the exhaust path, and the LP-EGR valve controls the LP-EGR mass flow. The engine air mass flow is evaluated in the LP exhaust manifold, which subtracts the LP-EGR mass flow from the one through the throttle valve. Three cooling systems are active in the air path model: the intercooler and the two EGR coolers.
In addition to the physics-based approach, the exhaust manifold includes the possibility to select a map-based solution. The turbocharger (TC) model includes two modeling approaches: a map-based approach and an advanced one that includes dedicated models for the compressor, turbine, and shaft.
For the evaluation of the turbine mass flow and efficiency, the component has been customized to offer two different possibilities. In Method 1, the mass flow depends on the VNT position and the pressure ratio over the turbine. The inputs for the single efficiency map are the turbocharger speed and the mass flow. Method 2 consists of multiple efficiency and mass flow maps as a function of the TC speed and the pressure ratio, interpolated depending upon the VNT position. The TC efficiency is then used for the calculation of temperature and power. Additionally, heat losses for the turbine can be calibrated to ensure an accurate reproduction of the temperature behavior around the TC housing.

2.3. Stochastic Reactor Model with Tabulated Chemistry for Real-Time Emissions Prediction

The 0D modeling for the prediction of the in-cylinder processes employs a variant for the stochastic reactor model (SRM) that is tailored for the simulation of direct injection CI engines. The model is a part of LOGEengine simulation platform [36]. The presented description has been freely adopted from previous work and publications [32,36,37,38,39], which provide a more comprehensive description of the modeling.
The SRM is a 0D model of physical and chemical processes occurring during the combustion cycle. It is expressed within the probability density function (PDF) approach for turbulent reacting flows that allows for the precise treatment of chemical reactions. The SRM considers gas contained within the cylinder as an ensemble of notional particles. The particles can combine with each other and exchange heat with the walls of the cylinder. Each particle has a chemical composition, temperature, and mass that correspond to a point in the gas-phase. These scalars are treated as random variables quantified with probabilities and determine the composition of the gas mixture. Thus, the in-cylinder mix is represented in gas-phase space by a PDF, and the particles are realizations of the distributions. The PDF transport equation provides the solution for scalars, enthalpy, and species mass fractions [36,40].
The mixing time history is the main input parameter for the SRM. It must be modelled because the mixing process cannot be predicted by the 0D model. In the current version of the SRM, the mixing time is derived from the K-k-based modeling of the turbulence as introduced previously [32,36]. For the formation of the particulate emissions, the detailed soot model described in earlier work [41] is used within the chemistry look-up table. The model distinguishes between particle inception, condensation, coagulation and agglomeration, surface growth, fragmentation, and oxidation with oxygen and hydroxyl radicals. The modeling of NO emissions is based on a transport equation describing the changes over time of the NO formation rate according to the thermal model. CO, CO2, and unburned HC emissions are directly retrieved from the chemistry look-up table [37].
Reaction kinetics for predicting the combustion process and emissions formation are used in the form of tabulated chemistry. The tabulated chemistry approach implemented in the SRM relies on a parameterization of the combustion progress as a function of EGR rate, pressure, temperature in the unburned zone, and equivalence ratio. The idea behind this approach builds on the assumption that an appropriately chosen progress variable can be used for the reconstruction of the thermochemical state on the whole reaction trajectory within the combustion progress variable model (CPV) [42,43,44]. In the present work, the progress variable is defined based on the latent enthalpy (enthalpy of formation). The combustion chemistry and emission source terms are precalculated and stored in a look-up table that is accessed during calculation run time. Regardless of the size of the reaction mechanism, the use of tabulated chemistry significantly reduces the computing cost to the point where it reaches engine cycle simulation in real time [44].
As a fuel surrogate, the fuel model included a blend of n-decane, α-methylnaphthalene, and methyl-decanoate in a mass fraction ratio of 71.3%, 21.3%, and 7.40%, respectively. The gas-phase chemistry for the model was taken from the available fuel database. The applied mechanism contains 264 species and 4280 reactions [36,45]. Besides the oxidation of the main fuel species, the model additionally contains a thermal NO formation model and a detailed PAH model for the prediction of soot formation and oxidation. The properties of the selected surrogate fuel match well with the properties of the actual diesel fuel utilized during the engine measurements. The C:H:O ratio is 10.27:19.4:0.115 (14.1:25.9:0.13 for the actual fuel), the cetane number is 53.3 (53.1 for the actual fuel), and the lower heating value is 42.81 MJ/m3 (42.61 MJ/m3 for the actual fuel).

3. Model Parametrization and Simulation Environment

The following paragraphs introduce the MiL and HiL platforms, and provide a brief overview of the calibration process for the engine model. Additionally, the procedure for the calibration of the combustion model is described, and the interface between the air path and combustion model are specified. Finally, a standardized solution for coupling the air path and the combustion model is described for RT applications.

3.1. Co-Simulation Framework Setup

The framework containing the engine air path model and the 0D SRM is set up in Simulink. Additionally, the environment contains a model for the selection of the driving cycle to simulate the remaining parts of the powertrain including the driver, vehicle, and transmission models. Both HiL and MiL platforms are used for the validation of the results. The MiL configuration includes a virtual ECU controller which provides the actuators signals and receives feedback from the plant models. The simulation of the system is performed in VEOS, a PC-based simulation platform for models and network communications [46]. The HiL platform utilized in this study has been described in detail previously [24]. The HiL architecture consists of the aforementioned RT-capable models of the powertrain components, the physical hardware ECU, and the actuators. The ECU is directly connected to the HiL simulator SCALEXIO. Specific actuators, such as throttle valves, EGR valves, turbocharger, and injectors are physically connected to the ECU as hardware components.

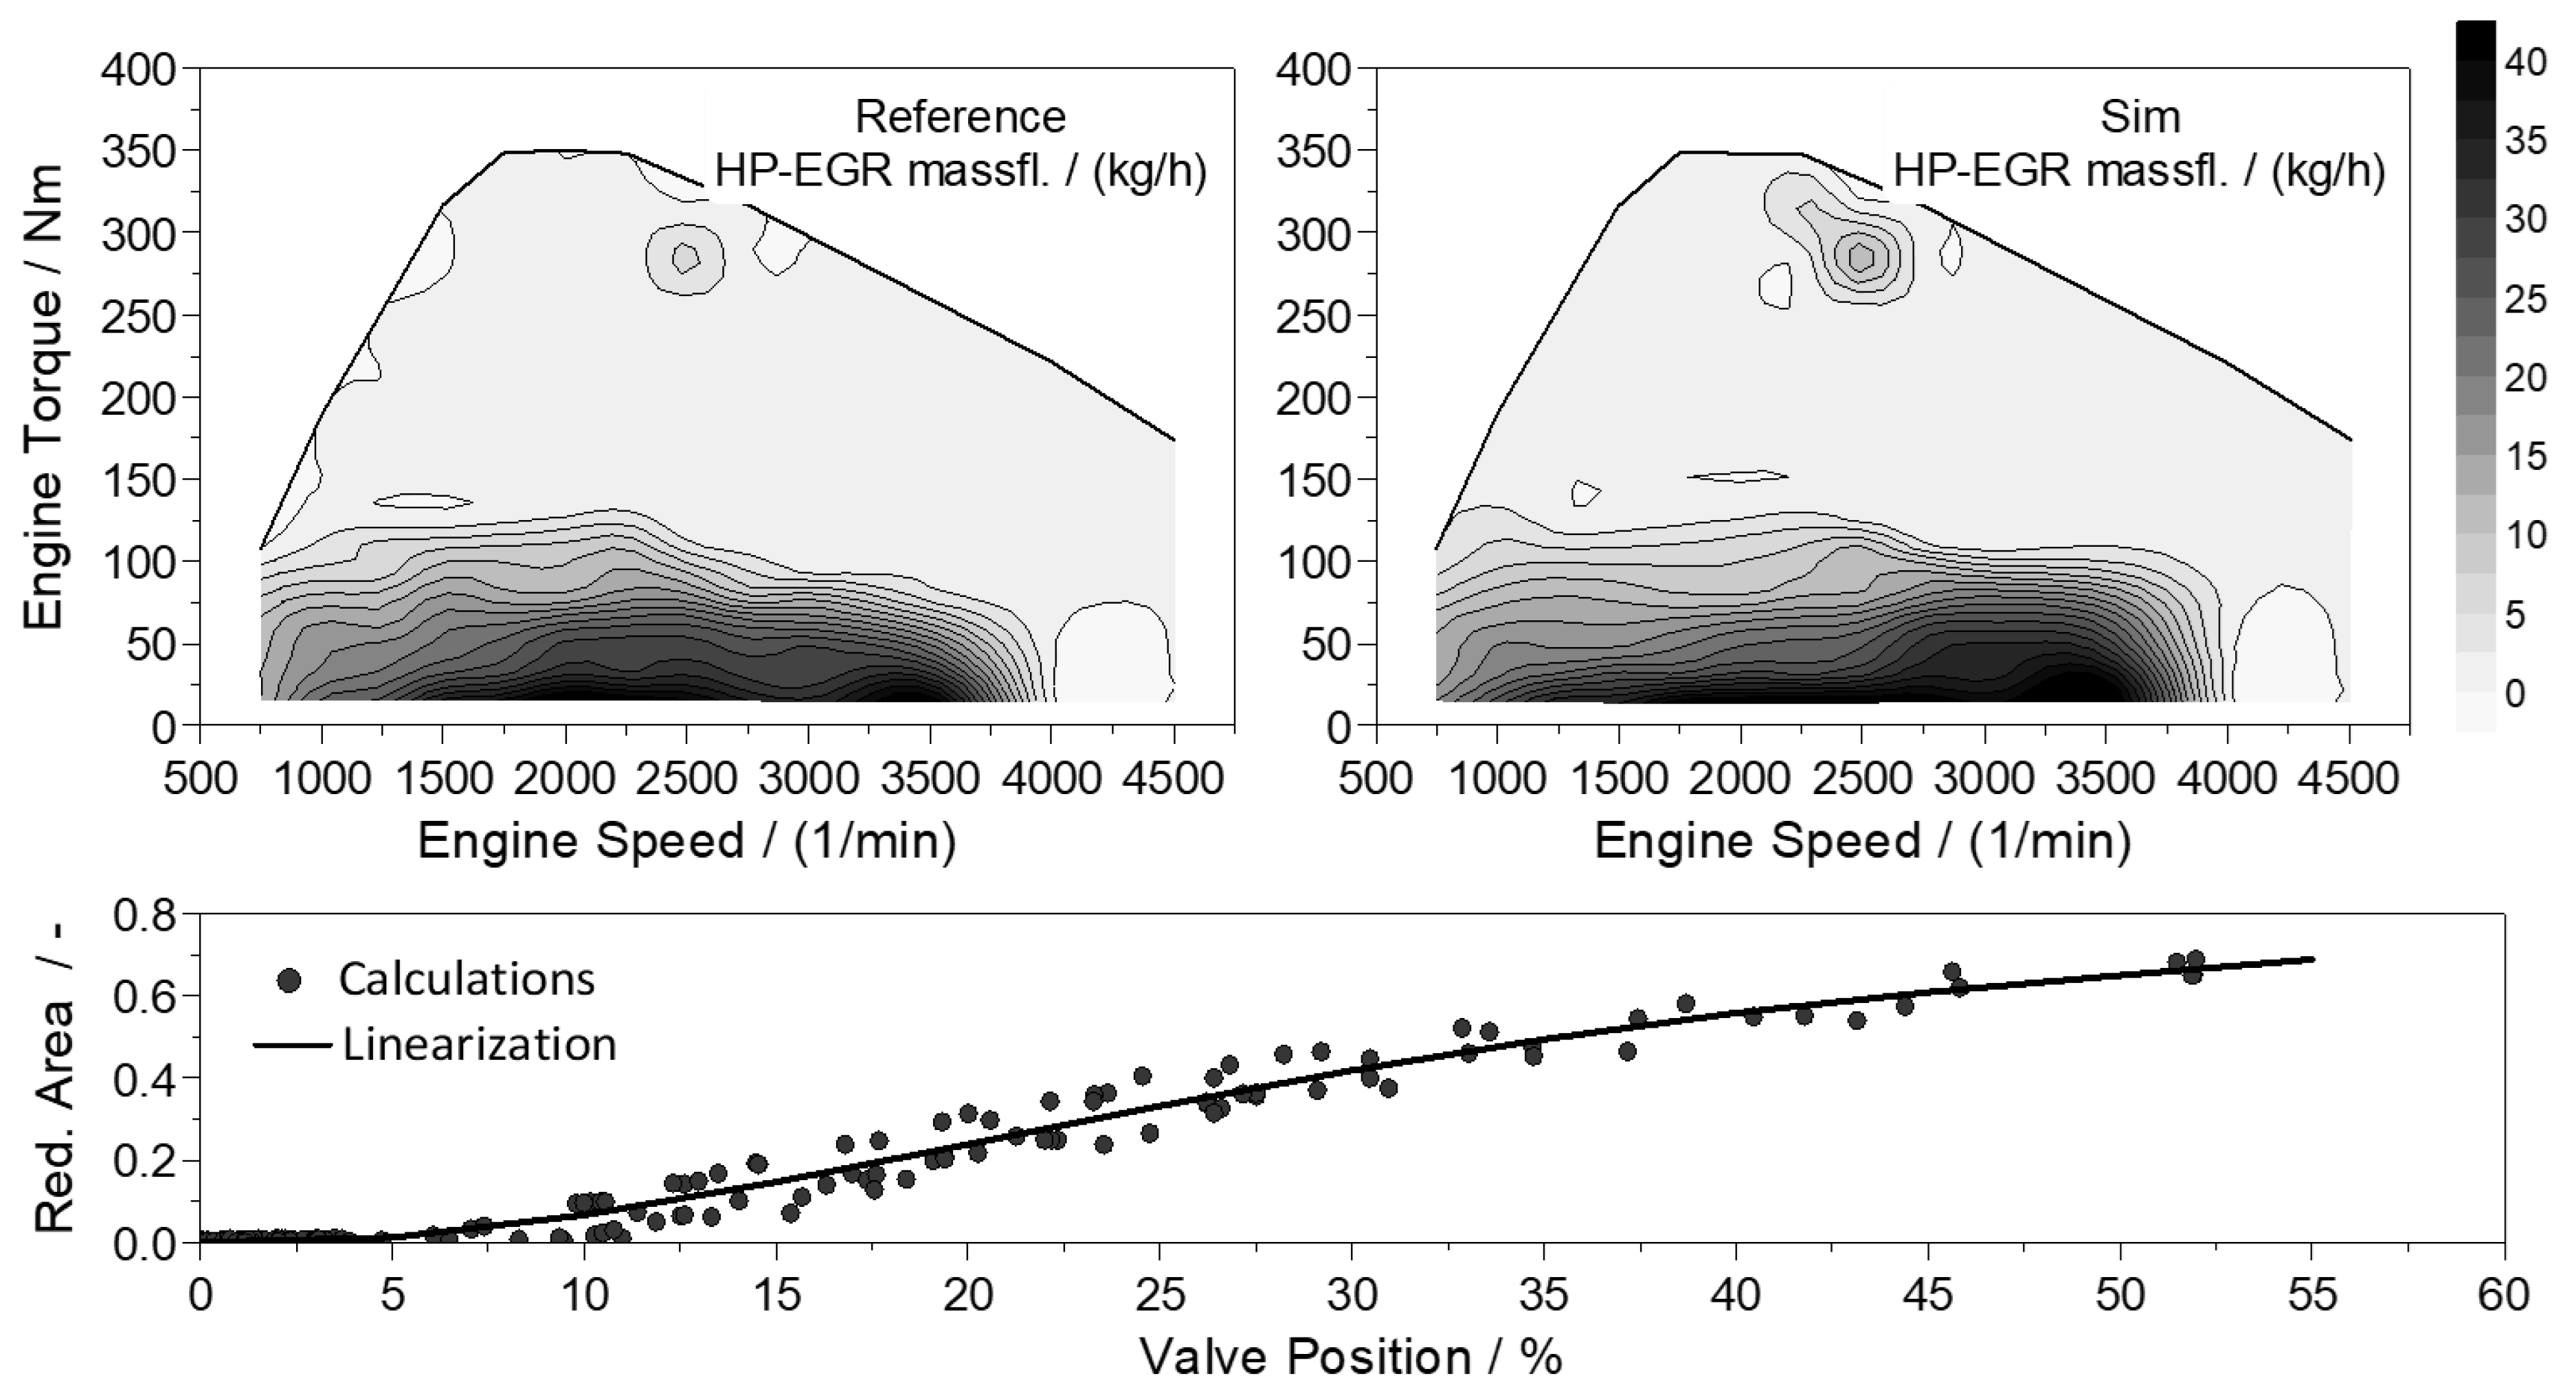
3.1.1. Engine Air Path Model Calibration

For the calibration of the engine air path system, the following measurement data were used:
  • Engine mapping without EGR in warm conditions (Coolant temperature of 90 °C);
  • Engine mapping with EGR in warm conditions (Coolant temperature of 90 °C);
  • Full load curve in warm conditions (Coolant temperature of 90 °C).
The intentionally limited amount of data used for the calibration of the engine air path model has two reasons: first, because this type of relevant data is readily available for model calibration in vehicle calibration projects; second, to limit the dependence on test bench or chassis dynamometer measurements, while keeping the quality of model performances as high as possible. Any required coolant correction that is required for cold engine simulations is calibrated using available databases with the assumption of having similar impacts on the performances. In order to evaluate the performances of the combustion model, reference values of peak cylinder pressure (PCP) and indicated mean effective pressure (IMEP) have been obtained through a 1D detailed model calibrated on the same reference engine. The rationale is that these measurements are usually not included in a standard measurement campaign, and are therefore not available from real engine and vehicle measurements.
For the calibration of the air path, the equations used in the model have been extracted from each subsystem. If a quantity required for the calibration is not directly available from measurements, it was necessary to obtain it during a pre-processing step. Any requirement for refining the pre-processing results can be met during this phase. One disadvantage of this approach is that it requires an understanding of the models in order to prepare the calibration data. The effort required to extract the physical relationships from each subsystem, and the competence to use test bench measurements to evaluate them, is not negligible. The performance of the model is heavily dependent on the inputs used to create the parametrization. Additional skills would be required for the data refinement and the further extrapolation of the maps, if required. Inevitably, the processed maps may need further refinement and a post-processing phase. Besides the higher effort for the model analysis and data pre-processing, this approach proved to be effective to minimize re-calibration loops.

3.1.2. Combustion Model Parametrization

The parametrization of the 0D SRM targets the minimization of calibration effort while maintaining the accuracy required for virtual calibration over the engine operating field. Out of the complete engine mapping operation, a set of steady-state points is used for the training of the model. Figure 3 shows the operating points that were selected for the training out of all 227 operating points. In particular, the complete engine operating area is shown as a function of brake torque and speed, with a timeshare in the cumulated dwell time (in %) of a reference Real Driving Emissions (RDE) cycle.
The training points have partially been selected for being representative of the driving cycles available from the vehicle measurements. Specifically, a widely distributed number of operating points have been chosen for being able to represent the behavior of the entire engine map on HiL. Furthermore, additional points from high speed and high load areas have also been included in the training to increase the global robustness.
A multi-objective optimization approach for the parameterization of the 0D SRM has been applied to this research using the modeFRONTIER software [47]. The approach uses evolutionary algorithms and multi-criteria decision making to select one optimal parametrization of the 0D SRM to predict the whole engine operating range [48].
The optimization consists of three separated stages, each one targeting the minimization of specific errors. The first optimization stage minimizes the sum of least squares for the cylinder pressure profiles and the logarithmic sum of least squares for carbon monoxide (CO) and unburned hydrocarbons (uHC) concentrations at the exhaust valve opening (EVO) by modifying the K-k turbulence model parameters. The rationale of this approach is that the cylinder pressure profile results from turbulence–chemistry interaction during the engine cycle. With the knowledge of the cylinder pressure and the detailed chemistry of the surrogate fuel, it is possible to reverse engineer the turbulence within the cylinder by the parameterization of the physics-based K-k model. The second and third optimization stages target the parameterization of the tabulated soot source terms by minimizing the sum of least squares of soot mass at EVO and nitrogen monoxide (NO) source terms by minimizing the sum of least squares of NO concentration at EVO.
The preparation of the inputs to the optimization required to integrate missing information that are not available from real measurements from a 1D detailed model of the reference engine. This concerns, for example, the specific flow characteristics around the valves or the turbulence level of the combustion. In addition, the crank-angle resolved pressure and fuel injection rate profiles from test bench measurements have been examined using the thermodynamic heat release analysis in LOGEengine [36].
The first stage optimized the K-k turbulence model describing different processes of turbulence. The parameters of the turbulence model include squish, swirl, local tumble vortex velocity and size, compressibility, direct injection axial-flows, and dissipation [32,36,48]. Table 5 summarizes the main parameters of the turbulence model, with the relative optimized value.

3.1.3. Combustion Model Interface

The interface between the air path model and 0D SRM was designed to increase the flexibility of the platform. Table 6 and Table 7 depict the list of inputs and the selected outputs, respectively, of the combustion model in the co-simulation framework.

3.2. FMU for HiL-Based Applications

Due to the variety of requirements in different powertrain applications, multiple models of a component have to be developed by different programs and suppliers. To achieve system-level simulations, the different programs have to interact with each other. The FMI standard is a free standard solution, in which each software component or model can be connected together without disclosing what is inside. Each of the software component or models is called a FMU (Functional Mockup Unit). Consequently, the compiled model can be deployed to 3rd parties without disclosing any internals of the software components, keeping the standard Intellectual Property (IP) protected [49,50]. The FMU interface for the 0D SRM is a container based on the current FMI standards 2.0, which enables an interface using FMI between HiL and MiL platforms with RT 0D SRM. The 0D SRM is specifically tailored for the simulations of engine in-cylinder processes based on tabulated chemistry in RT.
The MiL/HiL co-simulation platform includes the powertrain environment, which provides the requested conditions to the combustion model. In the case of transient simulations, the framework provides the necessary variables to the 0D SRM through the FMI standard that are used to predict combustion performance and emissions for each cycle. The logic that allows for the continuation of the energy flow from cycle to cycle in a fixed-timestep simulation requires two conditions: first, the combustion model must store the last values of the crank-angle resolved kinetic energy; second, the conditions upstream of the intake valves have to be used by the 0D SRM for the evaluation of the conditions of the following cycle.
The co-simulation involves a main process in the 0D SRM that reads the input quantities from the air path model in each simulation time step. Within the main process, the 0D SRM is executed and is able to provide the results for the rest of the framework in real time. In particular, this enables continuous monitoring of the major pollutants emitted in real time.

4. Performance Evaluation

To evaluate the modeling approach, the multi-domain framework is utilized to simulate various drive cycles and to compare the results with measurement data. Two driving cycles are simulated: a WLTC and an RDE cycle measured with the reference vehicle and fuel.

4.1. Steady-State Simulation

4.1.1. Engine Air Path Model Validation

This paragraph focuses on the validation results of the engine air path model in steady-state conditions for a warm engine. The experience from virtual calibration applications allowed for the identification of sensitive fields that have significant potential to improve the performance of air path models (Table 8).
The turbocharger performance characteristics are shown because of their importance for a fair validation of the combustion model. Figure 4 compares the results of a steady-state air path validation for the intake manifold pressure (boost pressure) obtained with the different TC modeling approaches (map-based, Method 1, and Method 2) with measured values obtained with the reference engine on the engine dyno.
A good agreement between the measured values and the simulation results was found, particularly in the WLTC and RDE engine operating range. The steady-state results show that the boost pressure for the map-based approach achieves the accuracy targets generally assumed for virtual calibration applications.
With Method 1, where the mass flow is dependent on the VNT position and the pressure ratio over the turbine, and only a single efficiency map is used, the predicted boost pressure shows deviations at low engine speed and torque. With Method 2, the estimation of the boost pressure shows good results with a relative error below 20% over a wide operating range. Despite occasional inaccuracies, notably at high engine speeds and loads, the overall performance of the framework under steady-state conditions for all of the three approaches can be considered satisfactory, especially given the low calibration effort. The transient performances of the approaches are discussed in Section 4.2.

4.1.2. In-Cylinder Combustion Model Optimization Results

The optimization of the operating points selected for training the 0D SRM was performed for the three separated stages and evaluated in terms of combustion and emission prediction performances. In particular, Figure 5 shows the results of the optimization for the points selected (in Figure 3) in terms of PCP, IMEP, and NOx, as well as soot emissions, in comparison with the reference measurements.
The performance of the 0D SRM in terms of PCP prediction is representative of the behavior of the real engine. The overall IMEP prediction follows the trend of the PCP in quality. For the majority of the points, the IMEP deviation is within ±0.5 bar. However, a deviation in the performances can be observed for points 14 and 16. The maximum deviation for the PCP is 19% (Point 14), and is 20% for the IMEP (Point 16).
The optimization results for the NOx emissions closely match the trend observed in the reference data. In terms of soot prediction, besides being not trivial to replicate the phenomena for the creation of soot in a low-dimensional model, the magnitude of the tendency is reproduced; however, the results depict margins for improvements.

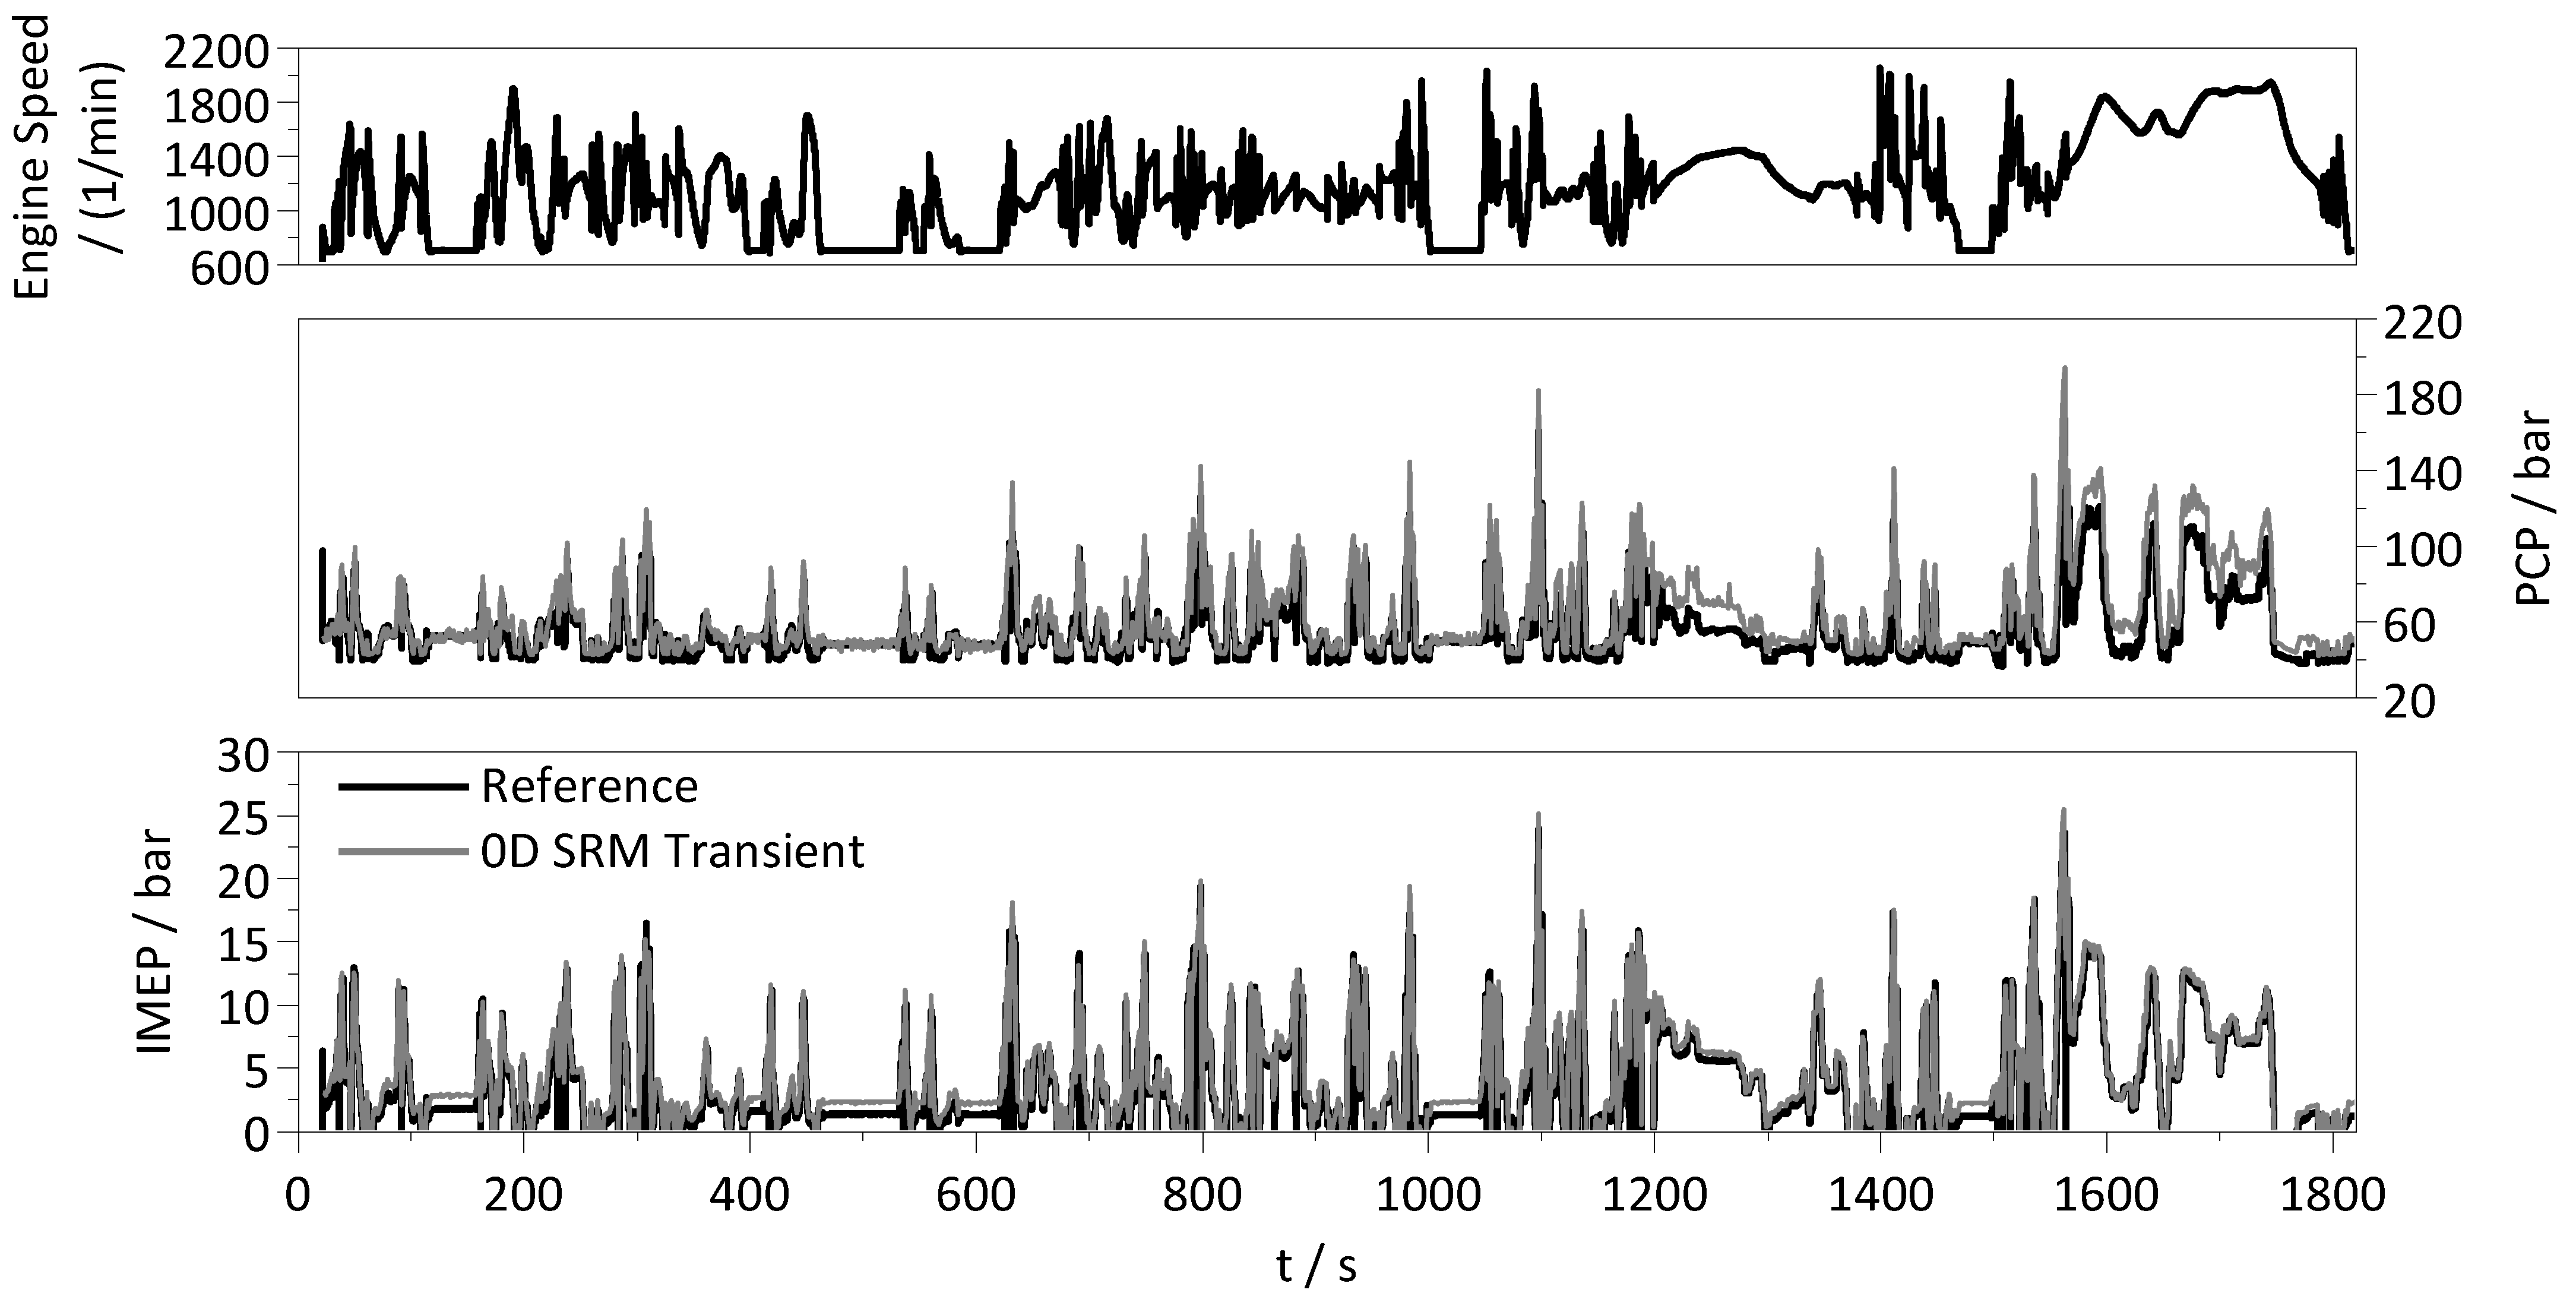
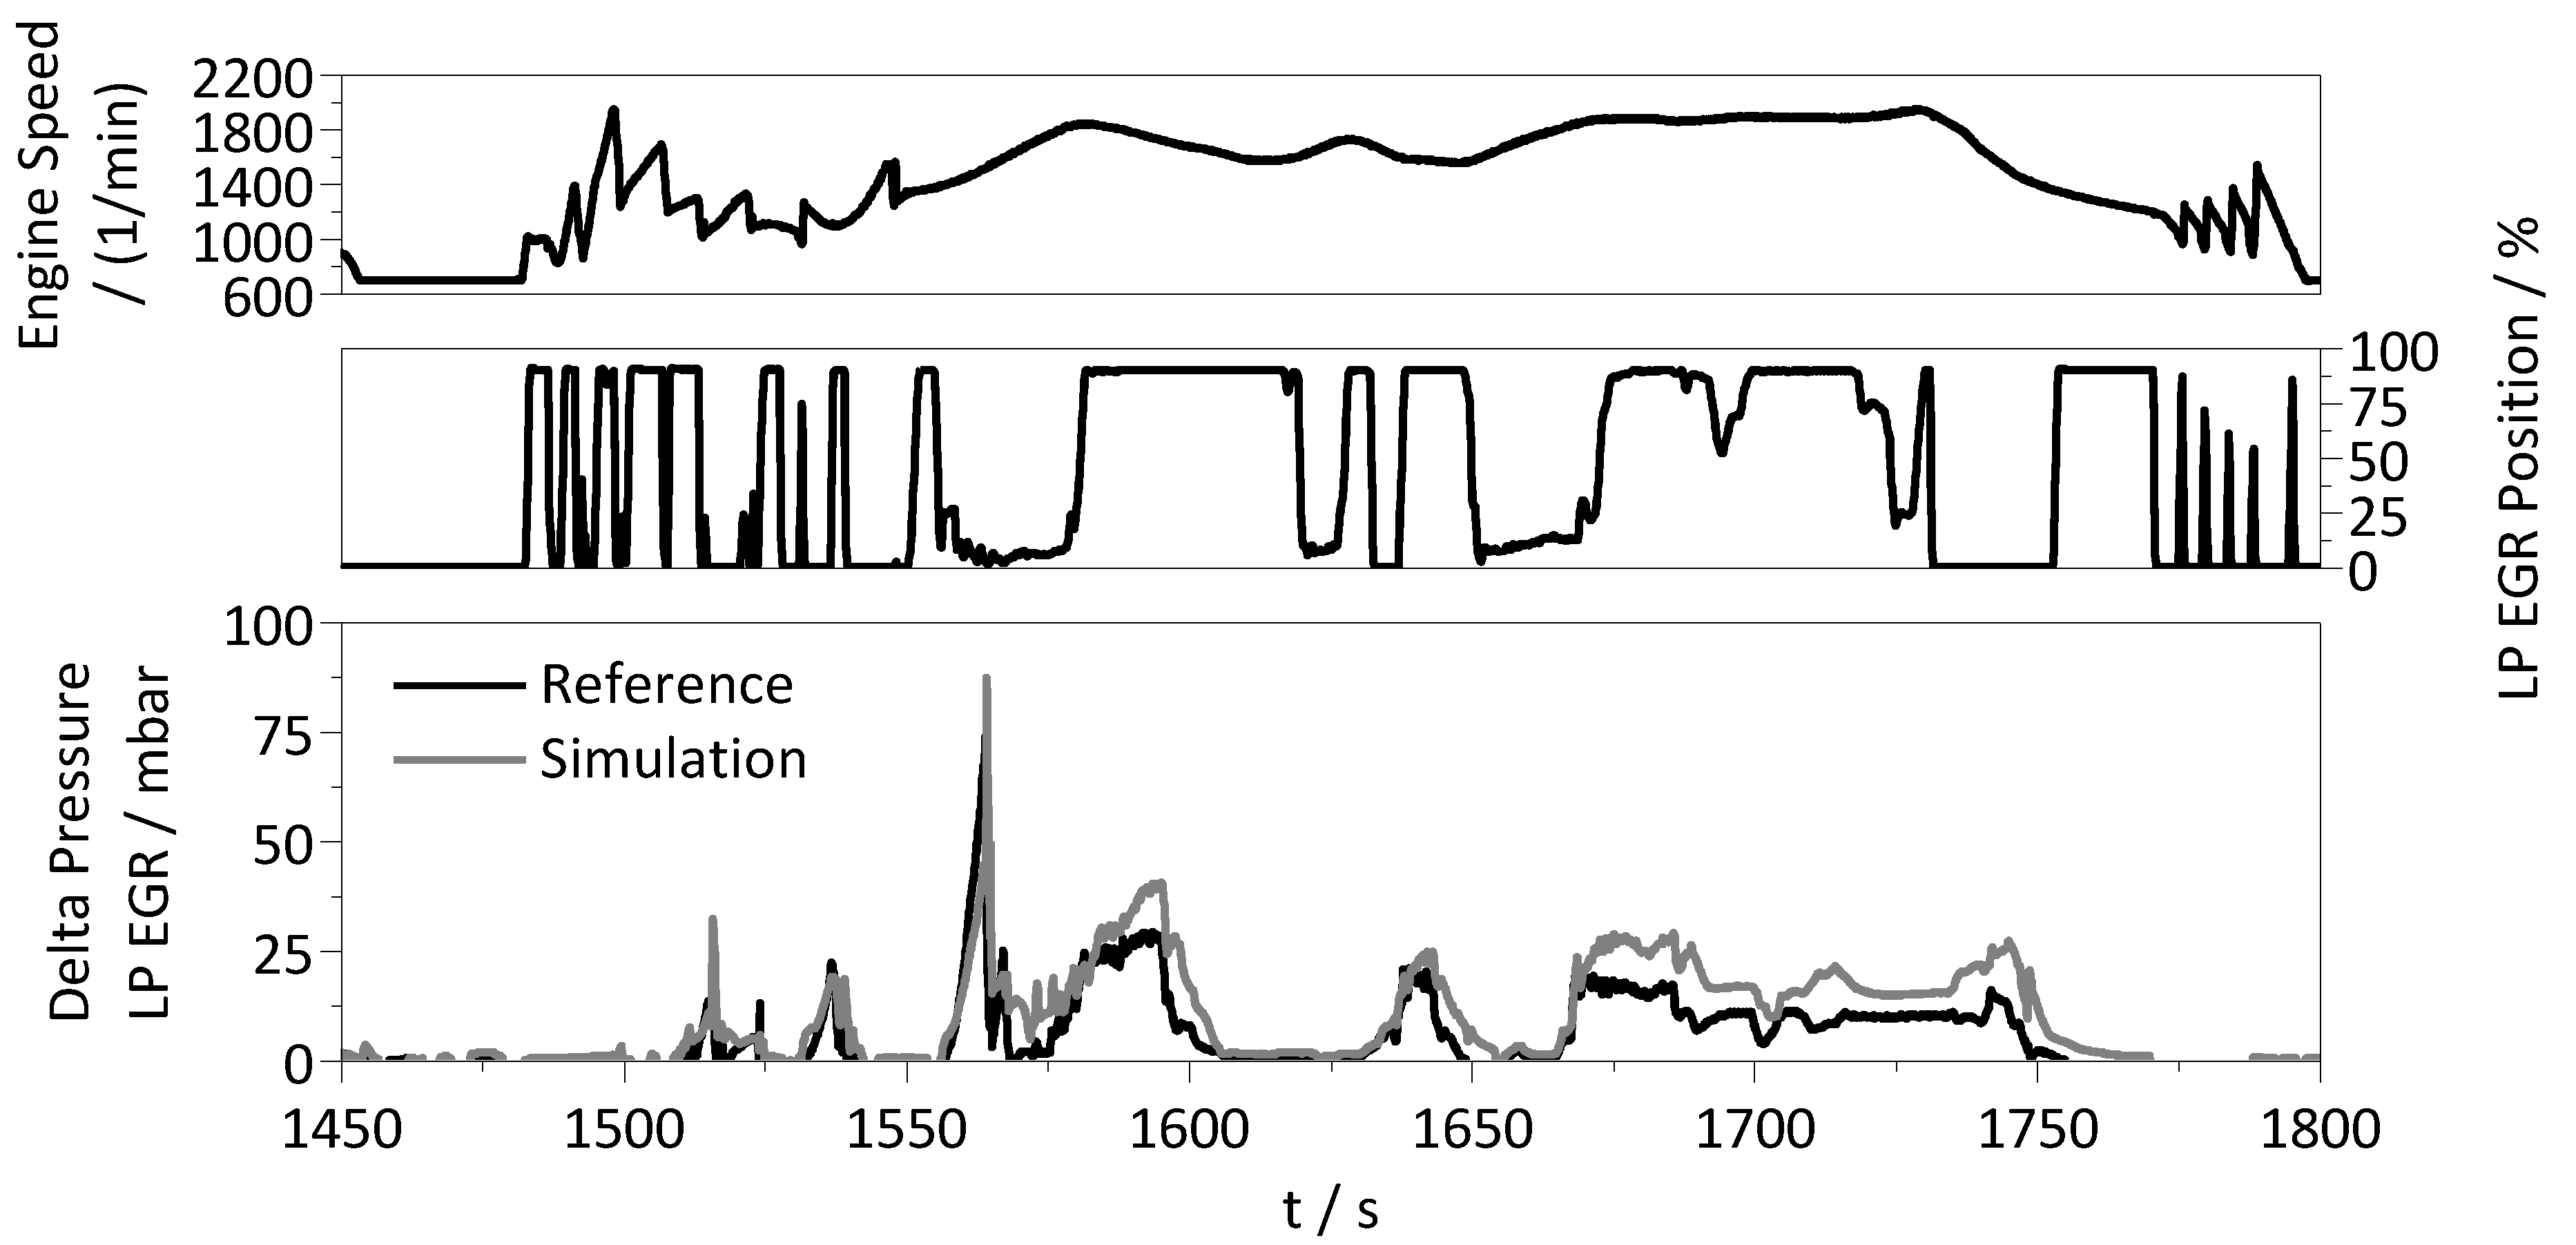
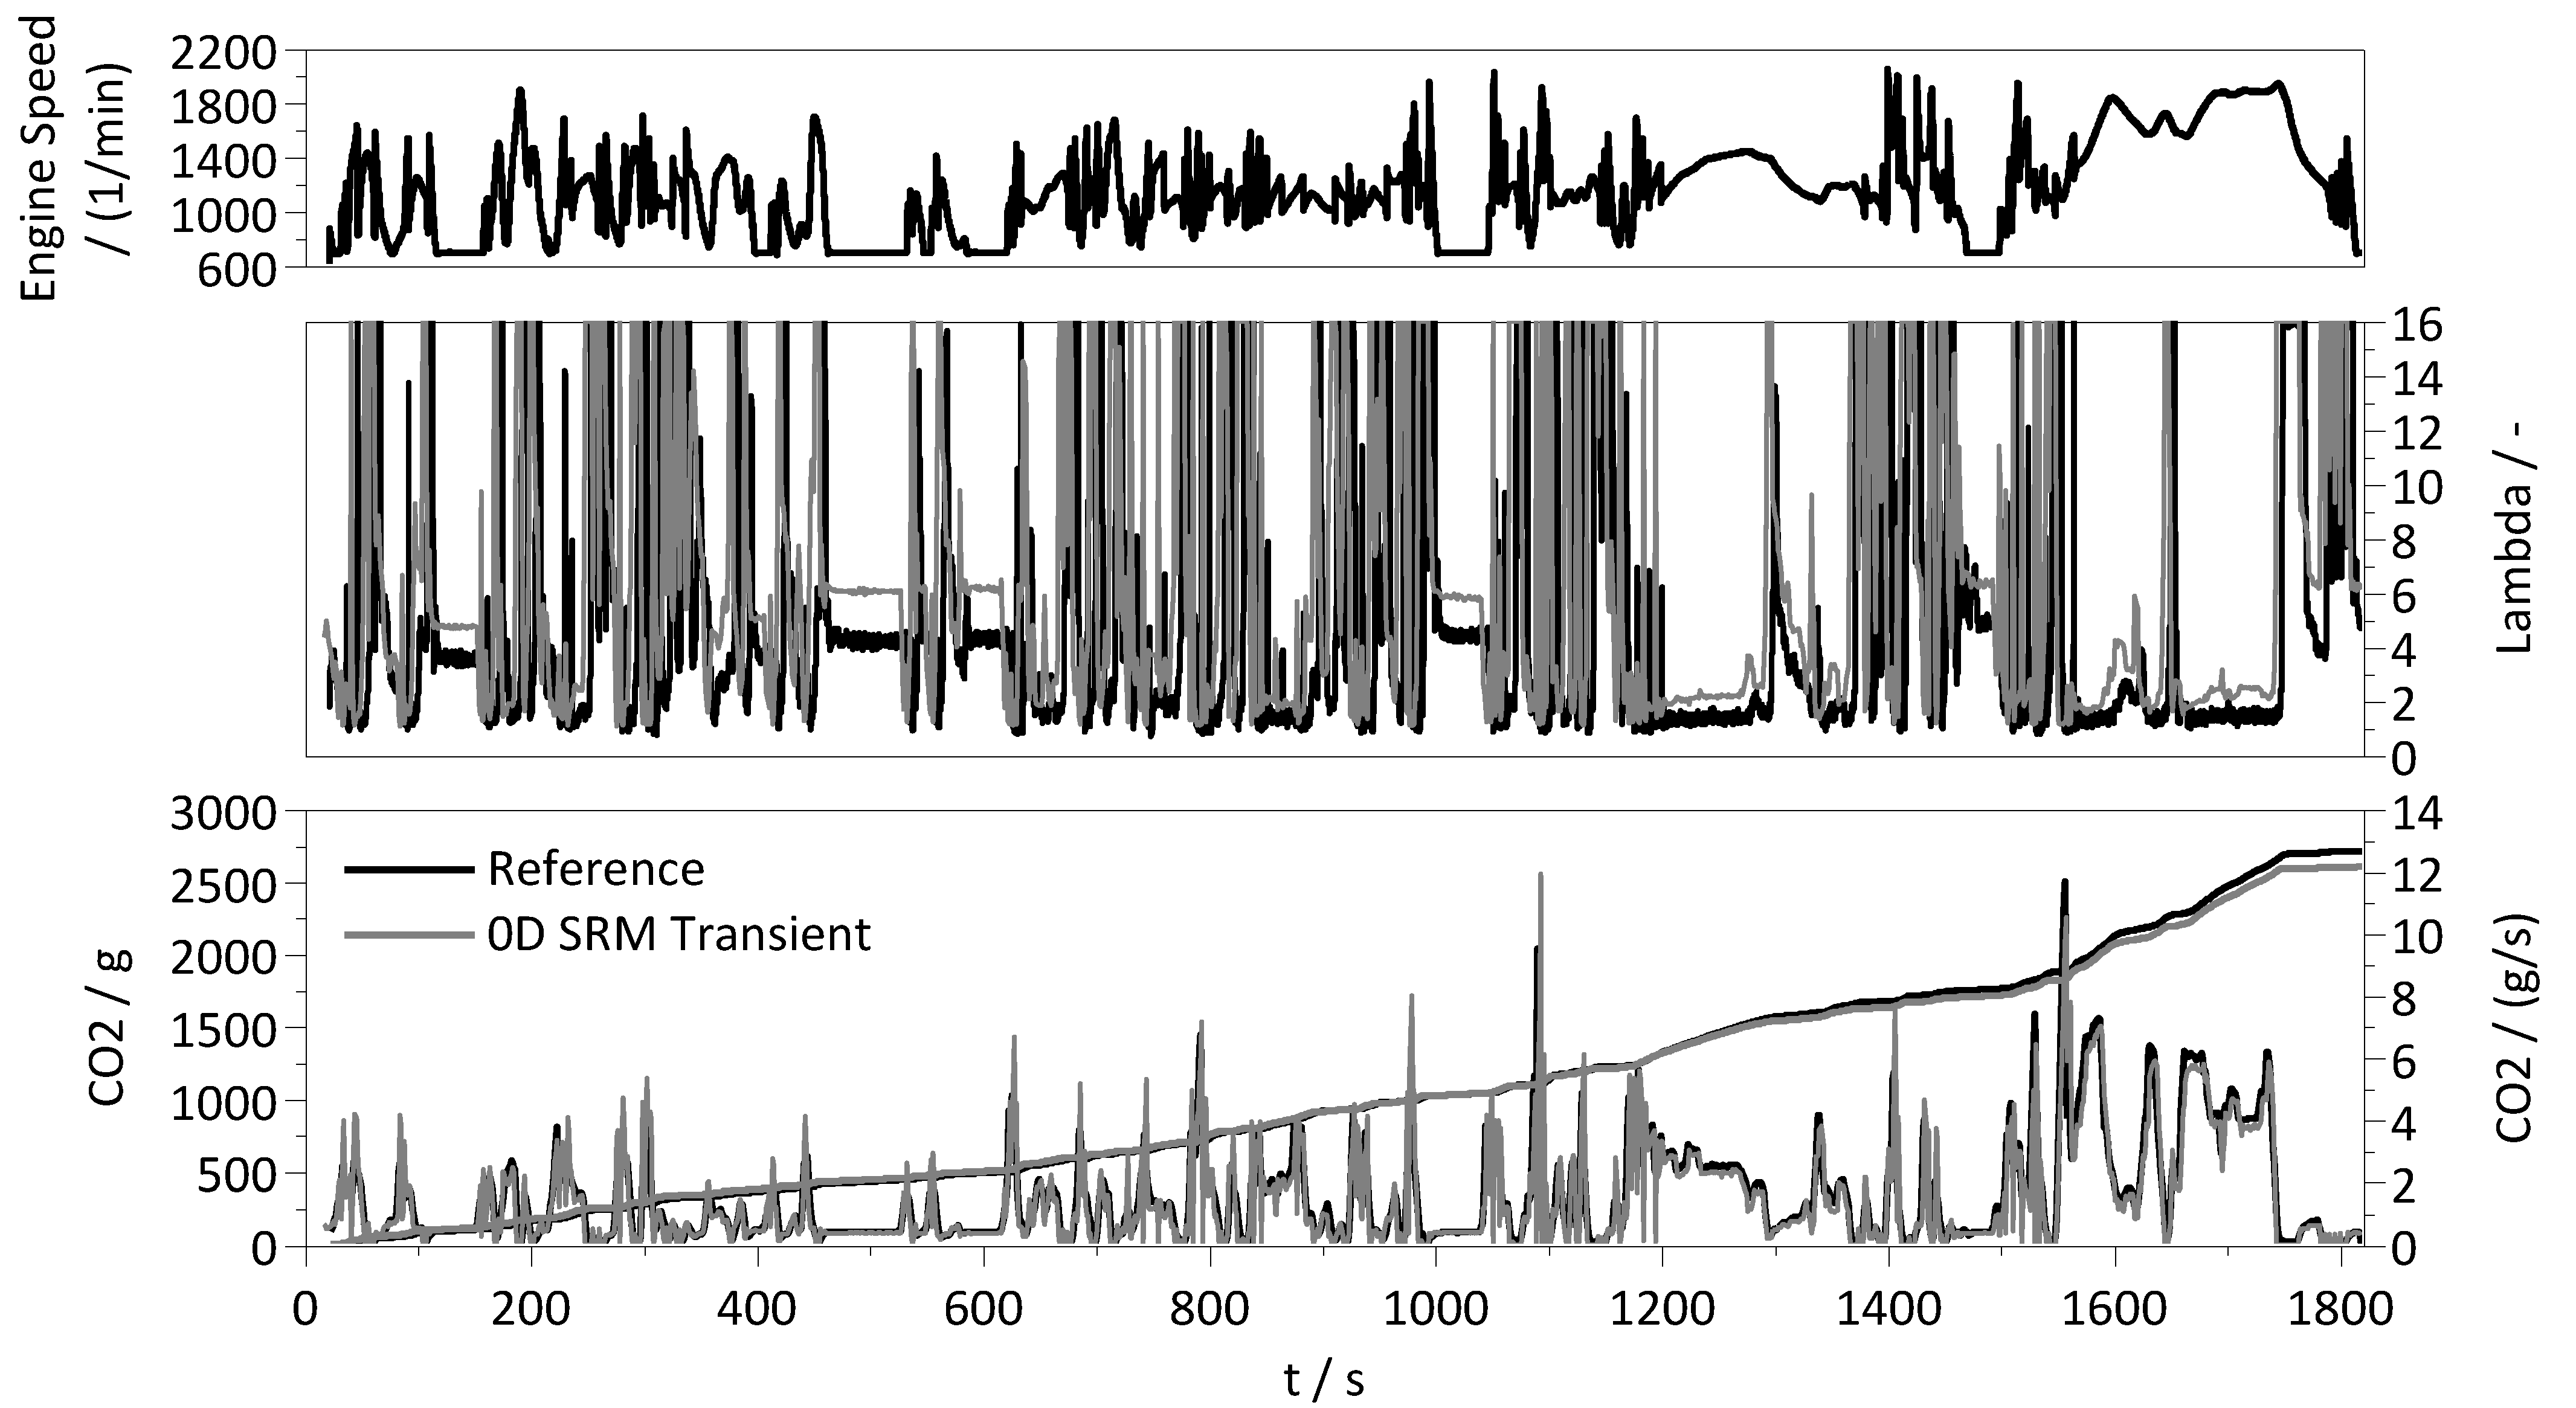
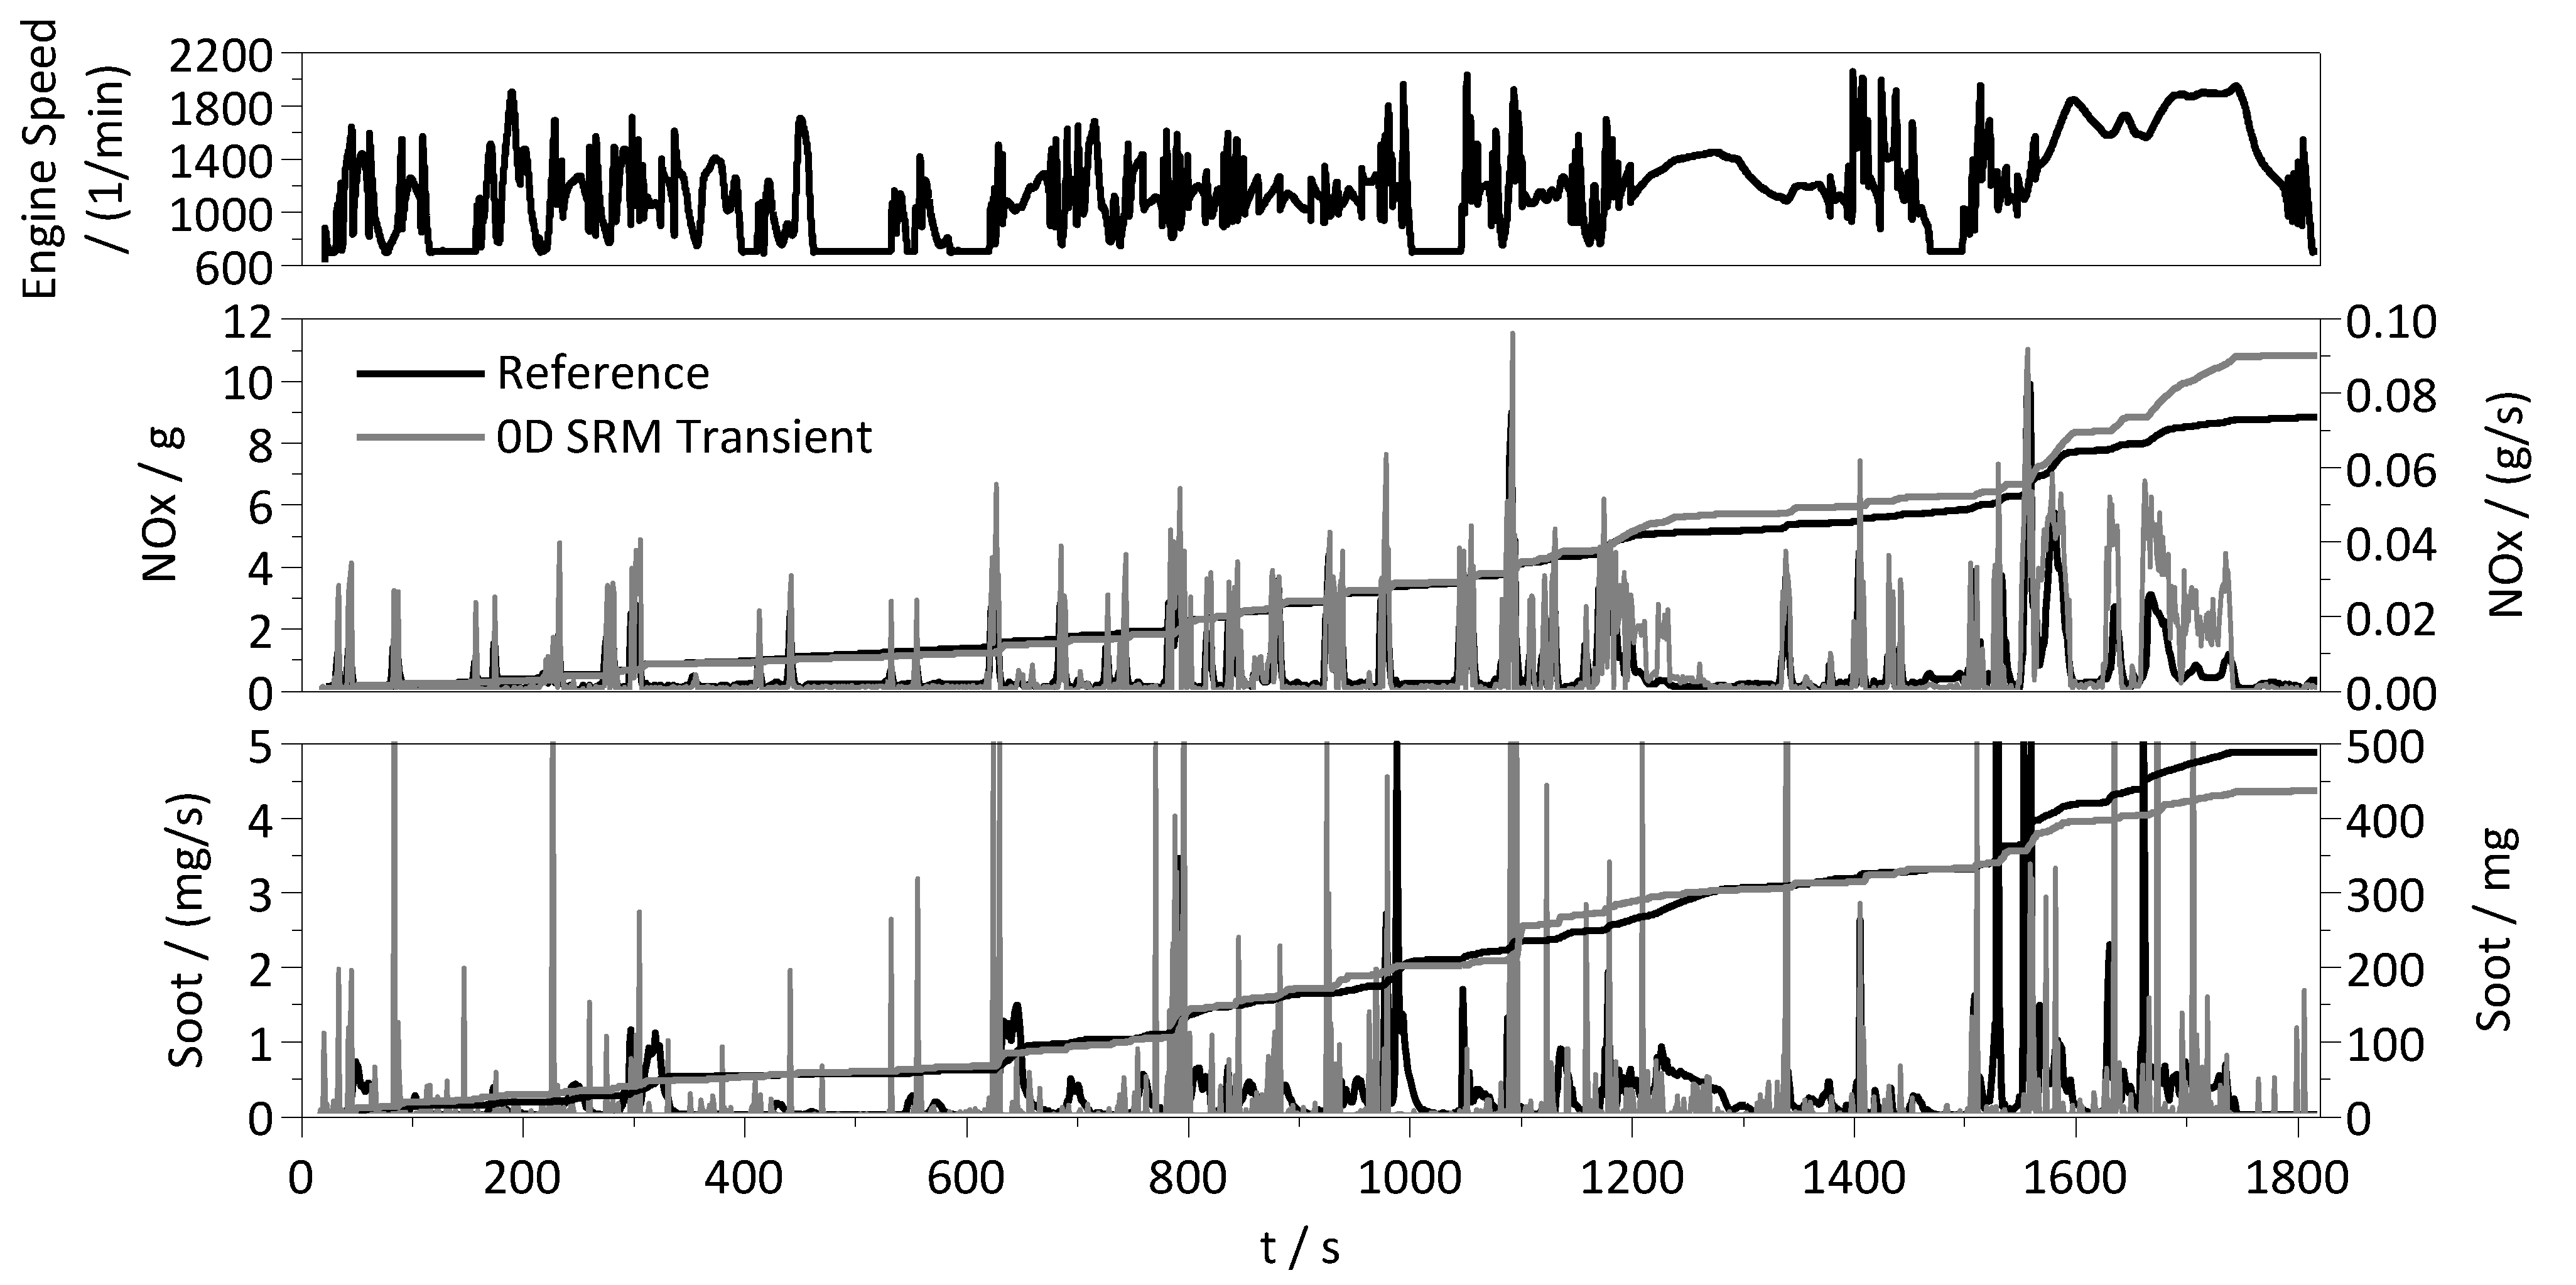
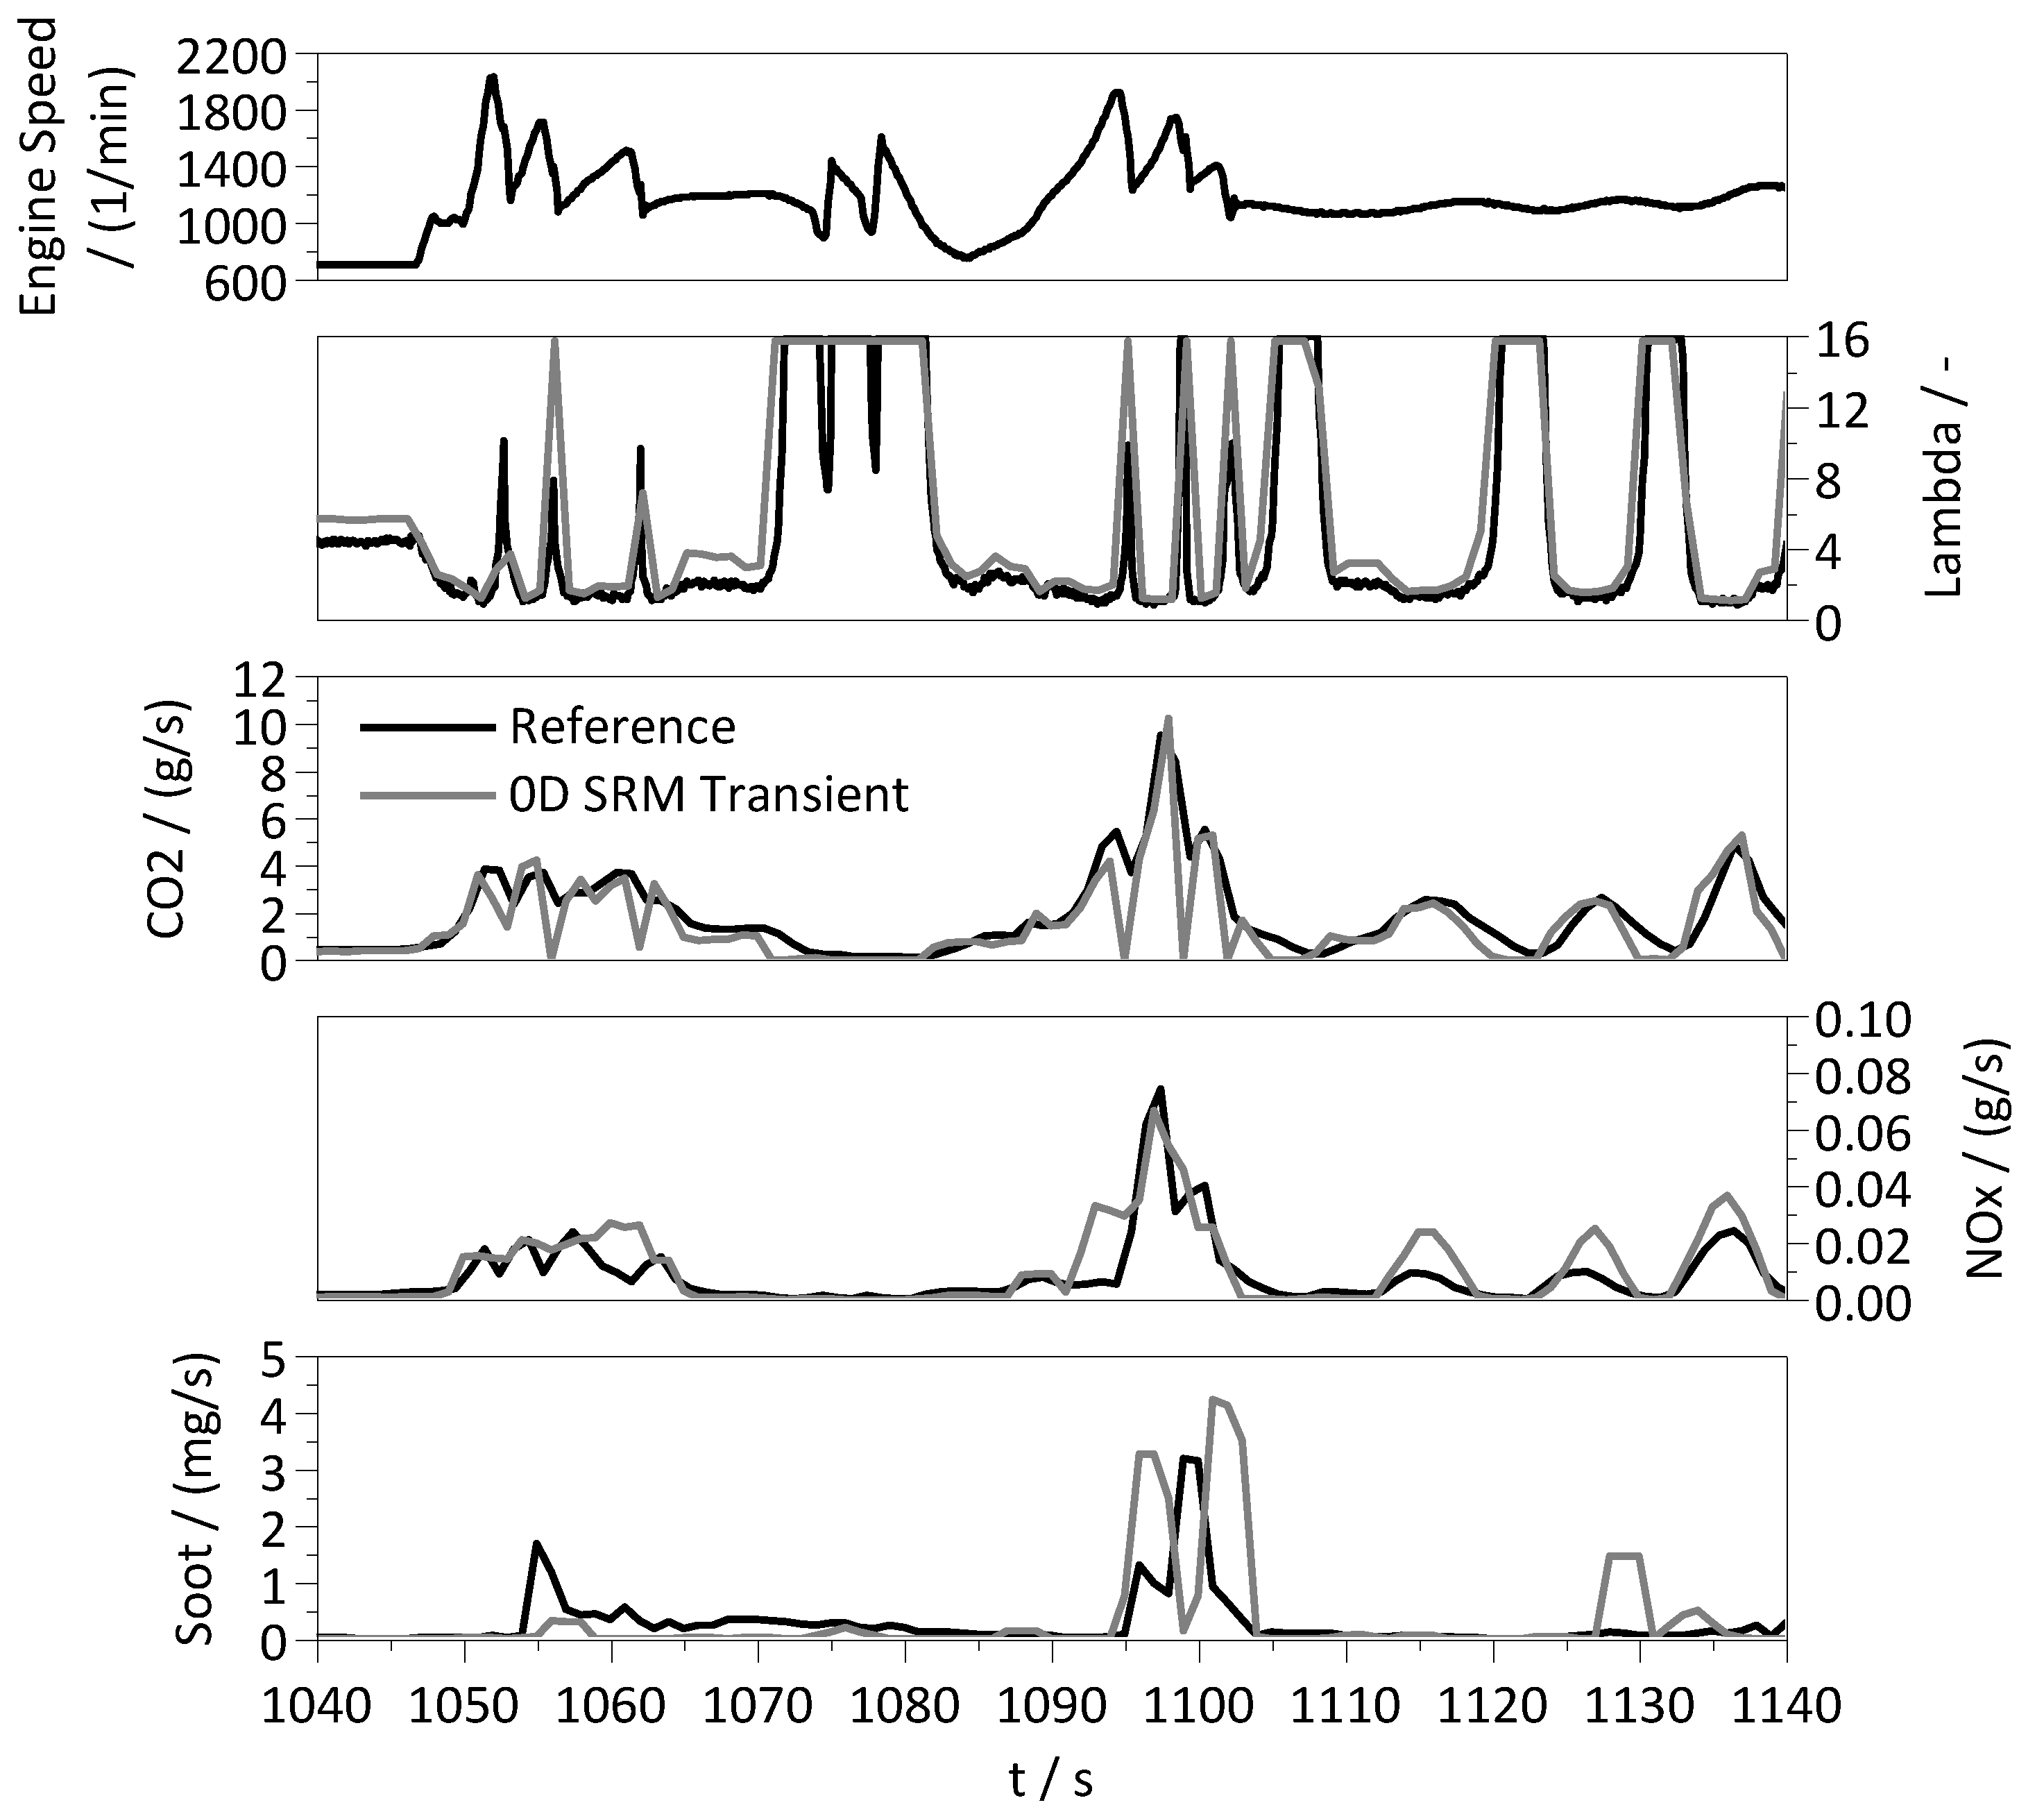
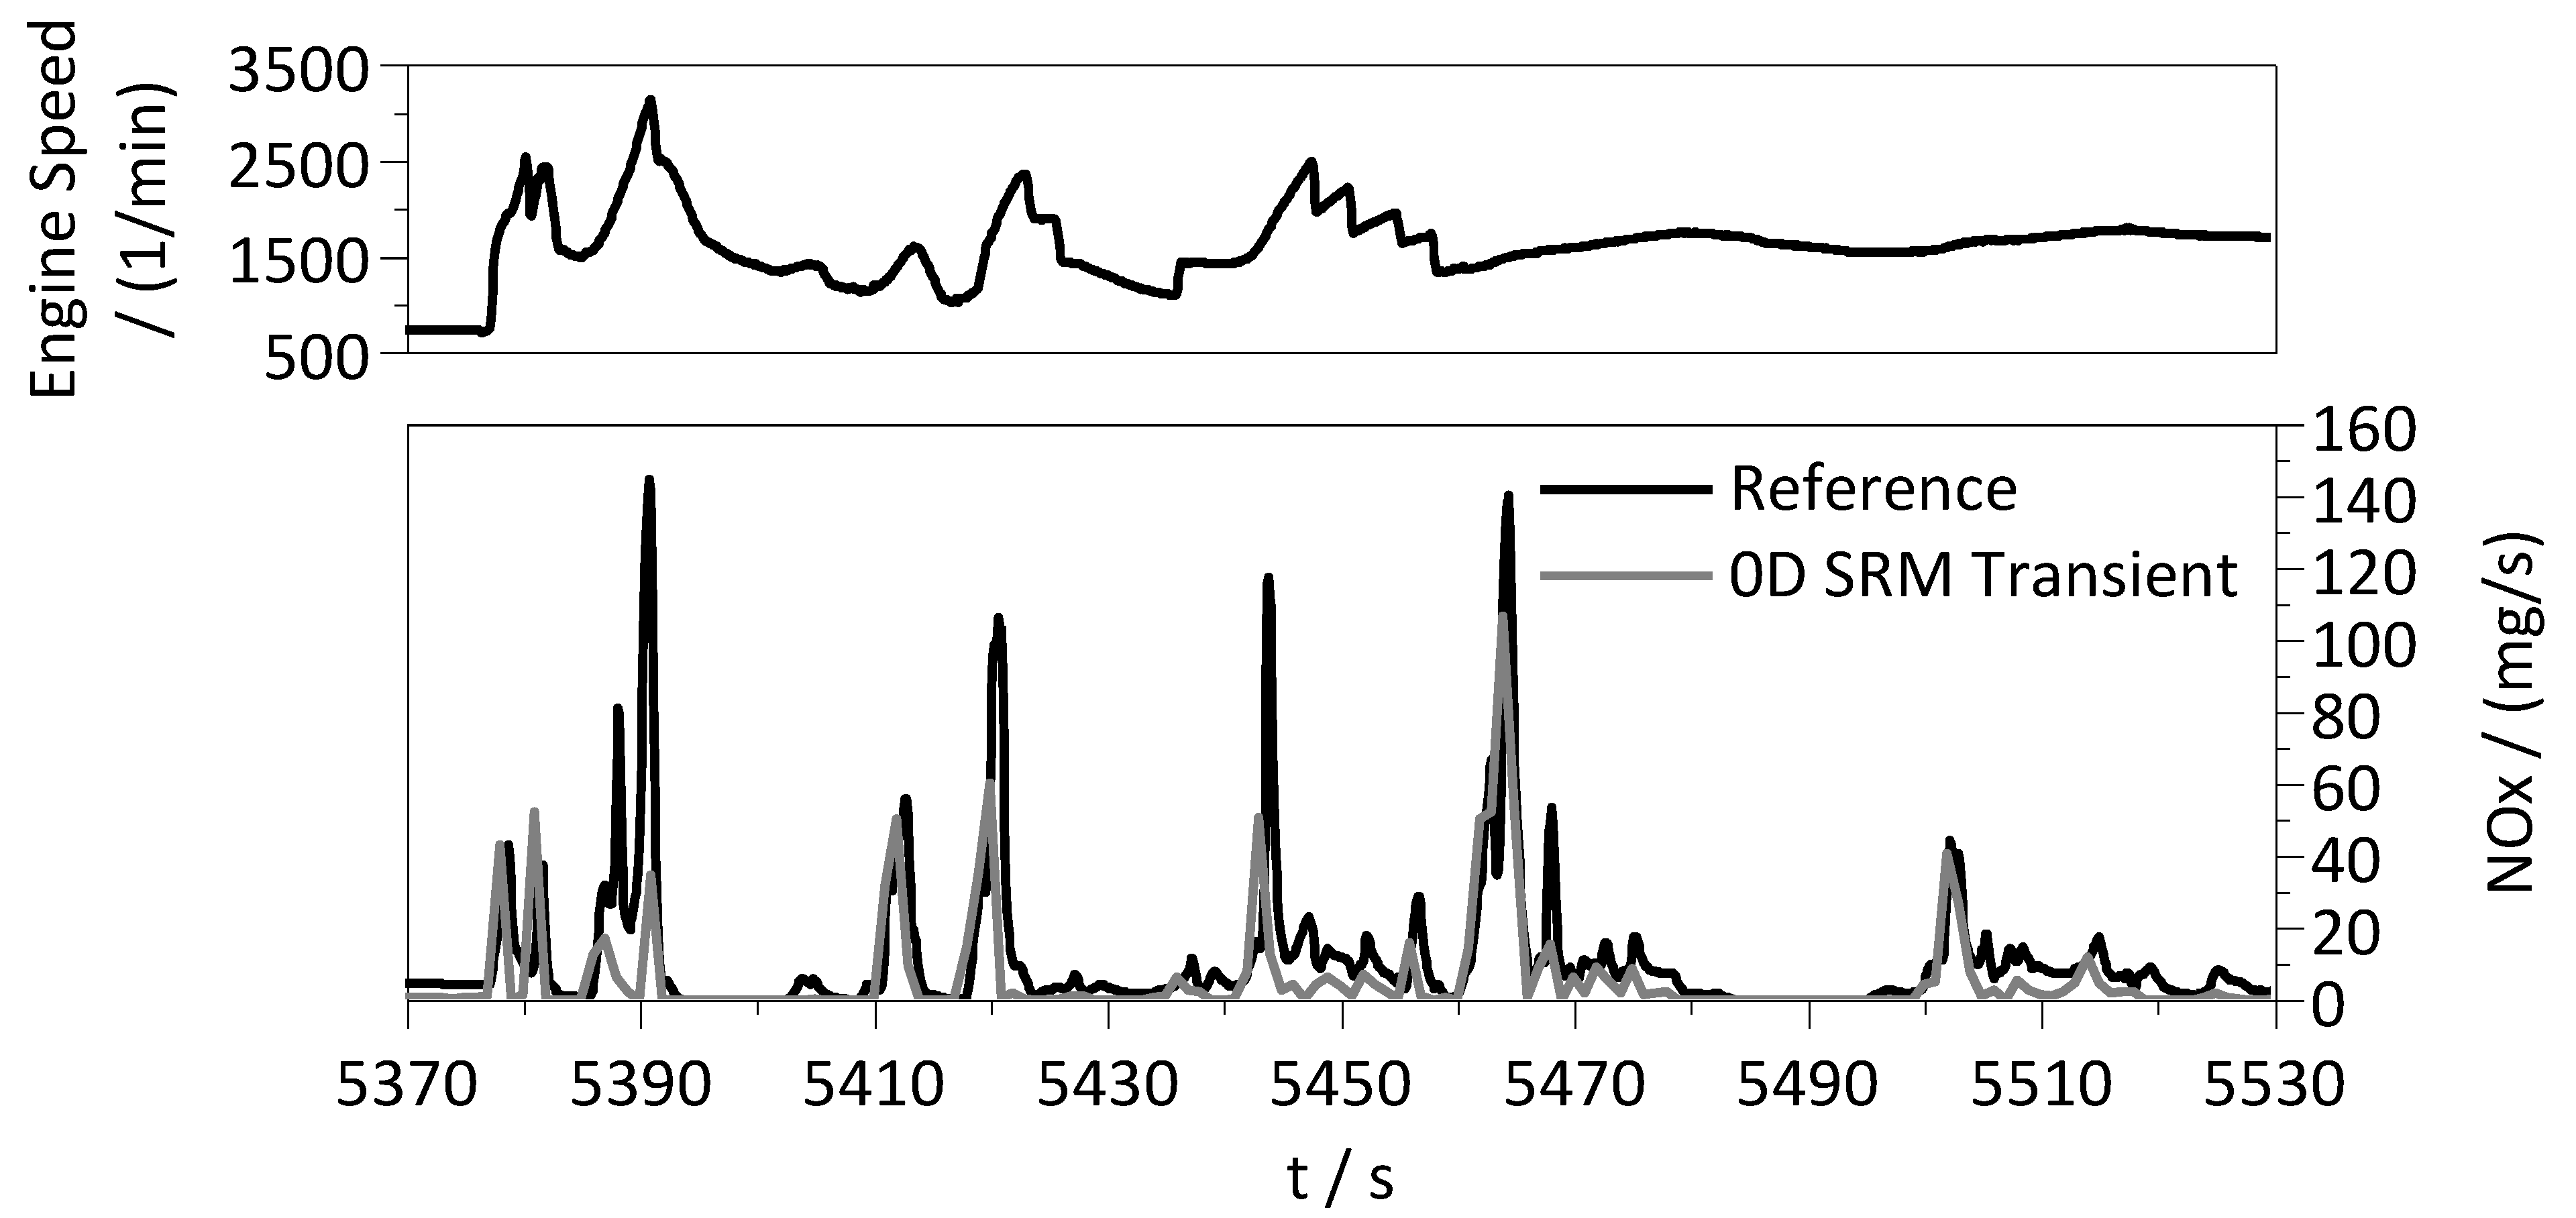
4.2. Transient Simulation

The models calibrated with the steady-state points have been tested in transient simulations characterized by vehicle idling, accelerations, and decelerations phases. The three different approaches for the modeling of the TC behavior have been compared to the reference chassis dynamometer measurements of the vehicle. Figure 6 represents the performances of the air path model in the time domain for a part of the extra high-speed segment of the WLTC cycle. In particular, it is possible to observe the details related to the intake manifold pressure, the temperature, and the turbocharger speed for the three simulated TC modeling approaches compared to the reference measurements. For all three approaches, the intake manifold pressure is well reproduced considering that no specific correction for the transient behavior is applied.
The intake manifold temperature evaluated with all the approaches is compared to the temperature from the vehicle measurements. The map-based TC modeling approach shows temperature deviations up to 40 °C, while for the two variations of the advanced TC, the maximum deviation is up to 25 °C. The reason for these differences is that the calibration of the heat transfer models used to simulate the thermal inertia was reduced. The TC speeds for the two variations of the advanced TC show good agreement with the measured data. The map-based approach does not include a model for the evaluation of the TC speed.
Figure 7 represents the prediction of the performances of the co-simulation framework over the complete WLTC cycle.
The results show a good overall agreement between simulations and measurements in terms of transient performances. Thereby, the calibration effort necessary to obtain these results was minimal.
The absence of an idle controller in the simulation of the detailed model used to generate the reference IMEP and PCP affected the offset observed in the idling phases. Deviations in the PCP can be observed at around 1250 and 1700 s. A zoomed section of the WLTC (Figure 8) highlights the reference valve position and the delta pressure through the LP-EGR valve. In particular, at high speed and loads, the simulated back pressure is lower than in the real vehicle measurements. Consequently, the simulated PCP is higher since the EGR rate is increased. This is the cause for the PCP deviation.
Figure 9 represents the WLTC performance data of the 0D SRM in terms of lambda (λ), CO2 mass flows, and cumulative values compared to the corresponding measurements.
The ECU values from the λ-sensor are adapted for overrun or idling phases where it can go to high values with an imposed limit of 16. The comparison of the sensor value for λ to the prediction of the 0D SRM is quite accurate. The differences shown, such as the difference shown at 450 s, are consistent with the behavior of the IMEP during the idle phase.
The overall deviation in the cumulative CO2 emissions is below 4%. When CO2 is calculated from the injected fuel mass flow, which is determined by the demanded torque of the ECU fuel path based on the acceleration pedal input, the deviation in l/100 km is lower than 3% at the end of the cycle.
The SRM transient reproduction of the CO2 emissions is well representative of the actual engine behavior and shows an acceptable simulation of the combustion process. The observed discrepancies in CO2 emissions are attributed to the inaccuracy of the EGR mass flow estimation that is used as an input to the in-cylinder combustion model. This issue will be investigated in more detail in future work.
Figure 10 represents the WLTC performances of the 0D SRM in terms of NOx and soot mass flows, as well as cumulative values, in comparison to the reference measurements. The results depict a good match between reference measurements and simulation results. The deviation in NOx and soot emissions is always below 10% until the extra-high segment of the WLTC. At high engine speed and high load, the deviation reached 20% for the modeling assumptions in the reproduction of the LP- and HP-EGR paths. The intrinsic absolute errors in HP- and LP-EGR valve positions caused by linearization is below 10% in a large operating area.
The operation of the reference engine is characterized by a strong LP-EGR throttling at high speeds and loads which is not fully considered by the combustion model. Since an accurate measurement of the EGR mass flow is not practicable during chassis dynamometer tests, the ECU model for the estimation of the EGR rate has been considered for the optimization of the combustion model. Consequently, any inaccuracies are carried over to the transient simulations.
In Figure 11, a zoomed section of the WLTC shows the performances in terms of λ, CO2, NOx, and soot mass flows. The results demonstrate the consistency of the simulation in the vehicle launch from standstill, during acceleration phases, and in phases when the acceleration pedal is released (motoring).
The 0D SRM is also able to predict the λ values during gear upshifting and highly transient phases, although the amplitude of the peaks during shifting could be improved since it directly affects the CO2 emission prediction (e.g., 1055 s). The overall trade-off between NOx and soot emissions is sufficiently represented. For the soot prediction, the magnitude of the predicted quantity matches the trend of the reference measurements, even though a further optimization of the EGR path calibration may be required.
Figure 12 highlights the validation results for the HP-EGR mass flow. It illustrates the error in the linearization of the HP-EGR valve, which is then propagated into the combustion model for the prediction of the emissions.
The two modeling approaches have been evaluated under real-world driving circumstances. The test drive was conducted in western Germany and eastern Belgium’s Eifel area, which is a low mountain range. The vehicle was equipped with a portable emission measuring system (PEMS) that enables the continuous monitoring of key pollutant emissions in real time.
Figure 13 shows details of the motorway segment from the RDE test cycle. In particular, the comparison between the reference and predicted NOx mass is depicted with a focus on the representation of transient peaks. Apart from an overall good representation of the transient NOx predictions, the combination of inputs to the 0D SRM (boost pressure, EGR rate, and injected mass) in sensitive phases with high speed, shifting, and an aggressive driving style may cause a missing reproduction of NOx peaks (like for 5385 s).

5. Conclusions and Outlook

In this work, a novel methodology is described that minimizes the technical effort required to develop a HiL-based virtual calibration platform for transient emission prediction. The platform adopts RT chemistry for emission performance evaluation and reduces the model calibration effort for steady-state phases. The detailed chemistry model has been simplified to a tabulated approach to reduce the computational costs of the simulation.
The presented technique presupposes that model calibration and optimization efforts should be minimized. In particular, this simplification has been targeted through a minimal parametrization of the combustion model. For the majority of the points, the deviation of IMEP is within ±0.5 bar. The maximum deviation for the PCP is 19%, and is 20% for the IMEP. In this regard, the impact of the number of operating points identified for the parametrization needs to be further investigated. The sensitivity of the number of training points on the accuracy is important to frame the robustness in different driving cycles. Therefore, for future applications, variations of the number and selection of training points need to be performed to further evaluate the robustness of the training approach.
The performance of the 0D SRM showed an acceptable representation of the trade-off between engine-out NOx and soot emissions (both within an accuracy of 20%), despite the limited amount of steady-state measurement data utilized for the calibration. In terms of soot prediction, the trend is reproduced, but the results suggest further optimizations of the model. The tailpipe emissions through the consideration of the exhaust EAT system in the framework have not been considered yet, but they are critical for the evaluation of virtual calibration use cases. Furthermore, the impact of LP- and HP-EGR paths on the emission prediction (in particular at high engine speed and load) as an input of the 0D SRM needs to be addressed in more detail. Moreover, the impact of EGR on the EAT, and the emission conversion process in the exhaust line, should be further studied to better evaluate the potential of the framework. In terms of fuel consumption, the accuracy is within 4% for the WLTC cycle. The overall effort required for the calibration and optimization of the framework, and the competence to use test bench measurements to evaluate them, is minimized, but is not negligible.
In order to assess the overall accuracy and the repeatability of the HiL simulation results, the performances in terms of RT capability need to be further investigated and analyzed. In particular, the impact of the sample time, simulation scheduling, and communication between the 0D SRM and air-path model through FMI standard requires further tests to achieve the maximum potential of the interface. Therefore, the settings of the co-simulation framework need to be tested for their impact on driving cycles simulation in RT to evaluate the accuracy of the overall system. In conclusion, the transferability of the developed platform cannot be clearly defined without first investigating the aforementioned aspects.
Future work needs to focus on several additional aspects. First, the FMU interface for the 0D SRM will be extended to multi-cylinders simulation, multizone models, and exhaust manifold simulation. Second, a sensitivity study on the multi-objective optimization process will target different combinations of points and optimization strategies to further improve the results, with a particular focus on soot emissions. Finally, the developed framework will be applied to virtual calibration use cases, including the evaluation of the emissions prediction in extreme conditions such as altitude and cold simulations. Additionally, the robustness of the chemistry-based combustion model can support the development of on-board diagnostics and monitoring functions, as foreseen in the upcoming EU7 regulations. The possibility to change the fuel properties in the chemistry-based combustion model would allow for the investigation of different fuel blends and their impact on the reduction of pollutant emissions. The 0D SRM, in combination with artificial intelligence applied for function development, is a promising method to investigate the further decrease of costs and development time.

Author Contributions

Conceptualization, M.P. (Mario Picerno) and S.-Y.L.; methodology, M.P. (Mario Picerno), T.F., M.P. (Michal Pasternak) and S.-Y.L.; validation, M.P. (Mario Picerno) and S.-Y.L.; formal analysis, M.P. (Mario Picerno) and S.-Y.L.; investigation, M.P. (Mario Picerno), S.-Y.L., M.P. (Michal Pasternak), R.S. and T.F.; resources, J.A. and F.M.; data curation, M.P. (Mario Picerno), S.-Y.L. and T.F.; writing—original draft preparation, M.P. (Mario Picerno); writing—review and editing, M.P. (Mario Picerno), S.-Y.L., M.P. (Michal Pasternak), R.S., T.F. and J.A.; visualization, M.P. (Mario Picerno); supervision, S.-Y.L., J.A. and F.M.; project administration, J.A. and F.M.; funding acquisition, J.A. and F.M. All authors have read and agreed to the published version of the manuscript.

Funding

The presented research was carried out at the Center for Mobile Propulsion (CMP) of RWTH Aachen University. It was supported by the Federal Ministry for Economic Affairs and Energy (BMWi) through the AiF (German Federation of Industrial Research Associations eV) based on a decision taken by the German Bundestag (project number ZF4733201ZG9).

Institutional Review Board Statement

Not applicable.

Informed Consent Statement

Not applicable.

Acknowledgments

The authors would like to thank Alexandre Mugnai (ESTECO), and Joschka Schaub (FEV Europe GmbH) who supported the ConneCDT project, and Horst Schulte for comments that improved the manuscript.

Conflicts of Interest

The authors declare no conflict of interest. The funders had no role in the design of the study, in the collection, analyses, or interpretation of data, in the writing of the manuscript, or in the decision to publish the results.

References

  1. Samaras, Z. Preliminary Findings on Possible Euro 7 Emission Limits for Passenger Cars and LCVs: Online AGVES Meeting. Available online: https://circabc.europa.eu/sd/a/fdd70a2d-b50a-4d0b-a92a-e64d41d0e947/CLOVE%20test%20limits%20AGVES%202020-10-27%20final%20vs2.pdf (accessed on 15 January 2021).
  2. Samaras, Z. LDV Exhaust: Online AGVES Meeting. Available online: https://www.heise.de/downloads/18/3/0/8/5/7/1/4/AGVES-2021-04-08-LDV_Exhaust.pdf (accessed on 11 November 2021).
  3. Delphi Technologies. Worldwide Emissions Standards: Passenger Cars and Light Duty Vehicles. 2020. Available online: https://www.delphi.com/sites/default/files/2020-04/DELPHI%20booklet%20emission%20passenger%20cars%202020%20online%20complet.pdf (accessed on 11 November 2021).
  4. Conway, G.; Joshi, A.; Leach, F.; García, A.; Senecal, P.K. A review of current and future powertrain technologies and trends in 2020. Transp. Eng. 2021, 5, 100080. [Google Scholar] [CrossRef]
  5. Joshi, A. Review of Vehicle Engine Efficiency and Emissions. In SAE Technical Paper Series; WCX SAE World Congress Experience, APR. 21, 2020; SAE International400 Commonwealth Drive: Warrendale, PA, USA, 2020. [Google Scholar]
  6. Cosadia, I.; Silvestri, J.J.; Papadimitriou, I.; Maroteaux, D.; Obernesser, P. Traversing the V-Cycle with a Single Simulation—Application to the Renault 1.5 dCi Passenger Car Diesel Engine. In SAE Technical Paper Series; SAE 2013 World Congress & Exhibition, APR. 16, 2013; SAE International400 Commonwealth Drive: Warrendale, PA, USA, 2013. [Google Scholar]
  7. Klein, S.; Savelsberg, R.; Xia, F.; Guse, D.; Andert, J.; Blochwitz, T.; Bellanger, C.; Walter, S.; Beringer, S.; Jochheim, J.; et al. Engine in the Loop: Closed Loop Test Bench Control with Real-Time Simulation. SAE Int. J. Commer. Veh. 2017, 10, 95–105. [Google Scholar] [CrossRef]
  8. Roberts, P.J.; Mumby, R.; Mason, A.; Redford-Knight, L.; Kaur, P. RDE Plus—The Development of a Road, Rig and Engine-in-the-Loop Test Methodology for Real Driving Emissions Compliance. In SAE Technical Paper Series; WCX SAE World Congress Experience, APR. 09, 2019; SAE International400 Commonwealth Drive: Warrendale, PA, USA, 2019. [Google Scholar]
  9. Andert, J.; Xia, F.; Klein, S.; Guse, D.; Savelsberg, R.; Tharmakulasingam, R.; Thewes, M.; Scharf, J. Road-to-rig-to-desktop: Virtual development using real-time engine modelling and powertrain co-simulation. Int. J. Engine Res. 2019, 20, 686–695. [Google Scholar] [CrossRef] [Green Version]
  10. Lee, S.-Y.; Andert, J.; Quérel, C.; Schaub, J.; Kötter, M.; Politsch, D.; Hadj-amor, H. X-in-the-Loop-basierte Kalibrierung: HiL Simulation eines virtuellen Dieselantriebsstrangs. In Simulation und Test 2017; Liebl, J., Beidl, C., Eds.; Springer Fachmedien Wiesbaden: Wiesbaden, Germany, 2018; pp. 53–79. ISBN 978-3-658-20827-1. [Google Scholar]
  11. Kötter, M.; Lindemann, B.; Bergmann, D.; Ehrly, M.; Jung, T.; Nijs, M.; Thewes, S.; Körfer, T.; Trampert, S.; Drecq, T.; et al. Powertrain calibration based on X-in-theLoop: Virtualization in the vehicle development process. In 18. Internationales Stuttgarter Symposium; Bargende, M., Reuss, H.-C., Wiedemann, J., Eds.; Springer Fachmedien Wiesbaden: Wiesbaden, Germany, 2018; pp. 1187–1201. ISBN 978-3-658-21193-6. [Google Scholar]
  12. Picerno, M.; Lee, S.-Y.; Ehrly, M.; Schaub, J.; Andert, J. Virtual Powertrain Simulation: X-in-the-Loop Methods for Concept and Software Development. In 21. Internationales Stuttgarter Symposium; Bargende, M., Reuss, H.-C., Wagner, A., Eds.; Springer Fachmedien Wiesbaden: Wiesbaden, Germany, 2021; pp. 531–545. ISBN 978-3-658-33465-9. [Google Scholar]
  13. Picerno, M.; Lee, S.-Y.; Schaub, J.; Ehrly, M.; Millo, F.; Scassa, M.; Andert, J. Co-Simulation of Multi-Domain Engine and its Integrated Control for Transient Driving Cycles. IFAC-PapersOnLine 2020, 53, 13982–13987. [Google Scholar] [CrossRef]
  14. Xia, F.; Lee, S.-Y.; Andert, J.; Kampmeier, A.; Scheel, T.; Ehrlylng, M.; Tharmakulasingam, R.; Takahashi, Y.; Kumagai, T. Crank-Angle Resolved Real-Time Engine Modelling: A Seamless Transfer from Concept Design to HiL Testing. SAE Int. J. Engines 2018, 11, 1385–1398. [Google Scholar] [CrossRef]
  15. Andric, J.; Schimmel, D.; Sediako, A.D.; Sjoblom, J.; Faghani, E. Development and Calibration of One Dimensional Engine Model for Hardware-In-The-Loop Applications. In SAE Technical Paper Series; WCX World Congress Experience, APR. 10, 2018; SAE International400 Commonwealth Drive: Warrendale, PA, USA, 2018. [Google Scholar]
  16. Millo, F.; Di Lorenzo, G.; Servetto, E.; Capra, A.; Pettiti, M. Analysis of the Performance of a Turbocharged S.I. Engine under Transient Operating Conditions by Means of Fast Running Models. SAE Int. J. Engines 2013, 6, 968–978. [Google Scholar] [CrossRef]
  17. Xia, F.; Dorscheidt, F.; Lücke, S.; Andert, J.; Gardini, P.; Scheel, T.; Walter, V.; Tharmakulasingam, J.K.R.; Böhmer, M.; Nijs, M. Experimental Proof-of-Concept of HiL Based Virtual Calibration for a Gasoline Engine with a Three-Way-Catalyst. In SAE Technical Paper Series; 2019 JSAE/SAE Powertrains, Fuels and Lubricants, AUG. 26, 2019; SAE International400 Commonwealth Drive: Warrendale, PA, USA, 2019. [Google Scholar]
  18. Piano, A.; Millo, F.; Boccardo, G.; Rafigh, M.; Gallone, A.; Rimondi, M. Assessment of the Predictive Capabilities of a Combustion Model for a Modern Common Rail Automotive Diesel Engine. In SAE Technical Paper Series; SAE 2016 World Congress and Exhibition, APR. 12, 2016; SAE International400 Commonwealth Drive: Warrendale, PA, USA, 2016. [Google Scholar]
  19. Boccardo, G.; Servetto, E.; Seebooa, A.; Sammut, G.; Primitivo, J.S. Development of a Real Time GT-Power xRT Model for Virtual Calibration: Online AGVES Meeting. Available online: https://www.gtisoft.com/wp-content/uploads/2020/11/Development-of-a-Real-Time-GT-POWER-xRT-Model-for-Virtual-Calibration-Giulio-Boccardo-Powertech-and-JLR.pdf (accessed on 8 October 2021).
  20. Gamma Technologies. GT-SUITE: Engine Performance Application Manual Version 2021. Available online: https://www.gtisoft.com/gt-suite-applications/propulsion-systems/real-time-engine/ (accessed on 19 November 2021).
  21. Lee, S.-Y.; Andert, J.; Pischinger, S.; Ehrly, M.; Schaub, J.; Koetter, M.; Ayhan, A.S. Scalable Mean Value Modeling for Real-Time Engine Simulations with Improved Consistency and Adaptability. In SAE Technical Paper Series; WCX SAE World Congress Experience, APR. 09, 2019; SAE International400 Commonwealth Drive: Warrendale, PA, USA, 2019. [Google Scholar]
  22. Joerg, C.; Lee, S.-Y.; Reuber, C.; Schaub, J.; Koetter, M.; Thewes, S.; Thattaradiyil, R.; Andert, J. Accurate Mean Value Process Models for Model-Based Engine Control Concepts by Means of Hybrid Modeling. In SAE Technical Paper Series; WCX SAE World Congress Experience, APR. 09, 2019; SAE International400 Commonwealth Drive: Warrendale, PA, USA, 2019. [Google Scholar]
  23. Dorscheidt, F.; Düzgün, M.; Claßen, J.; Krysmon, S.; Pischinger, S.; Görgen, M.; Dönitz, C.; Nijs, M. Hardware-in-the-Loop Based Virtual Emission Calibration for a Gasoline Engine. In SAE Technical Paper Series; SAE WCX Digital Summit, APR. 13, 2021; SAE International400 Commonwealth Drive: Warrendale, PA, USA, 2021. [Google Scholar]
  24. Lee, S.-Y.; Andert, J.; Neumann, D.; Querel, C.; Scheel, T.; Aktas, S.; Miccio, M.; Schaub, J.; Koetter, M.; Ehrly, M. Hardware-in-the-Loop-Based Virtual Calibration Approach to Meet Real Driving Emissions Requirements. In SAE Technical Paper Series; WCX World Congress Experience, APR. 10, 2018; SAE International400 Commonwealth Drive: Warrendale, PA, USA, 2018. [Google Scholar]
  25. Gottorf, S.; Fryjan, J.; Leyens, L.; Picerno, M.; Habermann, K.; Pischinger, S. Lean Approach for Virtual Calibration Using Hardware-in-the-Loop and Electronic Control Unit (ECU)-Capable Engine Simulation. SAE Int. J. Engines 2021, 14, 531–542. [Google Scholar] [CrossRef]
  26. Xia, F. Real-Time Capable One-Dimensional Models for Internal Combustion Engines in X-in-the-Loop Applications; RWTH Aachen University: Aachen, Germany, 2020. [Google Scholar]
  27. Meli, M.; Pischinger, S.; Kansagara, J.; Dönitz, C.; Liberda, N.; Nijs, M. Proof of Concept for Hardware-in-the-Loop Based Knock Detection Calibration. In SAE Technical Paper Series; SAE WCX Digital Summit, APR. 13, 2021; SAE International400 Commonwealth Drive: Warrendale, PA, USA, 2021. [Google Scholar]
  28. Krysmon, S.; Dorscheidt, F.; Claßen, J.; Düzgün, M.; Pischinger, S. Real Driving Emissions—Conception of a Data-Driven Calibration Methodology for Hybrid Powertrains Combining Statistical Analysis and Virtual Calibration Platforms. Energies 2021, 14, 4747. [Google Scholar] [CrossRef]
  29. Mirzaeian, M.; Langridge, S. Creating a Virtual Test Bed Using a Dynamic Engine Model with Integrated Controls to Support in-the-Loop Hardware and Software Optimization and Calibration. Energies 2021, 14, 652. [Google Scholar] [CrossRef]
  30. Millo, F.; Accurso, F.; Piano, A.; Caputo, G.; Cafari, A.; Hyvönen, J. Experimental and numerical investigation of the ignition process in a large bore dual fuel engine. Fuel 2021, 290, 120073. [Google Scholar] [CrossRef]
  31. Exothermia. Exhaust. Available online: http://www.exothermia.com/exhaust-features (accessed on 10 April 2021).
  32. Franken, T.; Sommerhoff, A.; Willems, W.; Matrisciano, A.; Lehtiniemi, H.; Borg, A.; Netzer, C.; Mauss, F. Advanced Predictive Diesel Combustion Simulation Using Turbulence Model and Stochastic Reactor Model. In SAE Technical Paper Series; WCX™ 17: SAE World Congress Experience, APR. 04, 2017; SAE International400 Commonwealth Drive: Warrendale, PA, USA, 2017. [Google Scholar]
  33. Netzer, C.; Seidel, L.; Ravet, F.; Mauss, F. Impact of the surrogate formulation on 3D CFD engine knock prediction using detailed chemistry. Fuel 2019, 254, 115678. [Google Scholar] [CrossRef]
  34. RWTH. CONNECDT Homepage, C.M.P. Available online: https://www.mmp.rwth-aachen.de/go/id/eeofn (accessed on 9 November 2021).
  35. LOGE. CONNECDT Homepage. Available online: https://logesoft.com/public-projects/ (accessed on 5 April 2021).
  36. LOGEsoft; LOGEresearch, LOGEfuel, LOGEtable, LOGEengine. Loge AB, “LOGEsoft Manual” 2020. Available online: http://www.logesoft.com (accessed on 5 November 2021).
  37. Matrisciano, A.; Franken, T.; Perlman, C.; Borg, A.; Lehtiniemi, H.; Mauss, F. Development of a Computationally Efficient Progress Variable Approach for a Direct Injection Stochastic Reactor Model. In SAE Technical Paper Series; WCX™ 17: SAE World Congress Experience, APR. 04, 2017; SAE International400 Commonwealth Drive: Warrendale, PA, USA, 2017. [Google Scholar]
  38. Pasternak, M.; Mauss, F.; Perlman, C.; Lehtiniemi, H. Aspects of 0D and 3D Modeling of Soot Formation for Diesel Engines. Combust. Sci. Technol. 2014, 186, 1517–1535. [Google Scholar] [CrossRef]
  39. Tunér, M.; Pasternak, M.; Mauss, F.; Bensler, H. A PDF-Based Model for Full Cycle Simulation of Direct Injected Engines. In SAE Technical Paper Series; 2008 SAE International Powertrains, Fuels and Lubricants Congress, JUN. 23, 2008; SAE International400 Commonwealth Drive: Warrendale, PA, USA, 2008. [Google Scholar]
  40. Nett, O.; Pasternak, M.; Yang, Q.; Mauss, F.; Bargende, M.; Franken, T.; Grill, M.; Diezemann, M. Modelling Emissions of Diesel Engine Combustion with Variable Valve Timing. In Proceedings of the FVV Autumn Conference, Frankfurt, Germany, 21–25 September 2020. [Google Scholar]
  41. Mauß, F. Entwicklung Eines Kinetischen Modells der Rußbildung mit Schneller Polymerisation. Ph.D. Thesis, RWTH Aachen University, Aachen, Germany, 1998. [Google Scholar]
  42. Lehtiniemi, H.; Borg, A.; Mauss, F. Combustion Modeling of Diesel Sprays. In SAE Technical Paper Series; SAE 2016 World Congress and Exhibition, APR. 12, 2016; SAE International400 Commonwealth Drive: Warrendale, PA, USA, 2016. [Google Scholar]
  43. Matrisciano, A.; Borg, A.; Perlman, C.; Lehtiniemi, H.; Pasternak, M.; Mauss, F. Soot Source Term Tabulation Strategy for Diesel Engine Simulations with SRM. In SAE Technical Paper Series; 12th International Conference on Engines & Vehicles, SEP. 13, 2015; SAE International400 Commonwealth Drive: Warrendale, PA, USA, 2015. [Google Scholar]
  44. Matrisciano, A.; Franken, T.; Gonzales Mestre, L.C.; Borg, A.; Mauss, F. Development of a Computationally Efficient Tabulated Chemistry Solver for Internal Combustion Engine Optimization Using Stochastic Reactor Models. Appl. Sci. 2020, 10, 8979. [Google Scholar] [CrossRef]
  45. Wang, X. Kinetic Mechanism of Surrogates for Biodiesel. Ph.D. Thesis, BTU Cottbus-Senftenberg, Cottbus, Germany, 2017. [Google Scholar]
  46. dSPACE GmbH. VEOS, “VEOS Manual”. 2020. Available online: https://www.dspace.com/en/inc/home/products/sw/simulation_software/veos.cfm#180_25666 (accessed on 29 November 2021).
  47. ESTECO. modeFRONTIER User Guide 2020R2. 2020. Available online: https://engineering.esteco.com/modefrontier/ (accessed on 19 November 2021).
  48. Franken, T.; Duggan, A.; Matrisciano, A.; Lehtiniemi, H.; Borg, A.; Mauss, F. Multi-Objective Optimization of Fuel Consumption and NO x Emissions with Reliability Analysis Using a Stochastic Reactor Model. In SAE Technical Paper Series; WCX SAE World Congress Experience, APR. 09, 2019; SAE International400 Commonwealth Drive: Warrendale, PA, USA, 2019. [Google Scholar]
  49. Functional Mockup Interface. FMI Specification 2.0.2. github.com/modelica. Available online: https://fmi-standard.org/ (accessed on 11 November 2021).
  50. Blockwitz, T.; Otter, M.; Akesson, J.; Arnold, M.; Clauss, C.; Elmqvist, H.; Friedrich, M.; Junghanns, A.; Mauss, J.; Neumerkel, D.; et al. Functional Mockup Interface 2.0: The Standard for Tool independent Exchange of Simulation Models. In Proceedings of the 9th International MODELICA Conference, Munich, Germany, 3–5 September 2012; Linköping University Electronic Press: Linköping, Sweden, 2012; pp. 173–184. [Google Scholar]
Figure 1. Schematics of the model CI diesel engine.
Energies 15 00261 g001
Figure 2. Schematics of the engine air path sub-components.
Energies 15 00261 g002
Figure 3. Selected (16) operating points depending on engine speed, brake torque, and timeshare in the cumulated dwell time (in %) in the reference RDE cycle for the combustion model calibration.
Energies 15 00261 g003
Figure 4. MiL verification of the engine model compared to test bench measurements for the different TC modeling approaches tested (map-based, Method 1, and Method 2).
Energies 15 00261 g004
Figure 5. Performance and emission results from the three-stage optimization campaign of the 0D SRM.
Energies 15 00261 g005
Figure 6. Verification of the engine model compared to chassis dynamometer measurements with different TC modeling approaches.
Energies 15 00261 g006
Figure 7. Verification of the 0D SRM compared to reference measurements.
Energies 15 00261 g007
Figure 8. Verification of the 0D SRM compared to reference measurements.
Energies 15 00261 g008
Figure 9. Comparison of lambda, CO2 mass flows, and cumulative values between the simulation and reference measurements.
Energies 15 00261 g009
Figure 10. Comparison of the NOx and soot mass flows, as well as cumulative values, between simulation and reference measurements.
Energies 15 00261 g010
Figure 11. Comparison of λ, CO2, NOx, and soot mass flow values between simulation and reference measurements in a zoomed section of the WLTC.
Energies 15 00261 g011
Figure 12. Comparison of the HP-EGR mass flows and deviations between calculated values for the reduced area of the HP-EGR valve and the values from linearization.
Energies 15 00261 g012
Figure 13. Detail of the NOx mass flows between the simulation and reference measurements of the motorway section of an RDE test cycle.
Energies 15 00261 g013
Table 1. Specification of the reference engine.
Displacement2000 cm3
Number of cylinders4
Compression ratio16:1
EGR systemDual HP- and LP-EGR
Turbocharging systemSingle stage VNT 1
Maximum engine power120~130 kW
Maximum engine torque380~450 Nm
Fuel systemCommon rail DI 1800 bar
1 Variable nozzle turbine.
Table 2. Specification of the reference vehicle and transmission.
Vehicle categoryD-segment *
Wheel drive systemRWD 1
Curb weight1500 kg
Nominal peak torque400 Nm (1750–2500 1/min)
Transmission type6 speed transmission (manual)
1 Rear wheel drive; * According to European vehicle categories.
Table 3. Specification of reference fuel.
Density at 25 °C833.4 kg/m3
Lower heating value42.61 MJ/m3
C:H:O 1 ratio14.1:25.9:0.13
FAME 1 content9.8%
CN for CFR 253.1
1 Fatty Acid Methyl Ester; 2 Cetane number according to CFR standard.
Table 4. Modeling approaches for each component with some remarks.
ComponentModeling Approach
Air filter
  • Pressure drop across the air filter as a linear function of the mass flow through the component.
Valves
  • Physics-based valve models describing an isentropic flow through an orifice with a variable cross-section.
  • Cross-section is implemented as a linearized function.
Manifolds
  • Manifold components with physics-based approaches.
  • Equation of the energy conservation with a factor for the estimation of the heat losses over the walls.
  • Ideal gas law for the calculation of the pressure.
Turbocharger
  • Map-based TC without turbine or shaft models.
    Turbine represented by maps for temperatures and pressures.
    Map-based evaluation of quantities over the compressor.
  • Advanced TC with turbine and shaft components for the power balance of the system.
    Semi-physical approach with physics-based equations in combination with map-based corrections.
    Frictions as calibratable in the shaft balance.
    Compressor as map-based component for compression and efficiency evaluation.
Intercooler
  • Components as semi-physical models with map-based efficiency.
Table 5. Input parameters of the turbulence model with optimized values.
Squish factor1
Injection factor0.06178
Mixing time factor14.8477
Friction factor1.5
Axial flow factor0.2
Vortex size factor 17
Vortex size factor 21.64157
Angular momentum1 × 10−7
Table 6. Model input specification with required units.
Injection pressurebar
Fuel densitykg/m3
Engine speed1/min
Liner/piston/head wall temperaturesK
Injections SOI 1 and EOI 2deg
Fuel temperatureK
Start/stop crank-angledeg
Injection massmg/str
Temperature at IVC 3,*K
Pressure at IVC *Pa
Equivalent ratio-
EGR ratio at IVC-
Temperature at EVO *K
Exhaust manifold pressurePa
1 Start of injection; 2 End of injection; 3 Intake valves closing; * At EVO only for the initialization of the simulation, then from the respective manifold.
Table 7. Model output specification with required units.
Pressure at EVObar
Fuel/air/EGR masskg
Fuel/air/EGR mass fractions-
Cylinder pressurebar
Lambda-
IMEPbar
Brake torqueNm
Injection massmg/str
EnthalpyJ
NOx/soot/uHC/CO emissionsmg/s
Q10/Q50/Q90 1deg
1 Degrees of 10, 50 and 90% heat release.
Table 8. Modeling potential for air path models.
AspectImpact on Accuracy
Valve linearization
  • Accuracy reduction in mass flows for TC, EGR models.
Usage of Coolant temperature
  • Corrections required for cold engine applications in crucial air path subcomponents.
Emission modeling
  • Corrections based on coolant temperature, dynamic influences, physical parameters.
Cylinder filling
  • Volumetric efficiency influenced by multiple effects (e.g., temperatures).
Manifolds
  • Sensor modeling for temperatures.
  • Possible reproduction of gas/sensor dynamics.
  • Impact of EGR on temperatures and fresh gas junction.
Intercooler
  • Impact of low circuit coolant and impact from actuation of water pump on temperatures.
Turbocharger
  • Compartment modeling for temperature prediction after turbine.
  • Optimization of inter/extrapolation capabilities.
Publisher’s Note: MDPI stays neutral with regard to jurisdictional claims in published maps and institutional affiliations.

