
Field Performance of South-Facing and East-West Facing Bifacial Modules in the Arctic


1
Alaska Center for Energy and Power, University of Alaska Fairbanks, Fairbanks, AK 99775, USA
2
Sandia National Laboratories, Albuquerque, NM 87185, USA
*
Author to whom correspondence should be addressed.
Energies 2021, 14(4), 1210; https://0-doi-org.brum.beds.ac.uk/10.3390/en14041210
Submission received: 12 January 2021
/
Revised: 12 February 2021
/
Accepted: 18 February 2021
/
Published: 23 February 2021
(This article belongs to the Special Issue Increasing the Lifetime of Photovoltaics Systems: Advanced Materials, Monitoring, O&M and Energy Modeling)
Abstract
:This paper presents the first systematic comparison between south-facing monofacial and bifacial photovoltaic (PV) modules, as well as between south-facing bifacial and vertical east-west facing bifacial PV modules in Alaska. The state’s solar industry, driven by the high price of energy and dropping equipment costs, is quickly growing. The challenges posed by extreme sun angles in Alaska’s northern regions also present opportunities for unique system designs. Annual bifacial gains of 21% were observed between side by side south-facing monofacial and bifacial modules. Vertical east-west bifacial modules had virtually the same annual production as south-facing latitude tilt bifacial modules, but with different energy production profiles.
1. Introduction
Despite Alaska’s northern location and lower solar insolation values compared to more temperate areas, there is a growing solar industry in the state. The steep drop in prices for solar photovoltaic (PV) modules and other components coupled with the high cost of energy has led to increased utilization of the technology [1]. Alaska’s high latitude with the majority of its land mass north of 60°, combined with extended periods of reflective ground snow cover, can potentially serve as an advantage for bifacial and other emerging PV technologies, especially in non-standard configurations [2].
Bifacial PV cells were first patented in the 1960s [3] but were slow to catch on in the market [4]. More recently, with the evolution of PV cells away from Al-BSF to designs with open rear-side metalization patterns such as PERC, PERT, and heterojunction technologies, bifacial PV cells and modules have become commonplace [5]. The ITTRPV [6] notes that, as of 2020, bifacial PV cells accounted for about 20% of the total world PV cell market and that, by 2030, are expected to increase to 70%.
A recent study by Rodríguez-Gallegos et al. [7] found that for most parts of the world the lowest levelized cost of energy (LCOE) is for bifacial modules on single axis trackers, but that for high latitude regions the bifacial PV on two axis trackers resulted in the lowest LCOE. Burnham et al. [8] reported very high bifacial gains from a two-axis tracker in Vermont during the winter due to the high albedo effects of snow. It has also been recognized that the vertical east-west (E-W) oriented bifacial PV has many potential advantages in high latitude regions [9,10]. These advantages include the ability to take advantage of relatively low sun elevations and a wide range of solar azimuth angles in the summer, optimal orientation for harvesting reflected light from snow covered ground, and less impact from snow covering the arrays. In addition, the vertical arrays result in energy output patterns that may better match load profiles [11].
Bifacial PV modules are decreasing the LCOE relative to monofacial PV modules in solar PV arrays around the world [7,12], and the benefits could be even greater in Alaska due to high ground albedos and extreme azimuth angles during the polar summer [13]. To date, there is only one commercial bifacial array in the state, located in Kotzebue on the Bering Sea Coast just north of the Arctic Circle, at 66° N. Its commissioning coincides with the writing of this paper [14].
A barrier to increased bifacial deployment and investment is the lack of research and model validation of various system designs in northern environments [15]. Recent research indicates that bifacial modules can potentially increase the system yield by 20–30% over monofacial modules [16,17,18], especially for small systems with lots of open space around the perimeter [19]. Bifacial PV modeling has demonstrated that bifacial modules oriented vertically facing east and west can outperform monofacial modules facing south at the latitude tilt [2,11].
To better understand the performance gain of bifacial modules over monofacial modules, the Alaska Center for Energy and Power (ACEP) at the University of Alaska Fairbanks partnered with Sandia National Laboratories to construct a northern solar test site with the following objectives:
- Obtain field performance data for PV modules sighted at multiple orientations.
- Compare the performance of south-facing bifacial PV modules with monofacial PV modules.
- Validate new bifacial performance models at latitudes north of 60°.
These outcomes will help inform further research, as well as upcoming commercial deployments of solar PV technology in Alaska and other high latitude regions.
2. Field Testing
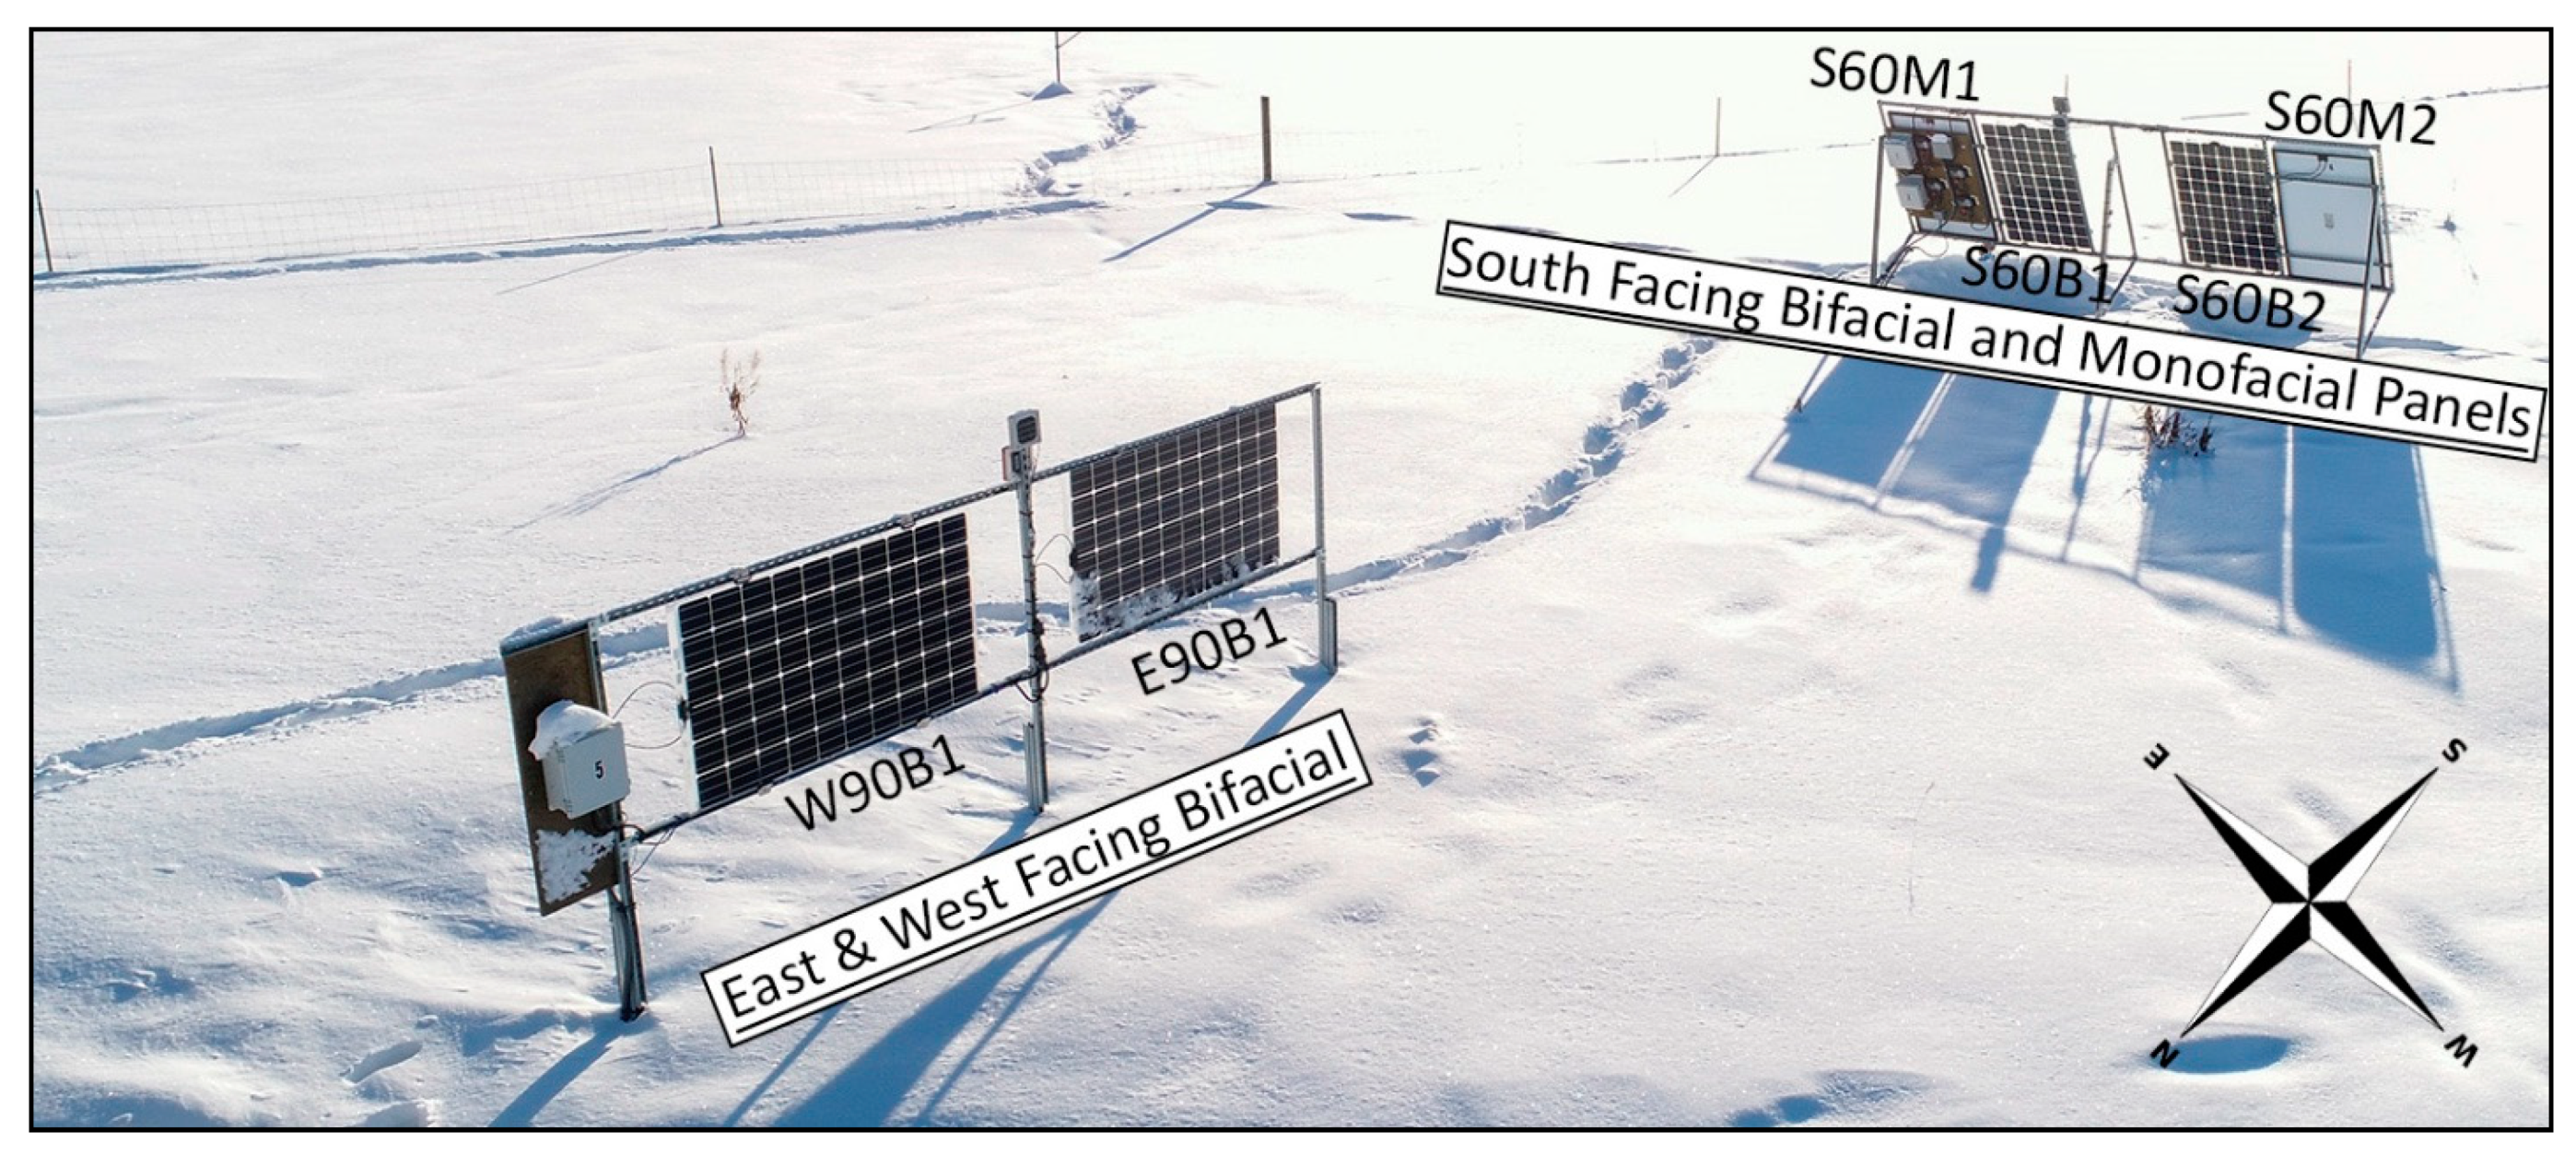
ACEP has constructed a test site on the University Alaska Fairbanks campus at 64° N that includes six solar PV modules. Two bifacial modules are oriented vertically in an east-west facing orientation. Of these, one module has the front side facing east, while the front side of the other module faces west. These modules are referred to here as E90B1 and W90B1, respectively. Four modules (two bifacial and two monofacial) face south at a 60° tilt, as shown in Figure 1. The south-facing bifacial modules are referred to as S60B1 and S60B2, while the south-facing monofacial modules are referred to as S60M1 and S60M2. All bifacial modules are Sunpreme Maxima GxB-310, and all monofacial modules are Suniva OPT270-60-4-1B0. The factory specifications are shown in Table 1.
All modules are grid connected using Enphase IQ6+ micro inverters, and the AC power is measured using Shark 200 energy meters connected to a Campbell Scientific data logger.
Global horizontal irradiance, diffuse horizontal irradiance, and global normal irradiance are measured at the site using Hukseflux SR-30-D1 secondary standard pyranometers. The direct normal irradiance is measured using a Hukseflux DR01 first class pyrheliometer. The front and rear plane of array irradiance are collected using reference cells. Albedo data are collected with a Hukseflux SRA-20 secondary standard albedometer. All irradiance data and power production data are collected at 1-min intervals.
Multiple studies have verified that small bifacial arrays with lower ground coverage ratios have larger bifacial gains than larger utility scale installations [20,21]. While the authors acknowledge this reality, both the northern latitude of this site, as well as the comparison of south-facing and vertical east-west bifacial PV module orientations make this small site an important tool for informing northern PV research and model validation.
2.1. Flash Testing and Assumptions of Pmp
The PV modules at the test site were flash tested at Sandia National Laboratories before they were deployed in Fairbanks. The flash testing maximum power (Pmp) values are shown in Table 2. The testing at Sandia showed that the Pmp values for each module were below the rated values. For the Suniva monofacial modules, it appears that the modules were over-rated. The Sunpreme bifacial modules were early bifacial modules that were released before the current bifacial test standard [8]. The Sunpreme factory ratings were acquired by flash testing the front of the module using standard test conditions (STC), while placing a white reflective sheet a few inches behind the module to obtain the rated value of 310 Watts. The fronts and backs of the bifacial modules were flash tested at Sandia under STC, while covering the opposite side of the module with a black cloth, a practice consistent with the current International Electrotechnical Commission (IEC) standard [22]. The front side flash test results are reported here as Pmp, while the back side Pmp divided by the front side Pmp was used to determine a bifaciality factor of 94% in all the bifacial modules used in this study. The Sandia flash tester had an approximate uncertainty of 5% based on round robin comparisons (Josh Stein, Distinguished Member of Technical Staff at Sandia National Laboratories, Personal communication).
2.2. Environmental Conditions
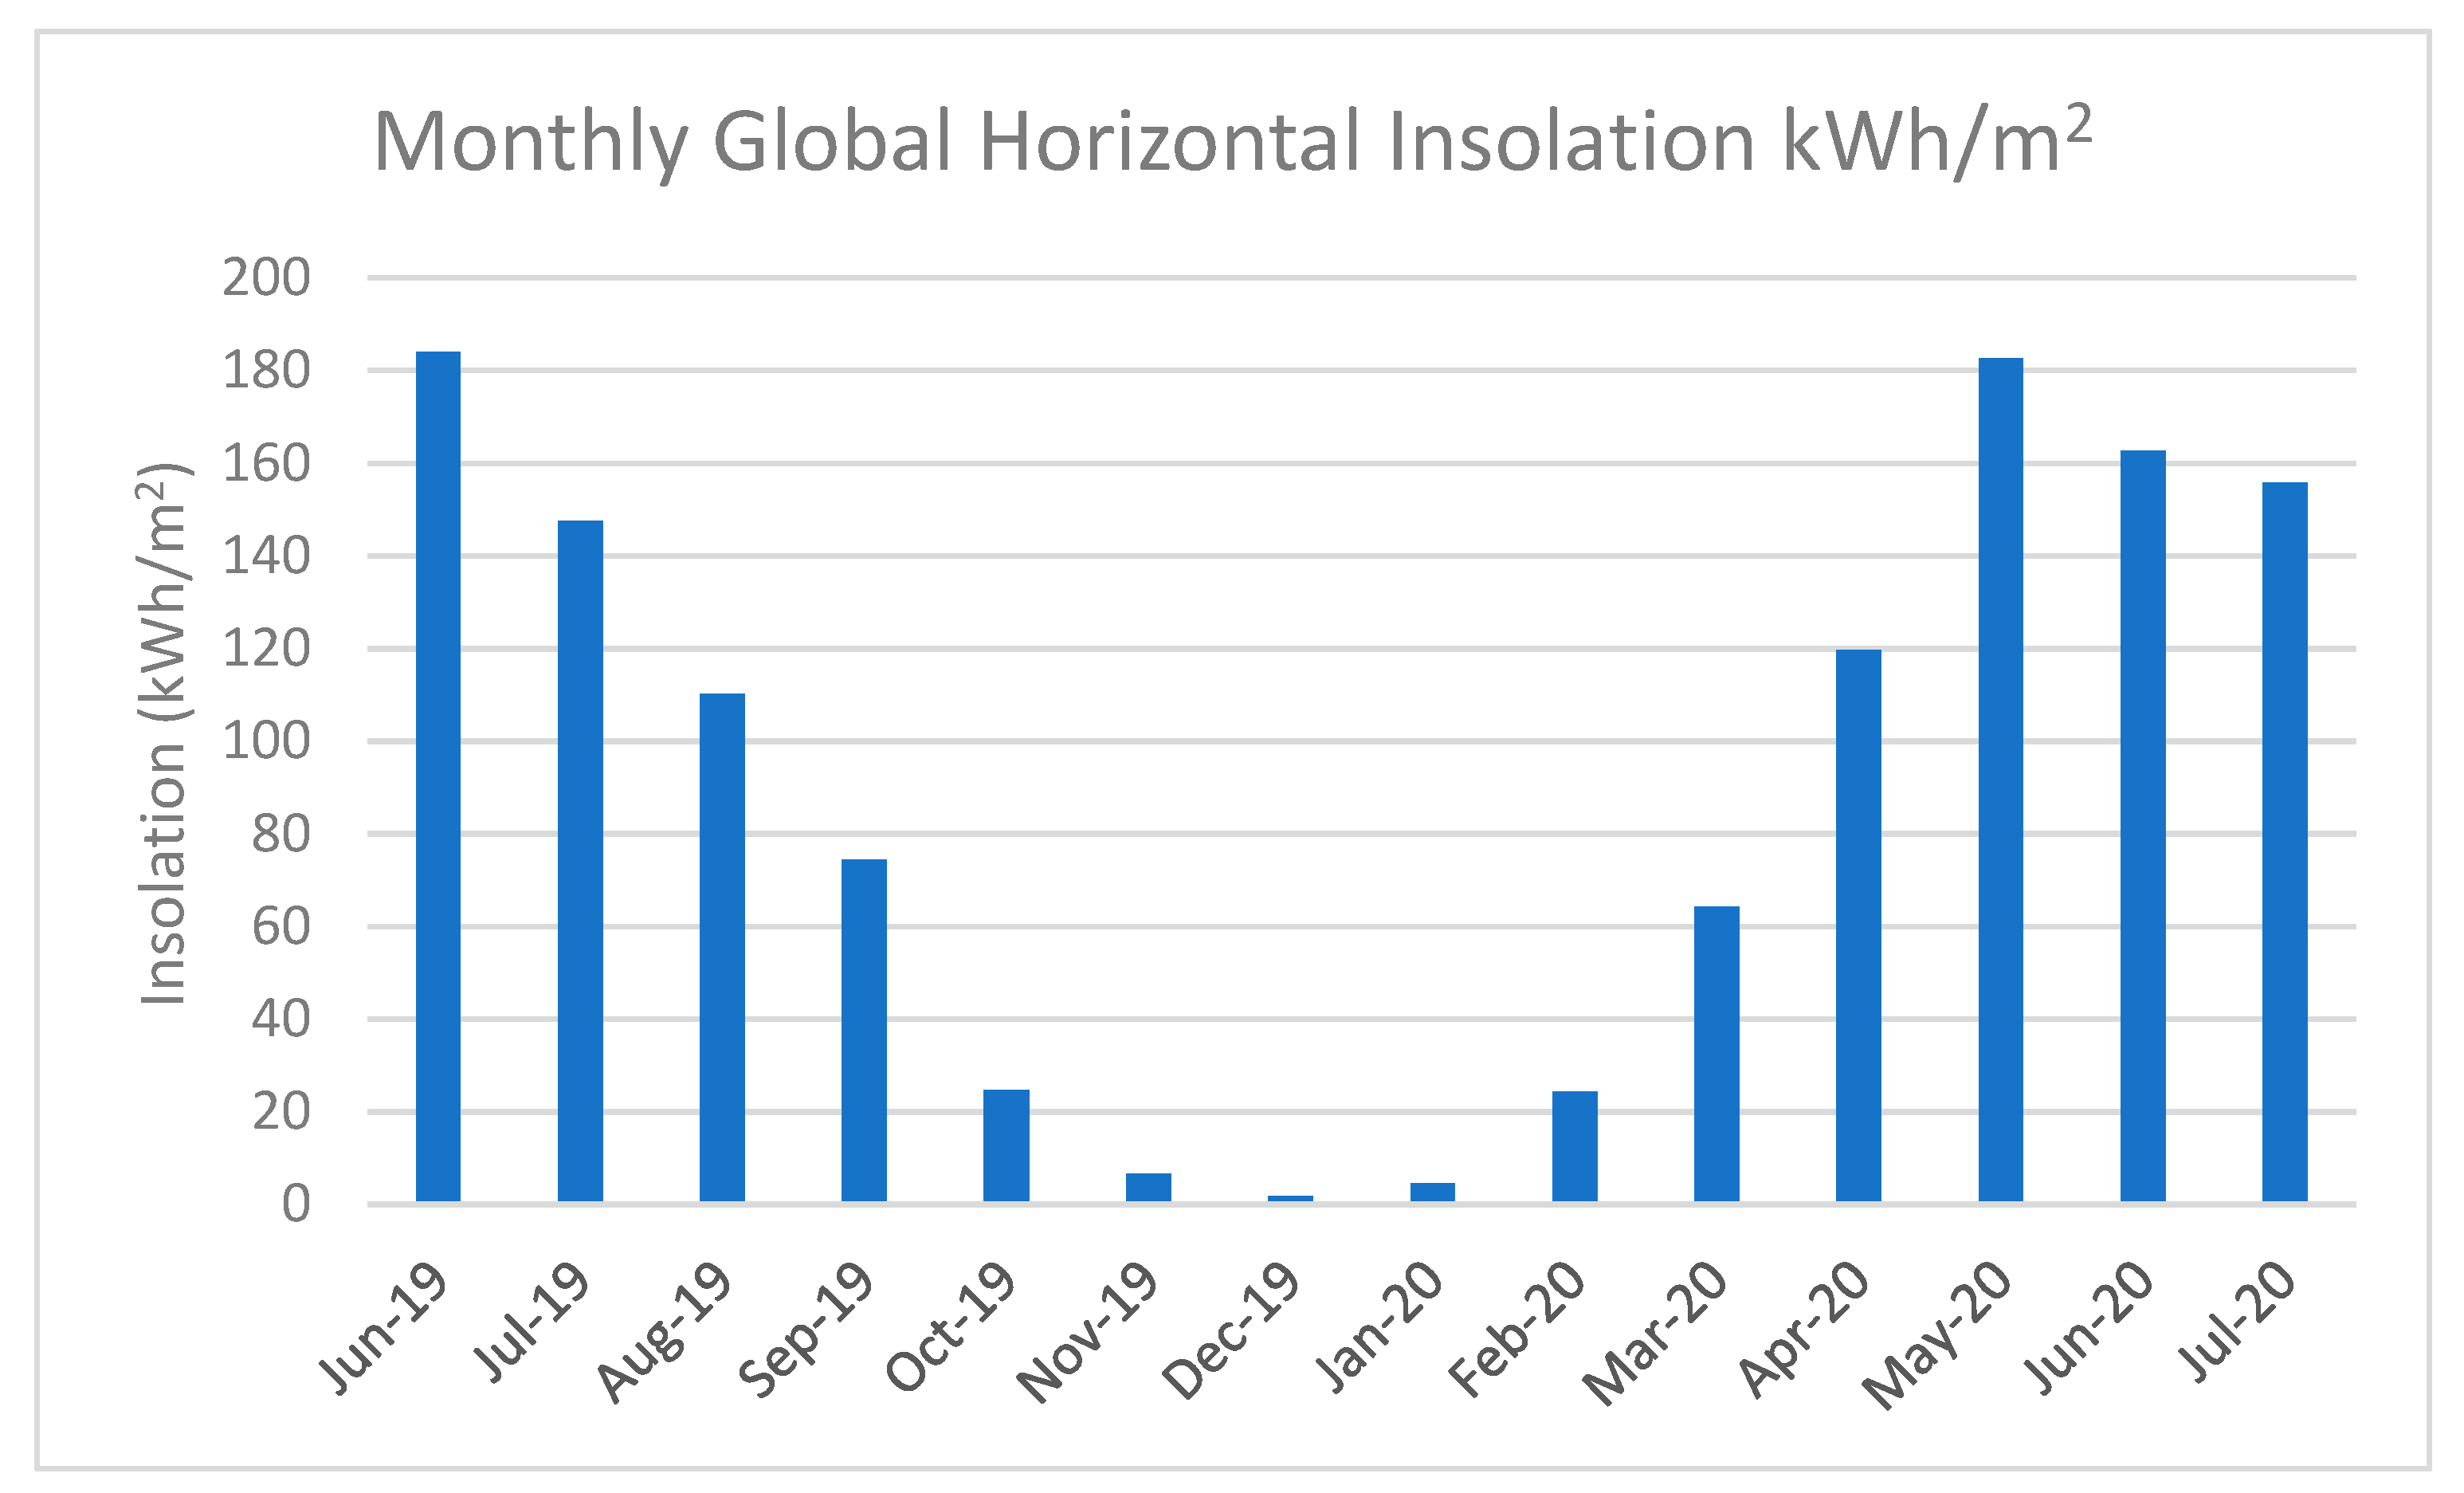
Fairbanks lies at 64° N in the interior region of Alaska. It has a subarctic climate with extremely cold winters and short, warm summers. During the study period, a minimum temperature of −37.9 °C and a maximum temperature of 30.9 °C were observed. Figure 2 shows the global horizontal insolation measured at the site during the study period.
2.3. Inverter Clipping
The Enphase IQ6+ microinverters at the test site have a maximum power output of 290 W, which was verified during testing. Clipping of the modules did occur, primarily in the springtime with the south-facing bifacial modules. Details on the total number of minutes and days when clipping occurred are presented in Table 3. More analysis of the clipping events is presented later in the paper.
2.4. Missing and Errant Data Filtering
During the 13 months of data collection described in this report, both the south-facing and the vertical east-west facing arrays functioned as designed, and performance data were collected. However, there were three instances when data were either not reliable or known to be inaccurate. Data from these periods were not included in the comparative analysis. These known issues are described below.
No clearing of snow from the PV modules occurred at the testing site. While this is an accurate scenario for real world performance testing, it also introduces uncertainty when comparing the performance of two different types of PV modules that have different snow shedding characteristics.
- To compare the south-facing bifacial and south-facing monofacial panels when the output was not affected by snow, data from days when energy production did not reach a minimum threshold for each module (20 Wh) were removed. This level of production was chosen based on observations from the data to separate low production due to the snow coverage from low production caused by the cloud cover, etc. Based on this methodology, data between 1 November 2019 and 14 March 2020 were filtered out for the south bifacial gain analysis. Using the Fairbanks typical meteorological year version 3 (TMY3) data set analyzed with the PV Watts transposition model, these 135 days represented 37% of the year, but only 14% of the annual 60° plane-of-array (POA) irradiance.
- In order to compare the vertical bifacial and south-facing bifacial production, at least one vertical bifacial module and one south-facing bifacial module must have production. The same methodology described above was used, and data between 19 November 2019 and 13 January 2020 were excluded from the vertical bifacial and south-facing bifacial comparison. This period represented 15% of the year and 2% of the annual 60° POA irradiance according to Fairbanks TMY3 data.
- A failed wiring connection caused by ground heaving led to the loss of data between 13 June and 1 July 2020. Data from this period were removed from all analyses.
3. Analysis Methods
The analysis compares south-facing bifacial solar PV module performance to the performance of equivalent south-facing monofacial modules, as well as vertically oriented east-west facing bifacial modules using several approaches.
3.1. Normalized Monthly Energy
Since the analysis presented here compares the output of different models of PV modules with different Pmp ratings, results are often presented as normalized monthly energy calculated as:
where the numerator is the sum of the energy that a module produces in a month and the denominator is the front side power ratings of the same module measured with a flash tester, as shown in Table 2.
3.2. South-Facing Performance and Bifacial Gain
To compare south-facing monofacial and bifacial modules with each other, the monthly integrated bifacial gain in energy was calculated using the method from Stein et al. [16]:
where NMES60B1, NMES60B2, NMES60M1, and NMES60M2 are the normalized monthly energy values of each PV module calculated using Equation (1).
3.3. Bifacial Irradiance
For the clipping analysis and the analysis of bifacial gain, the total bifacial irradiance was calculated, given as Etotal, using the method from Waters et al. [23]. This method incorporates the sum of irradiance striking the front of the module, as well as the irradiance striking the rear of the module derated by the bifaciality factor, as shown in the following equation:
where EPOA is the measured front side irradiance, Erear is the measured back side irradiance, and is the module bifaciality factor. Since this methodology incorporated the irradiance striking both the front and back side of the module into a single number, it effectively incorporates albedo and extreme sun angles.
The rear fraction of the monthly total solar energy available for conversion to electricity is used in the analysis of bifacial gain. It is given as Qrear fraction and calculated using the following equation:
where Qrear is the measured backside insolation and QPOA is the measured front side insolation.
3.4. Vertical East-West and South-Facing Bifacial Comparison
This paper compares the monthly normalized energy production of the south-facing bifacial PV modules and the vertical east-west facing bifacial modules. The vertical bifacial module gain over the south-facing bifacial modules was calculated as:
where is the vertical bifacial energy gain, NMEE90B1, NMEW90B1, NMES60B1, and NMES60B2 are the normalized monthly energy values of each PV module calculated using Equation (1).
4. Results
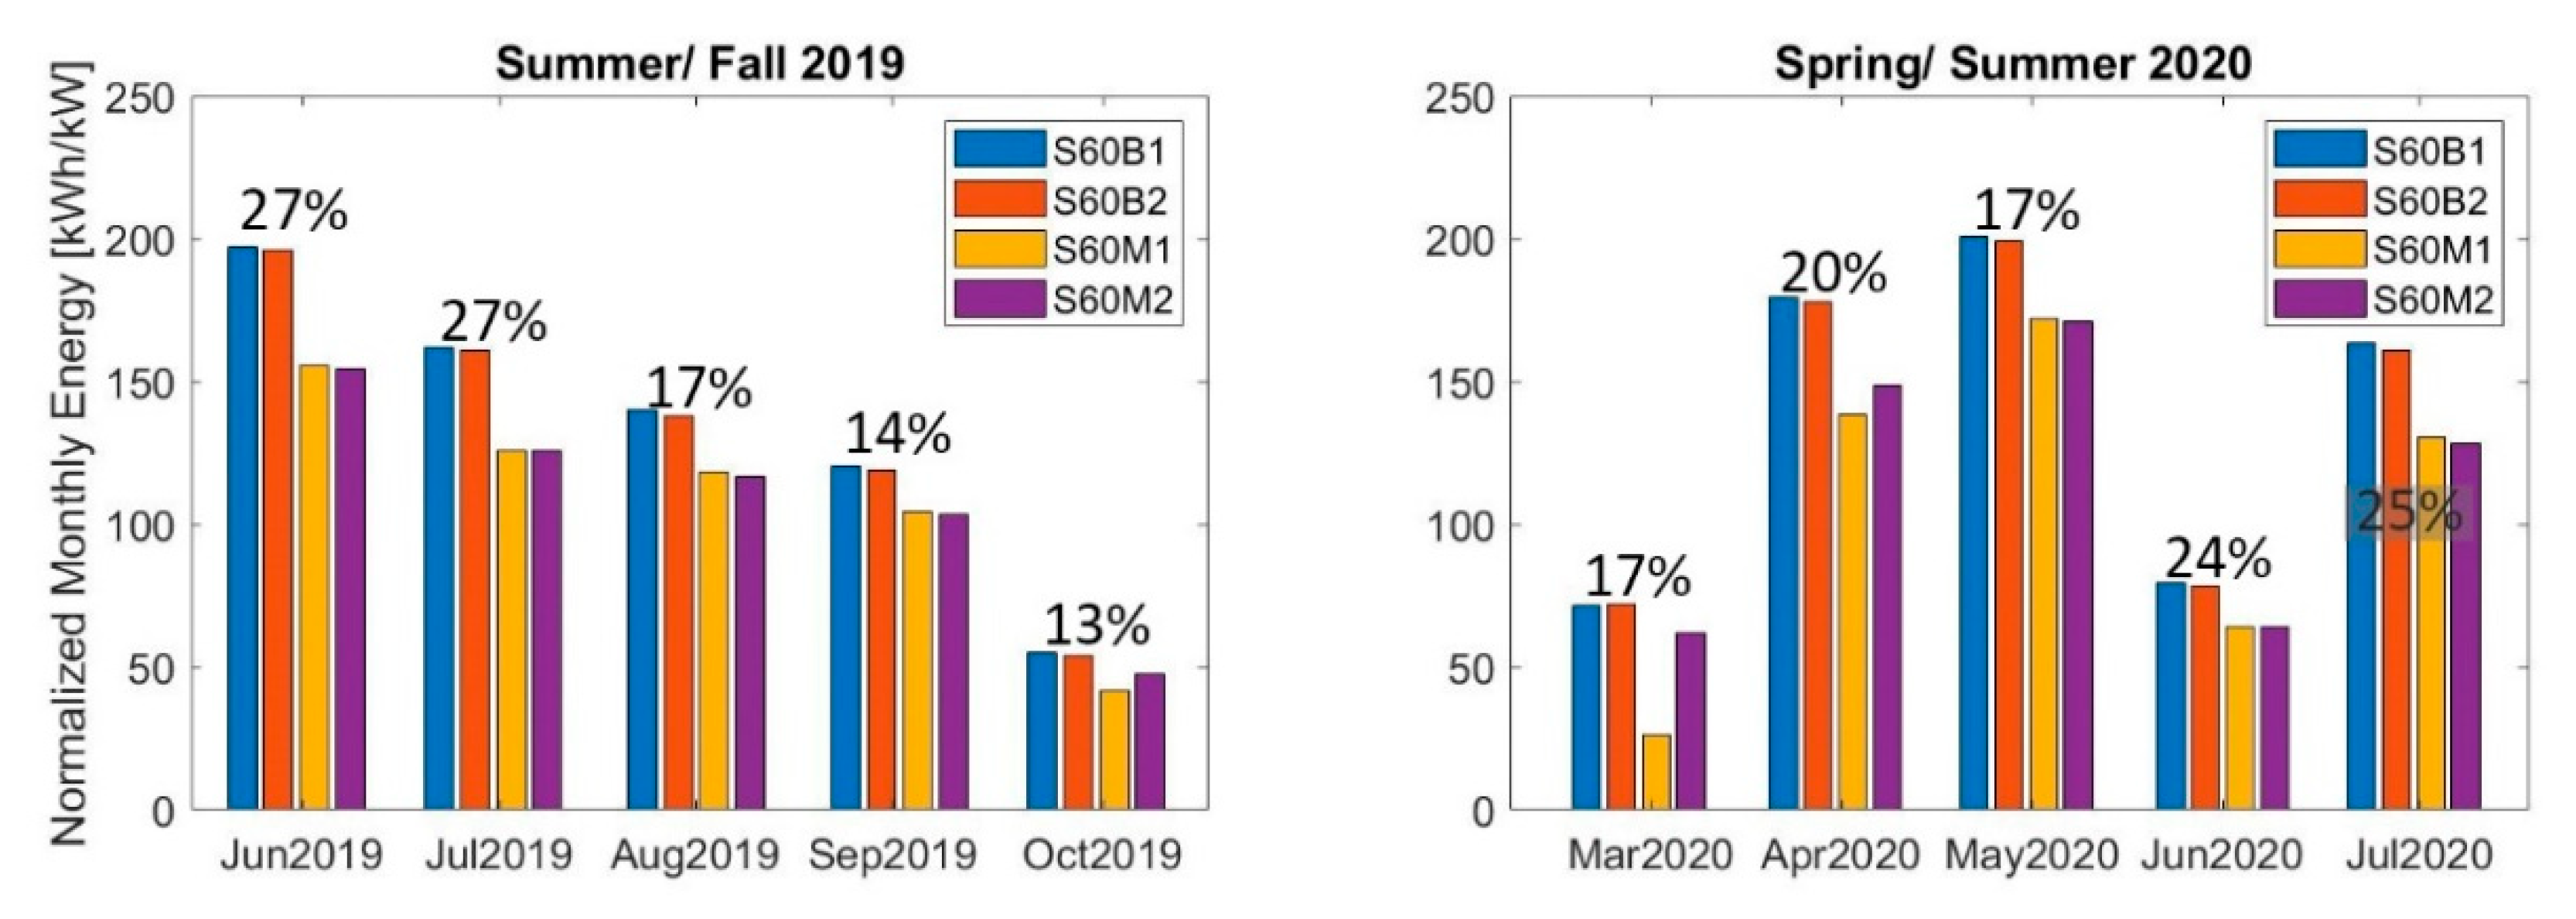
The data show that the bifacial gain of the south-facing modules was highest in the summer months followed by the spring months. Figure 3 shows the monthly normalized energy production of the south-facing modules and the bifacial gain calculated using Equations (1) and (2), respectively. The annotation above each month is the average of the bifacial gain for both sets of modules with the exception of October 2019, March 2020, and April 2020 when the energy production in module S60M1 was hampered by what is believed to be an issue with the inverter power point tracking. During these months, the bifacial gains using S60B2 and S60M2 are reported.
The results show a bifacial gain from the entire data set of 21%. The low energy production in June 2020 was the result of an equipment failure that caused 19 days of lost production.
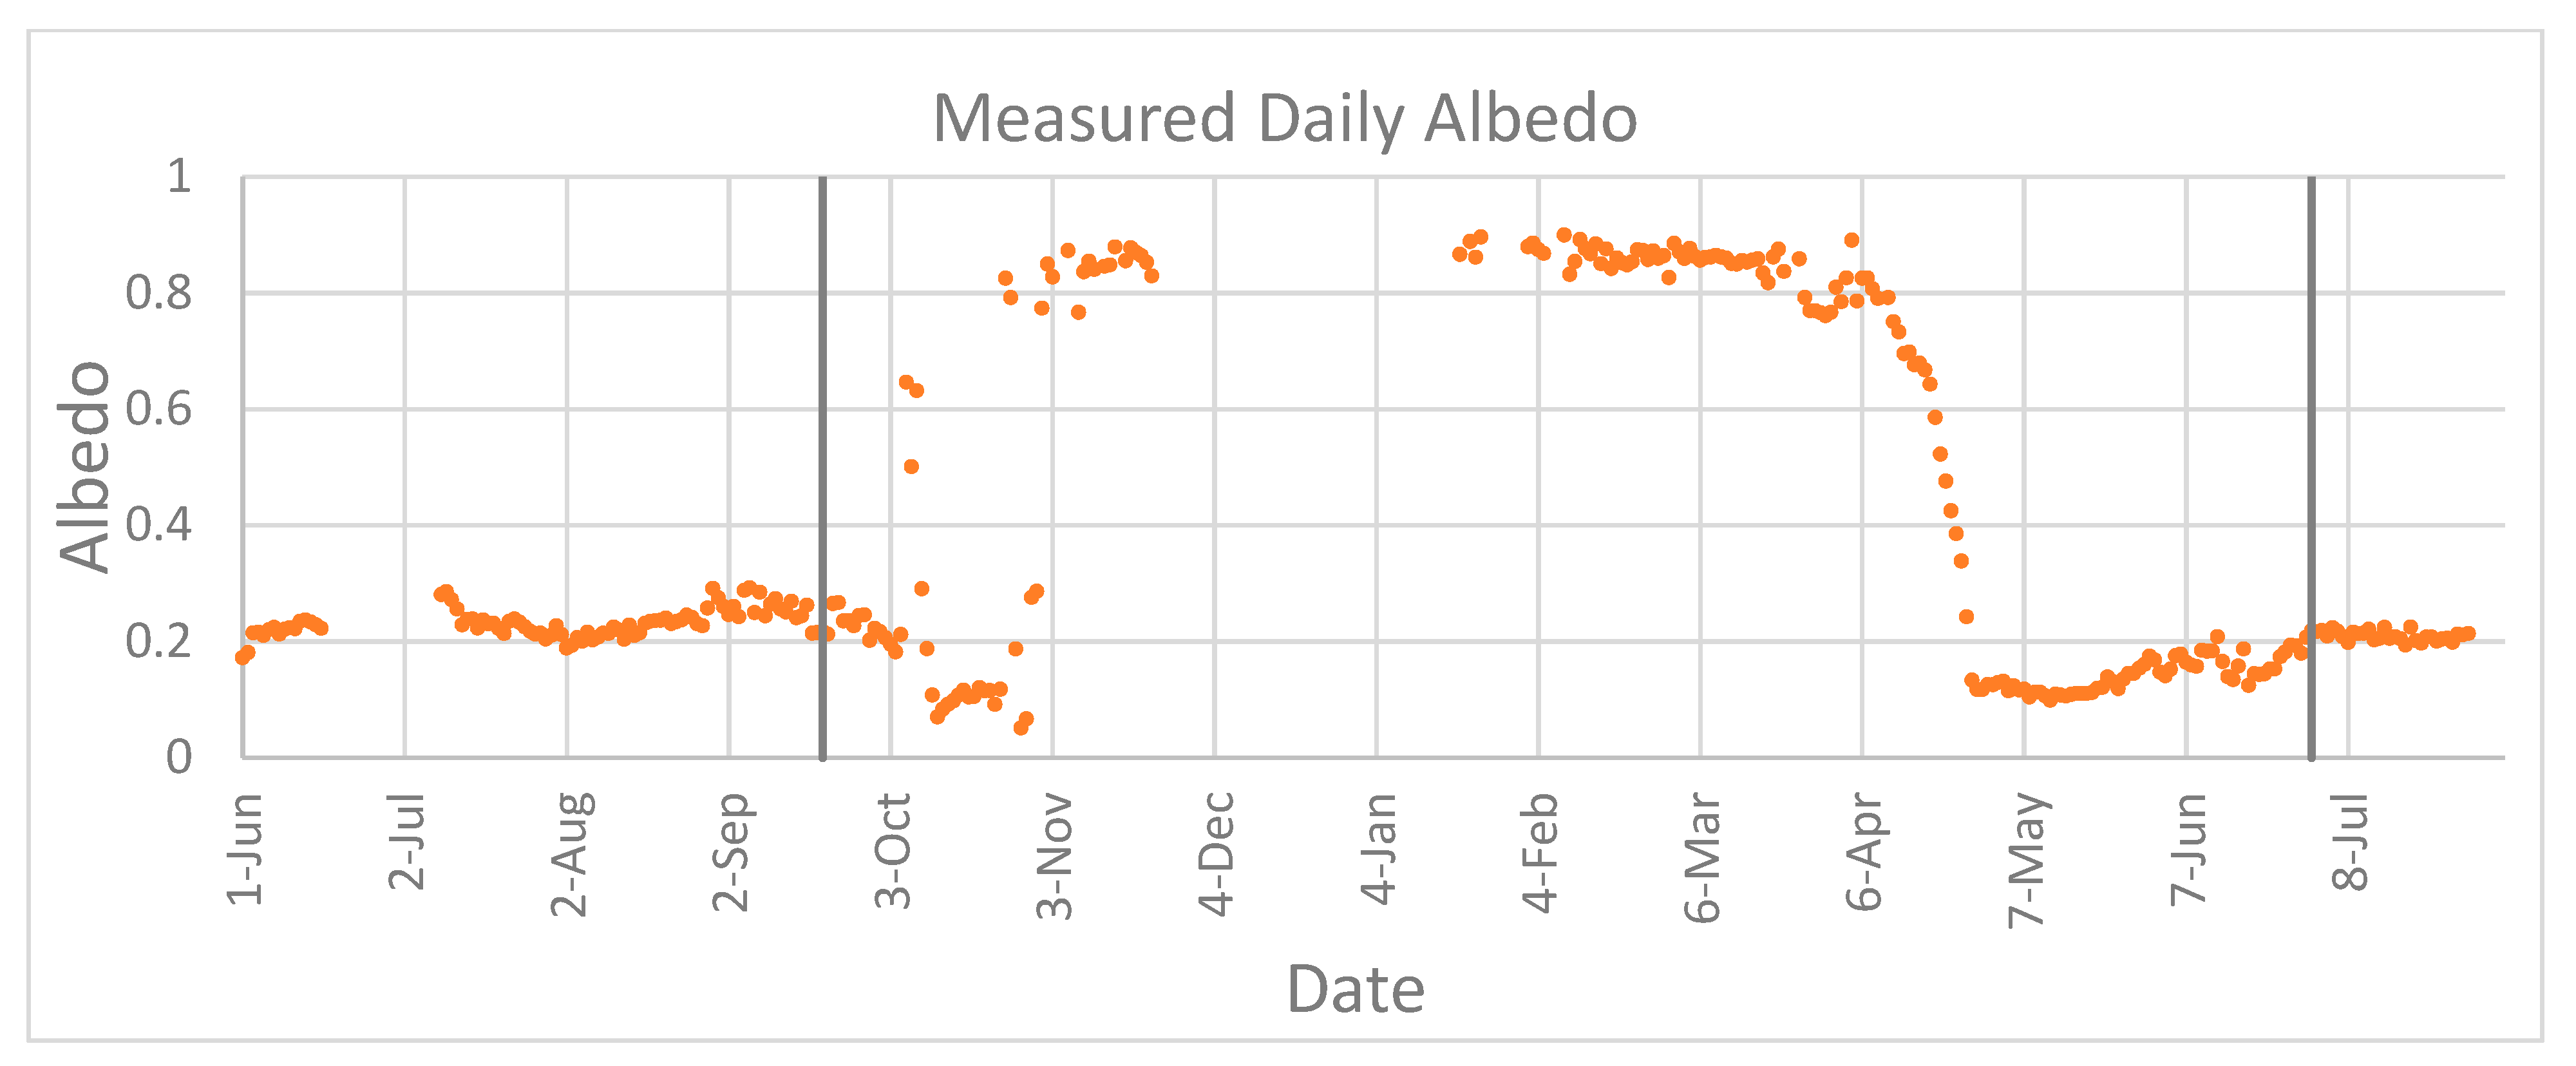
Bifacial gain has been shown to be related to the ground albedo [16,24]. Figure 4 shows the daily average albedo calculated using data when the sun elevation was greater than 5° above the horizon. Albedo ranged from 0.1 in early May and October when the vegetation was brown and there was no snow cover, to between 0.8 and 0.9 in the winter and spring months when the ground was covered with snow. There was a data gap between mid-November and mid-January when the solar elevation was below 5°. However, the shape of the data and the known Fairbanks weather patterns would suggest that the albedo during this period stayed between 0.8 and 0.9.
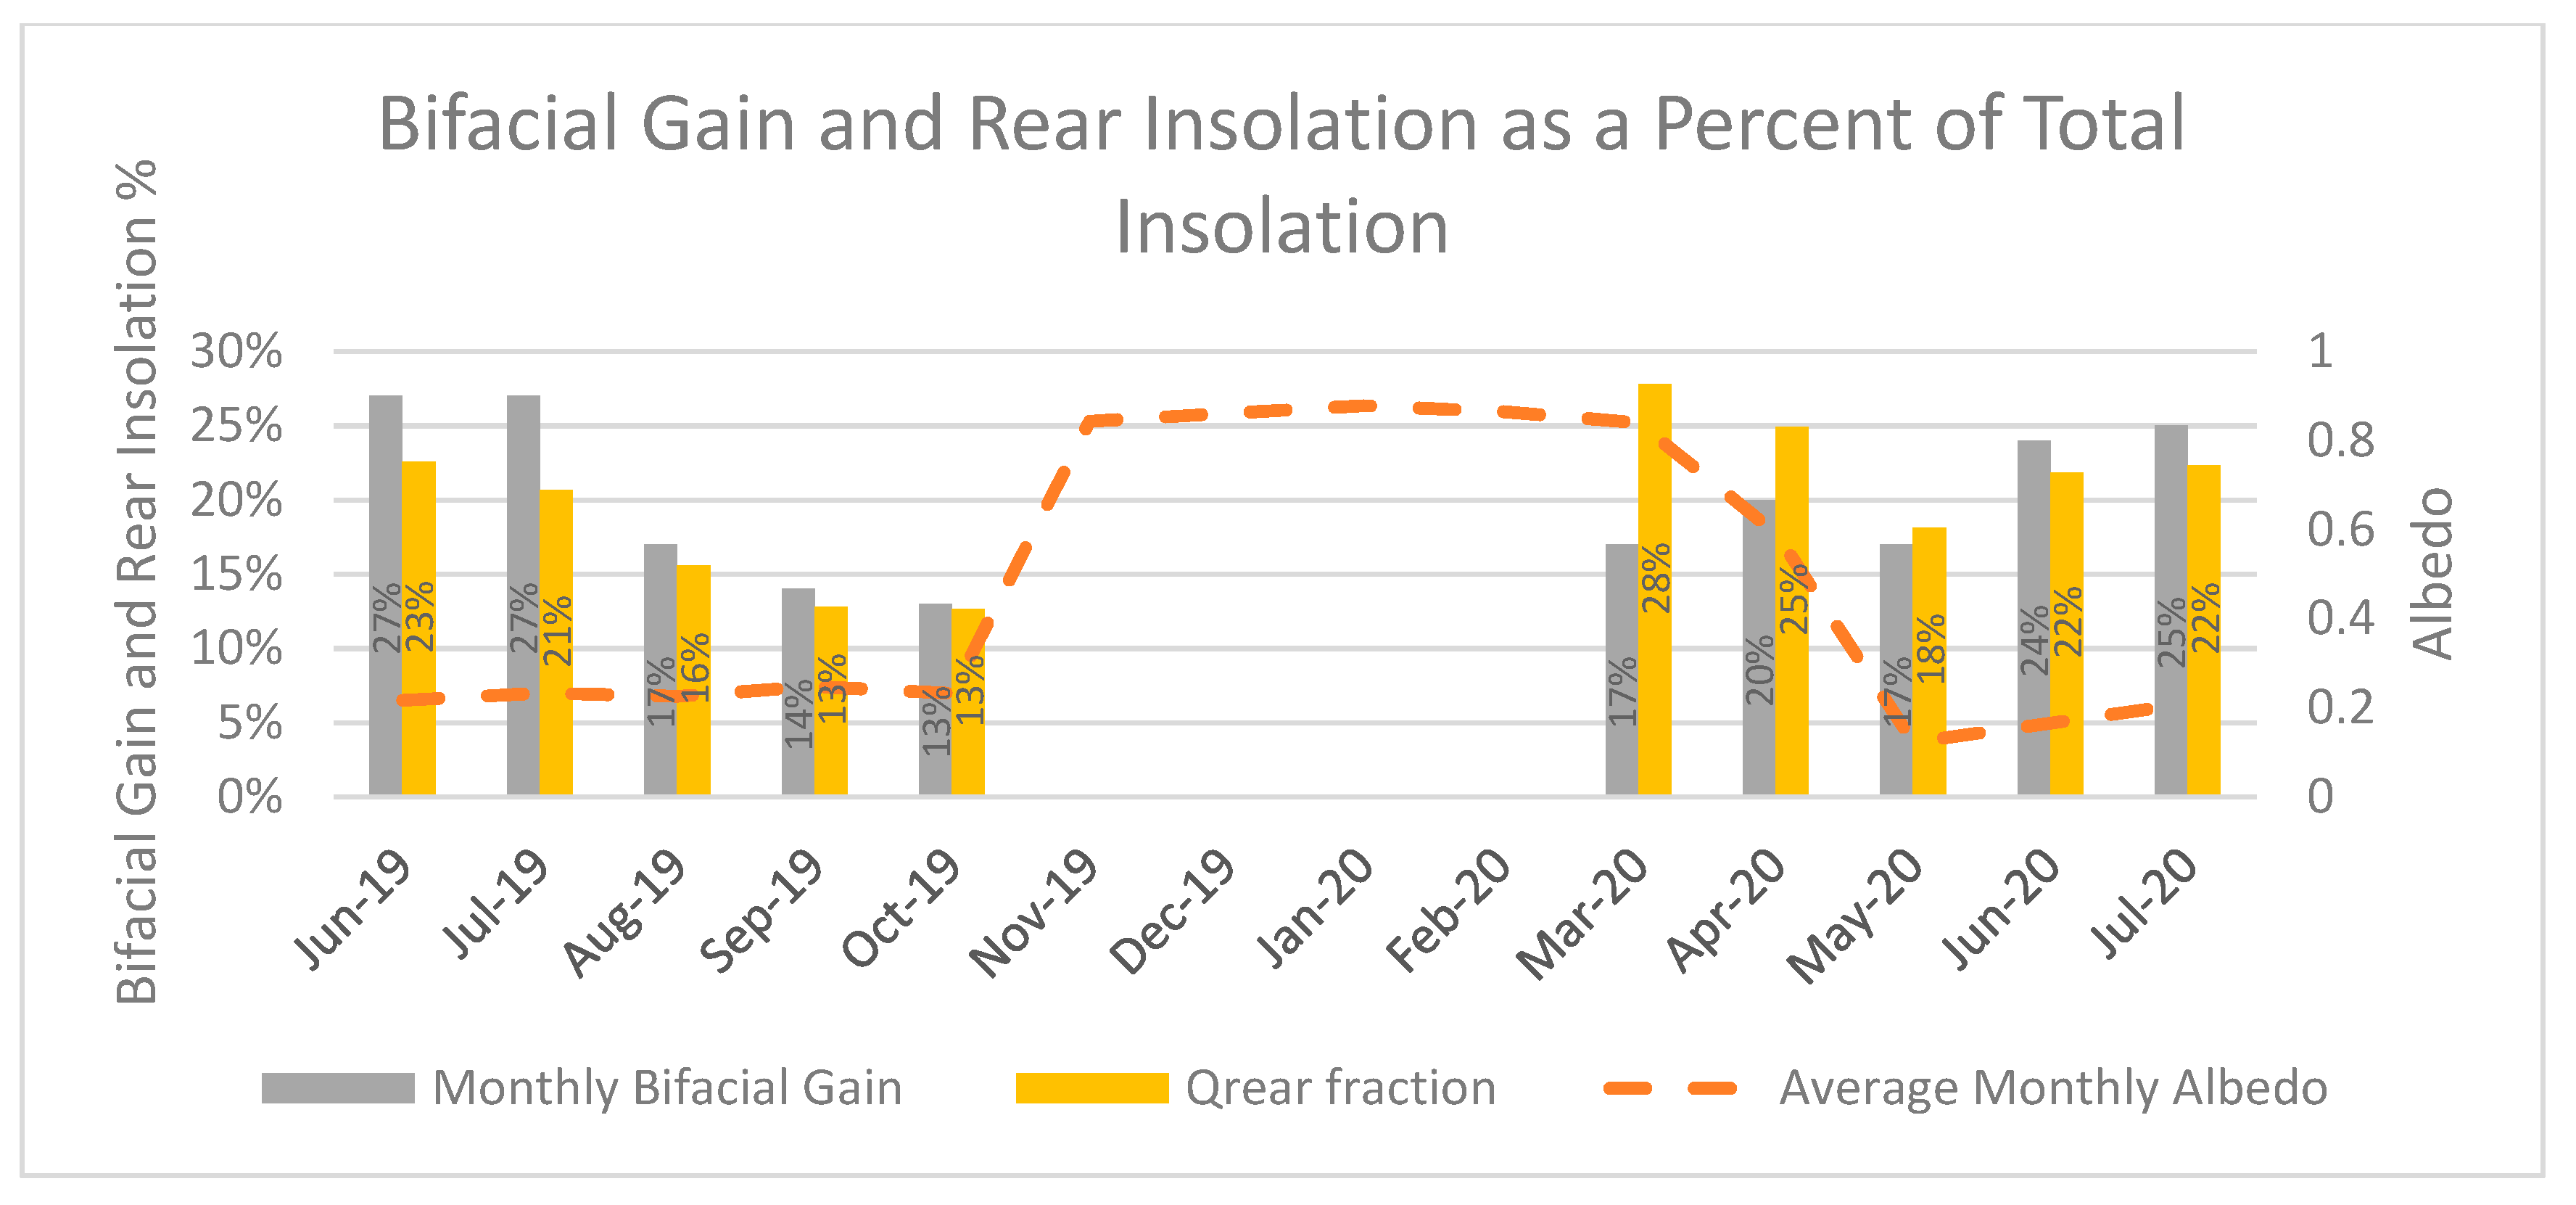
Figure 5 shows the measured bifacial gain from Figure 3, along with the albedo and rear fraction of the total monthly solar energy (Qrear fraction) calculated using Equation (4).
The figure shows that in March and April the rear insolation fraction was higher than the other months shown in the graph, which corresponded to the highest average albedo. June and July consistently had the highest bifacial gains despite the low albedo. This was likely due to the several factors described below.
The temperature coefficient is likely responsible for the high rear insolation percent yet lower bifacial gains in March and April compared to the summer months. The bifacial modules described in the paper have a temperature coefficient power of −28%/°C, while the monofacial modules have a temperature coefficient of −42%/°C. This difference causes the monofacial modules to perform better relative to the bifacial in cold temperatures and worse than the bifacial modules in warmer temperatures. This seems to explain the lower bifacial gains in March and April relative to June and July, despite the high rear insolation fraction.
It is also important to note that March and September have the same sun paths, but March had a higher rear insolation fraction and bifacial gain primarily due to the higher albedo. The same was true with April and August. This trend was independent of total monthly insolation as Figure 2 shows that September had more insolation than March and April had more than August.
4.1. Inverter Clipping
The Enphase IQ6+ microinverters at the test site have a maximum power output of 290 W, which was verified during testing. Clipping of all the modules did occur, with the vast majority of clipping events experienced in the springtime by the south-facing bifacial modules. Details on the total number of minutes when clipping occurred are presented in Table 3.
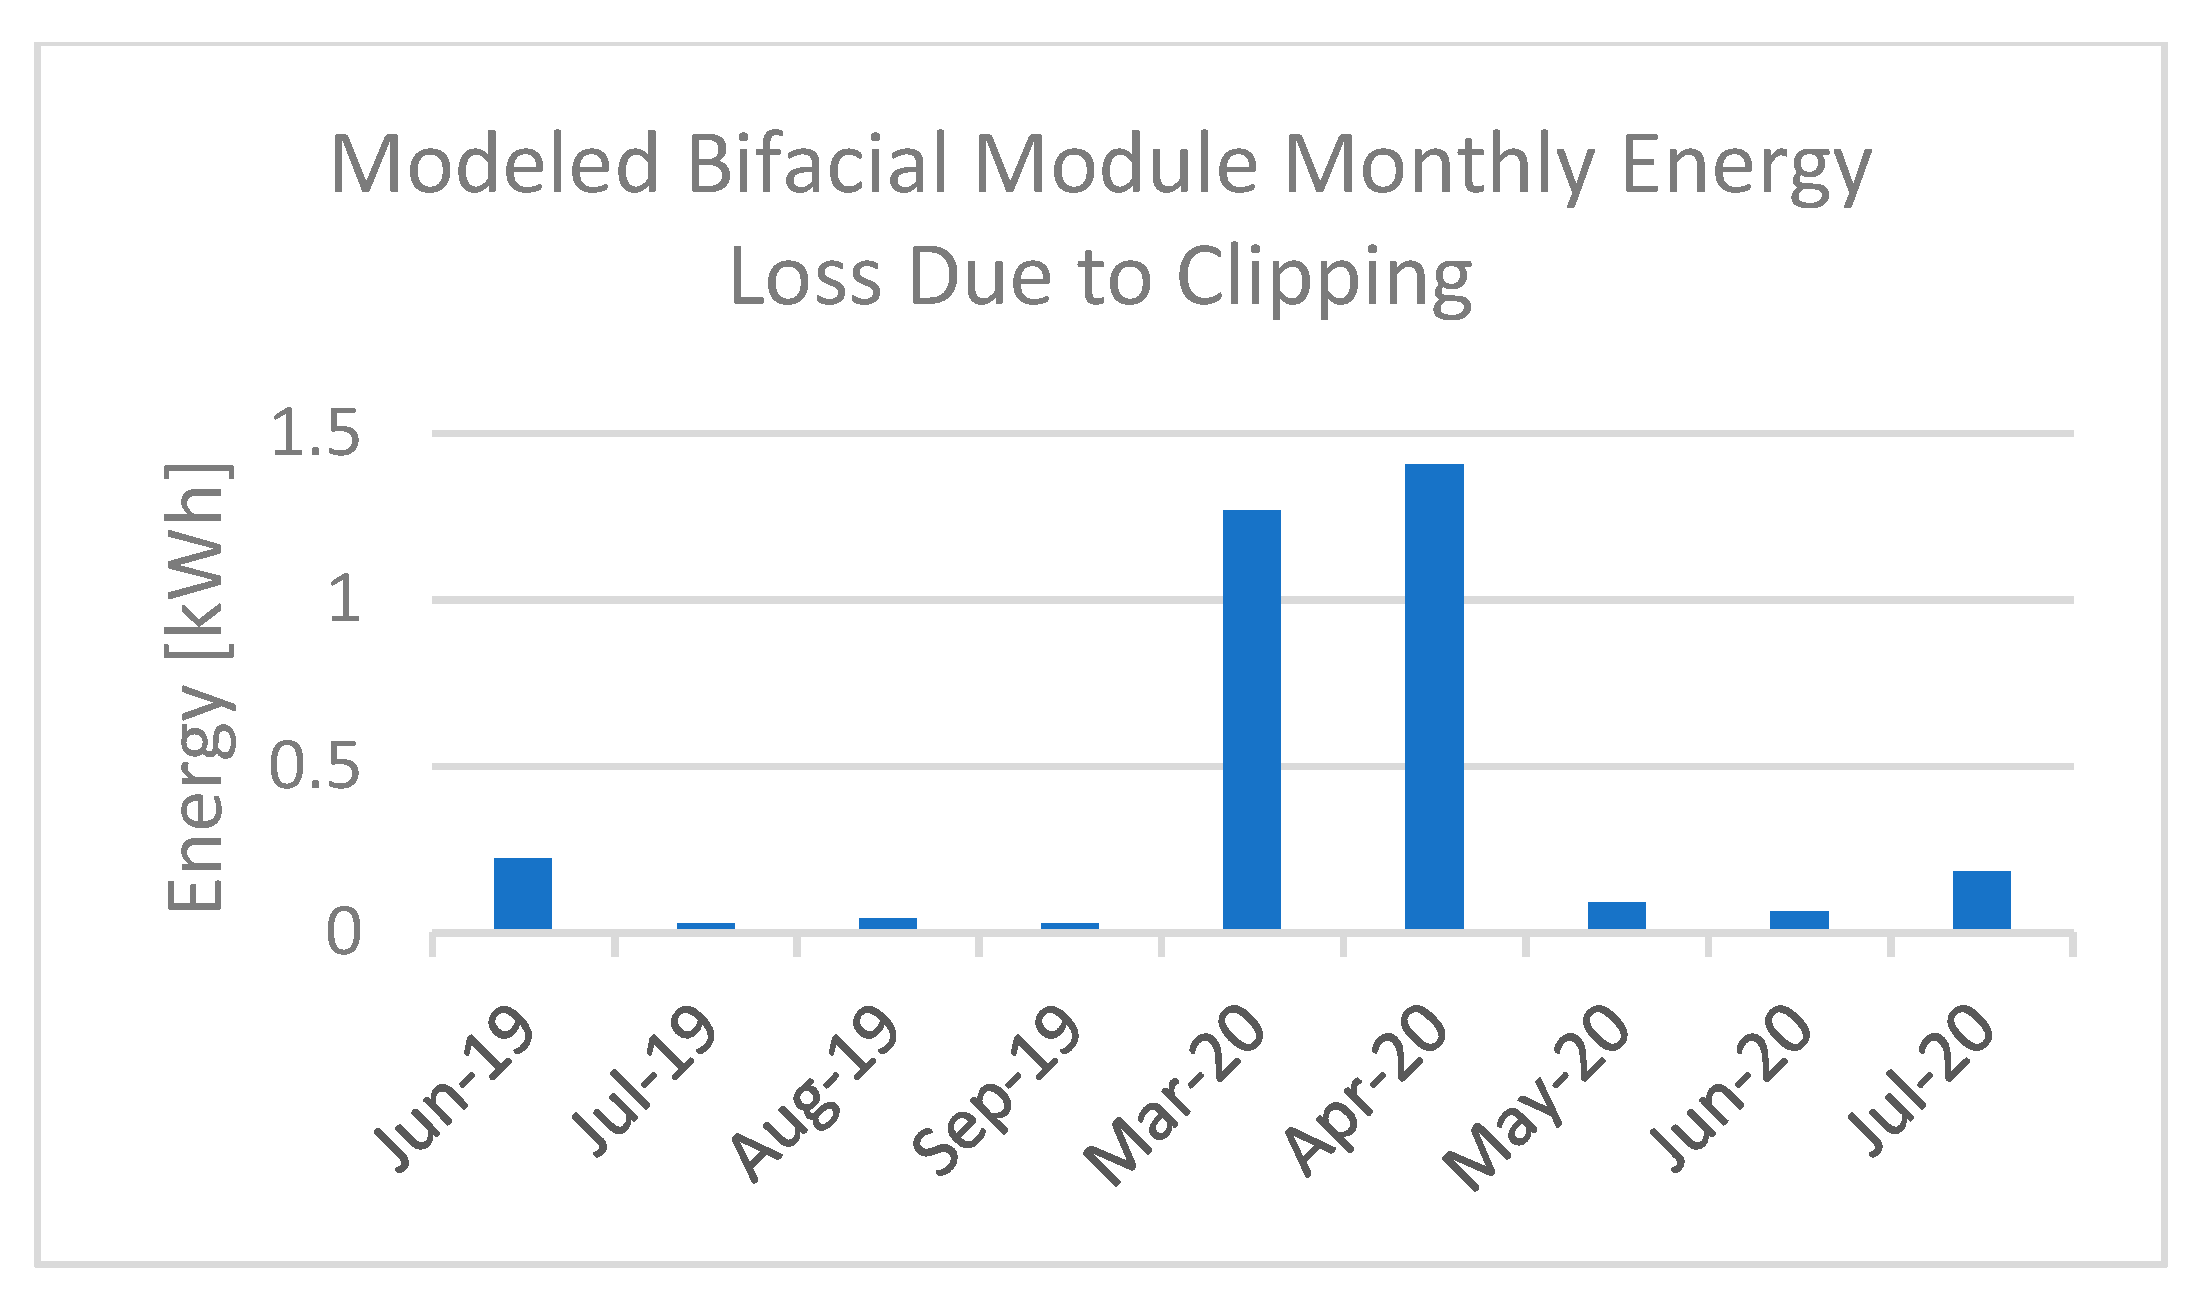
As shown in Figure 6 and Figure 7, the majority of clipping events occurred during March and April when the interior region of Alaska often receives bright sunshine, high albedo caused by snow cover, and clear cold days. While no change to the bifacial gain analysis above occurred due to clipping, it should be noted that the springtime bifacial solar production could have been slightly higher for the south-facing bifacial modules, where clipping had not occurred. With this said, as shown in Figure 6, the modeled energy loss due to clipping was 1.3 and 1.4 kWh, respectively for each south-facing bifacial module in March and April of 2020. In addition, DC to AC ratios greater than 1 are very common in the industry and, in this analysis, the DC to AC ratio was very close to 1.
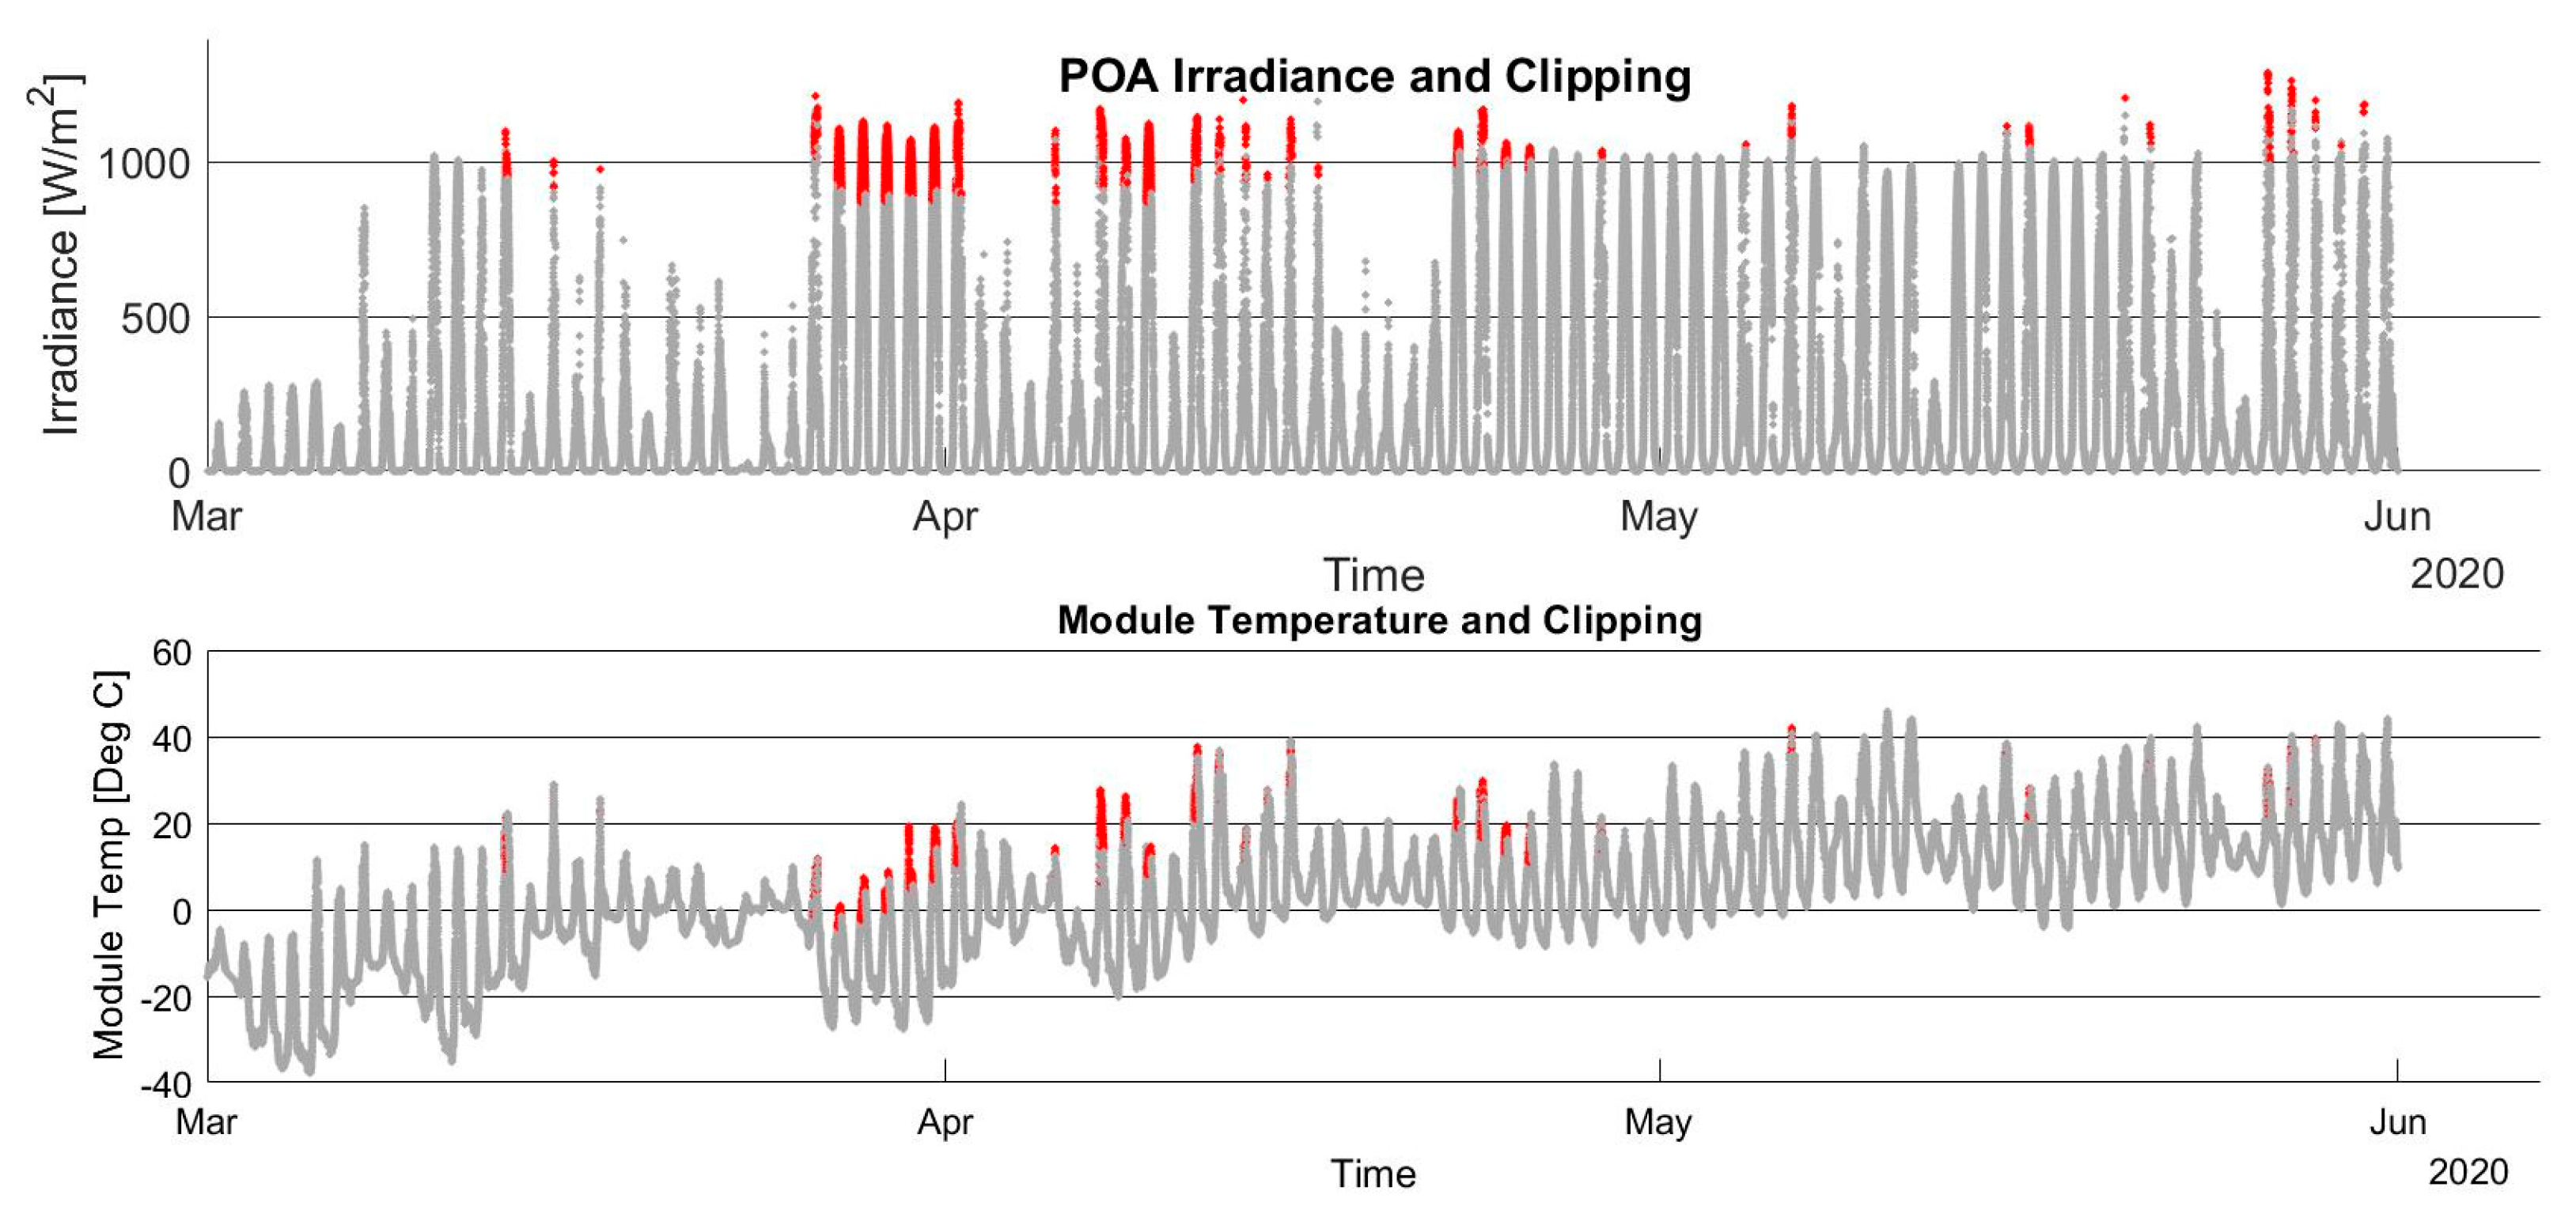
Figure 7 shows the relationship over time between the POA irradiance, module temperature, and clipping (which is highlighted in red) for the Spring of 2020. The most consistent period of daily clipping occurred in late March and April. Clipping occured at lower POA irradiance levels in the springtime than in the summer.
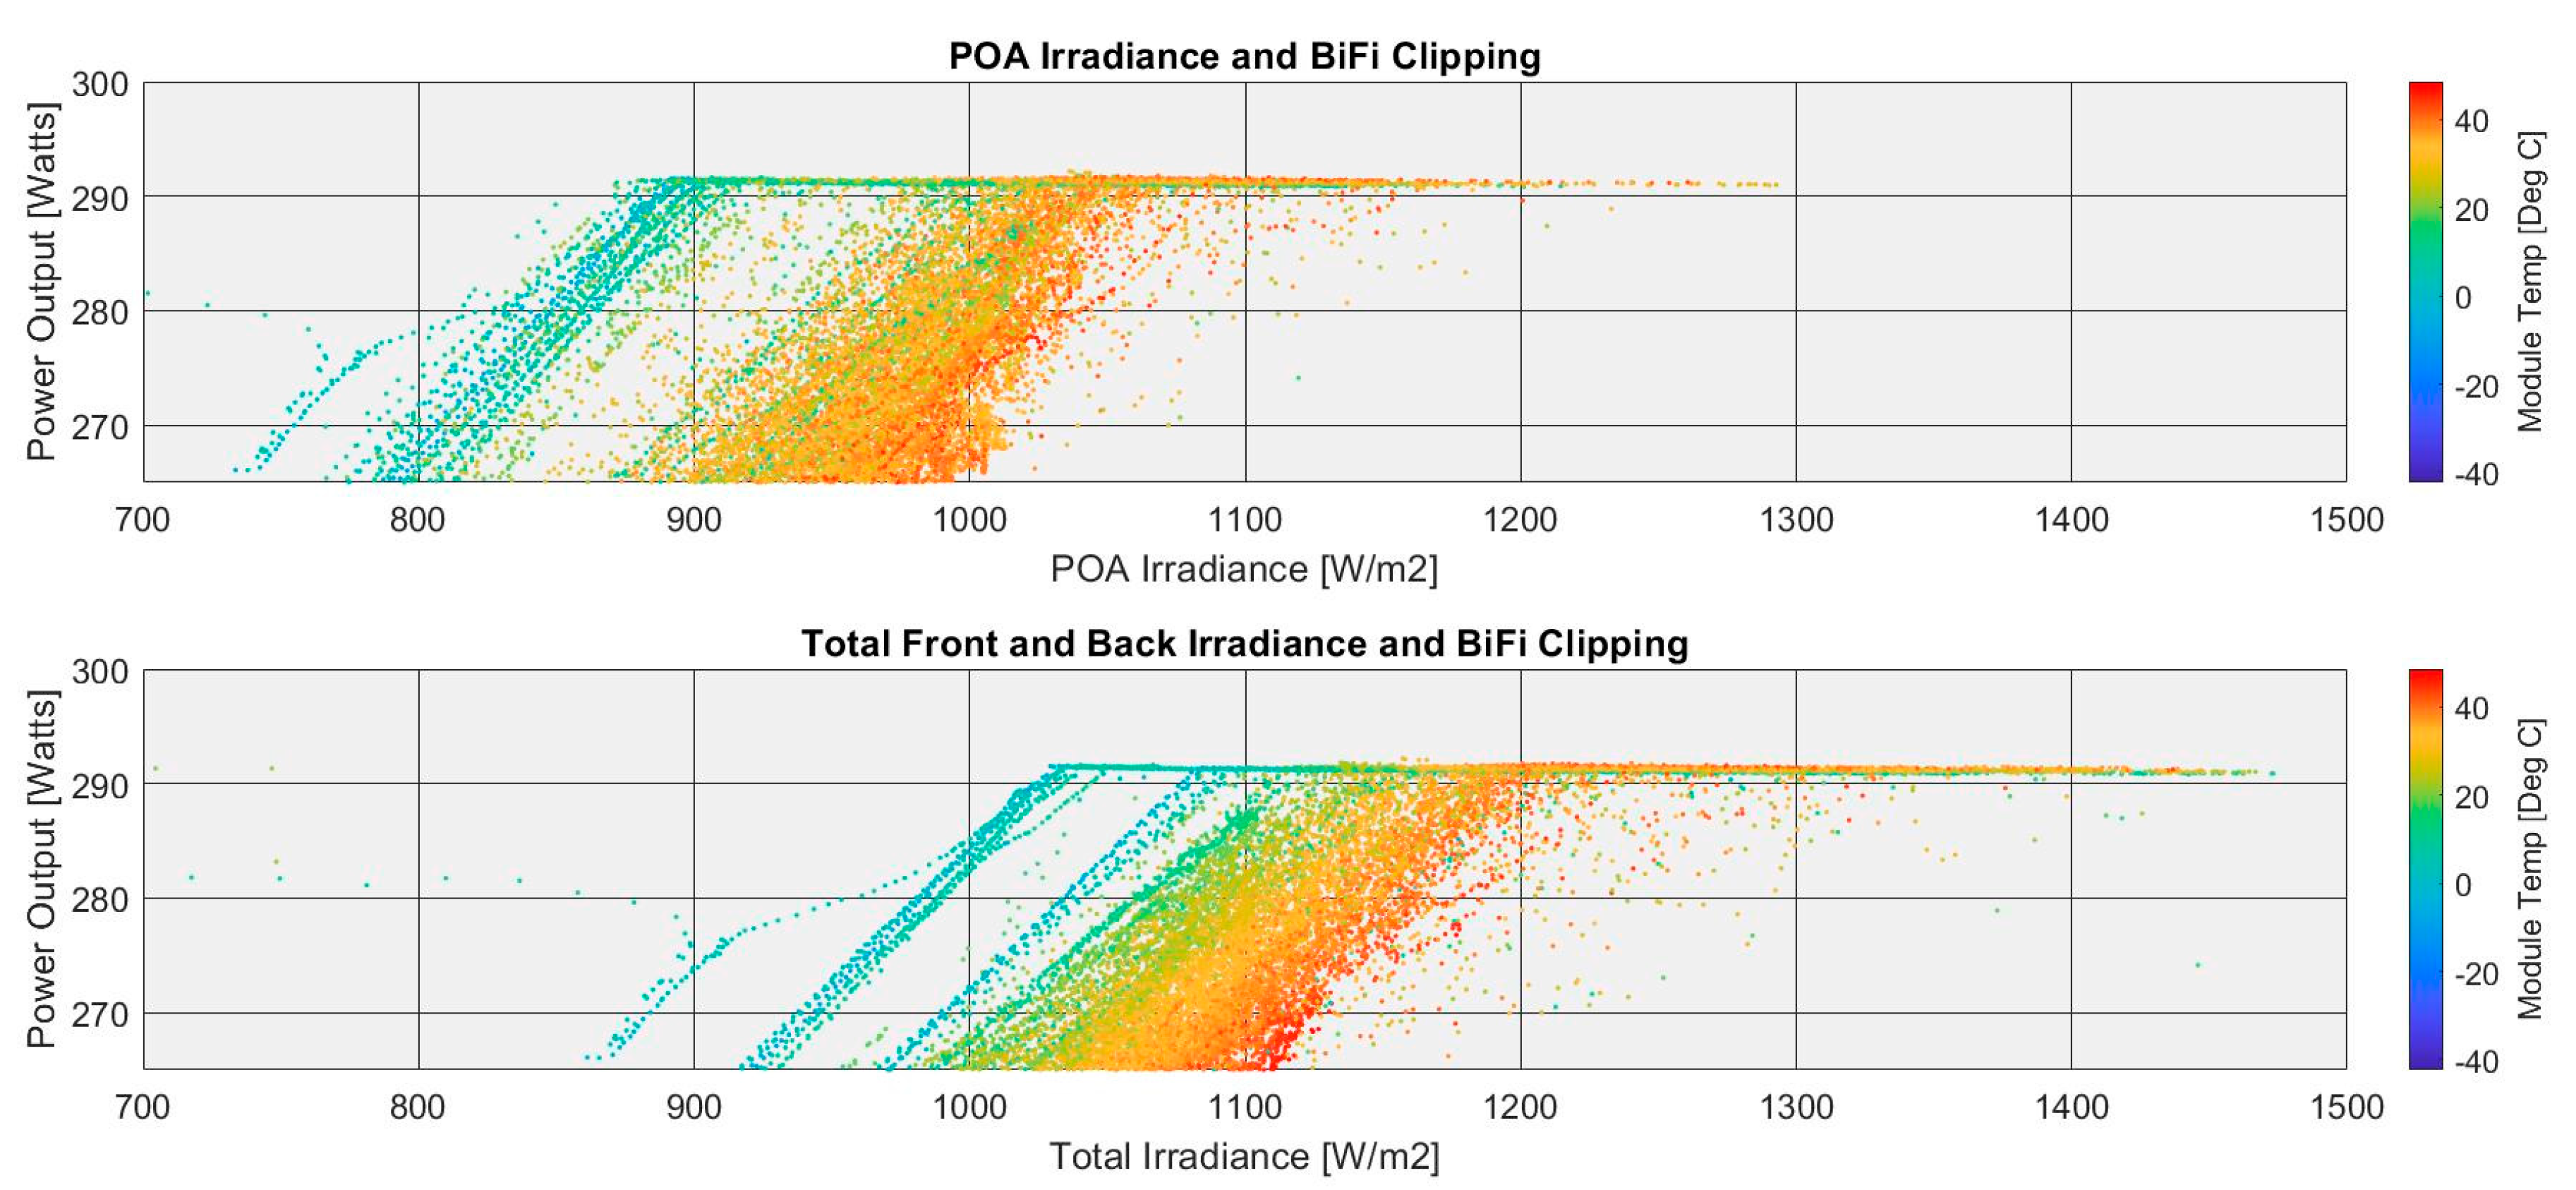
Figure 8 demonstrates inverter clipping with a scatter plot between the module power output and both POA irradiance, as well as the total front and backside irradiance along with the module temperature. This figure shows that when the modules were cold, inverter clipping sometimes occurred at a POA irradiance as low as about 850 W/m2. The bottom graph shows the relationship between the module power output and the front and back irradiance calculated using Equation (3). It shows that when the backside irradiance was considered, the total irradiance on the module was over 1000 W/m2 when clipping began to occur.
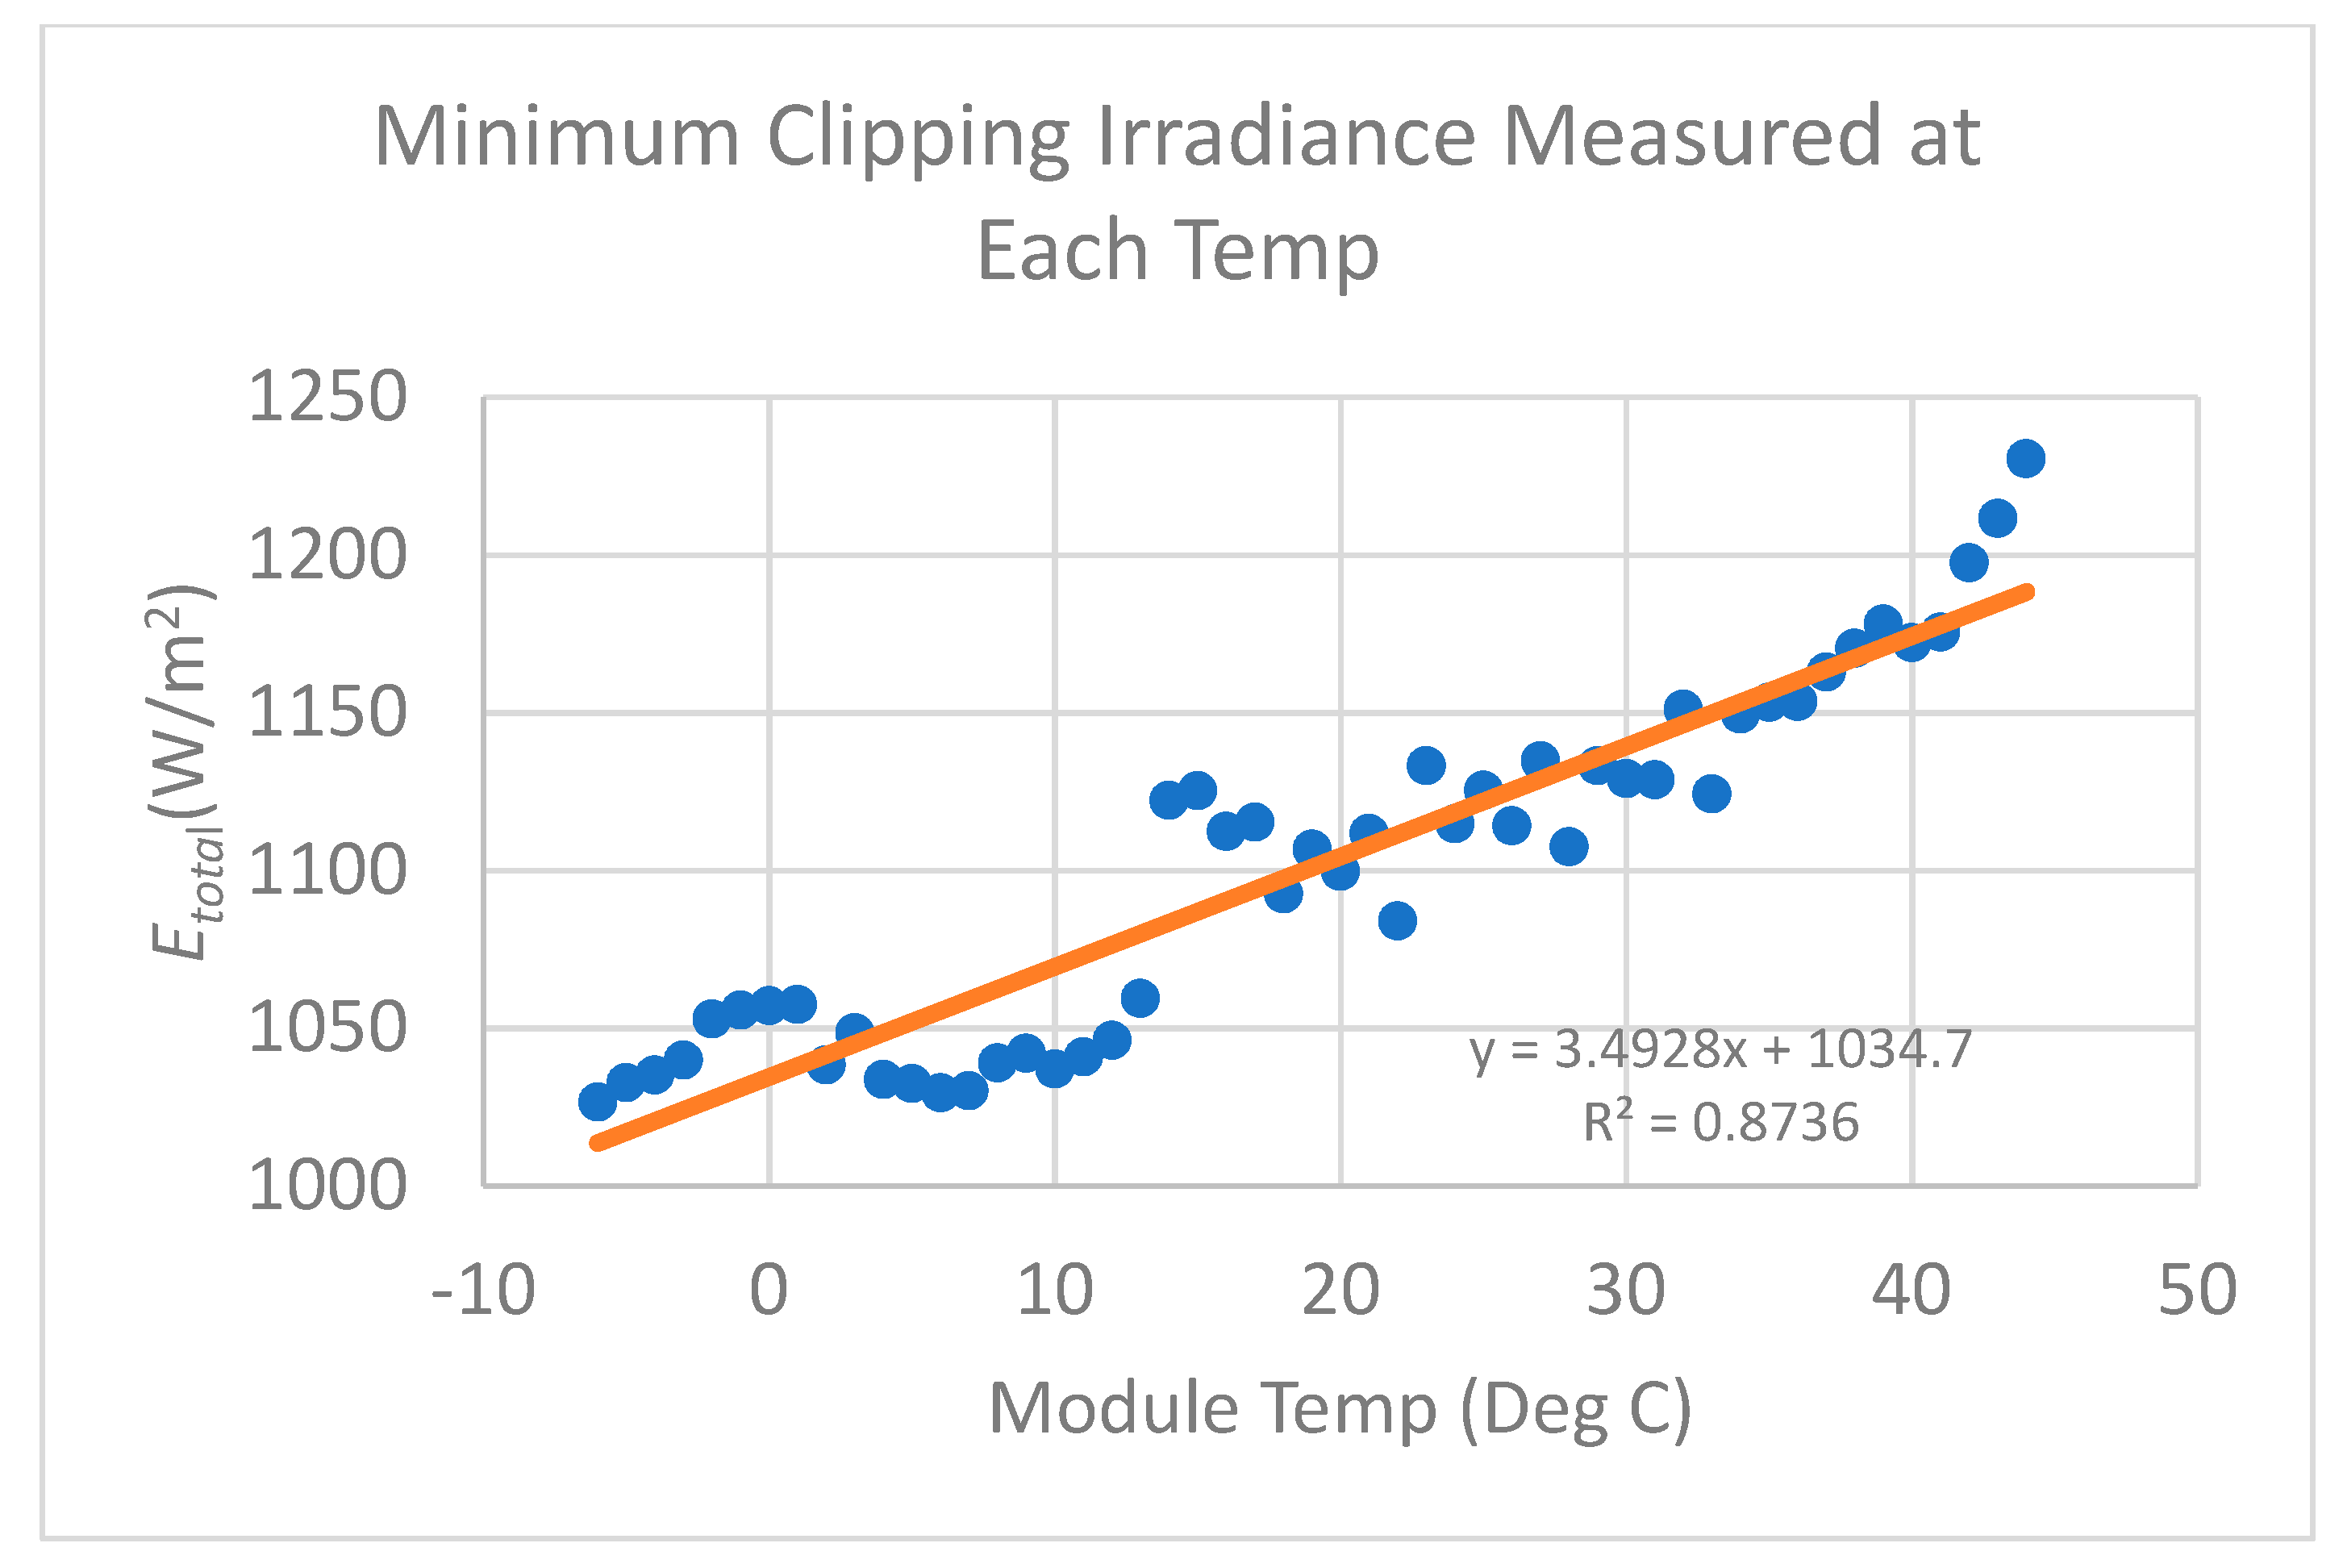
The data shown in Figure 7 and Figure 8 enable the calculation of a curve that can be used to predict when clipping will occur at different temperatures and total irradiance levels, as shown in Figure 9. To create this figure, the Etotal values calculated from Equation (3) that correspond to the clipped data were binned by the temperature, and then the lowest irradiance values where clipping occurred for each temperature were graphed. Temperature and total irradiance values that lie above the line would be expected to experience inverter clipping. This curve would be expected to change as the PV modules degrade over time.
4.2. East-West Versus South-Facing Orientation of Bifacial Modules
The data set for comparing the performance of the south-facing bifacial PV modules and vertical east-west bifacial modules included more wintertime data than the analysis above due to the improved snow shedding characteristics of the frameless bifacial modules.
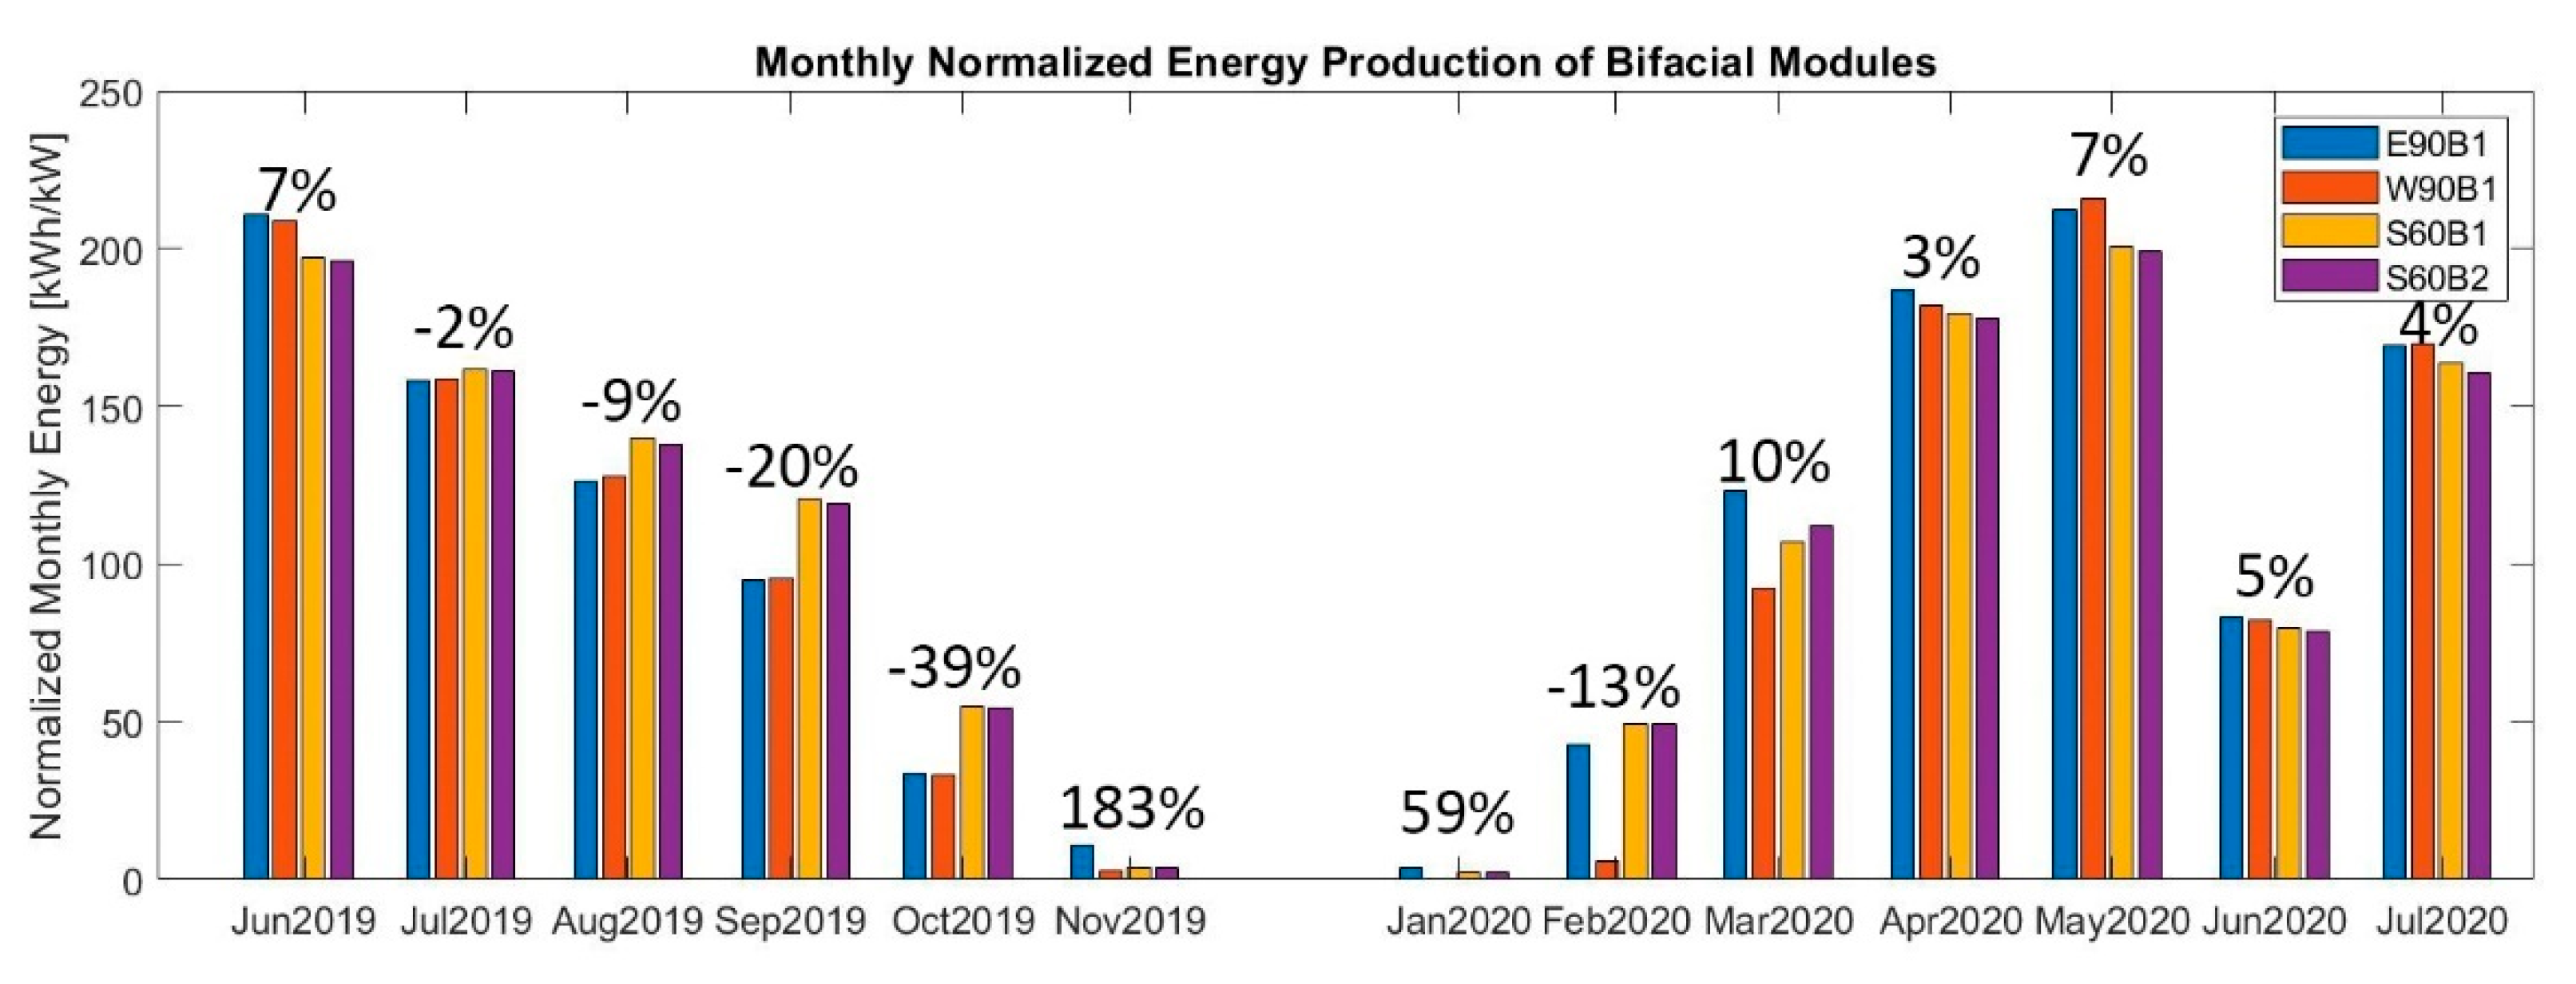
The normalized monthly energy output of south-facing and east-west vertical bifacial modules is shown in Figure 10 along with the vertical bifacial energy gain ) or loss in the annotation. The monthly vertical bifacial gain was calculated using Equation (5).
To calculate the vertical bifacial energy gain values shown in Figure 10, was averaged for the east and west vertical bifacial PV modules. In November, January, February, and March, the west-facing vertical PV module had suspected MPPT tracking issues which reduced the production, similar to what was observed above in module S60M1. During these months, the energy value from this module was not used in the vertical bifacial gain calculation.
In general, the data showed that the vertical bifacial PV modules produced more energy than the south-facing bifacial modules from March through June. From August through October, the south-facing bifacial modules produced more energy than the vertical east-west modules. The November and January data were suspect, as very little energy was produced from any of the modules, so these months did not play a substantial role in the annual production of solar energy.
4.3. Monthly Performance by Hour of the Day
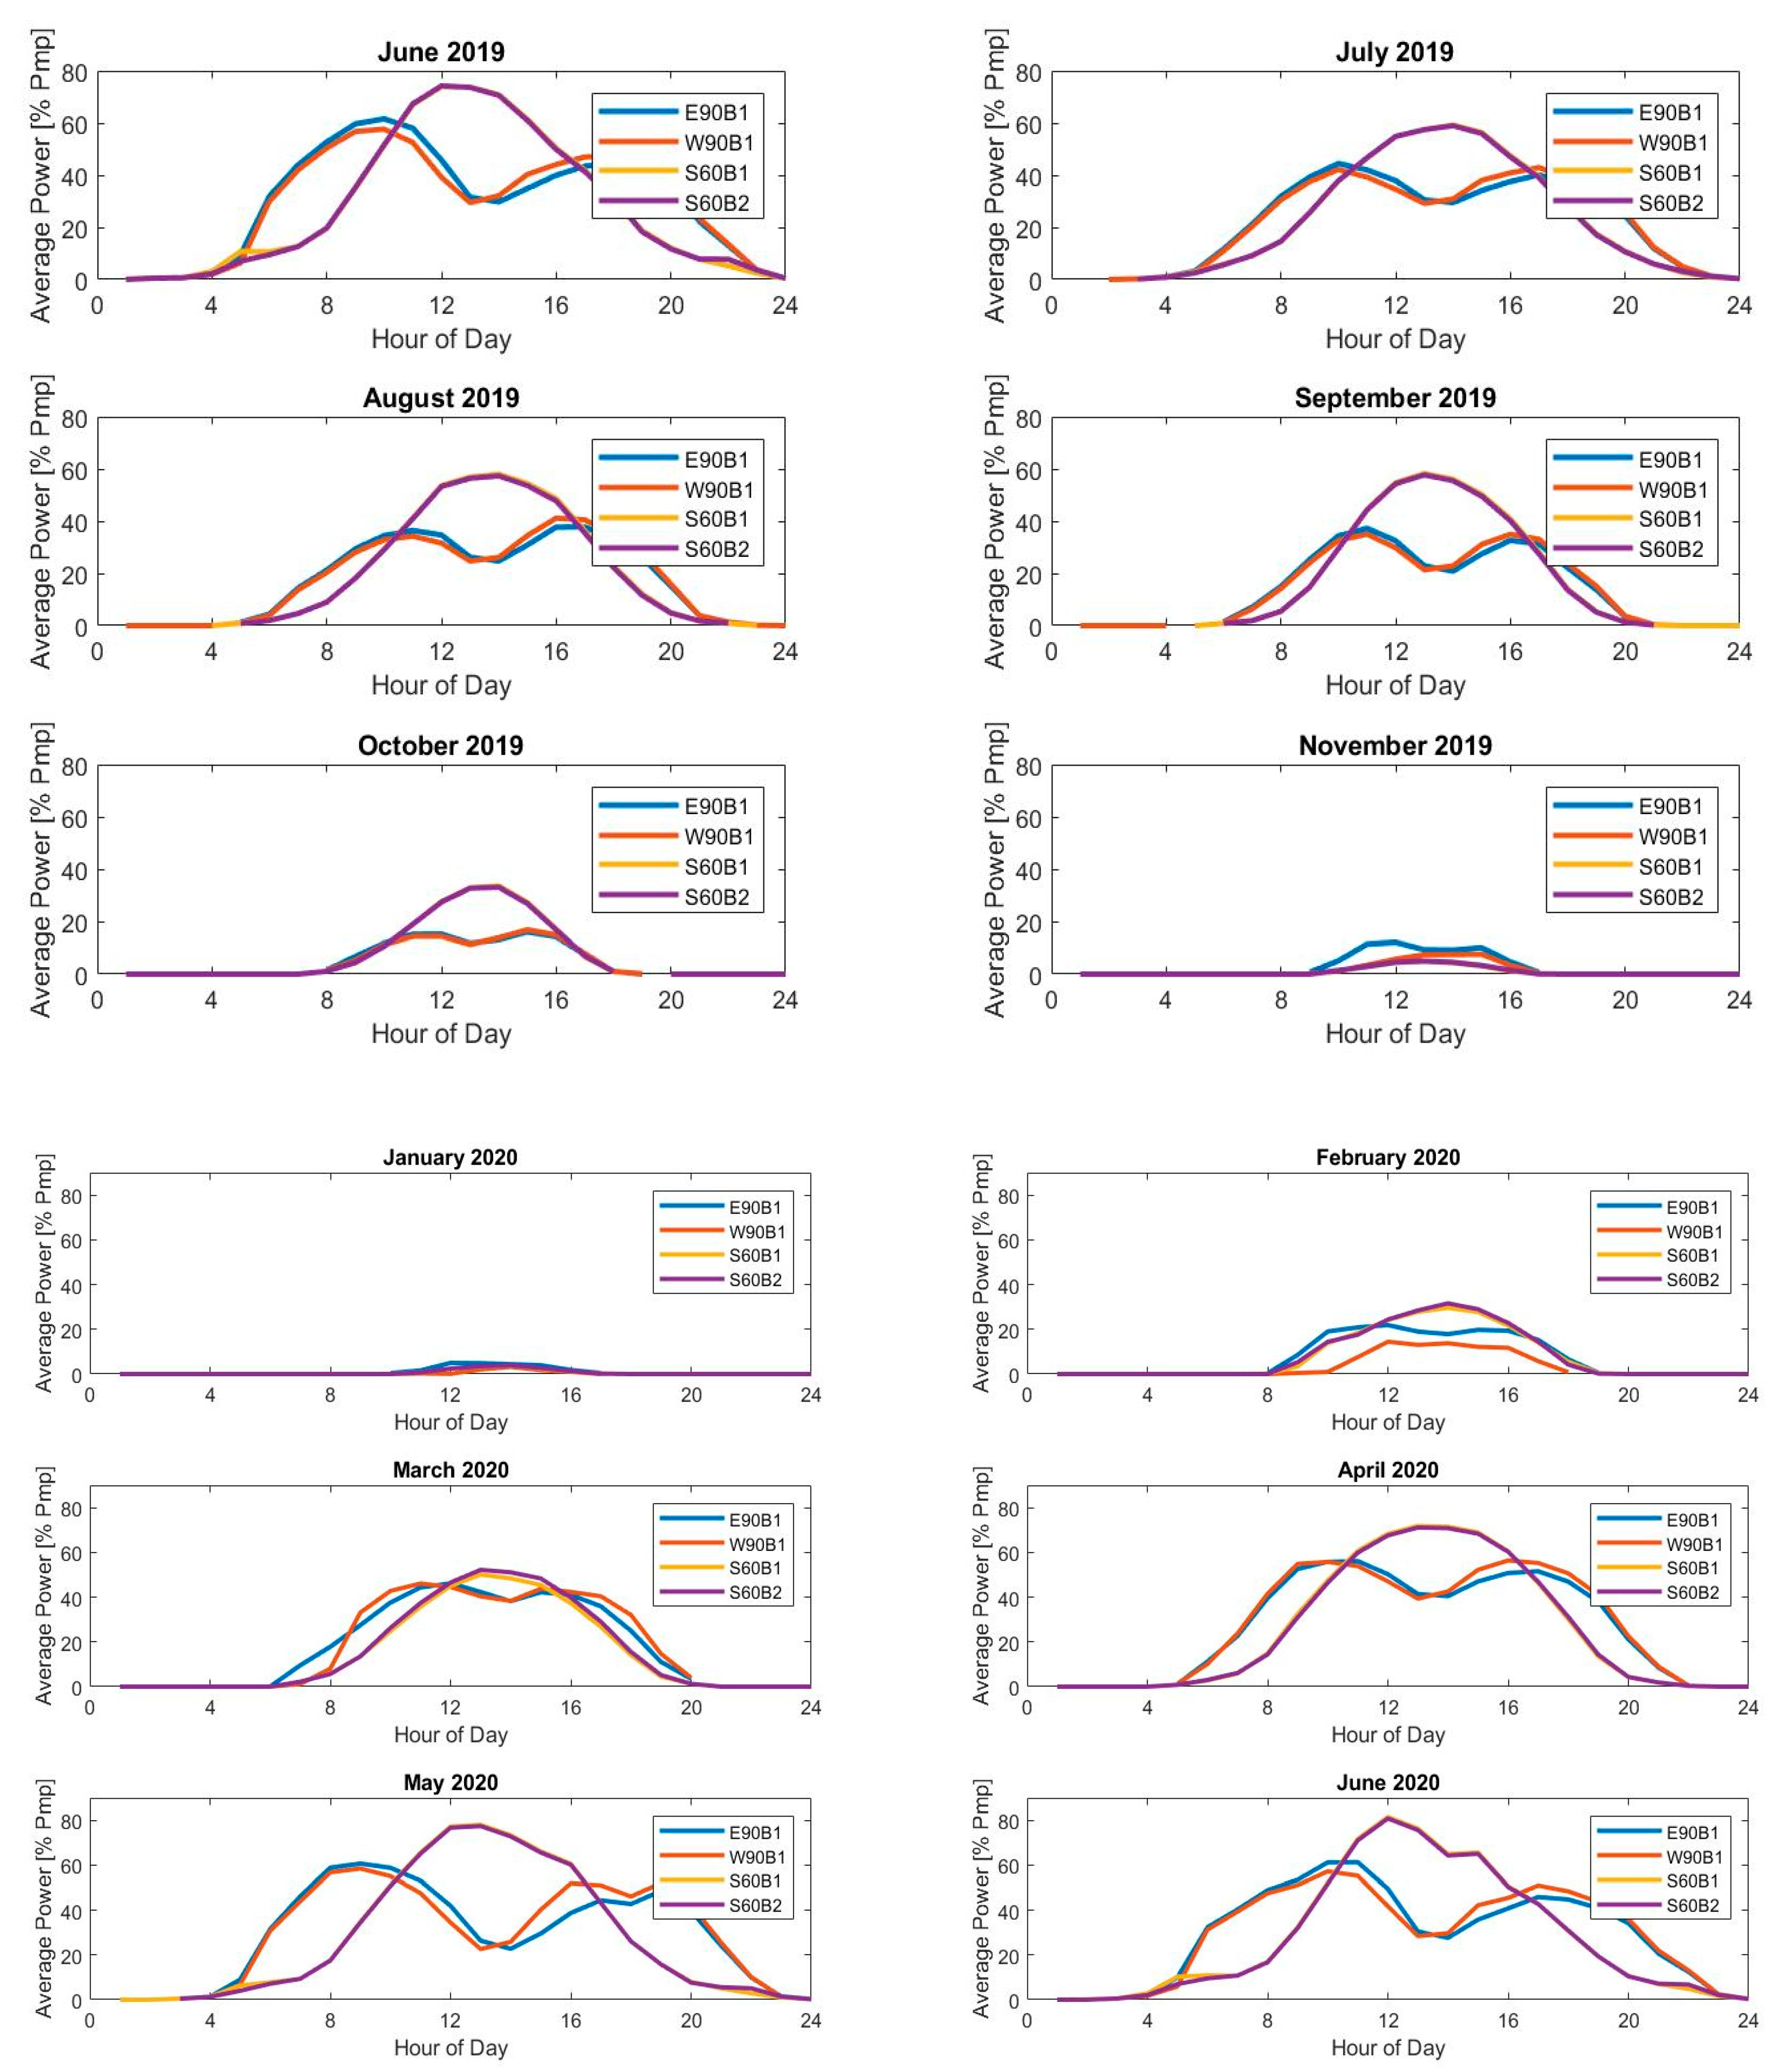
If used strategically, orienting bifacial PV modules vertically in an east-west orientation in conjunction with traditionally south-facing modules could better match the performance curve with daily utility load profiles. Figure 11 shows the monthly average hourly production as a percent of Pmp for each of the vertical and south-facing bifacial modules. The vertical east-west orientations of the bifacial modules shifted the peak production curves from a normal-like distribution that peaked in the early afternoon to a bimodal distribution with peak production in the morning and early evening periods during the spring and summer months.
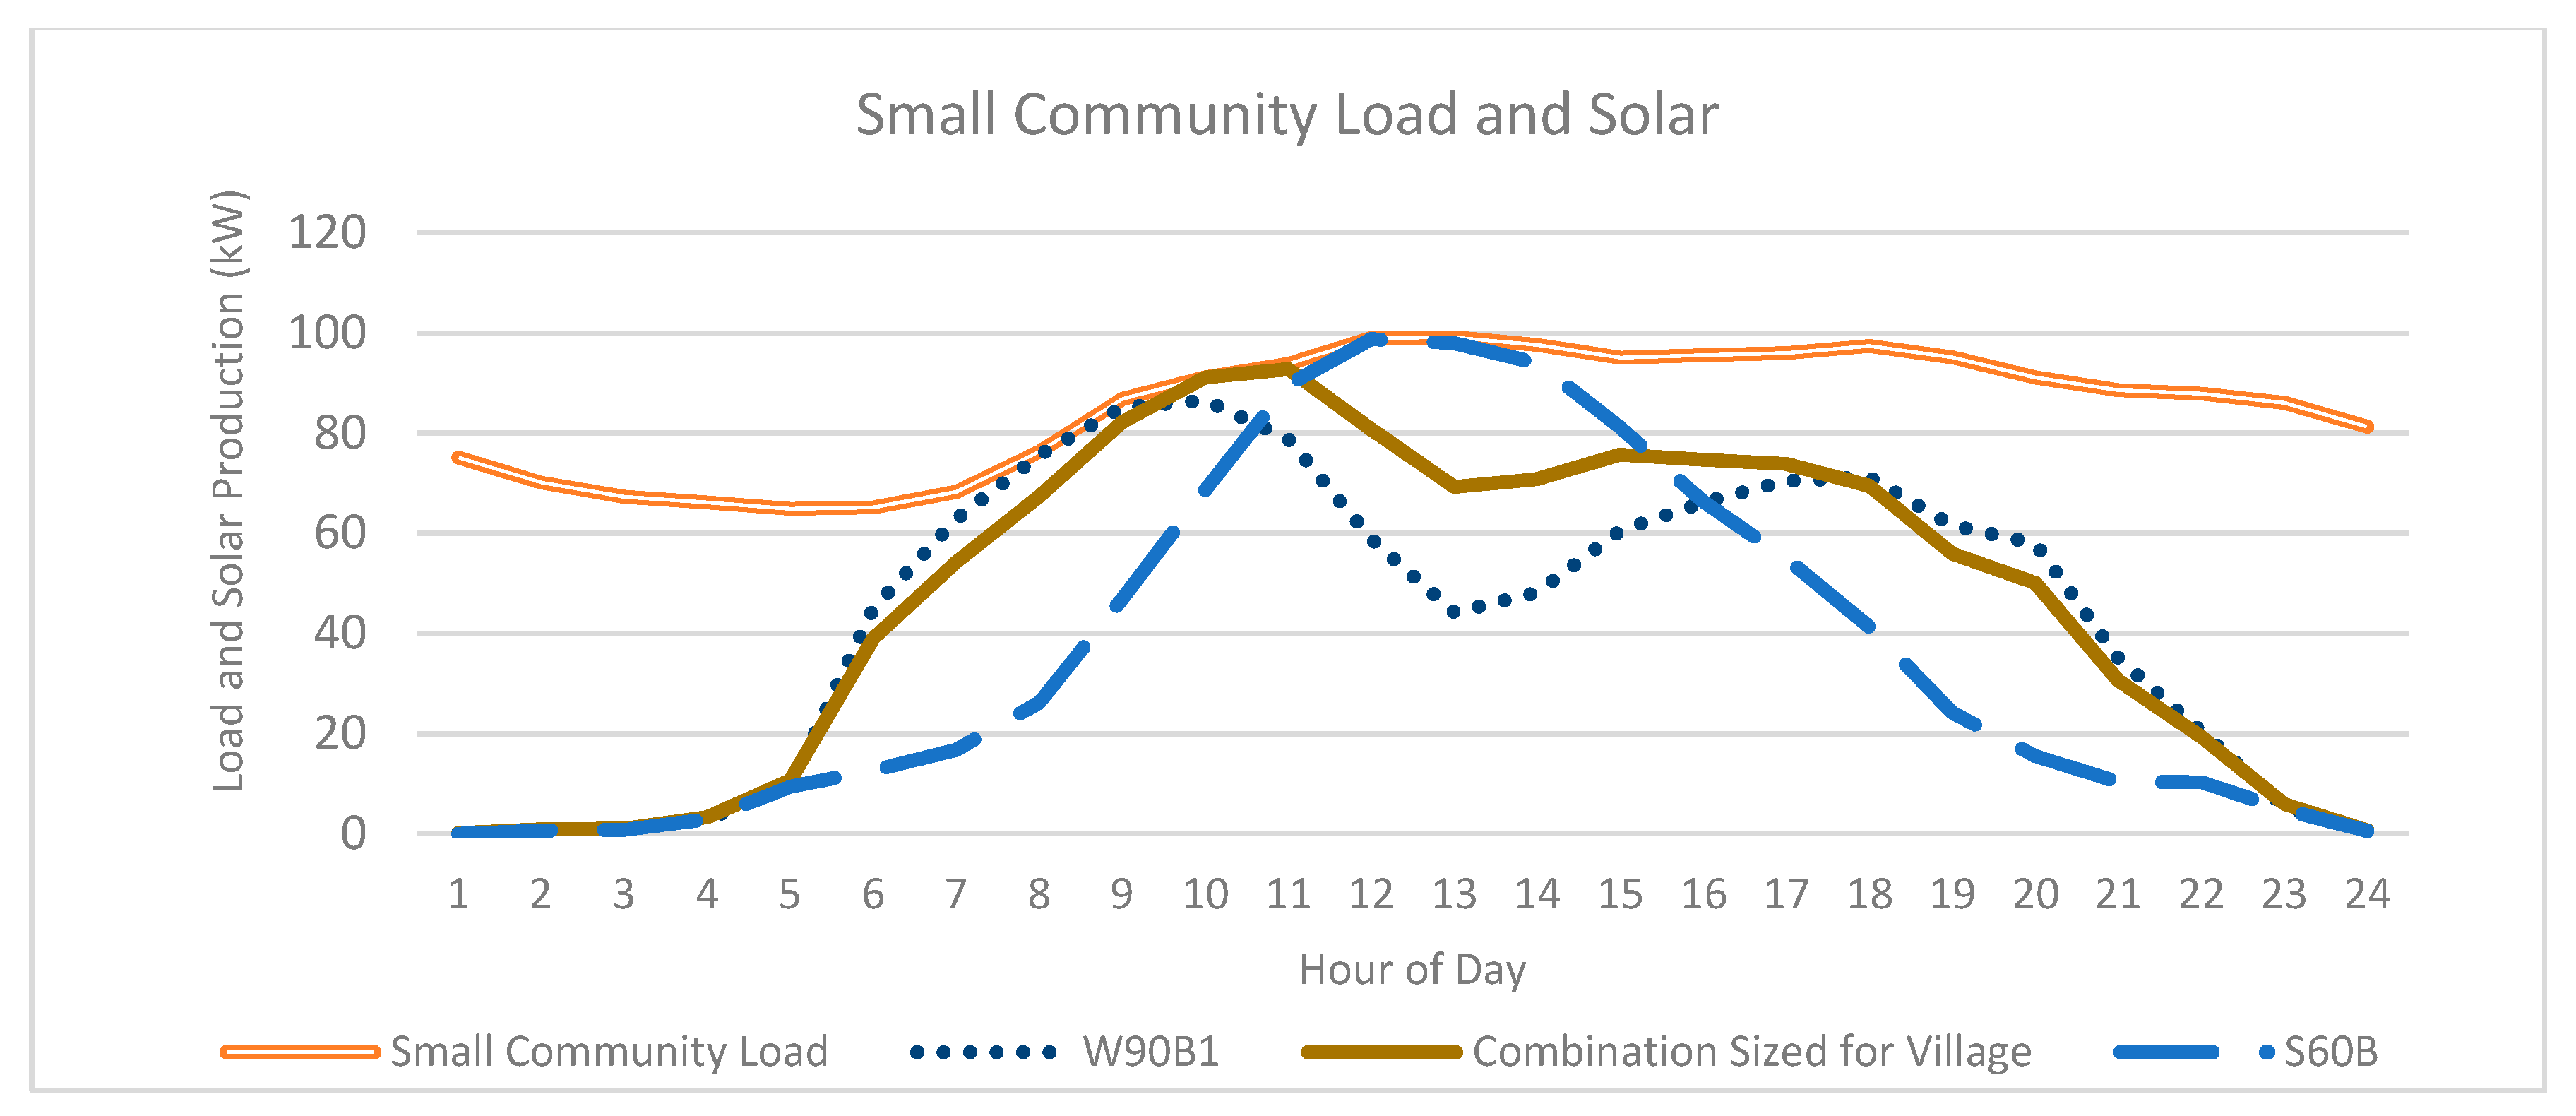
Figure 12 shows how the hourly production output from different PV module orientations line up with an aggregated summer load profile of several small towns in Alaska, scaled so that the maximum load is 100 kW. Devine et al. [25] studied the loads of rural Alaskan communities and showed that summer peaks occurred between 12:00 and 6:00 PM, although the peaks are not significant and the load essentially plateaued during the day. We verified this finding during our own load exercise illustrated in Figure 12. The three different solar scenarios were created using the June production profile shown in Figure 11, scaled so that the average hourly production never exceeded the hourly load. The scenarios included south-facing bifacial modules, vertical east-west bifacial modules, and a combination of the two. The analysis showed that, for this example, a ratio of installed capacity of 2.4 kW vertical east-west modules to 1 kW south-facing modules offsets the most load with the solar along with spreading out the production curve and minimizing the mid-day production dip observed in an all the east-west vertical orientation array. The specific amount of energy offset depends on the site’s solar resource, load profiles, and the amount of solar generation that a grid can support in each community, so additional modeling would be required for site optimization.
4.4. Total Energy Production
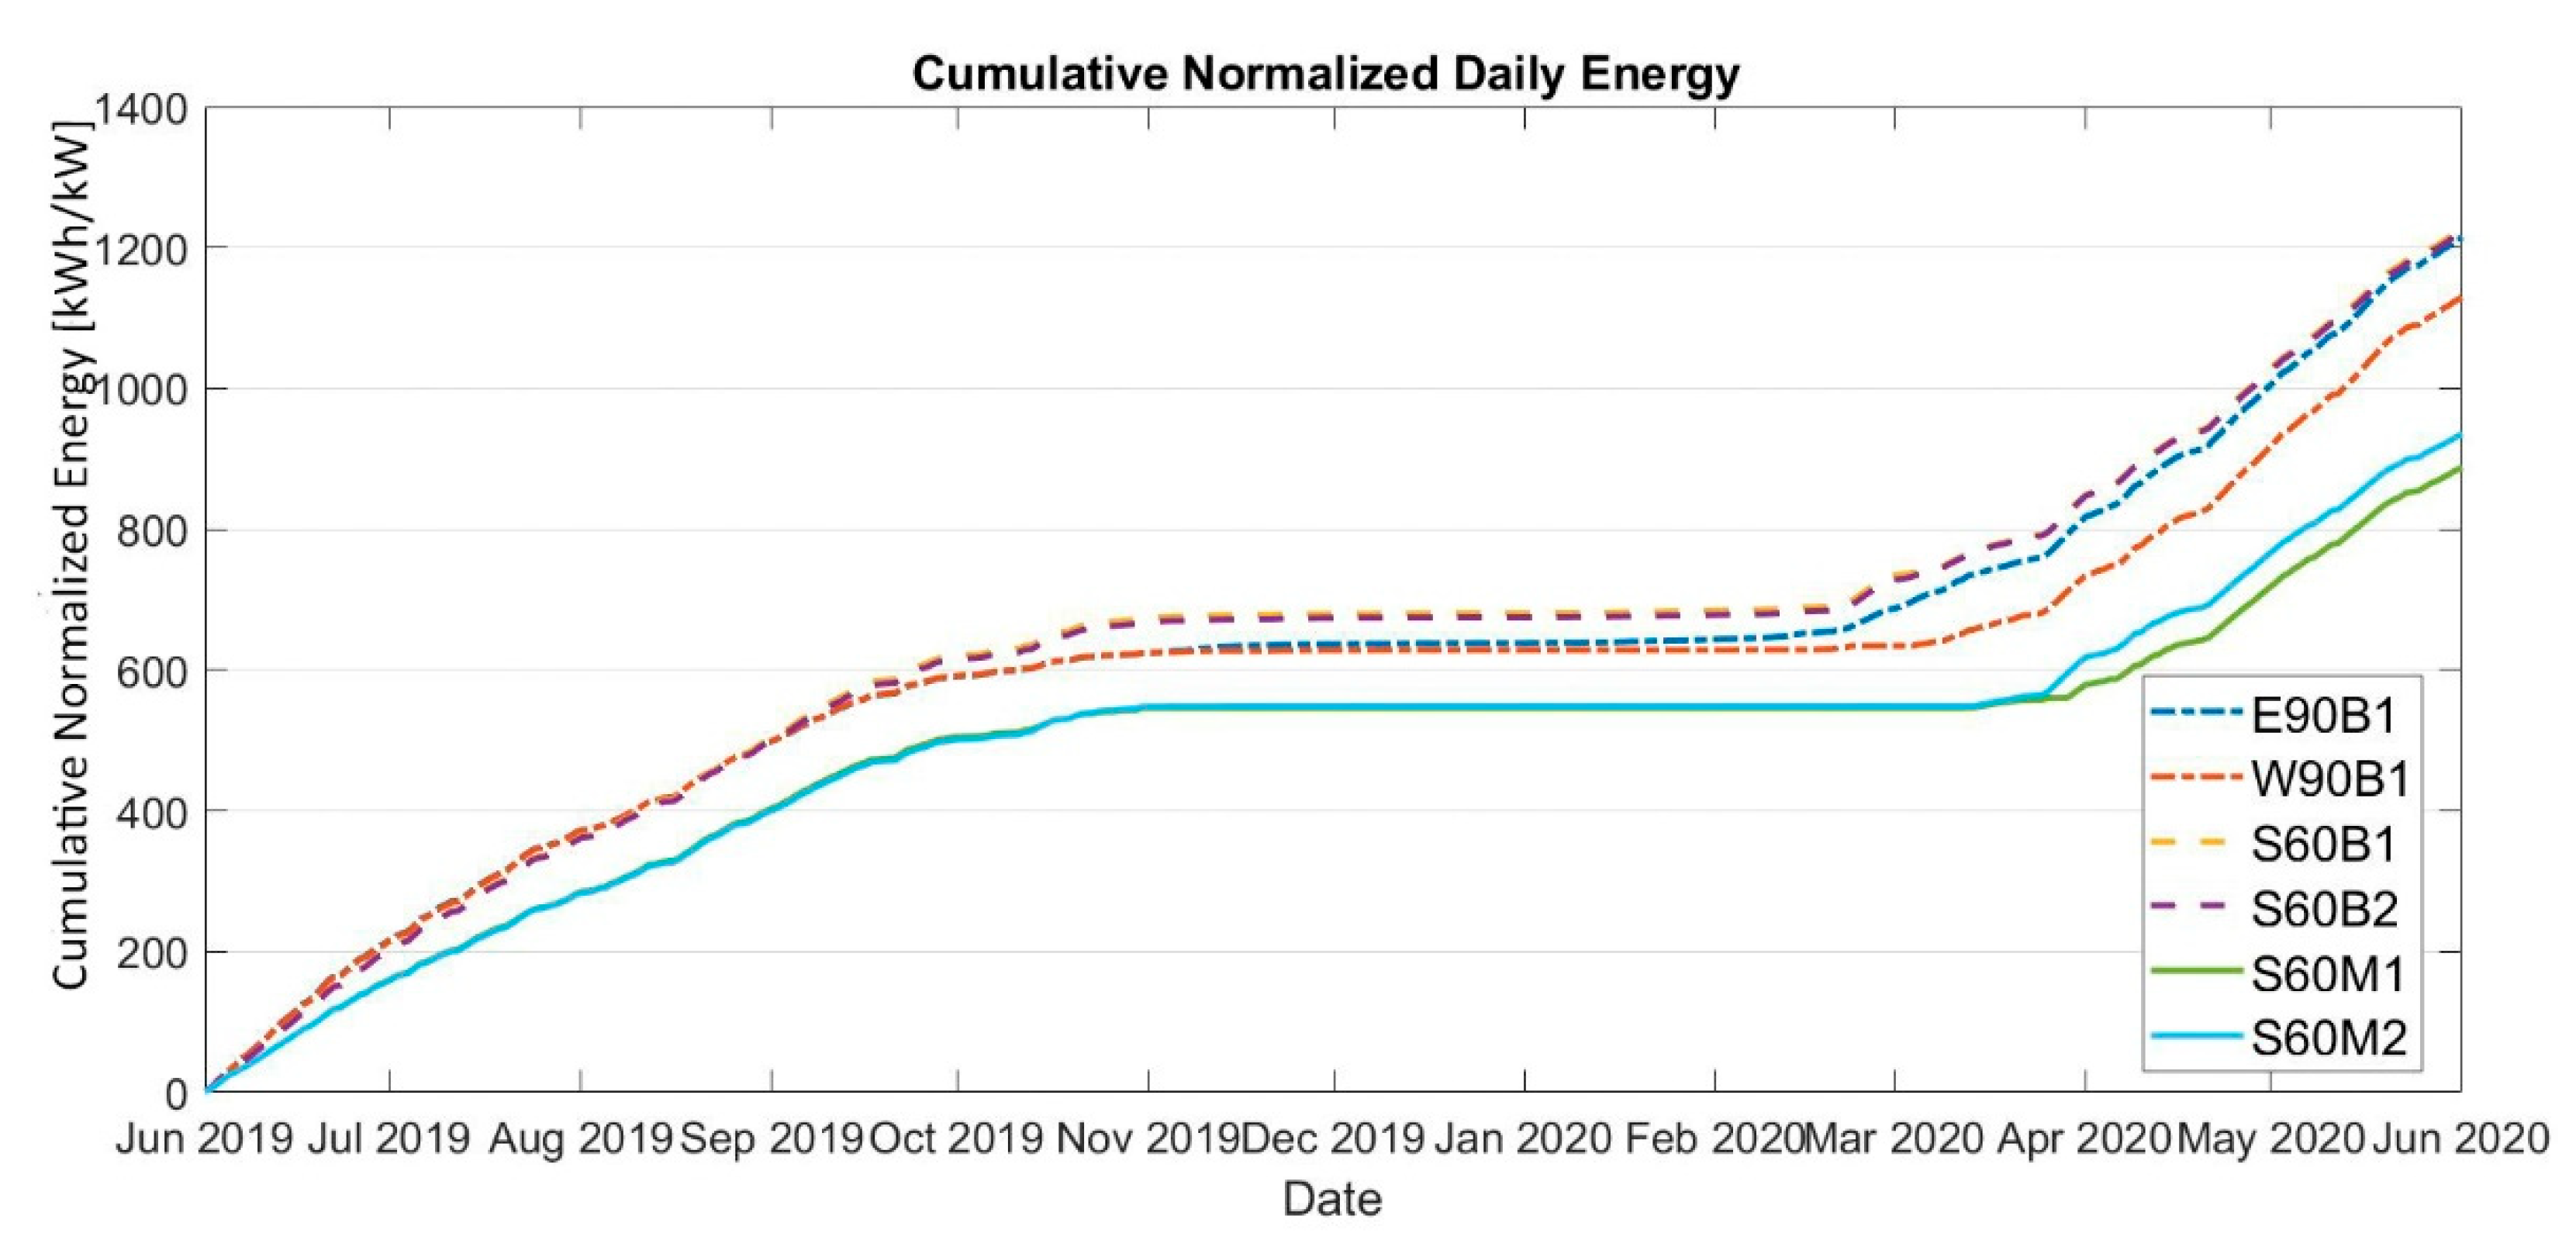
Despite the differences in seasonal and hourly production between the vertical east-west and south-facing bifacial module production which are shown in Figure 11, the overall energy production data showed only a minor difference in the total annual production achieved by the two orientations. Figure 13 shows one year of normalized cumulative production of all the modules that have been discussed and includes the winter data that were excluded from the analysis above. Excluding the underperforming modules S60M1 and W90B1, the data show that the annual production between the south-facing bifacial modules and the vertical east-west bifacial modules was virtually identical. Seasonally, the south-facing bifacial modules performed best in the fall, while the east-west facing modules performed best in the spring and summer.
5. Discussion and Conclusions
This paper adds to the body of literature demonstrating that bifacial PV modules can offer significantly enhanced energy production compared to monofacial PV production. This analysis found that monthly bifacial gains for south-facing modules ranged from 13% to 27%. The bifacial gain was over 20% during the months from April through July. In addition, this analysis showed that east-west facing bifacial panels will outperform south-facing monofacial panels in northern locations. In our analysis, the months with the highest south-facing bifacial gains, relative to monofacial modules, corresponded to the periods with the largest range of daily azimuth angles. During the summer months, the sun actually rises and sets in the northern sector of the sky so that direct irradiance strikes the back of the south-facing bifacial module in the morning and evening. During these months in our study, the bifacial gain was greater than it was during the snowy months when ground albedos were high. The bifacial gain in this experiment was somewhat constrained during the colder spring months due to different temperature coefficients in the bifacial and monofacial modules and inverter clipping on the south-facing bifacial modules.
This analysis found that on a monthly basis the vertical bifacial modules outperformed the south-facing equivalent between March to June by up to 7%, while the south-facing bifacial modules performed better during the fall and early spring. On an annual basis, this analysis demonstrated the virtually identical annual production between vertical east-west and south-facing bifacial modules. While additional testing and modeling is warranted to determine if this level of production continues with larger bifacial arrays with ground coverage ratios consistent with the utility scale solar, this analysis demonstrated that vertical east-west bifacial modules had an enhanced production over the south-facing PV modules during evenings and mornings without sacrificing the annual energy production.
A combination of south-facing bifacial modules and vertical east-west bifacial modules was scaled based on the average hourly production to maximize the solar offset of a representative small Alaskan community’s load. Based on this research, it appears possible to have an array with both traditional south-facing bifacial modules, as well as vertical east-west facing bifacial modules to smooth out the daily production profile and avoid the duck curve that has been observed in more mature solar markets. This research suggests that this could be accomplished in northern locations with virtually no sacrifice in the annual energy production. Additional modeling is warranted to determine the optimal ground coverage ratio of this design and whether the balance of system costs for this design would be higher or lower than a traditional south-facing fixed tilt array.
Author Contributions
Conceptualization, C.P., E.W., and J.S.S.; methodology, C.P. and J.S.S.; software, C.P.; validation, C.P., E.W., M.W., and J.S.S.; formal analysis, C.P.; investigation, C.P.; resources, C.P., E.W., and J.S.S.; data curation, C.P.; writing—original draft preparation, C.P.; writing—review and editing, C.P., E.W., M.W., and J.S.S.; visualization, C.P. and J.S.S.; supervision, E.W. and J.S.S.; project administration, E.W. and J.S.S.; funding acquisition, E.W. and J.S.S. All authors have read and agreed to the published version of the manuscript.
Funding
This project is part of the ARCTIC Program, an initiative supported by the Office of Naval Research (ONR). Details at: Thearcticprogram.net.
Institutional Review Board Statement
Not applicable.
Informed Consent Statement
Not applicable.
Data Availability Statement
The data presented in this study are available on request from the corresponding author.
Acknowledgments
The authors would like to acknowledge the technical and material support from Sandia National Lab, and the support from the University of Alaska Fairbanks Agricultural and Forestry Experiment Station where the testing facility is located.
Conflicts of Interest
The funders had no role in the design of the study; in the collection, analyses, or interpretation of data; in the writing of the manuscript, or in the decision to publish the results.
References
- Pike, C. 2020 Net Metering Update. Available online: http://acep.uaf.edu/media/293024/2020-Net-Metering-Update_20200309Final.pdf (accessed on 12 September 2020).
- Stein, J.S. Solar PV Performance and New Technologies in Northern Latitude Regions. In Proceedings of the Rural Energy Conference, Fairbanks, Alaska, 11 April 2018. [Google Scholar]
- Mori, H. Radiation Energy Transducing Device. U.S. Patent US3278811A, 11 October 1966. [Google Scholar]
- Cuevas, A. The Early History of Bifacial Solar Cells. In Proceedings of the 20th European Solar Energy Conference, Barcelona, Spain, 6–10 June 2005. [Google Scholar]
- Romijn, I.; Janssen, G.; Dullweber, T.; Van Aken, B.; Eisenberg, N.; Kreinin, L.; Despeisse, M.; Mihailetchi, V.; Lossen, J.; Jooss, W.; et al. Bifacial cells. In Bifacial Photovoltaics: Technology, Applications and Economics; Institution of Engineering and Technology (IET): London, UK, 2018; pp. 17–70. [Google Scholar]
- International Technology Roadmap for Photovoltaic (ITRPV)—Results 2019. Available online: http://itrpv.vdma.org/ (accessed on 10 February 2021).
- Rodríguez-Gallegos, C.D.; Liu, H.O.; Gandhi, J.P.; Singh, V.; Krishnamurthy, A.; Kumar, J.S.; Stein, S.; Wang, L.; Li, T.; Reindl, T.; et al. Global techno-economic performance of bifacial and tracking photovoltaic systems. Joule 2020, 4, 1514–1541. [Google Scholar] [CrossRef]
- Burnham, L.; Riley, D.; Walker, B.; Pearce, J.M. Performance of Bifacial Photovoltaic Modules on a Dual-Axis Tracker in a High-Latitude, High-Albedo Environment. In Proceedings of the 2019 IEEE 46th Photovoltaic Specialists Conference (PVSC), Chicago, IL, USA, 16–21 June 2019; pp. 1320–1327. [Google Scholar]
- Guo, S.; Walsh, T.M.; Peters, M. Vertically mounted bifacial photovoltaic modules: A global analysis. Energy 2013, 61, 447–454. [Google Scholar] [CrossRef]
- Ito, M.; Gerritsen, E. Geographical Mapping of the Performance of Vertically Installed Bifacial Modules. In Proceedings of the 32nd European Photovoltaic Solar Energy Conference and Exhibition, München, Germany, 22 June 2016. [Google Scholar]
- Khan, M.R.; Hanna, A.; Sun, X.; Alam, M.A. Vertical bifacial solar farms: Physics, design, and global optimization. Appl. Energy 2017, 206, 240–248. [Google Scholar] [CrossRef] [Green Version]
- Deline, C.; Pelaez, S.A.; MacAlpine, S.; Olalla, C. Estimating and parameterizing mismatch power loss in bifacial photovoltaic systems. Prog. Photovolt. Res. Appl. 2020, 28, 691–703. [Google Scholar] [CrossRef]
- Schwabe, P. Solar Energy Prospecting in Remote Alaska: An Economic Analysis of Solar Photovoltaics in the Last Frontier State; National Renewable Energy Lab. (NREL): Golden, CO, USA, 2016. [Google Scholar] [CrossRef] [Green Version]
- State’s Largest Rural Solar Project Nears Completion Above the Arctic Circle in Kotzebue. Alaska Public Media. National Public Radio. 5 February 2020. Available online: https://www.alaskapublic.org/2020/06/24/states-largest-rural-solar-project-nears-completion-above-the-arctic-circle-in-kotzebue/ (accessed on 12 September 2020).
- Byrd, A. Solar Research in Alaska. Available online: https://youtu.be/IwPMqb2vgJk?list=PLJ_aYEKT8q8wQh2b053stawIn7MRR0gp1 (accessed on 2 June 2020).
- Stein, J.S.; Riley, D.; Lave, M.; Hansen, C.; Deline, C.; Toor, F. Outdoor Field Performance from Bifacial Photovoltaic Modules and Systems. In Proceedings of the 2017 IEEE 44th Photovoltaic Specialist Conference (PVSC), Washington, DC, USA, 25–30 June 2017; pp. 3184–3189. [Google Scholar]
- Janssen, G.J.; Van Aken, B.B.; Carr, A.J.; Mewe, A.A. Outdoor Performance of Bifacial Modules by Measurements and Modelling. Energy Procedia 2015, 77, 364–373. [Google Scholar] [CrossRef] [Green Version]
- Berrian, D.; Libal, J.; Klenk, M.; Nussbaumer, H.; Kopecek, R. Performance of Bifacial PV Arrays with Fixed Tilt and Horizontal Single-Axis Tracking: Comparison of Simulated and Measured Data. IEEE J. Photovolt. 2019, 9, 1583–1589. [Google Scholar] [CrossRef]
- Asgharzadeh, A.; Marion, B.; Deline, C.; Hansen, C.; Stein, J.S.; Toor, F. A Sensitivity Study of the Impact of Installation Parameters and System Configuration on the Performance of Bifacial PV Arrays. IEEE J. Photovolt. 2018, 8, 798–805. [Google Scholar] [CrossRef]
- Reise, C.; Schmid, A. Realistic yield expectations for bifacial PV systems—An assessment of announced predicted and observed benefits. In Proceedings of the 31st Europe Photovoltaic Solar Energy Conference Exhibition, Cologne, Germany, 23 October 2015. [Google Scholar]
- Deline, C.A.; Marion, W.F.; MacAlpine, S.M.; Stein, J.; Toor, F.; Ayala, S. Bifacial PV Performance Models: Comparison and Field Results (No. NREL/PR-5K00-70463); National Renewable Energy Lab. (NREL): Golden, CO, USA, 2019. [Google Scholar]
- International Electrotechnical Commission (IEC). IEC TS 60904-1-2: Photovoltaic Devices—Part 1–2: Measurement of Current-Voltage Characteristics of Bifacial Photovoltaic (PV) Devices. 2019. Available online: https://webstore.iec.ch/preview/info_iects60904-1-2%7Bed1.0%7Den.pdf (accessed on 29 January 2021).
- Waters, M.; Deline, C.A.; Kemnitz, J.; Webber, J. Suggested Modifications for Bifacial Capacity Testing (No. NREL/CP-5K00-73982); National Renewable Energy Lab. (NREL): Golden, CO, USA, 2019. [Google Scholar]
- Park, D.; Kim, M.; So, W.; Oh, S.-Y.; Park, H.; Jang, S.; Park, S.-W.; Kim, W.K. Evaluation of bifacial Si solar module with different albedo conditions. Curr. Photovolt. Res. 2018, 6, 62–67. [Google Scholar]
- Devine, M.; Baring-Gould, E.I. Alaska Village Electric Load Calculator; National Renewable Energy Lab.: Golden, CO, USA, 2004. [Google Scholar]
Figure 1.
The solar photovoltaic (PV) bifacial test site on the campus of the University of Alaska Fairbanks at 64° N.
Figure 1.
The solar photovoltaic (PV) bifacial test site on the campus of the University of Alaska Fairbanks at 64° N.

Figure 2.
Global horizontal insolation for the time period discussed in this paper as measured by a Hukseflux SR-30 pyranometer at the site.
Figure 2.
Global horizontal insolation for the time period discussed in this paper as measured by a Hukseflux SR-30 pyranometer at the site.

Figure 3.
The normalized monthly energy output of each south-facing PV module with the bifacial gain written above the monthly columns.
Figure 3.
The normalized monthly energy output of each south-facing PV module with the bifacial gain written above the monthly columns.

Figure 4.
The daily average albedo for the study period when the solar elevation was greater than 5°. It should be noted that between 20 September 2019 and 1 July 2020 (shown with the two black vertical lines), the albedometer was located in an agricultural field adjacent to the solar test site to minimize horizon obstructions.

Figure 5.
Bifacial gain calculated using Equation (2), the rear irradiance ratio (Qrear fraction) calculated using Equation (4), and the average monthly albedo.
Figure 5.
Bifacial gain calculated using Equation (2), the rear irradiance ratio (Qrear fraction) calculated using Equation (4), and the average monthly albedo.

Figure 6.
Calculated energy loss from clipping from one south-facing bifacial module.

Figure 7.
Plane-of-array (POA) irradiance and south-facing bifacial module temperature are shown over time. The data points that correspond to the time of inverter clipping are highlighted in red.
Figure 7.
Plane-of-array (POA) irradiance and south-facing bifacial module temperature are shown over time. The data points that correspond to the time of inverter clipping are highlighted in red.

Figure 8.
Scatter plots show the relationship between the power output, POA irradiance, and total irradiance calculated using Equation (3), as well as the module temperature.
Figure 8.
Scatter plots show the relationship between the power output, POA irradiance, and total irradiance calculated using Equation (3), as well as the module temperature.

Figure 9.
The relationship between the minimum total irradiance value where clipping occurred at each temperature is shown along with a line of best fit. Values that fall above the line would be clipped at a 290 W output by the inverters.
Figure 9.
The relationship between the minimum total irradiance value where clipping occurred at each temperature is shown along with a line of best fit. Values that fall above the line would be clipped at a 290 W output by the inverters.

Figure 10.
The normalized monthly energy production of the south-facing bifacial PV modules and the vertical east-west PV modules with the monthly vertical production gain (or loss) relative to the south-facing modules written above the monthly columns.
Figure 10.
The normalized monthly energy production of the south-facing bifacial PV modules and the vertical east-west PV modules with the monthly vertical production gain (or loss) relative to the south-facing modules written above the monthly columns.

Figure 11.
The average hourly production for south-facing bifacial PV modules and vertical east-west facing bifacial modules is shown for each month of the study period in Alaska Standard Time.
Figure 11.
The average hourly production for south-facing bifacial PV modules and vertical east-west facing bifacial modules is shown for each month of the study period in Alaska Standard Time.

Figure 12.
A load profile for a Rural Alaska community is scaled to 100 kW max load and shown along with June production profiles scaled to never exceed the load for south-facing bifacial, east-west vertical bifacial, and a combination of these orientations.
Figure 12.
A load profile for a Rural Alaska community is scaled to 100 kW max load and shown along with June production profiles scaled to never exceed the load for south-facing bifacial, east-west vertical bifacial, and a combination of these orientations.

Figure 13.
One year of cumulative energy production data are shown for each PV module included in this study. Unlike the graphs above, this graph includes winter data, when the snow on the modules affected performance.
Figure 13.
One year of cumulative energy production data are shown for each PV module included in this study. Unlike the graphs above, this graph includes winter data, when the snow on the modules affected performance.


Table 1.
Module factory rated specifications.
| Description | Model | Isc | Voc | Imp | Vmp | Pmp * |
|---|---|---|---|---|---|---|
| Bifacial Module | Sunpreme Maxima GxB-310 | 9.4 A | 45.9 V | 8.8 A | 35.2 V | 310 W |
| Monofacial Module | Suniva OPT270-60-4-1B0 | 9.18 A | 38.4 V | 8.70 A | 31.0 V | 270 W |
* Factory Pmp values are different from actual Pmp values which were obtained through flash testing, as shown in Table 2.
Table 2.
Flash test results for the front side maximum power output (Pmp) at standard test conditions for the PV modules included in this study.
Table 2.
Flash test results for the front side maximum power output (Pmp) at standard test conditions for the PV modules included in this study.
| Module Name | Description | Front Side Flash Test Pmp (W) |
|---|---|---|
| W90B1 | West-facing vertical bifacial | 286 |
| E90B1 | East-facing vertical bifacial | 289 |
| S60B1 | South-facing 60° tilt bifacial #1 | 286 |
| S60B2 | South-facing 60° tilt bifacial #2 | 290 |
| S60M1 | South-facing 60° tilt monofacial #1 | 251 |
| S60M2 | South-facing 60° tilt monofacial #2 | 251 |
Table 3.
The total number of minutes during which clipping was suspected of occurring for each module as well as the number of days that clipping occurred during the study period. For reference, the data set used in this analysis included 408 days and 587,524 min of data.
Table 3.
The total number of minutes during which clipping was suspected of occurring for each module as well as the number of days that clipping occurred during the study period. For reference, the data set used in this analysis included 408 days and 587,524 min of data.
| Clipping Occurrences | W90B1 | E90B1 | S60B1 | S60B2 | S60M1 | S60M2 |
|---|---|---|---|---|---|---|
| Number of minutes that clipping occurred | 36 | 34 | 5220 | 5564 | 5 | 117 |
| Number of days that experienced clipping | 8 | 9 | 127 | 128 | 2 | 3 |
Publisher’s Note: MDPI stays neutral with regard to jurisdictional claims in published maps and institutional affiliations. |
© 2021 by the authors. Licensee MDPI, Basel, Switzerland. This article is an open access article distributed under the terms and conditions of the Creative Commons Attribution (CC BY) license (http://creativecommons.org/licenses/by/4.0/).
Share and Cite
MDPI and ACS Style
Pike, C.; Whitney, E.; Wilber, M.; Stein, J.S. Field Performance of South-Facing and East-West Facing Bifacial Modules in the Arctic. Energies 2021, 14, 1210. https://0-doi-org.brum.beds.ac.uk/10.3390/en14041210
AMA Style
Pike C, Whitney E, Wilber M, Stein JS. Field Performance of South-Facing and East-West Facing Bifacial Modules in the Arctic. Energies. 2021; 14(4):1210. https://0-doi-org.brum.beds.ac.uk/10.3390/en14041210
Chicago/Turabian StylePike, Christopher, Erin Whitney, Michelle Wilber, and Joshua S. Stein. 2021. "Field Performance of South-Facing and East-West Facing Bifacial Modules in the Arctic" Energies 14, no. 4: 1210. https://0-doi-org.brum.beds.ac.uk/10.3390/en14041210
Note that from the first issue of 2016, this journal uses article numbers instead of page numbers. See further details here.