
Substantiation of Loading Hub Location for Electric Cargo Bikes Servicing City Areas with Restricted Traffic †


Faculty of Civil Engineering, Cracow University of Technology, Warszawska 24, 31155 Krakow, Poland
†
The present work is the extended version of the paper “Choosing the localisation of loading points for the cargo bicycles system in the Krakow Old Town” presented at RelStat 2018 Conference, Riga, Lavia, 17–20 October 2018; and published in Lecture Notes in Networks and Systems.
Energies 2021, 14(4), 839; https://0-doi-org.brum.beds.ac.uk/10.3390/en14040839
Submission received: 5 January 2021
/
Revised: 24 January 2021
/
Accepted: 2 February 2021
/
Published: 5 February 2021
(This article belongs to the Special Issue Smart Energy and Intelligent Transportation Systems)
Abstract
:Electric cargo bicycles have become a popular mode of transport for last-mile goods deliveries under conditions of restricted traffic in urban areas. The indispensable elements of the cargo bike delivery systems are loading hubs: they serve as intermediate points between vans and bikes ensuring loading, storage, and e-vehicle charging operations. The choice of the loading hub location is one of the basic problems to be solved when designing city logistics systems that presume the use of electric bicycles. The paper proposes an approach to justifying the location of a loading hub based on computer simulations of the delivery process in the closed urban area under the condition of stochastic demand for transport services. The developed mathematical model considers consignees and loading hubs as vertices in the graph representing the transport network. A single request for transport services is described based on the set of numeric parameters, among which the most significant are the size of the consignment, its dimensions, and the time interval between the current and the previous requests for deliveries. The software implementation of the developed model in Python programming language was used to simulate the process of goods delivery by e-bikes for two cases—the synthetically generated rectangular network and the real-world case of the Old Town district in Krakow, Poland. The loading hub location was substantiated based on the simulation results from a set of alternative locations by using the minimum of the total transport work as the efficiency criterion. The obtained results differ from the loading hub locations chosen with the use of classical rectilinear and center-of-gravity methods to solve a simple facility location problem.
1. Introduction
The growth of e-commerce during the last decade is one of the main reasons for the exponentially increased demand for last-mile deliveries that are characterized by cargo diversity and low utilization of vehicles’ capacity. Commercial vehicles delivering the packages directly to customers may significantly contribute to the increase of traffic in urban areas. Especially, this concerns the central city areas with historic buildings and low capacity of the roads: commercial vehicles are the main source of noise and air pollution in such areas, they cause congestions and reduce the public space. For these reasons, nowadays, the restriction of traffic in the selected districts is provided in many cities: the motorized vehicles may enter the area only during the specified time window (usually these are night or early-morning hours). Such restrictions, however, negatively influence the businesses located in the areas with restricted traffic by increasing the storage costs and causing the loss of profit due to the lack of goods at the given time moment. In such a situation, cargo distribution systems based on cargo bikes could be considered as the alternative to conventional last-mile deliveries by motorized vehicles.
Loading hubs are necessary elements of the urban distribution system based on cargo bicycles: loads are transported by vans to the storage point located at the bound of the area with restricted traffic and after are delivered to consignees. As examples of such hubs, the following real-world implementations may be listed: a trailer or a semi-trailer, a cargo container unit used as a mobile point, the dedicated transshipment bay, a parcel locker, or a storage space having the character of a permanent loading point. As the core function of the loading hubs, besides the transshipment operations and short-term storage, the e-bikes charging operations should be mentioned.
Both from practical and theoretical points of view, choosing the loading hub location constitutes a significant problem. Practically, such alternative locations should be found that satisfy the legislative restrictions and are characterized by availability for conventional transport and e-bikes. Then, theoretically, by applying a chosen methodology, such the hub location should be distinguished from the set of alternative variants that guarantees the most effective operation of the distribution system.
The current study presents the novel simulation-based methodology to choose the location of a loading hub for a cargo bicycle system given the set of alternative locations. The developed approach, unlike the existing simulation-based methods, considers stochasticity of demand for deliveries in the selected urban area as well as allows the implementation of the routing procedures as part of the technology of goods delivering by electric cargo bikes.
The paper has the following structure: The second part presents a brief review of recent publications related to the research problem; the proposed methodology to substantiate the loading hub location for a cargo bikes delivery system is described in the third part; the fourth part contains the introductive description of software implementing the developed model; the fifth section introduces case studies of choosing the loading point location for a synthetic rectangular network and the cargo bikes delivery system in the Old Town district of Krakow, Poland; the last part offers brief conclusions and directions of future research.
2. Literature Review
Many recent studies underline the advantages of cargo bicycles as the sustainable mean of transport under urban conditions [1,2,3]. The author of the paper [4] concludes that the use of cargo bikes contributes to the reduction of traffic congestion and the improvement of air quality. According to the publication [5], both operational and external transport costs can be reduced if the delivery scheme with transshipment hubs and cargo bikes is used for the distribution of e-commerce goods in Antwerp (Belgium). The authors of the research [6] point out that the use of electric cargo bikes in urban logistics activities in Porto (Portugal) reach up to 25% of reductions in external costs. Numeric results regarding the decrease of CO2 emissions due to the use of bicycles for cargo deliveries also show the significant impact: According to [6], CO2 emissions can be reduced by up to 73%, while the authors of the research [7] state that the use of electrically assisted cargo tricycles results in the CO2 emissions decrease by 54% per parcel delivered. Authors of the publication [6] also conclude that cargo bikes can replace up to 10% of the conventional vans without changing the overall network efficiency. The study [8] shows that the expected travel time for delivery distances up to 20 km is on average just 6 min longer if cargo bikes are used instead of traditional vans.
The transport of loads by bikes also has many limitations related to the delivery distance, the consignment size, the vehicles’ speed, and the safety of the goods. However, these limitations are not subject to the case of deliveries under the urban conditions when electrically powered bicycles are used: Delivery distances are relatively short, the e-bike’s capacity is comparable with the capacity of light commercial vehicles, the speed of conventional vans does not exceed the average e-bikes’ speed due to road traffic restrictions, and the freight is protected from the weather conditions when the bikes with the covered bins are used.
The contemporary scientific literature describes the set of operational problems to be solved while designing the e-bike delivery system in an urban area: vehicle routing [9,10,11], synchronization of bikes with conventional vans [12], choice of vehicle type [10,13], vehicles scheduling [14,15], shaping the recharging strategy [15,16,17], etc. However, the most significant practical and theoretical issue when setting up the regional e-bike delivery system is the substantiation of the transshipment hub(s) parameters, including the type and location of the hub(s).
As it pointed out in the study [13], contemporary knowledge about planning urban transshipment points is very limited. Substantiation of the loading hub location refers to the branch of the operations research known as the facility location problem (FLP) [18]. The simplest version of FLP (the Weber problem) assumes the choice of a single facility location for the given set of customers’ locations. For the multiple hub locations, the FLP becomes NP-hard and is usually solved by using different approximation algorithms that find the solution within a reasonable computational time. In real-world applications of FLP, the uncertainty of demand for deliveries, as well as the stochastic parameters of the servicing process and resource restrictions, should be considered [19,20,21,22,23]; it significantly complicates the process of searching for a reliable solution.
To solve FLP, various approaches are used by scholars and practitioners. The most popular mathematical apparatus for substantiation of the loading hubs location is the mixed-integer linear programming [9,14,15,21,24], although the fuzzy-logic-based models are used as well [17,25]. Another direction for finding the solution of FLP is the simulation-based approaches [5,8,19,26]: The delivery and servicing processes are simulated for a set of alternative locations and the best option is being substantiated based on the simulation results. The simulation-based approaches assume that the adequate model of the transport system is developed as the base for simulations. The model is used to run multiple simulations of the transport system to consider the overall influence of random parameters on the simulations’ results and to evaluate statistically significant values of the efficiency criteria. The authors of the study [27] use the robust optimization approach to alleviate the impact of uncertainty on obtained solutions.
Different heuristics are used to obtain the solution for FLP. The authors of the paper [28], to place bicycle stations in a way that minimizes the distance between clients and the closest bike station in Malaga (Spain), have studied the comparative advantages of the following algorithms: genetic algorithm, iterated local search, particle swarm optimization, simulated annealing, and variable neighborhood search. Genetic algorithms (GA) are quite a popular heuristic for solving FLP: e.g., the optimal location and size of charging stations are substantiated based on the developed GA in the study [17], the location of a transshipment hub is being chosen based on the proposed GA in the paper [29] considering the vehicle routing problem in the multistage distribution system.
Although the contemporary literature proposes a variety of methods to substantiate the loading hub location, it should be mentioned that existing approaches are usually case-study-sensitive and allow solving the problem for the specific situation or the given initial data. Considering the presented literature review, the following research gaps should be filled by the proposed simulation-based approach:
- the demand for deliveries is presented by deterministic parameters: the stochastic nature of the demand for transport services should be considered, that may be achieved by implementing the demand simulation procedure within the model of a distribution system;
- the technological procedures are not considered in detail: the result of some servicing operations (such as vehicle routing or loads scheduling) depend on the demand parameters; conventional linear programming models cannot consider this; however, the corresponding procedures may be implemented within the simulation models.
3. Simulation-Based Methodology for the Substantiation of a Loading Hub Location
As the basis for estimating the alternative location of the loading hub, the simulation model of the transportation system is proposed to be used. Such model simulates demand for transport services, as well as the technological processes: handling and charging operations in loading hubs, delivery of consignments to consignees located in the serviced area, as well as loading and unloading operations at customers’ locations and in a hub. To run the model, its proper program implementation should be developed. Based on the simulation results and considered efficiency criteria, the expediency of the loading hub locations is estimated.
The process of goods delivery by electric bikes is implemented within the logistic system of the considered urban area. As basic structural elements of this system, the following subsystems should be listed:
- the transport network of the selected urban area where the processes of goods delivery take place;
- demand for the supply of goods reflecting the customers’ needs for deliveries;
- the subsystem serving the transport demand that includes means of transport (cargo bicycles) and loading hubs.
Thus, the mathematical model of the delivery system in a general form can be presented as the tuple of three above listed elements:
where is the transport network; is demand for transport services; is the servicing subsystem.
3.1. Transport Network Model
The most commonly used approach to modeling transport networks is the use of mathematical structures based on graph models. The transport network can be formalized as a pair of subsets—the nodes and the edges:
where is the i-th node being the element of the network nodes set ; is the j-th edge being the element of the network edges set .
In the proposed mathematical model, as the nodes of the network, the locations of potential customers of transport services are presented, while the edges (links) are used to reflect the relevant sections of the road network connecting the nodes. Locations of the loading hubs, from which the cargoes are delivered by bikes, can be also represented as the network vertices. Additionally, for the more detailed networks, the nodes can be used to model the road intersections.
The basic characteristics of a node are its geographical coordinates and lists of ingoing and outgoing edges:
where x and y are the coordinates characterizing the node location (latitude and longitude may be used as such coordinates); and are the sets of ingoing and outgoing edges for the given node , .
The obligatory set of parameters describing the graph edge includes its weight and end vertices:
where w is the edge weight (e.g., the length of the corresponding road section, the travel time, the transport costs, etc.); and are the beginning and the ending nodes of the edge: , .
Note that in a more advanced version of the network model, the set of node and edge parameters could be extended depending on the problem being solved.
3.2. Model of Demand for Goods Delivery
The core unit shaping transport demand is a request for the delivery of goods understood as the customer’s need for services, supported by his purchasing ability, and presented on the market to be satisfied. A set of requests for the services of a given company forms the demand for the services of a transport enterprise. Each request could be quantified based on a set of numerical parameters.
In the general form, the demand model for goods delivery can be presented as an ordered set of requests:
where is the i-th request in the flow: if , is the moment of appearance of the i-th request; is the number of requests in a flow.
A single request for delivery is characterized by the following parameters:
where and are the transport network nodes defining the location of a sender and a recipient: , ; is the time interval between the moments of appearance of the given and previous requests [min]; is the consignment weight [kg]; , , and are dimensions of the load unit—its length, width, and height [cm].
In the Equation (6), the time interval characterizes the intensity of the demand for deliveries for the given consignor: the more the value of the interval, the less intense the demand for transport services.
For a flow of requests with a finite number of elements, the subsetting of requests by sender and recipient can be presented in the form of a travel matrix . An element of such the matrix reflects the number of requests for which the sender is located in the node (origin node), while the recipient—in the node (destination node).
For a single request, its numerical parameters are deterministic, but for the requests flow, these parameters are random, and can be described by stochastic variables. It follows that the demand model for cargo transport can be presented as a set of random variables characterizing the numerical parameters of requests for cargo deliveries supported by the origin-destination matrix defining spatial distribution of the requests:
where is a random variable characterizing some numeric parameter x of demand for cargo deliveries.
Given the set of ordered requests for the cargo deliveries characterize the demand, the task of demand modeling can be presented as the task of generating numerical parameters of the requests in a flow. Implementation of the demand model as a flow of N elements is a set of requests in the form (5), where numerical parameters are values from samples, generated for the respective random variables, and the locations of senders and recipients are defined by the matrix .
3.3. Model of the Servicing Subsystem
Basic components of the servicing subsystem are the fleet of vehicles (cargo bicycles) and a set of loading hubs:
where is the i-th cargo bicycle being the element of the vehicles fleet ; is the -th loading hub being the element of all the loading hubs’ set (in case, when the single hub location problem is solved, the set contains just one element).
The basic parameters of cargo bikes as elements of the servicing system are their load capacity, dimensions of the cargo space, and technical speed:
where is the load capacity of a cargo bicycle [kg]; is the average technical speed of a cargo bicycle [km/h] (the technical speed may be also considered as a random variable); , , and are dimensions of the bicycle cargo space—its length, width, and height [cm].
Note that the battery capacity may be considered as the key parameter for electric bikes, if it is used as the restriction in the problem being solved or if it is needed for the estimation of the resulting efficiency criteria. The dimensions of the loading space are considered in the model as the additional restriction to the load capacity (these parameters may be used if the solution of the knapsack problem is being considered in the procedure implementing the loading operations).
Loading hubs within the frame of the proposed model are short-term (temporary) storage points to which cargo is transported by other means of transport (usually—by delivery vans) to deliver them to the final recipient. The basic characteristics of loading hubs are their location and capacity:
where is the node of the transport network representing the location of the loading hub, ; is the loading hub capacity (possible maximum amount of cargo that can be stored at the hub) [t or m3].
3.4. Shaping the Routes for Delivery of Cargoes by Electric Bikes
In most cases, the deliveries of goods by bicycles are carried out under conditions of combined consignments: By aiming the minimization of the total distance, the delivery routes are being formed for the requests that are received during the considered time window (in such situations, the total weight of the combined consignment should not exceed the vehicle’s capacity). Assuming that servicing companies behave rationally and shape rational (or optimal) delivery routes while servicing the clients, the simulation model should approximate the real-world behavior of transport operators, and thus—it should contain the implementation of routing procedures.
As input data in the routing algorithms, the matrix of the shortest distances between the vertices of the transport network is used. To estimate such matrix, any known method of searching for the shortest paths should be used (e.g., Dijkstra algorithm or Floyd–Warshall algorithm [30]). For the generated flow of requests, the task of shaping the delivery routes is solved as the traveling salesman problem (TSP), where the location of the load sender (the parameter ) is defined as the location of a loading hub, and locations of recipients (the parameter )—as the locations of the corresponding nodes in the transport network model. Known heuristic methods can be used for solving the TSP (e.g., Clarke–Wright algorithm, simulated annealing method, methods based on genetic algorithms, ant colony optimization methods, etc. [31]). The result of the routing procedure is a set of delivery routes, being the ordered sets of vertices of the graph representing the network model. The first and last element in the set of nodes shaping the route are the vertices defining the location of a loading hub.
The basic characteristics of delivery routes, calculated based on given parameters of the mathematical model, are the route length (total distance covered), the total weight of transported cargo, and the total transport work. These technological characteristics may be considered as key indicators to estimate the efficiency of the routing procedures, as well as the efficiency of the delivery system for alternative facility locations.
Note that time windows may be added to the model as additional restrictions: for each consignor, the time window when a parcel should be delivered may be considered. More advanced optimization techniques should be used within the routing procedure in this case, as far as the solution for the capacitated vehicle routing problem with time windows should be found.
3.5. The Objective Function for the Hub Location Problem
Special scientific literature proposes various efficiency criteria for solving FLP. The most widely used criterion is total costs: In the research [5], the e-commerce distribution system based on cargo bikes and delivery points is assessed with total operational and external costs, the authors of the paper [9] propose to select cost-minimizing locations of parcel lockers for goods deliveries by cargo bikes, the study [15] uses total costs as the objective function to substantiate the location of recharging stations for electrical vehicles. However, some recently developed approaches define facility locations considering environmental pollution together with operational costs: The model developed in [10] uses the total costs and the environmental impacts to assess alternative configurations of urban consolidation centers, while the study [27] considers the combination of total costs and parameters of environmental pollution to select locations of refueling stations.
There are also other efficiency criteria mentioned in recent studies and used to substantiate the facility location. Authors of the publication [20] use total system travel time and total system net energy consumption for optimal positioning of dynamic wireless charging infrastructure for battery electric vehicles, while the minimization of the power loss in a distribution network is considered as the objective function in the study [17] when solving the problem of the charging stations location. The paper [24] proposes solving the multimodal capacitated hub location problem based on the profitability of alternative locations. The authors of the study [7] use the total distance traveled and the CO2 emissions per parcel delivered to substantiate the efficiency of an urban micro-consolidation center located in the delivery area where the deliveries are performed by electrically-assisted cargo tricycles and electric vans.
For solving the hub location problem based on the simulations of the delivery process, the minimization of total transport work can be used as the core objective function reflecting the technological operations performed within the logistic system of the considered urban area:
where is the node of the transport network that represents the loading hub location, , is the set of possible loading hub locations, ; is the number of delivery routes formed to service the transport demand in the considered city area; is the number of segments at the -th route, ; is the total weight carried by a vehicle at the j-th segment of the -th route [tons]; is the distance covered by a vehicle at the j-th segment of the -th route [km].
Note that represents the total transport work performed by a vehicle at the i-th delivery route.
The proposed objective function may be used for solving the multiple hub location problem as well. In such a case, the subsets of locations representing alternative solutions should be formed prior (if the number of available alternative locations n is greater than the number k of hubs to be located, then the number of subsets is equal to the number of possible combinations ), and the total transport work should be estimated for each of the combinations.
Criterion (11) is the resulting technological parameter that may be used as the base for the calculation of other indicators. The performed ton-kilometers estimated at the level of delivery routes can serve for evaluation of total costs, environmental pollution, and energy consumption for a heterogeneous fleet of vehicles (total transport work may also be used to estimate the values of these indicators for homogenous fleet).
4. Software Implementation
To implement simulation models of the systems of goods transport by cargo bikes, a library of core classes was created. The library has been developed by using the Python programming language (Version 3.9, Manufacturer–Python Software Foundation), and it is available in an open-source repository [32]. The structure of the library is presented in Figure 1.
The developed library contains the following core classes that are used to create a simulation model of the cargo bicycle transport system:
- Net class is used to implement the mathematical model of the transport network described in the previous section; this class contains lists of Node and Link elements defining the network configuration and the list of Consignment objects implementing the model of demand for transport services; the servicing system is implemented in the Net class as the lists of LoadPoint and CargoBike elements;
- Node and Link classes allow implementing the network vertices and edges as the models described by Equations (3) and (4);
- Consignment class is used to model requests for the delivery of goods; the sender and the consignee locations are defined within the given class as references to the appropriate Node objects of the transport network model;
- Route class allows implementing the program model of the delivery route; as far as the delivery route model can be defined only within a specific transport network, this class contains an object of the Net type being a reference to the network program model; the sequence of the route is defined as a list (ordered collection) of elements of the Consignment type; numeric parameters of the route (transport work, route length, total consignment weight) are calculated by methods implemented as properties of this class;
- CargoBike class is the program model of a cargo bicycle as the mean of transport used in the process of handling requests for the goods delivery;
- LoadPoint class is dedicated to developing program models of loading points; the point location is defined by the reference to the object of the Node type that represents the respective vertex of the transport network.
The Net class contains methods for generating demand as a flow of requests for the given random variables defining parameters of requests (consignment weight, the time interval between requests), the methods for calculating the shortest distance matrix based on the Floyd–Warshall and Dijkstra algorithm, as well as the methods for shaping delivery routes that implement the Clarke–Wright algorithm, the simulated annealing method, and the GA-based heuristic.
5. Case Studies and Discussion
The use of the proposed methodology of substantiating the loading hub location is presented for a synthetic transport network with two alternative locations and the real-world case study of the Old Town district in Krakow (Poland) with a set of feasible loading hub locations. The considered case studies represent examples of solving the FLP problem for a single facility.
5.1. Synthetic Network Example
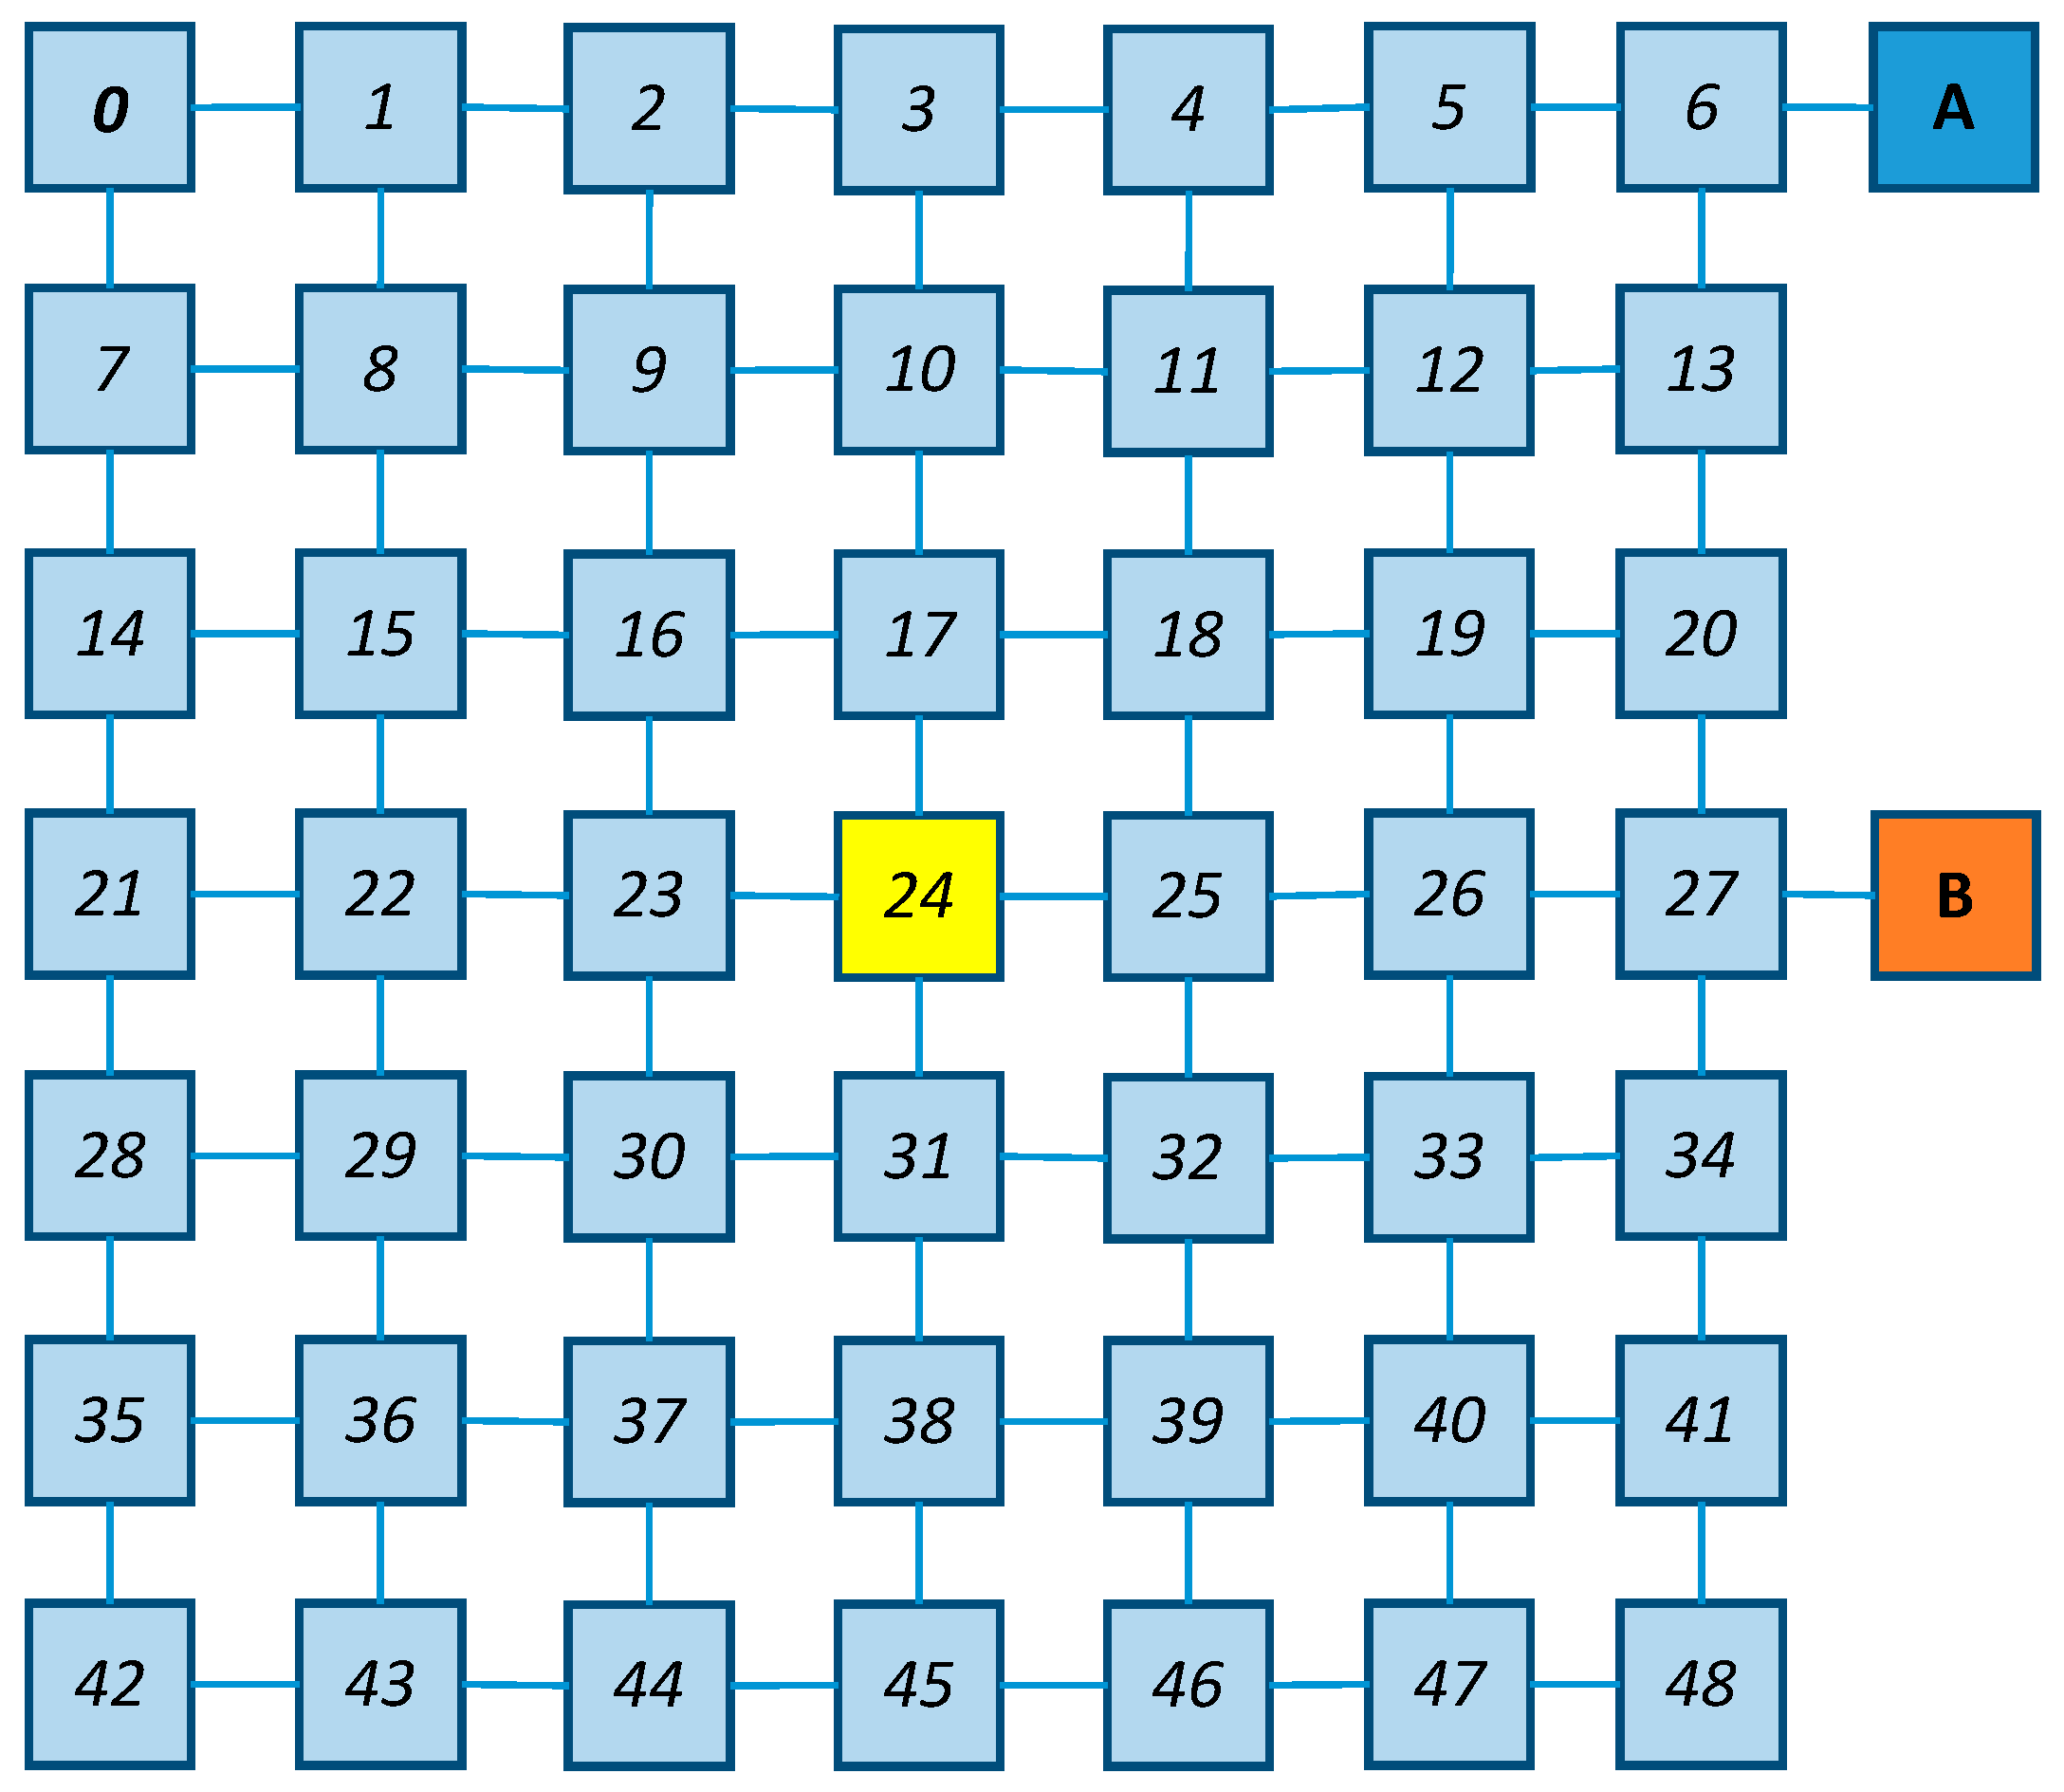
Let us consider the rectangular (square) transport network, where the nodes define the locations of clients. To generate such the network, the dedicated procedure is implemented within the class Net [32]: the method takes as arguments the size of the network (the side of the square in nodes) and the random variable representing the length of the network edges. The Figure 2 shows the configuration of the square network with the square side equal to 7 nodes.
As alternative locations of the loading hub, the nodes connected to the corner node (location A) and the mid-side node (location B) are considered. The hub nodes are connected to the network with the edge that has the weight generated based on the same random variable that was used for the network generation.
To choose the loading hub locations out of two alternatives, the following simulation experiment was conducted:
- for each alternative location, 100 runs of the simulation model representing the delivery system were made,
- the distance between adjacent network vertices was generated as the random variable uniformly distributed between 50 and 200 m,
- the weight of shipments was generated as the normally distributed random variable with the average value of 30 kg and standard deviation of 5 kg,
- the probability of the request appearance (the probability that a client located in the given node has a request for goods delivery) is set equal to 0.5,
- total transport work at each launch of the simulation model was measured as the sum of ton-kilometers for all delivery routes obtained based on the Clarke–Wright heuristic (capacity of vehicles was set to 150 kg).
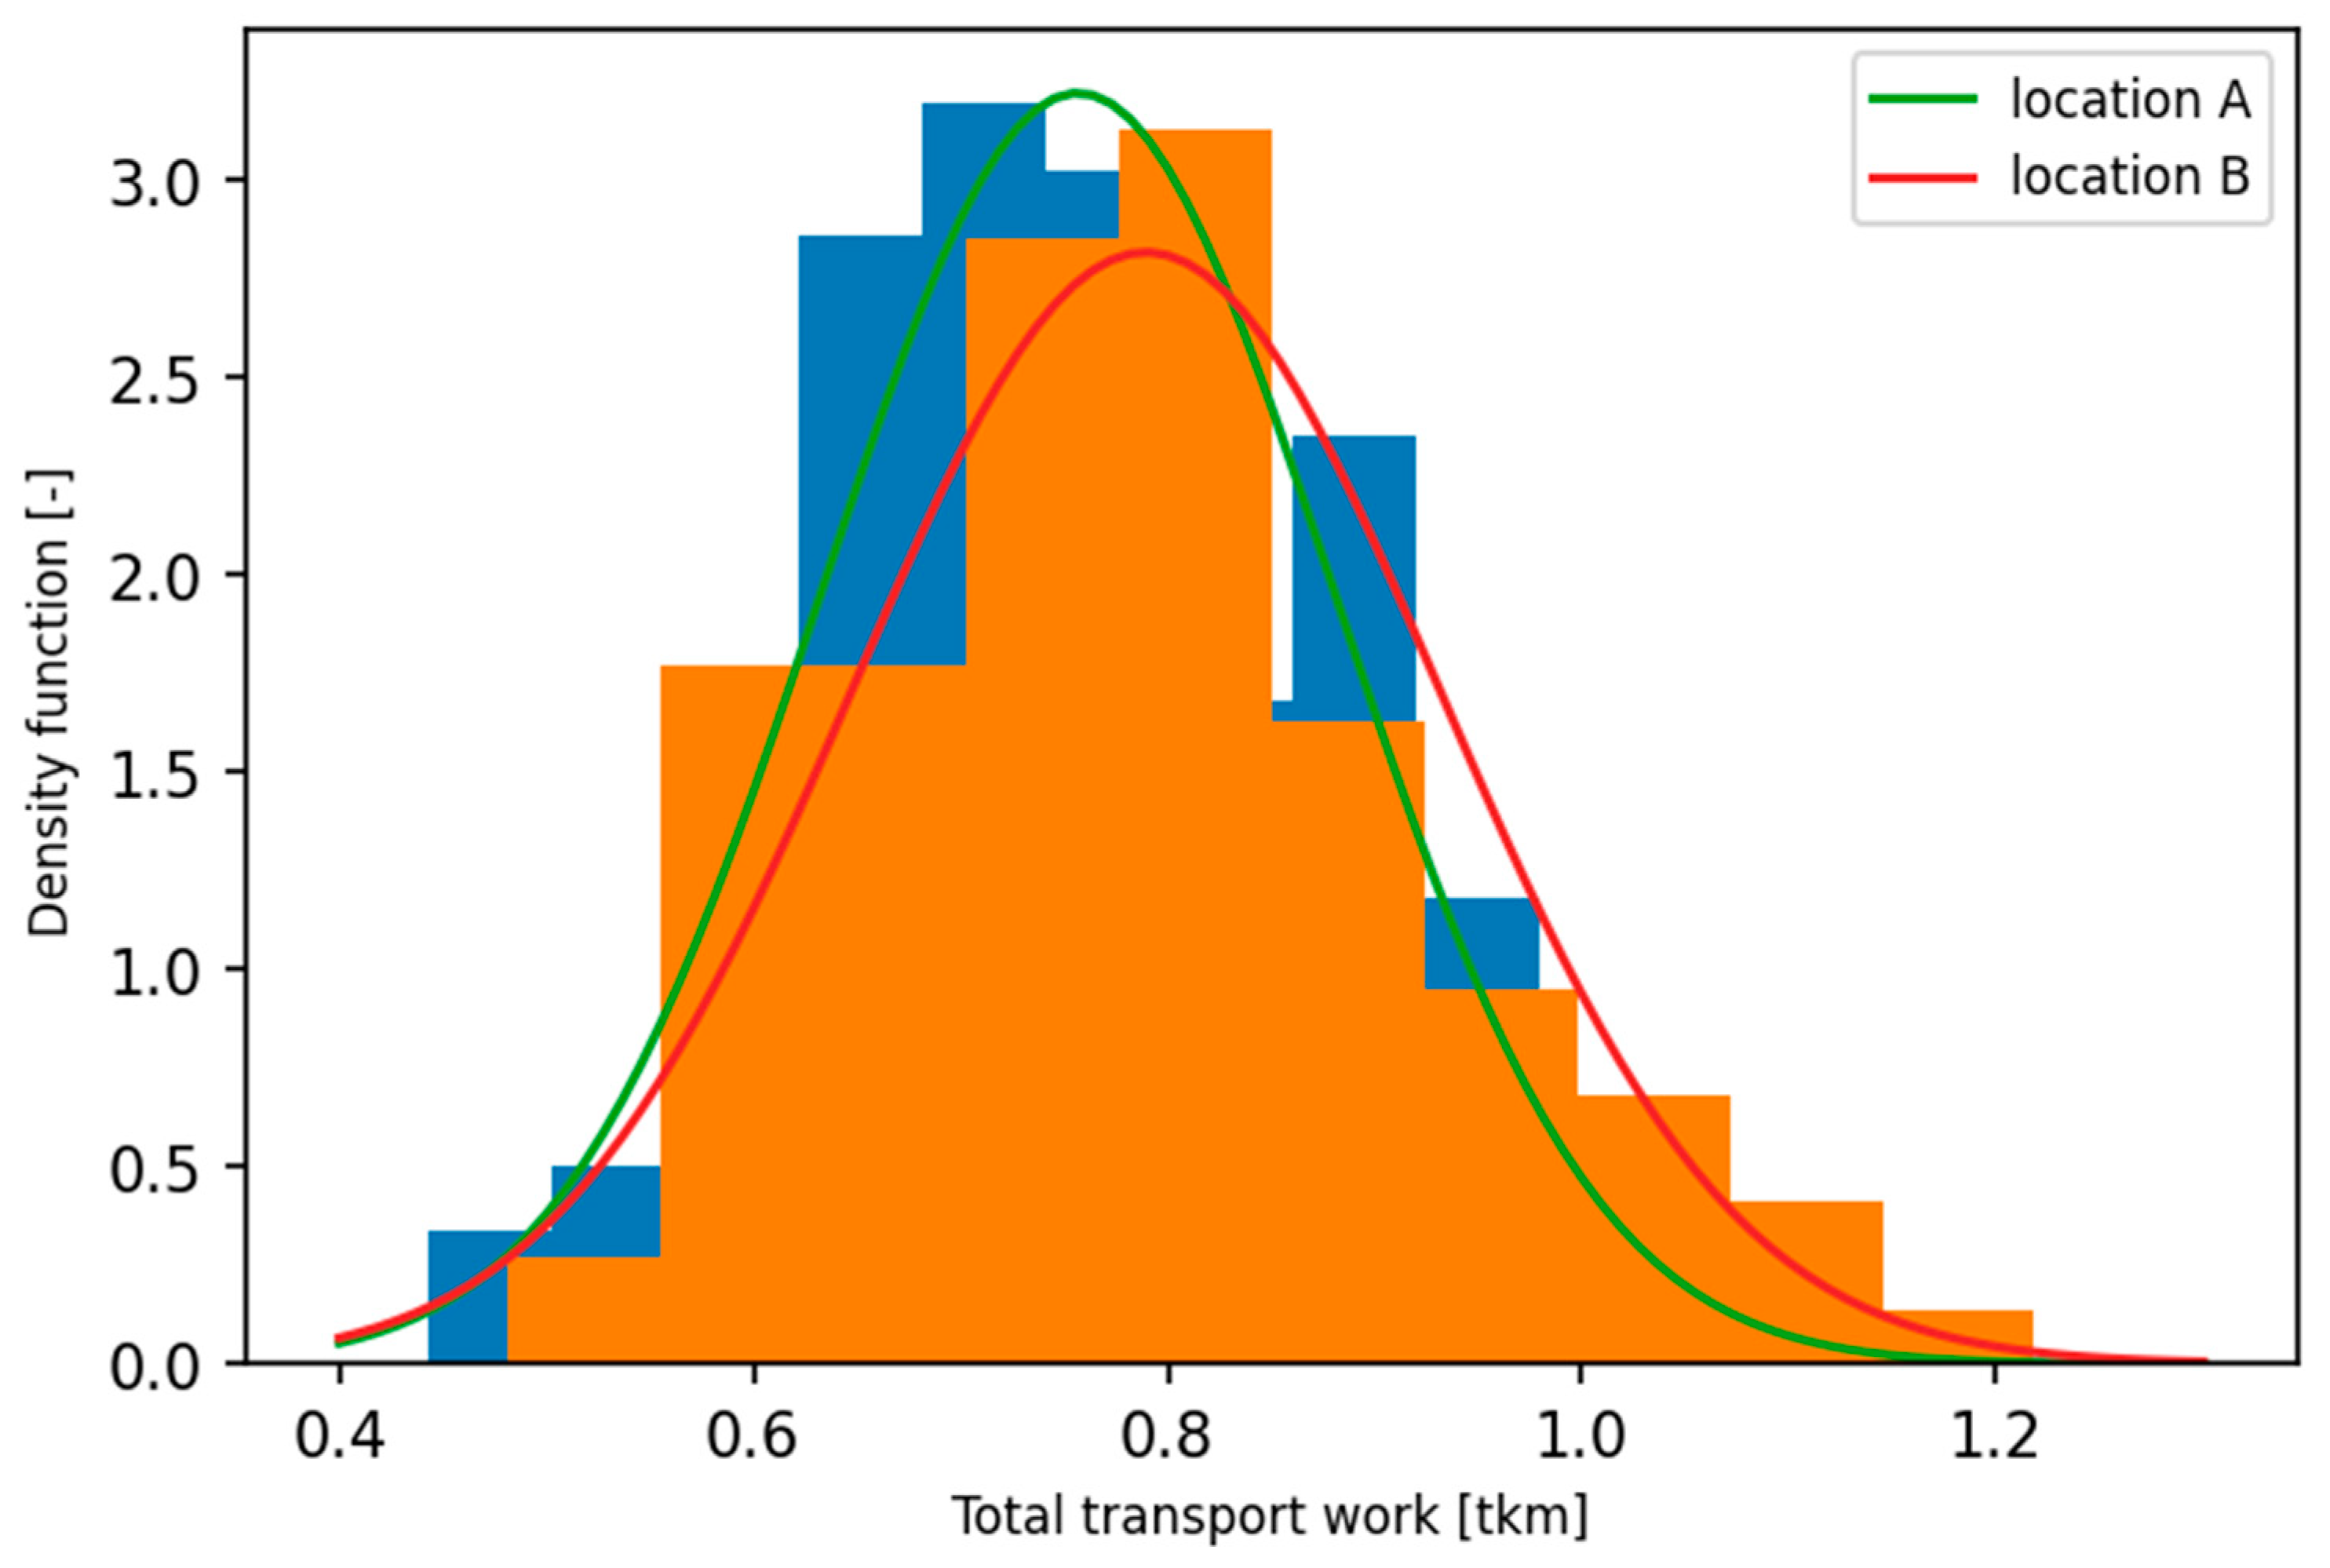
The results of the computer simulations are shown in Figure 3 as the distributions of random variables representing the total transport work conducted for each of the alternative variants of a loading hub location. The normal distribution of the random variables for both locations is confirmed with the Kolmogorov–Smirnov test for the probability of confidence equal to 0.95.
The obtained results of simulations show that the average total transport work for location A (0.757 tkm) is lower than the average value of this indicator for location B (0.789 tkm). On this basis, it can be concluded that the location of the loading hub in the corner of the rectangular network allows reducing the total transport work compared to the option of locating the hub in the middle of the rectangle side. However, it should be noted that such configurations of the network sections length and the parameters of demand are possible when the corner location of the transshipment point is characterized by a greater value of the objective function (in the conducted experiment, the 46 largest values of transport work for location A are greater than the corresponding lowest values of the objective function for location B).
A sufficient number of observations was evaluated for each of the experiment series based on the normal distribution of the objective function. For the significance level equal to 0.05, the sufficient number of the model runs is 29 for the series with location A and 35 for the series where a loading hub is located in node B. As the number of completed runs of the simulation model is bigger than the sufficient number of observations, it can be stated that the obtained results are statistically significant for the considered level of significance (the corresponding probability of confidence equal to 0.95).
The solution for the single-facility location problem obtained based on the rectilinear location model [18] for the considered example is the node located in the center of the network (that is node 24 highlighted at the net presented in Figure 2). Accordingly, when choosing between locations A and B, the node located closer to the center of the network would be a more preferable alternative (evidently, that is node B). As we can see, the solution obtained based on the proposed methodology differs from the conventional approach. This result may be explained by the effect of the routing procedures considered in the simulation model.
5.2. Kraków Old Town Case
The Old Town district of Krakow is the area with restricted traffic: only 3 streets of this district are not closed for motorized vehicles. At the same time, Krakow Old Town is the main touristic attraction of the region, where hundreds of restaurants, shops, and other touristic objects are located (locations of 730 commercial enterprises out of 954 objects registered in Google Maps are shown in Figure 4).
As far as the district is closed for heavy vehicles, the supply of the objects located in the district is allowed in the morning from 8 p.m. to 9.30 a.m. under the condition that only light good vehicles with the carrying capacity not exceeding 1.5 tons deliver the goods. Such restrictions lead to the increase of logistics expenses due to additional storage costs and the lack of the ability to implement on-time deliveries. The use of cargo bicycles is a solution that allows reducing logistics costs in this situation while preserving the tourist appeal of the district and low level of environmental pollution.
The location of a loading hub for the bikes delivery system in the Old Town of Krakow should be chosen from the set of alternative variants that satisfy the conditions of transport accessibility (both for conventional vehicles and cargo bicycles) and consider the architectural features of historic buildings in the district. The set of such alternative locations is presented in Table 1.
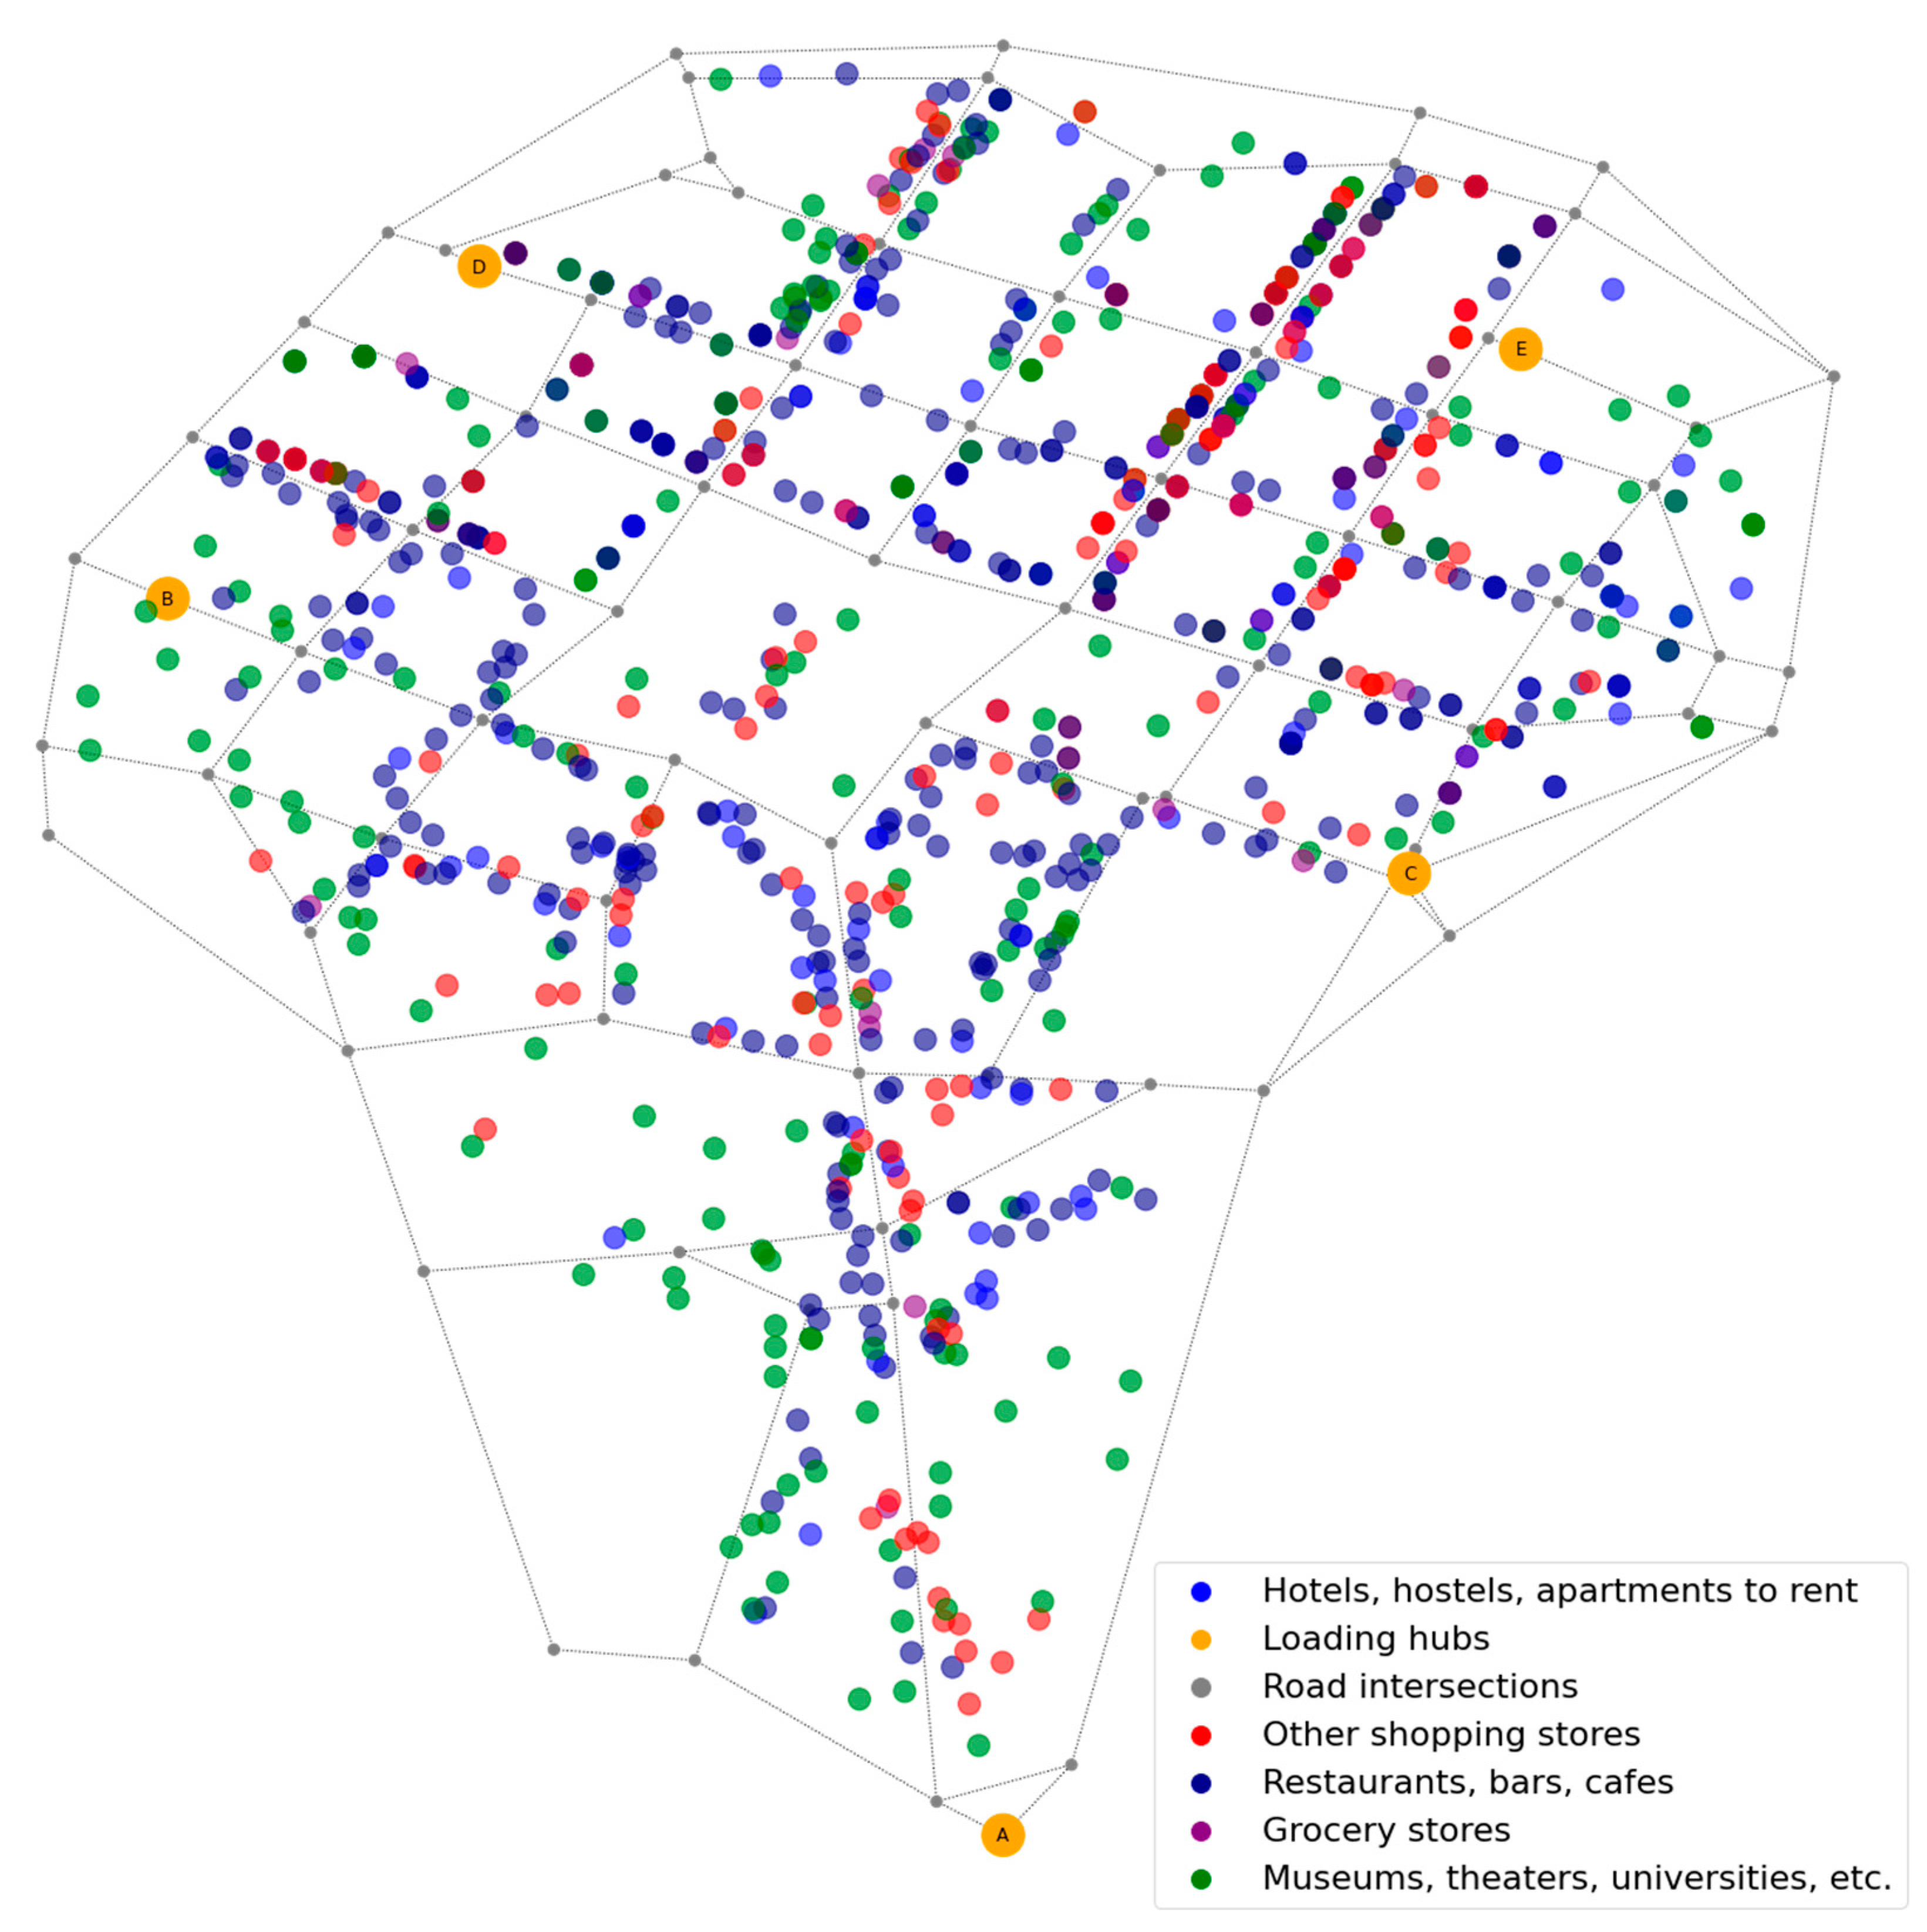
Using the developed software, the transport network model that considers roads available for bicycles was prepared for the district of the Krakow Old Town. Initial data for the network model (locations of the objects and intersections, the type of the objects) were obtained by the means of Google Maps API. Enterprises and non-commercial objects located in the Krakow Old Town (including hotels, shops, restaurants, cafés, museums, and theaters) and the set of alternative locations of a loading hub were considered as the nodes of the graph representing the network model. The graph of the obtained network model is presented in Figure 5.
To choose the best location of the loading hub, the Monte-Carlo simulations were performed based on the developed model. For each element of the considered set of possible hub locations, 30 runs of the following procedure were conducted:
- requests for goods delivery were generated for the set of the clients,
- the delivery routes were formed for the set of generated requests by using the Clarke–Wright algorithm,
- the total transport work was calculated for the obtained delivery routes.
For the demand simulation procedure, the probability of the request appearance was taken equal to 0.1 for each client and the random variable of the consignment weight was generated as the normally distributed variable with the average value equal to 30 kg and standard deviation equal to 5 kg.
As the result, the samples characterizing random variables of the total transport work were obtained for the alternative loading hub locations (distributions of the total ton-kilometers performed at the delivery routes are shown in Figure 6).
More detailed characteristics of the random variables representing the total transport work for the considered locations are presented in Table 2. To confirm that the obtained samples are big enough to make statistically significant conclusions, the sufficient number of observations was calculated for the level of significance equal to 0.05, assuming that the random variables representing the total transport work have a normal distribution. As it follows from the data presented in Table 2 (the number of performed observations is bigger than the corresponding sufficient number), the obtained results should be considered as statistically significant with the confidence probability equal to 0.95.
Based on the obtained results of computer simulations, locations C and E are the best options in the Krakow Old Town case, as they are characterized by the smallest mean value of the total transport work.
According to the center-of-gravity approach [18], for the set of potential clients located in the Old Town district of Krakow, the center of gravity is the point with coordinates (50.06178, 19.93846). Thus, based on the set of considered alternative locations, the solution of the single-facility location problem is the point closest to the center of gravity. The distances obtained from Google Maps (biking mode) and Euclidean distances between the gravity center and alternative hub locations are shown in Table 3.
As follows from the data presented in Table 3, both Euclidean and Google Maps distances to the gravity center are the smallest for location C, while location E is not the best alternative according to the conventional approach. Note that location A is evaluated as the worse possible option by the proposed methodology, as well as by the center-of-gravity approach.
The solution obtained by using the proposed simulation-based approach is superior to the one obtained based on the center-of-gravity approach: by choosing location E, we guarantee the minimum of the average total transport work (with 95% level of the probability of confidence), while by choosing location C, the minimum of the averaged values of the objective function cannot be guaranteed.
6. Conclusions
The proposed approach to the modeling of goods deliveries by cargo bicycles allows considering the stochastic nature of the demand for transport services and the used technology of the delivery process. The numerical parameters described in the mathematical model are the core characteristics, but the proposed model can be extended to be adapted for solving other optimization problems. Unlike the existing approaches, the proposed method allows taking into account the use of rational delivery routes, which increases the adequacy of the obtained results and the validity of the choice for the loading hub location problem. Since the main tool for choosing the loading hub location is the logistic system simulation, the proposed approach can be expanded by including other technological procedures in the program model in addition to routing.
By using the developed model and its software implementation, the problem of choosing the location for a loading point in the cargo bikes delivery system was solved for the Krakow Old Town district. It should be noted that the obtained results are preliminary: The detailed studies of demand and its simulation in the frame of the proposed model are needed for the real-world implementation of the system of goods delivery by cargo bicycles.
The use of the proposed approach in practice has the following implications:
- the chosen location of the transport hub will guarantee the minimum of total ton-kilometers performed by all e-bikes servicing the clients in the considered urban area; supposedly, the minimum of transport expenses will be achieved as well (for the homogenous fleet of vehicles);
- the stochastic nature of the demand for consignments delivery in the area will not affect the efficiency of the distribution system for chosen alternative location;
- the use of combined consignments will not deteriorate the resulting total transport work, as the rational behavior of the carriers regarding the used delivery routes is considered in the simulation model.
However, the use of the proposed methodology may have certain limitations placed upon its practical implementation:
- the parameters of demands should be studied prior for each group of potential clients located in the serviced area: for this, the surveys should be carried out aiming the estimation of the demand characteristics as stochastic variables; additionally, direct visual observations can be made for the selected clients to estimate the demand intensity (random variable of the time interval between requests in a flow);
- the method (or methods) of forming the delivery routes used by the carriers should be implemented within the simulation model: this limitation may be overcome directly if the carriers use a decision-support system that optimizes the delivery routes; otherwise, the behavior of the carriers should be studied to define the used routing strategies.
As the directions of further research on the developed methodology, the following topics should be mentioned:
- the development of the advanced procedures of demand simulations;
- the expansion of the model with algorithms of such technological operations as vehicle scheduling and stacking of load units in a bicycle cart;
- the study of the influence of different heuristics for solving the TSP problem on the simulation results for various parameters of demand for transport services;
- the consideration of additional restrictions related to the servicing subsystem, such as the number of available drivers and the drivers’ schedule.
Funding
This research was funded by European Union’s Horizon 2020 research and innovation program, grant agreement No. 769086 (CityChangerCargoBike project).
Institutional Review Board Statement
Not applicable.
Informed Consent Statement
Not applicable.
Data Availability Statement
The numeric results of the described simulations can be found at https://github.com/naumovvs/cargo-bikes-system.
Acknowledgments
The description of the developed model and the implemented software is reprinted by permission from Springer Nature Customers Service Center GmbH: Springer Lecture Notes in Networks and System, Choosing the localisation of loading points for the cargo bicycles system in the Krakow Old Town, Naumov V., Starczewski J. © 2019.
Conflicts of Interest
The author declares no conflict of interest.
References
- Tipagornwong, C.; Figliozzi, M. Analysis of competitiveness of freight tricycle delivery services in urban areas. Transp. Res. Rec. 2014, 2410, 76–84. [Google Scholar] [CrossRef] [Green Version]
- Schliwa, G.; Armitage, R.; Aziz, S.; Evans, J.; Rhoades, J. Sustainable city logistics–Making cargo cycles viable for urban freight transport. Res. Transp. Bus. Manag. 2015, 15, 50–57. [Google Scholar] [CrossRef] [Green Version]
- Rudolph, C.; Gruber, J. Cargo cycles in commercial transport: Potentials, constraints, and recommendations. Res. Transp. Bus. Manag. 2017, 24, 26–36. [Google Scholar] [CrossRef]
- Nürnberg, M. Analysis of using cargo bikes in urban logistics on the example of Stargard. Transp. Res. Procedia 2019, 39, 360–369. [Google Scholar] [CrossRef]
- Arnold, F.; Cardenas, I.; Sörensen, K.; Dewulf, W. Simulation of B2C e-commerce distribution in Antwerp using cargo bikes and delivery points. Eur. Transp. Res. Rev. 2018, 10, 2. [Google Scholar] [CrossRef]
- Melo, S.; Baptista, P. Evaluating the impacts of using cargo cycles on urban logistics: Integrating traffic, environmental and operational boundaries. Eur. Transp. Res. Rev. 2017, 9, 30. [Google Scholar] [CrossRef] [Green Version]
- Browne, M.; Allen, J.; Leonardi, J. Evaluating the use of an urban consolidation centre and electric vehicles in central London. IATSS Res. 2011, 35, 1–6. [Google Scholar] [CrossRef] [Green Version]
- Gruber, J.; Narayanan, S. Travel Time Differences between Cargo Cycles and Cars in Commercial Transport Operations. Transp. Res. Rec. 2019, 2673, 623–637. [Google Scholar] [CrossRef] [Green Version]
- Enthoven, D.L.J.U.; Jargalsaikhan, B.; Roodbergen, K.J.; uit het Broek, M.A.J.; Schrotenboer, A.H. The two-echelon vehicle routing problem with covering options: City logistics with cargo bikes and parcel lockers. Comput. Oper. Res. 2020, 118, 104919. [Google Scholar] [CrossRef]
- Simoni, M.D.; Bujanovic, P.; Boyles, S.D.; Kutanoglu, E. Urban consolidation solutions for parcel delivery considering location, fleet and route choice. Case Stud. Transp. Policy 2018, 6, 112–124. [Google Scholar] [CrossRef]
- Naumov, V.; Vasiutina, H.; Starczewski, J. Web planning tool for deliveries by cargo bicycles in Kraków Old Town. Adv. Intell. Syst. Comput. 2020, 1083, 90–98. [Google Scholar] [CrossRef]
- Anderluh, A.; Hemmelmayr, V.C.; Nolz, P.C. Synchronizing vans and cargo bikes in a city distribution network. Cent. Eur. J. Oper. Res. 2017, 25, 345–376. [Google Scholar] [CrossRef] [Green Version]
- Assmann, T.; Lang, S.; Müller, F.; Schenk, M. Impact assessment model for the implementation of cargo bike transshipment points in urban districts. Sustainability 2020, 12, 4082. [Google Scholar] [CrossRef]
- Alwesabi, Y.; Wang, Y.; Avalos, R.; Liu, Z. Electric bus scheduling under single depot dynamic wireless charging infrastructure planning. Energy 2020, 213, 118855. [Google Scholar] [CrossRef]
- Wang, I.-L.; Wang, Y.; Lin, P.-C. Optimal recharging strategies for electric vehicle fleets with duration constraints. Transp. Res. Part. C Emerg. Technol. 2016, 69, 242–254. [Google Scholar] [CrossRef]
- Xiao, D.; An, S.; Cai, H.; Wang, J.; Cai, H. An optimization model for electric vehicle charging infrastructure planning considering queuing behavior with finite queue length. J. Energy Storage 2020, 29, 101317. [Google Scholar] [CrossRef]
- Liu, G.; Kang, L.; Luan, Z.; Qiu, J.; Zheng, F. Charging station and power network planning for integrated electric vehicles (EVs). Energies 2019, 12, 2595. [Google Scholar] [CrossRef] [Green Version]
- Kasilingam, R.G. Logistics and Transportation; Springer Science: Berlin/Heidelberg, Germany, 1998; pp. 99–134. [Google Scholar]
- Kchaou-Boujelben, M.; Gicquel, C. Locating electric vehicle charging stations under uncertain battery energy status and power consumption. Comput. Ind. Eng. 2020, 149, 106752. [Google Scholar] [CrossRef]
- Ngo, H.; Kumar, A.; Mishra, S. Optimal positioning of dynamic wireless charging infrastructure in a road network for battery electric vehicles. Transp. Res. Part. D Transp. Environ. 2020, 85, 102385. [Google Scholar] [CrossRef]
- Gao, H.; Liu, K.; Peng, X.; Li, C. Optimal location of fast charging stations for mixed traffic of electric vehicles and gasoline vehicles subject to elastic demands. Energies 2020, 13, 1964. [Google Scholar] [CrossRef] [Green Version]
- Banerjee, S.; Kabir, M.M.; Khadem, N.K.; Chavis, C. Optimal locations for bikeshare stations: A new GIS based spatial approach. Transp. Res. Interdiscip. Perspect. 2020, 4, 100101. [Google Scholar] [CrossRef]
- Efthymiou, D.; Antoniou, C.; Tyrinopoulos, Y. Spatially aware model for optimal site selection. Transp. Res. Rec. 2012, 2276, 146–155. [Google Scholar] [CrossRef]
- Osorio-Mora, A.; Núñez-Cerda, F.; Gatica, G.; Linfati, R. Multimodal Capacitated Hub Location Problems with Multi-Commodities: An Application in Freight Transport. J. Adv. Transp. 2020, 2020, 2431763. [Google Scholar] [CrossRef] [Green Version]
- Rao, C.; Goh, M.; Zhao, Y.; Zheng, J. Location selection of city logistics centers under sustainability. Transp. Res. Part. D Transp. Environ. 2015, 36, 29–44. [Google Scholar] [CrossRef]
- Naumov, V.; Starczewski, J. Choosing the localisation of loading points for the cargo bicycles system in the Krakow Old Town. Lect. Notes Netw. Syst. 2019, 68, 353–362. [Google Scholar] [CrossRef]
- Tafakkori, K.; Bozorgi-Amiri, A.; Yousefi-Babadi, A. Sustainable generalized refueling station location problem under uncertainty. Sustain. Cities Soc. 2020, 63, 102497. [Google Scholar] [CrossRef]
- Cintrano, C.; Chicano, F.; Alba, E. Using metaheuristics for the location of bicycle stations. Expert Syst. Appl. 2020, 161, 113684. [Google Scholar] [CrossRef]
- Szczepański, E.; Jacyna-Gołda, I.; Murawski, J. Genetic algorithms-based approach for transhipment hub location in urban areas. Arch. Transp. 2014, 31, 73–83. [Google Scholar] [CrossRef]
- Simchi-Levi, D.; Chen, X.; Bramel, J. The Logic of Logistics: Theory, Algorithms, and Applications for Logistics Management; Springer: New York, NY, USA, 2014. [Google Scholar]
- Labadie, N.; Prins, C.; Prodhon, C. Metaheuristics for Vehicle Routing Problems; John Wiley & Sons Inc.: London, UK, 2016. [Google Scholar]
- Simulations of Goods Deliveries by Cargo Bicycles. Available online: https://github.com/naumovvs/cargo-bikes-system (accessed on 30 December 2020).
Figure 1.
UML-diagram of the library for modeling of goods delivery by cargo bicycles.

Figure 2.
Synthetic network and alternative locations of loading hubs.

Figure 3.
Distributions of the total transport work for the considered alternative hub locations in the synthetic network.
Figure 3.
Distributions of the total transport work for the considered alternative hub locations in the synthetic network.

Figure 4.
Locations of potential clients in the Old Town district of Krakow.

Figure 5.
Locations of clients, intersections, and loading hubs in the Krakow Old Town.

Figure 6.
Distribution of the total transport work for the considered loading hub locations.


Table 1.
The alternative locations of a loading hub in the Old Town district of Krakow.
| Hub Location | Longitude | Latitude | Address of Location |
|---|---|---|---|
| A | 50.05435 | 19.93880 | St. Giles str. |
| B | 50.06208 | 19.93341 | St. Anna str. |
| C | 50.06036 | 19.94142 | Holy Cross str. |
| D | 50.06416 | 19.93542 | St. Stephen sq. |
| E | 50.06364 | 19.94214 | Holy Spirit sq. |
Table 2.
Results of computer simulations for the considered loading hub locations.
| Alternative Hub Location | Mean Value of Total Transport Work [tkm] | Variance of Total Transport Work [tkm2] | Sufficient Number of Observations [obs.] |
|---|---|---|---|
| A | 5.828 | 0.335 | 11 |
| B | 3.521 | 0.128 | 12 |
| C | 2.999 | 0.076 | 10 |
| D | 3.130 | 0.073 | 9 |
| E | 2.992 | 0.087 | 11 |
Table 3.
Distances from the gravity center to alternative hub locations.
| Alternative Hub Location | Euclidean Distance [m] | Distance According to Google Maps [m] |
|---|---|---|
| A | 744 | 850 |
| B | 506 | 500 |
| C | 328 | 300 |
| D | 386 | 450 |
| E | 412 | 400 |
Publisher’s Note: MDPI stays neutral with regard to jurisdictional claims in published maps and institutional affiliations. |
© 2021 by the author. Licensee MDPI, Basel, Switzerland. This article is an open access article distributed under the terms and conditions of the Creative Commons Attribution (CC BY) license (http://creativecommons.org/licenses/by/4.0/).
Share and Cite
MDPI and ACS Style
Naumov, V. Substantiation of Loading Hub Location for Electric Cargo Bikes Servicing City Areas with Restricted Traffic. Energies 2021, 14, 839. https://0-doi-org.brum.beds.ac.uk/10.3390/en14040839
AMA Style
Naumov V. Substantiation of Loading Hub Location for Electric Cargo Bikes Servicing City Areas with Restricted Traffic. Energies. 2021; 14(4):839. https://0-doi-org.brum.beds.ac.uk/10.3390/en14040839
Chicago/Turabian StyleNaumov, Vitalii. 2021. "Substantiation of Loading Hub Location for Electric Cargo Bikes Servicing City Areas with Restricted Traffic" Energies 14, no. 4: 839. https://0-doi-org.brum.beds.ac.uk/10.3390/en14040839
Note that from the first issue of 2016, this journal uses article numbers instead of page numbers. See further details here.