
Optimal Pricing of Vehicle-to-Grid Services Using Disaggregate Demand Models


Department of Civil and Environmental Engineering, Imperial College London, London SW7 2BU, UK
*
Author to whom correspondence should be addressed.
Energies 2021, 14(4), 1090; https://0-doi-org.brum.beds.ac.uk/10.3390/en14041090
Submission received: 3 November 2020
/
Revised: 8 February 2021
/
Accepted: 12 February 2021
/
Published: 19 February 2021
(This article belongs to the Special Issue Smart Energy and Intelligent Transportation Systems)
Abstract
:The recent revolution in electric mobility is both crucial and promising in the coordinated effort to reduce global emissions and tackle climate change. However, mass electrification brings up new technical problems that need to be solved. The increasing penetration rates of electric vehicles will add an unprecedented energy load to existing power grids. The stability and the quality of power systems, especially on a local distribution level, will be compromised by multiple vehicles that are simultaneously connected to the grid. In this paper, the authors propose a choice-based pricing algorithm to indirectly control the charging and V2G activities of electric vehicles in non-residential facilities. Two metaheuristic approaches were applied to solve the optimization problem, and a comparative analysis was performed to evaluate their performance. The proposed algorithm would result in a significant revenue increase for the parking operator, and at the same time, it could alleviate the overloading of local distribution transformers and postpone heavy infrastructure investments.
1. Introduction
Advances in battery technology, the low emission factors, the low operation costs and the high fuel economy of Battery Electric Vehicles (BEVs) and Plugged-in Hybrid Electric Vehicles (PHEVs) are some of the reasons that the family of Electric Vehicles (EVs) has attracted a lot of attention over the last few years. New models with extended capabilities and longer electric ranges are presented every year by major automobile manufacturers [1]. The latest generation of EVs shifts the paradigm towards new markets by providing extended full electric ranges of over 300 km and significantly reducing the problems associated with “range anxiety” [2].
The adoption of EVs in private transportation could ultimately lead to a replacement of crude oil with cleaner energy sources. At the same time, they can be transformed from unidirectional devices that draw power from the grid to bidirectional assets that transfer power back. Vehicle-to-Grid (V2G) may enable drivers to provide ancillary services to the grid in exchange for financial returns, as well as to contribute in alleviating peak power demand [3]. Kempton and Tomic [3,4] have compared existing grid services (spinning frequency reserves, peak power supply and regulation) with Vehicle-to-Grid (V2G) support and concluded that using EVs for regulation can offer the most substantial returns to vehicle owners.
The accelerated growth in electric mobility also demands the development of new methods to address their implications for the power grid. The stability of the power system is at stake, particularly when charging events cluster in space and time. Without charging coordination, the variations in charging demand could have a great impact on the electricity market. Peak power demand could be deteriorated without investment in charging infrastructure at working places and throughout cities.
Public or non-residential private parking facilities are characteristic examples of places where large numbers of EVs can concentrate in short periods of time. In order to avoid system disruptions, the aggregated load in the parking facility should be closely coordinated. Techniques that achieve this are widely known as “smart charging”.
Smart charging can be either centralized or decentralized. In centralized approaches, EVs transmit a signal with the required State of Charge (SOC) and the desired parking duration, and a control unit allocates charging times and sends the information back to the charger/inverter of each vehicle [3,4,5,6,7]. In decentralized smart charging, the information on spatiotemporal demand is transmitted in the form of incentives that are processed by the in-vehicle controller, which optimizes the charging intervals of the vehicle [8,9,10,11,12,13,14,15,16,17,18].
This process can be facilitated by a Charging Service Provider (CSP), which coordinates charging events with the objective of optimizing one or more from the list below: power losses, transformer overloading, system operation costs, generation costs, vehicle integration, the cost of the power supply, costs for individual drivers, balancing demand and supply, and revenue for the CSP.
For this study, it was assumed that CSPs are contracted as intermediate agents to carry out the task of charging and V2G coordination for parking operators in their control area. As a result, they have a threefold role: a) to provide EV drivers with their desired SOCs at departure time, b) to exchange electricity in two directions by respecting the local grid constraints from the Distribution System Operators (DSOs) and c) to maximize revenue for contracted parking operators. If the parking operators were acting directly as Charging Point Managers (CPMs), there would be no need for the intermediate services of the CSP. These services can be classified as Business-to-Business (B2B) and Business-to-Customer (B2C), and they are schematically presented in Figure 1.
As they grow in size, EV fleets offer greater load flexibility to the CSP. For example, if an individual vehicle needs a lot of energy over a limited period, this energy can be balanced from drivers who are more flexible in their demand and are willing to postpone charging or even provide V2G services. Load flexibility is valuable for charging control, and price incentives can be applied to promote longer charging events with lower power rates and discourage short, power-intense intervals [19].
The work presented in this paper has contributed to the existing literature by developing a Revenue Management (RM) framework for charging coordination. In this framework, EV drivers reserve, in advance, a parking-and-charging bundle with certain characteristics, such as a charging location, start time and duration, as well as a charging rate. For the users, this approach offers more transparency and control over the charging parameters, and a better understanding of the underlying mechanisms compared to typical scheduling algorithms. For example, if they wish to leave the charging facility earlier, they can estimate, with precision, the final SOC at that time. However, this transition of control from the CSP to the EV driver does not necessarily mean a loss of flexibility. On the contrary, CSPs can vary prices to incentivize low-power bundles; they can better predict EV arrivals, segment their users and optimize their operations in advance.
The modelling framework was evaluated in a microsimulation framework with synthesized activity patterns from a London-based travel diary and choice parameters adopted from a stated preferences experiment [20]. Different EV penetration rates were simulated for a commercial and a shopping area in the city centre.
The rest of the paper is structured as follows: Section 2 discusses the literature review that is relevant to the context and the methodological approach of this study, while the proposed optimization algorithm is presented in Section 3. In Section 4, a brief overview of the data sources that were used for this study is provided along with a demonstration of the simulation framework. Section 5 presents the results and a comparative analysis. Finally, the outcomes of the study are discussed in Section 6.
2. Literature Review
2.1. State of the Art in EV Scheduling and V2G Optimization for Non-Residential Facilities
Several studies have investigated the optimal charging of electric vehicles and the provision of V2G services for peak power and ancillary markets [21,22,23,24,25,26,27,28,29,30,31,32,33]. In these studies, the objectives of the control algorithms vary significantly between maximizing economic factors and minimizing the impact on the power network.
The addition of V2G services on top of regular charging complicates the decision process for EV owners. The fast recovery of SOC is desirable because it means that smart charging does not interfere significantly with the daily schedules of the owners. On the other hand, arbitrage techniques based on wholesale electricity prices can generate profits for them at the expense of recharging speed [4].
Rotering and Ilic [21] present a dynamic programming approach to solving this V2G optimization problem, where the objective is to maximize the profit for the EV owners and the decision variable is the daily SOC curve. Zhang et al. [22] examined the potential application of V2G for ancillary services by developing optimal methods for voltage regulation and reactive power control. Shokrzadeh et al. [23] present optimal scheduling strategies for minimizing harmful operating conditions for distribution transformers at a neighbourhood level. DeForest et al. [24] present a centralized method for optimizing EV charging and bid capacity via V2G while maximizing the profit and minimizing the operation costs for the aggregator. Vandael et al. [25] propose a multiagent system for charging coordination with the objective of minimizing imbalance in a smart grid.
Non-residential parking facilities such as parking garages or supermarket parking lots are characteristic examples of places where large numbers of EVs can concentrate in short periods of time. As a result, there is an increasing volume of studies that are shifting their focus away from home recharging.
Yao et al. [26] investigated the optimal integration of EVs in a parking station with the distribution grid according to two different objectives: an economic and a technical one. Shafie-khah et al. [27] present an optimization problem for a parking operator that satisfies demand while curtailing loads for a power utility. They suggest that a constant power rate over the charging session, which is in line with the present paper implementation, can prolong the battery service time. Zhang et al. [28] also modelled the parking operator as a demand response aggregation agent, but they found the optimal level of participation in a set of demand response programs (price-based and incentive-based) instead of focusing on one. Su and Chow [29] developed an intelligent energy-management system for EVs that charge at a municipal parking site, which they solved using probabilistic model-building genetic algorithms.
Finally, the studies that explore the interaction between utilities and parking lots, when V2G is available, are more limited.
Mehta et al. [30] implemented a water-filling algorithm to minimize the variance of the load profile for workplace car parks as a means of reducing peak demand. Babic et al. [31] propose a framework where the parking operator is a broker with two distinct roles: (a) an energy retailer and (b) a player in a target electricity market. The electricity trading functionalities of the operator were evaluated within an agent-based simulation. Moradijoz et al. [32] used genetic algorithms to solve a multi-objective algorithm that optimizes the sites and sizes of parking lots that provide V2G services to the grid.
Probably the research work most closely related to the present paper is that of Hashimoto et al. [33]. In their study, drivers could reserve charging and V2G services through an auction-based system, and the improvements in revenue for the operators were evaluated. It also presents similar methodological assumptions such as discretizing hour intervals for parking reservations and billing by parking duration. In addition, a probability distribution for parking users’ willingness to pay was derived from the completion of a questionnaire addressed to them. Finally, the arrival and departure patterns were modelled according to real parking data.
Summarizing the state of the art in EV scheduling methodological approaches, while much effort has been devoted to assessing the economical and network impact of charging and V2G, the current practice largely relies on simplistic representations of charging and parking demand.
2.2. Representation of Charging Demand
In the majority of relevant studies, as was also pointed out by Daina et al. [34], smart charging appraisals adopt predefined charging scenarios and exogenous EV use patterns. The attributes that affect the charging process (the start and end times of charging sessions, initial SOC, subsequent trip duration, parking duration, etc.) are calculated by drawing values from typical probability distributions. Fazelpour et al. [35] used probability distributions of arrival rates and arrival times in a movie theatre parking lot in Tehran, in order to optimize the charging rates of the vehicles. Vandael et al. [25] used fixed charging scenarios, and they assumed that the charging rate is constant during the charging process.
In some rare cases [28], these values have been validated with historical parking information. When real-world charging data are available and are used to deduce charging flexibility [29], these data are not adequate for capturing the elasticity of drivers to charging parameters, because their choices are constrained by the limitations of the provided options.
Recently, there have been some efforts to predict charging behaviour with machine-learning methods. The impact of accurate predictions on charging scheduling has been demonstrated in [36], where the authors suggest a potential 27% decrease in peak load. However, when using historical data of parking durations and energy consumption to predict user behaviour, there is a lack of understanding of individual users’ preferences for service attributes, such as the location of the charger and the charging rates.
The prominent novelty of the choice-based pricing optimization that was developed in the present paper is the representation of the charging behaviour in a random utility context and the use of parameters that were empirically estimated from user-tailored choice experiments for charging choices. In a previous study by the authors, the results from these experiments were used under expected and non-expected utility frameworks to understand how people perceive price probabilities and how risk averse they are when they book charging events in advance [37].
Our model bridges the gap in the literature by capturing the heterogeneity in activity-travel and charging preferences and transferring this disaggregate information to a price-based control mechanism.
One of the first studies that modelled the implication of discrete choice models for smart charging services was [34], but in the context of home-based charging activities. In [8,11], the authors developed an activity-based microsimulation where the electric vehicles were controlled with smart charging. Nevertheless, the willingness-to-pay assumptions are not backed by empirical estimation based on revealed or stated preference data. The parameters in the utility function are somewhat arbitrarily tuned using the difference between the forecasted electricity price for next day and the current equivalent price of gasoline. This trade-off makes sense in the decision process for a PHEV driver who can run in both electric and gasoline modes, yet it does not adequately capture the behaviour of a BEV driver.
The integration of charging coordination with the demand response of EV users is achieved through the implementation of revenue management. Before proceeding to the methodological framework in Section 3, there is a brief review of RM and its existing applications in the context of parking and charging.
2.3. Revenue Management for Electric Vehicle Charging
Revenue management is a widely adopted method for the allocation and pricing of non-storable services and perishable goods in the service industry. It made its first appearance in the 1970s, when airline companies were deregulated. Data analytics were adopted to differentiate the fares for seats located in the same cabin, and the operators started making dynamic decisions based on predicted demand [38]. Today, we encounter RM techniques in car rental services, hotels, hospitality and most of the industries where there is an inventory with capacity constraints [39].
The first revenue-management approach for a car parking lot was presented in Guadix et al. [40]. In a later study, car parking revenue maximization was achieved by finding the optimal balance between early subscriptions and last-minute drive-in users [41]. In [42], the authors pursued the goal of maximizing revenue for a parking lot in a slightly different manner. A fuzzy-logic-based intelligent parking system with learning capabilities decided, in real time, which reservations to accept and which to reject.
To the best of the authors’ knowledge, the first study where revenue management was applied for electric vehicle charging was that of Flath et al. [43]. The optimization objective was to minimize disruption at the distribution network level and to balance energy demand with supply. In this approach, there were two main differentiations from conventional RM methods: (a) instead of discrete inventory units (e.g., hotel rooms, airplane seats, etc.), the energy provided to the EV drivers was continuous, and (b) limited and high-value transactions were replaced by frequent and low-cost ones. In terms of customer segmentation, it is assumed that there are two types of users: drivers who charge their vehicles on a regular schedule (e.g., at home or work) and drivers who have a spontaneous need for topping-up their batteries.
Compared to [43], our methodological approach adds the physical dimension of charging-post availability, moving from a single-resource (energy amount) to a dual-resource allocation. Most importantly, it uses a sophisticated representation of charging demand, and it enables customer segmentation using both quantitative and qualitative choice parameters.
3. Choice-Based Price Optimization
3.1. Charging Offer Set
Charging services in the rest of the paper are represented as “bundles” that combine a parking place with the electricity for recharging. As with existing revenue-management applications, this study developed an online reservation system where EV drivers can book their charging bundles up to 1 h before arrival. This system should display all the available options at the time of reservation, including their prices and other service attributes. By packaging out-of-home charging with other parking services, overall prices could become even more appealing than home energy tariffs and attract sufficient charging events to boost investment in public infrastructure.
This is not the first study where users have had the option to choose between different charging offers. In [44], the authors suggest a menu-based pricing system where the users select among contracts of fixed energy quantity and time windows.
The charging bundle offer set for the EV customers was designed by the CSP, and it could either include or not V2G services. The optimal pricing algorithm that is presented here used as input the demand for parking and charging along with the elasticities to the characteristics of each bundle. Given that the size of the price menu escalated exponentially with additional hours of operations, multiple periods of four-hour slots were evaluated.
Moreover, the various bundles were categorized according to their charging rates, which ranged between 3 and 12 kW. It was decided that rapid chargers should not be included in the analysis, due to their relatively low availability at the time that the research was undertaken. The charging preferences of EV customers were estimated under a Latent Class (LC) model.
The optimization problem has two capacity constraints. The first one is the physical constraint of the available charging posts across the parking lots. The second one is the power constraint that is defined by the remaining capacity available to the DSO. While the objective of the algorithm is revenue maximization for the CSP and the contracted parking facilities, the demand-driven management of charging events has the potential for peak shaving and the alleviation of bottlenecks in the local distribution network.
One of the ethical concerns around dynamic pricing is the fairness of the prices. For this reason, the fairest approach is to differentiate prices for EV services based on the impact they have on the grid. Therefore, we need to make sure that we apply accurate bounds for each charging bundle. In order to achieve that, the following equation was formulated:
where is representative of the specific charging service, and the upper bound is defined at 1.5 ; is the parking price for an hour, is the price for baseload electricity, is the factor that penalizes power-intensive services, is the factor that penalizes peak-load time intervals, is the charging duration and is the factor that penalizes parking lots with high occupancy. All these factors were normalized in a way meaning that the electricity price varied between the base price (10 p/kWh) and a maximum of 55 p/kWh.
In the UK power market, after the actual delivery of electricity, the differences between demand and supply are resolved with an imbalance settlement. This settlement recovers the costs for the system operator by compensating every entity that produced an energy surplus and charging every entity that produced a deficit [45]. Therefore, if the CSP agrees with the DSO for a certain amount of power supply, and the actual demand for EV charging is lower than the expected one, each unit of deficit will have to be reimbursed according to the market index for imbalance costs.
Imbalance prices should be higher for peak-load periods because these are translated to higher costs for the TSO; as a simplification of the complexity of real-market trading values, the imbalance price for each charging bundle was estimated using the factor from Equation (1). Subsequently, these prices were used to calculate the costs from excess power capacity, which were subtracted from the charging service profits to calculate the net revenue for the CSP.
The analysis went a step further by incorporating V2G services in the bundles offered by the CSP. Preferences for V2G services were not estimated because there was a high risk of compromising the estimation validity by augmenting the stated preferences experiments conducted in [20] with V2G scenarios and increasing the complexity for the respondents. Therefore, an assumption was made that the sensitivities to the selling price and discharging amount are identical to those for the buying price and charging amount. The only difference was that the marginal utilities would then have the opposite signs.
While charging and V2G behaviour are assumed to be symmetric, it is likely that this is not the case in reality. For example, the marginal disutility from discharging could be higher for the drivers because of the degradation of the battery or range anxiety. As there are increasing examples of V2G trials around the world, future research could explore these behavioural nuances.
When V2G services are provided, the offer set is extended from 46 to 60 charging bundles. Therefore, EV drivers with low energy requirements (<1 kWh/day) are presented with an extended choice set, where all 14 discharging alternatives deliver a 6 kWh discrete energy quantity to the grid, using different combinations of discharging rates and plug-in durations.
As Moradijoz et al. [32] elaborate, the revenues from V2G power depend on the type of the electricity market that it is sold to. For example, there are markets that pay for energy such as the peak-power market and markets that pay for the available capacity and only require having the vehicle plugged in, such as ancillary services [4]. In the following analysis, only peak-power services were taken into account.
In the next section, we show that by incorporating a latent class model, within the choice-based formulation, it is possible to capture the taste heterogeneity among EV users.
3.2. Utility Specification
The utility of the individual user n selecting the charging bundle j under a discrete choice model specification is the following:
where is the alternative specific constant of the charging bundle j, is a set of parameters to be estimated, X is a vector of charging-bundle-specific attributes, and are sets of parameters for interaction terms, Y is a vector of the travel and charging patterns of the individual n, and Z is a vector of individual attributes of the decision maker such as age, marital status, employment type, income, gender and parental status. In particular, the vector X consists of the following characteristic parameters of the charging service:
- The energy required by the user n, ;
- The parking and charging price, ;
- The walking time from the charging post to the location where the activity of the individual takes place, ;
- The Charging-Induced Schedule Delay Early ( and the Charging-Induced Schedule Delay Late ).
The last two parameters (i.e., and ) are based on the theory behind time-of-travel-choice modelling. In particular, the methodology developed in Vickrey’s seminal paper [46] suggests that when a commuter choses what time to leave for work, this decision comes after a trade-off between travel time and the measures Schedule Delay Early (SDE) and Schedule Delay Late (SDL). These two measures were defined as follows:
where is the preferred arrival time, is the time of departure from home and is the travel time, which is a function of the departure time. We defined and in a similar fashion to the disutility of starting the activity earlier or later, respectively, due to the starting time of the charging event. To better clarify these terms, they are visually demonstrated in Figure 2 for a hypothetical daily scenario.
The majority of the above parameters were estimated in [20]. The parameter for the energy amount was based on a previous estimation of EV drivers’ sensitivity to post-charging SOC [47], and the parameter for CISDL was obtained from the CISDE coefficient using the SDE-to-SDL ratio estimated in another study for London commuters [48].
3.3. Latent Class Specification
Latent Class (LC) models are typically applied for segmentation, since they identify classes of users with distinct choice behaviours. As a result, the objective of these models is to achieve intrasegment homogeneity and intersegment heterogeneity based on a set of attributes. Individuals are attributed to each of the classes probabilistically, by estimating class-membership probabilities. A typical LC model formulation is the following:
where Κ represents the total number of classes, is the set of attributes that makes the behaviour across the segments distinctive and is the probability that the user n belongs to class κ, conditional on , widely known as the class-membership probability. It is deduced that . Additionally, is the class-specific probability calculated in (6).
where J is the total set of bundles and is the utility gained from the “no buy” choice. Since “no buy” was not an option in the choice experiments, this utility was approximated by calibrating the alternative specific constant of Equation (2) in a way implying that a small share of the EV drivers did not buy any of the charging bundles.
The typical formulation for a class-specific probability is the multinomial logit (MNL) model; however, other Generalized Extreme Value (GEV) models, such as nested logit or cross-nested logit, can also be adopted to relax some of the hard assumptions of MNL.
The empirical estimation of the latent class model in [20] identified two latent classes: a class where the common characteristic was the high elasticity to price, and a class that was more sensitive to time coefficients, such as walking time and charging duration. The class-membership model is shown in Equation (7).
where is a constant that is specific to the k class and are the parameters to be estimated.
3.4. Price Optimization
In revenue management, it is commonly assumed that the demand is homogeneous. The introduction of discrete choice models as a means to better capture customer behaviour was first attempted with the Choice-Based Deterministic Linear Program (CDLP) [49]. MNL models were replaced by more sophisticated specifications such as nested logit [50] and LC models [51] in subsequent studies.
The objective of the optimization problem developed in this paper is to maximize the expected revenue of the CSP for each four-hour period. The final solution is a menu-based pricing strategy, which should satisfy the constraints for the two-dimensional capacity (charging-post and power availability). The decision variables of this problem, , are the prices of the 46 (or 60 when V2G is available) charging bundles. The latent-class optimization problem is formulated as follows:
subject to:
- Capacity constraints:
- Price-policy constraints:
Equation (8) can be decomposed in two terms. The first term is the generated profit that is calculated by multiplying the number of EVs by the latent class probability of choosing a charging bundle j and the price of this bundle. The second term is the imbalance cost that is calculated by multiplying the imbalance price for each hour slot with the respective deficit power. The maximum revenue for the CSP is equal to the difference between the generated profit and the imbalance cost for the optimal price menu.
The capacity constraints (9) and (10) correspond to the number of charging posts and the supplied power, respectively. Price-policy constraints (11) vary across charging and V2G services. The minimum price for charging bundles is equal to the maximum price for V2G bundles, and it is assumed to be zero. On the other hand, the maximum prices for charging bundles and minimum prices for V2G bundles reflect their main characteristics; i.e., power-intensive bundles are allowed to have higher prices.
4. Data and Simulation Approach
A simulation approach was employed for the demonstration of the developed pricing algorithm. Two areas with distinct activity patterns and increased travel demand levels were selected for the simulation: a large shopping mall (Westfield Shopping Centre) and a busy commercial area (Canary Wharf). Similar assumptions were made in Battistelli et al. [52], where two garages with EV parking spaces were modelled, serving an office and a residential area. The characteristics of the trips for these areas were extracted from an annual household survey, which combined personal and household information with data from travel diaries: the London Travel Demand Survey (LTDS) [53].
The number of parking spaces used for the simulation corresponded to the existing off-street infrastructure within a 1 km2 radius of the centroid of each area. It was assumed that these spaces and the hypothetical charging posts were concentrated in two large parking lots for both areas. In terms of data preprocessing, the steps below were followed:
- The units of analysis were tours that started and ended at the homes of the respondents. The tours contained multiple trips.
- Tours that were not identified as car driving, or did not have an intermediate stop within the examined areas, were removed from the analysis.
- If the number of stops in the area of interest was higher than one, the parking event with the highest duration was identified, and that is where the charging event was assumed to take place.
All the electric vehicles in the simulation were assumed to be BEVs, because of range anxiety and their higher likelihood of depending on out-of-home charging infrastructure. At the time of the research, one of the most competitive BEVs in the market was the Nissan Leaf; hence, it was used for the estimation of electricity consumption [54]. For combined city and highway driving, this was set equal to 30 kWh/100 miles, and given a battery capacity of 24 kWh, it corresponds to a driving range of 83 miles. Finally, the energy efficiency of the charging posts was assumed to be 80% and to remain constant at any time step.
The number of charging posts for the simulation was assumed to be equal to the number of parking spaces. While this could be considered a very optimistic scenario for the evolution of electromobility and its infrastructure, there is a rapid deployment of charging posts in large urban centres, which is going to be further facilitated by economies of scale. Furthermore, it should be noted that the areas examined are of high economic interest, with the potential to attract infrastructure investments.
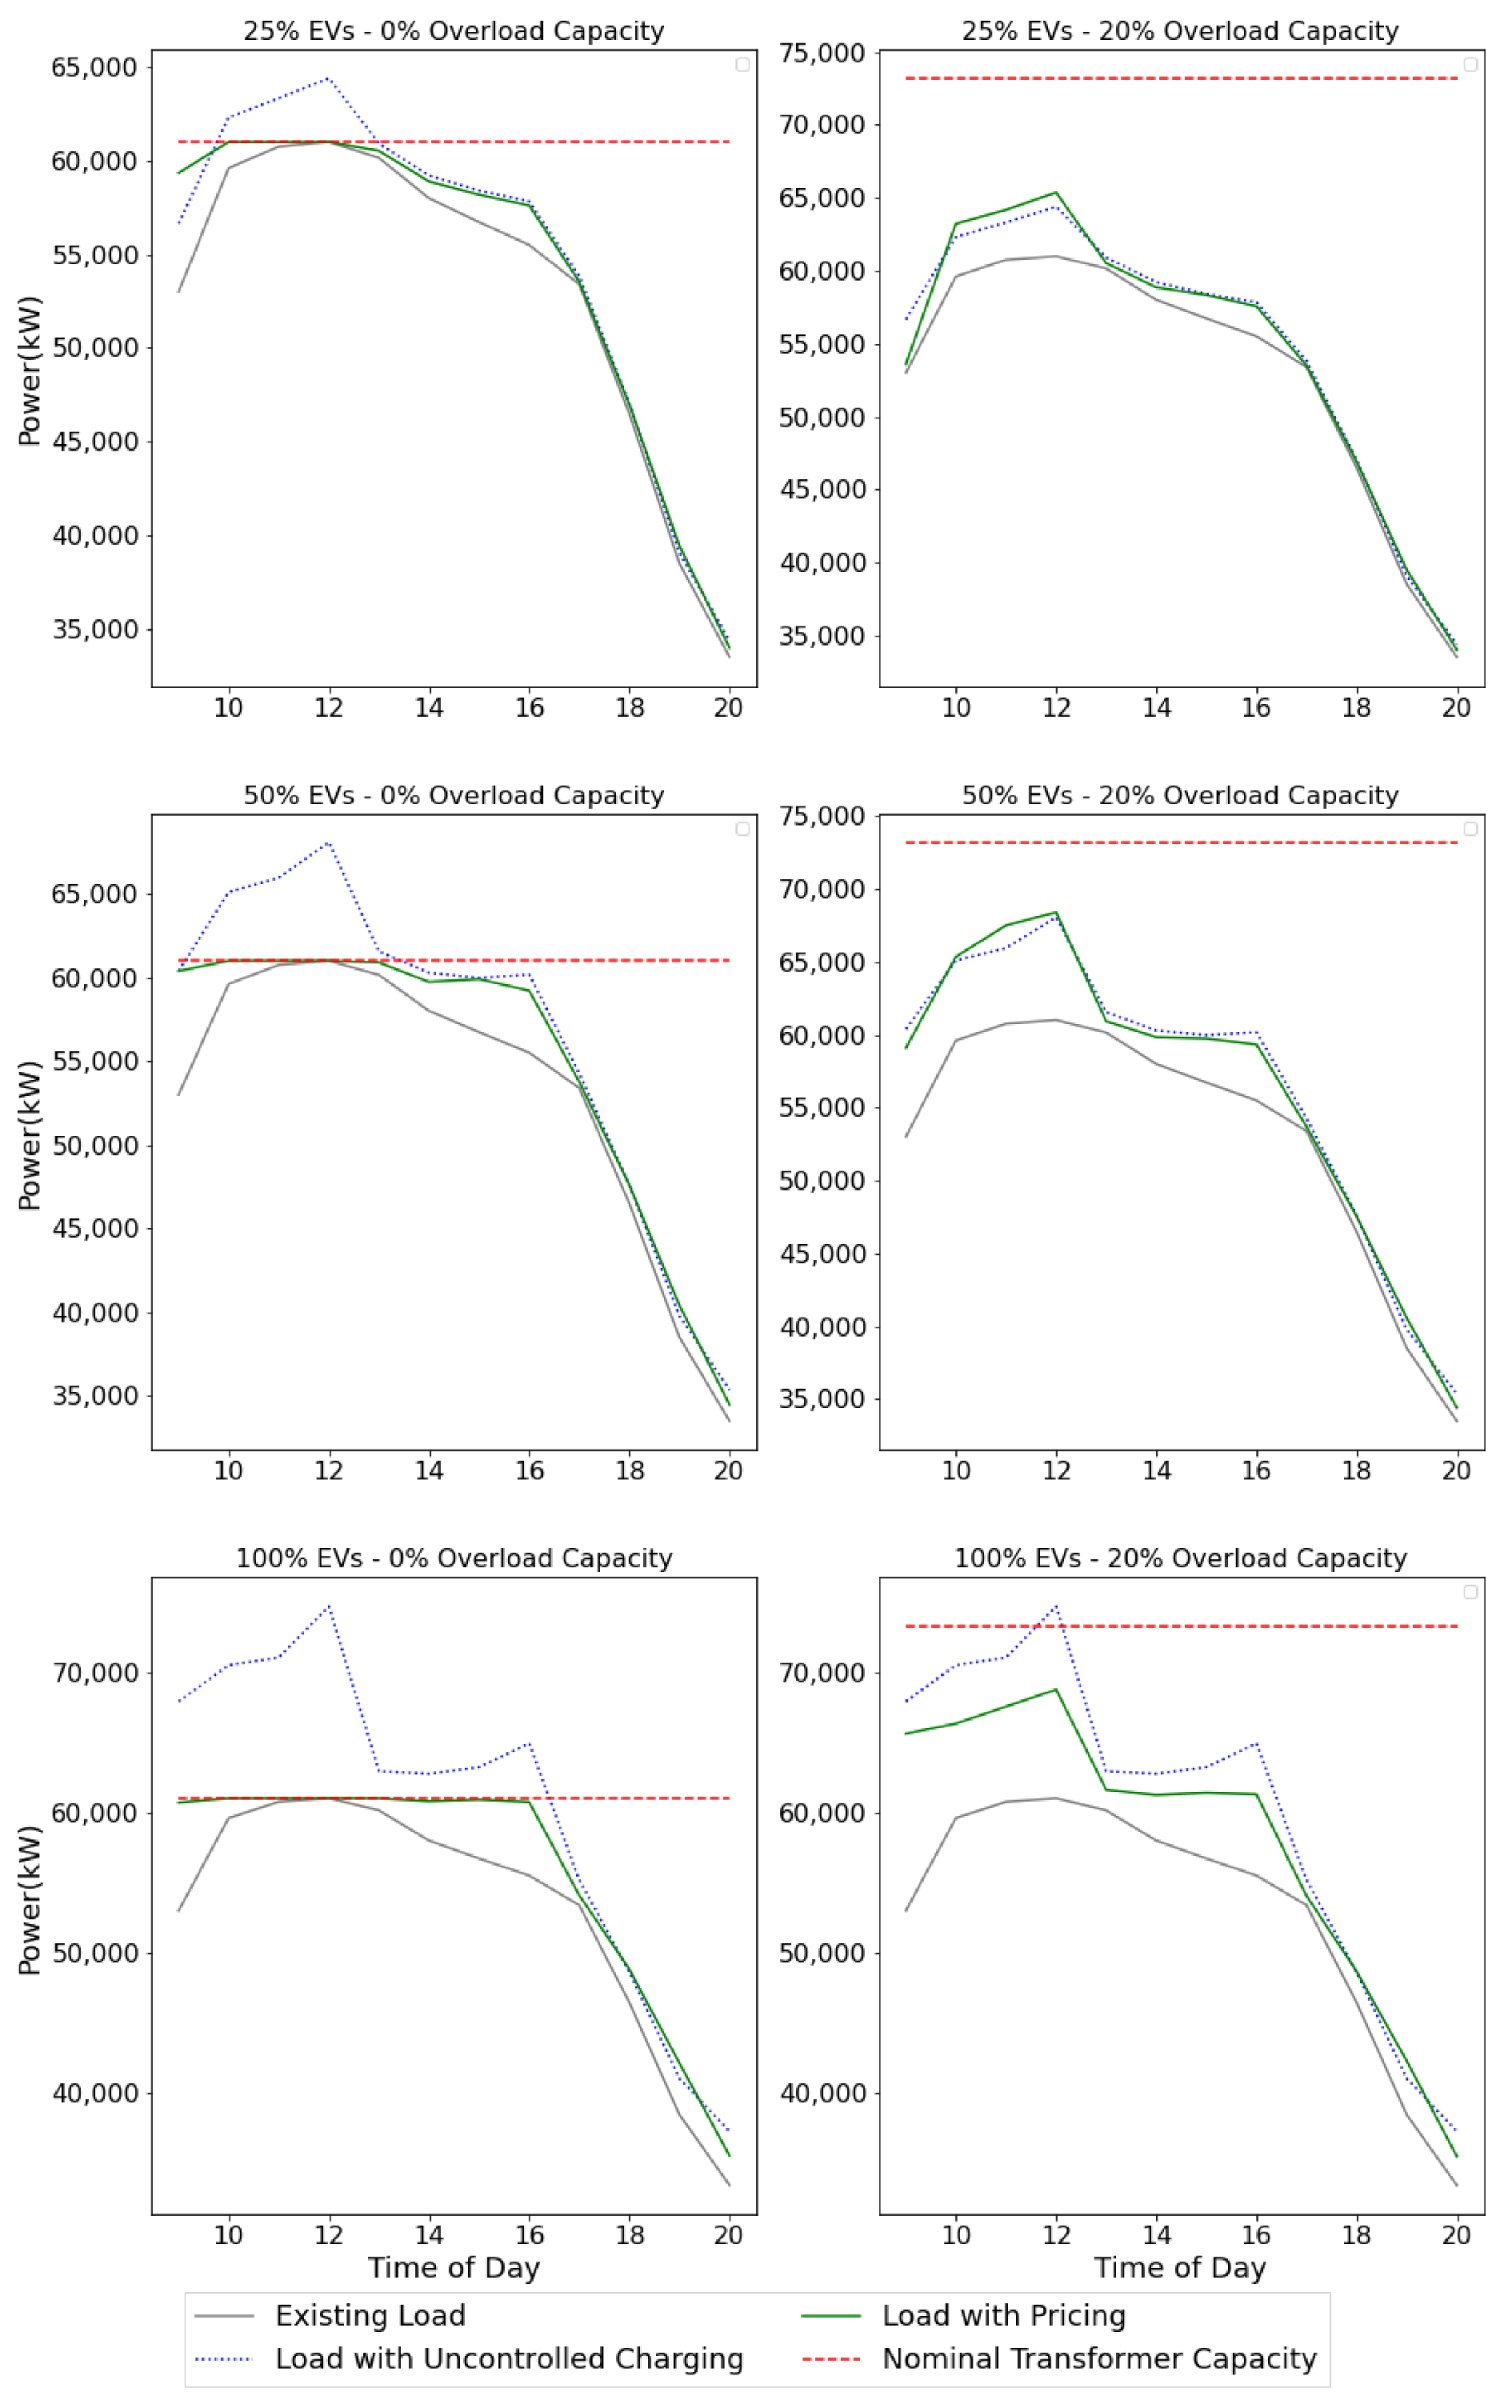
Along with travel demand, these areas have increased electricity demand, especially during hours of peak occupancy. Some examples of appliances that contribute to the aforementioned peaks are personal computers, display lighting and air conditioning units. In order to model the base load of electricity without electric vehicles, first, we identified the baseload profiles for a typical winter weekday for both domestic and nondomestic users. Then, the average population density of residents, the number of employees and the percentages of domestic and nondomestic consumption were used to scale up from a personal profile to the daily distribution. The resulting load curves are presented in Figure 4.
The overload capacity can generally fluctuate between local distribution networks. Typically, distribution transformers are replaced when the peak demand grows to be almost equal to the installed capacity. Figure 4 demonstrates the capacities that were selected for the simulation, which in both cases, were 20% higher than the peak value of the base load.
The trip data from LTDS only represent a sample of the population and not the actual demand. Thus, the respondents were used to generate a synthetic population that would allow the exploration of network effects for the two areas. The specifics of the population synthesis algorithm are presented in [20]. The energy requirements for the synthetic EV drivers were calculated based on the reported mileage for all the daily trips. However, since out-of-home charging events were expected to follow a top-up pattern, there was an asymmetric draw from the lower end of the distribution (1–5 kWh).
In order to account for different levels of EV penetration, three scenarios were evaluated: a mid-term scenario (25%), a long-term scenario (50%) and a full-electrification (100%) scenario. As a preliminary step, the incoming demand was satisfied with an uncoordinated charging strategy. This allowed an initial estimation of the spatiotemporal allocation; thus, it could be used for an informed pre-allocation of the supplied power capacity amongst the parking facilities. Some basic assumptions for the uncoordinated scenario were the following: (a) recharging starts as soon as the vehicle is plugged in and (b) the charging event has a constant rate and is evenly distributed over the parking dwell time.
Combining the data sources and the synthetic information that has been described so far in this section, we present all the variables that were used for simulation and optimization in this study, in Table 1. Scaling up the trip sample dataset using aggregate statistics for the areas of interest, we ended up with 10,852 trips for Canary Wharf and 14,360 trips for Westfield. Then, depending on the scenario for EV penetration levels, the total numbers of trips in the simulation are presented at the end of the table.
The first step of the methodological approach was to examine an uncontrolled charging scenario. The parking and charging characteristics in the top left of Table 1 were deduced from the trip dataset following a set of assumptions and rules. For example, it was assumed that the driver will park at the facility that is closer to the final destination and that the energy requirements will depend on the subsequent trips of the day and the remaining SOC. Subsequently, the initial SOC depends on the distance driven so far and the energy consumption. Additional context variables that were necessary for the simulation are depicted in the middle-right part of the table.
The “dumb charging” strategy is useful for understanding the spatiotemporal allocation of demand and applying the simple area-based and time-based fixed prices that are explained in Equation (1). It also enables the higher allocation of power capacity to the busiest parking facility as a strategic decision. In the next step of our methodology, the charging events were driven by actual choices of the users, which in turn, were probabilistic outcomes of a decision process. Individuals try to maximize their utility (Equation (2)), which is a linear combination of factors from all the sections of Table 1. Using the choice-based formulation described in Equation (8), the prices of the charging bundles were optimized with respect to CSP revenue. Then, they were used to rerun the simulation and evaluate other key metrics such as the load factors and demand–supply imbalance.
EV scheduling problems are typically characterized by large numbers of variables and constraints that are not continuously differentiable and increase the related models’ execution times for finding an optimal solution. Metaheuristic algorithms (MAs) are very popular in the relevant literature as a means for solving these NP-hard (nondeterministic polynomial-time hard) problems [55,56]. The main disadvantage of MAs is that they are not guaranteed to reach the global optimum, due to the stochasticity in the process. However, V2G scheduling problems are typically highly dimensional, nonconvex and nonlinear optimization problems, and MAs are arguably one of the best options for both binary and real-valued problems.
The formulation in this paper is, in fact, a constrained nonlinear problem, and the two main categories of MAs that are applied to solve such are Genetic Algorithms (GAs) and Particle Swarm Optimization (PSO).
The reader is referred to [55,56] for a detailed review of GAs, PSO and other metaheuristics applied in Unit Commitment (UC) problems and EV charging/discharging coordination. The studies [57,58] are typical applications of the two methods. In [57], the authors used a GA in a game theoretic analysis of EV charging coordination. On the other hand, Hutson et al. [58] applied binary PSO to find the optimal buying and selling times for a fleet of vehicles in a parking lot.
The genetic algorithm creates a population of candidate price vectors for the charging bundles, and the best candidate approaches the optimal price vector. Each population is generated after applying certain stochastic operators to the previous population. In particular, the revenue for the operator, which is the fitness score in this application, is calculated for every price vector in the population using Equation (8). If the score of the vector is higher than the average fitness score, it is selected to be transitioned to the next population. This process is typically known as selection. If the score is lower than the average fitness score, random changes are applied to the parent price vectors in order to generate children for the new population. This process of adding diversity in the creation of new offspring is typically known as mutation. If some of the prices in a price vector lead to solutions that violate capacity constraints (Equations (9) and (10)) or price-policy constraints (Equation (11)), a penalty score is incremented by the maximum price. In this way, infeasible price candidates are less likely to be selected for the next population.
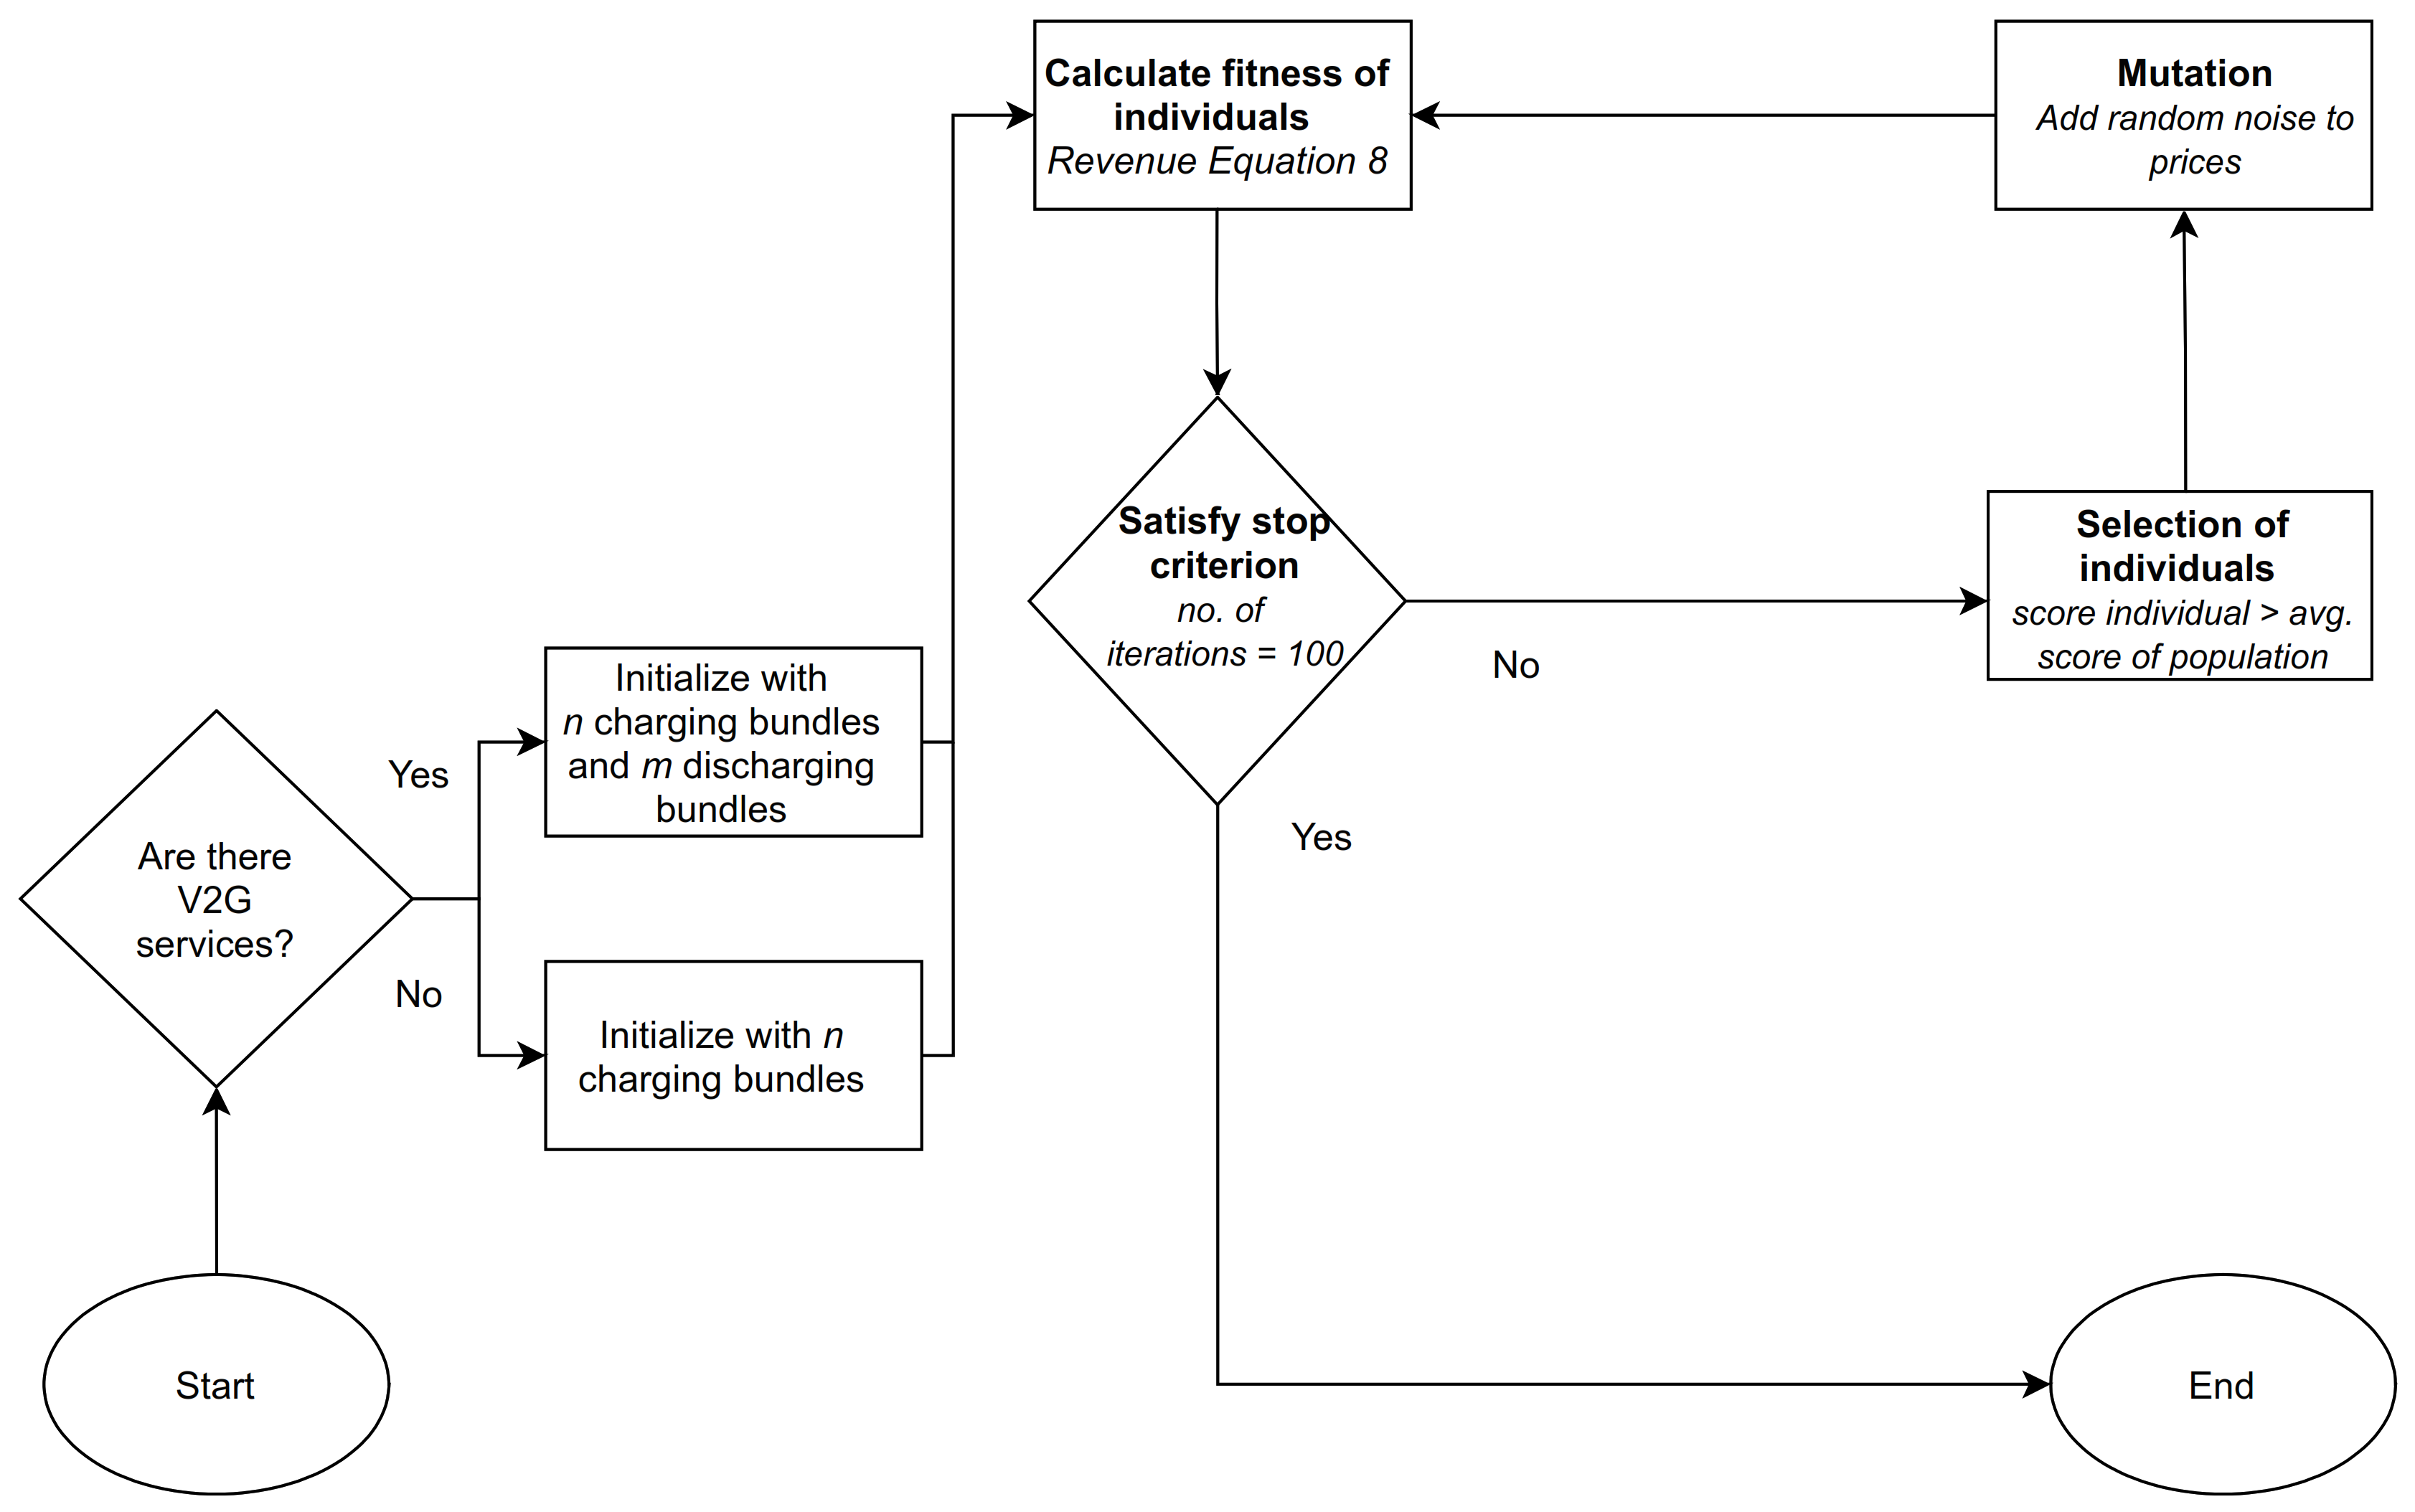
The algorithm is presented in detail in Figure 5. First, we initialize the number of iterations (generations) as G = 100. We randomly generate an initial population P0 of size P = 100. Each individual in the population is represented by a D-dimensional vector, where D is the number of charging (or charging and discharging) bundles:
and the genetic encoding is a direct value encoding the price. This value can be between 0 and the upper bound for the charging bundles or between the lower bound and 0 for the discharging bundles. The fitness function (the choice-based revenue function in Equation (8)) is evaluated for all the individuals in P0. Then, as long as the stopping criterion is not satisfied, we iteratively create subsequent populations. We calculate the score (revenue) for each individual and the average score of the population. We select the individuals with scores higher than the average population score to move to the next generation, and we remove the remaining ones. We also mutate the genes (prices) of the successful individuals by adding random noise, in order to create new price vectors and always have a population of size 100. At each generation t, we evaluate the fitness function Pt, and we follow the same steps. Finally, when the stopping criterion is satisfied, the iteration is terminated, and the individual that generates the maximum revenue is selected.
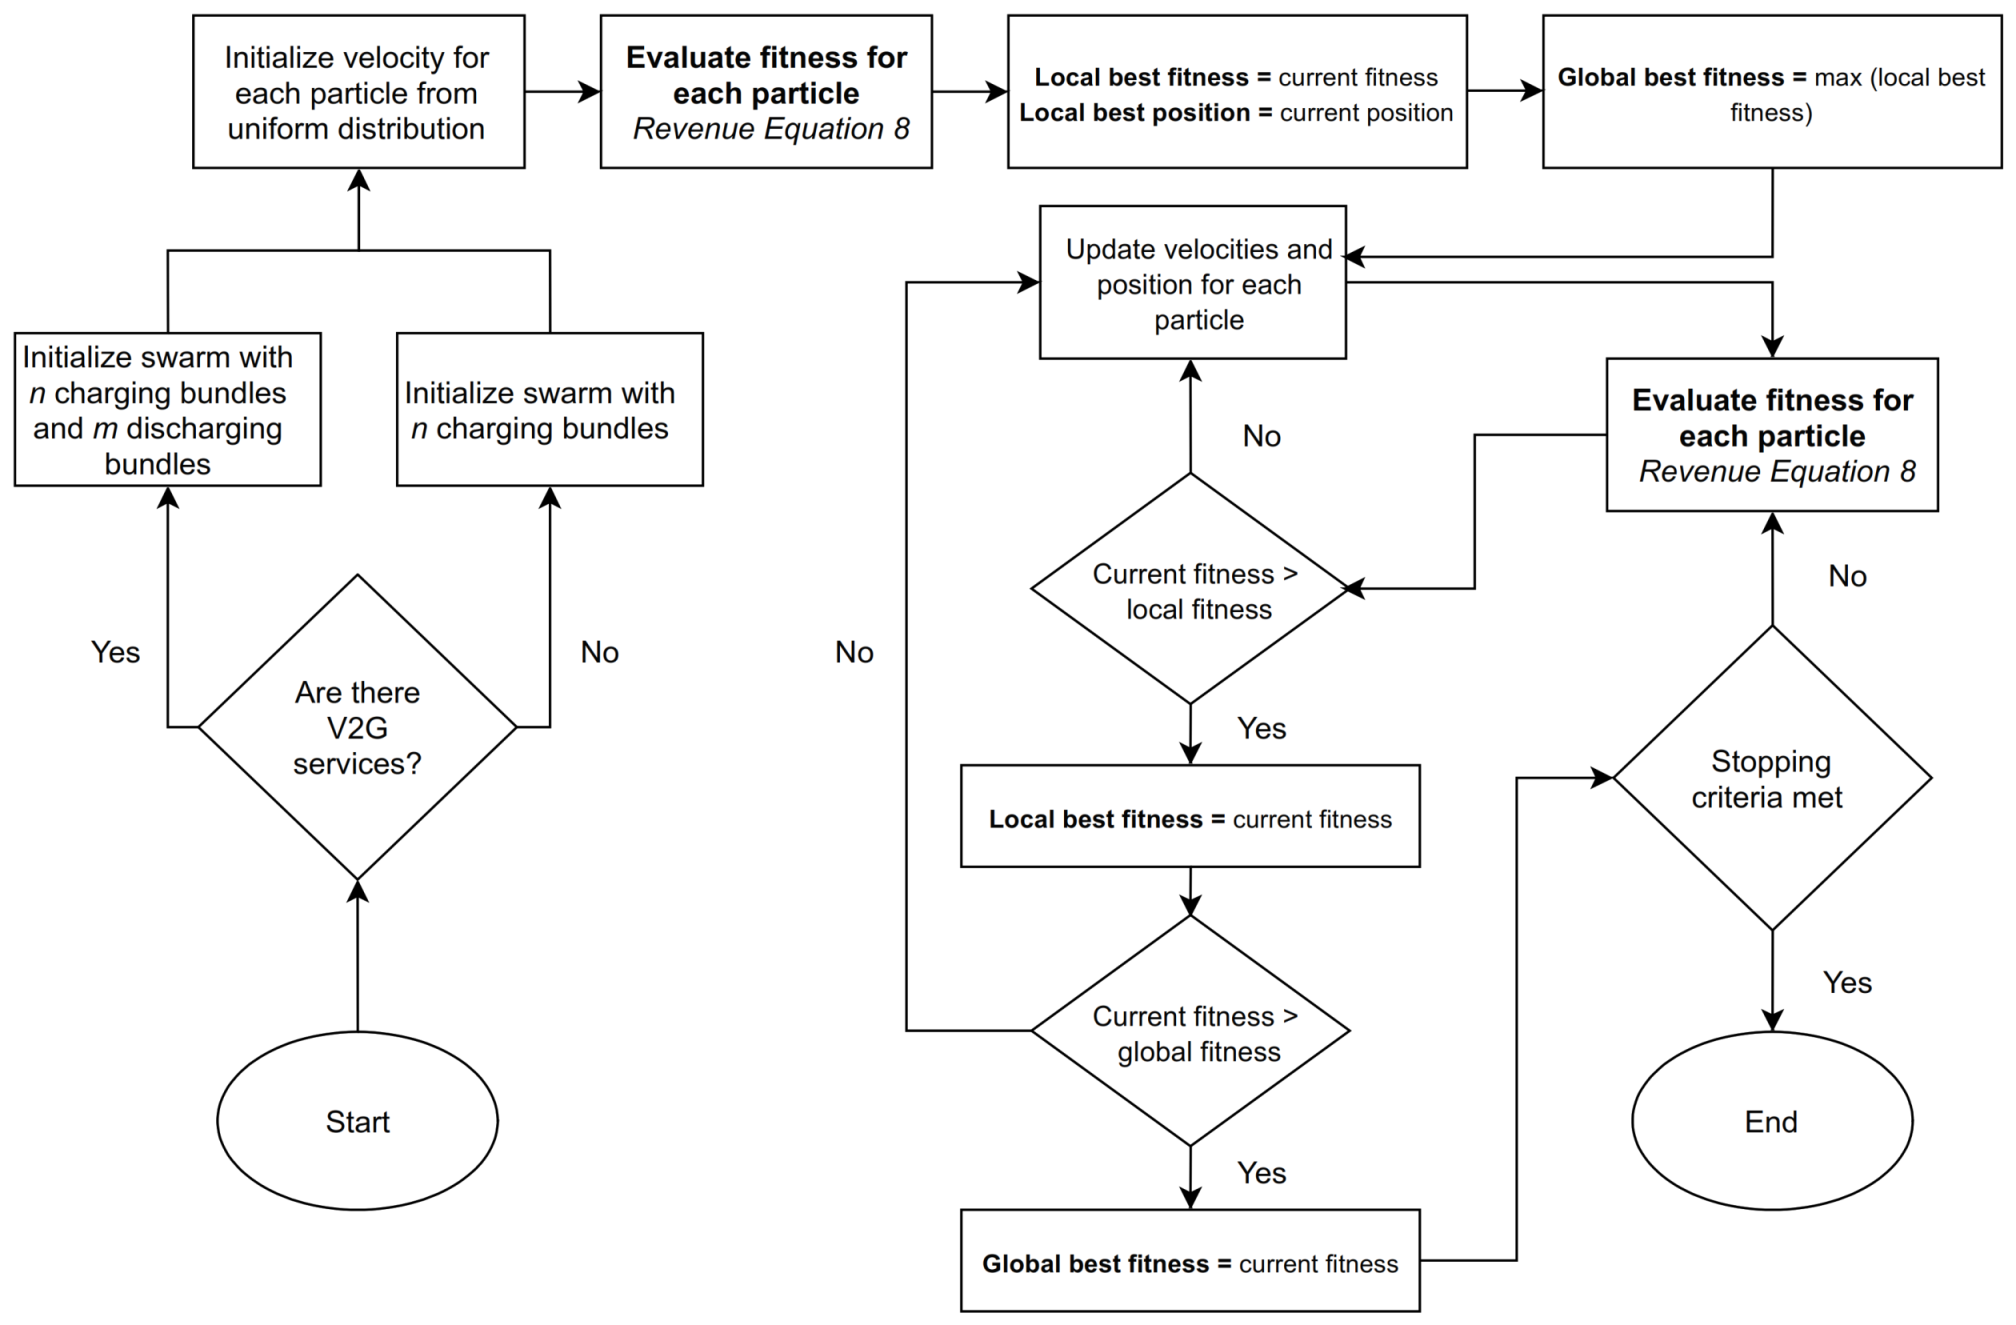
The second nature-inspired algorithm that was adopted in this study for optimization is the PSO. Like the genetic algorithm, each individual in a population (here referred to as swarm because it is based on the information exchange of birds in a swarm) is updated in an iterative manner. The exploration of the problem search space is guaranteed by introducing, again, a certain stochasticity in the transitions. Upon initialization, each individual particle in the swarm creates a randomized position solution, i.e., vector of prices, and a randomized velocity within a uniform range of values. Then, the initial positions are assigned to the particles’ best-known positions. For each iteration, the algorithm updates the velocity of the price vectors using their best individual positions and the best position of the swarm. A cognitive constant c1 limits the influence that the particle’s best-known positions have on their new velocity, while a social constant c2 limits the influence the best price vector of the swarm has on the other vectors.
The details of the PSO solution are presented in Figure 6. The algorithm starts by initializing a set of parameters including the acceleration constants c1 and c2. The size of the swarm is assumed to be P = 100. The position of each solution (particle) i of the swarm is represented by a D-dimensional vector, where D is the number of charging (or charging and discharging) bundles, as depicted earlier in Equation (12). Simultaneously, each particle is randomly assigned an initial velocity, which is given by:
The fitness value (Equation (8)) is evaluated for each particle’s position f(xi). The current position is assigned as the best local position (x*i), while the position with the highest fitness value is assigned as the best global position (gbest). Then, as long as the termination criterion is not satisfied, the positions and velocities of the swarm particles are updated based on (a) their own best local positions and (b) the global best positions in their neighbourhood:
where t is the iteration count, while r1 and r2 are random vectors that take values between 0 and 1. The fitness value is evaluated for the new position, and the local and global best solutions are updated. At the end, when the termination criterion is satisfied (t = 100), the best particle is selected as the optimal price vector.
Both the GA and PSO algorithms were developed in Python, which was also used to build the simulation framework.
The simulation framework, which is demonstrated in Figure 7, considered four control scenarios: (a) fixed pricing based on the time of day (FP), (b) fixed pricing based on the time of day and typical spatial demand (FP2), (c) optimal pricing with the GA, and (d) optimal pricing with PSO. All these control scenarios were compared with an uncontrolled charging scenario where it was assumed that charging demand was equally allocated for the parking duration.
All the simulation runs account for a 12 h operating window between 9:00 and 21:00 with overlapping subsequent 4 h scheduling windows. By running the simulation for all the possible combinations, a total of 48 cases were modelled. Breaking down the problem into 4 h subproblems led to near-optimal solutions but, simultaneously, did not become computationally expensive, which would be prohibitive for the numerous scenarios that were analysed.
5. Results
The main metrics that were evaluated after each simulation run are the revenue for the charging service provider, and the load factors for both the physical dimension of charging posts and the power supplied by the DSO.
Figure 8 and Figure 9 demonstrate the results for the simulation across two dimensions: the percentage of EVs and the overload capacity. Figure 8 corresponds to the heavy business area, while Figure 9 corresponds to the commercial area. For each case study, we examined the load curve against a transformer capacity that was designed based on the maximum value of the baseline curve (first column) and on an overload capacity of 20% (second column). Finally, the three rows are associated with an increasing percentage of EVs from top to bottom.
Since the peak demand for the study areas is already high, a 20% overload capacity is a significant increase in the available power, and it is sufficient, even for the full-electrification scenario. The baseline load distribution is quite similar for the two areas, with the busiest time being around midday. For the uncoordinated-charging scenario, there are several periods where demand exceeds the available capacity. The most extreme case is the scenario for Westfield, with 100% of EVs and 0% overload capacity.
The FP control algorithm takes into account historical driving and activity data to penalize the hour slots with the highest charging demand. The price for each charging bundle is calculated based on Equation (1) without the area factor. Each charging bundle is allocated only if it is not constrained by power availability and the number of free charging posts. This pricing incentive initiates a behavioural shift, with some EV drivers charging later in the day, while some drivers with low SOC needs are discouraged from charging at all.
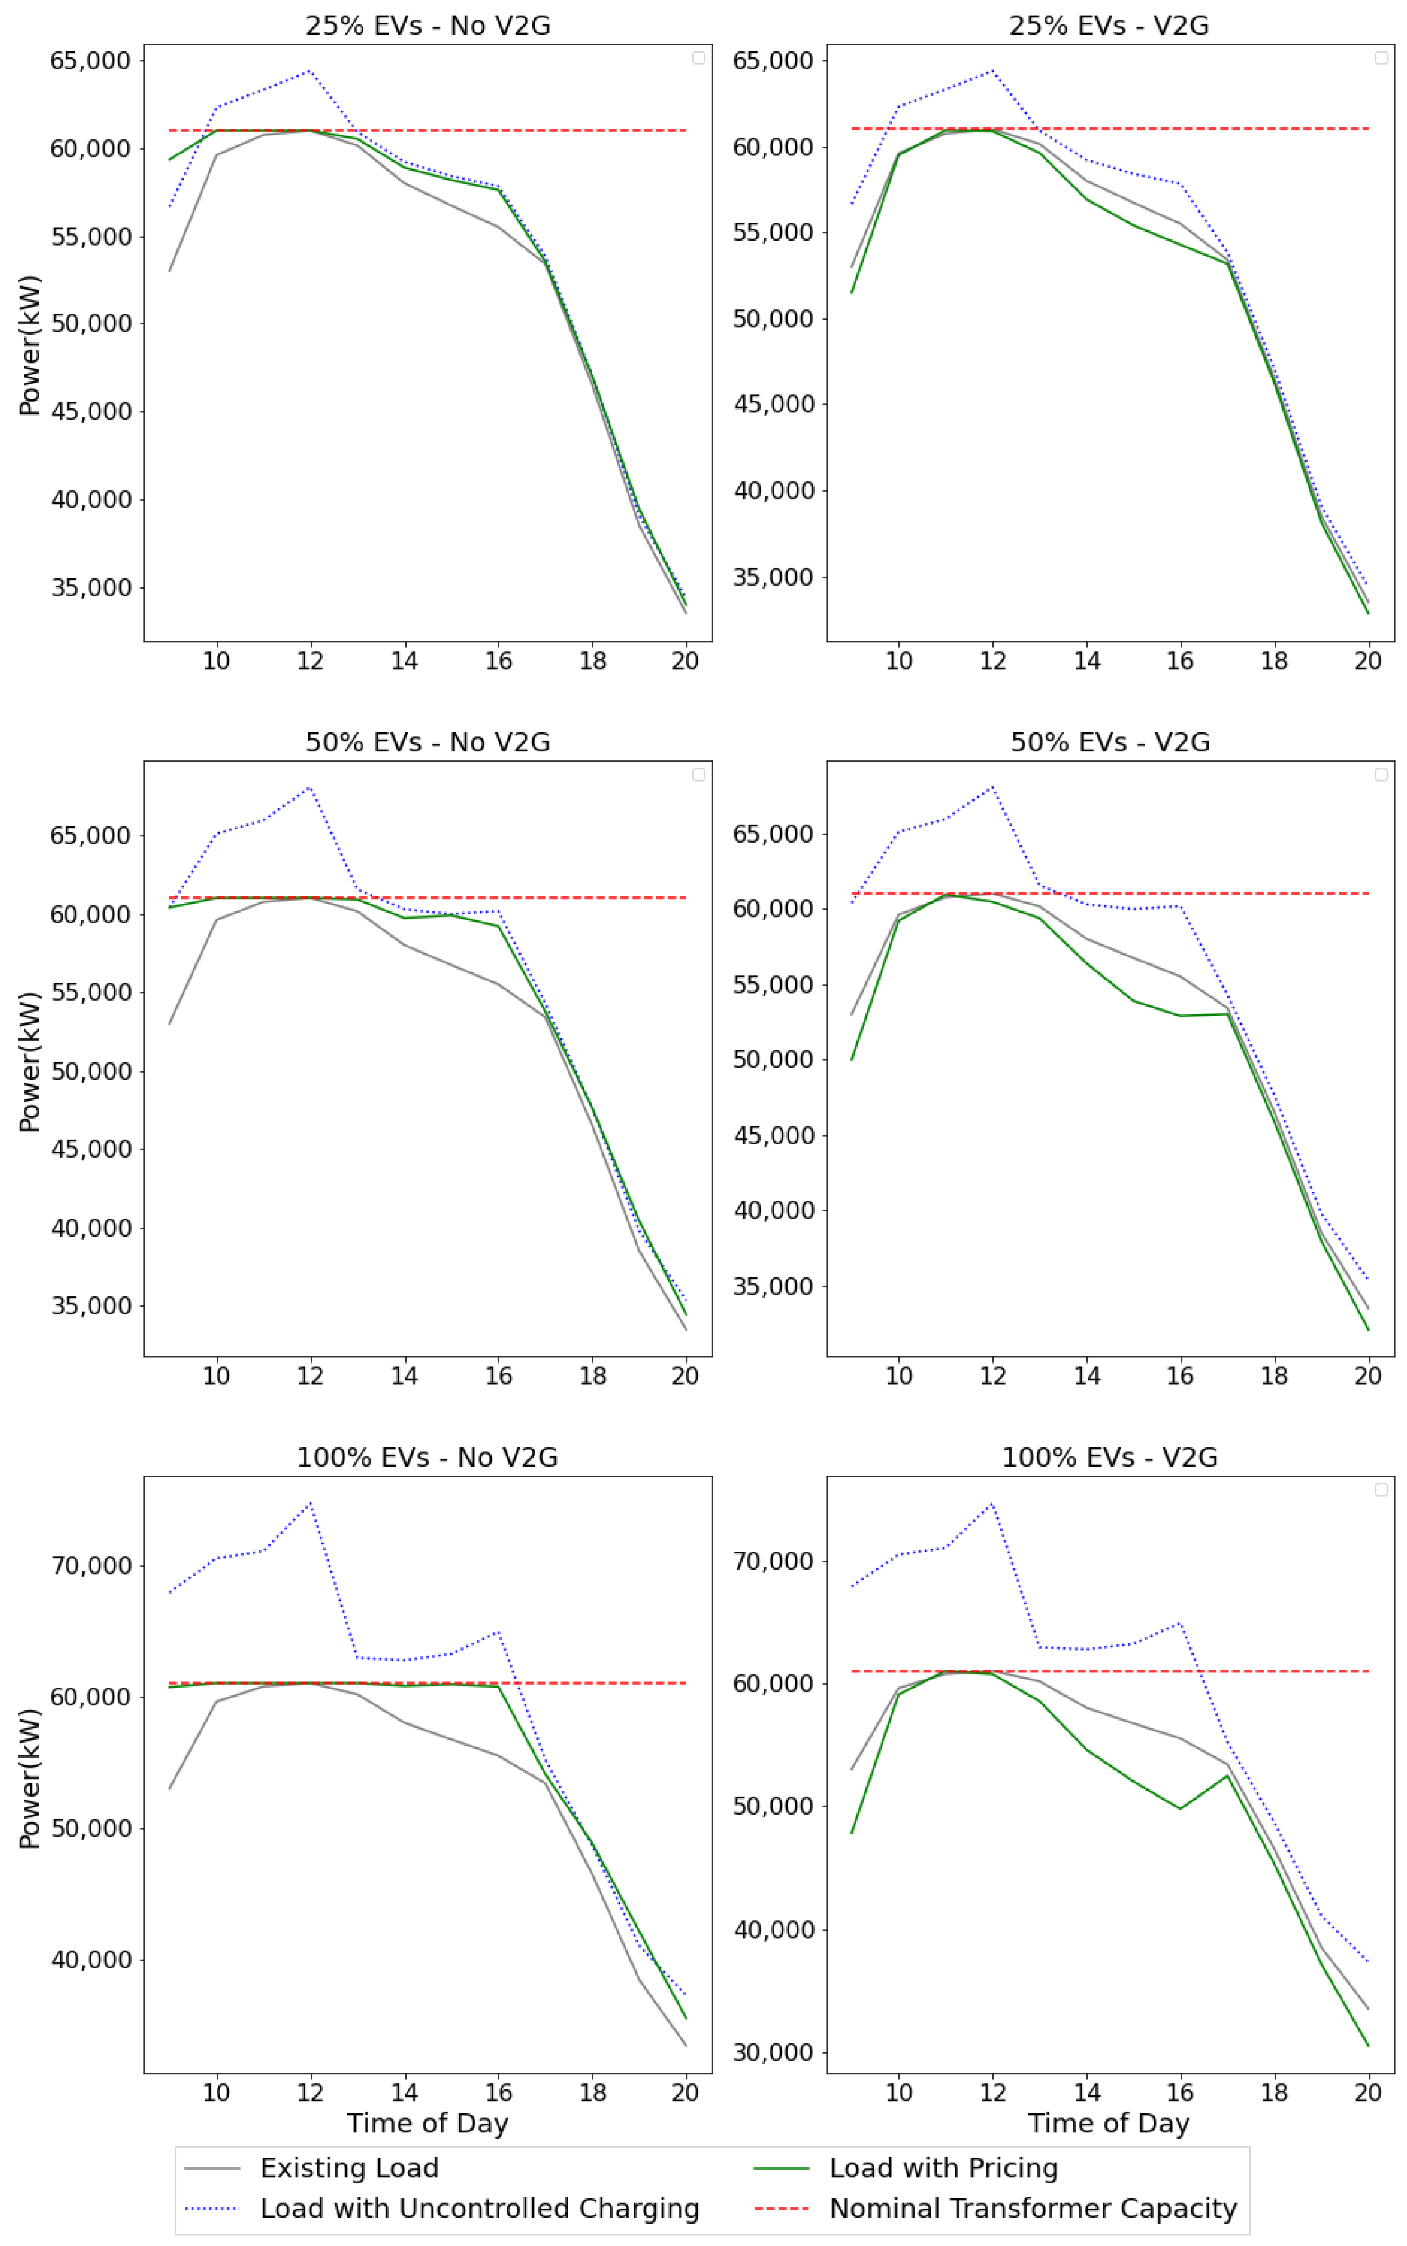
Figure 8 and Figure 9 do not include V2G services for parking customers. The impact of V2G services can be observed in Figure 10. From this point on, only the Canary Wharf results are presented because the relative effects of the parameters on the results were similar for the Westfield area. The difference is that now, the overload capacity was kept fixed at 0%, and it is replaced in the graphs by the V2G availability parameter.
It is interesting to observe that the final load curve is below the baseline curve for the majority of the day. This can be explained by the fact that several drivers prefer to sell electricity back to the grid instead of charging their cars, even taking into account the disutility from the reduced SOC for the rest of their daily trips. This is extremely useful for periods of peak demand because it allows other drivers with higher charging needs to refill their batteries. Nevertheless, it incurs additional imbalance costs to the CSP during nonpeak periods, when the V2G services are not required.
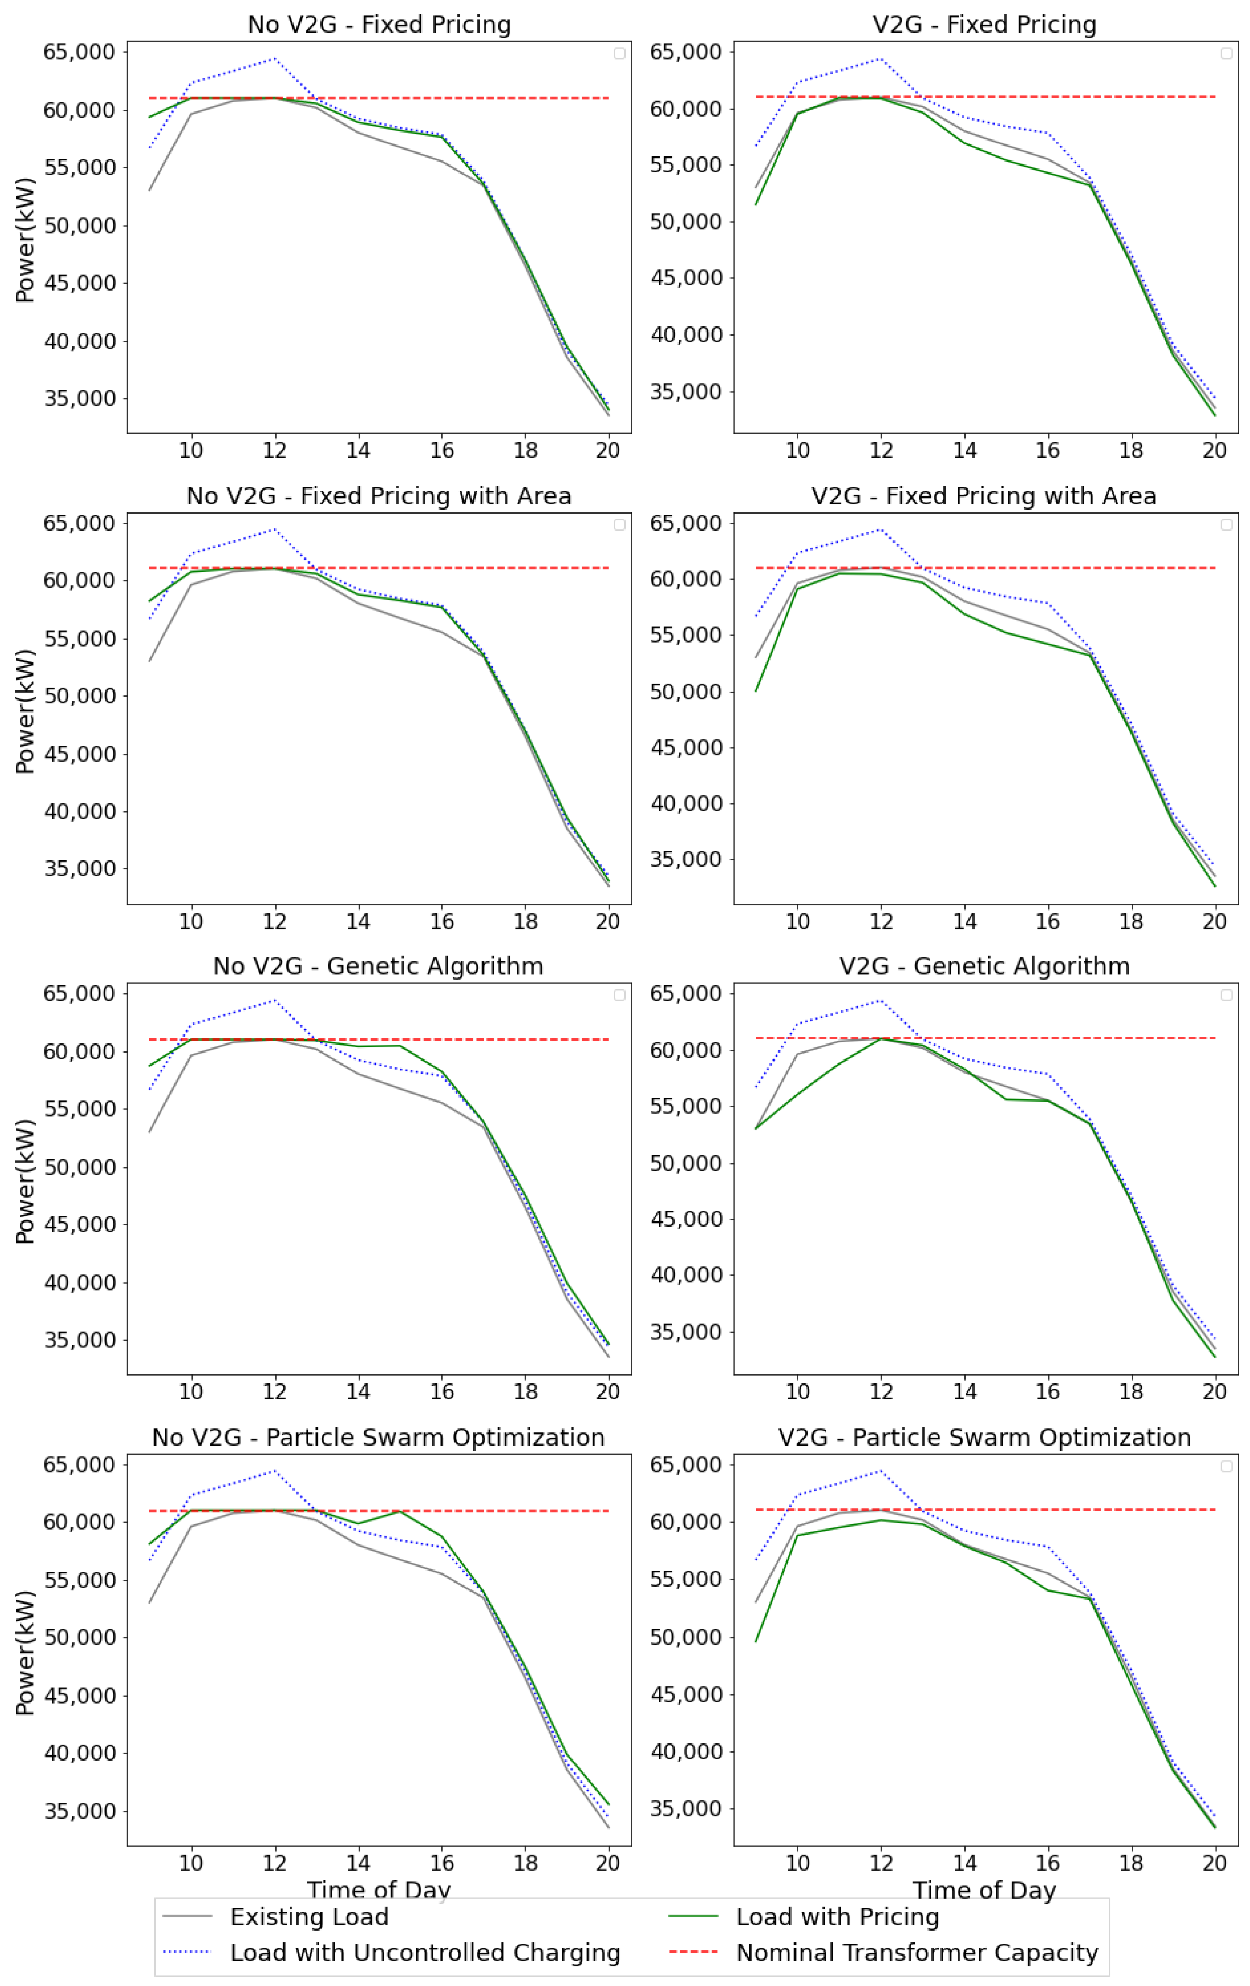
The net revenue for the CSP is optimized with the choice-based pricing algorithm that was presented in the previous sections. Figure 11 shows the load curves under the four different control approaches, with and without V2G availability. FP2 is similar to FP, but now, the area factor is included in the calculation of Equation (1). In this way, busy parking is penalized, and drivers are incentivized to plug in their cars in a more distant location.
In terms of overall load scheduling, this method has very similar results to the previous one. On the other hand, the two solution algorithms for our optimization problem have a more profound effect. When V2G is not available, a higher portion of charging events is shifted from peak to nonpeak hour slots by setting prices that are closer to the drivers’ willingness to pay. To better understand what happens when V2G services are provided, one can have a look at Table 2.
When drivers are allowed to sell electricity to the grid using V2G technology, all the methods result in losses for the CSP because the expenses from the “selling” bundles exceed the income from the “buying” bundles. The choice-based optimization reduces the losses, especially when the GA solution is applied. The reduced parking load factors indicate that upon decreasing the sale prices to avoid excessive V2G and reduce the imbalance costs, the V2G activities are spread throughout the day.
The trade-offs between charging and discharging in the choice model heavily rely on the customers’ sensitivity to price. As was highlighted earlier, the class-specific parameters for the two latent classes were estimated by the authors in previous work. Therefore, the estimates were bound to the tariffs used in the choice experiments and do not necessarily reflect future fluctuations in electricity prices. The effect of this behavioural uncertainty on the outcome of the optimization problem was addressed by performing a sensitivity analysis regarding the price coefficients. The outcomes are demonstrated in Table 3 for the GA solution. The relative differences were similar for the PSO solution.
The original specification was defined as “Medium Price Sensitivity”, and the price parameters were halved and doubled, respectively, for the “Decreased” and the “Increased” scenarios. When drivers are less sensitive to charging prices, their utility is overruled by their energy needs and their willingness to walk, so there is an increase in drivers that charge in parking lot 1, and the overall revenue becomes positive for the CSP. On the contrary, when drivers are more sensitive to charging prices, the number of V2G events increases in both parking facilities. Consequently, the imbalance costs are increased by the excess electricity, and the optimal solution leads to an overall loss.
The following results indicate the significance of the demand parameters in the developed framework. If similar datasets become available in the future, a cross-validation could be useful since some elements of the choice experiments that were used are not established at the moment (e.g., workplace charging services), and some properties were approximated (e.g., the sensitivity to energy quantity). At the same time, the estimated parameters should be treated with caution when applied to other geographic locations, since it is likely that they are correlated with some idiosyncratic preferences of British drivers.
The next step in the analysis was to understand how the optimal prices were related to the attributes of the charging bundles. Figure 12 demonstrates a classification of the prices that were generated with the GA solution by power and charging duration. It is observed that short-duration, high-power bundles tend to be more dispersed around 0 compared to long-duration, low-power bundles. This is essentially an indirect reward to users that strain the power network less by spreading their charging demand over time.
To conclude this section, we performed a comparative analysis of the two algorithms’ performance in terms of computational time. The run time of the optimization was evaluated for three different parameters: (a) the number of iterations, (b) the number of populations (GA) or the number of particles (PSO) and (c) the effect of scaling up the number of EVs. All the parameters were found to have linear effects on computational time as is shown in Table 4.
The metaheuristics’ overall performance can be summarized as follows:
- Their computational times are very similar;
- The GA algorithm provides a better solution without V2G;
- The PSO algorithm provides a better solution with V2G.
6. Conclusions
This paper shows how a choice-based revenue-management problem can be integrated with the parking and charging choices of electric vehicle drivers. In particular, an integrated latent class and nonlinear framework was developed to optimize prices for charging services provided by a charging service provider.
There are two innovative elements of the developed methodological framework in comparison to existing research.
First, the endogenous relationship between the sensitivity of EV drivers to charging characteristics and the charging coordination methods applied by the operator was captured with a sophisticated disaggregate model of demand. Most importantly, the parameters of this model were empirically estimated from user-tailored choice experiments for charging choices.
The second contribution of this paper is the development of a framework that can have direct implementation in the charging service industry. Revenue management allows the closed-loop integration of supply and demand and has proven to be financially beneficial in several service industries. The excessive number of papers that have been written in the last decade aiming to accommodate the increasing charging needs of EV drivers cannot always be aligned with practice-ready business models.
A microsimulation framework was used to implement the pricing model for a synthesized network of two distinctive regions. Baseload electricity curves were modelled by scaling up typical load profiles, and survey data for travel behaviour were scaled up by using synthetic population methods. The charging behaviour of the simulated drivers was modelled using an advanced discrete choice model, and different scenarios were established for EV penetration rates, the overload capacity and the V2G availability.
One limitation of this online reservation system is that it cannot capture last-minute stochastic arrivals. As was explained in the introduction, this approach reduces the uncertainty both for the users who need to be reassured of a certain level of SOC for their subsequent trip and for the parking operator who wants to achieve a smooth allocation of charging demand. However, it results in a conservative lower-bound estimation of the optimal revenue. Future research could combine a revenue-management approach, which by definition, has to be resolved in a preservice booking period, with a more dynamic application that considers last-minute arrivals.
The results suggest that the revenue-management framework simultaneously maximizes revenue and assists in the prevention of local transformer overloading. Charging peaks are alleviated especially when V2G services are adopted to provide energy back to the grid. In addition, it accommodates drivers during the peak hours, while before, they were unable to charge their vehicles because of network constraints.
The outcomes of this research could potentially be interesting for retail operators that host charging infrastructure and want to understand revenue opportunities from merging charging and retailing services. The charging bundles described could be extended to incorporate a point system or the exchange of electricity with retail products. At the same time, the power constraints could reflect the energy needs of a retail building, such as, for example, lighting, heating and cooling for a supermarket in high-demand hours. It is significant to highlight here the rapid increase in studies that are exploring the integration of V2G with energy-management systems in buildings [59,60,61].
Author Contributions
Conceptualization, C.L., A.S. and J.W.P.; methodology, C.L., A.S. and J.W.P.; software, C.L.; validation, C.L.; formal analysis, C.L.; investigation, C.L., A.S., and J.W.P.; resources, A.S. and J.W.P.; data curation, C.L.; writing—original draft preparation, C.L.; writing—review and editing, C.L. and A.S.; visualization, C.L.; supervision, A.S. and J.W.P.; project administration, A.S. and J.W.P.; funding acquisition, A.S. and J.W.P. All authors have read and agreed to the published version of the manuscript.
Funding
This work was partially supported by the Grantham Institute for Climate Change and Climate KIC.
Institutional Review Board Statement
Not applicable.
Informed Consent Statement
Not applicable.
Data Availability Statement
The data presented in this study are openly available in Dryad at https://0-doi-org.brum.beds.ac.uk/10.5061/dryad.c59zw3r68.
Acknowledgments
The authors would like to thank Transport for London for providing the LTDS dataset that was indispensable for the analysis. We would like to dedicate this paper to the recently deceased J.W.P. for his invaluable inspiration and support towards this research.
Conflicts of Interest
The authors declare no conflict of interest. The funders had no role in the design of the study; in the collection, analyses or interpretation of data; in the writing of the manuscript; or in the decision to publish the results.
References
- Electric Drive Transportation Association. Electric Drive Sales Dashboard. Available online: http://electricdrive.org/index.php?ht¼d/sp/i/20952/pid/20952 (accessed on 28 December 2019).
- Ulrich, L. 2017 top ten tech cars. IEEE Spectr. 2017, 54, 26–35. [Google Scholar] [CrossRef]
- Kempton, W.; Tomic, J. Vehicle-to-grid implementation: From stabilizing the grid to supporting large-scale renewable energy. J. Power Sources 2005, 144, 280–294. [Google Scholar] [CrossRef]
- Kempton, W.; Tomić, J. Vehicle-to-grid power fundamentals: Calculating capacity and net revenue. J. Power Sources 2005, 144, 268–279. [Google Scholar] [CrossRef]
- Acha, S.; Green, T.C.; Shah, N. Effects of Optimised Plug-In Hybrid Vehicle Charging Strategies on Electric Distribution Network Losses. In Proceedings of the IEEE PES T&D 2010, Sao Paulo, Brazil, 8–10 November 2010; pp. 1–6. [Google Scholar]
- Clement-Nyns, K.; Haesen, E.; Driesen, J. Coordinated Charging of Multiple Plugin Hybrid Electric Vehicles in Residential Distribution Grids. In Proceedings of the 2009 IEEE/PES Power Systems Conference and Exposition, Seattle, WA, USA, 15–18 March 2009; pp. 1–7. [Google Scholar]
- Zheng, Y.; Shang, Y.; Shao, Z.; Jian, L. A novel real-time scheduling strategy with near-linear complexity for integrating large-scale electric vehicles into smart grid. Appl. Energy 2018, 217, 1–13. [Google Scholar] [CrossRef]
- Galus, M.D.; Waraich, R.A.; Noembrini, F.; Steurs, K.; Georges, G.; Boulouchos, K.; Axhausen, K.W.; Andersson, G. Integrating power systems, transport systems and vehicle technology for electric mobility impact assessment and efficient control. IEEE Trans. Smart Grid 2012, 3, 934–949. [Google Scholar] [CrossRef]
- Shafiekhah, M.; Heydarian-Forushani, E.; Golshan, M.; Siano, P.; Moghaddam, M.P.; Sheikh-El-Eslami, M.; Catalão, J. Optimal trading of plug-in electric vehicle aggregation agents in a market environment for sustainability. Appl. Energy 2016, 162, 601–612. [Google Scholar] [CrossRef]
- Lopes, J.A.P.; Soares, F.J.; Almeida, P.M.R. Identifying Management Procedures to Deal with Connection of Electric Vehicles in the Grid. In Proceedings of the 2009 IEEE Bucharest PowerTech, Bucharest, Romania, 28 June–2 July 2009; pp. 1–8. [Google Scholar]
- Waraich, R.A.; Galus, M.D.; Dobler, C.; Balmer, M.; Andersson, G.; Axhausen, K.W. Plug-in hybrid electric vehicles and smart grids: Investigations based on a microsimulation. Transp. Res. Part C Emerg. Technol. 2013, 28, 74–86. [Google Scholar] [CrossRef] [Green Version]
- Gan, L.; Topcu, U.; Low, S.H. Optimal decentralized protocol for electric vehicle charging. IEEE Trans. Power Syst. 2013, 28, 940–951. [Google Scholar] [CrossRef] [Green Version]
- Ma, Z.; Callaway, D.; Hiskens, I. Decentralised Charging Control for Large Populations of Plug-In Electric Vehicles. In Proceedings of the CDC 2010: 49th IEEE Conference on Decision and Control, Atlanta, GA, USA, 15–17 December 2010; pp. 206–212. [Google Scholar]
- Karfopoulos, E.L.; Hatziargyriou, N.D. A multi-agent system for controlled charging of a large population of electric vehicles. IEEE Trans. Power Syst. 2013, 28, 1196–1204. [Google Scholar] [CrossRef]
- Wen, C.-K.; Chen, J.-C.; Teng, J.-H.; Ting, P. Decentralized plug-in electric vehicle charging selection algorithm in power systems. IEEE Trans. Smart Grid 2012, 3, 1779–1789. [Google Scholar] [CrossRef]
- Papadaskalopoulos, D.; Strbac, G. Participation of Electric Vehicles in Electricity Markets through a Decentralised Mechanism. In Proceedings of the 2011 2nd IEEE PES International Conference and Exhibition on Innovative Smart Grid Technologies (ISGT Europe 2011), Manchester, UK, 5–7 December 2011; pp. 1–8. [Google Scholar]
- Papadaskalopoulos, D.; Strbac, G. Decentralised Participation of Electric Vehicles in Network-Constrained Market Operation. In Proceedings of the 2012 3rd IEEE PES Innovative Smart Grid Technologies Europe (ISGT Europe 2012), Berlin, Germany, 14–17 October 2012; pp. 1–8. [Google Scholar]
- Cao, Y.; Tang, S.; Li, C.; Zhang, P.; Tan, Y.; Zhang, Z.; Li, J. An optimized EV charging model considering TOU price and SOC curve. IEEE Trans. Smart Grid 2012, 3, 388–393. [Google Scholar] [CrossRef]
- Bessa, R.J.; Matos, M.A. Global against divided optimisation for the participation of an EV aggregator in the day-ahead electricity market. Part I: Theory. Electr. Power Syst. Res. 2013, 95, 309–318. [Google Scholar] [CrossRef] [Green Version]
- Latinopoulos, C. Efficient Operation of Recharging Infrastructure for the Accommodation of Electric Vehicles: A Demand Driven Approach. Ph.D. Thesis, Imperial College London, London, UK, 2016. Available online: https://spiral.imperial.ac.uk/handle/10044/1/33340 (accessed on 25 December 2019).
- Rotering, N.; Ilic, M.D. Optimal charge control of plug-in hybrid electric vehicles in deregulated electricity markets. IEEE Trans. Power Syst. 2011, 26, 1021–1029. [Google Scholar] [CrossRef]
- Zhang, B.; Lam, A.Y.; Dominguez-Garcia, A.D.; Tse, D. An optimal and distributed method for voltage regulation in power distribution systems. IEEE Trans. Power Syst. 2015, 30, 1–13. [Google Scholar] [CrossRef] [Green Version]
- Shokrzadeh, S.; Ribberink, H.; Rishmawi, I.; Entchev, E. A simplified control algorithm for utilities to utilize plug-in electric vehicles to reduce distribution transformer overloading. Energy 2017, 133, 1121–1131. [Google Scholar] [CrossRef]
- Deforest, N.; Macdonald, J.S.; Black, D.R. Day ahead optimization of an electric vehicle fleet providing ancillary services in the Los Angeles Air Force Base vehicle-to-grid demonstration. Appl. Energy 2018, 210, 987–1001. [Google Scholar] [CrossRef] [Green Version]
- Vandael, S.; Boucké, N.; Holvoet, T.; de Craemer, K.; Deconinck, G. Decentralized Coordination of Plug-In Hybrid Vehicles for Imbalance Reduction in a Smart Grid. In Proceedings of the AAMAS ’11: The 10th International Conference on Autonomous Agents and Multiagent Systems, Taipei, Taiwan, 2–6 May 2011. [Google Scholar]
- Yao, L.; Lim, W.H.; Tsai, T.S. A real-time charging scheme for demand response in electric vehicle parking station. IEEE Trans. Smart Grid 2017, 8, 52–62. [Google Scholar] [CrossRef]
- Shafie-Khah, M.; Heydarian-Forushani, E.; Osorio, G.J.; Gil, F.A.S.; Aghaei, J.; Barani, M.; Catalao, J.P.S. Optimal behavior of electric vehicle parking lots as demand response aggregation agents. IEEE Trans. Smart Grid 2015, 7, 2654–2665. [Google Scholar] [CrossRef]
- Zhang, G.; Tan, S.T.; Wang, G.G. Real-time smart charging of electric vehicles for demand charge reduction at non-residential sites. IEEE Trans. Smart Grid 2018, 9, 4027–4037. [Google Scholar] [CrossRef]
- Su, W.; Chow, M.-Y. Performance evaluation of an EDA-based large-scale plug-in hybrid electric vehicle charging algorithm. IEEE Trans. Smart Grid 2011, 3, 308–315. [Google Scholar] [CrossRef]
- Mehta, R.; Srinivasan, D.; Khambadkone, A.M.; Yang, J.; Trivedi, A. Smart charging strategies for optimal integration of plug-in electric vehicles within existing distribution system infrastructure. IEEE Trans. Smart Grid 2018, 9, 299–312. [Google Scholar] [CrossRef]
- Babic, J.; Carvalho, A.; Ketter, W.; Podobnik, V. Extending Parking Lots with Electricity Trading Agent Functionalities. In Proceedings of the Workshop on Agent-Mediated Electronic Commerce and Trading Agent Design and Analysis (AMEC/TADA 2015), Istanbul, Turkey, 4 May 2015. [Google Scholar]
- Moradijoz, M.; Moghaddam, M.P.; Haghifam, M.R.; Alishahi, E. A multi-objective optimization problem for allocating parking lots in a distribution network. Int. J. Electr. Power Energy Syst. 2013, 46, 115–122. [Google Scholar] [CrossRef]
- Hashimoto, S.; Kanamori, R.; Ito, T. Auction-Based Parking Reservation System with Electricity Trading. In Proceedings of the 2013 IEEE 15th Conference on Business Informatics (CBI), Vienna, Austria, 15–18 July 2013; pp. 33–40. [Google Scholar]
- Daina, N.; Sivakumar, A.; Polak, J.W. Electric vehicle charging choices: Modelling and implications for smart charging services. Transp. Res. Part C Emerg. Technol. 2017, 81, 36–56. [Google Scholar] [CrossRef]
- Fazelpour, F.; Vafaeipour, M.; Rahbari, O.; Rosen, M.A. Intelligent optimization to integrate a plug-in hybrid electric vehicle smart parking lot with renewable energy resources and enhance grid characteristics. Energy Convers. Manag. 2014, 77, 250–261. [Google Scholar] [CrossRef]
- Chung, Y.-W.; Khaki, B.; Li, T.; Chu, C.; Gadh, R. Ensemble machine learning-based algorithm for electric vehicle user behavior prediction. Appl. Energy 2019, 254, 113732. [Google Scholar] [CrossRef]
- Latinopoulos, C.; Sivakumar, A.; Polak, J. Response of electric vehicle drivers to dynamic pricing of parking and charging services: Risky choice in early reservations. Transp. Res. Part C Emerg. Technol. 2017, 80, 175–189. [Google Scholar] [CrossRef]
- van Ryzin, G.; McGill, G. Revenue management without forecasting or optimisation: An adaptive algorithm for determining airline seat protection levels. Manag. Sci. 2000, 46, 760–775. [Google Scholar] [CrossRef] [Green Version]
- McGill, J.I.; van Ryzin, G.J. Revenue management: Research overview and prospects. Transp. Sci. 1999, 33, 233–256. [Google Scholar] [CrossRef]
- Guadix, J.; Onieva, L.; Muñuzuri, J.; Cortés, P. An overview of revenue management in service industries: An application to car parks. Serv. Ind. J. 2011, 31, 91–105. [Google Scholar] [CrossRef]
- Akhavan-Tabatabaei, R.; Bolívar, M.A.; Hincapie, J.A.; Medaglia, A.L. On the optimal parking lot subscription policy problem: A hybrid simulation-optimisation approach. Ann. Oper. Res. 2014, 222, 29–44. [Google Scholar] [CrossRef]
- Teodorović, D.; Lučić, P. Intelligent parking systems. Eur. J. Oper. Res. 2006, 175, 1666–1681. [Google Scholar] [CrossRef]
- Flath, C.M.; Gottwalt, S.; Ilg, J.P. A Revenue Management Approach for Efficient Electric Vehicle Charging Coordination. In Proceedings of the HICSS ’12 Proceedings of the 45th Hawaii International Conference on System Sciences, Washington, DC, USA, 4–7 January 2012; pp. 1888–1896. [Google Scholar]
- Ghosh, A.; Aggarwal, V. Control of Charging of Electric Vehicles through Menu-Based Pricing. In Proceedings of the IEEE International Conference on Communications (ICC), Paris, France, 21–25 May 2017. [Google Scholar]
- Elexon. Imbalance Pricing Guidance. A Guide to Electricity Imbalance Pricing. 2019. Available online: www.elexon.co.uk/documents/training-guidance/bsc-guidance-notes/imbalance-pricing/ (accessed on 5 January 2020).
- Vickrey, W.S. Congestion theory and transport investment. Am. Econ. Rev. 1969, 59, 251–260. [Google Scholar]
- Daina, N. Modelling Electric Vehicle Use and Charging Behavior. Ph.D. Thesis, Imperial College London, London, UK, 2014. Available online: https://spiral.imperial.ac.uk:8443/handle/10044/1/25018 (accessed on 28 December 2019).
- Hess, S.; Polak, J.W.; Daly, A.; Hyman, G. Flexible substitution patterns in models of mode and time of day choice: New evidence from the UK and The Netherlands. Transportation 2006, 34, 213–238. [Google Scholar] [CrossRef]
- Gallego, G.; Iyengar, G.; Phillips, R.; Dubey, A. Managing Flexible Products on a Network. Report TR-2004-01; Computational Optimisation Research Center, Department of Industrial Engineering and Operations Research, Columbia University: New York, NY, USA, 2004. [Google Scholar]
- Li, H.; Huh, W.T. Pricing multiple products with the multinomial logit and nested logit models: Concavity and implications. Manuf. Serv. Oper. Manag. 2011, 13, 549–563. [Google Scholar] [CrossRef] [Green Version]
- Hetrakul, P.; Cirillo, C. A latent class choice based model system for railway optimal pricing and seat allocation. Transp. Res. Part E Logist. Transp. Rev. 2014, 61, 68–83. [Google Scholar] [CrossRef]
- Battistelli, C.; Baringo, L.; Conejo, A. Optimal energy management of small electric energy systems including V2G facilities and renewable energy sources. Electr. Power Syst. Res. 2012, 92, 50–59. [Google Scholar] [CrossRef]
- London Travel Demand Survey. 2011. Available online: www.clocs.org.uk/wp-content/uploads/2014/05/london-travel-demand-survey-2011.pdf (accessed on 4 January 2020).
- United States Environmental Protection Agency (EPA) (2020) Fuel Economy. Available online: www.epa.gov/fueleconomy/ (accessed on 17 July 2020).
- Yang, Z.; Li, K.; Foley, A. Computational scheduling methods for integrating plug-in electric vehicles with power systems: A review. Renew. Sustain. Energy Rev. 2015, 51, 396–416. [Google Scholar] [CrossRef]
- Reid, D.J. Genetic algorithms in constrained optimisation. Math. Comput. Model. 1996, 23, 87–111. [Google Scholar] [CrossRef]
- Aghajani, S.; Kalantar, M. A cooperative game theoretic analysis of electric vehicles parking lot in smart grid. Energy 2017, 137, 129–139. [Google Scholar] [CrossRef]
- Hutson, C.; Venayagamoorthy, G.K.; Corzine, K.A. Intelligent Scheduling of Hybrid and Electric Vehicle Storage Capacity in a Parking Lot for Profit Maximization in Grid Power Transactions. In Proceedings of the IEEE Energy 2030 Conference, Atlanta, GA, USA, 17–18 November 2008; pp. 1–8. [Google Scholar]
- Sehar, F.; Pipattanasomporn, M.; Rahman, S. Demand management to mitigate impacts of plug-in electric vehicle fast charge in buildings with renewables. Energy 2017, 120, 642–651. [Google Scholar] [CrossRef] [Green Version]
- Alirezaei, M.; Noori, M.; Tatari, O. Getting to net zero energy building: Investigating the role of vehicle to home technology. Energy Build. 2016, 130, 465–476. [Google Scholar] [CrossRef]
- Quddus, A.; Shahvari, O.; Marufuzzaman, M.; Usher, J.M.; Jaradat, R. A collaborative energy sharing optimization model among electric vehicle charging stations, commercial buildings, and power grid. Appl. Energy 2018, 229, 841–857. [Google Scholar] [CrossRef]
Figure 1.
Business-to-Business (B2B) and Business-to-Customer (B2C) services of Charging Service Providers (CSPs) in public and private parking facilities with Vehicle-to-Grid (V2G)-enabled charging infrastructure.
Figure 1.
Business-to-Business (B2B) and Business-to-Customer (B2C) services of Charging Service Providers (CSPs) in public and private parking facilities with Vehicle-to-Grid (V2G)-enabled charging infrastructure.

Figure 2.
Graphical representation of charging-induced schedule delay for four scenarios: (a) there is no schedule disutility, as the charging and the parking episodes are identical; (b) there is no schedule disutility, as the charging episode is a subset of the parking episode; (c) there is Charging-Induced Schedule Delay Early (CISDE) because both episodes start before the Preferred Arrival Time (PAT); and (d) there is Charging-Induced Schedule Delay Late (CISDL) for the next activity because both episodes finish later than the typical departure time. The red dotted lines in (c,d) represent the actual arrival times that are different from the preferred arrival times.

Figure 3.
Decomposed elements of the choice-based revenue-management approach. The choice probability for a charging service for an electric vehicle driver affects the revenue outcome for the CSP. Simultaneously, the price, which is the decision variable of the optimization problem, can alter the choice probability, creating a closed-loop formulation with a nonlinear objective function.

Figure 4.
Typical winter weekday baseload curves for the areas of analysis (dashed lines represent installed capacity for the scenario of 20% overload capacity).
Figure 4.
Typical winter weekday baseload curves for the areas of analysis (dashed lines represent installed capacity for the scenario of 20% overload capacity).

Figure 5.
Genetic algorithm solution for price optimization.

Figure 6.
Particle Swarm Optimization (PSO) solution for price optimization.

Figure 7.
Simulation framework for charging and V2G coordination. The three levels capture (a) the synthetic approach to building a representative demand for travel and energy, (b) the technology and behavioural assumptions and (c) the dynamic parameters that were evaluated under different scenarios.

Figure 8.
Charging allocation analysis for Electric Vehicle (EV) market penetration and overload capacity (Canary Wharf area). The red dotted line represents the nominal capacity of the distribution transformer; the grey line, the baseline load demand; the blue dotted line, the uncoordinated charging scenario; and the green line, the charging allocation with Fixed Pricing based on time of day (FP).

Figure 9.
Charging allocation analysis for EV market penetration and overload capacity (Westfield Shopping Centre area). The red dotted line represents the nominal capacity of the distribution transformer; the grey line, the baseline load demand; the blue dotted line, the uncoordinated charging scenario; and the green line; the charging allocation with Fixed Pricing based on time of day (FP).

Figure 10.
Charging allocation analysis for EV market penetration and V2G availability (Canary Wharf area and 0% overload capacity). The red dotted line represents the nominal capacity of the distribution transformer; the grey line, the baseline load demand; the blue dotted line, the uncoordinated charging scenario; and the green line, the charging allocation with Fixed Pricing based on time of day (FP).

Figure 11.
Charging allocation analysis for V2G availability and control algorithm (Canary Wharf area and 0% overload capacity). The red dotted line represents the nominal capacity of the distribution transformer; the grey line, the baseline load demand; the blue dotted line, the uncoordinated charging scenario; and the green line, the charging allocation with the respective algorithm.

Figure 12.
Classification of GA-optimized prices for charging and V2G bundles by power and charging duration.
Figure 12.
Classification of GA-optimized prices for charging and V2G bundles by power and charging duration.


Table 1.
Description of the input data used in the simulation.
| Description | Value Range | Description | Value Range |
|---|---|---|---|
| Parking and charging characteristics | Demographics | ||
| Parking start time | 9:00–20:00 | Gender | Male or female |
| Parking end time | 10:00–21:00 | Age | <=40 vs. >40 |
| Parking location | 1 or 2 | Marital status | Married vs. all other categories |
| Constant charging rate (in kW) | 0.5–12 | Employment status | Employed vs. unemployed |
| Walking distance from activity to parking locations (in m) | 10–1700 | Income (in GBP) | <GBP 10,000 to >100,000 |
| Energy requirements (in kWh) | 0–24 | Children in the household | Yes or no |
| Charging bundle characteristics | Context variables | ||
| Discrete charging rate (in kW) | [−6,−3,3,6,8,12] | Day of week | Monday–Sunday |
| CISDE (in minutes) | 0–180 | Initial charging prices (GBP/kWh) | 0.10–0.55 |
| CISDL (in minutes) | 0–180 | Energy consumption (kWh/miles) | 30/100 |
| Charging duration (in minutes) | 0–240 | Battery range (in miles) | 83 |
| Number of products (no V2G/V2G) | 46/60 | Charging efficiency | 80% |
| Number of charging posts | 625 | ||
| Work-based tour | Yes or no | ||
| Distribution network headroom | 20% | ||
| Size of synthetic daily trip dataset | |||
| Canary Wharf | Westfield | ||
| 25% EVs scenario 50% EVs scenario 100% EVs scenario | 2713 5426 10,852 | 3590 7180 14,360 |
Table 2.
Revenue performance and parking load factors for various parameter combinations.
| V2G Availability | EV Market Penetration | Control Scenario | Overload Capacity | Revenue (GBP) | Parking Load Factor | Parking Load Factor (P1) | Parking Load Factor (P2) |
|---|---|---|---|---|---|---|---|
| No V2G | 100% | FP | 0.0 | 5768 | 40% | 43% | 38% |
| 0.2 | 7980 | 69% | 69% | 68% | |||
| 50% | FP | 0.0 | 3775 | 27% | 27% | 27 | |
| 0.2 | 5268 | 50% | 51% | 50% | |||
| 25% | FP | 0.0 | 1959 | 15% | 16% | 14% | |
| 0.2 | 2818 | 31% | 31% | 31% | |||
| FP2 | 0.0 | 1835 | 15% | 8% | 22% | ||
| GA | 0.0 | 6056 | 15% | 16% | 14% | ||
| PSO | 0.0 | 8051 | 15% | 16% | 13% | ||
| V2G | 100% | FP | 0.0 | −5278 | 72% | 73% | 71% |
| 0.2 | −5026 | 72% | 72% | 72% | |||
| 50% | FP | 0.0 | −2691 | 48% | 51% | 45% | |
| 0.2 | −2657 | 50% | 51% | 48% | |||
| 25% | FP | 0.0 | −1358 | 25% | 27% | 23% | |
| 0.2 | −1230 | 27% | 28% | 26% | |||
| FP2 | 0.0 | −2005 | 25% | 31% | 18% | ||
| GA | 0.0 | −6.86 | 18% | 9% | 26% | ||
| PSO | 0.0 | −1040 | 20% | 20% | 20% |
Table 3.
Analysis of revenue and parking load factor sensitivity to price parameters.
| Price Sensitivity | Revenue (GBP) | Parking Load Factor | Parking Load Factor (P1) | Parking Load Factor (P2) |
|---|---|---|---|---|
| Decreased | 850.21 | 23% | 24% | 13% |
| Medium | −6.41 | 20% | 11% | 28% |
| Increased | −791.26 | 18% | 17% | 30% |
Table 4.
Comparative analysis of computational times for solution algorithms.
| Genetic Algorithms | Particle Swarm Optimization | ||||||
|---|---|---|---|---|---|---|---|
| No. of Iter. | No. of Populations | Scale (%) | Time (s) | No. of Iter. | No. of Populations | Scale (%) | Time (s) |
| 10 | 10 | 25 | 20.1 | 10 | 10 | 25 | 17.1 |
| 10 | 10 | 50 | 40.6 | 10 | 10 | 50 | 35.0 |
| 10 | 10 | 100 | 83.6 | 10 | 10 | 100 | 69.2 |
| 100 | 10 | 25 | 186.7 | 100 | 10 | 25 | 184.5 |
| 10 | 100 | 25 | 192.7 | 10 | 100 | 25 | 194.3 |
Publisher’s Note: MDPI stays neutral with regard to jurisdictional claims in published maps and institutional affiliations. |
© 2021 by the authors. Licensee MDPI, Basel, Switzerland. This article is an open access article distributed under the terms and conditions of the Creative Commons Attribution (CC BY) license (http://creativecommons.org/licenses/by/4.0/).
Share and Cite
MDPI and ACS Style
Latinopoulos, C.; Sivakumar, A.; Polak, J.W. Optimal Pricing of Vehicle-to-Grid Services Using Disaggregate Demand Models. Energies 2021, 14, 1090. https://0-doi-org.brum.beds.ac.uk/10.3390/en14041090
AMA Style
Latinopoulos C, Sivakumar A, Polak JW. Optimal Pricing of Vehicle-to-Grid Services Using Disaggregate Demand Models. Energies. 2021; 14(4):1090. https://0-doi-org.brum.beds.ac.uk/10.3390/en14041090
Chicago/Turabian StyleLatinopoulos, Charilaos, Aruna Sivakumar, and John W. Polak. 2021. "Optimal Pricing of Vehicle-to-Grid Services Using Disaggregate Demand Models" Energies 14, no. 4: 1090. https://0-doi-org.brum.beds.ac.uk/10.3390/en14041090
Note that from the first issue of 2016, this journal uses article numbers instead of page numbers. See further details here.