
Classification Trees in the Assessment of the Road–Railway Accidents Mortality


1
Faculty of Management, Lublin University of Technology, Nadbystrzycka 38, 20-618 Lublin, Poland
2
Faculty of Security, Logistics and Management, Military University of Technology, ul. gen. Sylwestra Kaliskiego 2, 00-908 Warsaw, Poland
3
Motor Transport Institute, ul. Jagiellońska 80, 03-301 Warsaw, Poland
*
Author to whom correspondence should be addressed.
Energies 2021, 14(12), 3462; https://0-doi-org.brum.beds.ac.uk/10.3390/en14123462
Submission received: 11 May 2021
/
Revised: 1 June 2021
/
Accepted: 9 June 2021
/
Published: 11 June 2021
(This article belongs to the Special Issue Smart Energy and Intelligent Transportation Systems)
Abstract
:A special element of road safety research is accidents at the interface of the road and rail system. Due to their low share in the total number of incidents, they are not a popular subject of analyses but rather an element of collective studies, whereas the specificity of the road–rail accidents requires a separate characteristic, allowing, on the one hand, to categorize these types of incidents, and on the other, to specify the factors that affect them, along with an assessment of the strength of this impact. It is important to include in such analyses all potential predictors, both qualitative and quantitative. Moreover, the literature considers most often a number of accidents while, according to the authors, it does not fully reflect the scale of the danger. A better evaluation would be the victim’s degree of injury. Therefore, the purpose of this article is to assess the likelihood of occurrence of various effects of road–rail accidents in the aspect of selected factors. Due to the ordinal form of the dependent variable, the classification trees method was used. The results obtained not only allow the characterization and assessment of the danger but also constitute guidelines for taking preventive actions.
1. Introduction
Railroad transport safety is an important factor taken into account when evaluating the operation of this branch of transport. Due to the importance, scope and consequences for society and economy of the low level of traffic safety, it is the subject of many studies and analyses and is systematically evaluated [1,2,3]. According to the latest annual reports/statistics from the International Union of Railways (UIC), the number of railroad accidents is decreasing [4,5]. The European Union Agency for Railways (ERA) reports are similarly optimistic. The latest reported safety level is historically the highest, although ERA points out that while safety levels have steadily improved, the rate of improvement has slowed down [6].
World statistics are derived from research, and thus, the presented trends are very important for decision-making also at the national level. It should be noted that the level of safety should be shaped primarily at the local level. In Poland, according to the latest data [7], both the overall number of railroad accidents and fatalities decreased. However, the rates of accidents at railroad crossings have not decreased. For example, in 2019, 11 more people died there than the year before. This shows that despite the overall positive indicators (both at the global and national level), there are areas for safety improvement and analysis in a smaller scope, in this case concerning only road–railway crossings. This became the genesis of this publication. Additionally, the UIC report shows that at the international level, railway crossing accidents account for as much as 15% of all diagnosed causes of railroad accidents, being the second most common cause (after persons trespassing on railroad infrastructure) estimated at 75% [5]. This further supports the analysis presented in the article. Another important argument is that, according to the ERA report [6], the overall level of safety at railroad crossings in Europe has improved. The average annual decrease in accidents between 2010 and 2018 was 3%, and 4% for fatalities. This shows that Poland does not fit into the general trend in Europe in this regard. Therefore, detailed analyses for the country are necessary.
Rail–road level crossings are an important element of the road infrastructure, enabling an intersection of the road and rail vehicles’ tracks. There are over 14,000 such intersections in Poland [8] at which, in the period under investigation (the years 2014–2020), almost 8000 incidents (collisions and accidents) were recorded. Approximately 259 people were killed, and 404 were injured. Such accidents, apart from the tragic consequences, are associated with high costs, especially regarding the repair of rail vehicles. That is why the research is important, aimed to increase the level of safety and reduce the scale of the danger.
The accidents at the meeting point of road and rail transport are not a popular subject of analyses because they are relatively rare. This is shown in Figure 1, which shows the number of total road accidents during the study period and the number of road–railway accidents. The differences are so large that two scales had to be used to make the figure visible.
Calculations show that road–rail accidents account for only 5% of all traffic incidents. Therefore, the interest in this issue is mainly due to the potential severity of their consequences. The research in the literature concerns, for example, predicting the likelihood of accidents, injuries and fatalities using logistic regression [9]. Ghomi and others in [10] used the ordered probit model, CART and association rules to evaluate the factors that most strongly affect the risk of an accident, which turned out to be train speed, age and gender of the incident participant.
The large-scale study was conducted in [11] and in [12]. The first concerns the analysis of the railroad level crossings in Great Britain over 64 years (1946–2009), while the second one concerns Australia (Victoria) in the years 1969–1974. However, the mentioned research is not new. The dynamic development of motorization, the constantly increasing number of road users, as well as the development of road safety systems [13] make it necessary to update them. This conclusion indicates that new analyses are needed in this area.
The accessibility of information does not help such analyses, which in many countries is very limited [14,15], which is why the data from simulators are used [14].
The most frequently studied element are factors affecting the number of accidents or their consequences. They differ from one country to another. In Israel [14], the warning device category, vehicle traffic intensity, train traffic intensity, and visibility conditions were considered important. In Ethiopia [16], the studies have shown that most accidents are due to human error, followed by technical problems and non-compliance with operational procedures. In [17], Ling et al. evaluated the derailments of Australian passenger trains as a result of a collision with heavy road trucks.
Classification models are popular both for the analysis of railroad accidents and all accidents in general [18,19]. The decision to use them is primarily influenced by the form of the dependent variable, as well as the nature of the factors that may affect the number of such incidents or the injuries caused by them. These are often qualitative variables, which limits the availability of some methods of mathematical analysis.
Most commonly used are logistic regression and decision trees, as the most popular tools for assessing the impact of qualitative predictors [20,21,22,23,24]. Decision trees were used, for example, in the investigation of car accidents from the years 2005 to 2006 in Taiwan, where the key factors determining the effects of injuries turned out to be driving under the influence of alcohol, not using seat belts, type of vehicle, type of collision, number of vehicles involved in the accident and location of the accident [25].
The authors [24] also used such a method to analyze 4-year observations regarding road accidents in India, indicating that in order to improve safety on motorways, first of all, it is necessary to properly design and control motorway entrances and limit the speed achieved by vehicles. The CART algorithm was used to investigate accidents in 2001 in Taiwan. This made it possible to evaluate the relationship between the severity of injuries and driver characteristics, vehicle type and conditions during an accident. The results indicate that the most important variable related to the severity of the collision is the vehicle type. It has also been identified that pedestrians, motorcyclists and cyclists run a greater risk of injury than other drivers in road accidents [26].
The logistic regression, in turn, was used in the study of falling asleep at the wheel or fatigue as factors contributing to an accident [27]. In [20], the probability of death was examined, indicating a significant impact of the location and cause of the accident. On the other hand, the authors [28] used polynomial logistic regression to identify significant factors of risk of accidents, indicating elements related to the road infrastructure, driver’s characteristics and vehicle type.
Guided by the experiences resulting from reviewing the literature in terms of the tools used and the research gap identified regarding the railroad accidents analysis, the authors decided to use classification trees to evaluate factors influencing the effects of such an incident. Additionally, other approaches like random forest [29,30] and boosting technique [31,32,33] were used for improving the results obtained from the decision tree. All research was performed in the R environment.
2. Data for the Study
In Poland, information on traffic incidents is collected by the Police in the Accident and Collision Records System (SEWiK). Based on this, the Polish Road Safety Observatory (POBR), operating at the Motor Transport Institute (ITS), develops databases that have become the genesis of this study. The files made available contain a number of detailed characteristics for each incident, including:
- Place and time of the incident,
- Type of incident: collision of vehicles, rear-end collision, overturning,
- Consequences: fatalities, injured people (including slightly and seriously injured),
- Behavior of participants (drivers, passengers, pedestrians),
- Vehicle and road infrastructure condition,
- Atmospheric conditions (sun, rain, fog, strong wind), time of day and lighting (day, night, darkness, dawn),
- Type and condition of the road (surface, signposting, traffic lights),
- Circumstances and causes of the incident.
This study uses factors related to:
- Date and time of the incident,
- Existence of traffic lights at a railroad level crossing,
- Geographical location of the accident (province),
- Type of area (built-up, undeveloped),
- Driver characteristics (age, driving under the influence of alcohol or other drugs),
- Type of the injured participant (pedestrian, driver),
- Type of vehicle involved in the incident (passenger car, truck, truck with semi-trailer, motorcycle, motorcycle with an engine capacity of up to 125 cm3, moped, bicycle, bus, agricultural tractor, train, emergency vehicle).
The data from 2014 to 2020 was examined. The total number of incidents per month, with the participation of rail vehicles in this period, is shown in Figure 1 (green line).
Almost 11,000 people took part in these accidents, most of whom have not been injured. Other victims, according to the type of injuries sustained, were divided into three categories [34]:
- Fatal—people who died at the scene of the accident or within 30 days of the date of the accident due to the injuries sustained,
- Seriously injured—persons suffered severe disability, a serious incurable illness or long-term, life-threatening illness, permanent mental illness, complete or significant permanent incapacity for work or permanent, significant deformation or deformity of the body; this term also includes a person who suffered other injuries resulting in violation of bodily functions or health disorder for a period of more than 7 days,
- Slightly injured—injuries other than listed above and causing a health disorder in the period of no more than 7 days.
Due to the fact that almost 93% of participants in incidents did not suffer any injuries during the period under investigation, it was decided to further analyze only those who suffered health damage or died.
Results of the analysis of road traffic safety in Poland indicate that in the studied period there were 8474 accidents and collisions. Participants in them were 10,960 people, of which 210 died. This is less than 2% of all victims. For comparison, the total number of all road accidents and collisions in this period was 219,863. As many as 18,527 people died in them. Reducing the number of people injured in road accidents is the main goal of all actions undertaken in the area of road safety improvement. For this reason, the authors found it necessary to focus only on accidents and their worst effects. This will allow identifying the most important causes (factors) of these accidents and thus the necessary preventive actions (making the right decisions).
3. Decision Trees
We consider the feature (called the injured state), which depends on the value of the features (independent variables) presented in the previous chapter. One of the possible ways to determine the relationship between features is to construct a decision or regression tree. In the presented case, the feature is qualitative, so in order to analyze the impact of incident circumstances on the injured person’s condition, decision trees have been used.
Let be the learning set. For any set denotes the possible realization of feature, but set denotes the set of possible realizations of a response variable, where cardinality (power of the set or the number of possible classes is equal ). For the th observation, the vector denotes the realizations of independent (input) variables (usually feature values that influence to output variable) but denotes the value of the response variable. Our task is to define a model, where based on observations we should predict a victim condition. To assess the features influence on the sufferer state, we will apply the decision tree model.
The tree-based method consists of partition (splitting, division) of the feature space into a set of separable regions and fitting values of a response variable to appropriate regions. Below, we consider a decision problem for response variable . We split the entire feature space into regions, where for . Based on input vector , we predict the output variable as follows:
where,
and value for denotes the most commonly occurring class of response variable in the region. From (1), we see that the main task during decision tree building consists of splitting the entire space of features into separated regions.
The regression tree is usually presented in graphic form. The internal tree nodes describe how the division was made, while the leaves correspond to the classes to which the objects belong. The tree edges, in turn, represent the values of the features based on which the division was made.
For each region we estimate the classification rates corresponding to elements from set (possible realizations of response variable) where . The value represents the proportion of observations in the th region that are from the th class. The classification error rate is a fraction of observations in this region that do not belong to the most common class
The decision tree building method consists of portioning of an appropriate region by minimizing the Gini index
or entropy
From (4) and (5) we can see that the Gini index and entropy take on a small value when the classification rates are close to zero or one. Both the Gini index and entropy are referred to as purity of th node and typically used to assess the quality of a particular split of a region.
The restrictions that can be applied during the division of feature space are: the minimum cardinality of node subject to dividing, the minimum cardinality of the node resulting from dividing, the maximum number of tree levels. Selecting the right tree size can also be adjusted by pruning the original model.
For this purpose, there are selected algorithms being used. Among the most popular are: CART and C4.5 (and then C5.0) algorithms. Additionally, CHAID [35], QUEST, THAID and others [36] can be used. In our analysis, we employ the CART algorithm to select the important features’ influence on accidents result.
The decision trees suffer from high variance. One of the possible techniques to improve the predictions obtained from decision trees is bagging [33]. The main idea depends on creating an ensemble of decision trees based on several bootstrapped training sets. These training sets are chosen randomly with replacement from the data set and are used to train the decision trees. The variance is reduced by aggregating a set of predictions obtained from an ensemble of trees. For classification trees, we take a majority vote from the obtained class predicted by each tree.
The random forest is an extension of the bagging method [29,30]. The main difference is that during the making of the training set for each tree we randomly choose the set of features from a full set of features. Thus, we make an ensemble of random trees. A multitude of random trees is called a random forest. This technique avoids the problem of selecting the dominant predictor in the split of space for each tree. The predictions obtained from trees with randomly selected features are less correlated, thereby making the average of the predictions obtained from regression trees or majority vote from classification trees less variable and more reliable.
Another technique to improve the results obtained from the decision trees is boosting [33]. Boosting, like bagging, depends on creating an ensemble of decision trees. For bagging, we adapt the trees to training sets chosen randomly from the data set. By applying the boosting technique, the trees are made sequentially, i.e., the current tree is built based on information from the previously grown tree and the response variable in the current tree is defined as residuals (not explained outcomes) from the previous tree.
The adaptation of a large decision tree to the data can be hard and potentially overfitting. The boosting approach results in the learning process being slow. By adding the current decision tree into the ensemble of trees in order to update the residuals, we define the model that explains the dependences between outcomes and features. Each of these trees can be small but by adapting the small trees to the residuals, we improve the outcomes (response variable) in areas where this does not work well. It is the main benefit of this method. In general, the learning process is slow and sequential but tends to explain the dependences well. In our analysis, we employ the XGB (eXtreme Gradient Boosting) algorithm [31,32] to select the influence of important features on the accidents’ result.
Various measures are used to evaluate the classifier. Most often, the basis for their definition is the confusion matrix. The columns of this matrix determine the actual decision classes while rows determine the decisions predicted by the model. The value at the intersection of the th verse and th column specifies the number of observations of th class classified into the th class, . In general, the case has the form presented in Table 1.
For each possible realization, we estimate the basic values. th class (), the TP (true positive) denotes a number of outcomes (instances) that are correctly classified for this class, the FP (false positive) is the number of outcomes that are classified for the class but they do not belong to it, the FN (false negative) is the number of outcomes that belong to the class but are incorrectly classified, the TN (true negative) is the number of correctly classified outcomes that do not belong to the class. According to the notation presented in Table 1 for the th class (), we determine the basic values as follows:
Additionally, for each class, we estimate the following basic metrics:
- Sensitivity (Recall, True Positive Rate—TPR), indicating to what extent the truly positive class has been classified as positive:
- Specificity (True-Negative Rate—TRN), indicating to what extent the truly negative class has been classified as negative:
- Positive Predictive Value (PPV), indicating with what certainty we can trust positive predictions, i.e., in what percentage are the positive predictions confirmed by the truly positive state:
- Negative Predictive Value (NPV), indicating with what certainty can we trust negative predictions, i.e., in what percentage the negative predictions are confirmed by the truly negative state:
- Prevalence is the fraction of cases possessing the examined feature (it shows how often the positive class occurs in the sample).
- Detection rate shows the number of correct positive class predictions as a proportion of all of the predictions made.
- Detection prevalence or predicted positive condition rate (PPCR) is the percentage of observations that the classifier predicted as positive (it illustrates the feasibility of the model in practice).
- Balanced accuracy is an average arithmetic sensitivity and specificity, specifying the average number of predictions for each class, correctly classified by the model (it finds better use when we have just one test set, and it is not balanced).
Additionally, for the entire classifier, we determine accuracy (ACC), which denotes the fraction of all instances that are correctly categorized:
4. Results
The CART algorithm was used for the construction of decision trees. The influence of the characteristics of the province and the time of the incident on the condition of the victim was investigated. There were 631 observations used for the construction. The following symbols were adopted for individual provinces: B—Podlaskie, C—Kujawsko-Pomorskie, D—Dolnośląskie, E—Łódzkie, F—Lubuskie, G—Pomorskie, K—Małopolskie, L—Lubelskie, N—Warmińsko-Mazurskie, O—Opolskie, P—Wielkopolskie, R—Podkarpackie, S—Śląskie, T—Świętokrzyskie, W—Mazowieckie, Z—Zachodnio-Pomorskie. Figure 2 presents the classification tree with maximum depth equalling 5. This tree contains only seven rules.
The accuracy of the model taking into account only two variables is not satisfactory, with the value of ACC = 0.517. The accuracy of the predictions is presented by the confusion matrix—Table 2. The elements on the main diagonal indicate correctly classified observations.
Because the quality of the prediction is not satisfactory, a decision tree was constructed that includes a higher number of predictors. The following variables were taken into account: time of day, month, type of vehicle, type of participant, existence of traffic lights at the level crossing, age of the victim, area (developed, undeveloped), and location of the incident (province).
The classifier includes 49 decision rules. Its extensive form prevents legible, graphical presentation. Therefore, only a descriptive characteristic of the model was made using a matrix of errors, basic measures of states and a graph with variable importance.
The inclusion of additional predictors has improved the quality of the classifier. The accuracy is ACC = 0.679. Table 3 shows the confusion matrix. On the main diagonal, there are correctly classified observations.
The predictors, ranked by their importance, are shown in Figure 3. This figure shows the percentage of decrease of the Gini index (interpreted as gain) for the construction of the classification tree. The evaluation of the importance of the predictors’ impact on the dependent variable has indicated a significant impact primarily of the location of the accident (province) and the time of the incident. A detailed evaluation of the model was made by analyzing measures for each of the singled-out injury levels. The sensitivity and specificity take values exceeding 73% (except for the “serious injury” class for which sensitivity is about 49%). The precision of positive and negative prediction is high (up to 75% except for the “death” class). The remaining results are presented in Table 4.
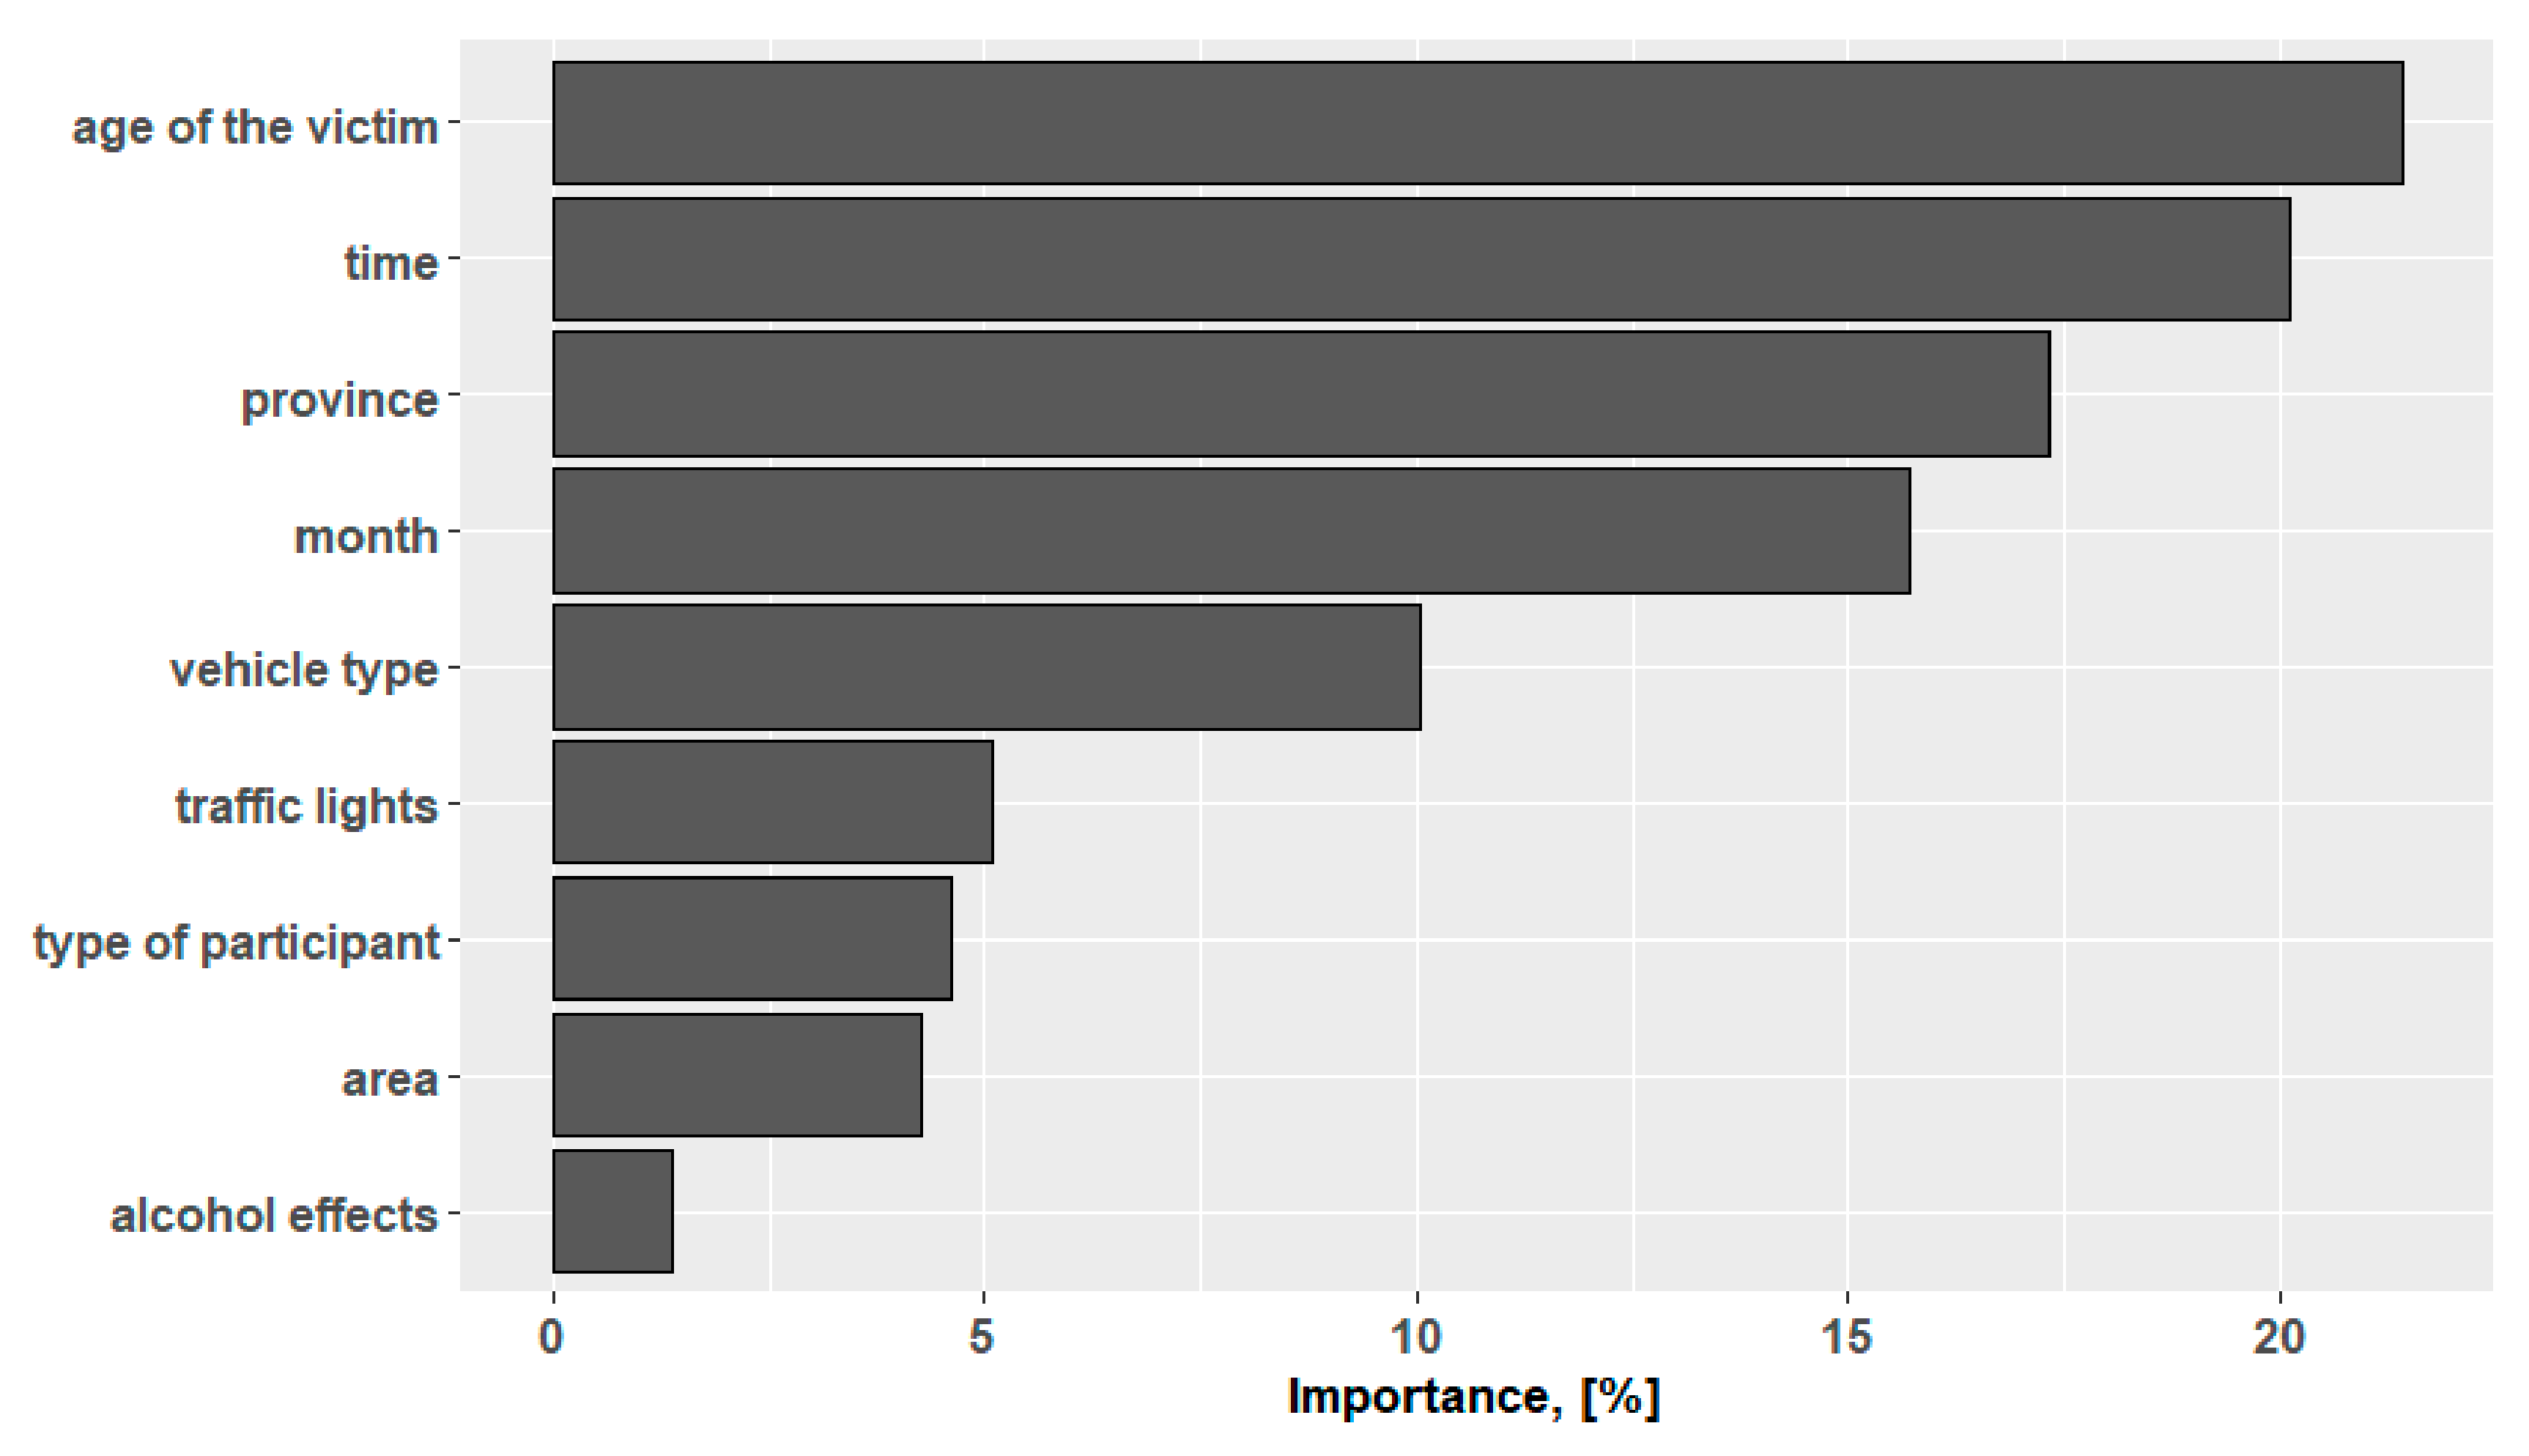
In order to verify the influence of each feature, a random forest was also constructed, consisting of 50 trees, where three features were randomly selected for the learning set. As before, we present the results in the form of a confusion matrix (Table 5), a matrix of the basic measures for each state (Table 6) and the variable importance plot (Figure 4).
By comparing Table 3 and Table 5, we can see that the quality of the classifier for the random forest is better than for the extended decision tree. For the random forest, the accuracy is equal to 0.913.
From Figure 4, we can see that the predictors: age of the victim, time, province and month have the greatest impact on the variable describing the state of the injured person. Basic metrics for the random forest are presented in Table 6.
From Table 6, we see a significant improvement in metrics sensitivity, specificity, balanced accuracy, PPV and NPV.
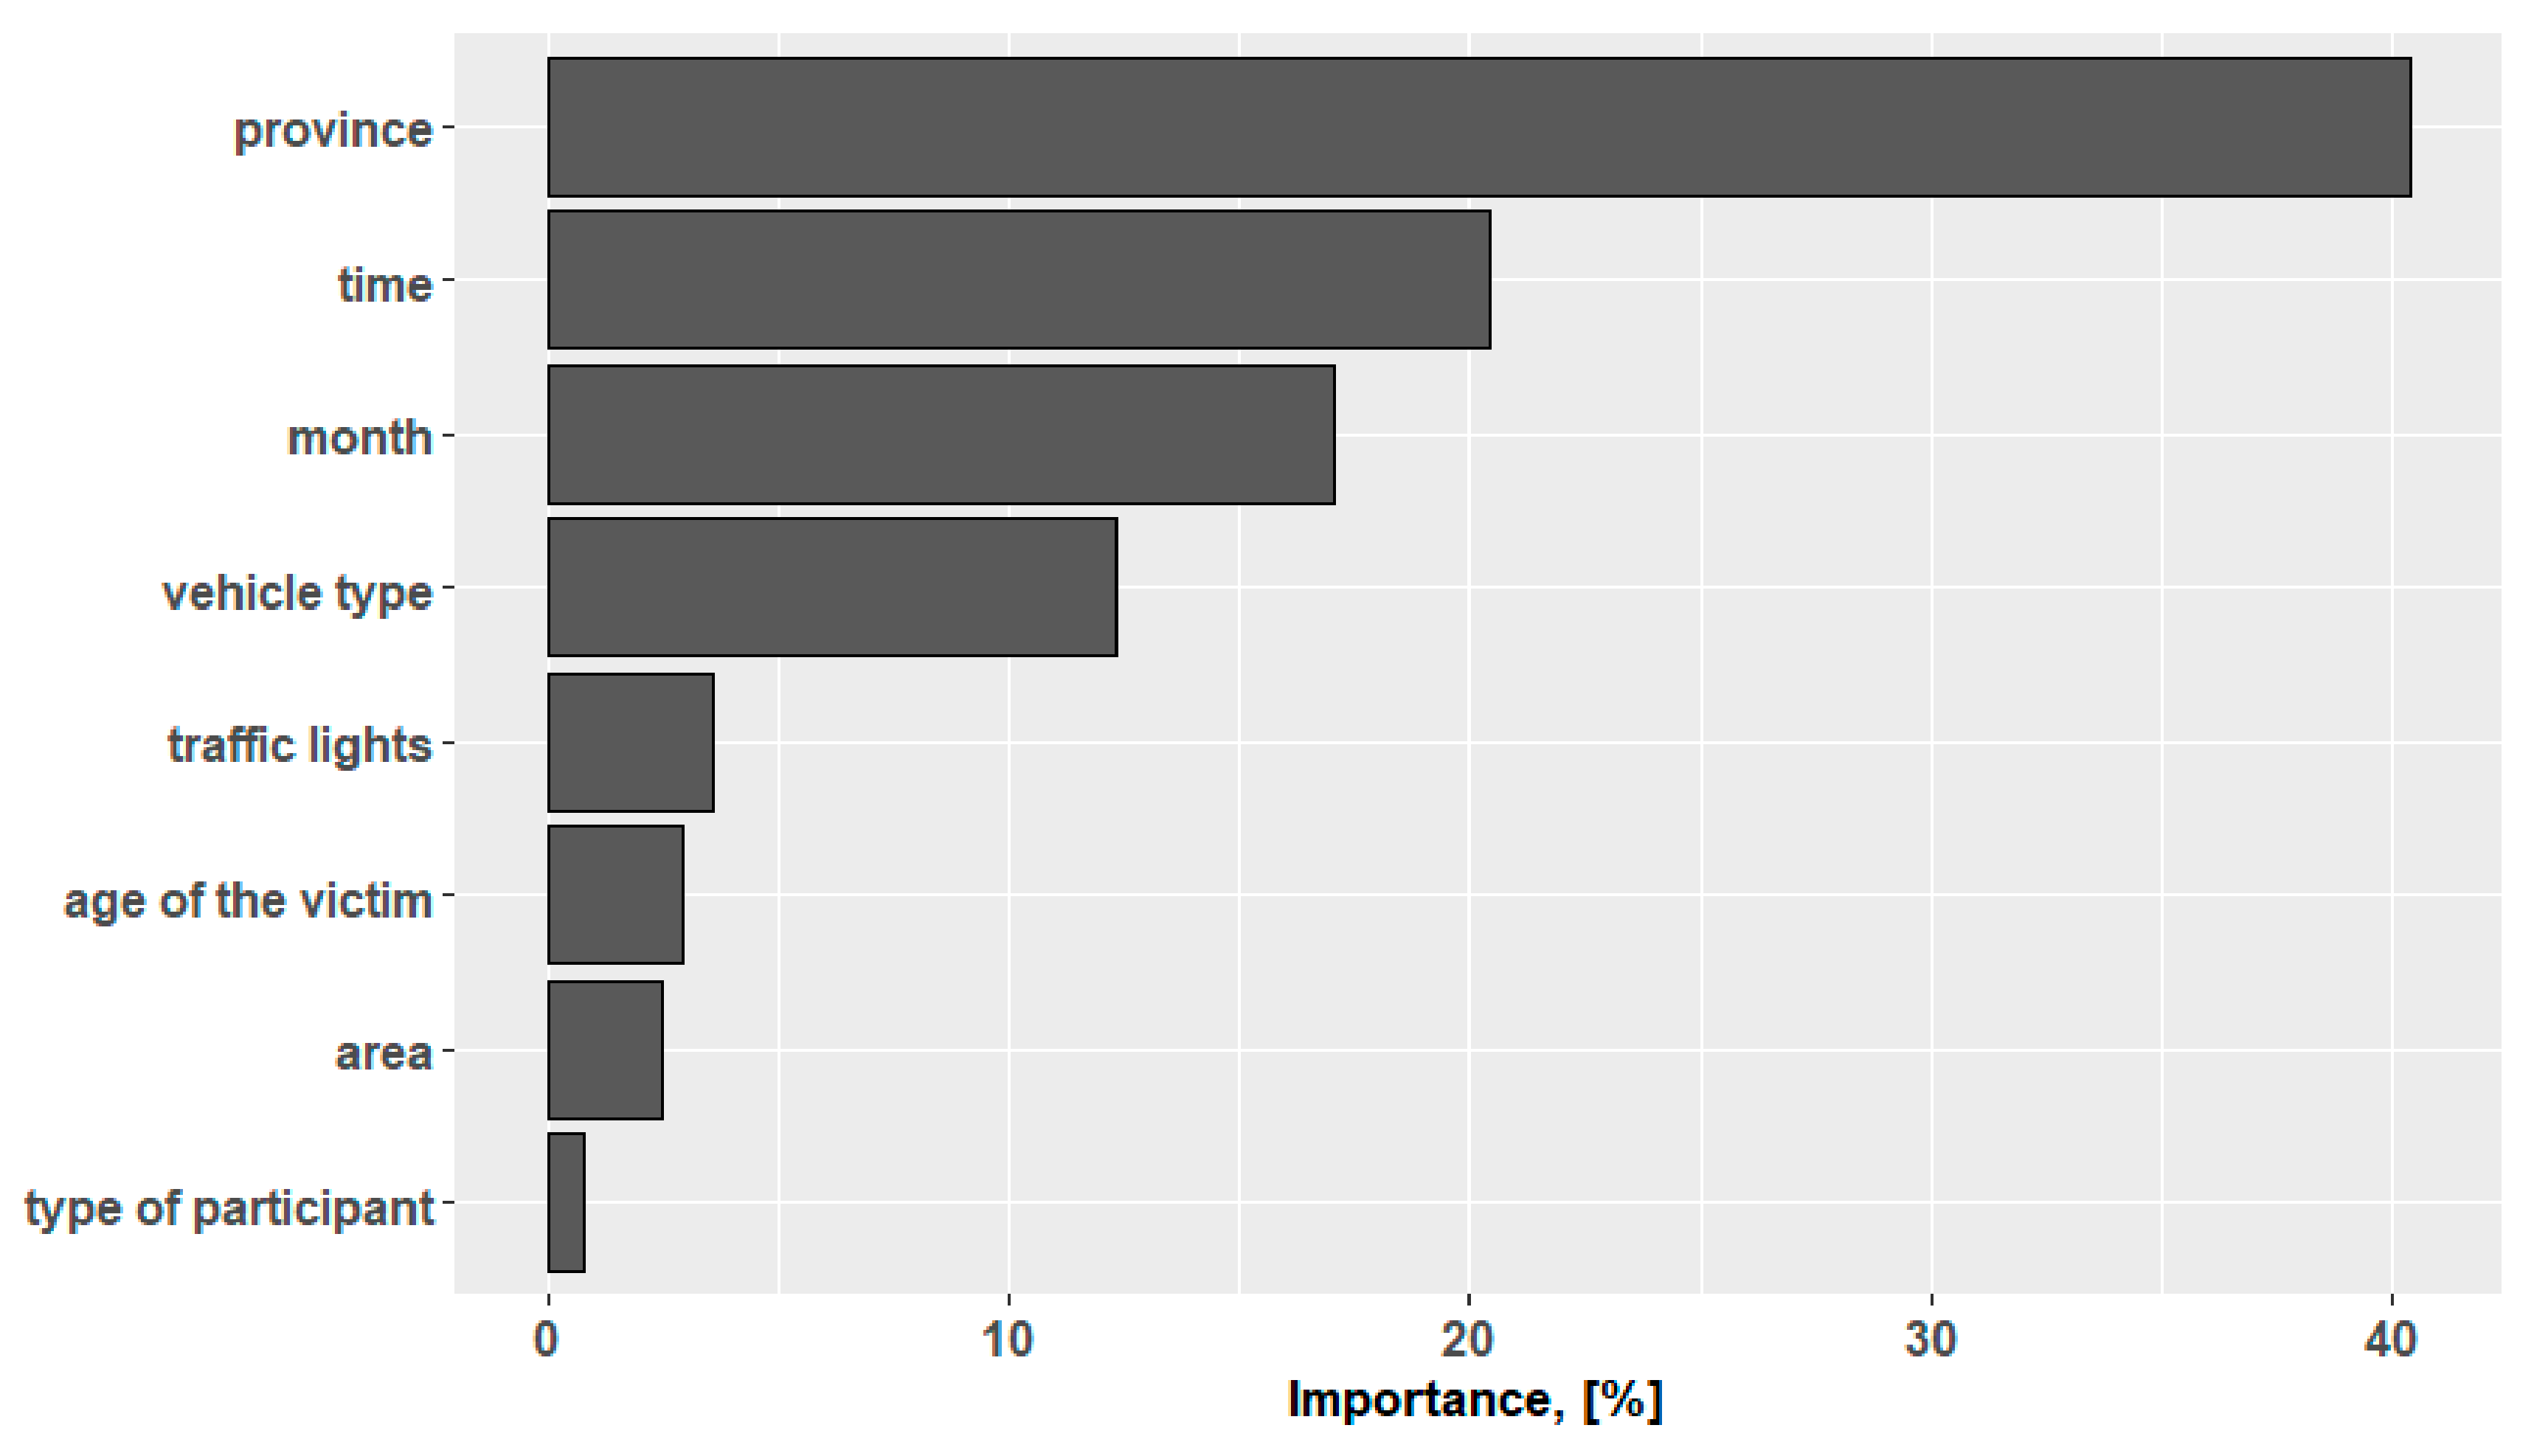
The classifier was also constructed using the boosting technique. In this case, it is assumed that the maximum depth of a tree equals 3, and the maximum number of boosting iterations is 50. As before, we present the results in the form of a confusion matrix (Table 7), matrix of the basic measures for each state (Table 8) and a variable importance plot (Figure 5).
By comparing Table 3, Table 5 and Table 7, we can see that the quality of the classifier for the boosting tree model is the best. For this model, the accuracy equals 0.972.
From Figure 5, we can see that the province predictor dominates the others. The time, month and vehicle type predictors have a significant impact on the variable describing the state of the injured person. Basic metrics for the boosting tree model are presented in Table 8.
From Table 8, we see that the sensitivity, specificity, balanced accuracy, PPV and NPV metrics are over 0.95.
The most powerful predictor, in the case of decision trees and the boosting tree model, is the location of the accident, in this case defined by the province. This can be due to two reasons. The first is the discrepancy in the state and quality of both linear and point infrastructure in the individual regions of Poland. These elements remain in the sphere of administration of the local government units. This condition applies to as much as 95.4% of all roads in the country and means different management, financing and control. Because the impact of infrastructure on both the number of accidents and injuries is significant [37], the impact of location in the presented study is also significant. Another reason influencing this result is the different densities of the railroad network in individual regions of Poland. In eastern Poland, it is smaller than in western Poland. However, central Poland has the largest number of railroad lines. Moreover, the number of road users as well as their mobility vary between provinces. This activity, different not only in particular areas but also during the times of the day, results in the next factor strongly influencing the model being the time of the event.
Another important predictor related to time is the month. The increased number of traffic accidents is probably influenced by the increase in traffic associated with vacation activity from May to September. It may also be due to the reduced alertness of drivers focused on resting. The fact that some drivers are not daily users of cars and have little experience in driving also contributes to the accidents. The fourth most important is the type of vehicle. Among the established rules, the most common means of transport is the bicycle, the passenger car and the truck. Additionally, in many situations, cyclists’ deaths are equal to or very close to 100%.
In the case of the random forest, the age of the victim was the first factor contributing to injury in accidents. The other factors with the highest influence were the same but ranked in a different order (time, province, month).
The influence of the remaining predictors was significant but smaller. The existence of traffic lights and developed areas is conducive to the tragic consequences of accidents. The drivers are more likely to die than passengers. The influence of alcohol is also an important factor, but it should be emphasized that this result is affected by a small number of accidents in which such a violation was noted. In the analyzed sample, there is less than 1.2% of them.
5. Conclusions
The classification trees are a flexible, user-friendly, and easy-to-interpret tool for analyzing large sets of observations, consisting of many variables. Their biggest advantages include transparency and readability of the result presented in the form of rules, as well as no requirements for the form and distribution of variables. Additionally, it is necessary to emphasize their insensitivity to the occurrence of non-typical observations and deficiencies in the data set.
However, in the analyzed case, the application of this method resulted in an accuracy of 68%. This result was improved by applying the boosting tree model for which the highest accuracy of 97% was achieved. In both cases, the result was the same. The most important predictors were: province, time, month and vehicle time. An additional method proposed was random forest, for which ACC = 91%. This model indicated a different order of predictors, placing the age of the victim first.
The results obtained, in addition to indicating the factors increasing the risk of certain injuries in an accident, also indicate the need to develop comprehensive solutions for the entire country in terms of improving road safety. Such a large impact of location may result from the different functioning of individual local government units and the differences in administration of the governed infrastructure. Therefore, it is necessary to develop and implement common standards and equalize the differences between individual regions, particularly in relation to the condition of the road, its surroundings and road equipment.
The obtained measurable results of measurements concerning the influence of the examined factors on traffic safety at railroad crossings provide information on such actions, which are conducive to improving road–rail traffic safety through:
- Shaping of the road–railway traffic safety strategy based not only on the analysis of data on the number of road–railway incidents but also on the factors influencing mortality and the strength of this influence,
- Ensuring funds in the state budget for the creation and improvement of national and local databases collecting information not only on the number of road–railway accidents but also covering detailed characteristics of each event (e.g., visibility range at a railroad crossing, number of lines/tracks–track gauge, frequency of railroad links),
- Setting standards for improving the safety of road–railway infrastructure in terms of traffic engineering and road and construction issues,
- Setting standards for improving the safety of road–railway infrastructure for owners and managers of roads with road–railway connections on each administrative level,
- Shaping the behavior of all road users and awareness of existing risk factors and the significance of their impact on road–railway incidents and their consequences,
- Conducting social campaigns shaping attitudes and opinions, also on the basis of obtained research results showing which factors most strongly influence mortality in road–railway accidents,
- Creating and enforcing stricter regulations, especially with respect to identified causes of fatal accidents, and increasing the penalties in this area,
- Improving the operation of road–railway rescue systems by identifying areas (railroad crossings) particularly conducive to fatal accidents,
- Improving the process of education and training using the results of analysis of factors affecting the mortality in road–railway accidents for prevention purposes, as part of training and prevention talks, as well as guidelines for determining the timing and scope of police operations organized in support of safety.
A limitation of the analysis presented in this paper is, first of all, the qualitative form of most of the variables. It limits the possibility of research to classificatory methods. The quality of the presented research is also affected by the number of recorded factors. Especially in the framework of further considerations, the authors would like to take into account the volume of traffic. This factor is very important from the point of view of road–railway traffic safety, but it is not monitored at most of the railroad crossings. Generally speaking, traffic volume monitoring in Poland concerns mainly selected regions (mostly intersections of big cities). However, the dynamic development of smart transportation systems is conducive to obtaining the necessary information [38], so analyses that take this factor into account for a smaller area will probably be possible soon.
Author Contributions
Conceptualization, A.B., E.K. and A.Ś.; methodology, A.B. and E.K. software, A.B. and E.K.; validation, A.B. and E.K.; formal analysis, A.B. and E.K.; investigation, A.B. and E.K.; resources, A.Ś. and P.S.; data curation, A.Ś. and P.S.; writing—original draft preparation, A.B., E.K. and A.Ś.; writing—editing, A.B., E.K. and A.Ś.; visualization, A.B. and E.K. All authors have read and agreed to the published version of the manuscript.
Funding
This research received no external funding.
Institutional Review Board Statement
Not applicable.
Informed Consent Statement
Not applicable.
Data Availability Statement
The data presented in this study are openly available in a publicly accessible Mendeley Data repository: http://0-dx-doi-org.brum.beds.ac.uk/10.17632/7vwx2pnbx5.1 (accessed on 11 May 2021).
Conflicts of Interest
The authors declare no conflict of interest.
References
- Blagojević, A.; Kasalica, S.; Stević, Ž.; Tričković, G.; Pavelkić, V. Evaluation of safety degree at railway crossings in order to achieve sustainable traffic management: A novel integrated fuzzy mcdm model. Sustainability 2021, 13, 832. [Google Scholar] [CrossRef]
- Cao, T.; Mu, W.; Gou, J.; Peng, L. A study of risk relevance reasoning based on a context ontology of railway accidents. Risk Anal. 2020, 40, 1589–1611. [Google Scholar] [CrossRef] [PubMed]
- Li, K.; Pan, Y. An effective method for identifying the key factors of railway accidents based on the network model. Int. J. Mod. Phys. B 2020, 34, 2050192. [Google Scholar] [CrossRef]
- Batarlienė, N. Improving safety of transportation of dangerous goods by railway transport. Infrastructures 2020, 5, 54. [Google Scholar] [CrossRef]
- EUAFR. UIC Annual Report; European Union Agency for Railways: Luxembourg, 2020. [Google Scholar]
- EUAFR. Report on Railway Safety and Interoperability in the EU-2020; Publications Office of the European Union: Luxembourg, 2020. [Google Scholar]
- UTK. Raport w Sprawie Bezpieczeństwa Transportu Kolejowego w Polsce w 2019 r; Dziennik Urzędowy Prezesa Urzędu Transportu Kolejowego nr 16/2020; UTK: Warsaw, Poland, 2020. [Google Scholar]
- NIK. Bezpieczeństwo Eksploatacji Pasażerskiego Taboru Kolejowego. Informacja o Wynikach Kontroli; Departament Infrastruktury: Warsaw, Poland, 2021. [Google Scholar]
- McCollister, G.M.; Pflaum, C.C. A model to predict the probability of highway rail crossing accidents. Proc. Inst. Mech. Eng. Part F J. Rail Rapid Transit 2007, 2213, 321–329. [Google Scholar] [CrossRef]
- Ghomi, H.; Bagheri, M.; Fu, L.; Miranda-Moreno, L.F. Analyzing injury severity factors at highway railway grade crossing accidents involving vulnerable road users: A comparative study. Traffic Inj. Prev. 2016, 178, 833–841. [Google Scholar] [CrossRef]
- Evans, A.W. Fatal accidents at railway level crossings in Great Britain 1946–2009. Accid. Anal. Prev. 2011, 435, 1837–1845. [Google Scholar] [CrossRef] [Green Version]
- Wigglesworth, E.C. Human factors in level crossing accidents. Accid. Anal. Prev. 1978, 103, 229–240. [Google Scholar] [CrossRef]
- Desai, A.; Singh, J.J.; Spicer, M.T. Intelligent transport system to improve safety at road-rail crossings. In Proceedings of the 11th World Level Crossing Symposium, Tokyo, Japan, 26–29 October 2010. [Google Scholar]
- Gitelman, V.; Hakkert, A.S. 1997 The evaluation of road-rail crossing safety with limited accident statistics. Accid. Anal. Prev. 1997, 292, 171–179. [Google Scholar] [CrossRef]
- Weatherford, B.A.; Willis, H.H.; Ortiz, D.S.; Mariano, L.T.; Froemel, J.E.; Daly, S.A. The State of US Railroads: A Review of Capacity and Performance Data Rand Corporation; RAND Corporation: Santa Monica, CA, USA, 2008. [Google Scholar]
- Ugochukwu, A.L.; Lovejoy, M.; Mercy, A. Safety demonstration and risk management at rail-road level crossing at addis ababa light rail transit network. IJSRSET 2019, 65, 103–109. [Google Scholar] [CrossRef]
- Ling, L.; Dhanasekar, M.; Thambiratnam, D.P. Assessment of road-rail crossing collision derailments on curved tracks. Aust. J. Struct. Eng. 2017, 182, 125–134. [Google Scholar] [CrossRef]
- Huang, W.; Liu, Y.; Zhang, Y.; Zhang, R.; Xu, M.; De Dieu, G.J.; Shuai, B. Fault Tree and Fuzzy DS Evidential Reasoning combined approach: An application in railway dangerous goods transportation system accident analysis. Inf. Sci. 2020, 520, 117–129. [Google Scholar] [CrossRef]
- Rungskunroch, P.; Jack, A.; Kaewunruen, S. Risk and resilience of railway infrastructure: An assessment on uncertainties of rail accidents to improve risk and resilience through long-term data analysis. In Lecture Notes in Civil Engineering; Springer Nature: Basingstoke, UK, 2021. [Google Scholar]
- Al-Ghamdi, A.S. Using logistic regression to estimate the influence of accident factors on accident severity. Accid. Anal. Prev. 2002, 346, 729–741. [Google Scholar] [CrossRef]
- Kozłowski, E.; Mazurkiewicz, D.; Żabiński, T.; Prucnal, S.; Sęp, J. Assessment model of cutting tool condition for real-time supervision system. Eksploat. Niezawodn. Maint. Reliab. 2019, 21, 679–685. [Google Scholar] [CrossRef]
- Rungskunroch, P.; Jack, A.; Kaewunruen, S. Benchmarking on railway safety performance using Bayesian inference, decision tree and petri-net techniques based on long-term accidental data sets. Reliab. Eng. Syst. Saf. 2021, 213, 107684. [Google Scholar] [CrossRef]
- Rymarczyk, T.; Kozłowski, E.; Kłosowski, G.; Niderla, K. Logistic regression for machine learning in process tomography. Sensors 2019, 19, 3400. [Google Scholar] [CrossRef] [Green Version]
- Singh, G.; Sachdeva, S.N.; Pal, M. M5 model tree based predictive modeling of road accidents on non-urban sections of highways in India. Accid. Anal. Prev. 2016, 96, 108–117. [Google Scholar] [CrossRef]
- Chang, L.Y.; Chien, J.T. Analysis of driver injury severity in truck-involved accidents using a non-parametric classification tree model. Saf. Sci. 2013, 511, 17–22. [Google Scholar] [CrossRef]
- Chang, L.Y.; Wang, H.W. Analysis of traffic injury severity: An application of non-parametric classification tree techniques. Accid. Anal. Prev. 2006, 385, 1019–1027. [Google Scholar] [CrossRef]
- Sagberg, F. Road accidents caused by drivers falling asleep. Accid. Anal. Prev. 1999, 316, 639–649. [Google Scholar] [CrossRef]
- Yan, X.; Radwan, E.; Abdel-Aty, M. Characteristics of rear-end accidents at signalized intersections using multiple logistic regression models. Accid. Anal. Prev. 2005, 376, 983–995. [Google Scholar] [CrossRef]
- Breiman, L. Bagging predictors. Mach. Learn. 1996, 26, 123–140. [Google Scholar] [CrossRef] [Green Version]
- Breiman, L. Random forests. Mach. Learn. 2001, 45, 5–32. [Google Scholar] [CrossRef] [Green Version]
- Biecek, P.; Burzykowski, T. Explanatory Model Analysis. Explore, Exam and Examine Predictive Models; Chapman & Hall Book: London, UK, 2020. [Google Scholar]
- Chen, T.; Guestrin, C. XGBoost: A scalable tree boosting system. In Proceedings of the 22nd ACM SIGKDD International Conference on Knowledge Discovery and Data Mining, San Francisco, CA, USA, 13–17 August 2016; pp. 785–794. [Google Scholar]
- Hastie, T.; Tibshirani, R.; Friedman, J. The Elements of Statistical Learning; Springer-Verlag New York Inc.: New York, NY, USA, 2009. [Google Scholar]
- Choinski, K. Zarządzenie Komendanta Głównego Policji z Dnia 30 Czerwca 2006 r; Komenda Główna Policji: Warsaw, Poland, 2006. [Google Scholar]
- Kass, G.V. An exploratory technique for investigating large quantities of categorical data. J. R. Stat. Soc. Ser. C Appl. Stat. 1980, 29, 119–127. [Google Scholar] [CrossRef]
- Loh, W.Y.; Shih, Y.S. Split selection methods for classification trees. Stat. Sin. 1997, 7, 815–840. [Google Scholar]
- Graczyk, B.; Polasik, R. Wpływ infrastruktury drogowej na bezpieczeństwo ruchu drogowego. Postępy Inżynierii Mech. 2016, 7, 5–15. [Google Scholar]
- Jamal, A.; Mahmood, T.; Riaz, M.; Al-Ahmadi, H.M. GLM-based flexible monitoring methods: An application to real-time highway safety surveillance. Symmetry 2021, 13, 362. [Google Scholar] [CrossRef]
Figure 1.
Number of total traffic accidents and road–railway accidents during the studied period.

Figure 2.
Classification tree for the variables of place and time of the accident.

Figure 3.
Variable importance ranking for the extended decision tree.

Figure 4.
Predictor importance ranking for the random forest.

Figure 5.
Predictor importance ranking for the boosting tree model.


Table 1.
Form of the confusion matrix.
| Actual Class
Predicted Class | Class 1 | Class 2 | ... | |
|---|---|---|---|---|
| Class 1 | ... | |||
| Class 2 | ... | |||
| ... | ... | ... | ||
| Class | ... |
Table 2.
Confusion matrix for the decision tree based on location of incident and time.
| Class | |||
|---|---|---|---|
| Prediction | Death | Seriously | Slightly |
| Death | 102 | 49 | 61 |
| Seriously | 16 | 48 | 16 |
| Slightly | 66 | 97 | 176 |
Table 3.
Confusion matrix for the extended decision tree.
| Class | |||
|---|---|---|---|
| Prediction | Death | Serious Injury | Slight Injury |
| Death | 149 | 60 | 50 |
| Seriously | 13 | 95 | 18 |
| Slightly | 22 | 39 | 185 |
Table 4.
Detailed measures for the individual injury classes.
| Class | Death | Serious Injury | Slight Injury |
|---|---|---|---|
| Sensitivity | 0.8098 | 0.4897 | 0.7312 |
| Specificity | 0.7539 | 0.9291 | 0.8386 |
| Pos Pred Value | 0.5753 | 0.7540 | 0.7520 |
| Neg Pred Value | 0.9059 | 0.8040 | 0.8234 |
| Prevalence | 0.2916 | 0.3074 | 0.4010 |
| Detection Rate | 0.2361 | 0.1506 | 0.2932 |
| Detection Prevalence | 0.4105 | 0.1997 | 0.3899 |
| Balanced Accuracy | 0.7818 | 0.7094 | 0.7849 |
Table 5.
Confusion matrix for the random forest.
| Class | |||
|---|---|---|---|
| Prediction | Death | Serious Injury | Slight Injury |
| Death | 175 | 16 | 8 |
| Seriously | 3 | 160 | 4 |
| Slightly | 6 | 18 | 241 |
Table 6.
Detailed measures of the random forest for the individual injury classes.
| Class | Death | Serious Injury | Slight Injury |
|---|---|---|---|
| Sensitivity | 0.9511 | 0.8247 | 0.9526 |
| Specificity | 0.9463 | 0.9840 | 0.9365 |
| Pos Pred Value | 0.8794 | 0.9581 | 0.9094 |
| Neg Pred Value | 0.9792 | 0.9267 | 0.9672 |
| Prevalence | 0.2916 | 0.3074 | 0.4010 |
| Detection Rate | 0.2773 | 0.2536 | 0.3819 |
| Detection Prevalence | 0.3154 | 0.2647 | 0.4200 |
| Balanced Accuracy | 0.9487 | 0.9044 | 0.9445 |
Table 7.
Confusion matrix for the boosting tree model.
| Class | |||
|---|---|---|---|
| Prediction | Death | Serious Injury | Slight Injury |
| Death | 179 | 5 | 1 |
| Seriously | 3 | 185 | 3 |
| Slightly | 2 | 4 | 249 |
Table 8.
Detailed measures of boosting tree model.
| Class | Death | Serious Injury | Slight Injury |
|---|---|---|---|
| Sensitivity | 0.9728 | 0.9536 | 0.9842 |
| Specificity | 0.9866 | 0.9863 | 0.9841 |
| Pos Pred Value | 0.9676 | 0.9686 | 0.9765 |
| Neg Pred Value | 0.9888 | 0.9795 | 0.9894 |
| Prevalence | 0.2916 | 0.3074 | 0.4010 |
| Detection Rate | 0.2837 | 0.2932 | 0.3946 |
| Detection Prevalence | 0.2932 | 0.3027 | 0.4041 |
| Balanced Accuracy | 0.9797 | 0.9699 | 0.9842 |
Publisher’s Note: MDPI stays neutral with regard to jurisdictional claims in published maps and institutional affiliations. |
© 2021 by the authors. Licensee MDPI, Basel, Switzerland. This article is an open access article distributed under the terms and conditions of the Creative Commons Attribution (CC BY) license (https://creativecommons.org/licenses/by/4.0/).
Share and Cite
MDPI and ACS Style
Kozłowski, E.; Borucka, A.; Świderski, A.; Skoczyński, P. Classification Trees in the Assessment of the Road–Railway Accidents Mortality. Energies 2021, 14, 3462. https://0-doi-org.brum.beds.ac.uk/10.3390/en14123462
AMA Style
Kozłowski E, Borucka A, Świderski A, Skoczyński P. Classification Trees in the Assessment of the Road–Railway Accidents Mortality. Energies. 2021; 14(12):3462. https://0-doi-org.brum.beds.ac.uk/10.3390/en14123462
Chicago/Turabian StyleKozłowski, Edward, Anna Borucka, Andrzej Świderski, and Przemysław Skoczyński. 2021. "Classification Trees in the Assessment of the Road–Railway Accidents Mortality" Energies 14, no. 12: 3462. https://0-doi-org.brum.beds.ac.uk/10.3390/en14123462
Note that from the first issue of 2016, this journal uses article numbers instead of page numbers. See further details here.