
Estimation of Self-Sufficiency Rate in Detached Houses Using Home Energy Management System Data

1
Sekisui Chemical Co., Ltd., Tokyo 186-0007, Japan
2
Institute of Industrial Science, University of Tokyo, Tokyo 153-8505, Japan
*
Author to whom correspondence should be addressed.
Energies 2021, 14(4), 975; https://0-doi-org.brum.beds.ac.uk/10.3390/en14040975
Submission received: 2 January 2021
/
Revised: 31 January 2021
/
Accepted: 9 February 2021
/
Published: 12 February 2021
(This article belongs to the Special Issue Energy-Saving, Comfort, and Healthier Strategies for Smart Buildings)
Abstract
:Japan’s energy consumption in 2018 was about 2.5 times that in 1975, with the increase in the household sector being the largest at 28%. Most of primary energy is still fossil fuel, and it is urgent to reduce energy consumption in the household sector. The purpose of this paper was to identify ways to reduce household energy consumption without compromising the quality of life in residence. However, the reduction methods vary by region, building specifications, household type, equipment specifications, season, and weather. The value of this paper is based on a systematic analysis of home energy management systems (HEMS) data from about 50,000 households under various conditions. We are analyzing ways to reduce energy consumption. Few studies have analyzed this much back-up data, which is likely to lead to a reduction in CO2 emissions across the household sector. To explore ways to reduce energy consumption in this sector, the company has introduced and provided services for home energy management systems (HEMS) since 2011 and is currently collecting HEMS data for up to 50,000 households. In order to grasp the actual state of energy consumption in each household, HEMS data are systematically analyzed, necessary conditions for energy reduction and self-sufficiency rate (SSR) improvement are analyzed, and energy consumption under certain conditions is estimated using storage batteries (SB) and heat pump water heaters (HPWH). In addition, energy consumption was investigated by actual measurement and simulation for several hundred households. Since power generation and consumption vary greatly depending on the region, building specifications, household type, equipment specifications, season, weather, etc., it is necessary to analyze these factors systematically. As a conclusion, in order to improve SSR, it is necessary to (1) reduce surplus power consumption and energy consumption of heat pump water heaters (HPWHs), (2) increase solar power generation, and (3) increase the size of SB. This study contributes to the spread of advanced housing and the reduction of CO2 emissions in the household sector.
1. Introduction
In the Paris Agreement signed at the 21st Conference of the Parties conducted by the United Nations, Japan committed to reducing CO2 emissions by 26% by 2030 compared to the FY 2013 levels. Furthermore, in October 2020, the current administration announced the aim of making Japan carbon neutral by 2050. However, the share of energy consumption in the household sector increased to 26% in 2000 and to 28% in 2018 (Ministry of Economy, Trade and Industry: Energy White Paper 2020). To reduce CO2 emissions and energy consumption in this sector, the following two approaches are important. First, reduce power consumption by improving the thermal insulation performance of houses and the efficiency of household equipment. Second, promote the introduction of photovoltaic (PV) power generation, storage batteries (SB), and home energy management systems and improve the self-sufficiency rate (SSR) of each household. These two approaches are important for popularizing advanced housing and reducing CO2 emissions in the household sector by balancing the environmental and economic aspects.
In Japan, the peculiar strategies related to the pricing of power for housings are the time-of-use (TOU) pricing and feed-in-tariff (FIT) policies. Under the TOU contract, the electricity tariff is low from 23:00 to 07:00 h (~15 yen/kWh) and high during the daytime (~27 yen/kWh). Under the FIT policy, surplus electric power from PV power generation is purchased at a fixed rate; in 2020, the rate was fixed as 21 yen/kWh for 10 years. With the increase in the number of houses equipped with solar power facilities, the amount of surplus solar power has increased, thus posing a problem for grid management. Therefore, reducing surplus power and improving the SSR by efficiently storing the surplus power in SB and using the heat pump water heater (HPHW) is essential. However, the amount of surplus power (i.e., (PV power generation)—(self-consumption)) and SSR vary from house to house depending on the capacity of the installed PV power generation system, weather, season, power consumption, and operating conditions and with the performance of residential facilities, such as SB and heat pump water heaters (HPWHs), lifestyle, residential area, residential households, and house performance. The systematic analysis of each of these factors leads home buyers to design and purchase economical and comfortable houses with less expenditure and high self-sufficiency. With the increase in the number of such houses, the CO2 emission of the household sector will decrease. The importance of reducing CO2 emissions in the housing and construction sectors is also discussed by Samad, M. et al., (2019) [1], who reported emissions from non-road diesel engines are not regulated in several countries. It is expected to increase significantly in the construction field in the future. PM10 is emitted more than on-road vehicles.
In 2011, this research group introduced the Home Energy Management System (HEMS), which is the core technology of smart houses. It collects data, grasps, and analyzes the energy use situation. As of March 2020, ~50,000 houses are using HEMS. This novel study examines the possibility of energy and CO2 reduction in the home sector by analyzing actual power generation, power consumption, and charge/discharge quantity by classifying them into residential areas, types of households, building specifications, equipment specifications, and building years from significant amounts of actual data and not from simulation. Furthermore, this study analyzes the surplus power of PV power generation to increase SSR using SB and HPWH. This study is highly applicable and likely to be used in the future because all types of electric systems, PV power generation systems, SB, and heat pump facilities (air-conditioning and hot water supply systems) are being increasingly used as the primary means of reducing energy consumption in houses. Thus, systematically analyzing the HEMS data is very important to grasp the actual energy use situation, share this information, analyze additional energy saving and improvement methods of SSR, and contribute to the creation of business ideas for data use. This study aims to enable the future energy-saving policies and renewable energy to popularize advanced houses with a low system power load by clarifying the problems in popularizing houses with low CO2 emissions and high SSRs.
2. Background
The energy consumption of detached houses, power generation, and direct consumption of PV power, as well as HEMS data, have been analyzed in previous studies. Van der Stelt et al. [2] numerically analyzed the actual demand and PV power generation data of 39 households and demonstrated that in-house PV consumption is most effective when SB are used and that the annual cost was reduced by 22–30% and self-consumption (SC) increased by 23–29%. In another study, the HEMS data of three households was analyzed, and the effects of differences in power consumption patterns and PV sizes of houses on private consumption was examined; these data were then used to develop a model for SC prediction [3]. Leehter, Y. et al., in 2015 [4], focused on the Internet of Things technology for HEMS and developed a model for reducing the utility cost and load of system power based on demand response from the data from a demonstration experiment. The electricity consumption rate and the purchased electric power can be reduced using surplus electric power of SB. Furthermore, Pengfei, Z. et al., in 2019 [5], examined the reduction in energy costs by confirming the consumption patterns of uncertain PV generation and SB, as well as various demand responses, through simulations. In another study [6], depending on the utility rate system (TOU and FIT) and the adoption of HEMS, the economic efficiency of each SB size was simulated; moreover, the results demonstrated that the price of batteries is extremely high, indicating that smaller batteries are more economical or have a shorter payback period. Chen, Z. et al., in 2015 [7], focused on the operation of electric heating systems and confirmed the role and effectiveness of HEMS in PV and battery direct current (DC) systems via demonstration experiments and simulations. Furthermore, they demonstrated that daytime and nighttime operation volumes and conditions considerably affect battery strategy and HEMS control. Donald, A. et al., in 2018 [8], performed simulations and demonstrated that several energy optimization and management methods can increase the household consumption and that maximization can reduce costs along with TOU. However, they suggested that PV itself provides improved performance at the current battery costs. Al-Saqlawi et al., in 2018 [9], simulated the energy consumption, economic effects, and potential of grid-independent and grid-connected systems using solar PV and battery equipment in homes in Oman. To report the requirement for on batteries, Luthander et al., in 2016 [10], analyzed the SC of PV power generation systems in 21 detached houses in Sweden. Note that sharing an SB system among the community is more economical and efficient than to have them individually installed. Luthander and Widén et al., in 2015 [11], summarized previous studies on the SC of electricity from household PV systems using two special techniques to increase SC: storage and demand-side management (DSM). Many studies on energy storage utilize batteries with a storage capacity (kWh) of 0.5–1 times that of the installed PV power (kW). The increase in SC is 10–24% in the referenced system. A discernible trend exists between the size of the battery storage normalized by the size of PV system and increase in SC. Despite increase in interest in solar PV in recent years, few studies on the SC of solar PV exist. Leonard et al. [12] conducted grid-independent studies in houses in the southwestern and northern United States. Solar energy, battery systems, and hydrogen storage were used to analyze seasonal energy use and storage requirements; the area requirements for solar PV, the overall capacity, and seasonal use of the required energy storage system; and the various components affecting power production and storage parameters [13]. Using the data of actual photovoltaic power generation and energy consumption in detached houses, the case of self-consumption of photovoltaic power generation using a storage battery system was modeled. This model maximizes private consumption and minimizes costs, resulting in a cost reduction of more than 87%. Hadi, P., in 2019 [14], analyzed the optimum sizing method for PV power generation and SB systems from SSR and the SC rate by simulation. Note that SSR tends to increase; however, the SC rate tends decrease. Sameti et al. [15] modeled the electrical energy of a typical dwelling by simulation: it is a combination of 2 kW small wind power generation, 5 kWh SB, and 3 kW PV. Subsequently, a 96% reduction in the annual electricity charge was achieved. However, small-scale wind power generation was not extensively used because it rarely achieved the expected power generation.
Among these studies, Ishida, K., in 1997 [16], conducted a questionnaire survey of about 1000 households and reported the actual state of energy consumption in each region. Furthermore, Murakami et al. [17] and Akabayashi et al. [18] analyzed the annual energy consumption of various household electric appliances in detail for 1 year from 2002 to 2003 in 80 households. Furthermore, Hasegawa et al. [19] and Inoue et al. [20] conducted a nationwide survey to analyze the annual energy consumption by the year of construction and reported that recent constructions showed improved energy conservation performance. These studies primarily aimed to understand the energy consumption in the housing sector; the employed survey method was primarily questionnaire-based, whereas long-term measurement was not conducted. Nevertheless, studies based on the HEMS [21,22] reported the annual energy consumption and frequency of use for 600 households in Japan. Similar to a preliminary study on the energy balance of PV power generation in houses and SB, Iga et al. [23] examined the merits of combining SB rather than simulating solar power generation. Nishino [24] investigated the economic merit (break-even construction cost) of a simulation of SB utilization of the surplus electric power by creating the demand load pattern of PV power generation and housing. However, some other studies [25,26] explored the operation of an energy supply and demand system that combines sunlight, SB, and HPWH. Endo et al. [27] examined a PV power generation system (4.5 kW) and SB of 8.9 kWh; moreover, various load patterns of electric power at the time of disaster were verified. Furthermore, the remaining capacity of SB, charge and discharge efficiency, and solar power generation patterns were analyzed. In conclusion, solar power generation and SB are effective for supplying power in the event of a disaster.
A common feature of previous studies is that demonstration experiments on energy consumption and power generation considered ~100 samples. To the best of our knowledge, although many questionnaires have been used, detailed and large amounts of energy data have not been obtained. Large amounts of real energy data have been analyzed only in few cases. Furthermore, multiple simulations of SC in SB and solar PV exist; however, few studies analyze the effective use of surplus power from solar PV by examining both SB and HPWH. The novelty of this work is that it systematically summarizes energy consumption, SC, and SSRs for various residential areas, forms of residence, equipment specifications, and types of family using of the abundant data from HEMS, and it analyzes the utilization of surplus power from PV power generation in both SB and HPWH. In Section 3, we classified HEMS users by residential area and family type. Furthermore, we classified them based on the capacity of PV power generation and SB. In Section 4, we extracted energy consumption, power generation, and charge from HEMS data and calculated the median values for each category. In Section 5, we analyzed the operation results of each category in HPWH. Then, we calculated the SSR when the surplus power of PV power generation was utilized. In Section 6, we calculated the SSR when the surplus power of PV power generation was used for both SB and HPWH.
3. Data Acquisition and Analysis
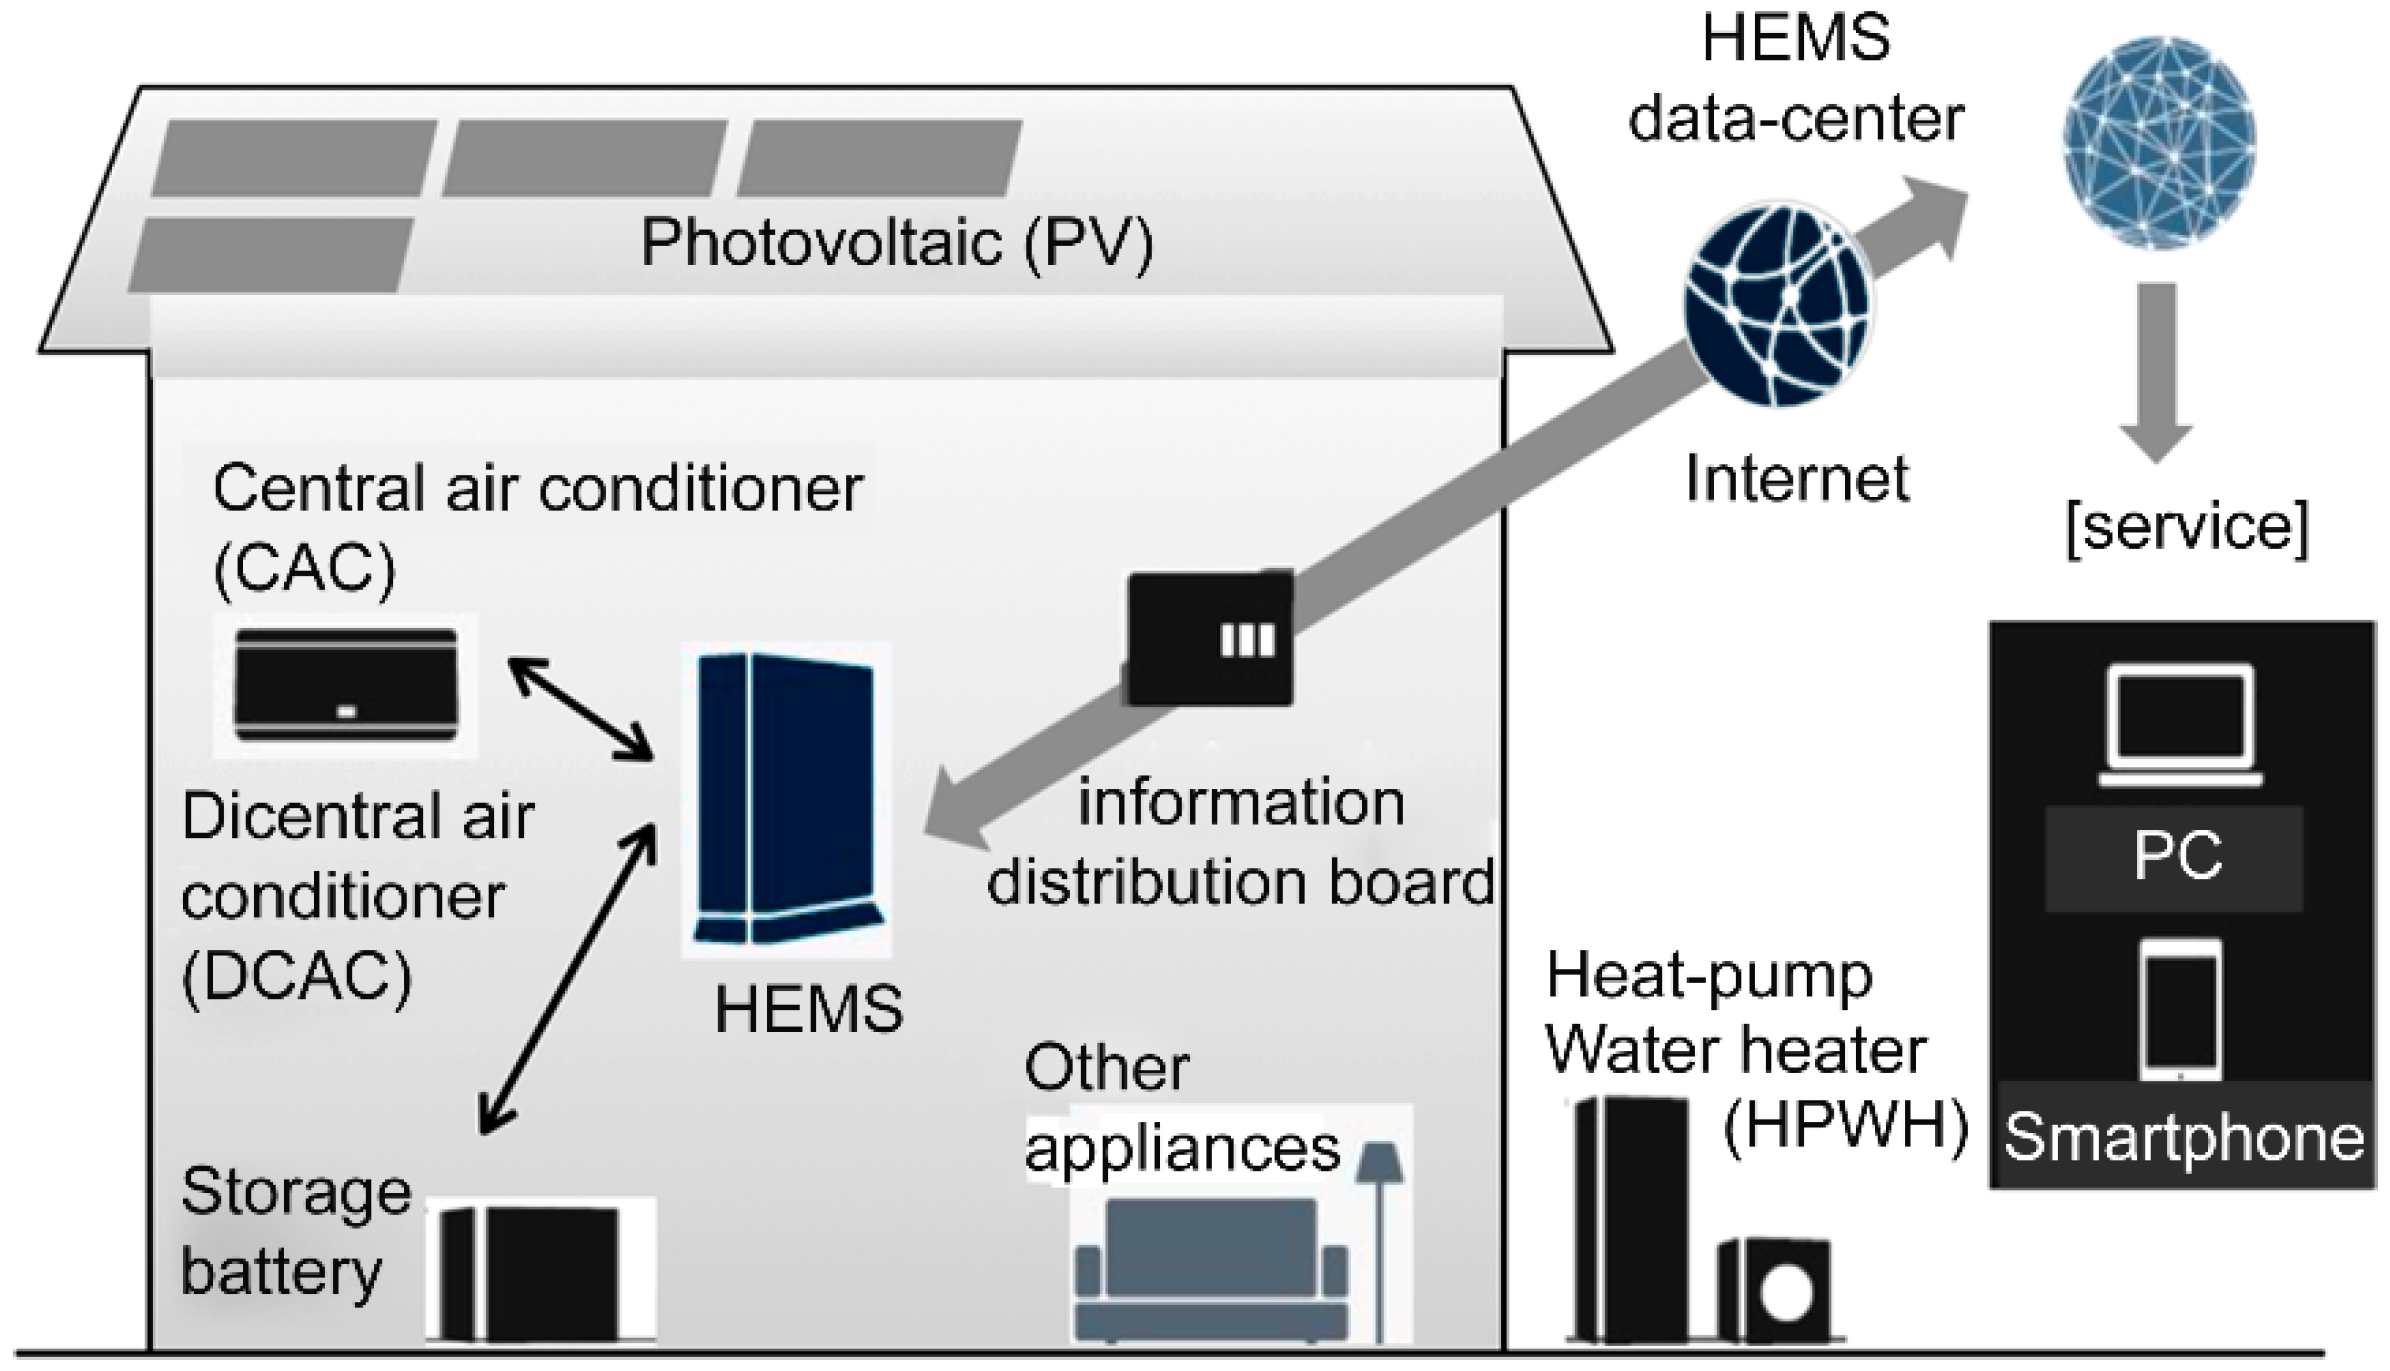
In this study, the HEMS data were obtained from electrified detached houses equipped with PV primarily with the cooperation of Sekisui Chemical Co., Ltd., Housing Company. The HEMS (Figure 1) obtains information on power consumption and solar power generation (PV) primarily from the HEMS itself and from the information distribution board. Moreover, it is directly connected to the SB, central air conditioning (CAC), dicentral air conditioning (DCAC), and HPWH systems via LAN wiring. All data are collected in the data center on the cloud. Users can view energy consumption and enjoy various services, such as operation, control, and maintenance of equipment, using smartphones. Table 1 lists the obtained primary data. The following static data were acquired: building area and address, year of construction, floor space of each floor, thermal insulation performance, number of tenants, family structure, holidays, specifications of each facility and equipment, and electric power contract course. Furthermore, the following dynamic data were totaled and accumulated by day, month, and year: energy consumption, PV power generation, SB charging and discharging, sales and purchase, and in-house consumption for the entire dwelling unit and for each primary facility equipment [28]. Table 2 lists the number of HEMS registrants by the building year. Since 2012, HEMS is being introduced in new buildings; hence, >5000 households are registered every year. After 1990, HEMS has been introduced at the time of renovation. Figure 2 shows the number of HEMS users by area in the energy-saving standard. The general area, called ZONE6 (including many areas in Japan, such as Tokyo, Osaka, and the northern part of Kyushu) [29], is the largest and has >20,000 households. Therefore, the research was conducted with data from ZONE6, wherein sufficient research targets can be ensured. Table 3 lists the primary specifications and equipment performance of the dwelling house after 2011, which is the subject of this study. The “UA value,” which indicates the thermal insulation performance of the dwelling house, was 0.65 W/m2 K on an average by 2016. After 2017, the thermal insulation specifications of the roof, under-floor regions, and openings were improved to 0.59 W/m2 K. CAC efficiency was improved in 2013, and the Coefficient of Performance (COP) was improved from 3.50 to 4.00. In terms of the entire building ventilation system (balanced ventilation), the motor was improved using direct current (DC) systems in 2014 to improve the energy-saving performance. The average efficiency (APF: annual performance factor) of the HPWH gradually improved each year to reach 3.29 in 2017. Moreover, since 2015, most residential lighting has been Light Emitting Diode (LED).
Figure 3 shows the ratio of floor space and the number of objects for each major family structure in Japan and ZONE6. Single family (husband and wife + children) has a peak at 110–130 m2; however, two families have a gentle peak at 140–180 m2 with a volume of 200 m3 or more. According to the Japan Land Survey conducted by the Ministry of Internal Affairs and Communications in 2018, the floor space of detached Japanese houses is 120 m2 on an average [30]. Figure 4 shows the composition of solar power generation systems in Japan as a whole and in ZONE6 according to the amount of power generated. A large peak is observed around 5 kW, a moderate decrease is observed up to 9 kW, and a moderate peak is observed again around 10–11 kW. Figure 5 shows the composition ratio of each SB capacity. The composition ratio of the capacity accounts for >50% of the medium capacity ratio of 7.2 and 5.5 kWh. The small capacity of 4.4 and 5 kWh accounts for >25%; furthermore, a small peak is observed for the large capacity of 12 kWh.
Table 4 lists the analysis of the HEMS data. The average floor space of a single-family Zone 6 energy-saving standard region was limited to 100–140 m2. As per the Japanese Land Survey conducted by the Ministry of Internal Affairs and Communications in 2018, the average floor space of a Japanese detached house was 120 m2. Then, PV systems are classified based on average capacities of 4 (3–5), 6 (5.1–7), 8 (7.1–9), and 10 (9.1–11) kW (hereinafter, referred to as PV4, PV6, PV8, and PV10 systems, respectively). SB are classified into those with a small capacity of ≤5 kWh (SB (S)), medium capacity of 5.1–8 kWh (SB (M)), and large capacity of ≥8.1 kWh (SB (L)). The analysis period was 1 year, from April 2018 to March 2019, and data from 829 residences were collected without data loss. The median values were then calculated by extracting the total power consumption (total energy consumption; TCE), power generation (PG), purchased electricity (PE), SC, sold electricity (SE), and charge and discharge (charge electricity: CE and discharge electricity: DCE) for each category by time. The SSR (Equation (1)) is the ratio of the power consumption that should be satisfied using PV power generation. The ratio of self-power consumption (including the charging power) and the total power consumption (including self-power consumed and purchased power) was calculated and integrated on an hourly basis. This is one of the important indexes in the energy policy of housing and smart house popularization. The operation rate (OR) (Equation (2)) was calculated as one of the indicators of the effective utilization of SB by the value obtained by integrating and averaging the ratio of SB charge and SB capacity. The charge and discharge rate (Equation (3)) was calculated from the ratio of the battery discharge amount and battery charge. After the SB is operated in the operation mode (midnight mode: MNM), wherein it is charged in the middle of the night and discharged when power is purchased from the daytime to the nighttime, the surplus power from solar power generation is preferentially used for charging and the mode changes to the operation mode (green mode; GRM), wherein the power is discharged after purchase.
where SSR (%): Self-sufficiency rate, SC (kWh): Self consumption, DCE (kWh): Discharge electricity, TCE (kWh): Total consumption of energy, OR (%): Operation rate, CE (kWh): Charge electricity, SB (kWh): Storage battery, and CDR (%): Charge and discharge rate.
4. Energy Balance for PV and SB Category
Figure 6 shows the annual energy balance by category. The annual TCE for all categories is 6700–9800 kWh. The average annual energy consumption of detached houses in Japan is 11,500 kWh (according to the CO2 statistics of the Ministry of the Environment, 2018) [31,32]. Therefore, it can be seen that the annual TCE for each category is reduced by 20–30%. In all PV categories, from PV4 to PV10, annual electricity purchases have decreased as battery capacity has increased, and the effect of batteries has been confirmed in all PV capacity. SB (L) comprises <3400 kWh of purchased power, whereas PV8SB (L) is reduced to 1890 kWh at the minimum. The charging amount of PV4SB (S) increases to 1267 kWh, while that of PV10SB (L) increases to 3281 kWh. The minimum sold amount of PV4SB (L) is 411 kWh, whereas the maximum sold amount of PV10SB (S) is 7970 kWh; a difference of more than 19 times. Figure 7 shows the SSR for each category, as well as the utilization rate, charge–discharge efficiency, and the SC rate for each battery category.
The SSR was the highest for PV8SB (L) at 73%, followed by PV10SB (L) at 64%. The operation rate (OR) decreased as the SB capacity increased. In comparison, for a given SB capacity, the OR improved with the PV capacity. The charge–discharge efficiency was 85–94% but tended to increase with the capacity, because the larger the proportion of hybrid power conditioners (integrated power conditioners of PV and SB), the larger is the loss. Furthermore, the in-house consumption is almost proportional to the SB capacity.
Figure 8, Figure 9 and Figure 10 show the monthly energy balance when the PV capacity is 8 kW, while the SB capacity is (S), (M), and (L). The purchase of electricity in the middle and summer decreases in proportion to the SB capacity. The purchase of SB (L) in July decreases to <38 kWh/month. Moreover, the purchase of electricity in February in winter increases to 880 kWh/month, compared to SB (S). The amount of electricity sold (SE) in August in summer decreased to 713 kWh/month for PV8SB (S) and 304 kWh/month for PV8SB (L). The (SE) in February in winter decreased to ~40 kWh/month. The increase in the SB capacity contributed to the improvement in the SSR and the decrease in the purchased and sold electricity. Figure 11 and Figure 12 show the hourly energy balance for a day in February and August, respectively, for PV8 kW SB (L). In February (Figure 11), the daily power generation is ~20 kWh. The duration of sunshine is short; hence, power generation mainly occurs from 7:00 to 16:00. Most of the power generation is used for SC and CE. The ES is ~1.5 kWh, while DCE continues from 16:00 to 00:00, but ~12 kWh of power purchase energy (PE) is required until the morning. Till date, the power PE seems to be primarily used for heating and hot water supply. Figure 12 shows the energy balance in August. SC increased to ~7 kWh owing to the addition of air conditioning. Moreover, it is fully charged by ~10:00, and sufficient surplus power is obtained. DCE starts from around 17:00, while power PE starts from around 03:00 on the next day. Power PE occurs only for 3 h, from 03:00 to 05:00.
In Section 4, we analyzed the annual, monthly, and hourly energy balances and SSRs using solar PV and SB. We reported that increasing the size of SB is effective for improving the SSRs; however, simultaneously, SSRs do not necessarily increase with the TCE. Furthermore, energy reduction is important because power generation decreases in winter and total consumption increases. However, surplus electricity is still available in mid-season and summer; hence, not only SB but also HPWH can be expected to be used. The Section 5 primarily analyzes HPWH energy consumption.
5. Energy Analysis Considering HPWH
At present, all electric houses in detached houses in Japan are TOU contracted, as described above. Hence, HPWH is in operation in the middle of the night when the unit price of electric power is low (HPWH: 0%). However, with decrease in the FIT price, the active utilization of surplus electric power from PV systems is necessary; not only SB, but also HPWH systems, are required to utilize the surplus electric power from PV systems. First, we analyze the relation between total electric power consumption and electric power consumption in HPWH for each category. Figure 13 shows the annual total consumption for each PV capacity category and the power consumption of HPWH for SB (S), (M), and (L). The total consumption does not significantly change with the SB capacity. The total consumption decreases with the PV capacity, and, in the case of PV 8 and PV 10, the total consumption 7000~9000 kWh. For HPWH, power consumption does not change with SB capacity and PV, and it changes by ~1500 kWh. Figure 14 shows the annual power consumption of each household and the power consumption of HPWH. The total power consumption increases with the PV capacity. For PV 6, the consumption was 7800 kWh for households with only married couples, 9100 kWh for single-family households, and 10,300 kWh for two households. Figure 15 shows the annual total consumption and the electric energy consumption of the HPWH for each floor space of a single family. For all PV categories, the TCE increases with the floor space, and the electric energy consumption of HPWH does not significantly change for a floor space of 140 m2 but slightly changes for a floor space of >140 m2. Figure 16 shows the annual total consumption, HPWH power consumption, and the SSR by PV capacity. The total consumption and the power consumption of the HPWH were less for more recent constructions. The total consumption of PV6 in 13 years was 9351 kWh for HPWH, while the power consumption was 1623 kWh. In 2017, the total power consumption was 8418 kWh and that of the HPWH was 1318 kWh, a reduction of 10% and 19%, respectively. As shown in Table 3, this is attributed to the fact that the newer the building, the better is the thermal insulation performance of the house. Hence, the efficiency of each facility, the HPWH, is improved. Figure 17 shows the monthly TCE per PV capacity and the power consumption of HPWH. In any season, the larger the PV capacity, the greater is the tendency of the total consumption to increase. However, the total consumption of HPWH is almost constant regardless of the PV capacity. The consumption is ~200 kWh in winter and ~50 kWh in summer.
In Section 5, we analyze various types of power consumption in HPWH. As shown, HPWH power consumption changes as per the year of construction, the floor space, the season, and the household. Furthermore, the manner of operation of the HPWH affects the SSR. The latest model of HPWH is that 20–30% of HPWH’s electricity consumption can utilize surplus electricity from PV. In the future, it will use surplus power of 50% and 100%. Therefore, the focus will be on how to increase the SSR using SB and HPWH.
6. Estimation and Analysis of SSR in Each Category
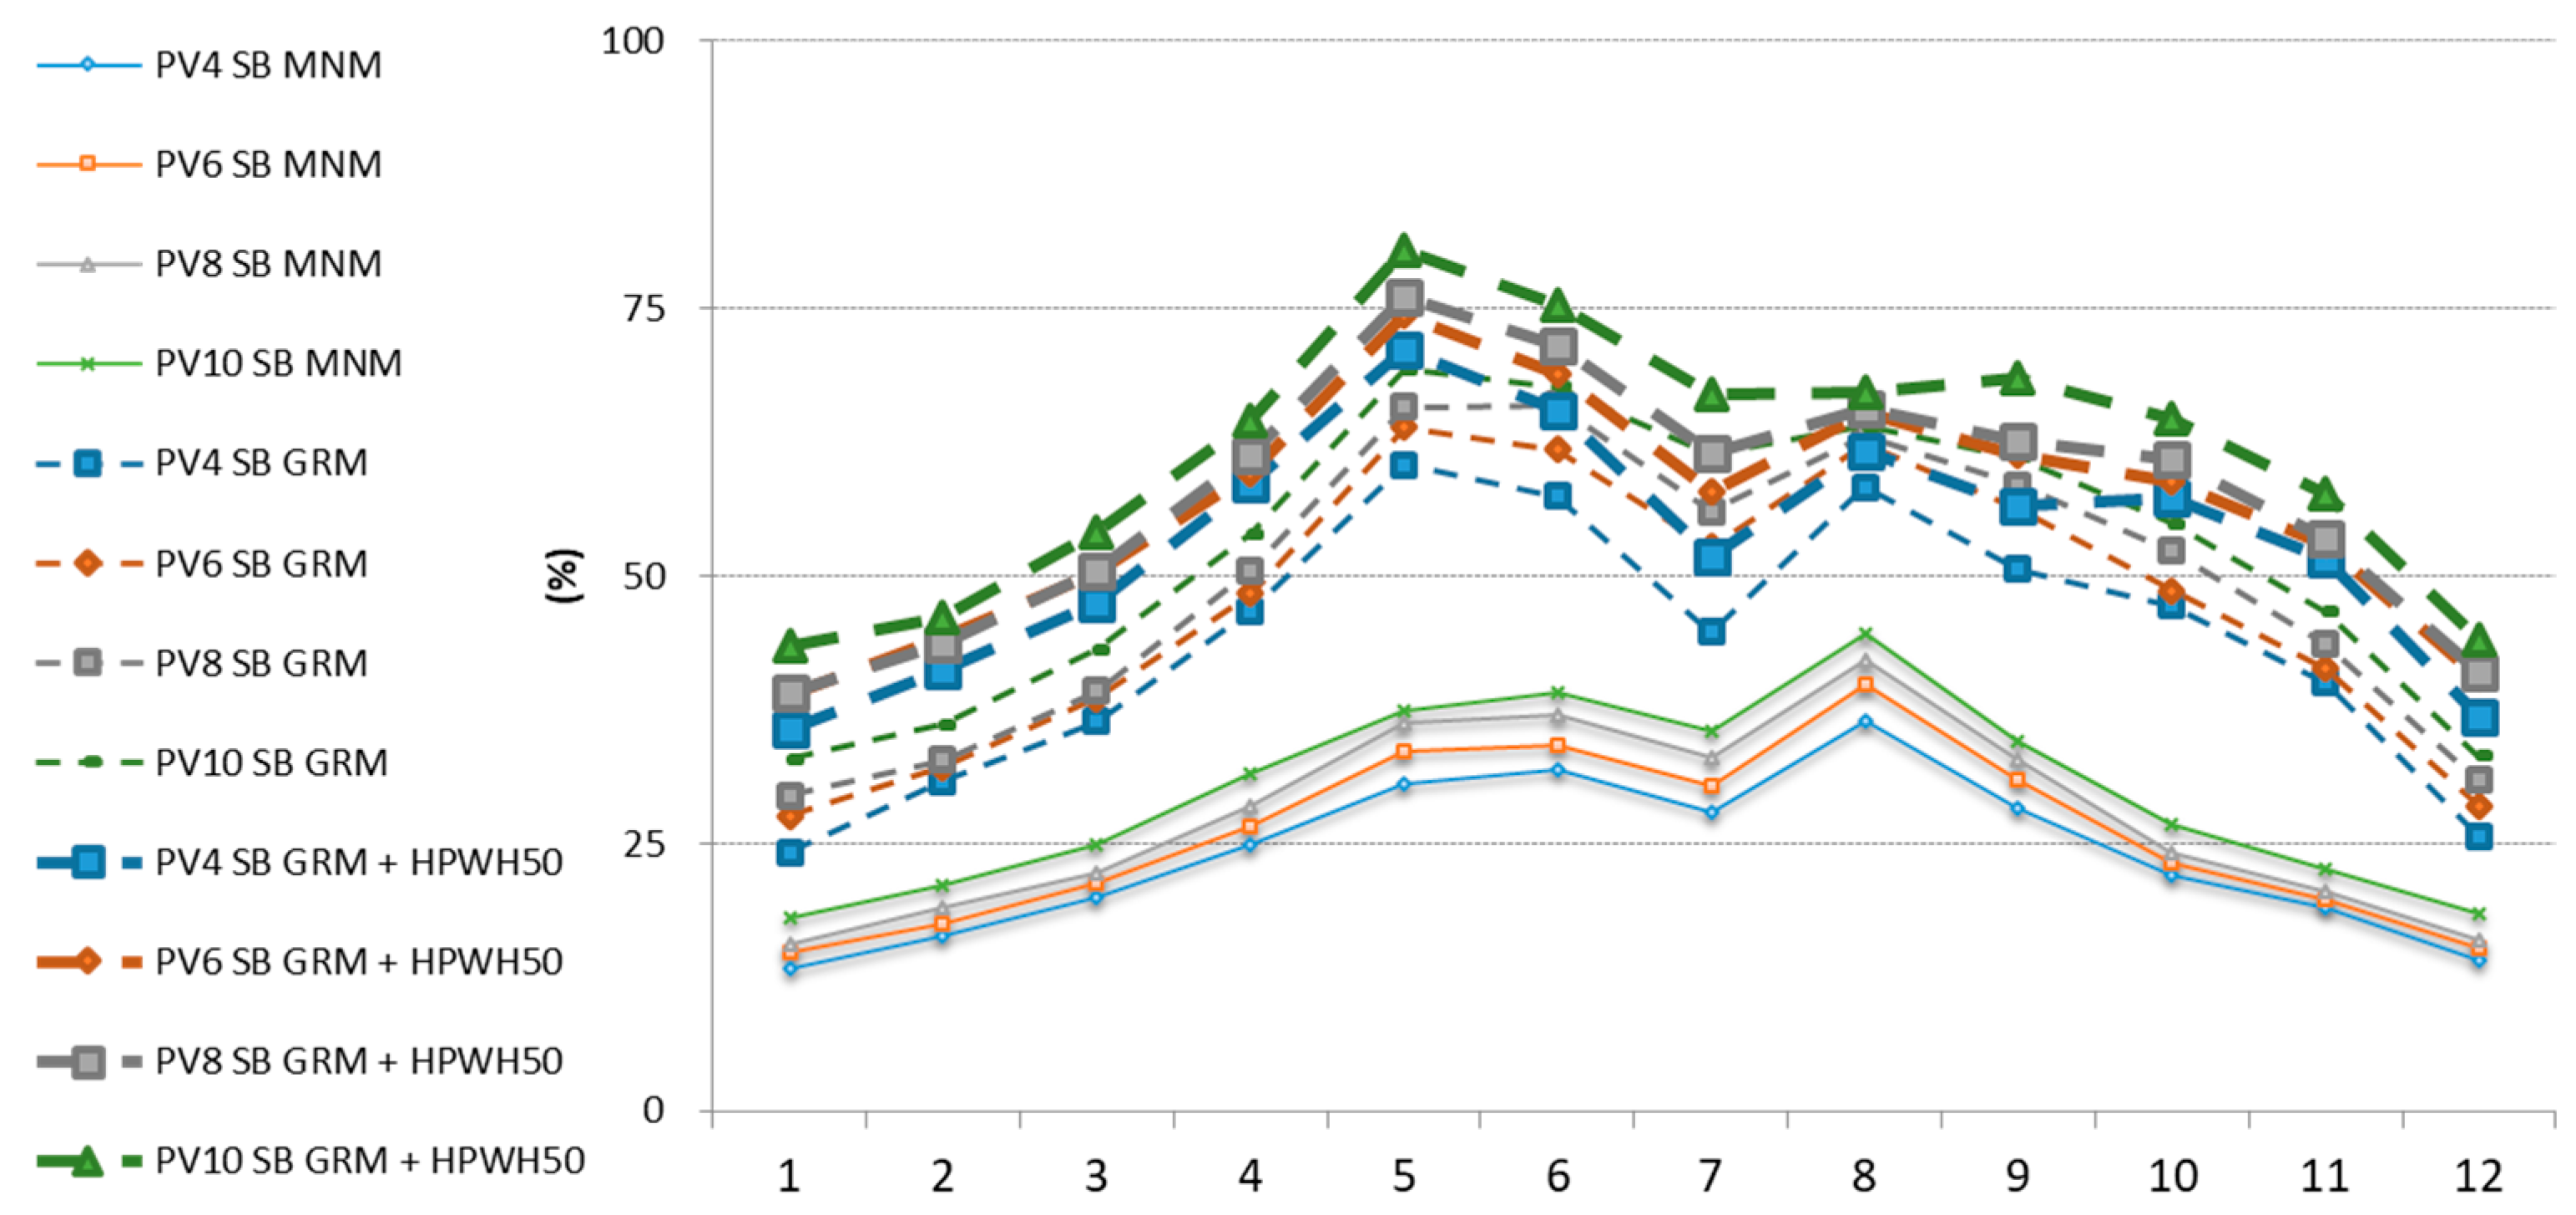
In this study, the SSR was calculated in various categories, assuming that 50% of the power consumption in HPWH is used for the surplus power of PV (HPWH: 50%) and that 100% is used (HPWH: 100%). Figure 18 summarizes the annual SSR for each category. Compared to SB (S) and SB (M), SB (L) shows a large increase in the SSR for any PV capacity when used in the GRM: 65% for PV10 SB (L) GRM, 71% for GRM + HPWH 50%, and 78% for GRM + HPWH 100%. However, even with SB (S), the SSR increases to 52–59% at any PV capacity when used with HPWH 100%. Even with the same SB (M), the SSR increases to 41% for PV4 GRM and 49% for PV10, indicating that the SSR changes with the PV capacity. Thus, to improve the SSR, increasing the capacity of SB and effectively utilizing the PV surplus power using HPWH is essential. Figure 19 shows the monthly SSR for SB (M). The SSR is the highest in the summer and increases to ~40% when using the SB in the MNM. When only SB are operated in the GRM and when HPWH is operated at 50%, the SSR is generally the highest in May, followed by October, and the summer months. For PV6, the SSR was 31% in the MNM of the SB in May, 54% in the GRM of the SB, 65% in the GRM + HPWH 50% operation, and 75% in the GRM + HPWH 100% operation. This is a 52% increase compared to the values for MNM. In August, the rates were 37%, 63%, 65%, and 68%, respectively. Since the power consumption of HPWH is 46 kWh, which is less than half that of May, the SSR increased when the GRM of HPWH was only 2–3%. Even in January, when the SSR was the least, 45% SSR was achieved with the SB operated in the GRM + HPWH 50% mode.
7. Regression Formula of SSR (Semilogarithmic Approximation)
Depending on the PV capacity, a logarithmic regression formula was used to calculate the changes in SSR when the SB are operated in the GRM and HPWH is operated in 100% GRM. Note that the TCE was classified as follows: 25% TCE denoted as TCE (S); 25–75% TCE as TCE (M); and >75% TCE as TCE (L). Figure 20, Figure 21 and Figure 22 show the cases for SB (S), SB (M), and SB (L), respectively. First, the SSR of SB (S), SB (M), and SB (L) is compared in TCE (L). The SSR of SB (S) in Figure 20 starts converging at a PV of ~8 kW and increases only up to ~35% at the maximum. The SSR of SB (M) in Figure 21 also increases to a PV of ~9 kW, and then, the elongation slows down to a maximum of ~60%. The SSR of SB (L) in Figure 22 continues to increase to a PV of 13 kW and reaches values ≥65%. As the PV capacity increases, the SSR of SB (S) increases to only about 10%, while that of SB (L) increases to nearly 30%. Next, for intermediate TCE (TCE (M)), in the case of SB (S) shown in Figure 20, as in the case of TCE (L), the SSR starts to converge from around PV (8 kW). Overall, however, the SSR is about 10% higher than that for the TCE (L), and the maximum SSR is 45%. In Figure 21, in the case of SB (M), the SSR increases up to ~60% when the PV starts converging from ~10 kW. In the case of SB (L), as shown in Figure 22, the SSR continued to increase owing to an increase in the PV capacity; at a PV of 3 kW, the SSR was <50% but increased to a maximum of 70%. The difference was >25%, which is the largest increase in the latest survey. Finally, when the TCE was low (TCE (S)), as shown in Figure 20, for SB (S), the SSR started converging at a PV of 6–7 kW, the maximum SSR was 60%, and the elongation was ~10%. As shown in Figure 21, for SB (M), the convergence was slow and the SSR was ≥70 at the maximum. The growth rate was ~30%, which is the highest for SB (M). However, in the case shown in Figure 22, the SSR was originally high at 65% even with a PV of 3 kW, in addition to an increase of >15%. Thus, the most effective way of maintaining a high SSR was to maintain low TCE and to balance the SB and PV capacity 22.
8. Conclusions
Using the most recent and large amount of HEMS data, the analysis was carried out for the case where the HPWH was combined for each capacity of the PV power generation system and the SB, and a regression model was obtained for each capacity of the PV, the SB and the TCE. The model described in Section 7 is valid because the t value is 2 or more and the P value is 0.05 or less in most categories and it was confirmed that there is no problem with the heterocedasticity (statistical analysis is entered in the legend in Figure 20, Figure 21 and Figure 22). The most important and efficient way of improving the SSR is to reduce the TCE. Even if the PV and SB are small, the SSR can be expected to be 70% if the energy consumption is small. If the energy consumption is close to the median value (TCE (M)), the SSR can be expected to exceed 80% when the SB capacity is increased. Furthermore, the SSR can be expected to exceed 80% when the PV capacity is increased. To plan a house with a high SSR with less expenditure, studying methods to reduce the energy consumption is necessary by analyzing further energy consumption with HEMS data, as well as by improving high-efficiency equipment and thermal insulation performance. In the future, if energy saving is advanced with the improvement of amenities, and if increasing the size of SB is possible, the SSR will be improved further, and the system will be stabilized by supporting virtual power plants in some cases. Furthermore, examining how SSR changes with the cooperation of electric vehicles is essential. By optimally combining solar power generation, SB, and HPWH, an energy efficient electric heat-pump and water heating and supply system, the evolution of the Internet of Things will lead to reduction in CO2 emissions and system stability and to improved comfort in not only Japan but also the residential sector worldwide. This study is limited to the analysis of the general area of a detached house zone. Further increases in HEMS data could lead to increases in cold regions (e.g., Hokkaido and Aomori [29]). Whether it is a two-family situation or a couple-only family, it will be possible to analyze various areas and households for the future. Housing suppliers supply more houses with less environmental impact and Residents improve their quality of life while maximizing their use of renewable energy. To do this, more researchers need to analyze, use, and disseminate more HEMS data.
Author Contributions
Conceptualization, M.O. and R.O.; methodology, Y.I.; software, M.O.; validation, M.O. and R.O.; formal analysis, Y.I.; investigation, M.O.; resources, M.O.; data curation, M.O.; writing—original draft preparation, M.O.; writing—review and editing, R.O.; visualization, Y.I.; supervision, Y.I.; project administration, R.O. All authors have read and agreed to the published version of the manuscript.
Funding
This research did not receive any specific grant from any funding agencies in the public, commercial, or not-for-profit sectors.
Acknowledgments
We would like to express our deep gratitude to Master Taisa of NTT DATAS System for the storage, management, and extraction of HEMS data. We would also like to express our gratitude to all members of the HEMS Data Utilization Project. Furthermore, we would like to thank the teachers that provided their valuable advice at the University of the Tokyo Institute of Technology. Lastly, we would like to thank Enago (www.enago.jp, accessed on 10 February 2021) for the English language review.
Conflicts of Interest
The authors declare no conflict of interest. The funders had no role in the design of the study; in the collection, analyses, or interpretation of data; in the writing of the manuscript, or in the decision to publish the results.
References
- Sepasgozar, S.M.E.; Blair, J. Measuring non-road diesel emissions in the construction industry: A synopsis of the literature. Int. J. Constr. Manag. 2019. [Google Scholar] [CrossRef]
- van der Stelt, S.; AlSkaif, T.; van Sark, W. Techno-economic analysis of household and community energy storage for residential prosumers with smart appliances. Appl. Energy 2018, 209, 266–276. [Google Scholar] [CrossRef]
- Yildiz, B.; Bilbao, J.; Sproul, A. A Method for Classifying Households to Help Forecasting their Photovoltaic Electricity Self-Consumption Patterns. In Proceedings of the Asia Pacific Solar Research Conference, Melbourne, Australia, 5–7 December 2017; Australian PV Institute: Sydney, Australia, 2017. Available online: https://builtbetter.org/node/7619 (accessed on 4 December 2018).
- Yao, L.; Lai, C.-C.; Lim, W.H. Home Energy Management System based on Photovoltaic System. In Proceedings of the IEEE International Conference on Data Science and Data Intensive Systems, Sydney, Australia, 11–13 December 2015; pp. 644–650. [Google Scholar] [CrossRef]
- Zhao, P.; Wu, H.; Gu, C.; Hernando-Gil, I. Optimal home energy management under hybrid photovoltaic-storage uncertainty: A distributionally robust chance-constrained approach. IET Renew. Power Gener. 2019, 13, 1911–1919. [Google Scholar] [CrossRef] [Green Version]
- Jin, X.; Maguire, J.; Christensen, D. Economic Sizing of Batteries for the Smart Home. In Proceedings of the 5th International High Performance Buildings Conference, West Lafayette, Indiana, 9–12 July 2018; Available online: https://www.nrel.gov/docs/fy18osti/71619.pdf (accessed on 4 December 2018).
- Zhao, C.; Dong, S.; Li, F.; Song, Y. Optimal home energy management system with mixed types of loads. CSEE J. Power Energy Syst. 2015, 1, 29–37. Available online: https://0-ieeexplore-ieee-org.brum.beds.ac.uk/stamp/stamp.jsp?arnumber=7377166 (accessed on 4 December 2018). [CrossRef]
- Azuatalam, D.; Forstl, M.; Paridari, K. Techno-economic Analysis of Residential PV-battery Self-Consumption. In Proceedings of the Asia-Pacific Solar Research Conference, University of New South Wales, Sydney, Australia, 4–6 December 2018; Available online: http://apvi.org.au/solar-research-conference/wp-content/uploads/2018/12/059_DI_Azuatalam_D_2018.pdf (accessed on 4 December 2018).
- Al-Saqlawi, J.; Madani, K.; Mac Dowell, N. Techno-economic feasibility of grid-independent residential roof-top solar PV systems in Muscat, Oman. Energy Convers. Manag. 2018, 178, 322–334. [Google Scholar] [CrossRef]
- Luthander, R.; Widén, J.; Munkhammar, J.; Lingfors, D. Self-consumption enhancement and peak shaving of residential photovoltaics using storage and curtailment. Energy 2016, 112, 221–231. [Google Scholar] [CrossRef]
- Luthander, R.; Widén, J.; Nilsson, D.; Palm, J. Photovoltaic self-consumption in buildings: A review. Appl. Energy 2015, 142, 80–94. [Google Scholar] [CrossRef] [Green Version]
- Leonard, M.D.; Michaelides, E.E. Grid-independent residential buildings with renewable energy sources. Energy 2018, 148, 448–460. [Google Scholar] [CrossRef]
- Vieira, F.M.; Moura, P.S.; de Almeida, A.T. Energy storage system for self- consumption of photovoltaic energy in residential zero energy buildings. Renew. Energy 2017, 103, 308–320. [Google Scholar] [CrossRef]
- Hadi, P.O. Designing hybrid system of PV-battery based on energy independence level, Seatuc. J. Sci. Eng. 2019, 1, 31–37. [Google Scholar] [CrossRef]
- Sameti, M.; Kasaeian, A. Simulation of a ZEB electrical balance with a hybrid small wind/PV. Sustain. Energy 2014, 2, 5–11. [Google Scholar] [CrossRef]
- Ishida, K. Energy consumption of detached houses. J. Archit. Plan. Environ. Eng. AIJ 1997, 501, 29–36. [Google Scholar] [CrossRef]
- Murakami, S.; Bogaki, K. Detail survey of long-term energy consumption for 80 houses. J. Environ. Eng. AIJ 2006, 603, 93–100. [Google Scholar] [CrossRef]
- Akabayashi, S.; Murakami, S. Study on the energy consumption of various electric appliances for the 80 houses in Japan. J. Environ. AIJ 2007, 619, 61–67. [Google Scholar] [CrossRef] [Green Version]
- Hasegawa, Y.; Inoue, T. Energy consumption in housing on the basis of national scale questionnaire Part 1 study on influence of residential characteristic and dispersion of energy consumption. J. Environ. AIJ 2004, 583, 23–28. [Google Scholar]
- Inoue, T.; Mizutani, S. Energy consumption in housing on the basis of national scale questionnaire Part 2. J. Environ. AIJ 2006, 606, 75–80. [Google Scholar] [CrossRef] [Green Version]
- Seike, T.; Akimoto, T.; Serikawa, M.; Satoh, M.; Aozasa, K. Validation of energy saving on “Leading Projects Adopted by Promotion Programs for CO2 Emission Reduction Projects” for residential houses. AIJ J. Technol. Des. 2016, 22, 199–204. [Google Scholar] [CrossRef] [Green Version]
- Honda, T.; Kudo, Y. The Effects of Energy Saving in Different Types of Housing Household’Actua1 Electricity Consumption based on HEMS data. Jpn. Inst. Energy 2015. [Google Scholar] [CrossRef]
- Iga, A.; Yamaguchi, M.; Yokoyama, S.; Sueda, O.; Yoshii, K.; Kaneko, T. Study of the merit of battery combined photovoltaic gneration system for residential house (2). IEEJ Trans. Power Energy 2004, 124, 1224–1230. [Google Scholar] [CrossRef] [Green Version]
- Nishino, Y. Economic evaluation of residential solar power generation. J. Socio Econ. Res. 1987, 1, 1–16. Available online: https://criepi.denken.or.jp/jp/serc/periodicals/pdf/periodicals22_01.pdf (accessed on 4 December 2018).
- Nakajima, A.; Nagano, K. Study on smart community integrated with heat pump (Part 1) Optimum control of charging and discharging of lithium ion battery cooperated with PV panel for a smart house. Shasetaikai 2017, E-9, 37–40. [Google Scholar] [CrossRef]
- Murakami, T.; Nagano, K. Study on smart community integrated with ground source heat pump (Part 2) Optimization method of energy demand supply system in smart house. Shasetaikai 2017, E-10, 41–44. [Google Scholar] [CrossRef]
- Endo, H.; Yokoyama, S. Application of battery combined photovoltaic generation system for disaster-proof house. JIPE 2006, 31, 109–115. [Google Scholar] [CrossRef] [Green Version]
- Association for Electric Home Appliances. Home Appliance Industry Handbook. 2018. Available online: https://www.aeha.or.jp/about/pdf/kadenhandbook_2018.pdf (accessed on 4 December 2018).
- Kuwasawa, Y.; Mineno, S.; Sase, T. Study on characterization of integrated system with household storage battery and PV in LCCM housing. Part 2. Shasetaikai 2018, D-37, 173–176. [Google Scholar] [CrossRef]
- Ministry of Internal Affairs and Communications. Housing Land Statistics Survey. 2019. Available online: https://www.stat.go.jp/data/jyutaku/2018/pdf/kihon_gaiyou.pdf (accessed on 30 September 2019).
- Ministry of Economy. Trade and Industry Energy White Paper. 2018. Available online: https://www.enecho.meti.go.jp/about/whitepaper/2018pdf/ (accessed on 8 June 2018).
- Ministry of the Environment. Annual Report on the Environment. 2019. Available online: http://www.env.go.jp/en/wpaper/ (accessed on 7 June 2019).
Figure 1.
Configuration of home energy management system (HEMS).

Figure 2.
HEMS users by construction year.

Figure 3.
Family type-based ratio of floor area (Zone 6).

Figure 4.
Capacity-based ratio of photovoltaic (PV) users.

Figure 5.
Capacity-based ratio of storage battery users.

Figure 6.
Annual power balance for PV and storage batteries (SB).

Figure 7.
Annual self-sufficiency rate, operation rate, and charge and discharge rate for PV and SB.
Figure 7.
Annual self-sufficiency rate, operation rate, and charge and discharge rate for PV and SB.

Figure 8.
Monthly energy balance for PV8 SB (S).

Figure 9.
Monthly energy balance for PV8 SB (M).

Figure 10.
Monthly energy balance for PV8 SB (L).

Figure 11.
Hourly energy balance for PV8 SB (L) in February 2020.

Figure 12.
Hourly energy balance for PV8 SB (L) in August 2020.

Figure 13.
Annual total and HPWH consumption of SB type for PV.

Figure 14.
Annual power consumption and HPWH of Family type for PV.

Figure 15.
Annual power consumption and HPWH of floor space.

Figure 16.
Annual power consumption and HPWH of construction year.

Figure 17.
Monthly total consumption and HPWH consumption of PV.

Figure 18.
Annual SSR of SB and HPWH.

Figure 19.
Monthly self-sufficiency rate (SSR) of PV and SB and HPWH for SB (M).

Figure 20.
Self-sufficiency rate (SSR) regression equation for each PV capacity by SB (S) green mode (GRM) and HPWH 100%.
Figure 20.
Self-sufficiency rate (SSR) regression equation for each PV capacity by SB (S) green mode (GRM) and HPWH 100%.

Figure 21.
SSR regression equation for each PV capacity by SB (M) GRM and HPWH 100%.

Figure 22.
SSR regression equation for each PV capacity by SB (L) GRM and HPWH 100%.


Table 1.
Available HEMS data. (Data sources: Sekisui Chemical Co., Ltd., Housing Company.)
| Static Data | Resident Information | Building Area, Number of Residents, Family Structure, Resident’s age, Holidays, etc. |
| Housing information | Building Type, Floor Area, Building Date Construction orientation, building materials used, thermal insulation performance, etc. | |
| Ancillary facility information | Heating and Cooling Equipment, HPWH Information, Solar Power Generators Battery facility information V to H system information Ventilation system information | |
| Dynamic Data | Energy consumption (by year, month, day, and hour) | Total energy consumption, energy consumption by use Heating and cooling consumption, HPWH consumption Lighting, ventilation energy consumption Consumption by equipment (refrigerator, IH heater, etc.) Consumption by room (LDK, master bedroom, children’s room, etc.) |
| Solar power generation Storage battery related (by year, month, day, and hour) | Amount of solar power generation, in-house consumption, and electricity sales and purchase Battery charge, battery discharge, and remaining amount |
Table 2.
HEMS users by energy conservation level zone.
| Zone | 1 | 2 | 3 | 4 | 5 | 6 | 7 |
| Users | 489 | 912 | 1060 | 4648 | 15,752 | 32,149 | 1543 |
Table 3.
Annual household and facility specification.
| Year | Insulation Av. UA (W/m2 K) | CAC COP | Balanced Ventilation | HPWH APF |
|---|---|---|---|---|
| 2011 | 0.65 | 3.48 | AC Motor | 2.98 |
| 2012 | 0.65 | 3.50 | AC Motor | 2.98 |
| 2013 | 0.65 | 4.00 | AC Motor | 2.99 |
| 2014 | 0.65 | 4.00 | DC Motor | 3.06 |
| 2015 | 0.65 | 4.00 | DC Motor | 3.11 |
| 2016 | 0.65 | 4.00 | DC Motor | 3.23 |
| 2017 | 0.59 | 4.00+ Control | DC Motor+ Control | 3.29 |
| 2018 | 0.57 | 4.00+ Control | DC Motor+ Control | 3.31 |
| 2019 | 0.57 | 4.00+ Control | DC Motor+ Control | 3.40 |
| 2020 | 0.55 | 4.00+ Control | DC Motor+ Control | 3.40 |
Table 4.
Analysis of HEMS data.
| Single Family Energy Conservation Level Zone 6 | ||||
|---|---|---|---|---|
| Floor space (m2) | 100~140 | |||
| Photovoltaic (Average kW) | 4 (3–5) | 6 (5.1–7) | 8 (7.1–9) | 10 (9.1–11) |
| Storage battery(kWh) | Small (4–5), Middle (5.1–8), Large (8.1–12) | |||
| Year of construction | 2013–2019 | |||
| Measurement period | 2020/01–2020/12 | |||
| Number of households | 821 | |||
| Extracted data | TPC, PG, PE, SE, CE, DCE | |||
Publisher’s Note: MDPI stays neutral with regard to jurisdictional claims in published maps and institutional affiliations. |
© 2021 by the authors. Licensee MDPI, Basel, Switzerland. This article is an open access article distributed under the terms and conditions of the Creative Commons Attribution (CC BY) license (http://creativecommons.org/licenses/by/4.0/).
Share and Cite
MDPI and ACS Style
Oota, M.; Iwafune, Y.; Ooka, R. Estimation of Self-Sufficiency Rate in Detached Houses Using Home Energy Management System Data. Energies 2021, 14, 975. https://0-doi-org.brum.beds.ac.uk/10.3390/en14040975
AMA Style
Oota M, Iwafune Y, Ooka R. Estimation of Self-Sufficiency Rate in Detached Houses Using Home Energy Management System Data. Energies. 2021; 14(4):975. https://0-doi-org.brum.beds.ac.uk/10.3390/en14040975
Chicago/Turabian StyleOota, Masato, Yumiko Iwafune, and Ryozo Ooka. 2021. "Estimation of Self-Sufficiency Rate in Detached Houses Using Home Energy Management System Data" Energies 14, no. 4: 975. https://0-doi-org.brum.beds.ac.uk/10.3390/en14040975
Note that from the first issue of 2016, this journal uses article numbers instead of page numbers. See further details here.