Article

The Equilibrium Phase Formation and Thermodynamic Properties of Functional Tellurides in the Ag–Fe–Ge–Te System

1
Department of Chemistry and Physics, National University of Water and Environmental Engineering, 33028 Rivne, Ukraine
2
Department of Physical and Colloid Chemistry, Ivan Franko National University of Lviv, 79005 Lviv, Ukraine
3
Johan Gadolin Process Chemistry Centre, Åbo Akademi University, 20500 Turku, Finland
4
Department of Inorganic Chemistry, Ivan Franko National University of Lviv, 79005 Lviv, Ukraine
5
Department of Cartography and Geospatial Modeling, Lviv Polytechnic National University, 79013 Lviv, Ukraine
6
Department of Chemical and Metallurgical Engineering, Aalto University, Kemistintie 1, 02150 Espoo, Finland
*
Authors to whom correspondence should be addressed.
Submission received: 31 December 2020 / Revised: 21 February 2021 / Accepted: 25 February 2021 / Published: 28 February 2021

Abstract

:
Equilibrium phase formations below 600 K in the parts Ag2Te–FeTe2–F1.12Te–Ag2Te and Ag8GeTe6–GeTe–FeTe2–AgFeTe2–Ag8GeTe6 of the Fe–Ag–Ge–Te system were established by the electromotive force (EMF) method. The positions of 3- and 4-phase regions relative to the composition of silver were applied to express the potential reactions involving the AgFeTe2, Ag2FeTe2, and Ag2FeGeTe4 compounds. The equilibrium synthesis of the set of phases was performed inside positive electrodes (PE) of the electrochemical cells: (−)Graphite ‖LE‖ Fast Ag+ conducting solid-electrolyte ‖R[Ag+]‖PE‖ Graphite(+), where LE is the left (negative) electrode, and R[Ag+] is the buffer region for the diffusion of Ag+ ions into the PE. From the observed results, thermodynamic quantities of AgFeTe2, Ag2FeTe2, and Ag2FeGeTe4 were experimentally determined for the first time. The reliability of the division of the Ag2Te–FeTe2–F1.12Te–Ag2Te and Ag8GeTe6–GeTe–FeTe2–AgFeTe2–Ag8GeTe6 phase regions was confirmed by the calculated thermodynamic quantities of AgFeTe2, Ag2FeTe2, and Ag2FeGeTe4 in equilibrium with phases in the adjacent phase regions. Particularly, the calculated Gibbs energies of Ag2FeGeTe4 in two different adjacent 4-phase regions are consistent, which also indicates that it has stoichiometric composition.

1. Introduction

Several household devices and industrial applications dissipate considerable amounts of heat. About 60% of the dissipated heat is below 473 K, therefore, recovering the low temperature waste heat plays a crucial role in improving energy efficiency [1]. Low and intermediate temperature thermoelectric materials (TMs) technology promoting high performance and low materials cost play a key role for enabling energy efficiency through waste heat harvest and utilization [1,2,3]. Generally, discovery of new functional materials with unique physicochemical properties and a wider thermal stability ranges is one of the main objectives of inorganic materials research. In this regard, ternary and quaternary silver tellurides are good candidate functional materials with unique thermoelectric, photoelectric, non-linear optical, etc. properties [4,5,6]. Some of these compounds have high conductivity of Ag+ ion and can applied in electrochemical data storage devises, electrodes, sensors, etc. [7,8]. For instance, the performance of temperature (T) dependent TMs is quantified with figure of merit (ZT), which is dimensionless and expressed as ZT = σS2T∙(κlat + κel)−1, where σ, S, κlat, and κel are the electrical conductivity, Seebeck coefficient, electronic thermal conductivity, and lattice thermal conductivity, respectively [9,10]. The search for cost effective new TMs of high ZT is based on phase equilibria data in the respective systems and thermodynamic data of the individual phases in different temperature ranges.
The Ag–Fe system’s phase diagram is presented in [11]. The Fe1+xTe (0.067 < x < 0.17) and FeTe2 compounds exist in the system below 770 K [12]. The structural parameters for the Fe1.12Te phase were reported in [13]. The data on the formation of the AgFeTe2 compound in the Ag–Fe–Te system are debatable. The existence of the compound is denied in [14,15,16,17] due to the 2-phase composition of the ‘AgFeTe2’ samples quenched from the melt at T = 1073 K and from the range 873–1023 K. It was shown that the synthesis of ‘AgFeTe2’ resulted in at least two phases of which one is Ag2Te. The reported experimental results were also confirmed in [18,19,20], but the authors considered them insufficient to assert the absence of the AgFeTe2 compound in the solid-state part of Tx phase diagram. Physical properties of AgFeTe2 were studied in [20,21,22,23]. According to Shtrum [18], AgFeTe2 exists at T > 793 K. Structural characterizations of the AgFeTe2 single crystal quenched from T = 873 K were performed with X-ray analysis in [19]. The trigonal ordering of the crystal lattice with the parameters a = 0.760 nm, c = 0.569 nm, c/a = 0.749, Z = 3 was established. The AgFeTe2 single crystal decomposes into two phases below 773 K. Such solid-state decomposition of compounds is not uncommon. For instance, the decomposition of CuFeS2 at T = 843 K was established in [24]. Another example is given in [25] where the superionic phase Ag2ZnI4 exists in two temperature ranges of (300–477) K and (538–553) K. The obstacle to the formation of equilibrium compounds from metastable heterogeneous phase mixtures at relatively low temperatures (T < 600 K) is the lack of the nucleation centers of a new phase due to the low energy of the thermal motion of atoms [26,27]. Kinetic barrier is eliminated by using the metastable phase mixture as the positive electrode (PE) of electrochemical cell (ECC) [28]. The defining role in these processes belongs to Ag+ cations that moved from the negative to the positive electrode and are centers of formation of the equilibrium compounds. Examples of the transition from metastable to equilibrium phases in PE of ECCs are presented in [29,30,31,32,33,34,35].
The existence of the only quaternary compound Ag2FeGeTe4 in the Fe-Ag–Ge–Te system was reported by [36]. The compound was obtained by cooling the melt mixture of the pure elements in an evacuated ampoule from T = 1420 K. The melt crystallizes at T = 990 K. The homogenization annealing of the crystallized material was performed at T = 770 K for 1 h, followed by rapid cooling to room temperature. X-ray study of the quenched material revealed that Ag2FeGeTe4 has orthorhombic lattice with the parameters a = 0.8048 nm, b = 0.6668 nm, and c = 0.6450 nm. No information on the thermal stability of Ag2FeGeTe4 below 600 K was found in the published literature.
The main objective of this experimental research was to reveal the possibilities of solid state synthesis of the equilibrium set of phases from a non-equilibrium mixture of elements and compounds in the Ag–Fe–Ge–Te system below 600 K. This temperature is also at which the energy of the thermal motion of atoms is not favorable for the nucleation centers of the phase formation; to establish the phase equilibria in the vicinity of synthesized ternaries and quaternary phases; and to determine thermodynamic properties of the AgFeTe2, Ag2FeTe2, and Ag2FeGeTe4 compounds. The obtained thermodynamic data can be applied for completing and optimizing phase diagrams of the studied system by applying the CALPHAD method [37,38]. Furthermore, the obtained data can help to control chemical behaviors of the multicomponent compounds in more complex systems; including the ongoing research for substitution of Fe with Co/Ni, Ge with Sn, and Te with S/Se, and to synthesis stable phases with high ZT parameter values.

2. Materials and Methods

2.1. Synthesis and Characterization

High purity elements, 99.99 wt% Ag, from Alfa Aesar (Karlsruhe, Germany), 99.9 wt% Fe also from Alfa Aesar (Karlsruhe, Germany), 99.999 wt% Ge from Lenreactiv (St. Petersburg, Russia), 99.99 wt% S from Lenreactiv (St. Petersburg, Russia), and 99.99 wt% Te from Lenreactiv (St. Petersburg, Russia) were used as initial materials for the synthesis of the compounds. The samples of compositions ‘AgFeTe2’ and ‘Ag2FeGeTe4’ were synthesized for X-ray diffraction (XRD) analysis by:
(1)
a carefully weighed mixture of the pure elements were synthesized in evacuated quartz ampoules by annealing at 630 K for 1 week. Then, the samples were cooled at the rate of 2 K·min−1 to room temperature and ground to ~5 μm particle size. Vacuum homogenization of the fine particles was conducted at 580 K for a week, and
(2)
melting of the appropriately weighed mixture of the pure elements at 1100 K in vacuum followed with annealing of the finely disperse mixture, also in vacuum, at 580 K for a week.
Equilibrium phases synthesis for the thermodynamic investigation of AgFeTe2, Ag2FeTe2, and Ag2FeGeTe4 was conducted within the positive electrodes (PEs) of the electrochemical cells (ECCs) at 560 K.
An STOE_STADI_P diffractometer equipped with a linear position-sensitive detector PSD, in a Guinier geometry (transmission mode, CuKα1 radiation, a bent Ge(111) monochromator, and 2θ/ω scan mode) collected the XRD patterns. Preliminary data processing and phase analysis with XRD were conducted with STOE_WinXPOW_3.03 [39] and Powder_Cell_2.4_PC programs [40], applying the data of structures of the compounds adapted from the database [41].
The Ag2GeS3 glass [42,43,44] was synthesized by melting appropriately weighed mixtures of the pure elements at 1200 K and quenching in ice-water.

2.2. Electromotive Force (EMF) Measurements

To accomplish accurate thermodynamic measurements by the EMF method [45,46,47,48,49], the following ECC were arranged:
(-)Graphite ‖LE‖SE‖R[Ag+]‖PE‖ Graphite(+),
where LE is (-) electrode on the left, SE is the solid-state fast Ag+ ions conducting solid-electrolyte, PE is the (+) electrode on the right, and R[Ag+] is the diffusion region of Ag+ into PE. Pure silver in powder form was used as LE. The purely Ag+ ion conducting Ag2GeS3 glass was used as SE [42,50].
PEs of the cells were prepared from a homogenously mixed powder (particles size ~5 μm) composition of the elements Ag, Fe, and Te (the Ag–Fe–Te system); the elements Ag, Fe, Te and compounds Ag8GeTe6, GeTe, FeTe2 (the Ag–Fe–Ge–Te system). The ratios of the elements and compounds were calculated from the potential reactions in the considered phase regions. Materials of the ECCs in powder form were poured in a hole with 2 mm in diameter that was arranged in the fluoroplast matrix and pressed at a pressure of 108 Pa. After pressing, the components had a density of ρ = (0.93 ± 0.02)·ρ0, where ρ0 is the experimentally determined density of cast samples [51,52]. The process of forming the equilibrium set of phases in the R[Ag+] region for the particle size of the heterogeneous phase mixture ~5 μm and 500 K took <10 h. The criterion for attaining phase equilibria in the R[Ag+] region of PE were; (1) when the EMF values (E) measured at the target equilibration temperature wing around a certain EMF value and (2) the reproducibility of the E vs. T relations of ECCs during the heating-cooling cycles. Due to its negligible amount, it was impossible to detach the equilibrium set of phases from pressed components of ECCs for X-ray diffraction analysis, similar to the one described in [28,30].
Measurements of the EMF were carried out by the compensation method in a resistance furnace situated horizontally similar to the one detailed in [53]. We used a continuously flowing highly purified 99.9% Ar(g) at p = 0.12 MPa, as protective atmosphere, with a rate of flowing of 2 × 10⁻³ m3·h−1 from the negative to positive electrode of the electrochemical cell. The temperature variation was controlled to be less than 0.1%. The EMF of the cells were measured with high resistance digital voltmeter universal U7-9 and MTech PGP-550M device. Differences in the EMF values at the specific equilibration temperature did not exceed ∆E = ±0.3 mV. The rate of heating and cooling were 2 K·min−1. More details on the ECCs and procedure of the EMF-measurements are given in our previous publications [54,55,56].

3. Results

3.1. Thermodynamic Data of the AgFeTe2 and Ag2FeTe2

Samples of the compounds ‘AgFeTe2′ were synthesized with the methods described in Section 2.1. According to results of XRD analysis, composition of these samples are identical and consists mixture of the Ag2Te [57], FeTe2 [58], and Fe1.12Te [41] compounds (Figure 1). Increasing the annealing time to 3 weeks did not change the samples’ diffraction patterns. Therefore, there are no indication of the formation of the AgFeTe2 compound under the conditions in the synthesis and annealing of the samples in vacuum ampoules, similar to Refs. [13,14,15].
The syntheses and thermodynamic investigations of the AgFeTe2 and Ag2FeTe2 compounds, as in case of AgFeSe2 and Ag2FeSe2 [28], were:
(1)
Characterized by the XRD method, heterogeneous phase compositions of the ‘AgFeTe2’ sample is for kinetic reasons considered metastable below 600 K;
(2)
The correctness of the proposed equilibrium concentration space division of the Ag–Fe–Te system in the part Ag2Te–FeTe2–Fe1.12Te (I) into separate 3-phase regions; and
(3)
Possibility of the synthesis of set of equilibrium phases, including the AgFeTe2 and Ag2FeTe2, in the PE of ECCs.
As in the case of the study of formation of equilibrium phase in the Se-Ag–Fe system [28], we analyzed the possibility the existence of AgFeTe2 and Ag2FeTe2 compounds in the equilibrium phase space of the Ag–Fe–Te system. The compositions AgFeTe2 and Ag2FeTe2 lay at the intersection points of the tie-lines AgTe–‘FeTe’, Ag–FeTe2, and Ag2Te–‘FeTe’, Ag–FeTe2, AgTe–Fe, respectively. According to Goryunova [59], ternary compounds are formed at the cross of the sections between binary compounds or binary compounds and elements.
The division of the equilibrium Te-Ag–Fe system’s concentration space in the part (I) into 2- and 3-phase regions involving the proposed ternary phases AgFeTe2 and Ag2FeTe2, and the binary compounds of the Ag–Te and Fe–Te systems is plotted in Figure 2. The correctness of the division was confirmed by the following experimental studies. Based on the suggested division of the Ag–Fe–Te system, samples of positive electrodes of the ECCs were prepared in different phase regions. The ratios of the elements Ag:Fe:Te into the 2- and 3-phase regions were: 1:2:4 (phase region FeTe2–AgFeTe2 (II)), 3:2:4 (AgFeTe2–Ag2FeTe2 (III)), 1:3:5 (FeTe2–Fe1.12Te–AgFeTe2), 3:2:5 (Ag2Te–FeTe2–AgFeTe2), 3:3:5 (Ag2FeTe2–Fe1.12Te–AgFeTe2), and 5:2:5 (Ag2Te–Ag2FeTe2–AgFeTe2), respectively.
In ECCs of the type (A), Ag+ ions diffusing from the electrode on the left to the right due to chemical potentials’ of silver difference in these regions [60]. The consequence of such dynamics is the existence of a potential difference at the two electrodes. Synthesis of the set of equilibrium phases was conducted in the PE of ECC at the diffusion depth of Ag+ ions, which is the R[Ag+] region. Since the Ag+ ions are not phases, they do not interact with PE components chemically. Instead, the Ag+ ions served as the nucleation centers for stable phases as well as catalysts for the low temperature synthesis of the equilibrium set of phases [26,28].
The positive electrodes of ECCs with components in the 2- and 3-phase regions are characterized by various EMF values at constant T between 435 and 490 K, Table 1 and Figure 3. The 3-phase region which is further away from the point of Ag has a higher EMF value. These data validate the suggested division of the concentration space in the Ag–Fe–Te system.
The division of (I) relative to the position of silver, shown in Figure 2, can be applied for the determination of the thermodynamic properties of the AgFeTe2 and Ag2FeTe2 by the EMF method [60]. The overall potential forming reactions can be expressed as:
Ag + FeTe2 = AgFeTe2,
Ag + AgFeTe2 = Ag2FeTe2.
The (R1) and (R2) reactions were realized in PE of the phase regions (II) and (III), respectively.
The analyses of the E vs. T relations for reactions (R1) and (R2) between 435 and 490 K was carried out by the least-squares method [60,61,62] using Equation (1):
E = a + b T   E ¯ + b ( T T ¯ ) ,
where E ¯ =   E i n , T ¯ =   T i n ( E i is the EMF of ECC at temperature T i ; n is number of experimental pairs E i and T i ).
Coefficients b and a were calculated by the following Equations (2) and (3):
b =   [ ( E i E ¯ ) ( T i T ¯ ) ]   ( T i T ¯ ) 2 ,
a =   E ¯ b T ¯ .
The measurement uncertainties’ statistical dispersions consisted of the determination of variances of the experimental EMF, E ( u E 2 ), coefficients b ( u b 2 ) and a ( u a 2 ), and the dispersions of the calculated EMF according to Equation (1) E ˜ ( u E ˜ 2 ):
u E 2 =   ( E i E ˜ i ) 2 n 2 ,
u b 2 ( T ) = u E 2   ( T i T ¯ ) 2 ,
u a 2 ( T ) = u E 2 n + u E 2 T ¯ 2   ( T i T ¯ ) 2 ,
u E ˜ 2 ( T ) = u E 2 n + u b 2 ( T T ¯ ) 2 .
Equation (8) was applied to calculate the corresponding uncertainties ( Δ i ):
Δ i = k S t u i ,
where k S t is the Student’s coefficient, and u i is the standard deviation. Student’s coefficient is k S t = 2.179 when n = 12 and with the confidence level of 95% [63].
The overall equation of the E as a function of T together with the statistical dispersions can be express as [48,64]:
E = a + b T ± k S t ( u E 2 n + u b 2 ( T T ¯ ) 2 ) .
Presented in Table 1 experimental values of the EMF and temperature were used to calculate the coefficients and dispersions of Equation (9) for the (II) and (III) phase regions. The obtained results are listed in Table 2.
The Gibbs energies, enthalpies and entropies of reactions (R1) and (R2) can be calculated by applying the measured EMF of each ECCs as a function of temperature in the fundamental Equations (10)–(12):
Δ r G = z · F · E ,
Δ r H = z · F · [ E ( d E / d T ) · T ] ,
Δ r S = z · F · ( d E / d T ) ,
where z = 1 is the number of electrons participated in reactions (R1) and (R2), F is Faraday’s constant (96,485.33 C·mol−1), and E in V is the EMF of the ECCs.
The thermodynamic functions of the reactions (R1) and (R2) at 298 K were determined using Equations (10)–(12) by approximating ( Δ r H T ) p = 0 and ( Δ r S T ) p = 0 [29,65]. The determined results are collected in Table 3.
Standard thermodynamic functions of reaction (R1) are related to the thermodynamic functions of formation of the phases and pure elements by Equations (13)–(18):
Δ r ( R 1 ) G = Δ f G AgFeTe 2 Δ f G FeTe 2 ,
Δ r ( R 1 ) H = Δ f H AgFeTe 2 Δ f H FeTe 2 ,
Δ r ( R 1 ) S = S AgFeTe 2 S Ag S FeTe 2 .
It follows from Equations (13)–(15) that:
Δ f G AgFeTe 2 = Δ f G FeTe 2 + Δ r ( R 1 ) G ,
Δ f H AgFeTe 2 = Δ f H FeTe 2 + Δ r ( R 1 ) H ,
S AgFeTe 2 = S Ag + S FeTe 2 + Δ r ( R 1 ) S .
The corresponding reactions to determine Δ f G , Δ f H , and S for the Ag2FeTe2 compound can be written similar to Equations (16)–(18) with their appropriate stoichiometric numbers.
By combining Equations (16)–(18) and thermodynamic data for Ag and FeTe2 [66], the formation standard Gibbs energies of the AgFeTe2 and Ag2FeTe2 compounds have been calculated for the first time. The results of the calculations are shown in Table 4.
The Gibbs energies of formations of the AgFeTe2 and Ag2FeTe2 compounds as functions of temperature are described by the following equations as:
Δ f G AgFeTe 2 / ( kJ · mol 1 ) =   ( 85.86 ± 1.08 ) + ( 5.80 ± 0.17 ) × 10 3 T / K ,
Δ f G Ag 2 FeTe 2 / ( kJ · mol 1 ) =   ( 93.23 ± 1.21 ) ( 24.48 ± 0.51 ) × 10 3 T / K .

3.2. Thermodynamic Properties of the Ag2FeGeTe4 Compound

The samples of the formula composition ’Ag2FeGeTe4′ were obtained by both methods described in Section 2.1 above. For both samples, the diffraction patterns are identical (see Figure 4). The presence of the phases Ag8GeTe6, FeTe2, GeTe, and impurities of the fourth unidentified phase in the samples was identified by XRD. Heat treatment of the finely disperse mixture of the phases in vacuum and in the range between 450 and 600 K did not affect samples’ phase composition.
As in the case of the AgFeTe2 and Ag2FeTe2 compounds (Section 3.1), investigation of thermodynamic properties of the Ag2FeGeTe4 in this work were on the following reasons:
(a)
below 600 K, composition of the samples of the concentration triangle Ag8GeTe6–FeTe2–GeTe in the Ag–Fe–Ge–Te system as the mixture of Ag8GeTe6, FeTe2, and GeTe compounds is considered to be metastable for kinetic reasons,
(b)
possibility of the Ag2FeGeTe4 synthesis, similar to the synthesis of the AgFeTe2 and Ag2FeTe2 compounds into the PE of ECC, and
(c)
correctness of the division of the equilibrium concentration space Fe–Ag–Te–Ge system in the Ag8GeTe6–GeTe–FeTe2–AgFeTe2–Ag8GeTe6 part into separate 4-phase regions: Ag8GeTe6–Ag2FeGeTe4–GeTe–AgFeTe2 (IV), Ag8GeTe6–Ag2FeGeTe4–GeTe–FeTe2 (V), Ag8GeTe6–Ag2FeGeTe4–AgFeTe2–FeTe2, and GeTe–Ag2FeGeTe4–AgFeTe2–FeTe2.
The phase equilibria of the Fe–Ag–Te–Ge system in the part Ag8GeTe6–GeTe–FeTe2–AgFeTe2–Ag8GeTe6 are shown in Figure 5.
The concentration space’s division into separate regions was performed with the information presented in [36,54,67] as well as this work. Validity of the proposed limits of 4-phase regions is done by the following calculations of thermodynamic values of the Ag2FeGeTe4 compound.
The position of the phase regions (IV) and (V) relative to Ag was used to express the equations of the overall reactions of decomposition and synthesis of the 4-component compound:
3Ag + 5Ag2FeGeTe4 = Ag8GeTe6 + 5AgFeTe2 + 4GeTe,
2Ag + Ag8GeTe6 + 4GeTe + 5FeTe2 = 5Ag2FeGeTe4.
According to the reactions (R3) and (R4), the phase compositions of the positive electrodes in the phase regions (IV) and (V) were determined by element ratios Ag:Fe:Ge:Te of 23:10:10:40 and 18:10:10:40, respectively. The compositions of the PE are marked in Figure 5 by red circles and are located on the Ag–Ag2FeGeTe4 ray-line of the Ag–Fe–Ge–Te tetrahedron, on both sides of the Ag2FeGeTe4 composition. The PE samples ‘Ag2.3FeGeTe4’ and ‘Ag1.8FeGeTe4’ were obtained by melting a mixture of pure elements at 1100 K and heat treatment of the mixture at 580 K in vacuum for 1 week.
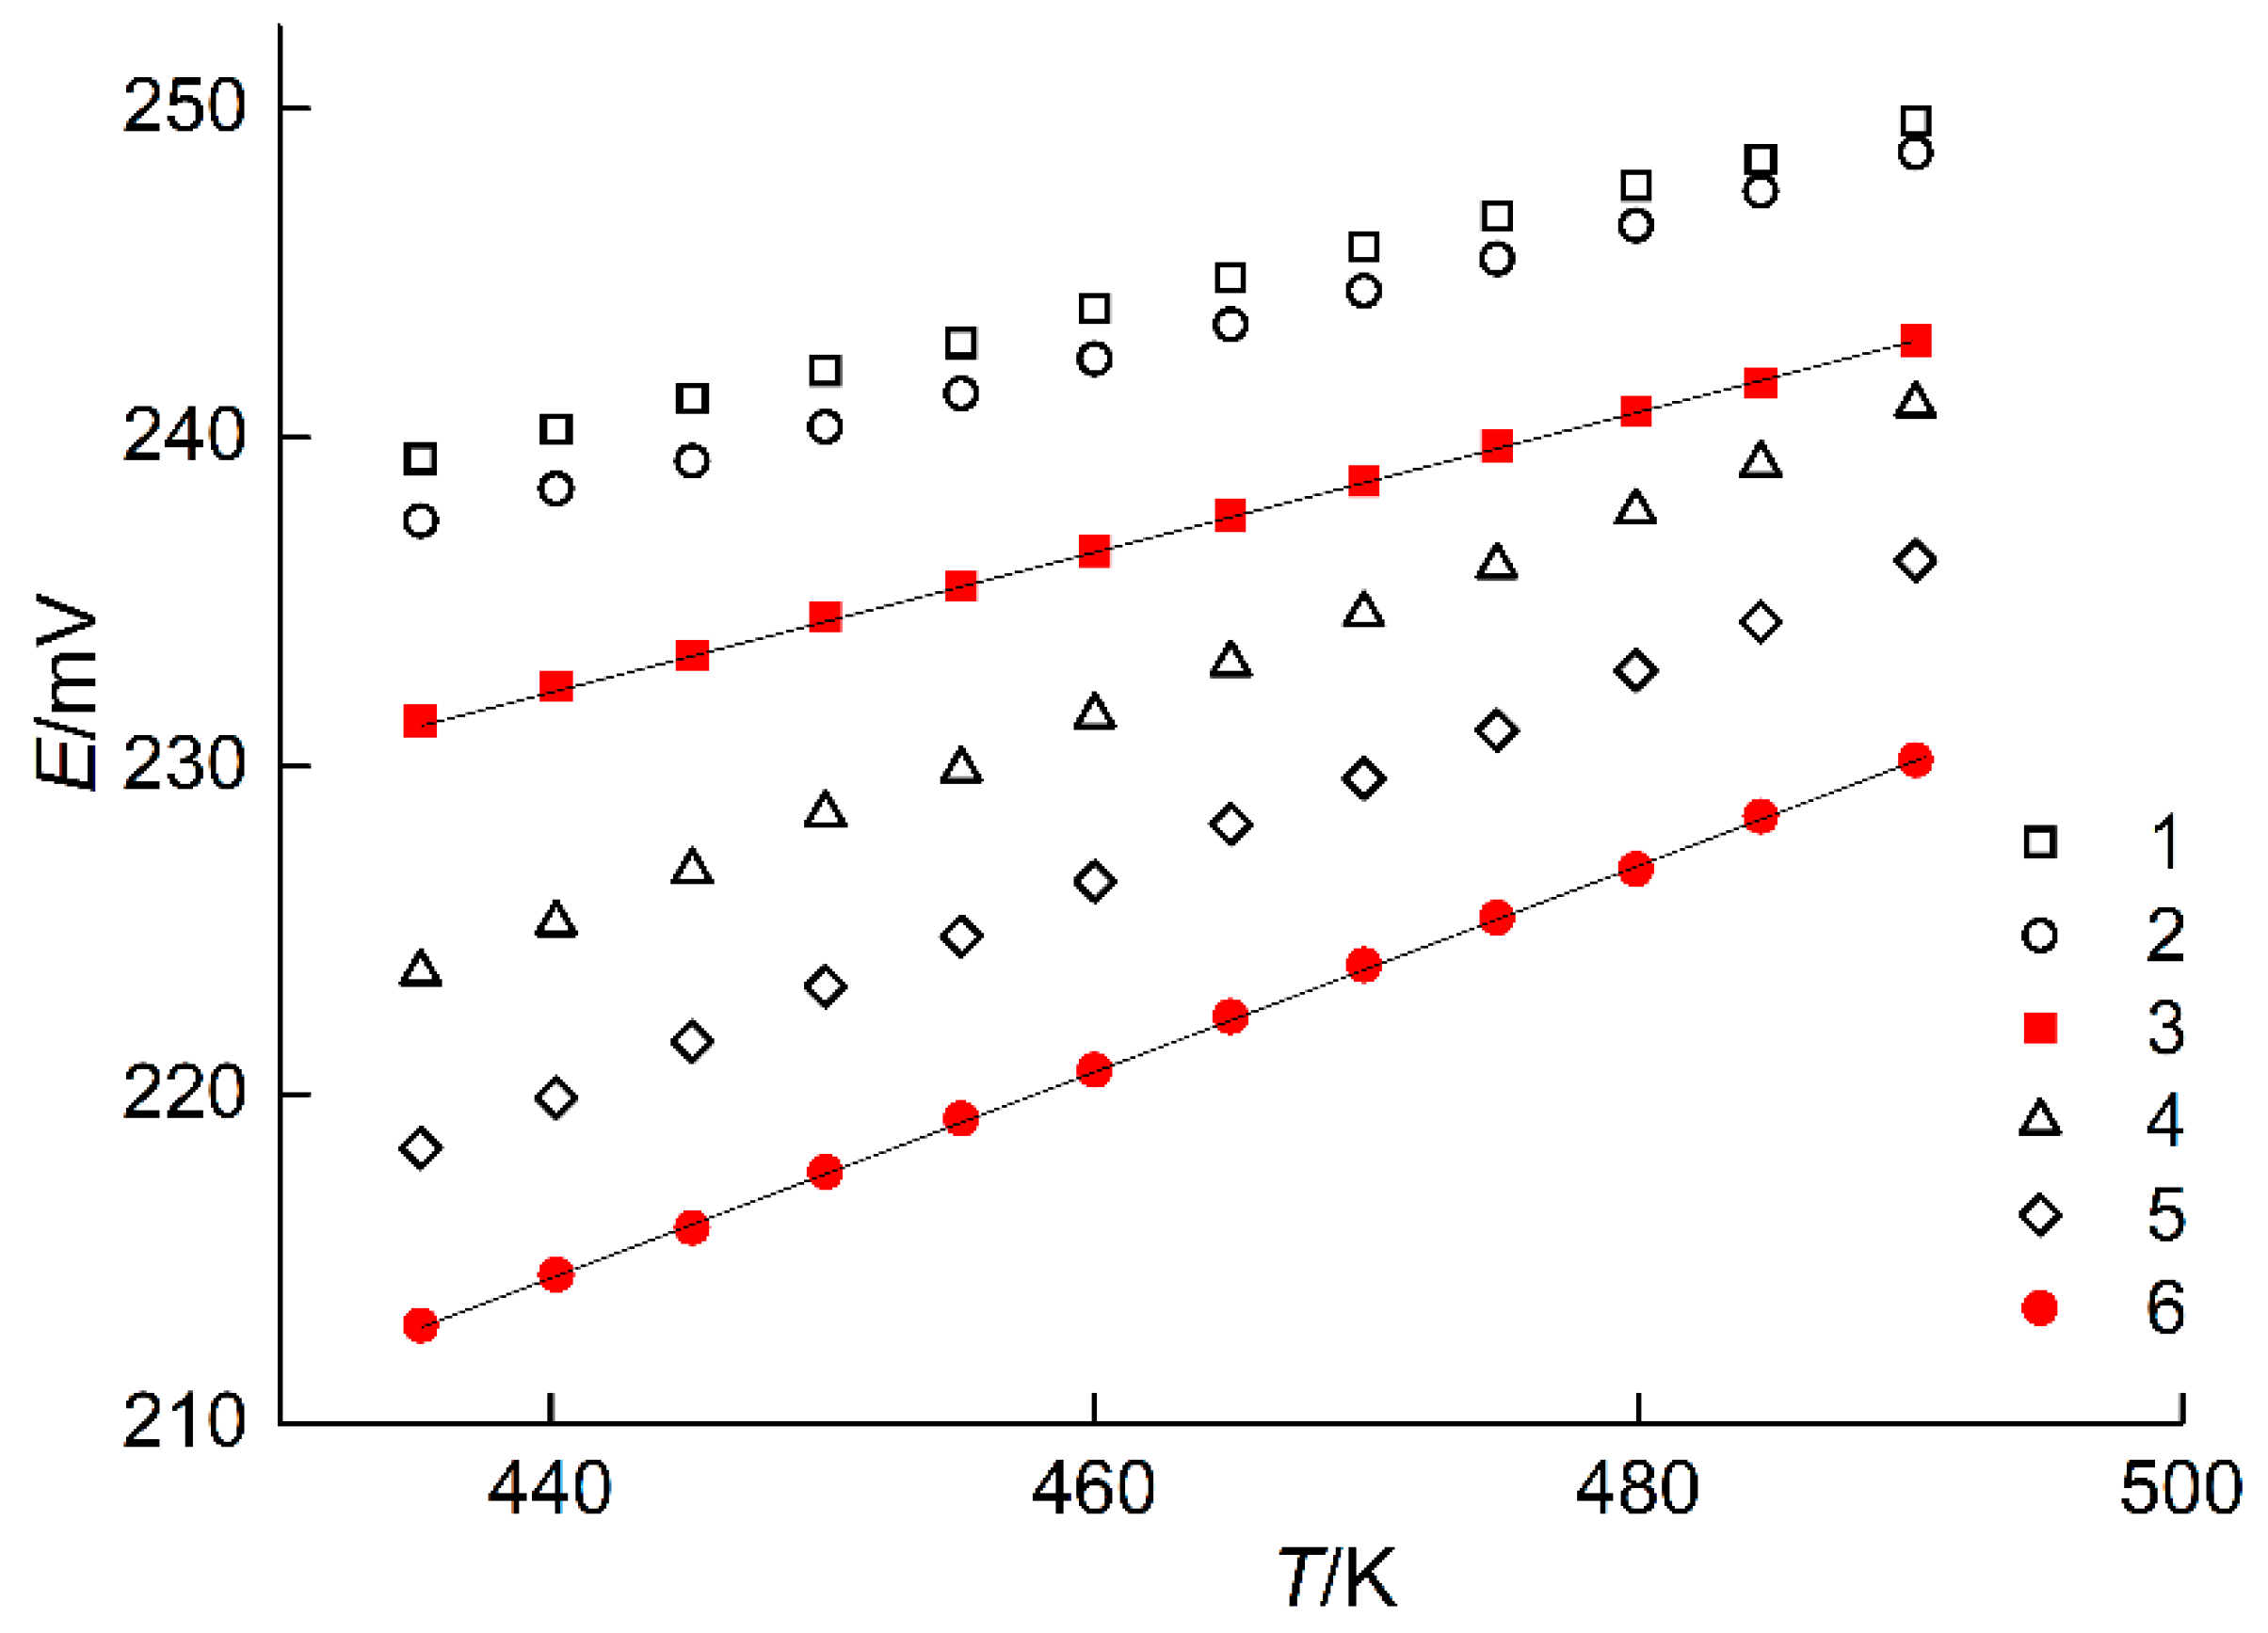
The measured EMF values of the ECCs at various temperatures are presented in Table 5 and plotted in Figure 6. These data were used to calculate the coefficients and dispersions of Equation (9) for the phase regions (IV) and (V). Results of calculations are listed in Table 6.
The thermodynamic quantities of the reactions (R3) and (R4) were calculated by combining the experimental EMF of each ECC and the Equations (10)–(12). The calculated results are listed in Table 7.
The corresponding reactions to determine Δ f G , Δ f H , and S for the Ag2FeGeTe4 in the phase regions (IV) and (V) can be written similar to Equations (16)–(18) for the AgFeTe2 compound with their appropriate stoichiometric numbers. Considering thermodynamic data of the pure elements [66], and compounds GeTe [66], Ag8GeTe6 [60], the standard Gibbs energies of formations of the Ag2FeGeTe4 in the phase regions (IV) and (V) were described as:
Δ f G Ag 2 FeGeTe 4 , ( I V ) / ( kJ · mol 1 ) =   ( 166.6 ± 2.6 ) ( 2.59 ± 0.04 ) × 10 3 T / K ,
Δ f G Ag 2 FeGeTe 4 , ( V ) / ( kJ · mol 1 ) =   ( 166.5 ± 2.5 ) ( 3.54 ± 0.05 ) × 10 3 T / K .
A summary of the calculation results with the reported literature data is shown in Table 8.
The Δ f G values of the Ag2FeGeTe4 were determined from the EMF measurements into two independent potential forming processes, the Ag2FeGeTe4 decomposition into Ag8GeTe6, AgFeTe2, and GeTe and in the phase region (IV), and the synthesis of Ag2FeGeTe4 from Ag8GeTe6, GeTe, and FeTe2 in the phase region (V). These processes include all compounds of the investigated concentration space Ag8GeTe6–GeTe–FeTe2–AgFeTe2–Ag8GeTe6. It follows from the data presented in Table 6 that the calculated values of Δ f G for Ag2FeGeTe4 in these phase regions converge within the experiment error of (the relative difference is less 1%). It validates:
(a)
phase compositions and divisions of the equilibrium concentration spaces of the Ag–Fe–Te system in the part Ag2Te–FeTe2–Fe1.12Te and the Fe–Ag–Te–Ge system in the part Ag8GeTe6– FeTe2–GeTe–AgFeTe2–Ag8GeTe6,
(b)
determined values of thermodynamic functions of the AgFeTe2 and Ag2FeGeTe4 compounds,
(c)
reliability of the thermodynamic data of GeTe, FeTe2, and Ag8GeTe6 in the literature, and
(d)
the narrow homogeneity region of the Ag2FeGeTe4.

4. Conclusions

The equilibrium concentration spaces division of the Fe–Ag–Te–Ge system in the parts Ag2Te–FeTe2–Fe1.12Te and Ag8GeTe6–GeTe–FeTe2–AgFeTe2–Ag8GeTe6 into 3- and 4-phase regions were established. The phase regions position relative to the composition of Ag were used to express the overall potential reactions. Synthesis of the equilibrium set of phases in solid-state, including the AgFeTe2, Ag2FeTe2, and Ag2FeGeTe4 compounds, was conducted in the positive electrodes of ECCs. Ag+ cations that shifted from the negative to positive electrode were serving as the nucleation centers for formation of stable compounds and catalysts for the synthesis of the equilibrium set of phases.
The linear relations of the EMF on T of the ECCs were utilized for the calculations of the standard Gibbs energies, entropies, and enthalpies of formations of the ternary and quaternary compounds. Calculations of thermodynamic properties of the quaternary compound were performed in two independent potential forming processes. The similarity of Δ f G values in the two potential forming processes confirm the division of the concentration space of the Fe–Ag–Te–Ge system and the composition of the phases in the positive electrodes within the ECCs were used to determine the thermodynamic quantities of the AgFeTe2, Ag2FeTe2, and Ag2FeGeTe4 for the first time. Furthermore, the reproducibility of the determined Δ f G validate the literature Gibbs energy data for GeTe, FeTe2, and Ag8GeTe6 compounds.
The observed results in this work promote the development of thermodynamic data for the ternary and quaternary compounds, and enable modeling of the more complex phase diagrams of the Ag–{Fe, Co, Ni}–{Ge, Sn}–{S, Se, Te} systems. These thermodynamic data including thermal stability ranges of the multicomponent tellurides assist the discovery of new thermoelectric materials with high values of ZT parameter, and other applications.

Author Contributions

Conceptualization, M.M., F.T. and O.R.; methodology, M.M., F.T., P.D. and O.R.; investigation, M.M. and P.D.; data curation, M.M., P.D., M.P. and N.Y.; writing—original draft preparation, M.M., F.T., P.D., M.P. and N.Y.; writing—review and editing, M.M., F.T., P.D., D.L., O.R. and L.H.; supervision, O.R., F.T., D.L. and L.H.; funding acquisition, O.R., P.D., F.T. and L.H. All authors have read and agreed to the published version of the manuscript.

Funding

This research was supported by the national projects of the Ministry of Education and Science of Ukraine: “Synthesis, physico-chemical and thermodynamic properties of nanosized and nanostructured materials for electrochemical systems” (No. 0120U102184). This work was partly supported by the Academy of Finland project (Decision number 311537), as part of the activities of the Johan Gadolin Process Chemistry Centre at Åbo Akademi University.

Institutional Review Board Statement

Not applicable.

Informed Consent Statement

Not applicable.

Data Availability Statement

Data is contained within the article.

Conflicts of Interest

The authors declare no conflict of interest.

References

  1. Lee, K.H.; Kim, H.-S.; Kim, M.; Roh, J.W.; Lim, J.-H.; Kim, W.J.; Kim, S.-I.; Lee, W. Isovalent Sulfur Substitution to Induce a Simultaneous Increase in the Effective Mass and Weighted Mobility of a p-type Bi-Sb-Te Alloy: An Approach to Enhance the Thermoelectric Performance Over a Wide Temperature Range. Acta Mater. 2021, 205, 116578. [Google Scholar] [CrossRef]
  2. Lv, S.; Qian, Z.; Hu, D.; Li, X.; He, W. A Comprehensive Review of Strategies and Approaches for Enhancing the Performance of Thermoelectric Module. Energies 2020, 13, 3142. [Google Scholar] [CrossRef]
  3. Zoui, M.A.; Bentouba, S.; Stocholm, J.G.; Bourouis, M. A Review on Thermoelectric Generators: Progress and Applications. Energies 2020, 13, 3606. [Google Scholar] [CrossRef]
  4. Ahluwalia, G.K. Data Storage Devices. In Applications of Chalcogenides: S, Se, and Te, 1st ed.; Ahluwalia, G.K., Ed.; Springer: Cham, Switzerland, 2017; pp. 323–370. [Google Scholar]
  5. Chen, M.-M.; Xue, H.-G.; Guo, S.-P. Multinary metal chalcogenides with tetrahedral structures for second-order nonlinear optical, photocatalytic, and photovoltaic applications. Coord. Chem. Rev. 2018, 368, 115–133. [Google Scholar] [CrossRef]
  6. Zeng, X.; Yan, C.; Ren, L.; Zhang, T.; Zhou, F.; Liang, X.; Wang, N.; Sun, R.; Xu, J.B.; Wong, C.P. Silver Telluride Nanowire Assembly for High-Performance Flexible Thermoelectric Film and Its Application in Self-Powered Temperature Sensor. Adv. Electron. Mater. 2019, 5, 1800612. [Google Scholar] [CrossRef]
  7. Hull, S.; Berastegui, P.; Grippa, A. Ag+ diffusion within the rock-salt structured superionic conductor Ag4Sn3S8. J. Phys. Condens. Matter. 2005, 17, 1067–1084. [Google Scholar] [CrossRef]
  8. Bailey, T.P.; Uher, C. Potential for superionic conductors in thermoelectric applications. Curr. Opin. Green Sustain. Chem. 2017, 4, 58–63. [Google Scholar] [CrossRef]
  9. Shi, Y.; Sturm, C.; Kleinke, H. Chalcogenides as thermoelectric materials. J. Solid State Chem. 2019, 270, 273–279. [Google Scholar] [CrossRef]
  10. Tesfaye, F.; Lindberg, D. Thermochemical properties of selected ternary phases in the Ag-Bi-S system. J. Mater. Sci. 2016, 51, 5750–5759. [Google Scholar] [CrossRef]
  11. Swartzendruber, L.J. The Ag−Fe (Silver-Iron) system. Bull. Alloy Phase Diagr. 1984, 5, 560–564. [Google Scholar] [CrossRef]
  12. Okamoto, H.; Tanner, L.E. The Fe-Te (Iron-Tellurium) system. Bull. Alloy Phase Diagr. 1990, 11, 371–376. [Google Scholar] [CrossRef]
  13. Rodriguez, E.E.; Zavalij, P.; Hsieh, P.-Y.; Green, M.A. Iodine as an Oxidant in the Topotactic Deintercalation of Interstitial Iron in Fe1+xTe. J. Am. Chem. Soc. 2010, 132, 10006–10008. [Google Scholar] [CrossRef]
  14. Wernick, J.H.; Wolfe, R. Semiconducting “Compound” AgFeTe2. J. Appl. Phys. 1961, 32, 749–774. [Google Scholar] [CrossRef]
  15. Manca, P.; Massazza, F. Note on the Constitution of the Semiconducting “Compound” AgFeTe2. J. Appl. Phys. 1962, 33, 1608–1609. [Google Scholar] [CrossRef]
  16. Manca, P.; Massazza, F. Reply to the Remark by E. L. Shtrum on the AgFeTe2 Semiconductor “Compound.” II. J. Appl. Phys. 1965, 36, 647–648. [Google Scholar] [CrossRef] [Green Version]
  17. Deneke, K. A Remark on the Semiconducting Compound “AgFeTe2”. J. Appl. Phys. 1965, 36, 653. [Google Scholar] [CrossRef]
  18. Shtrum, E.L. AgFeTe2 Semiconductor Compound: (A Remark on Papers by J. H. Wernick and R. Wolfe, and P. Manca and F. Massazza). J. Appl. Phys. 1964, 35, 252. [Google Scholar] [CrossRef]
  19. Zaslavskii, A.I.; Zhukova, T.B. The structure of AgFeTe2. J. Struct. Chem. 1965, 5, 222–224. [Google Scholar] [CrossRef]
  20. Aliev, S.A.; Gasanov, Z.S.; Mamedova, S.O. The phenomenon of a hysteresis in AgFeTe2 in phase transition region. Fizika 2004, 10, 25–29. [Google Scholar]
  21. Aliev, M.I.; Gasanov, Z.S.; Guseinov, F.Z. Physical properties of iron silver telluride (AgFeTe2) in the phase transition region. Izv. Akad. Nauk SSSR Neorg. Mater. 1974, 10, 1897–1898. [Google Scholar]
  22. Amulevicius, A.; Baltrunas, D. Moessbauer parameters and some physical properties of silver iron telluride (AgFeTe2) in the phase transition region. Liet. Fiz. Rink. 1978, 18, 243–250. [Google Scholar]
  23. Aliev, M.I.; Guseinov, F.Z.; Gasanov, Z.S.; Dzhafarov, Z.A. Thermal properties of AgMeX2 compounds (Me-iron, nickel, X-selenium, tellurium). Dokl. Akad. Nauk Azerbaidzhanskoi SSR 1978, 34, 15–19. [Google Scholar]
  24. Merwin, H.E.; Lombard, R.H. The system Cu-Fe-S. Econ. Geol. 1937, 32, 203–284. [Google Scholar] [CrossRef]
  25. Blachnik, R.; Stöter, U. The phase diagram AgI-ZnI2. Thermochim. Acta 1989, 145, 93–99. [Google Scholar] [CrossRef]
  26. Karapetyants, M.K. The Chemical Thermodynamics; Goskhimizdat: Moscow, Russia, 1953. (In Russian) [Google Scholar]
  27. O’Connell, J.P.; Haile, J.M. Thermodynamics: Fundamentals for Applications; Cambridge University Press: Cambridge, UK, 2005; pp. 310–365. [Google Scholar]
  28. Moroz, M.; Tesfaye, F.; Demchenko, P.; Prokhorenko, M.; Kogut, Y.; Pereviznyk, O.; Prokhorenko, S.; Reshetnyak, O. Solid-state electrochemical synthesis and thermodynamic properties of selected compounds in the Ag–Fe–Pb–Se system. Solid State Sci. 2020, 107, 106344. [Google Scholar] [CrossRef]
  29. Voronin, M.V.; Osadchii, E.G.; Brichkina, E.A. Thermochemical properties of silver tellurides including empressite (AgTe) and phase diagrams for Ag–Te and Ag–Te–O. Phys. Chem. Miner. 2017, 44, 639–653. [Google Scholar] [CrossRef]
  30. Moroz, M.V.; Demchenko, P.Y.; Prokhorenko, M.V.; Reshetnyak, O.V. Thermodynamic Properties of Saturated Solid Solutions of the Phases Ag2PbGeS4, Ag0.5Pb1.75GeS4 and Ag6.72Pb0.16Ge0.84S5.20 of the Ag-Pb-Ge-S System Determined by EMF Method. J. Phase Equilibria Diffus. 2017, 38, 426–433. [Google Scholar] [CrossRef]
  31. Abrikosov, N.K.; Stasova, M.M. Solid solutions based on bismuth and antimony tellurides and bismuth selenides. Izv. Akad. Nauk SSSR Neorg. Mater. 1985, 21, 2011–2015. [Google Scholar]
  32. Shelimova, L.E.; Karpinsky, O.G.; Kretova, M.A.; Avilov, E.S. Phase equilibria in the Ge-Bi-Te ternary system at 570–770 K temperature range. J. Alloys Compd. 1996, 243, 194–201. [Google Scholar] [CrossRef]
  33. Moroz, M.V.; Prokhorenko, M.V. Phase relations in PbSe-PbTe alloys of the Ag-Pb-Se-Te system studied by EMF measurements. Inorg. Mater. 2015, 51, 302–306. [Google Scholar] [CrossRef]
  34. Moroz, M.V.; Prokhorenko, M.V. Determination of thermodynamic properties of saturated solid solutions of the Ag–Ge–Se system using EMF technique. Russ. J. Electrochem. 2015, 51, 697–702. [Google Scholar] [CrossRef]
  35. Prokhorenko, M.V.; Moroz, M.V.; Demchenko, P.Y. Measuring the thermodynamic properties of saturated solid solutions in the Ag2Te-Bi-Bi2Te3 system by the electromotive force method. Russ. J. Phys. Chem. A 2015, 89, 1330–1334. [Google Scholar] [CrossRef]
  36. Quintero, M.; Barreto, A.; Grima, P.; Tovar, R.; Quintero, E.; Porras, G.S.; Ruiz, J.; Woolley, J.C.; Lamarche, G.; Lamarche, A.-M. Crystallographic properties of I2–Fe–IV–VI4 magnetic semiconductor compounds. Mater. Res. Bull. 1999, 34, 2263–2270. [Google Scholar] [CrossRef]
  37. Kroupa, A. Modelling of phase diagrams and thermodynamic properties using Calphad method—Development of thermodynamic databases. Comput. Mater. Sci. 2013, 66, 3–13. [Google Scholar] [CrossRef]
  38. Jung, I.-H.; Van Ende, M.-A. Computational Thermodynamic Calculations: FactSage from CALPHAD Thermodynamic Database to Virtual Process Simulation. Metall. Mater. Trans. B 2020, 51, 1851–1874. [Google Scholar] [CrossRef]
  39. Diffractom. Stoe WinXPOW Version 303; Stoe Cie GmbH: Darmstadt, Germany, 2010. [Google Scholar]
  40. Kraus, W.; Nolze, G. POWDER CELL—Program Represent. Manip. Cryst. Struct. Calcul. Result. X-Ray Powder Patterns 1996, 29, 301–303. [Google Scholar]
  41. Villars, P.; Cenzual, K. Pearson’s Crystal Data: Crystal Structure Database for Inorganic Compounds, Release 2014/15; ASM International: Materials Park, OH, USA, 2014. [Google Scholar]
  42. Robinel, E.; Carette, B.; Ribes, M. Silver sulfide based glasses (I): Glass forming regions, structure and ionic conduction of glasses in GeS2–Ag2S and GeS2–Ag2S–AgI systems. J. Non-Cryst. Solids 1983, 57, 49–58. [Google Scholar] [CrossRef]
  43. Moroz, M.V.; Demchenko, P.Y.; Mykolaychuk, O.G.; Akselrud, L.G.; Gladyshevskii, R.E. Synthesis and electrical conductivity of crystalline and glassy alloys in the Ag3GeS3Br-GeS2 system. Inorg. Mater. 2013, 49, 867–871. [Google Scholar] [CrossRef]
  44. Moroz, M.; Tesfaye, F.; Demchenko, P.; Prokhorenko, M.; Lindberg, D.; Reshetnyak, O.; Hupa, L. Determination of the thermodynamic properties of the Ag2CdSn3S8 and Ag2CdSnS4 phases in the Ag–Cd–Sn–S system by the solid-state electrochemical cell method. J. Chem. Thermodyn. 2018, 118, 255–262. [Google Scholar] [CrossRef]
  45. Santoso, I.; Taskinen, P. Thermodynamic properties of Ag–Au–Pd alloys measured by a solid-state EMF method. J. Mater. Sci. 2018, 58, 9232–9242. [Google Scholar] [CrossRef]
  46. Jendrzejczyk-Handzlik, D.; Fitzner, K. Thermodynamic stability of copper gallates determined from the E.M.F. method. J. Solid State Chem. 2015, 232, 207–212. [Google Scholar] [CrossRef]
  47. Babanly, M.B.; Mashadiyeva, L.F.; Babanly, D.M.; Imamaliyeva, S.Z.; Tagiev, D.B.; Yusibov, Y.A. Some Issues of Complex Studies of Phase Equilibria and Thermodynamic Properties in Ternary Chalcogenide Systems Involving Emf Measurements (Review). Russ. J. Inorg. Chem. 2019, 64, 1649–1671. [Google Scholar] [CrossRef]
  48. Imamaliyeva, S.Z.; Musayeva, S.S.; Babanly, D.M.; Jafarov, Y.I.; Taghiyev, D.B.; Babanly, M.B. Determination of the thermodynamic functions of bismuth chalcoiodides by EMF method with morpholinium formate as electrolyte. Thermochim. Acta 2019, 679, 178319. [Google Scholar] [CrossRef]
  49. Mukherjee, S.; Dash, S. Thermodynamic study of NaLaF4 in NaF-LaF3 system using solid state electrochemical cell method. J. Solid State Chem. 2019, 277, 61–67. [Google Scholar] [CrossRef]
  50. Moroz, M.V.; Demchenko, P.Y.; Prokhorenko, S.V.; Moroz, V.M. Physical properties of glasses in the Ag2GeS3-AgBr system. Phys. Solid State. 2013, 55, 1613–1618. [Google Scholar] [CrossRef]
  51. Moroz, M.V.; Prokhorenko, M.V.; Prokhorenko, S.V. Determination of thermodynamic properties of Ag3SBr superionic phase using EMF technique. Russ. J. Electrochem. 2015, 51, 886–889. [Google Scholar] [CrossRef]
  52. Moroz, M.V.; Prokhorenko, M.V.; Demchenko, P.Y.; Reshetnyak, O.V. Thermodynamic properties of saturated solid solutions of Ag7SnSe5Br and Ag8SnSe6 compounds in the Ag–Sn–Se–Br system measured by the EMF method. J. Chem. Thermodyn. 2017, 106, 228–231. [Google Scholar] [CrossRef]
  53. Aspiala, M.; Tesfaye, F.; Taskinen, P. Electrochemical study on the Ag–Sb system by advanced experimental method. Electrochim. Acta 2015, 173, 649–655. [Google Scholar] [CrossRef]
  54. Moroz, M.V.; Prokhorenko, M.V.; Rudyk, B.P. Thermodynamic properties of phases of the Ag-Ge-Te system. Russ. J. Electrochem. 2014, 50, 1177–1181. [Google Scholar] [CrossRef]
  55. Moroz, M.V.; Prokhorenko, M.V. Thermodynamic properties of the intermediate phases of the Ag-Sb-Se system. Russ. J. Phys. Chem. A 2014, 88, 742–746. [Google Scholar] [CrossRef]
  56. Moroz, M.V.; Prokhorenko, M.V.; Reshetnyak, O.V.; Demchenko, P.Y. Electrochemical determination of thermodynamic properties of saturated solid solutions of Hg2GeSe3, Hg2GeSe4, Ag2Hg3GeSe6, and Ag1.4Hg1.3GeSe6 compounds in the Ag–Hg–Ge–Se system. J. Solid State Electrochem. 2017, 21, 833–837. [Google Scholar] [CrossRef]
  57. Mashadieva, L.F.; Kevser, J.O.; Aliev, I.I.; Yusibov, Y.A.; Tagiyev, D.B.; Aliev, Z.S.; Babanly, M.B. Phase equilibria in the Ag2Te-SnTe-Sb2Te3 system and thermodynamic properties of the (2SnTe)1−x(AgSbTe2)x solid solution. J. Phase Equilibria Diffus. 2017, 38, 603–614. [Google Scholar] [CrossRef]
  58. Tengner, S. Über Diselenide und Ditelluride von Eisen, Kobalt und Nickel. Z. Für Anorg. Allg. Chem. 1938, 239, 126–132. [Google Scholar] [CrossRef]
  59. Goryunova, N.A. The Chemistry of Diamond-Like Semiconductors; Chapman and Hall: London, UK, 1965. [Google Scholar]
  60. Babanly, M.; Yusibov, Y.; Babanly, N. The EMF method with solid-state electrolyte in the thermodynamic investigation of ternary copper and silver chalcogenides. In Electromotive Force and Measurement in Several Systems; Kara, S., Ed.; InTech: London, UK, 2011; pp. 57–78. [Google Scholar]
  61. Gordon, A.J.; Ford, R.A. The Chemist’s Companion: A Handbook of Practical Data, Techniques, and References; Wiley: New York, NY, USA, 1972. [Google Scholar]
  62. Morachevskii, A.G.; Voronin, G.F.; Geyderikh, V.A.; Kutsenok, I.B. Electrochemical Research Methods in the Thermodynamics of Metallic Systems; Akademkniga: Moscow, Russia, 2003. (In Russian) [Google Scholar]
  63. Gravetter, F.J.; Wallnau, L.B. Statistics for the Behavioral Sciences, 10th ed.; Cengage Learning: Victoria, Australia; Belmont, CA, USA, 2017; ISBN 978-1-305-50491-2. [Google Scholar]
  64. Babanly, N.B.; Orujlu, E.N.; Imamaliyeva, S.Z.; Yusibov, Y.A.; Babanly, M.B. Thermodynamic investigation of silver-thallium tellurides by EMF method with solid electrolyte Ag4RbI5. J. Chem. Thermodyn. 2019, 128, 78–86. [Google Scholar] [CrossRef]
  65. Voronin, M.V.; Osadchii, E.G. Thermodynamic properties of silver and bismuth sulfosalt minerals, pavonite (AgBi3S5) and matildite (AgBiS2) and implications for ore deposits. Econ. Geol. 2013, 108, 1203–1210. [Google Scholar] [CrossRef] [Green Version]
  66. Barin, I. Thermochemical Data of Pure Substance; VCH: Weinheim, Germany, 1995. [Google Scholar]
  67. Ferhat, A.; Ollitrault-Fichet, R.; Rivet, J. Description du système ternaire Ag-Ge-Te. J. Alloys Compd. 1991, 177, 337–355. [Google Scholar] [CrossRef]
Figure 1. Comparison of the XRD patterns of the sample ‘AgFeTe2′ with those theoretical patterns of the compounds.
Energies 14 01314 g001
Figure 2. Equilibrium phase relations in the Ag–Fe–Te system below 500 K in the Ag2Te–FeTe2–Fe1.12Te (I) part. The dashed and solid tie lines indicate 2-phase equilibria and the red dots indicate phase compositions of the positive electrodes of the ECCs. For some phase regions, EMF values in mV at 460 K are given.
Energies 14 01314 g002
Figure 3. Dependences E vs. T of the ECCs constituting positive electrodes of phase assemblages: FeTe2–Fe1.12Te–AgFeTe2 (1), Ag2Te–FeTe2–AgFeTe2 (2), FeTe2–AgFeTe2 (3), Ag2FeTe2–Fe1.12Te–AgFeTe2 (4), Ag2Te–Ag2FeTe2–AgFeTe2 (5), and AgFeTe2–Ag2FeTe2 (6).
Energies 14 01314 g003
Figure 4. XRD patterns of the sample ‘Ag2FeGeTe4’ as compared with those theoretical patterns of the compounds.
Energies 14 01314 g004
Figure 5. The equilibrium phases in the Fe–Ag–Te–Ge system in the Ag8GeTe6– FeTe2–GeTe–AgFeTe2–Ag8GeTe6 part, below 550 K. The dashed and solid tie lines show the 2-phase equilibria, the red closed circle show compositions of positive electrodes of ECCs, and the open circle show compounds.
Energies 14 01314 g005
Figure 6. EMF versus temperature obtained with the ECCs incorporating PE in the phase regions (IV)–red open circles and (V)–closed square.
Energies 14 01314 g006
Table 1. A summary of the measured temperatures and EMF values of the ECCs in different phase regions of the Ag–Te–Fe system.
T(K)Phase Region FeTe2–AgFeTe2Phase Region AgFeTe2–Ag2FeTe2Phase Region FeTe2–Fe1.12Te–AgFeTe2Phase Region Ag2Te–FeTe2–AgFeTe2Phase Region Ag2FeTe2–Fe1.12Te–AgFeTe2Phase Region Ag2Te–Ag2FeTe2–AgFeTe2
E(mV)E(mV)E(mV)E(mV)E(mV)E(mV)
435.2231.38212.98239.35237.45223.71218.37
440.2232.43214.53240.24238.43225.22219.90
445.2233.36215.96241.17239.27226.80221.62
450.1234.52217.65242.02240.31228.54223.29
455.1235.47219.27242.87241.33229.88224.82
460.0236.54220.75243.91242.38231.53226.48
465.0237.62222.37244.85243.42233.12228.23
469.9238.66223.94245.78244.45234.62229.62
474.8239.74225.38246.72245.43236.09231.09
479.9240.78226.86247.65246.45237.75232.90
484.5241.65228.47248.44247.48239.18234.39
490.2242.94230.19249.62248.65240.99236.25
Table 2. EMF vs. temperature relations for the type (A) ECCs in the (II) and (III) phase regions of the Fe–Ag–Ge–Te system, in the temperature range between 435 and 490 K. The coefficients a and b were obtained through the linear least squares analysis of the EMF vs. T measuremnt data, n is the number of experimental points, k S t is Student’s coefficient with the level of confidence 95%.
Phase Region E = a + b T ± k S t ( u E 2 n + u b 2 ( T T ¯ ) 2 )
(II) E ( II ) = 139.72 + 210.52 × 10 3 T ± 2.179 ( 2.65 × 10 3 12 + 7.53 × 10 7 ( T 462.51 ) 2 )
(III) E ( III ) = 76.43 + 313.73 × 10 3 T ± 2.179 ( 5.44 × 10 3 12 + 1.54 × 10 6 ( T 462.51 ) 2 )
Table 3. Standard thermodynamic quantities of the reactions (R1) and (R2) in the ECCs at 298 K.
Reaction Δ r G Δ r H Δ r S
kJ·mol−1J·(mol·K)−1
(R1)19.53 ± 0.0313.48 ± 0.0820.31 ± 0.18
(R2)16.39 ± 0.047.37 ± 0.1230.27 ± 0.26
Table 4. A summary of the standard thermodynamic quantities of selected phases in the Ag–Fe–Te system at 298 K.
Phases Δ f G Δ f H S [Ref.]
kJ·mol−1J·(mol·K)−1
Ag0042.677[66]
Fe0027.280[66]
FeTe264.59972.383100.165[66]
AgFeTe284.13 ± 1.0385.86 ± 1.08163.15 ± 1.19This work
Ag2FeTe2100.53 ± 1.0793.23 ± 1.21236.10 ± 1.46This work
Table 5. A summary of the measured temperatures and EMF values of the ECCs in different phase regions of the Fe–Te–Ag system.
T(K)E[Phase Region (IV)] (mV) E[Phase Region (V] (mV)
482.2243.51248.45
484.7244.11248.91
487.1244.71249.29
489.6245.24249.72
492.1245.74250.20
494.5246.47250.72
497.0246.99251.01
499.4247.58251.59
501.9248.31251.88
504.3248.92252.41
506.8249.51252.75
509.2250.14253.12
511.7250.72253.65
514.1251.47254.05
516.6252.09254.38
519.0252.81254.86
Table 6. EMF vs. temperature relations for the type (A) ECCs in the (IV) and (V) phase regions of the Fe–Ag–Te–Ge system, in the temperature range between 482 and 519 K. The coefficients a and b were determined through linear least squares analysis of the measurements, n is the number of successful experimental points, k S t is Student’s coefficient with a level of confidence of 95%.
Phase Region E = a + b T ± k S t ( u E 2 n + u b 2 ( T T ¯ ) 2 )
(IV) E ( IV ) = 122.15 + 251.42 × 10 3 T ± 2.120 ( 9.41 × 10 3 16 + 4.60 × 10 6 ( T 500.64 ) 2 )
(V) E ( V ) = 164.64 + 173.88 × 10 3 T ± 2.120 ( 3.71 × 10 3 16 + 1.81 × 10 6 ( T 500.64 ) 2 )
Table 7. Standard thermodynamic quantities of reactions (R3) and (R4) in the ECCs.
Reaction Δ r G Δ r H Δ r S
kJ·mol−1J·(mol·K)−1
(R3)57.05 ± 0.2735.35 ± 0.6672.77 ± 1.32
(R4)41.77 ± 0.1131.77 ± 0.2833.55 ± 0.55
Table 8. The Standard thermodynamic quantities of the selected elements and compounds in the Ag–Fe–Ge–Te system at 298 K.
Phases Δ f G Δ f H S [Ref.]
kJ·mol−1J·(mol·K)−1
Ge0031.087[66]
Te0049.497[66]
GeTe51.32848.53489.956[66]
Ag8GeTe6268.0 ± 1.0245.0 ± 7.0746.6 ± 17.1[60]
Ag2FeGeTe4 a167.4 ± 2.3166.6 ± 2.6344.3 ± 4.9This work
Ag2FeGeTe4 b167.6 ± 2.2166.5 ± 2.5345.2 ± 4.5This work
a phase region (IV). b phase region (V).
Publisher’s Note: MDPI stays neutral with regard to jurisdictional claims in published maps and institutional affiliations.

