
Artificial Neural Networks in Modeling of Dewaterability of Sewage Sludge


Faculty of Infrastructure and Environment, Częstochowa University of Technology, Dabrowskiego 69, 42-201 Czestochowa, Poland
*
Author to whom correspondence should be addressed.
Energies 2021, 14(6), 1552; https://doi.org/10.3390/en14061552
Submission received: 20 January 2021
/
Revised: 5 March 2021
/
Accepted: 8 March 2021
/
Published: 11 March 2021
(This article belongs to the Special Issue Wastewater Treatment and Biogas Production)
Abstract
:Mechanical dewatering is a key process in the management of sewage sludge. However, the drainage efficiency depends on a number of factors, from the type and dose of the conditioning agent to the parameters of the drainage device. The selection of appropriate methods and parameters of conditioning and dewatering of sewage sludge is the task of laboratory work. This work can be accelerated through the use of artificial neural network (ANNs). The paper discusses the possibilities of using ANNs in predicting the dewatering efficiency of physically conditioned sludge. The input variables were only four parameters characterizing the conditioning methods and the dewatering method by centrifugation. These were the dose of the sludge skeleton builders (cement, gypsum, fly ash, and liquid glass), sonication parameters (sonication amplitude and time), and relative centrifugal force. Dewatering efficiency parameters such as sludge hydration and separation factor were output variables. Due to the nature of the research problem, two nonlinear networks were selected: a multilayer perceptron and a radial neural network. Based on the results of the prediction of artificial neural networks, it was found that these networks can be used to forecast the effectiveness of municipal sludge dewatering. The prediction error did not exceed 1.0% of the real value. ANN can therefore be useful in optimizing the dewatering process. In the case of the conducted research, it was the optimization of the sludge dewatering efficiency as a function of the type and parameters of conditioning factors. Therefore, it is possible to predict the dewatering efficiency of sludge that has not been tested in the laboratory, for example, with the use of other doses of physical conditioner. However, the condition for correct prediction and optimization was the use of a large dataset in the neural network training process.
1. Introduction
Chemical substances such as aluminum sulfate, iron (III) chloride, iron (II) sulfate, and polyelectrolytes are usually added to sludge in order to improve the dewaterability. Currently, the most common method of pretreating sludge before the dewatering process is adding polyelectrolyte [1]. However, polyelectrolytes are expensive conditioning agents and may also cause secondary pollution of the environment. Therefore, a number of alternative methods (chemical, physical, and biological) for sewage sludge conditioning are proposed in order to improve the dewatering efficiency [2]. Physical conditioning methods include the addition of skeleton builders of sludge floc such as gypsum and ash [3] and also sludge sonication [4].
The addition of skeleton builders to sludge generally reduces the compressibility of the sludge and ultimately improves filterability [2,3]. However, to improve the dewatering, large doses of these conditioners are required, which causes the mineralization of the sludge. Zhao et al. used the addition of gypsum in the amount of 60% of the total solids of conditioned sludge, which resulted in a 4.3% reduction in the sludge hydration after the dewatering process [5]. Chen et al. used coal dust modified by sulfuric acid to improve sludge dewatering. The use of the most optimum dose of coal dust, amounting to 274% of sludge total solids, resulted in a reduction of final hydration of filter cake to 56.52% [6]. Dewatering ultrasonically conditioned sludge can have both positive and negative effects on the efficiency of solid separation [7]. Na et al. [8] noticed that using ultrasounds for pretreatment of sludge before dewatering improved the dewaterability with the increase of the ultrasound energy. The observed improvement in drainage could result from a reduction in the size of flocs and an increase in the concentration of extracellular polymeric substances [9]. The ultrasound energy dose higher than 4400 kJ/kg of dry mass has a negative impact on the dewatering process. In the studies of Chu et al., it was confirmed that ultrasonic conditioning requires a low power density and a short exposure time [10].
In the sludge conditioning process, it is possible to use conditioners independently, as well as dual or multiconditioning, including the use of various physical, chemical, and biological methods. The use of conditioners is not the only variable that determines the effectiveness of sludge dewatering. The process is also important; the use of filtration or centrifugation must be correlated with the method of conditioning. In the case of sludge dewatering by centrifugation, the key factor is the rotational speed (multiplication of gravity), at which the water content in the sludge reaches the minimum value [11].
The effectiveness of sludge conditioning and dewatering depends on the conditioning methods, parameters of these methods, and physical and chemical properties of the sludge, as well as the settings of the dewatering device. Usually, it is a group of several parameters that determine the susceptibility of sludge to dewatering. The nature of their relationship is usually the subject of research, research that generally aims to increase drainage efficiency. This requires multiple repetitions and careful analysis, which could be simplified by the use of artificial neural networks (ANNs).
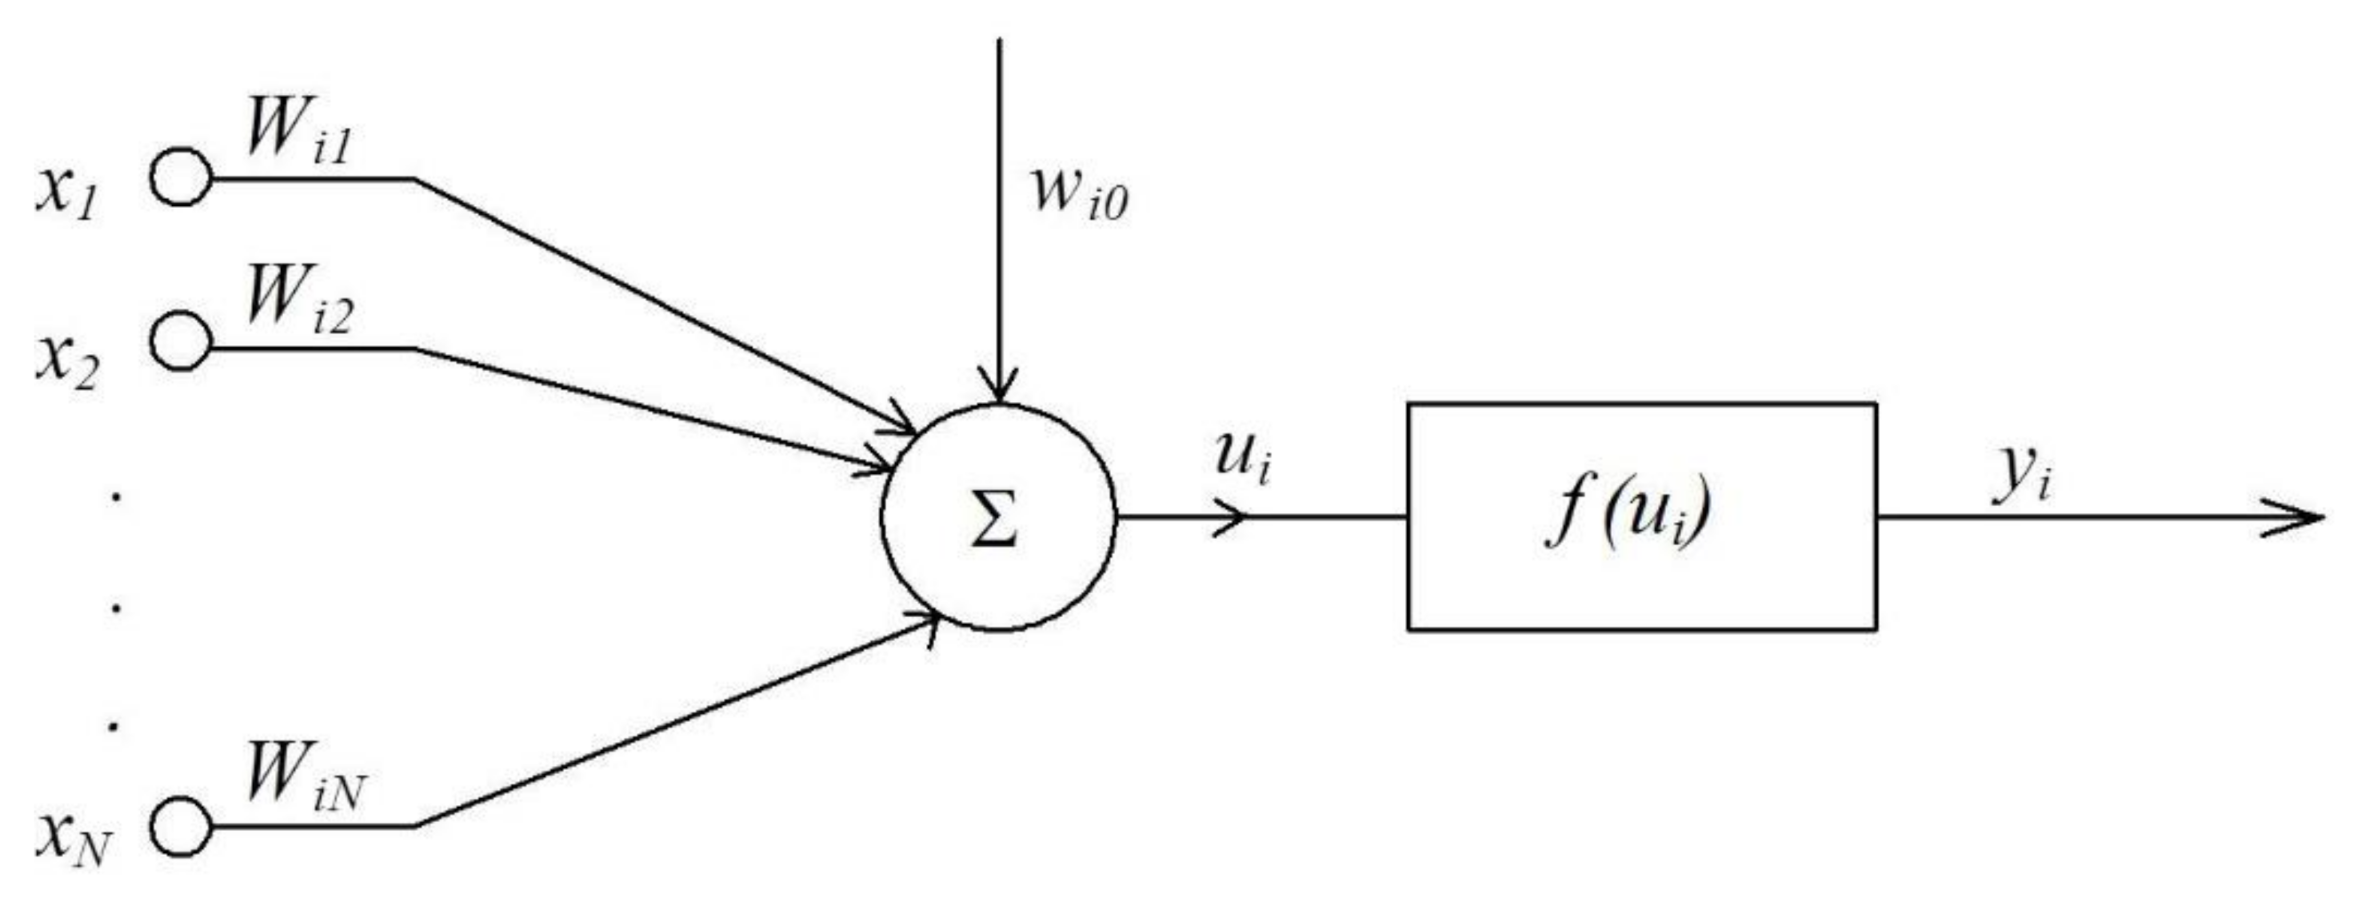
Artificial neural networks (ANNs) are typically used in technical applications which enable tackling the issues of recognition. They are also used in the classification, prediction, and analysis of images and their processing. Artificial neural networks (ANNs) can be useful in many applications because they act like artificial intelligence [12,13,14]. The model of neural network emerged with McCulloch’s and Pitts’ seminal work [15], which was the first to describe a neuron in mathematical terms and associate it with data processing. One of the key elements of the model is summing up the input signals with an appropriate weight, and subjecting the result to the nonlinear activation function. As a result, the neuron’s output signal yi is defined as:
where xj (j = 1, 2, …, n) represents the input signals and Wij the appropriate weight coefficients, also known as synaptic weights or weights for short. At a positive value, the weight transmits an excitatory signal, while at a negative value, the transmitted signal is inhibitory. The activation function f may take different forms; in McCulloch–Pitts’ original model, it is a unit step function [12,15]. The diagram of McCulloch–Pitts’ neuron is shown in Figure 1.
The function consists of a summation element, which receives the input signals x1, x2, … xN, forming the input vector x = [x1, x2, …, xN]T, multiplied by the assigned weights Wi1, Wi2, …, WiN, forming the weight factor of the ith neuron Wi = [Wi1, Wi2, …, WiN]T, and the value Wi0, known as the threshold. The input signal of the summation function is marked as ui, whereby:
The signal is transmitted to the block performing the nonlinear activation function f(ui), and thus the output signal yi is obtained.
The neural network works by determining the vector of output signals on the basis of the vector of input signals. This is done by calculating for each subsequent layer, starting from the first, the vectors of input signals of the linear part of the neuron; next, on the basis of the input vectors, the vectors of output signals of the nonlinear part of the neuron are calculated, becoming the input signal to the next layer [12,13].
Neural networks find application in the analysis and modeling of various signals and information, including in the field of chemistry, materials, engineering [16], for example, in catalysis [17], for predicting energy absorption capability of thermoplastic commingled composites [18], steel structures [19], or prediction of end milling process parameters [20]. A number of studies are available on modeling in the discipline of environmental engineering, such as biological wastewater treatment processes [21,22,23,24], compost maturity [25], or for water quality prediction [26]. Artificial neural networks are used in solving not only technological but also technical problems. Kulkarni et al. used ANN for the designing of overall conductance of a hot water storage tank in a solar water heating system [27]. Artificial neural networks can be used to assist in the design of industrial reactors in microalgal biofuel production [28] or in optimizing the irrigation process [29]. In most studies, one of the main goals is to determine the number and type of input variables that enable the artificial neural network to correctly predict the selected output variable.
One of the key benefits of neural networks as forecasting tools is the fact that through the learning process, the network can acquire the ability to predict the output signals solely on the basis of observation of the so-called learning series (i.e., a specified number of sequences of input and output signals serving as historical empirical data). Overall, the aim of this study was to investigate the usefulness of artificial neural networks in the technology of conditioning and dewatering of sewage sludge. The developed artificial neural networks were used to predict the dewatering efficiency, including final hydration and the separation factor of the dewatered sludge by centrifugation. The main research question was whether artificial neural networks are capable of predicting drainage efficiency, considering only a few inputs characterizing the conditioning process.
2. Materials and Methods
2.1. Substrate
The sludge samples were collected from the municipal sewage treatment plant located in the Silesian province (Poland). The sewage treatment plant functioning in a UCT technological system operates at a wastewater inflow of 45,000 m3/d. The studied digested sludge was taken from the heat exchanger installation. Two samples of sludge were collected for testing. The total solids (TS) and the volatile solids (VS) of the sludge from the first collection were respectively 23.9 g/L and 40.1% TS. The sludge from the second collection was characterized by TS = 22.6 g/L and VS = 46.4% TS.
2.2. Sludge Conditioning
For physical conditioning, substances that are considered to be the skeleton builders of the sludge flocs were used. Portland cement (C, commercial product), gypsum (G, commercial product), and fly ash (A, coal-fired power plant) were used. The following doses of skeleton builders were used in the research: 0.25, 0.5, and 0.75 g/L. The selection of cement, gypsum, and fly ash doses was made on the basis of the information contained in the literature [2,3,4,5,6,7]. Initial, demonstrative tests showed that at a dose of only 1% of the total solids of sludge, changes in the effectiveness of sludge dewatering occurred. Finally, the doses of the skeleton builders were set at 1, 2, and 3% of the total solids of the tested sludge. Sodium liquid glass (LG, commercial product) was used as an alternative for conditioning the sludge with a chemical method. Due to the properties of liquid glass as a binder of solids, it was decided to include this substance in the research. The LG doses were 0.25, 0.5, 0.75 g/L of sludge.
2.3. Sludge Conditioning by Ultrasonic Disintegration
Three types of ultrasonic disintegrators were used to sonicate sewage sludge: Hielscher UP 400 S (Germany), Sonics VCX 134 (Newtown, Connecticut, USA) and Sonics VC 750 (Newtown, Connecticut, USA). The parameters of the disintegrators and sludge sonication process are provided in Table 1. All sonication was performed on 100 mL sludge samples.
2.4. Sludge Dewatering/Centrifugation
The sludge samples were centrifuged (dewatered) on centrifuge Eppendorf 5810 (Germany). For the study of the impact of the changes of g-force of the centrifuge on the sewage sludge dewatering efficiency, three values of relative centrifugal force (rcf) were specified for the centrifugation process: 4530, 6040, and 7550. The sludge samples (100 mL each) were conditioned and centrifuged at assumed rcf values. The selection of the rcf values was based on overload of centrifuges operating in the municipal wastewater treatment plant.
2.5. Analysis
Total solids (TS) and volatile solids (VS) of tested sludge were measured by means of standard methods of water and wastewater testing [30]. After the centrifugation process, TS was determined in the supernatant (TSSUP) and the concentrated sludge (TSSLU). In order to determine the separation efficiency (sludge solids-supernatant), the separation factor (SF) was determined according to the formula, (Equation (3)):
The percent water content of the sludge after centrifugation-sludge hydration (SH) was calculated according to the formula, (Equation (4)):
SF = ((TS − TSSUP)/TS) × 100%
SH = (1000 − TSSLU)/100%
2.6. Artificial Neural Networks (ANNs)
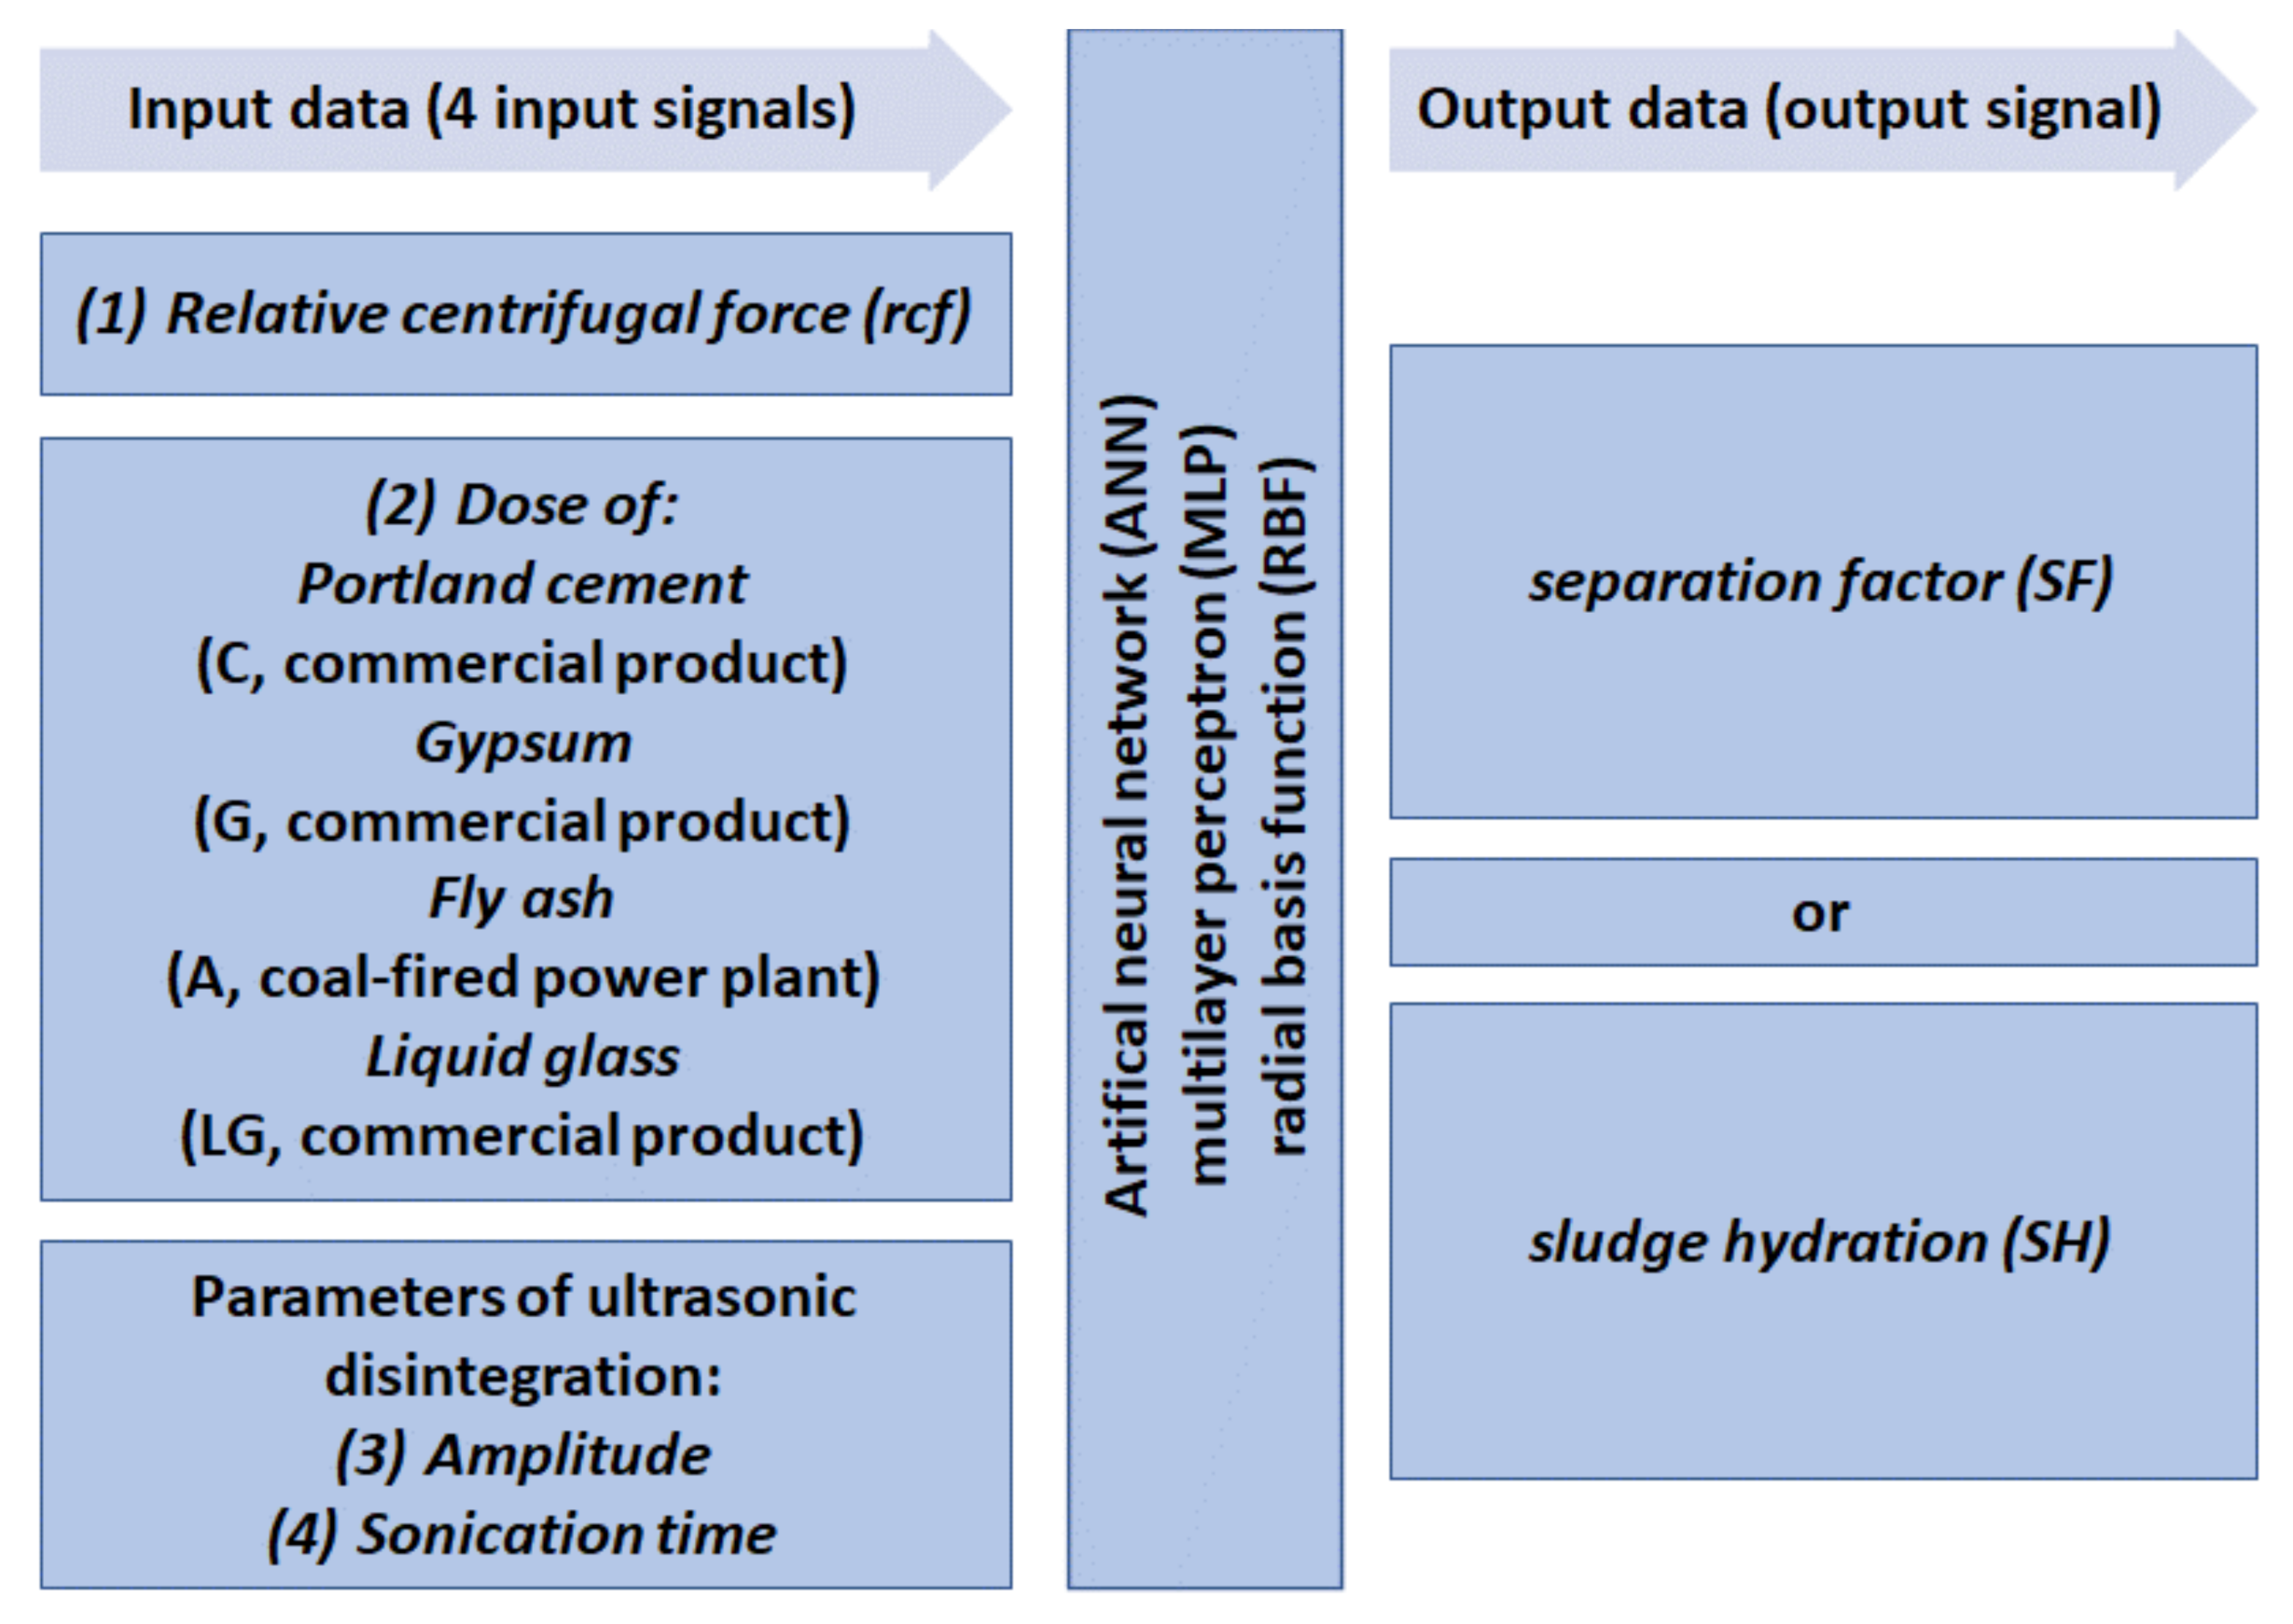
Mathematical analysis of the obtained results was conducted using the STATISTICA software (STATISTICA 7.1, Palo Alto, California, USA). The software included the Neural Networks module. For the purposes of the study, the most popular network architectures were selected: multilayer perceptron (MLP) and radial basis function (RBF). The neural networks were taught in over 600 cases serving as learning vectors. In order to create the neural networks, the learning (about 70% of the data), validation (26%), and test (4%) datasets were randomly selected. The presented considerations concerned the development of the sludge hydration and separation factor prediction model depending on the input variables (conditioning and centrifugation parameters). A dataset of 25 cases was used for the final network testing (these cases were not used in the network training process) (Figure 2).
2.7. Research Methodology
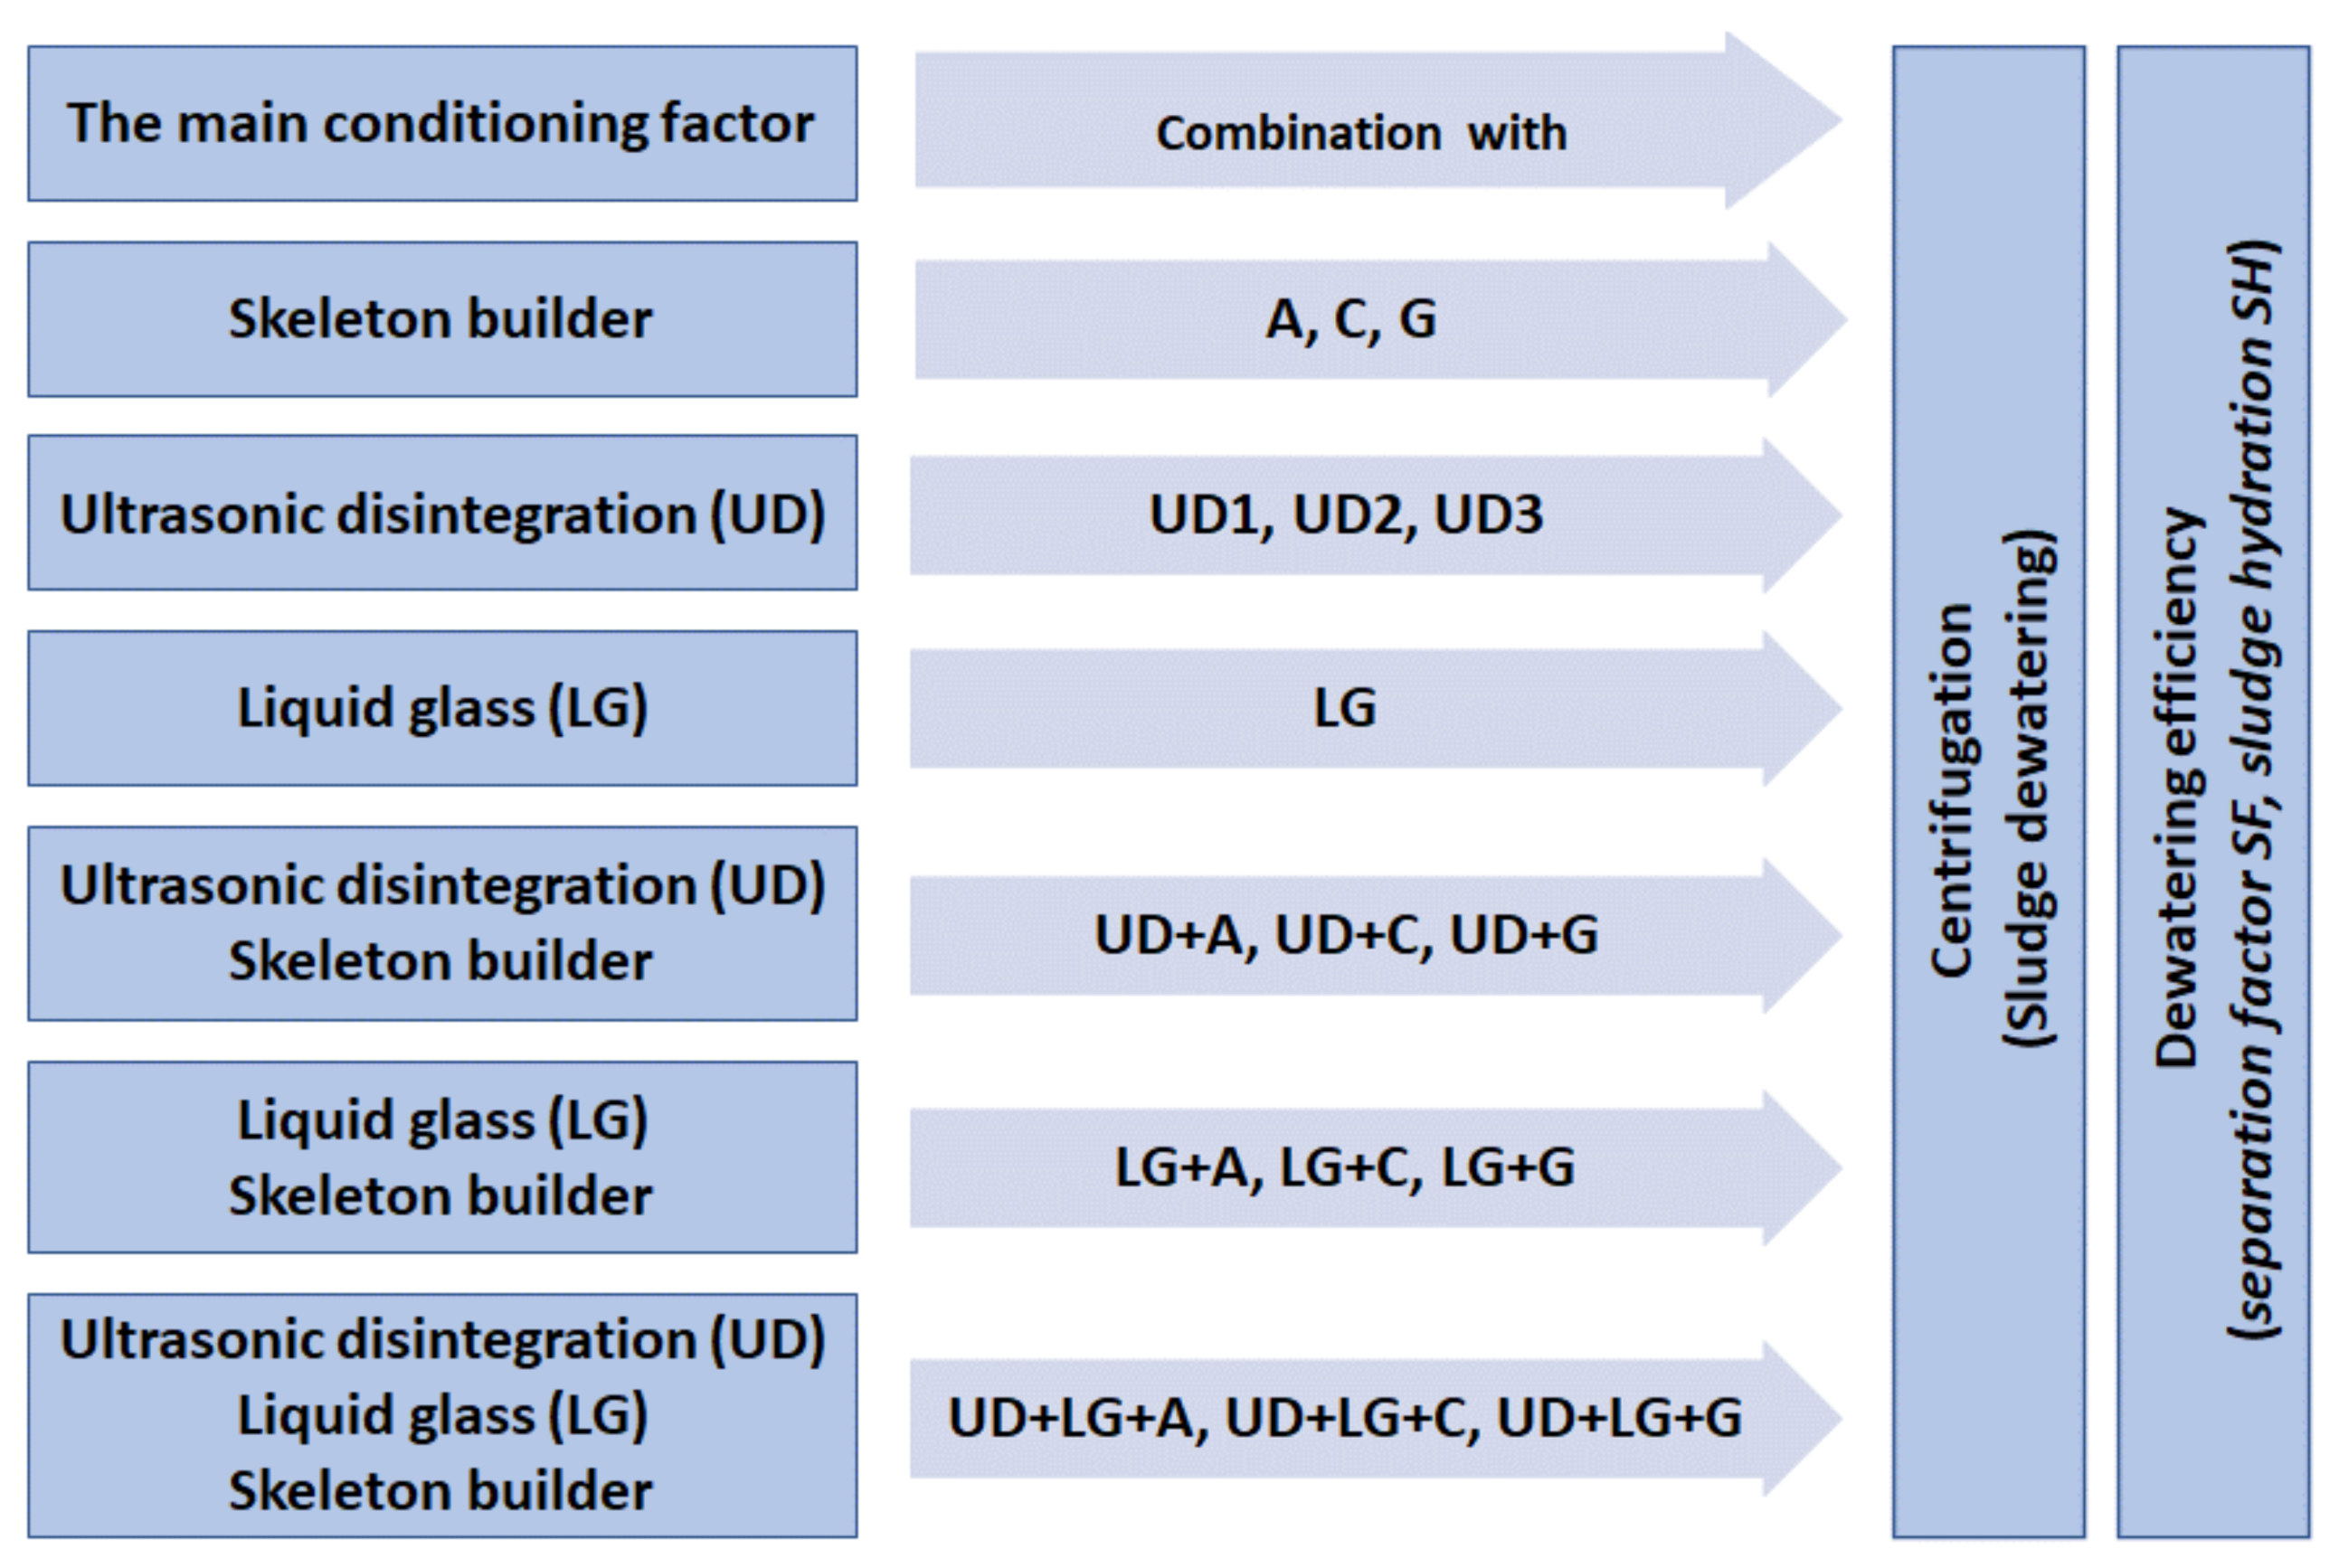
The sewage sludge dewatering tests were carried out in accordance with the test scheme assuming the performance of six main combinations (Figure 3).
3. Results
3.1. Dewatering Efficiency
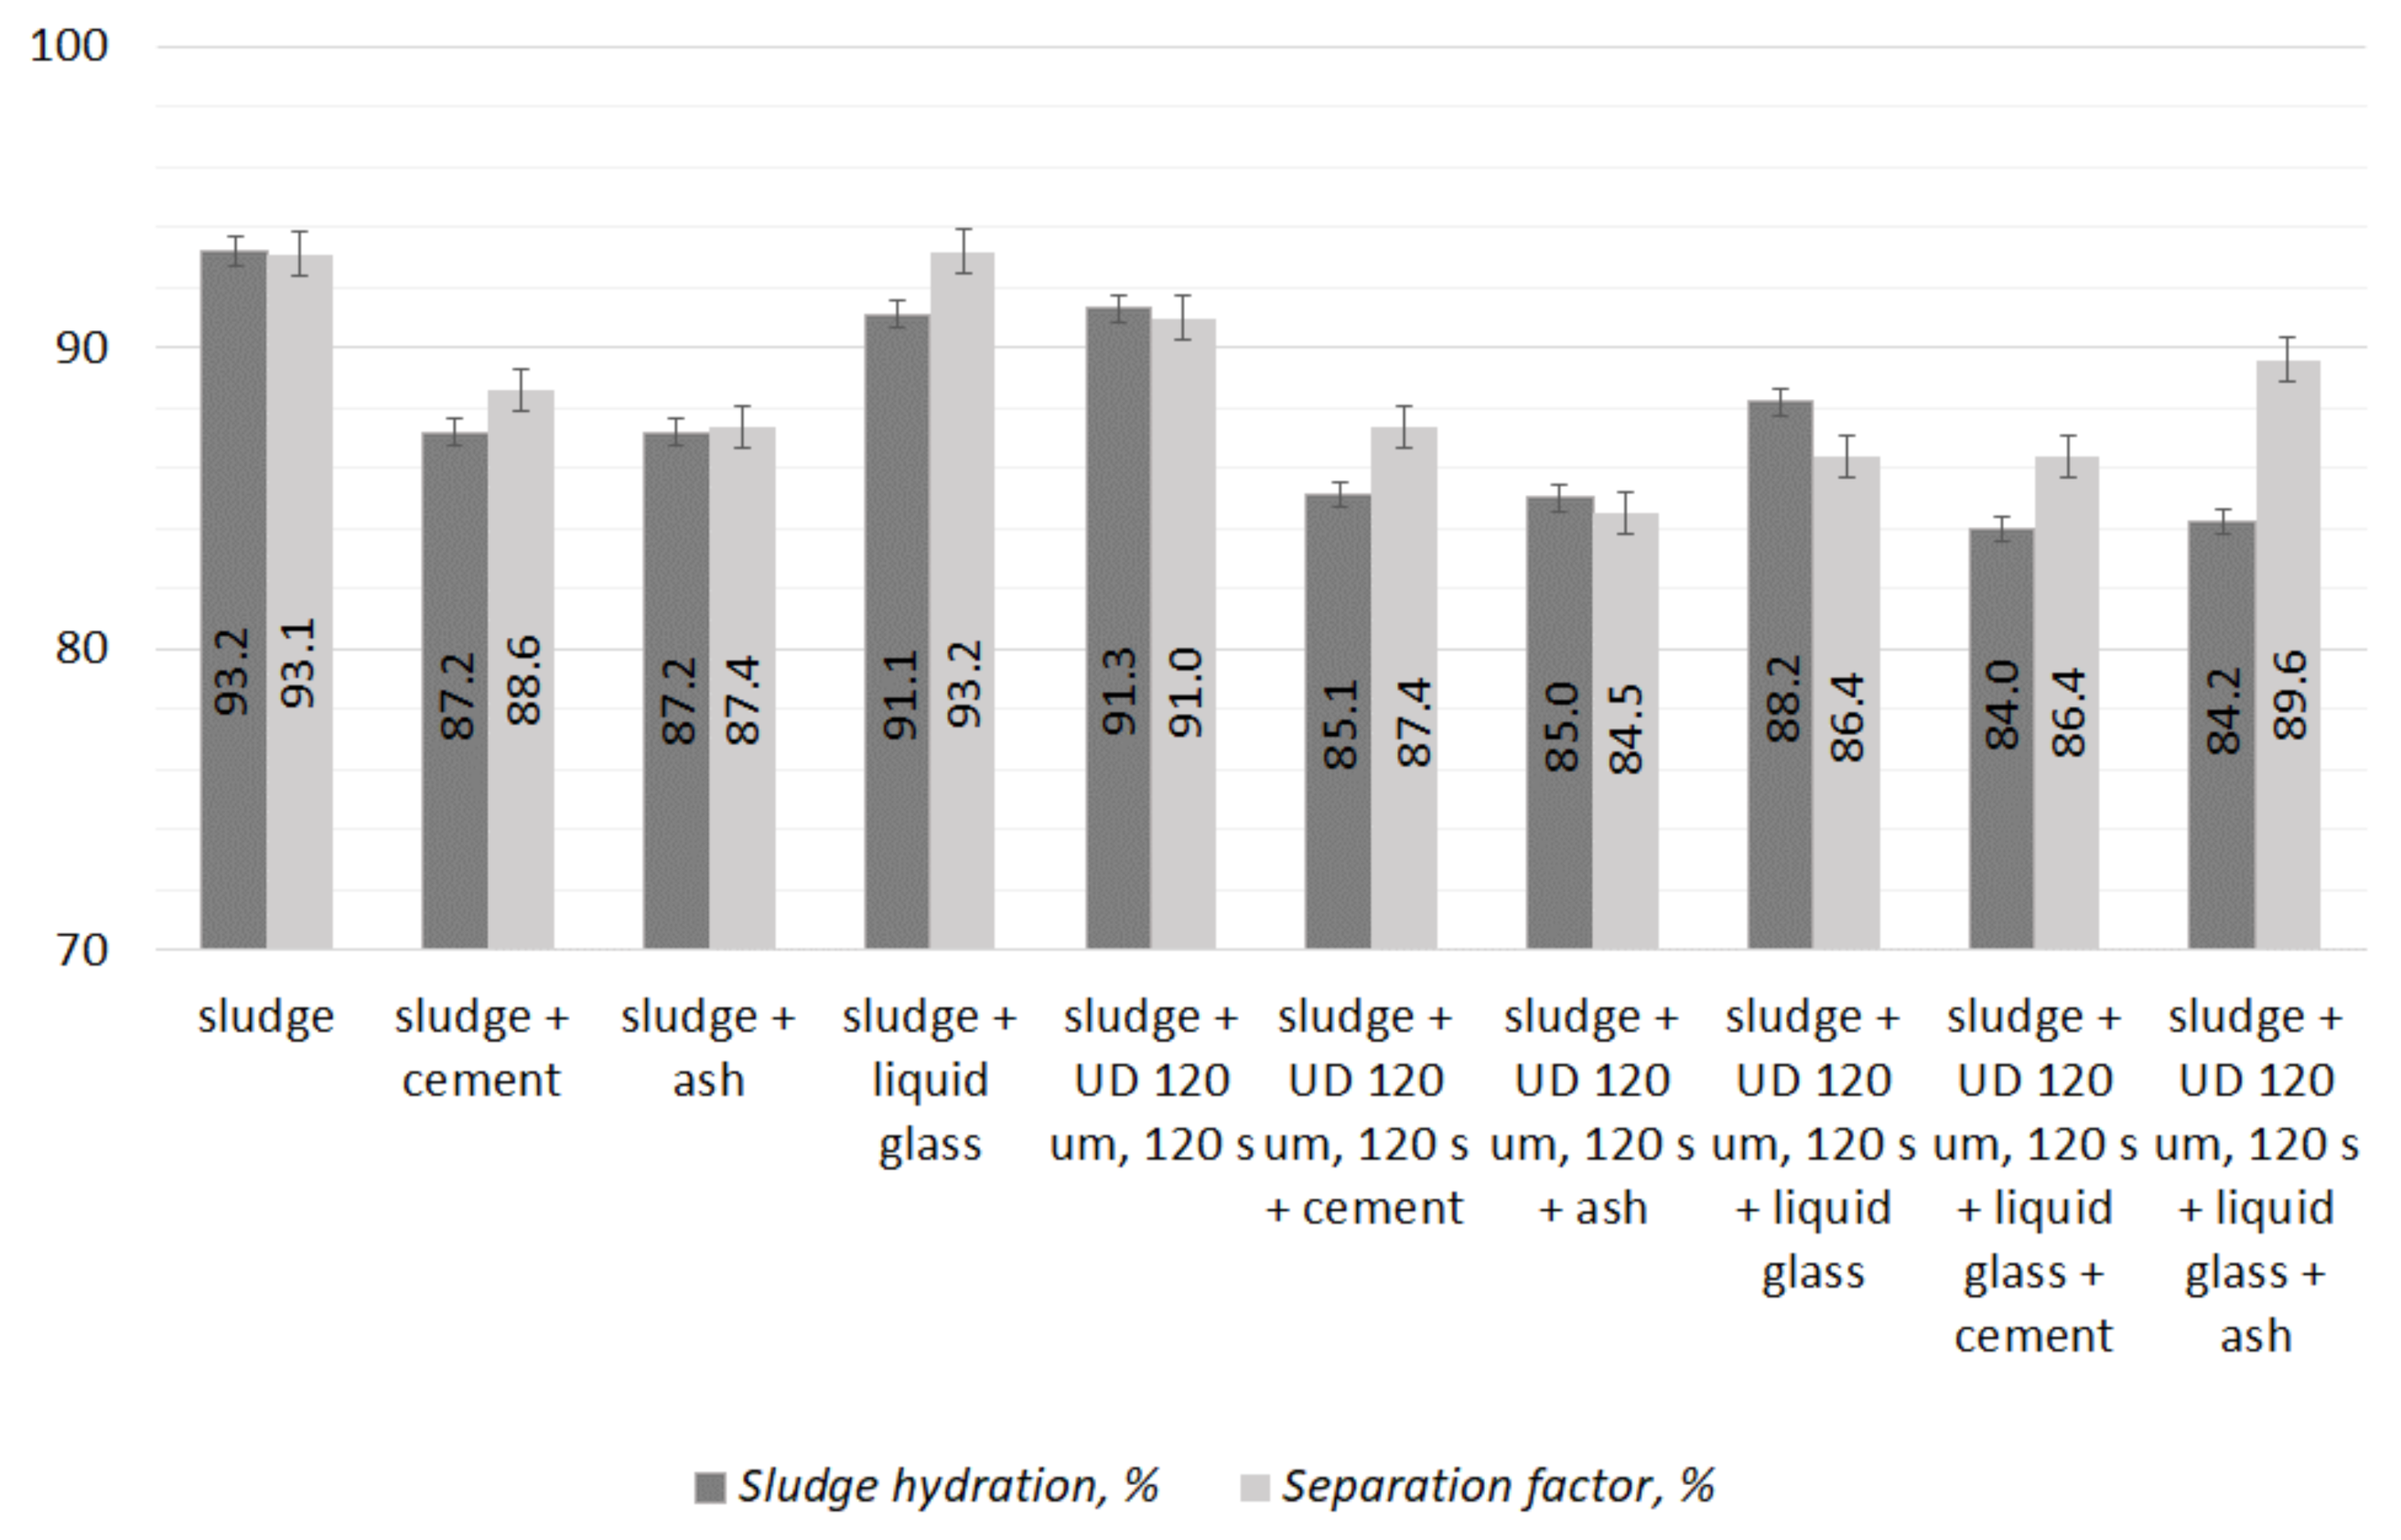
Ultrasonic treatment of sewage sludge improves the efficiency of dewatering by centrifugation, as expressed by the obtained values of end water content (Figure 4). The peak amplitude of 120 μm and sonification time of 120 s resulted in water content that was 1.9% lower than in crude sludge. For those sonification parameters, the separation factor decreased to 91% and was 2.1% lower as compared to crude sludge. A much lower end water content was obtained by treating sludge with components (ash, gypsum, cement). The lowest water content of 87.2% was obtained with the addition of ash and cement to the sludge; it was 6.0% lower than in crude sludge. The phase separation deteriorated significantly, as the separation factor did not reach 89%. A considerable amount of suspended matter remained in the sludge supernatant. The dewatering efficiency was improved by applying preliminary sonification, followed by dosing the components. The resulting water content was approximately 2% lower than that obtained when only the components were added at the highest sonification parameters. The reduction of the end water content increased with the increase of the amplitude and the sonification time. An increase of the suspension levels in the supernatant was observed. The separation factor was once again reduced and did not exceed 85%. This might have been caused by the dispersing effect of the ultrasounds and small particles of components which remain suspended during centrifugation and do not settle under the centrifugal force. Using liquid glass as an alternative to polyelectrolyte resulted in a reduction of the end water content to 91.1% (2.1% lower than that obtained by centrifugating crude sludge). The separation factor value was similar to the one obtained by centrifugating untreated sludge. Using preliminary sonification with the highest ultrasonic energy reduced the end water content to 88.2%. Applying enrichment resulted in the reduction of the separation factor to as low as 86.4%. The lowest end water content after centrifugation was obtained by conditioning the sludge using the combination of preliminary sonification, liquid glass, and components. The most efficient components were cement and ash, for which the obtained end water content was approximately 84.0%. The separation factor fell within the range of 86.4% to 89.6%.
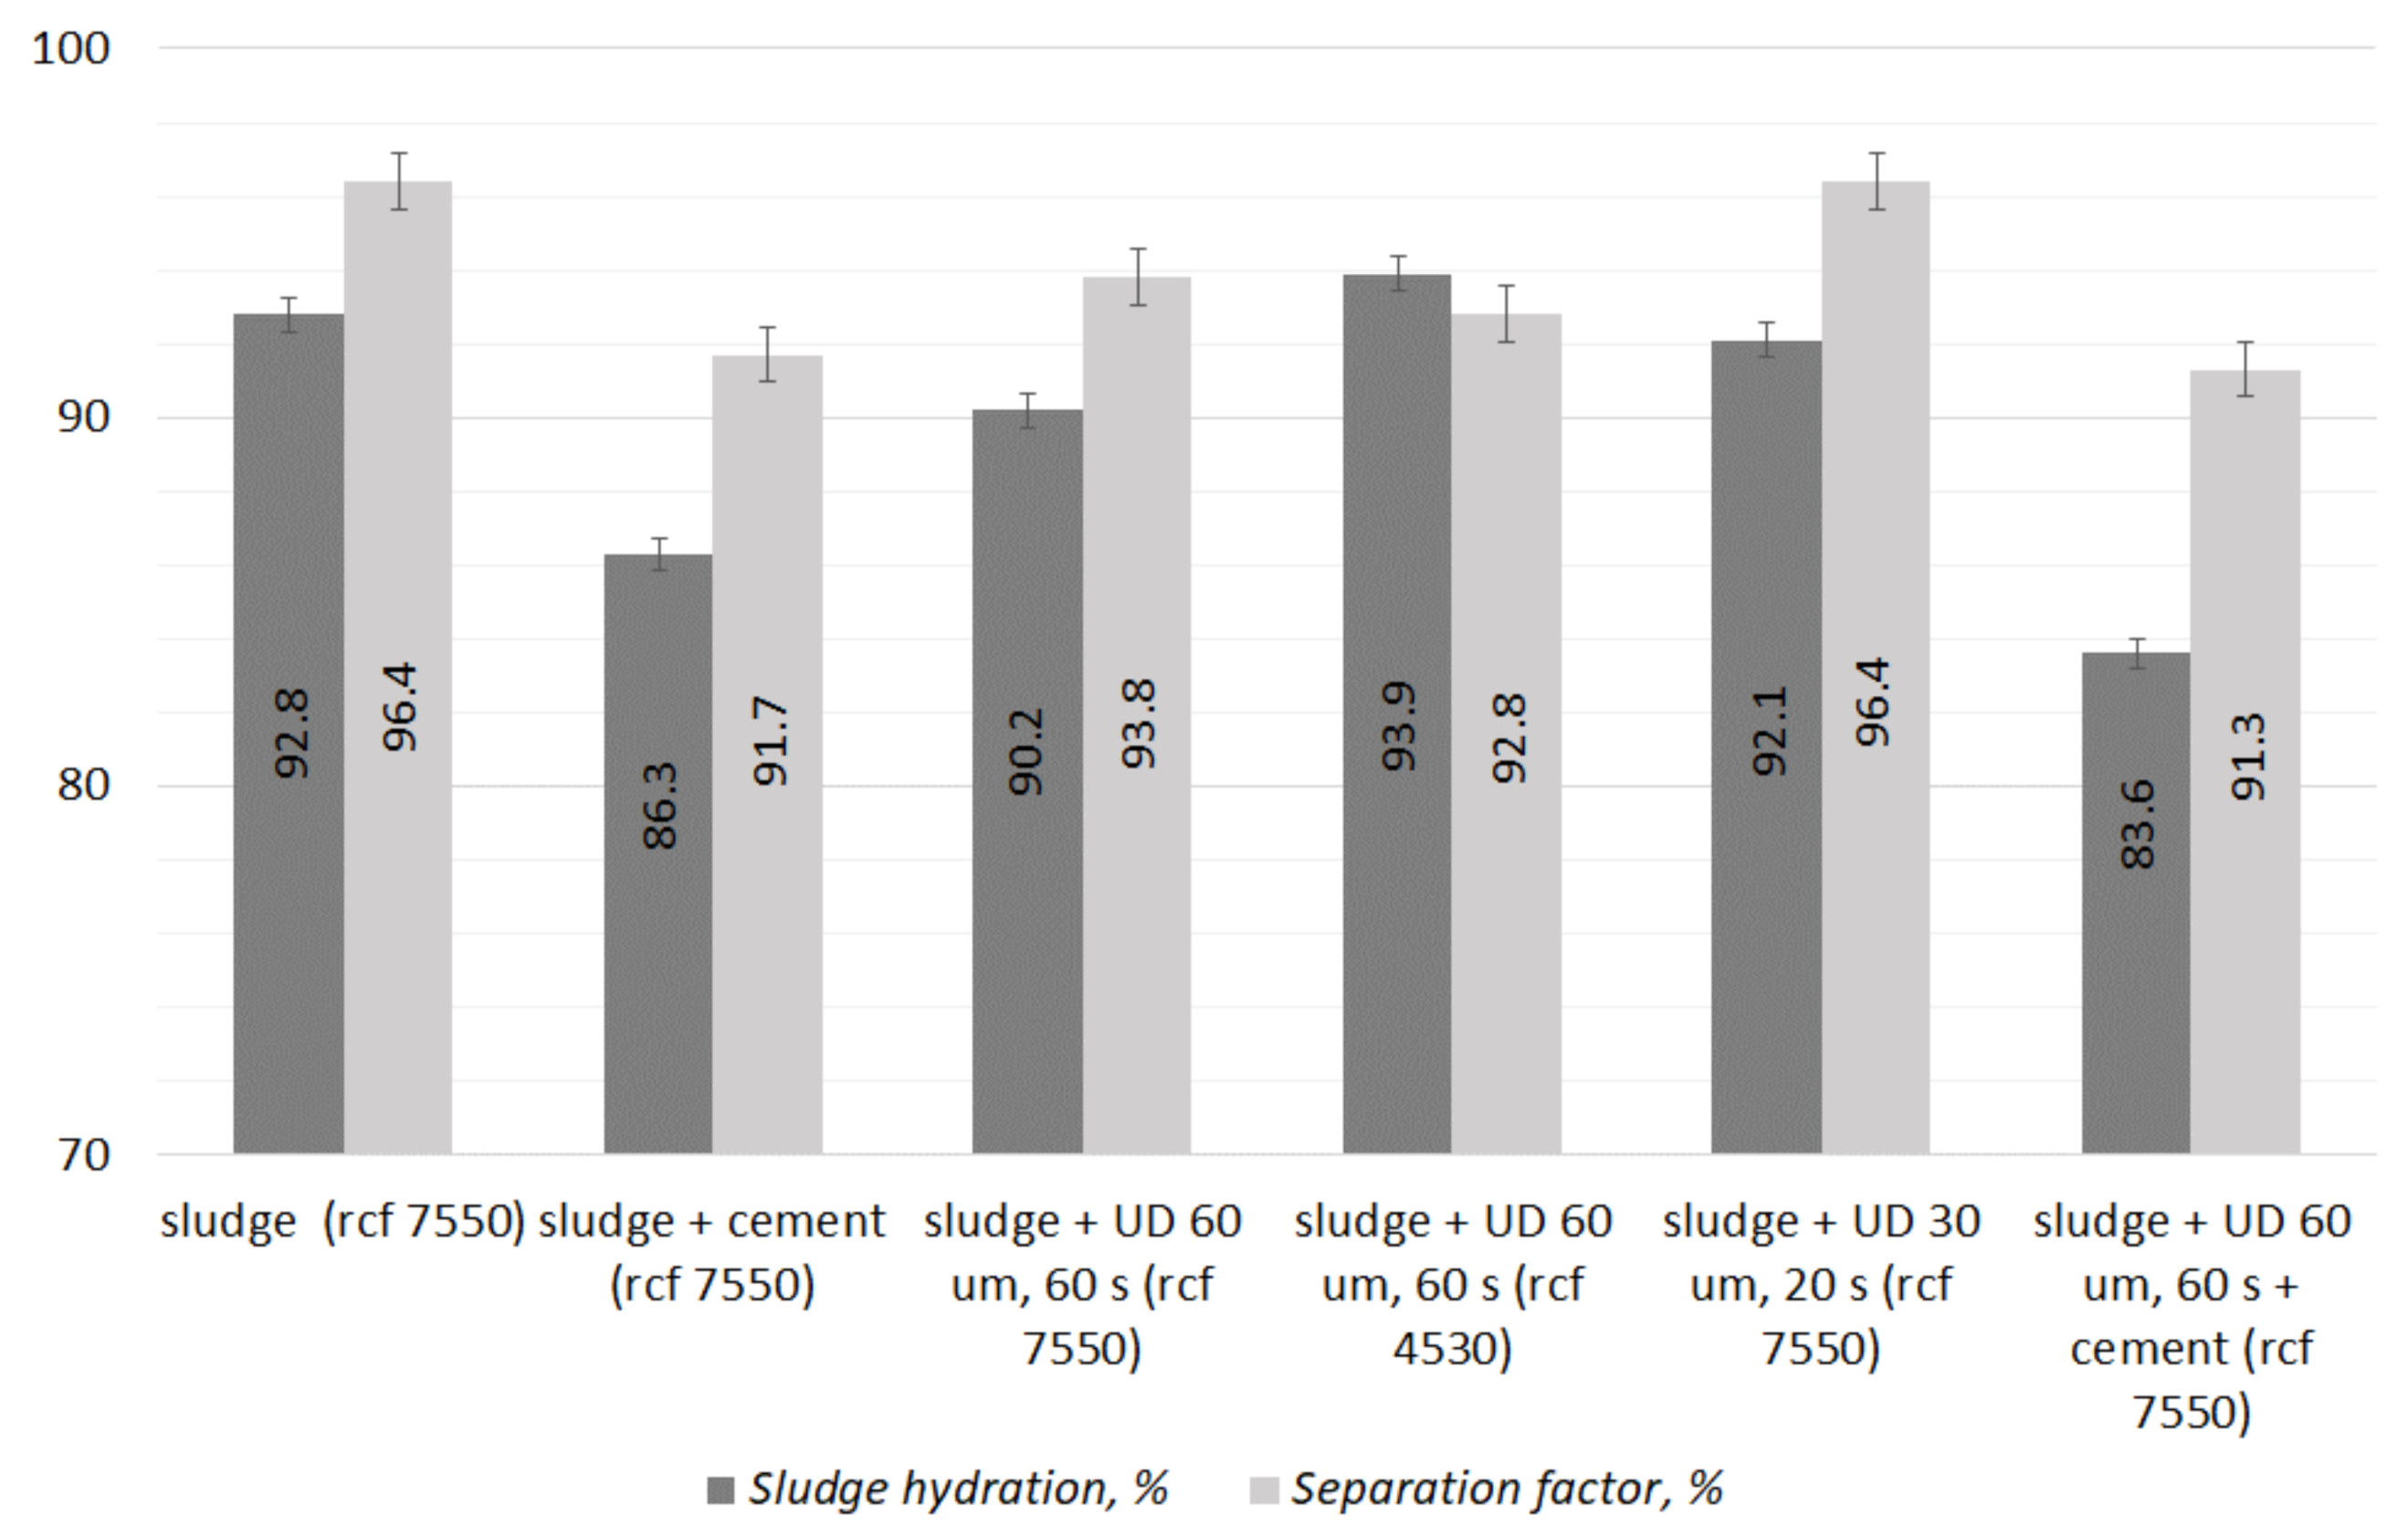
Analysis was also conducted to identify the correlation between the sludge treatment method and the efficiency of sludge dewatering by centrifugation at different g-force values in the centrifuge (Figure 5). Sludge conditioning by ultrasonic field reduced the end water content regardless of the g-force in the centrifuge. The best effects were achieved for conditioning the sludge with the peak amplitude over 60 s, for the 7550 rcf, obtaining the end water content of 90.2%. For the same conditioning parameters but with the lowest g-force in the centrifuge, the water content was 3.7% lower. The end water content would decrease with the increasing sonification amplitude and time, and the rcf. Higher g-force in the centrifuge resulted in an increase of the separation factor. However, with the increase of the sonification amplitude and time, the separation factor would drop. During centrifugation of the sludge at the highest rcf, the value of 96.4% was obtained. The addition of components (cement, ash, gypsum) to the sludge significantly improved the sludge dewatering efficiency. The lowest end water content was obtained by centrifugating the sludge with the highest g-force and with the addition of cement. The obtained end water content in this case was 86.3% (i.e., 6.5% lower than for untreated sludge). With the increasing efficiency of lowering the end water content, the efficiency of solid phase separation would decrease, with lower separation factor values. The substances that build the sludge skeleton contain different fractions of mineral substances. Heavy fractions load the sludge flocs, accelerate sedimentation, and strongly thicken the sludge under the influence of centrifugal force. Therefore, the decreasing final dewatering of the sludge after centrifugation was observed. Light fractions may not sediment under the influence of (too low) centrifugal force and then form a suspended solid in the supernatant. This was the most possible cause of lowering the separation factor. The content of light substances in the raw sludge was low, therefore a higher separation factor was noted. On the other hand, the lack of tight packing (thickening) of the flocs resulted in higher final hydration values. Further reduction of the end water content by approximately 3% after centrifugation was achieved by using preliminary sonification and adding components (cement) in the sludge treatment. The lowest obtained water content of 83.6% was achieved with preliminary sonification at the highest ultrasonic field parameters and with the addition of cement, and also with the highest rcf of the centrifuge. The separation factor was 91%. Given that good efficiency of solid phase separation from the sludge occurs with a coefficient higher than 95%, the observed value does not meet that criterion (Figure 5).
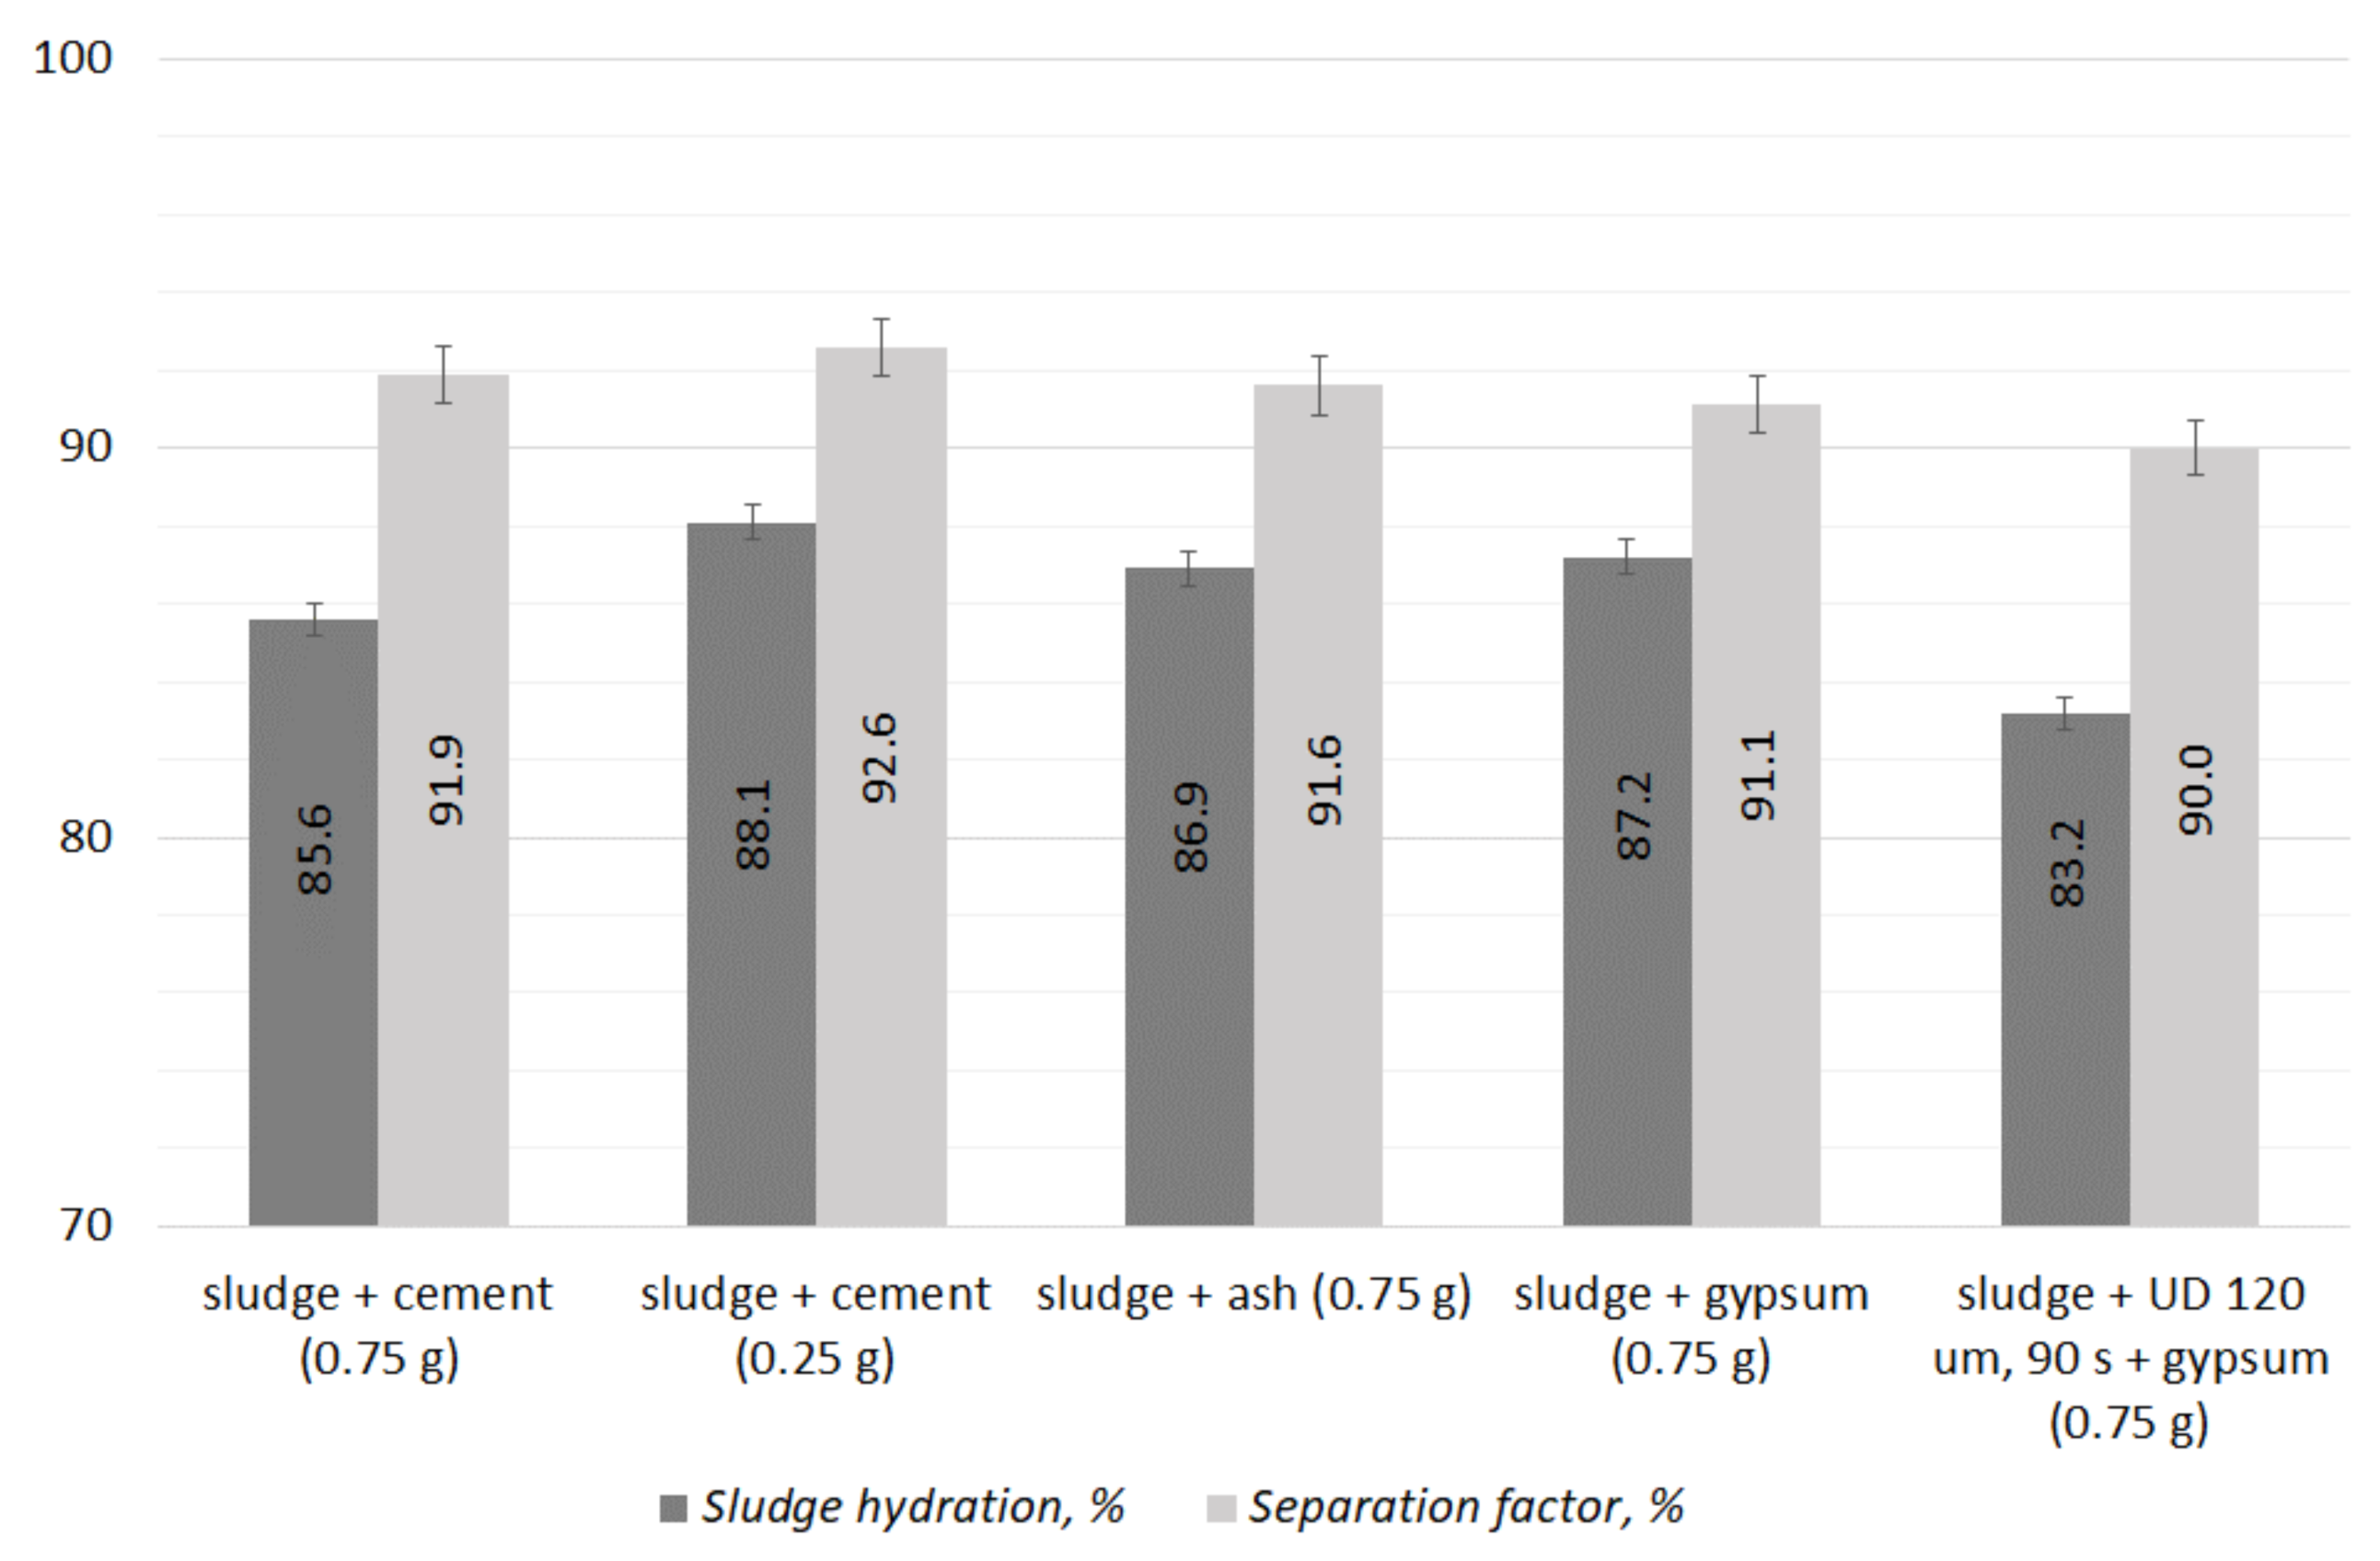
The assessment also included the efficiency of solid phase separation from the sludge by centrifugation at different doses of treatment components (Figure 6). The lowest end water content was observed for cement in the highest dose of 0.75 g/100 cm3 and amounted to 85.6%. The difference of water content between the lowest and the highest dose was 2.5%. Regardless of the applied dose of component, the separation factor was approximately 92%. Using other treatment components also reduced the end water content, with the best results achieved with the highest doses (89% for ash and 87.2% for gypsum). For the combined treatment, using preliminary sonification and the addition of components, the best results of end water content were once more achieved for cement in the highest dose. Sonification with the highest ultrasonic energy and the addition of cement resulted in the end water content of 83.2%. The separation factor fell within the range of 89.3% to 91.4%.
3.2. Developing the Mathematical Model
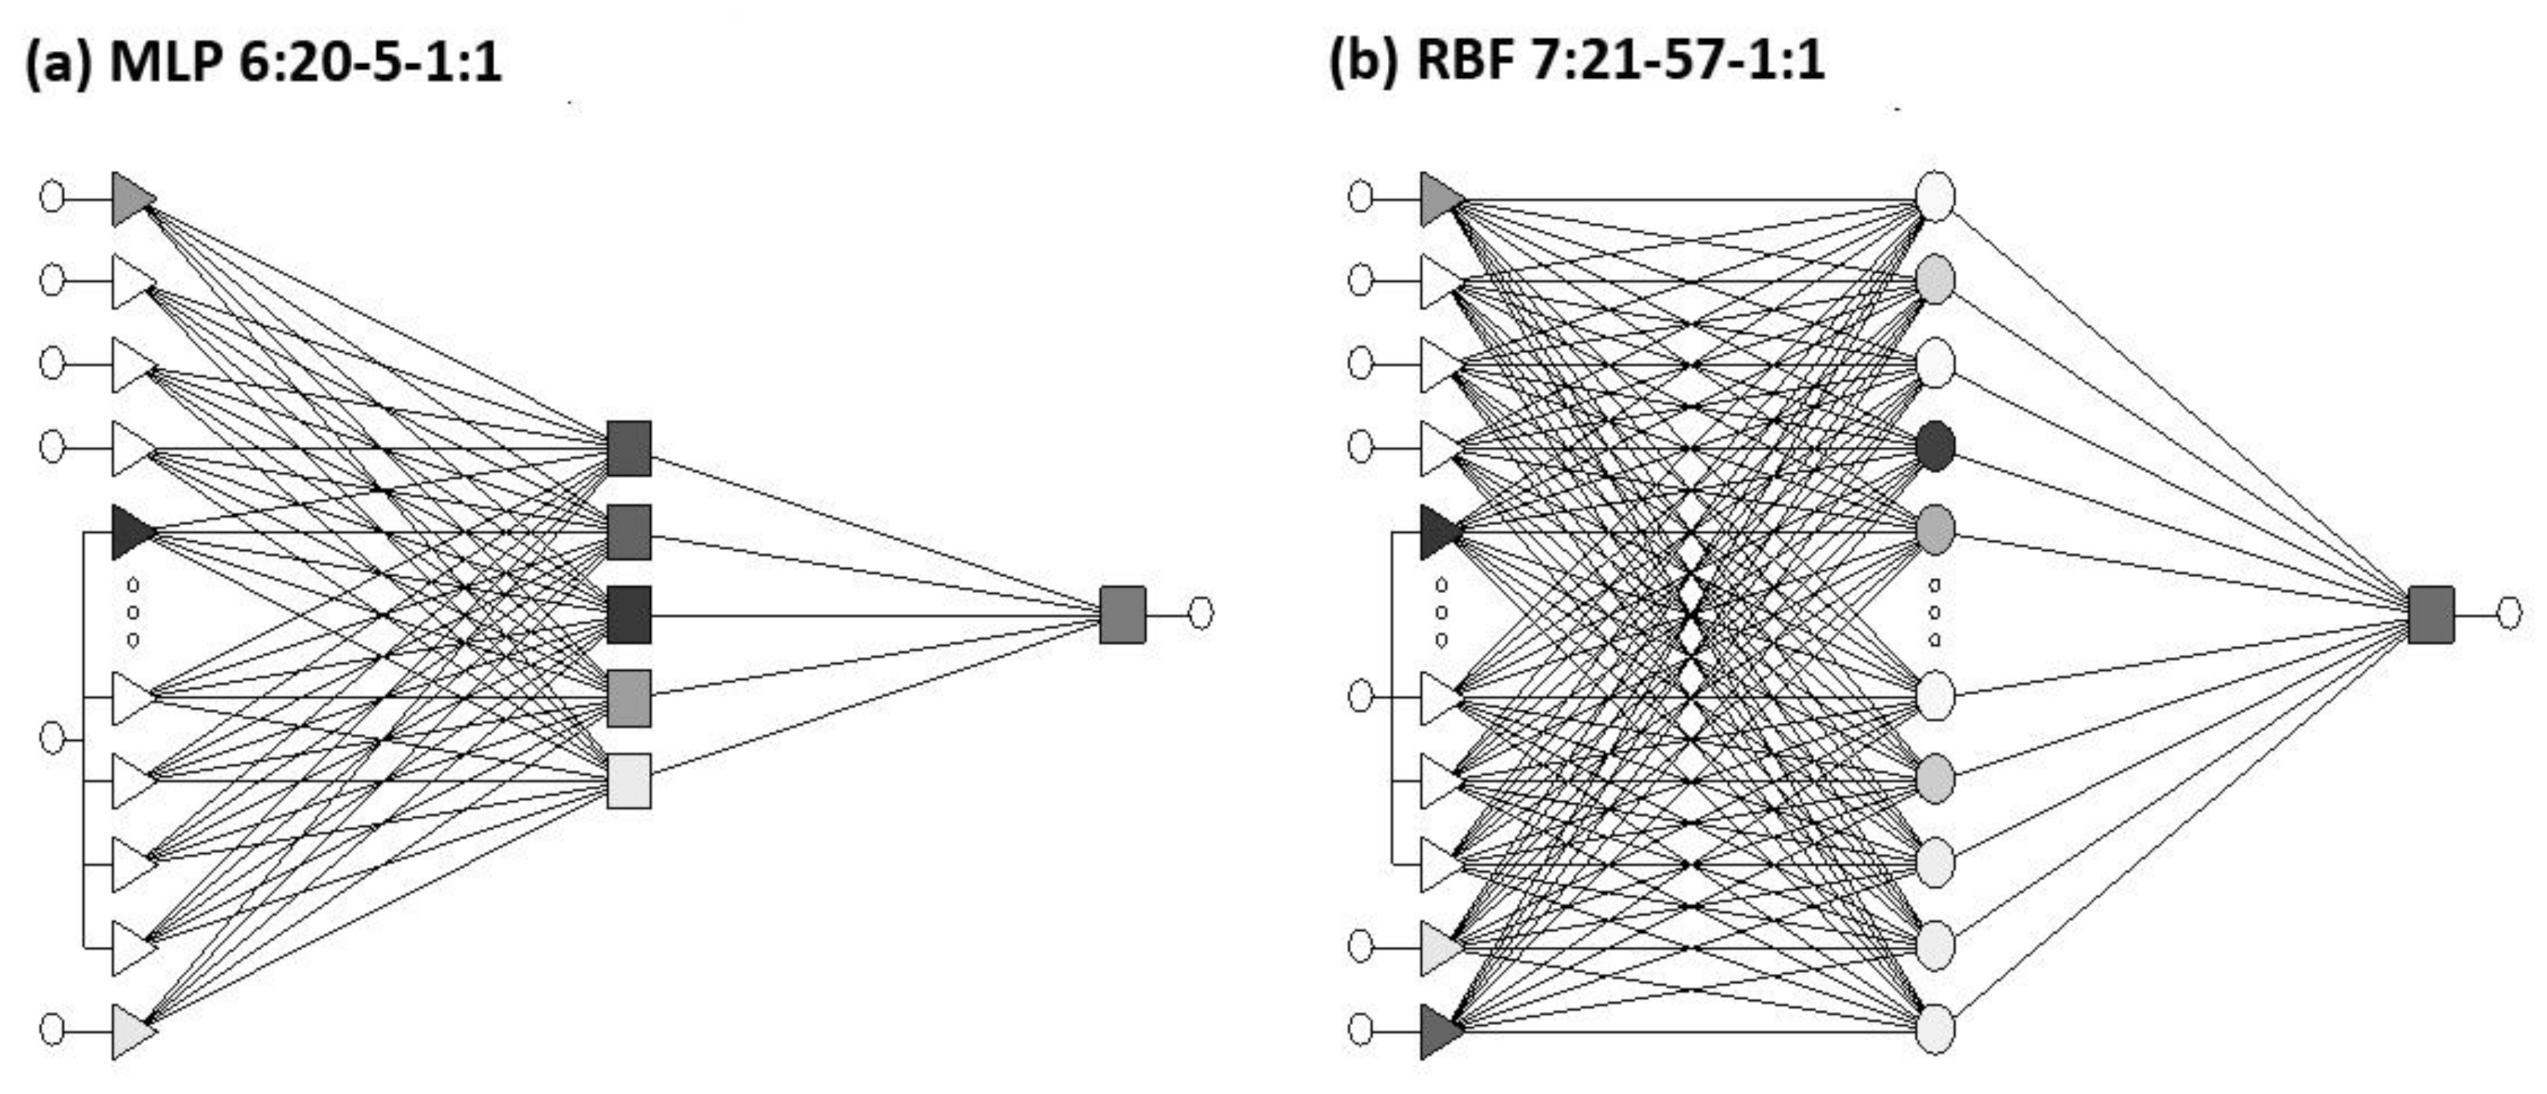
In the development of the neural networks model, for the regression describing the changes of the end water content, the set of variables of parameters affecting the quality of preparation of the sludge before dewatering was selected as the input variables. Two networks were developed (MLP and RBF) characterized by the highest correlation coefficient. As the input variables with the highest sensitivity, the networks selected the vibration amplitude, the time of application of the ultrasonic field, the dry matter content in the sludge, and the dose of the applied components. Both neural networks used the same parameters as highest-quality variables. Table 2 shows the comparison of the parameters of the selected neural networks. The value of the deviation (quality) quotient for the learning, test, and validation datasets was similar in both cases and attested to the good quality of the neural network model. It also indicates high learning capability.
The network models are illustrated in Figure 7.
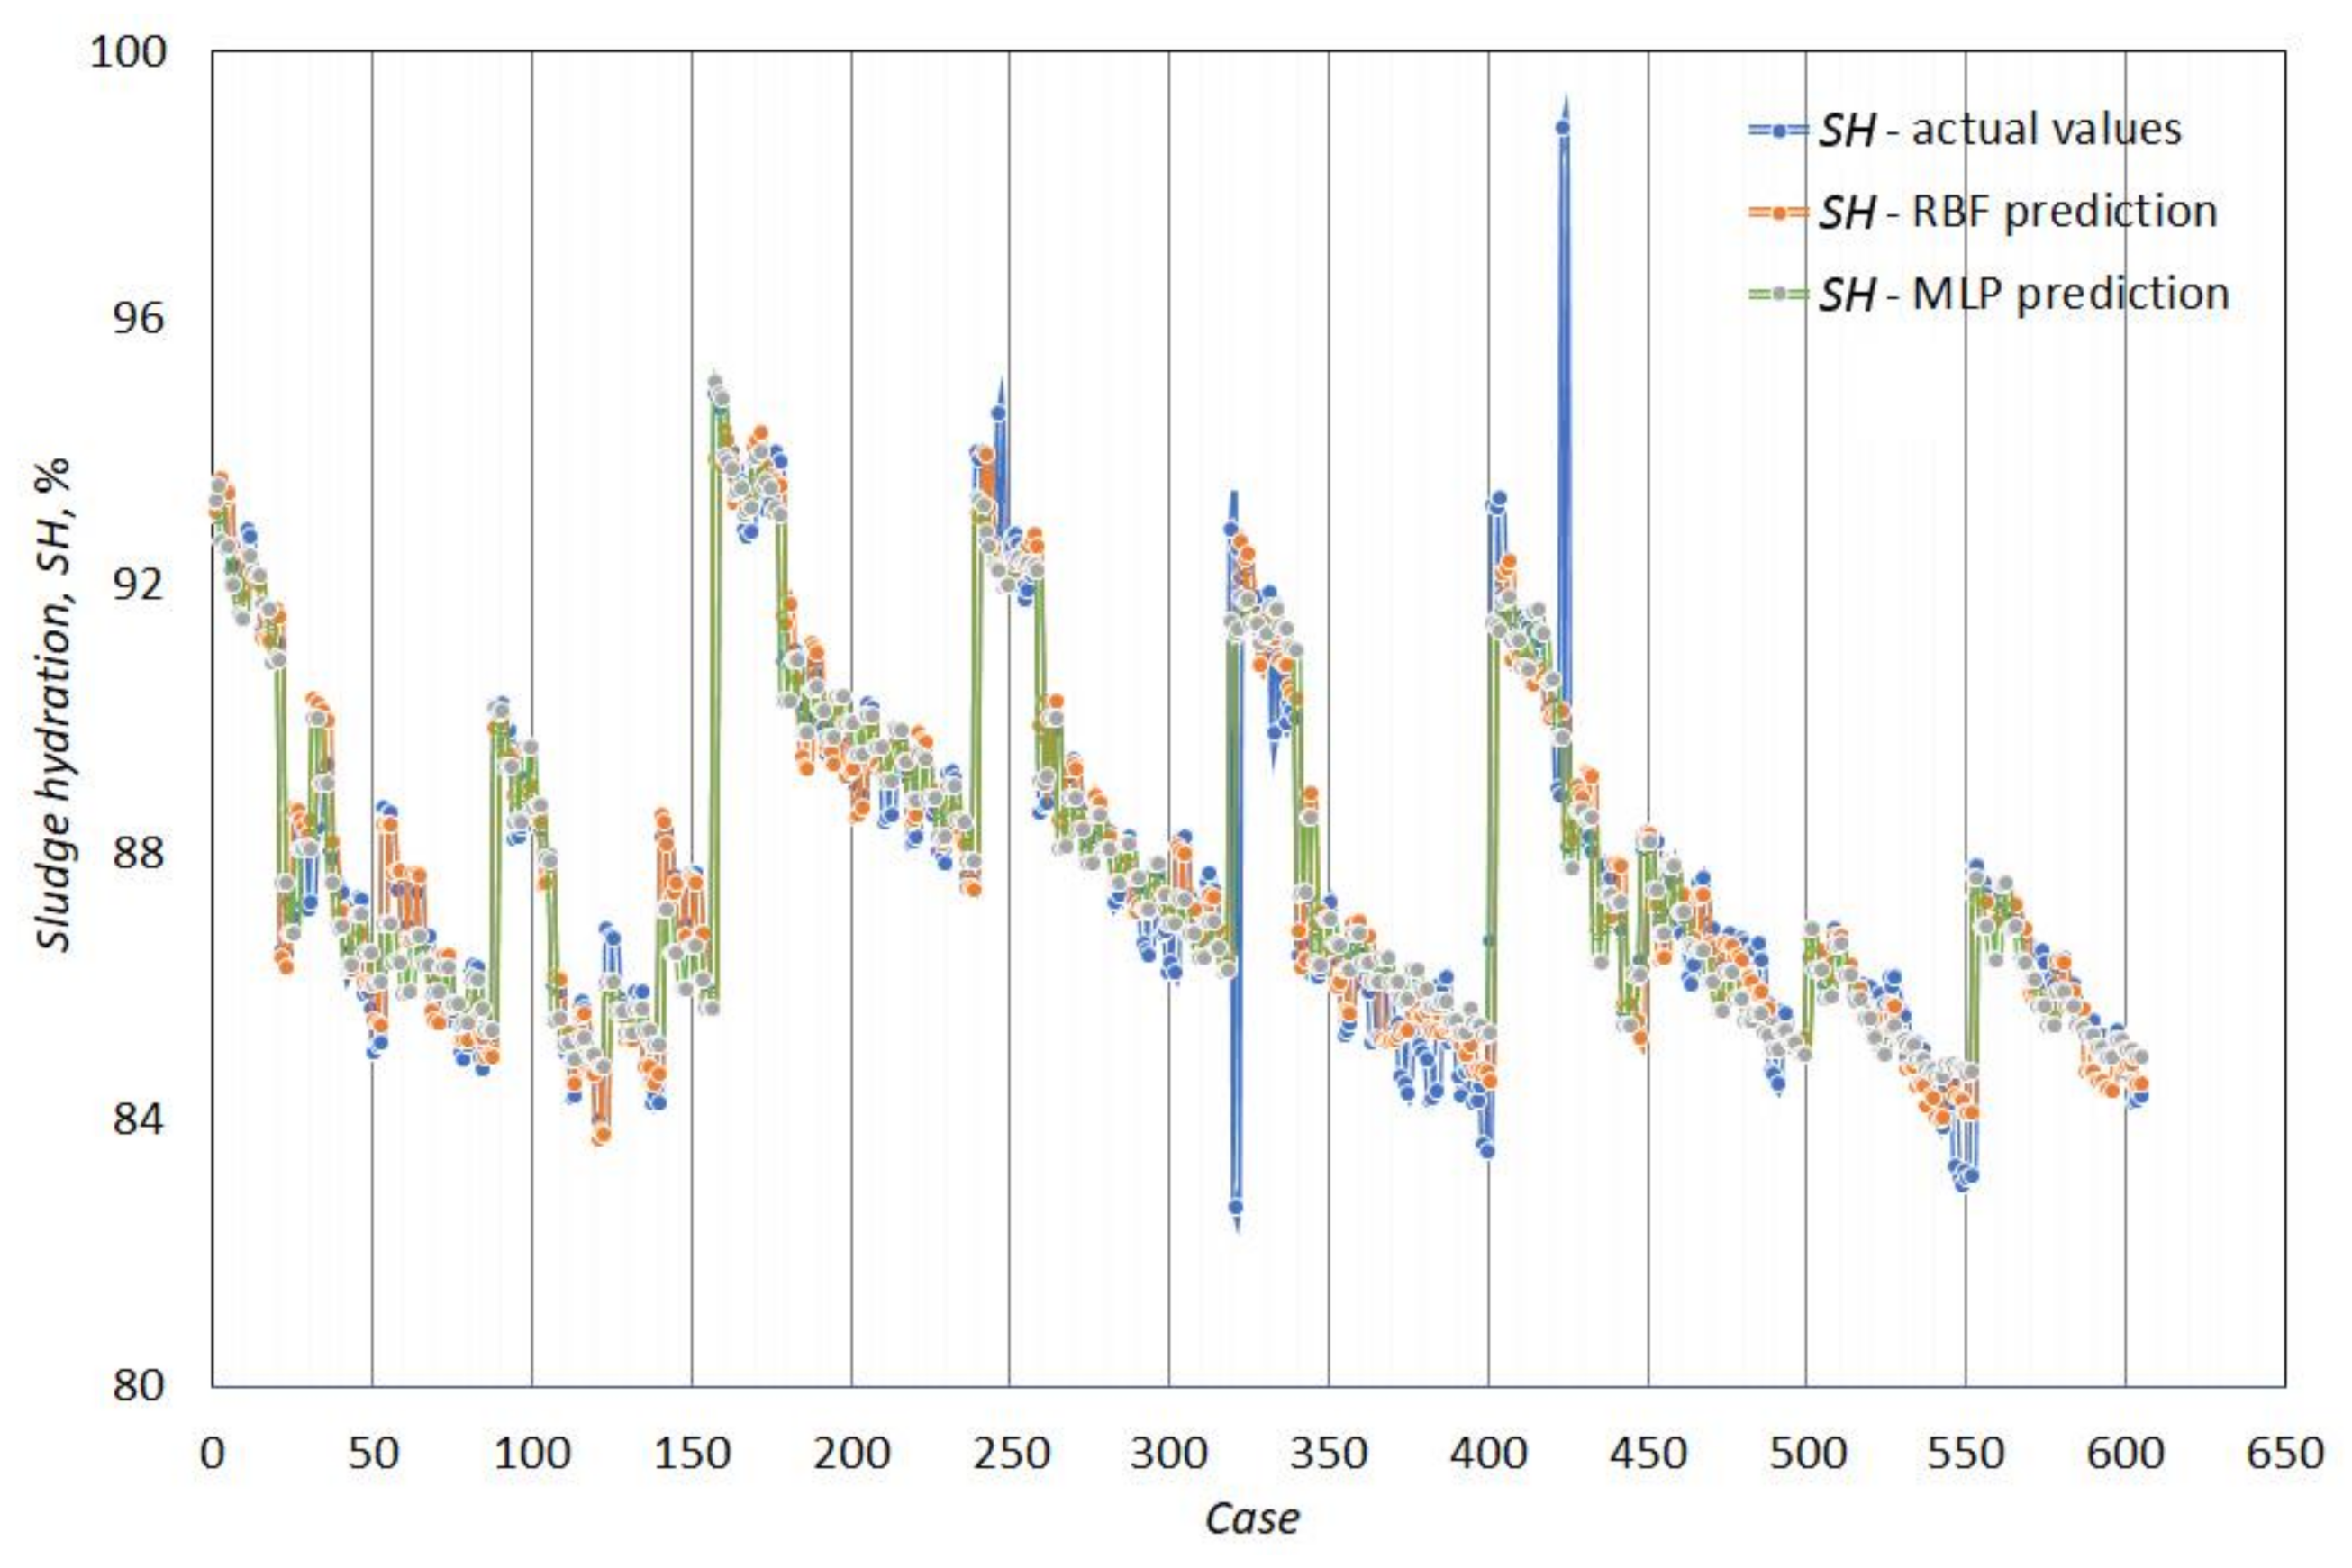
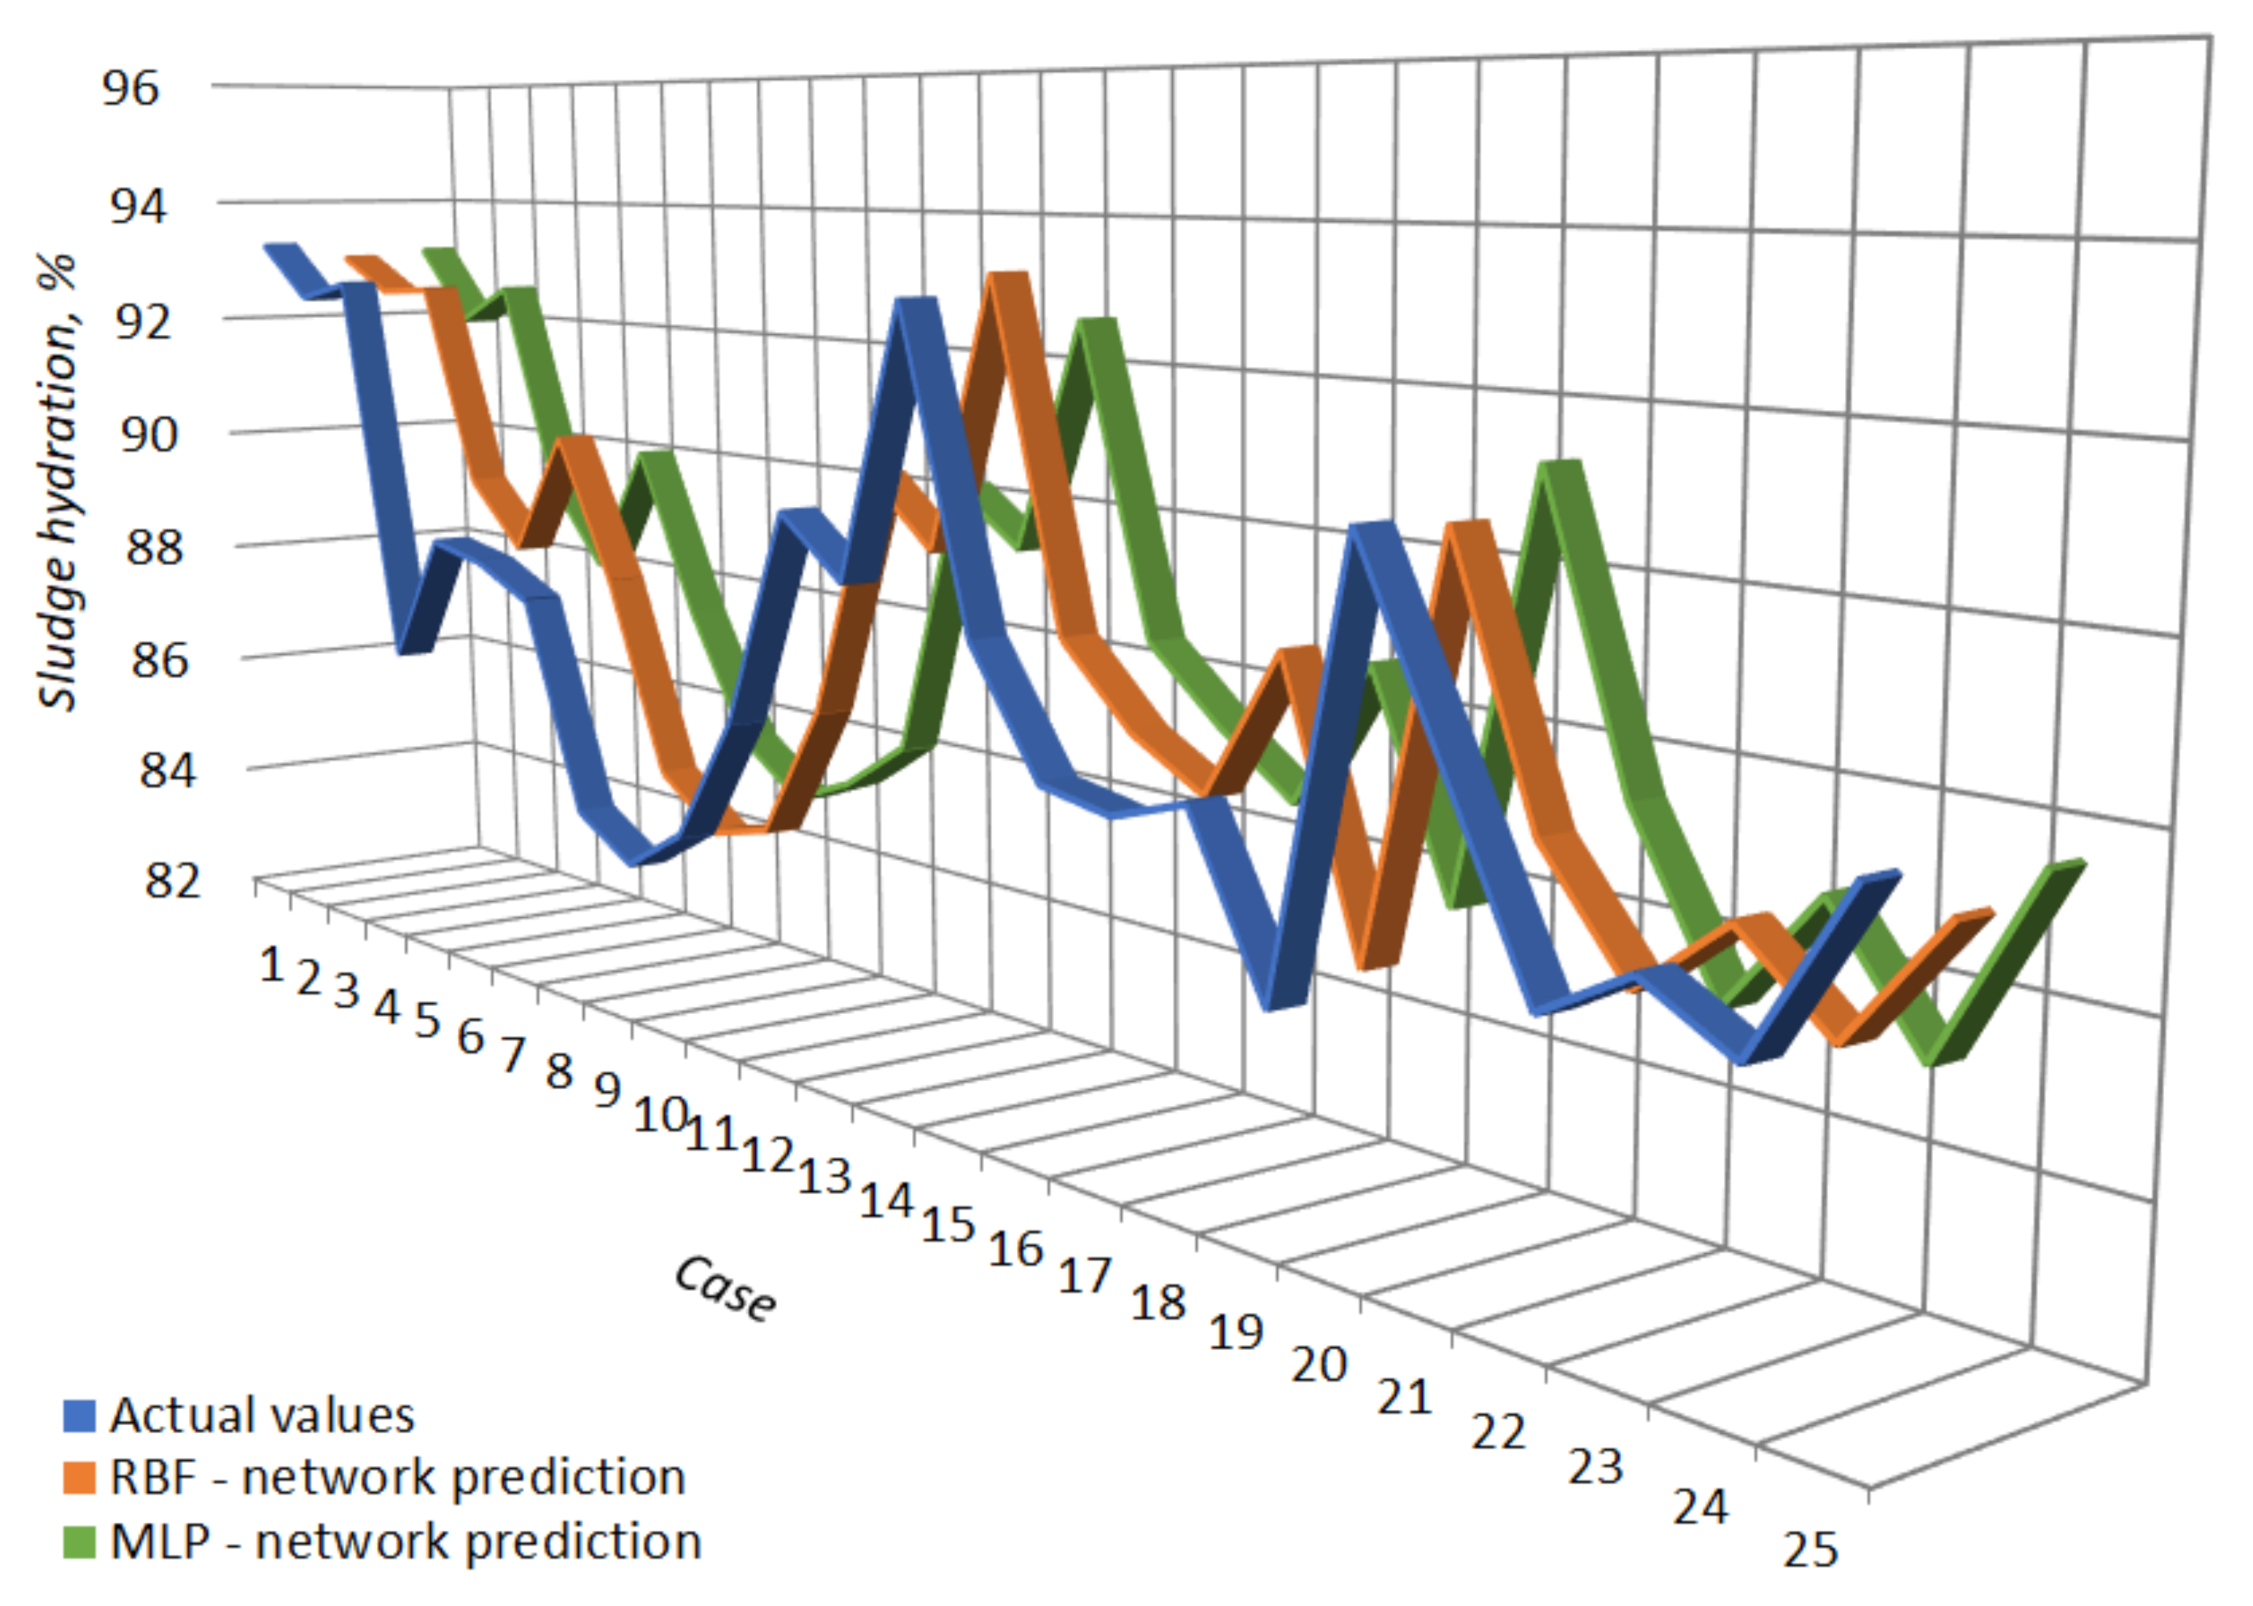
In both discussed cases, due to the fact that the values obtained for the validation and the test datasets were low, no capacity for overlearning was found in the neural networks. Figure 8 shows the degree of alignment of the neural networks to real-life values. For a handful of cases, some minor differences can be found between the real-life values and the values forecasted by the networks.
After analyzing the obtained parameters of both neural networks, it was concluded that the networks can be used to predict the value of the output variable (end water content). For the modeled parameter, some minor differences were found between the real-life values and the values forecasted by the networks.
Table 3 and Figure 9 show the results of network tests, conducted on the test dataset containing 25 random cases. Both networks were able to produce very accurate forecasts of the end water content after centrifugation. In two cases, the end water content forecasts had errors within the range of 3.0–3.2%. In other cases, regardless of the network applied, the error value did not exceed 2.0% (Table 3). After testing the end water content modeling in the created networks, it was concluded that the neural networks can be excellent tools for predicting the results of that parameter.
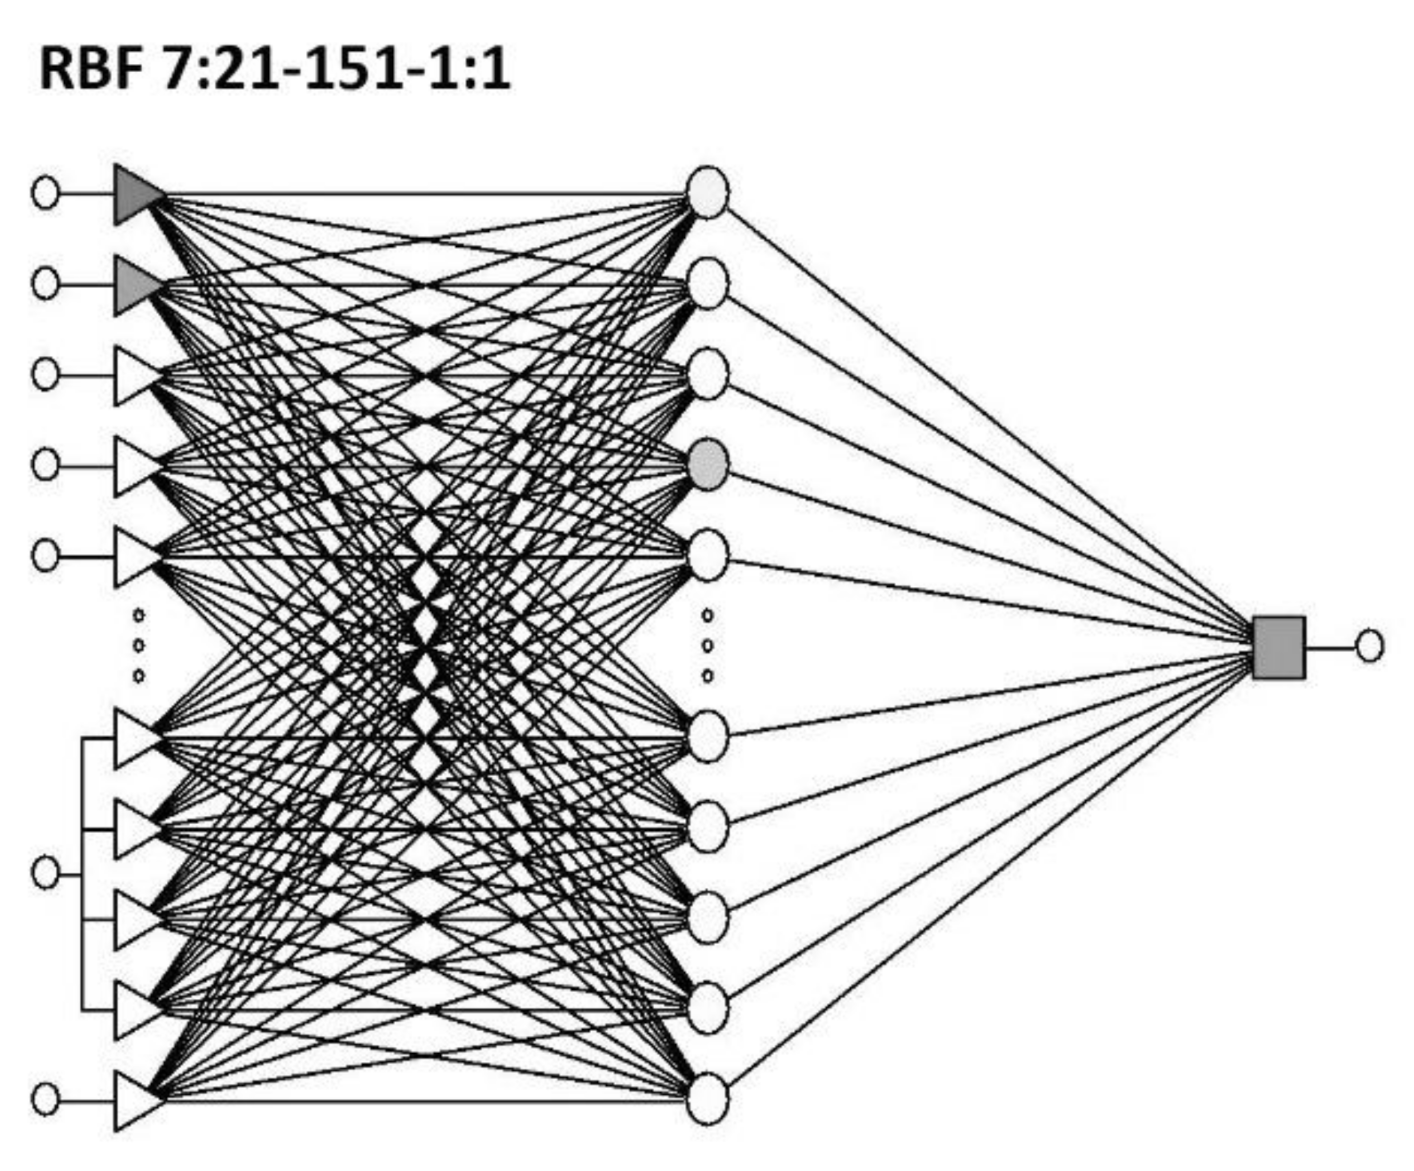
Using neural networks to produce a mathematical model of the changes of the separation factor SF which does not maintain a clear linear upwards or downwards tendency is exceptionally difficult. In such cases, the model of regression by a radial basis function neural network (RBF, Figure 10) is usually used, as this method produces the lowest statistical error. Similar to modeling the changes of end water content (Figure 7, Figure 8), for the purpose of building a regression model for the separation factor, the networks were taught on 630 cases serving as learning vectors. The learning, validation, and test datasets were also randomly chosen. Building the network, the software automatically used only those variables, the absence of which would result in the highest increase of the error value (the so-called sensitivity analysis). Figure 8 shows the schematic of a radial basis function neural network, which provided an accurate description of the changes of the separation factor. The network comprised input vectors, which included the parameters of conditioning and dewatering in sewage sludge centrifugation, a hidden layer of 151 neurons, and an output (i.e., the vector describing the separation factor).
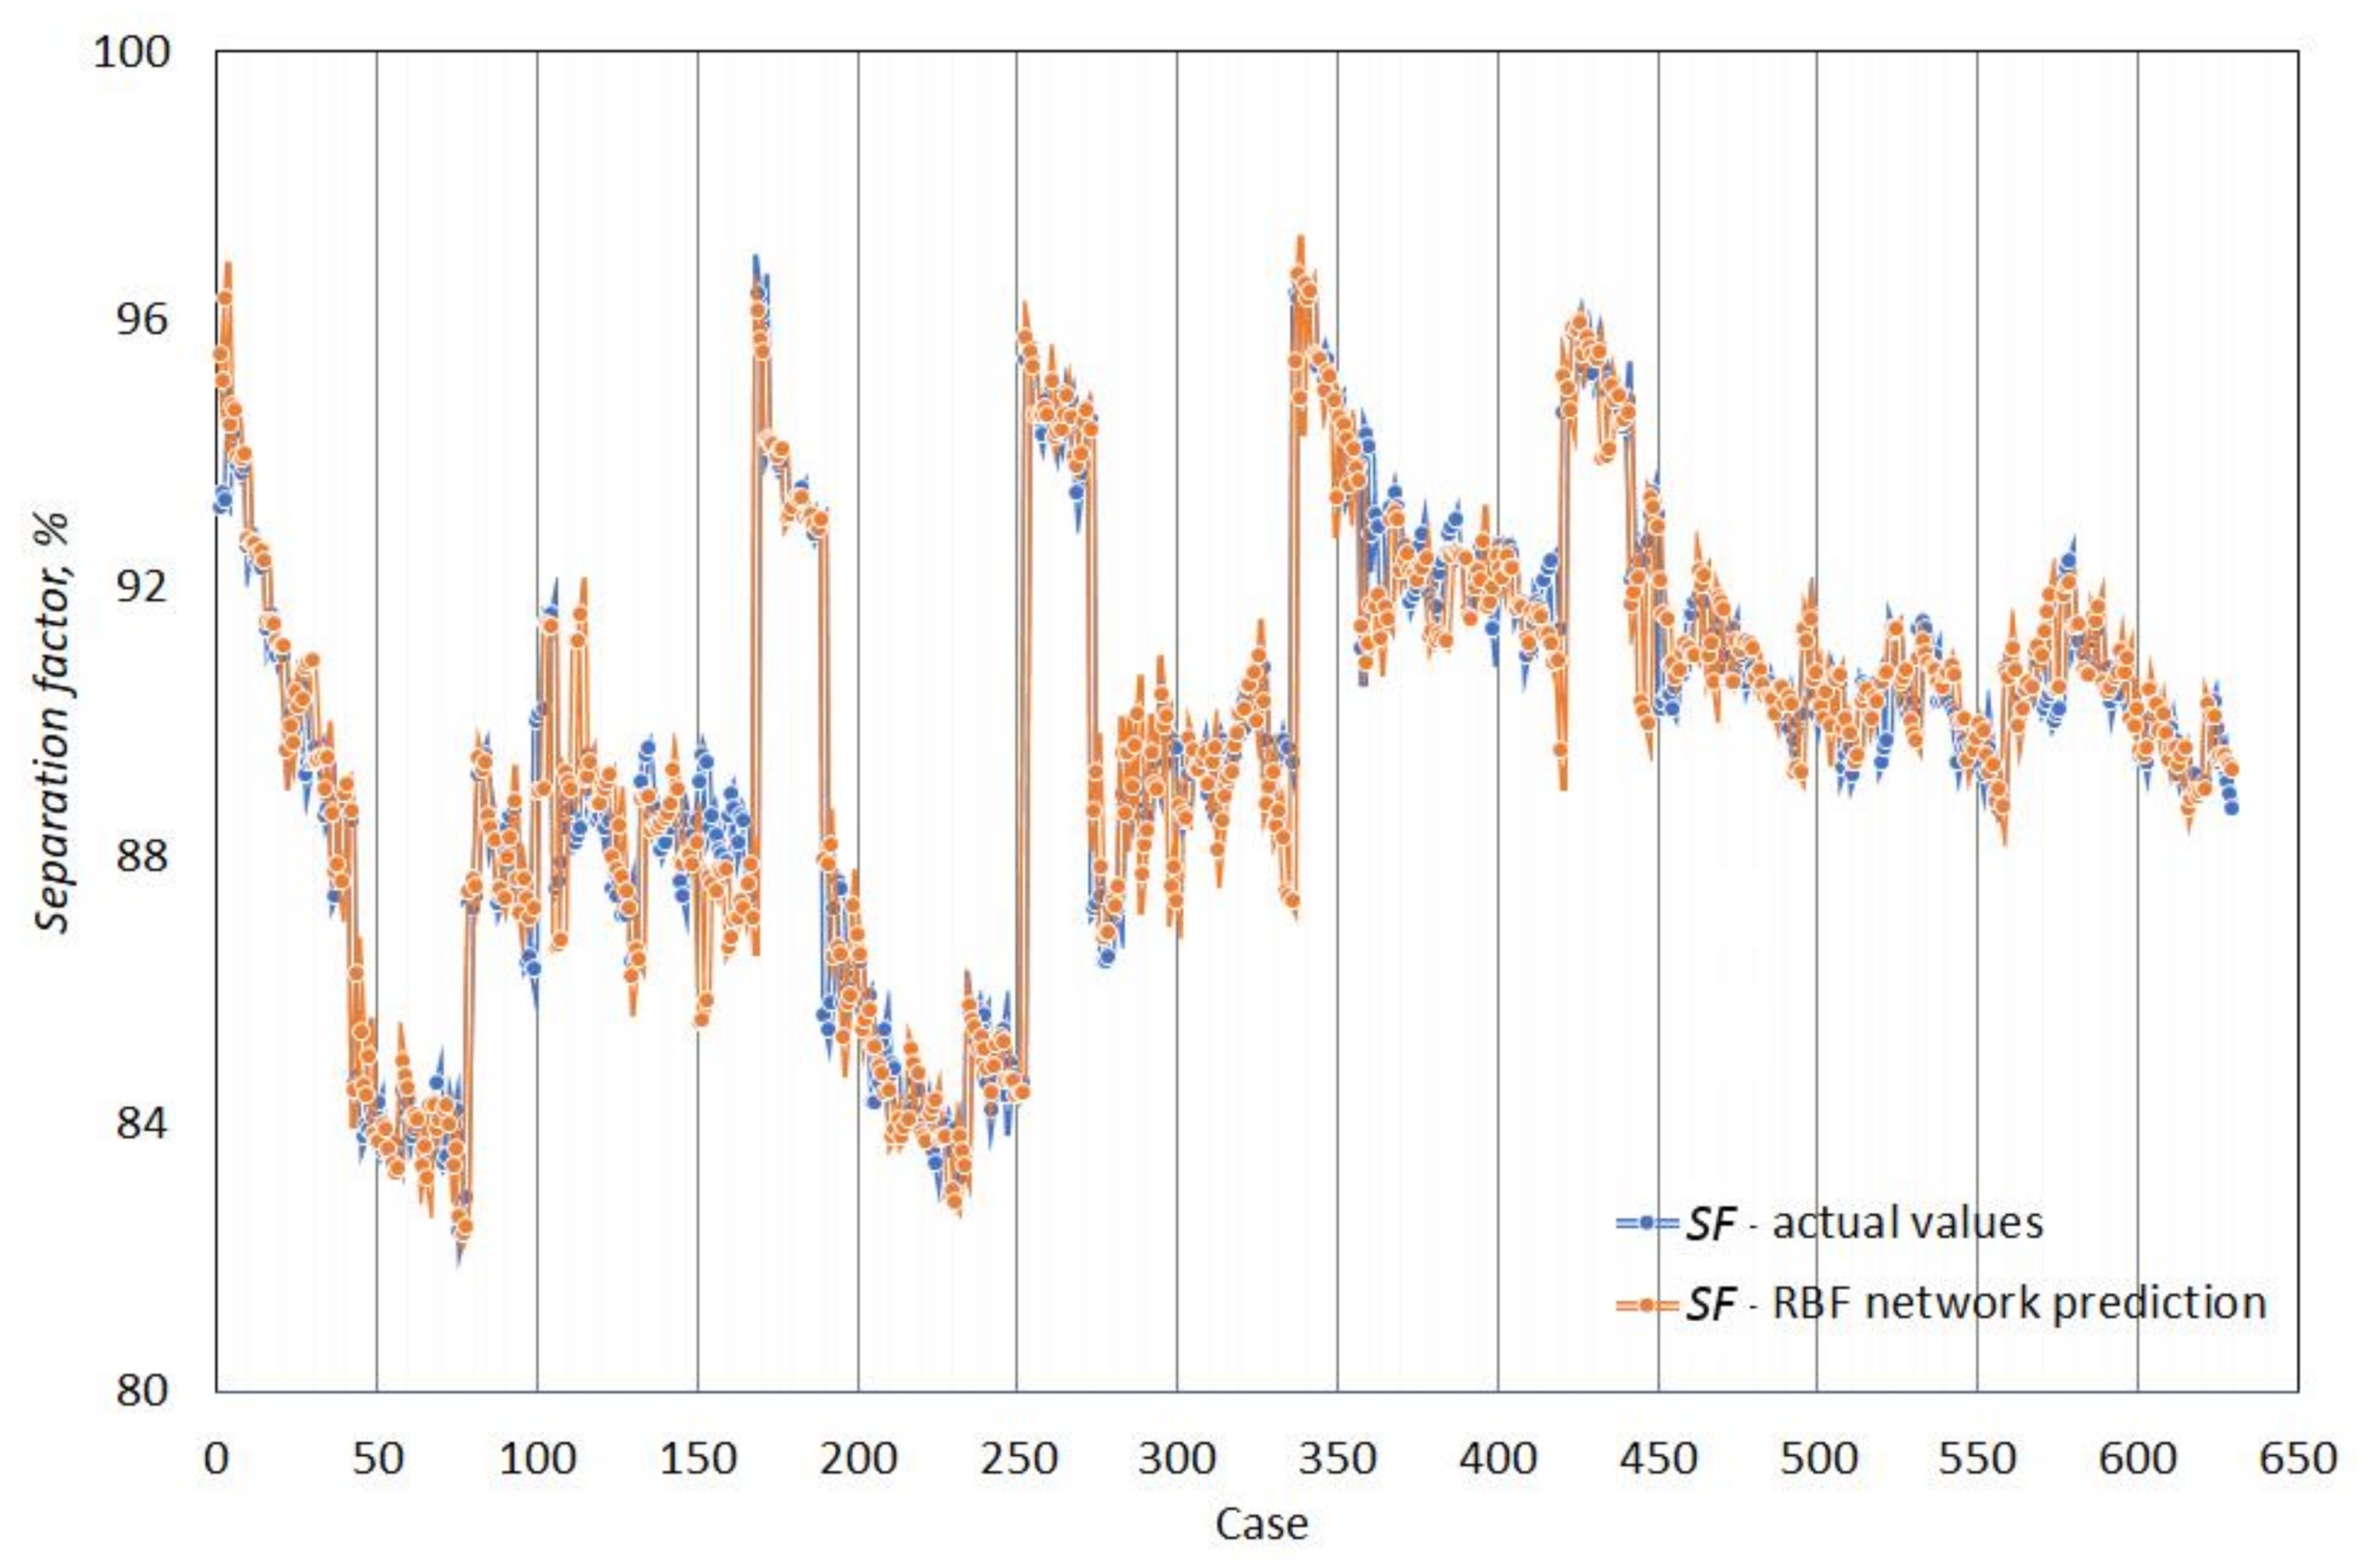
Figure 11 shows the degree of alignment of the neural network to real-life values. Analyzing the diagram below, some minor differences were found between the real-life values and the values forecasted by the networks. The high correlation coefficient for the output parameters of the neural network is confirmed in the diagram analyzed below.
Table 4 summarizes the parameters of the selected networks for comparison. Comparing the parameters of the created network, it was concluded that the value of the deviation (quality) quotient for the learning dataset was 0.1404 and indicated a good quality of the neural network model, and thus its high learning capability. In the analyzed case, the values obtained for the validation dataset (0.06637) and the test dataset (0.087312) were relatively low, which clearly indicates that the networks had no overlearning capability. The created neural network can be used as a tool for predicting the value of the output variable (separation factor).
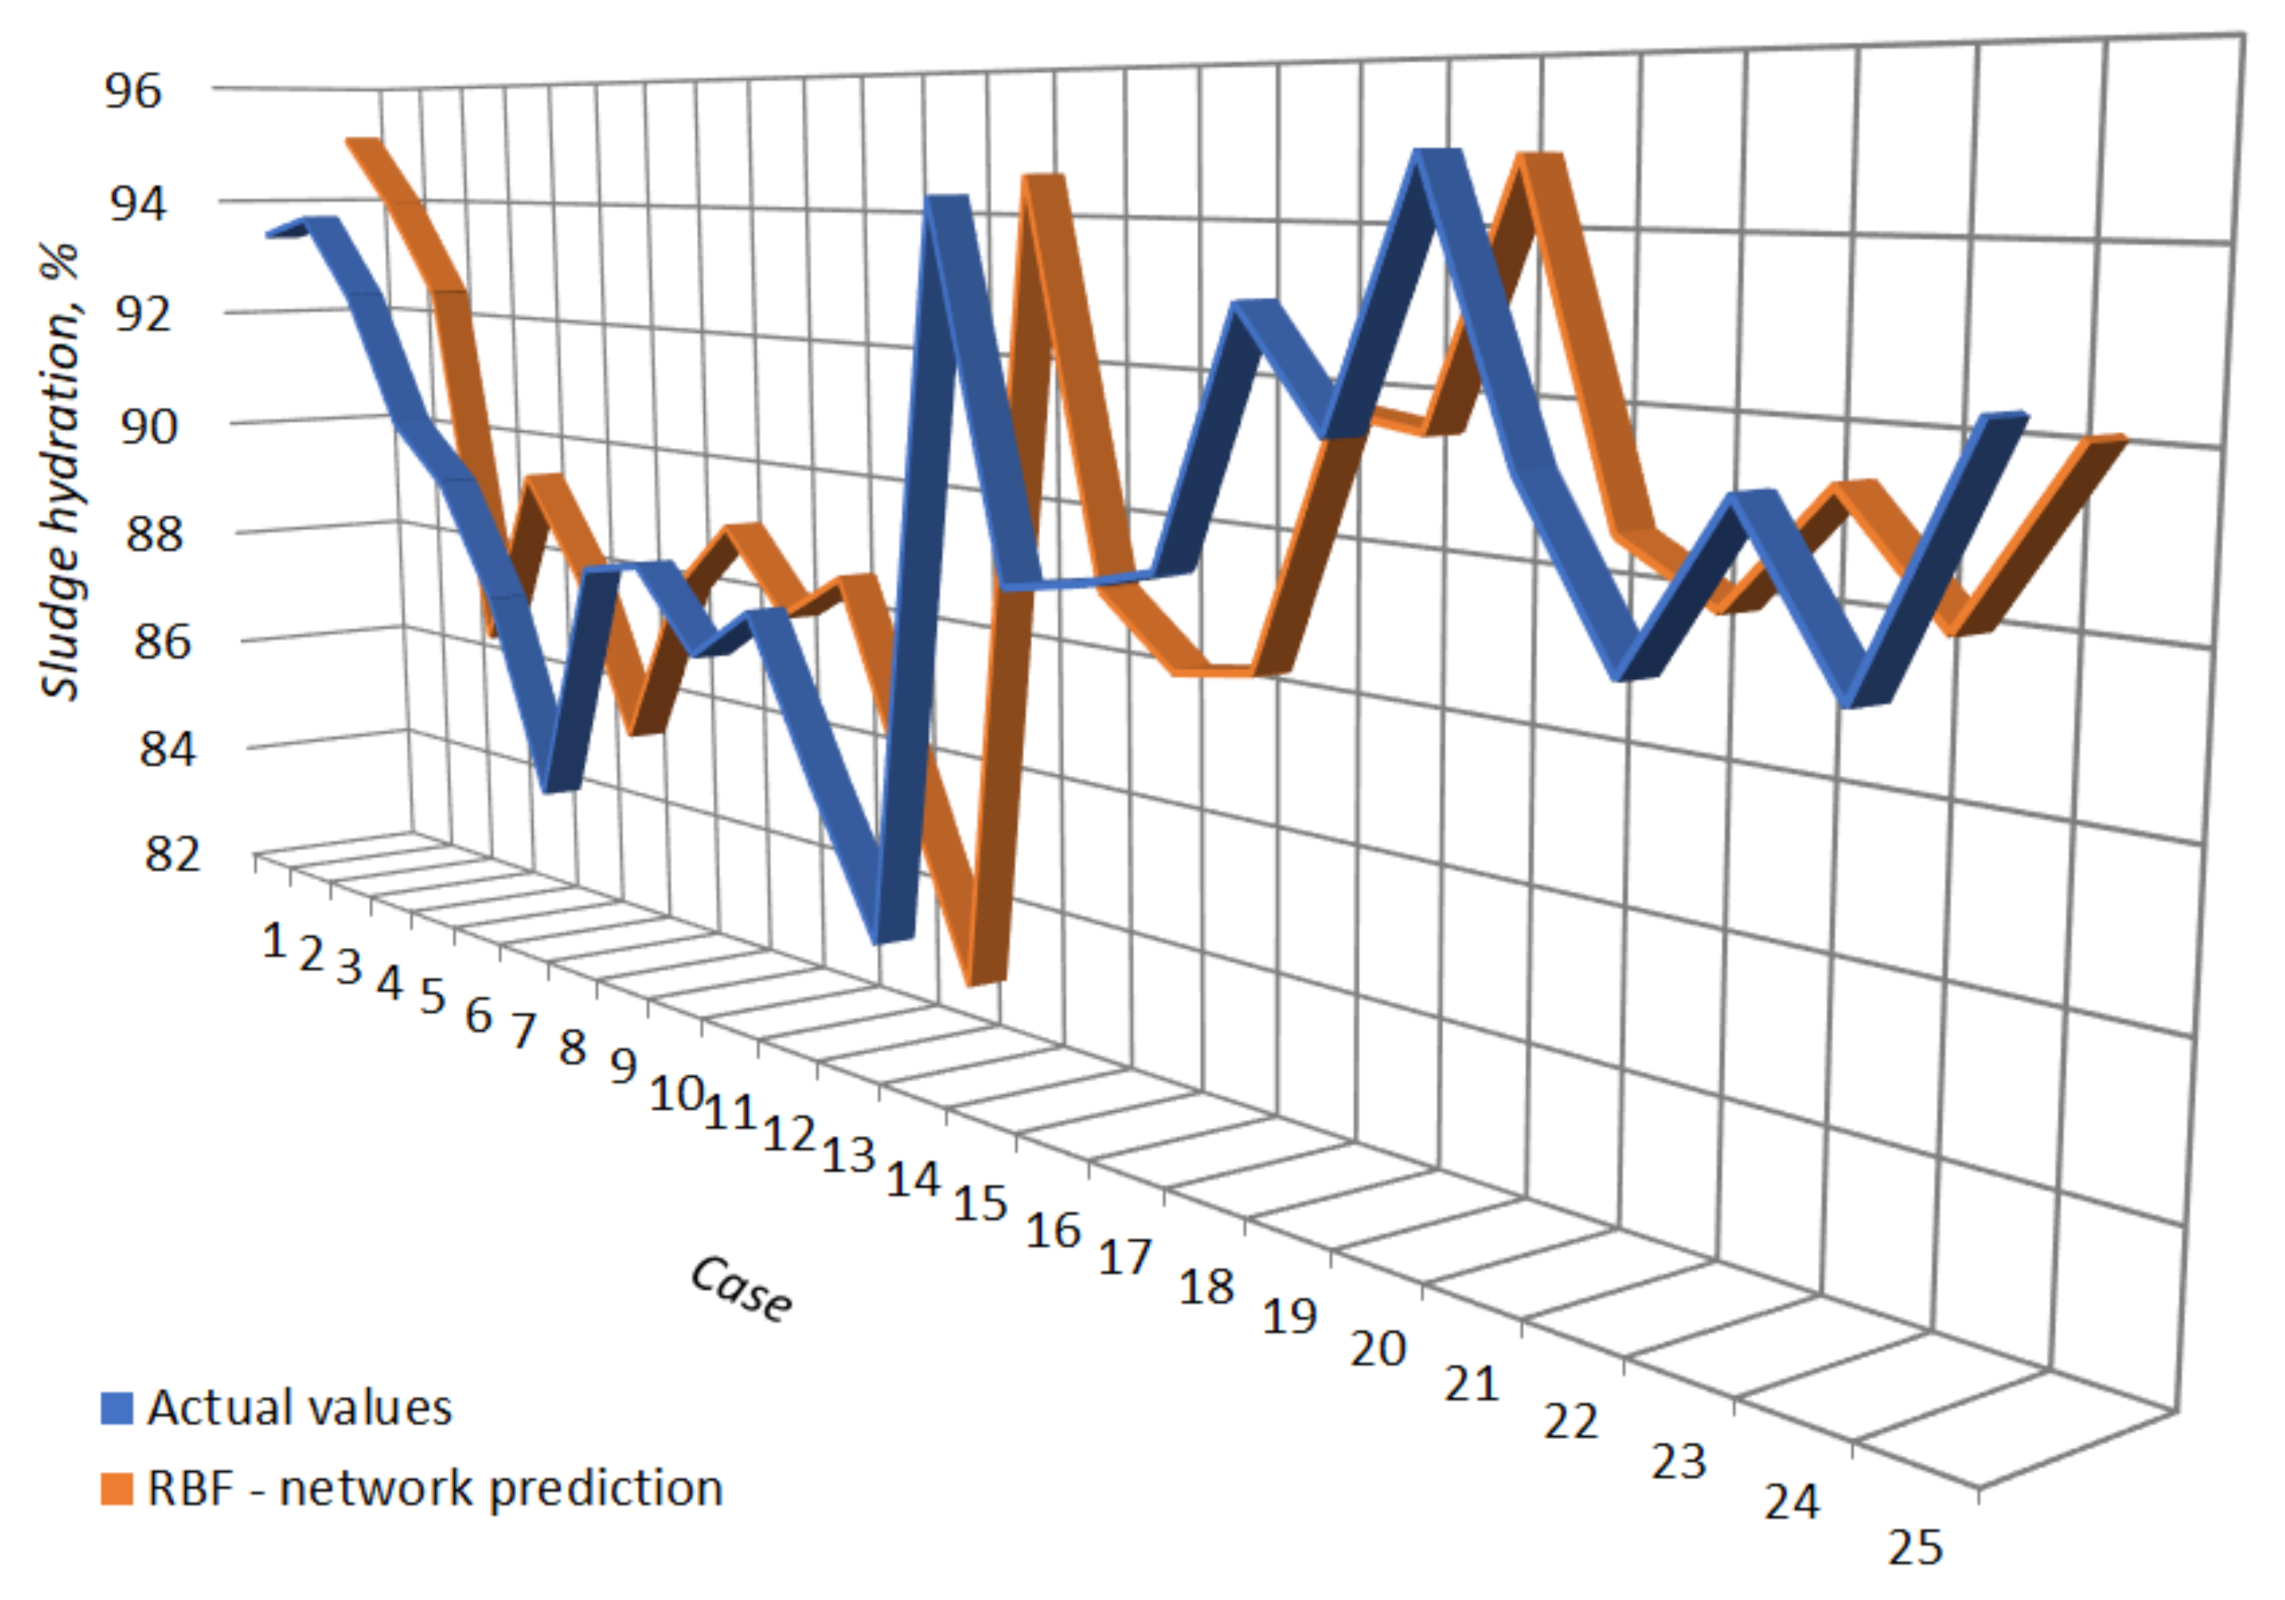
Table 5 and Figure 12 show the results of network tests, conducted on the test dataset containing 25 random cases. Analyzing the output parameters, it was concluded that the network was able to reliably forecast the values of the separation factor after centrifugation. In one case, the forecast of the discussed parameter value had an error of 4.2%. In other cases, the error of forecast of the separation factor value did not exceed 1.6%. After testing results modeling in the created network, it was concluded that the neural network can be an excellent tool for predicting the results of that parameter.
4. Discussion
According to previous studies [5,6,7,8,9,10], it was confirmed that the applied physical conditioning methods were useful in the dewatering of sludge. In the presented study, the increase in dewatering efficiency was achieved with the use of higher doses of physical conditioners or higher relative centrifugal force values. The most promising solution was the use of dual sludge conditioning based on the sonification–cement addition sequence. Combined conditioning methods, including dual and even multicomponent methods, are the subject of many studies [2,3]. Nevertheless, the combination of sonification–physical conditioner is of interest and requires further research. Due to the specificity of the presented studies, no extensive physical and chemical analysis was planned. The focus was on carrying out a number of dewatering tests based on a cause-and-effect relationship (i.e., the dewatering efficiency of the conditioning parameter function). A quantitatively large dataset was crucial for these studies.
In the development of the neural network model, only four conditioning parameters were selected as input variables (Figure 2). The resulting two networks (MLP and RBF) were characterized by high quality of prediction. Testing of the ANN models showed that the predicted final hydration and separation factor values were consistent with the actual values in over 90% of the tests. The key conclusion from the conducted research is the usefulness of ANN in the technology of sewage sludge. ANN can be useful in optimizing the dewatering process without real testing. However, the condition is that the conditioning method has to be tested to some extent, and the test results are the dataset used for ANN training. By using ANN and untested conditioning conditions, it is possible to obtain a highly reliable value of the output variable (drainage effects). A separate issue is the selection of appropriate input and output variables, the type of network, or the neural network learning algorithm. Therefore, there are further opportunities for the improvement and wider use of ANN in sludge management.
5. Conclusions
Based on the laboratory analysis and mathematical modeling with the use of artificial neural networks, the following conclusions were formulated:
The effective conditioning and dewatering of the sludge were influenced by the dose of the skeleton builders, the sonication parameters, and the value of the relative centrifugal force. The best results were obtained using: a dose of 3% of the dry mass of the sludge, 120 s sonication at an amplitude of 120 µm, and an overload of 7550 g.
Among the tested conditioning methods based on self-dosing of the skeleton builders (cement, gypsum, fly ash, liquid glass) or sonification, the dual and triple methods (combining conditioning agents), the dual method was the most effective.
The best dewatering efficiency was achieved by using dual conditioning, consisting of initial sonication of the sludge and then dosing of cement. This conditioning method reduced the hydration of the centrifugal dewatered sludge from about 98% to 83.2%, with a separation factor of 90%.
The dataset for training artificial neural networks included over 600 research cases. Each case was based on four input variables (dose of skeleton builders, time and amplitude of sonication, and relative centrifugal force) and two output variables (final sludge hydration after centrifugation or separation factor). Such a set made it possible to develop good-quality models (in terms of training, validation, and test) of MLP and RBF neural networks.
Based on the results of the prediction of artificial neural networks, it was found that these networks can be used to forecast the effectiveness of municipal sludge dewatering. The prediction error did not exceed 1.0% of the real value.
Author Contributions
M.K.: Conceptualization, Methodology, Software, Investigation, Validation, Data curation, Writing—original draft, Writing—review & editing, Visualization, Supervision. T.K.: Investigation, Validation, Data curation, Resources, Writing—review & editing. Both authors have read and agreed to the published version of the manuscript.
Funding
The scientific research was funded by the statute subvention of Czestochowa University of Technology, Faculty of Infrastructure and Environment.
Institutional Review Board Statement
Not applicable.
Informed Consent Statement
Not applicable.
Conflicts of Interest
The authors declare no conflict of interest. The funders had no role in the design of the study; in the collection, analyses, or interpretation of data; in the writing of the manuscript, or in the decision to publish the results.
References
- Skinner, S.; Studer, L.J.; Dixon, D.R.; Hillis, P.; Rees, C.A.; Wall, R.C.; Cavalida, R.G.; Usher, S.P.; Stickland, A.; Scales, P.J. Quantification of wastewater sludge dewatering. Water Res. 2015, 82, 2–13. [Google Scholar] [CrossRef]
- Mowla, D.; Tran, H.; Allen, D.G. A review of the properties of biosludge and its relevance to enhanced dewatering processes. Biomass Bioenergy 2013, 58, 365–378. [Google Scholar] [CrossRef]
- Qi, Y.; Thapa, K.B.; Hoadley, A.F. Application of filtration aids for improving sludge dewatering properties-A review. Chem. Eng. J. 2011, 171, 373–384. [Google Scholar] [CrossRef]
- Zhu, C.; Zhang, P.; Wang, H.; Ye, J. Conditioning of sewage sludge via combined ultrasonication-flocculation-skeleton building to improve sludge dewaterability. Ultrason. Sonochem. 2018, 40A, 353–360. [Google Scholar] [CrossRef]
- Zhao, Y.Q. Involvement of gypsum (CaSO4·2H2O) in water treatment sludge dewatering: A potential benefit in disposal and reuse. Sep. Sci Technol. 2006, 41, 2785–2794. [Google Scholar] [CrossRef] [Green Version]
- Chen, C.; Zhang, P.; Zeng, G.; Deng, J.; Zhou, Y.; Lu, H. Sewage sludge conditioning with coal fly ash modified by sulfuric acid. Chem. Eng. J. 2010, 158, 616–622. [Google Scholar] [CrossRef]
- Kowalczyk, M.; Kamizela, T. Sludge Dewatering: Processes for Enhanced Performance, Industrial and Municipal Sludge. Emerging Concerns and Scope for Resource Recovery; Prasad, M.N.V., Vithanage, M., Mohan, S.V., Eds.; Elsevier: Oxford, UK, 2019; pp. 399–423. [Google Scholar]
- Na, S.; Kim, Y.U.; Khim, J. Physiochemical properties of digested sludge with ultrasonic treatment. Ultrason Sonochem. 2007, 14, 281–285. [Google Scholar] [CrossRef]
- Zhang, P.; Zhang, G.; Wang, W. Ultrasonic treatment of biological sludge: Floc disintegration, cell lysis and inactivation. Bioresour. Technol. 2007, 98, 207–210. [Google Scholar] [CrossRef] [PubMed]
- Chu, C.P.; Chang, B.V.; Liao, G.S.; Jean, D.S.; Lee, D.J. Observations on changes in ultrasonically treatedwaste-activated sludge. Water Res. 2001, 35, 1038–1046. [Google Scholar] [CrossRef]
- Chu, C.P.; Lee, D.J. Experimental analysis of centrifugal dewatering process of polyelectrolyte flocculated waste activated sludge. Water Res. 2001, 35, 2377–2384. [Google Scholar] [CrossRef]
- Rutkowski, L. Methods and Techniques of Artificial Intelligence; Wydawnictwo Naukowe PWN: Warszawa, Poland, 2005. (In Polish) [Google Scholar]
- Livingstone, D.J. (Ed.) Artificial Neural Networks, Methods and Applications; Humana Press: Totowa, NJ, USA, 2008. [Google Scholar]
- Wu, Y.C.; Feng, J.W. Development and Application of Artificial Neural Network. Wireless Pers. Commun. 2018, 102, 1645–1656. [Google Scholar] [CrossRef]
- McCulloch, W.S.; Pitts, W. A logical calculus of the ideas immanent in nervous activity. Bull. Math. Biophys. 1943, 5, 115–133. [Google Scholar] [CrossRef]
- Li, H.; Zhang, Z.; Zhao, Z.Z. Data-Mining for Processes in Chemistry, Materials, and Engineering. Processes 2019, 7, 151. [Google Scholar] [CrossRef] [Green Version]
- Li, H.; Zhang, Z.; Liu, Z. Application of Artificial Neural Networks for Catalysis: A Review. Catalysts 2017, 7, 306. [Google Scholar] [CrossRef]
- Di Benedetto, R.M.; Botelho, E.C.; Janotti, A.; Ancelotti Junior, A.C.; Gomes, G.F. Development of an artificial neural network for predicting energy absorption capability of thermoplastic commingled composites. Compos. Struct. 2021, 257, 113131. [Google Scholar] [CrossRef]
- Chojaczyk, A.A.; Teixeira, A.P.; Neves, L.C.; Cardoso, J.B.; Guedes Soares, C. Review and application of Artificial Neural Networks models in reliability analysis of steel structures. Struct. Saf. 2015, 52, 78–89. [Google Scholar] [CrossRef]
- Parmar, J.G.; Dave, K.G.; Gohil, A.V.; Trivedi, H.S. Prediction of end milling process parameters using artificial neural network. Mater. Today Proc. 2020, in press. [Google Scholar] [CrossRef]
- Lee, D.S.; Jeon, C.O.; Park, J.M.; Chang, K.S. Hybrid neural network modeling of full-scale industrial wastewater treatment process. Biotechnol. Bioeng. 2002, 78, 670–682. [Google Scholar] [CrossRef] [PubMed]
- Cinar, O.; Hasar, H.; Kinaci, C. Modeling of submerged membrane bioreactor by artificial neural network. J. Biotechnol. 2006, 123, 204–209. [Google Scholar] [CrossRef] [PubMed]
- Nasr, M.S.; Moustafa, M.A.E.; Seif, H.A.E.; Kobrosy, G.E. Application of Artificial Neural Network (ANN) for the prediction of EL-AGAMY wastewater treatment plant performance-EGYPT. Alex. Eng. J. 2012, 51, 37–43. [Google Scholar] [CrossRef] [Green Version]
- Hassen, E.B.; Asmare, A.M. Artificial neural networks application to monitor brewery wastewater treatment plant efficiency based on water assurance quality. Chem. Int. 2019, 5, 87–96. [Google Scholar]
- Kujawa, S.; Mazurkiewicz, J.; Czekała, W. Using convolutional neural networks to classify the maturity of compost based on sewage sludge and rapeseed straw. J. Clean. Prod. 2020, 258, 120814. [Google Scholar] [CrossRef]
- Chen, Y.; Song, L.; Liu, Y.; Yang, L.; Li, D. A Review of the Artificial Neural Network Models for Water Quality Prediction. Appl. Sci. 2020, 10, 5776. [Google Scholar] [CrossRef]
- Kulkarni, M.V.; Deshmukh, D.S.; Shekhawat, S.P. An innovative design approach of hot water storage tank for solar water heating system using artificial neural network. Mater. Today Proc. 2020. [Google Scholar] [CrossRef]
- Chen, H.; Fu, Q.; Liao, Q.; Zhu, X.; Shah, A. Applying artificial neural network to predict the viscosity of microalgae slurry in hydrothermal hydrolysis process. Energy AI 2021, 4, 100053. [Google Scholar] [CrossRef]
- Al-Naji, A.; Fakhri, A.B.; Gharghan, S.K.; Chahl, J. Soil color analysis based on a RGB camera and an artificial neural network towards smart irrigation: A pilot study. Heliyon 2021, 7, e06078. [Google Scholar] [CrossRef]
- APHA. Standard Methods for the Examination of Water and Wastewater, 21st ed.; American Public Health Association; American Water Works Association; Water Environment Federation: Washington, DC, USA, 2005. [Google Scholar]

Figure 2.
General scheme of the ANN for modeling dewatering efficiency.

Figure 3.
Research scheme.

Figure 4.
The influence of the conditioning method on the dewatering effects of sewage sludge.

Figure 5.
The influence of conditioning method and centrifugal force on the dewatering effects of sewage sludge.
Figure 5.
The influence of conditioning method and centrifugal force on the dewatering effects of sewage sludge.

Figure 6.
The influence of the conditioning method and component dose on the effects of dewatering sewage sludge.
Figure 6.
The influence of the conditioning method and component dose on the effects of dewatering sewage sludge.

Figure 7.
Diagram of two variants of neural networks, MLP (a) and RBF (b), using the sludge conditioning process parameters as the input vectors, and the end water content as the output vector.
Figure 7.
Diagram of two variants of neural networks, MLP (a) and RBF (b), using the sludge conditioning process parameters as the input vectors, and the end water content as the output vector.

Figure 8.
Comparison of the actual water content values with the values forecasted by the MLP and RBF network.
Figure 8.
Comparison of the actual water content values with the values forecasted by the MLP and RBF network.

Figure 9.
Graphic presentation of the results of tests of MLP and RBF neural networks for predicting the end water content.
Figure 9.
Graphic presentation of the results of tests of MLP and RBF neural networks for predicting the end water content.

Figure 10.
Neural network schematic: RBF, using the sludge conditioning process parameters as the input vectors, and the separation factor as the output vector.
Figure 10.
Neural network schematic: RBF, using the sludge conditioning process parameters as the input vectors, and the separation factor as the output vector.

Figure 11.
Comparison of the actual water content values with the values forecasted by the RBF network.
Figure 11.
Comparison of the actual water content values with the values forecasted by the RBF network.

Figure 12.
Graphic presentation of the results of the RBF neural network tests for predicting the separation factor.
Figure 12.
Graphic presentation of the results of the RBF neural network tests for predicting the separation factor.


Table 1.
Parameters of the ultrasonic disintegrators used.
| Ultrasonic Disintegrator | Power, W | Frequency, kHz | Maximum Amplitude, µm | Sonication, Applied Amplitude, µm | Sonication Time, s | |
|---|---|---|---|---|---|---|
| UP 400 S | UD 1 | 400 | 20 | 90 | 45.90 | 20, 30, 40, 60, 90, 120 |
| VCX 134 | UD 2 | 130 | 40 | 120 | 60.120 | |
| VC 750 | UD 3 | 750 | 20 | 61 | 30.61 | |
Table 2.
Summary of parameters for the analyzed neural networks: MLP and RBF.
| ANN Parameters | MLP | RBF |
|---|---|---|
| Type | MLP 6:20–5-1:1 | RBF 7:21–57–1:1 |
| Quality for the learning dataset | 0.355271 | 0.322423 |
| Quality for the validation dataset | 0.215901 | 0.206959 |
| Quality for the test dataset | 0.219473 | 0.203221 |
| Error for the learning dataset | 0.059430 | 0.118578 |
| Error for the validation dataset | 0.034089 | 0.072439 |
| Error for the test dataset | 0.034617 | 0.069828 |
| Learning algorithms | BP100, CG20, CG 83b | SS, KN, PI |
| Correlation | 0.95 | 0.96 |
BP–backpropagation algorithm, CG–conjugate gradient methods, SS–sampling method, KN–K–medium method, PI–PI controller.
Table 3.
Summary of the results of tests of MLP and RBF neural networks for predicting the end water content.
Table 3.
Summary of the results of tests of MLP and RBF neural networks for predicting the end water content.
| Case | rcf | Conditioning | Sonication Time, s | Amplitude, µm | Dose, g | Real Value | MLP Network Forecast | RBF Network Forecast | |||
|---|---|---|---|---|---|---|---|---|---|---|---|
| SF, % | SH, % | SH, % | Error, % | SH, % | Error, % | ||||||
| 1 | 6040 | 0 | 0 | - | 93.4 | 93.3 | 93.1 | 0.1 | 93.0 | 0.3 | |
| 2 | 6040 | UD | 90 | 60 | - | 93.7 | 92.4 | 92.0 | 0.5 | 92.5 | 0.1 |
| 3 | 6040 | UD | 60 | 120 | - | 92.4 | 92.7 | 92.5 | 0.2 | 92.6 | 0.1 |
| 4 | 6040 | LG + C | 0 | 0 | 0.5 | 90.3 | 86.6 | 89.3 | 3.0 | 89.4 | 3.2 |
| 5 | 6040 | LG + G | 0 | 0 | 0.5 | 89.4 | 88.6 | 88.0 | 0.6 | 88.4 | 0.2 |
| 6 | 6040 | A | 0 | 0 | 0.5 | 87.6 | 88.4 | 90.0 | 1.8 | 90.3 | 2.1 |
| 7 | 6040 | UD + A | 60 | 60 | 0.5 | 84.6 | 88.0 | 87.5 | 0.5 | 88.1 | 0.2 |
| 8 | 6040 | UD + C | 90 | 120 | 0.5 | 88.4 | 84.8 | 85.6 | 0.9 | 85.3 | 0.5 |
| 9 | 6040 | UD + LG + C | 120 | 60 | 0.5 | 88.6 | 84.2 | 84.9 | 0.8 | 84.5 | 0.3 |
| 10 | 6040 | UD + LG+ A | 90 | 120 | 0.5 | 87.4 | 84.9 | 85.3 | 0.5 | 84.8 | 0.1 |
| 11 | 6040 | UD +LG + G | 90 | 120 | 0.5 | 88.2 | 86.8 | 86.1 | 0.8 | 86.8 | 0.0 |
| 12 | 4530 | UD + A | 40 | 30 | 0.5 | 85.9 | 89.9 | 90.1 | 0.2 | 90.4 | 0.5 |
| 13 | 4530 | UD + G | 40 | 60 | 0.5 | 83.8 | 89.1 | 89.3 | 0.3 | 89.4 | 0.4 |
| 14 | 6040 | UD | 20 | 30 | - | 94.3 | 93.0 | 92.6 | 0.4 | 93.3 | 0.3 |
| 15 | 6040 | UD + A | 40 | 30 | 0.5 | 89.2 | 88.6 | 88.3 | 0.3 | 88.5 | 0.1 |
| 16 | 6040 | UD + G | 40 | 60 | 0.5 | 89.4 | 86.9 | 87.4 | 0.5 | 87.4 | 0.6 |
| 17 | 6040 | UD + C | 40 | 60 | 0.5 | 89.7 | 86.8 | 86.6 | 0.2 | 86.8 | 0.1 |
| 18 | 7550 | A | 0 | 0 | 0.5 | 93.1 | 87.1 | 88.5 | 1.6 | 88.8 | 2.0 |
| 19 | 7550 | UD + C | 20 | 60 | 0.5 | 91.6 | 84.9 | 85.7 | 1.0 | 85.1 | 0.3 |
| 20 | 7550 | UD | 60 | 120 | - | 94.9 | 90.8 | 91.3 | 0.6 | 90.7 | 0.1 |
| 21 | 7550 | UD + A | 60 | 60 | 0.25 | 91.4 | 88.2 | 87.4 | 0.9 | 87.2 | 1.2 |
| 22 | 7550 | UD + A | 60 | 60 | 0.75 | 89.3 | 85.7 | 85.3 | 0.5 | 85.7 | 0.0 |
| 23 | 7550 | UD + C | 30 | 60 | 0.25 | 91.4 | 86.4 | 86.8 | 0.5 | 86.7 | 0.4 |
| 24 | 7550 | UD + C | 60 | 60 | 0.5 | 89.4 | 85.8 | 85.2 | 0.6 | 85.7 | 0.1 |
| 25 | 7550 | UD + G | 30 | 60 | 0.25 | 92.4 | 87.9 | 87.6 | 0.3 | 87.3 | 0.7 |
Table 4.
Summary of parameters for the RBF neural network.
| ANN Parameters | RBF |
|---|---|
| Type | RBF 7:21–151–1:1 |
| Quality for the learning dataset | 0.140401 |
| Quality for the validation dataset | 0.250827 |
| Quality for the test dataset | 0.306424 |
| Error for the learning dataset | 0.042594 |
| Error for the validation dataset | 0.066379 |
| Error for the test dataset | 0.087312 |
| Learning algorithms | SS, KN, PI |
| Correlation | 0.98 |
SS–sampling method, KN–K–medium method, PI–PI controller.
Table 5.
Summary of the results of tests of RBF neural networks for predicting the SF value.
| Case | rcf | Conditioning | Sonication time, s | Amplitude, µm | Dose, g | Real Value | RBF Network Forecast | ||
|---|---|---|---|---|---|---|---|---|---|
| SH, % | SF, % | SF, % | Error, % | ||||||
| 1 | 6040 | - | - | - | - | 93.3 | 93.4 | 95.1 | 1.8 |
| 2 | 6040 | UD | 90 | 60 | - | 92.4 | 93.7 | 93.9 | 0.2 |
| 3 | 6040 | UD | 60 | 120 | - | 92.7 | 92.4 | 92.4 | 0.0 |
| 4 | 6040 | LG + C | 0 | 0 | 0.5 | 86.6 | 90.3 | 86.5 | 4.2 |
| 5 | 6040 | LG + G | 0 | 0 | 0.5 | 88.6 | 89.4 | 89.4 | 0.0 |
| 6 | 6040 | A | 0 | 0 | 0.5 | 88.4 | 87.6 | 87.9 | 0.3 |
| 7 | 6040 | UD + A | 60 | 60 | 0.5 | 88.0 | 84.6 | 85.4 | 0.9 |
| 8 | 6040 | UD + C | 90 | 120 | 0.5 | 84.8 | 88.4 | 88.0 | 0.5 |
| 9 | 6040 | UD + LG +C | 120 | 60 | 0.5 | 84.2 | 88.6 | 89.1 | 0.5 |
| 10 | 6040 | UD + LG + A | 90 | 120 | 0.5 | 84.9 | 87.4 | 87.9 | 0.5 |
| 11 | 6040 | UD + LG + G | 90 | 120 | 0.5 | 86.8 | 88.2 | 88.6 | 0.4 |
| 12 | 4530 | UD + A | 40 | 30 | 0.5 | 89.9 | 85.9 | 85.7 | 0.2 |
| 13 | 4530 | UD + G | 40 | 60 | 0.5 | 89.1 | 83.8 | 82.9 | 1.0 |
| 14 | 6040 | UD | 20 | 30 | 0 | 93.0 | 94.3 | 94.6 | 0.3 |
| 15 | 6040 | UD + A | 40 | 30 | 0.5 | 88.6 | 89.2 | 89.0 | 0.2 |
| 16 | 6040 | UD + G | 40 | 60 | 0.5 | 86.9 | 89.4 | 88.1 | 1.5 |
| 17 | 6040 | UD + C | 40 | 60 | 0.5 | 86.8 | 89.7 | 88.3 | 1.6 |
| 18 | 7550 | A | 0 | 0 | 0.5 | 87.1 | 93.1 | 91.7 | 1.5 |
| 19 | 7550 | UD + C | 20 | 60 | 0.5 | 84.9 | 91.6 | 91.6 | 0.0 |
| 20 | 7550 | UD | 60 | 120 | 0 | 90.8 | 94.9 | 94.9 | 0.0 |
| 21 | 7550 | UD + A | 60 | 60 | 0.25 | 88.2 | 91.4 | 90.6 | 0.9 |
| 22 | 7550 | UD + A | 60 | 60 | 0.75 | 85.7 | 89.3 | 89.9 | 0.7 |
| 23 | 7550 | UD + C | 30 | 60 | 0.25 | 86.4 | 91.4 | 91.4 | 0.0 |
| 24 | 7550 | UD + C | 60 | 60 | 0.5 | 85.8 | 89.4 | 90.0 | 0.7 |
| 25 | 7550 | UD + G | 30 | 60 | 0.25 | 87.9 | 92.4 | 92.1 | 0.3 |
Publisher’s Note: MDPI stays neutral with regard to jurisdictional claims in published maps and institutional affiliations. |
© 2021 by the authors. Licensee MDPI, Basel, Switzerland. This article is an open access article distributed under the terms and conditions of the Creative Commons Attribution (CC BY) license (http://creativecommons.org/licenses/by/4.0/).
Share and Cite
MDPI and ACS Style
Kowalczyk, M.; Kamizela, T. Artificial Neural Networks in Modeling of Dewaterability of Sewage Sludge. Energies 2021, 14, 1552. https://0-doi-org.brum.beds.ac.uk/10.3390/en14061552
AMA Style
Kowalczyk M, Kamizela T. Artificial Neural Networks in Modeling of Dewaterability of Sewage Sludge. Energies. 2021; 14(6):1552. https://0-doi-org.brum.beds.ac.uk/10.3390/en14061552
Chicago/Turabian StyleKowalczyk, Mariusz, and Tomasz Kamizela. 2021. "Artificial Neural Networks in Modeling of Dewaterability of Sewage Sludge" Energies 14, no. 6: 1552. https://0-doi-org.brum.beds.ac.uk/10.3390/en14061552
Note that from the first issue of 2016, this journal uses article numbers instead of page numbers. See further details here.