
Anaerobic Co-Digestion of Tannery and Slaughterhouse Wastewater for Solids Reduction and Resource Recovery: Effect of Sulfate Concentration and Inoculum to Substrate Ratio

 , , ,
, , ,  and
and
Abstract
:Highlights
- Tannery effluent characteristics exhibited significant batch to batch variability
- Inhibition was seemingly caused by , and S, respectively
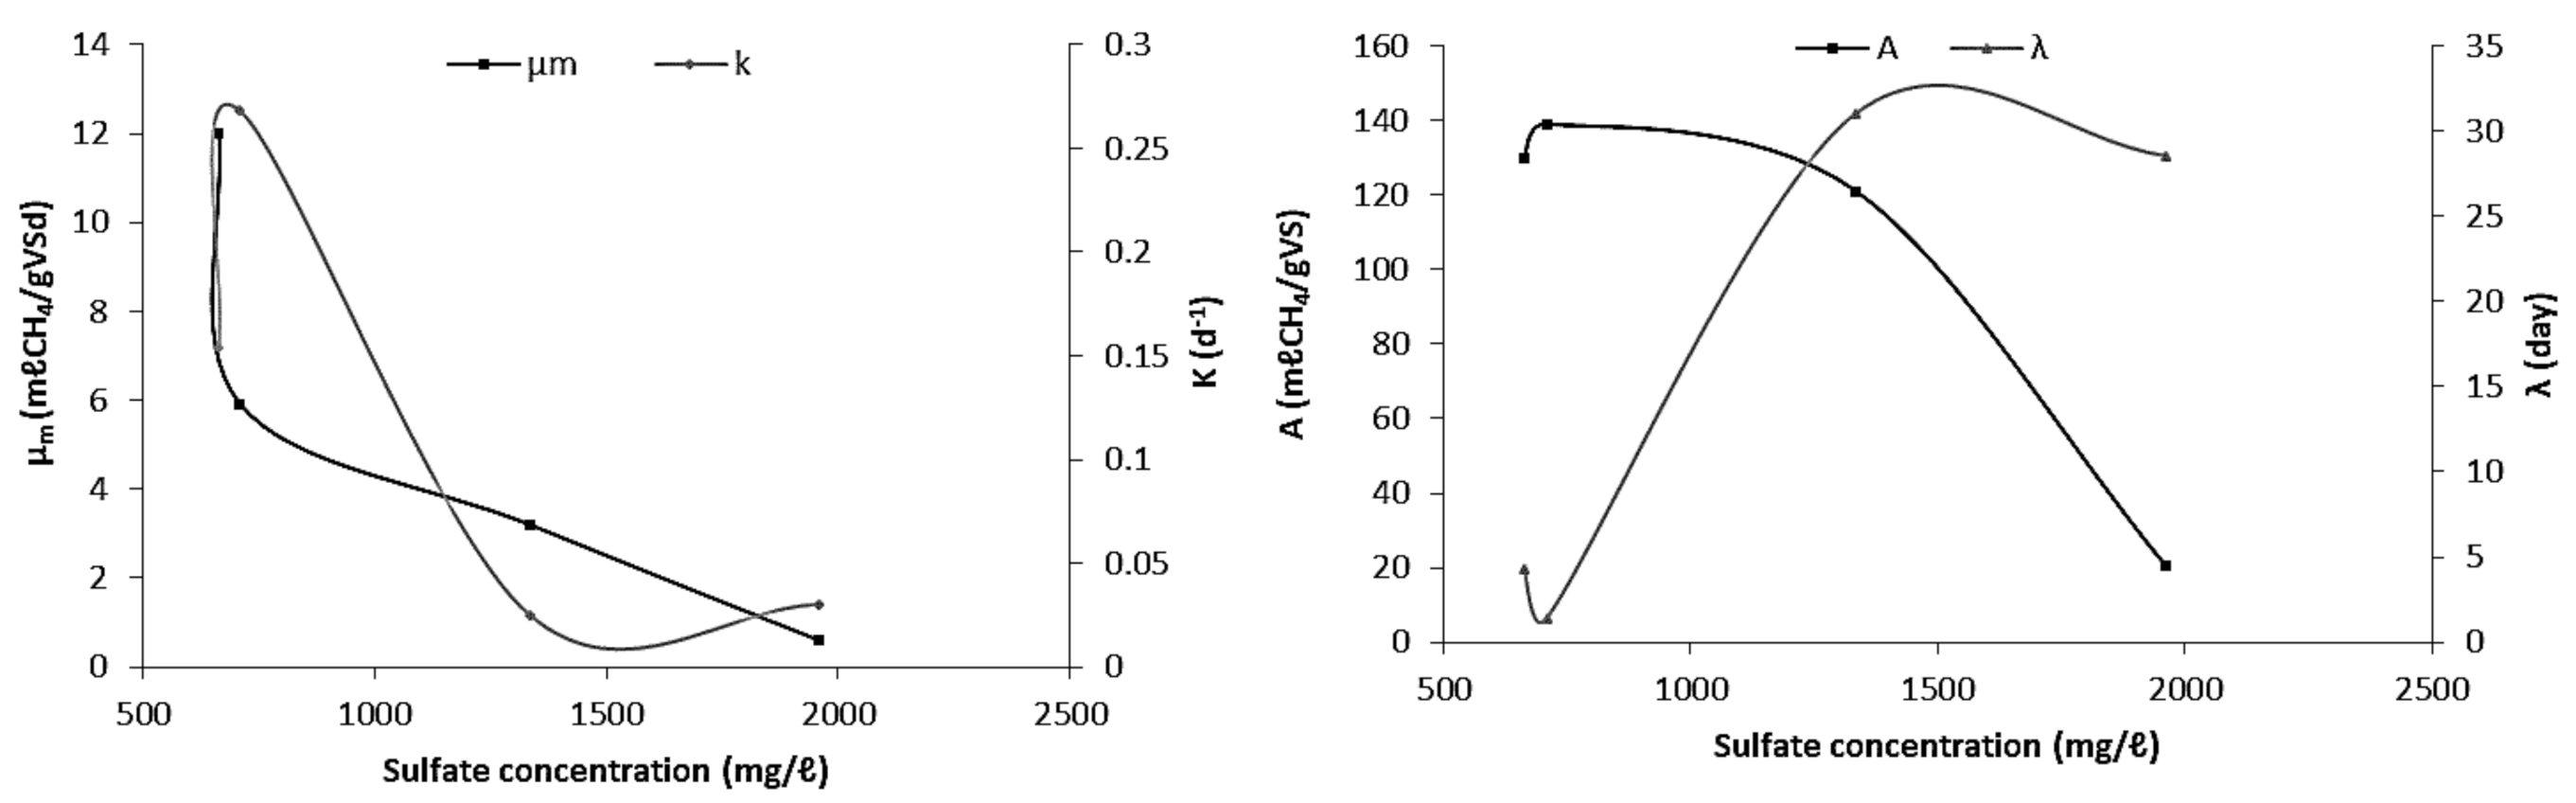
- The inhibitory effect of led to a significant decrease in A, µm, and K
- Process recovered , , and reusable water e.g for irrigation and construction
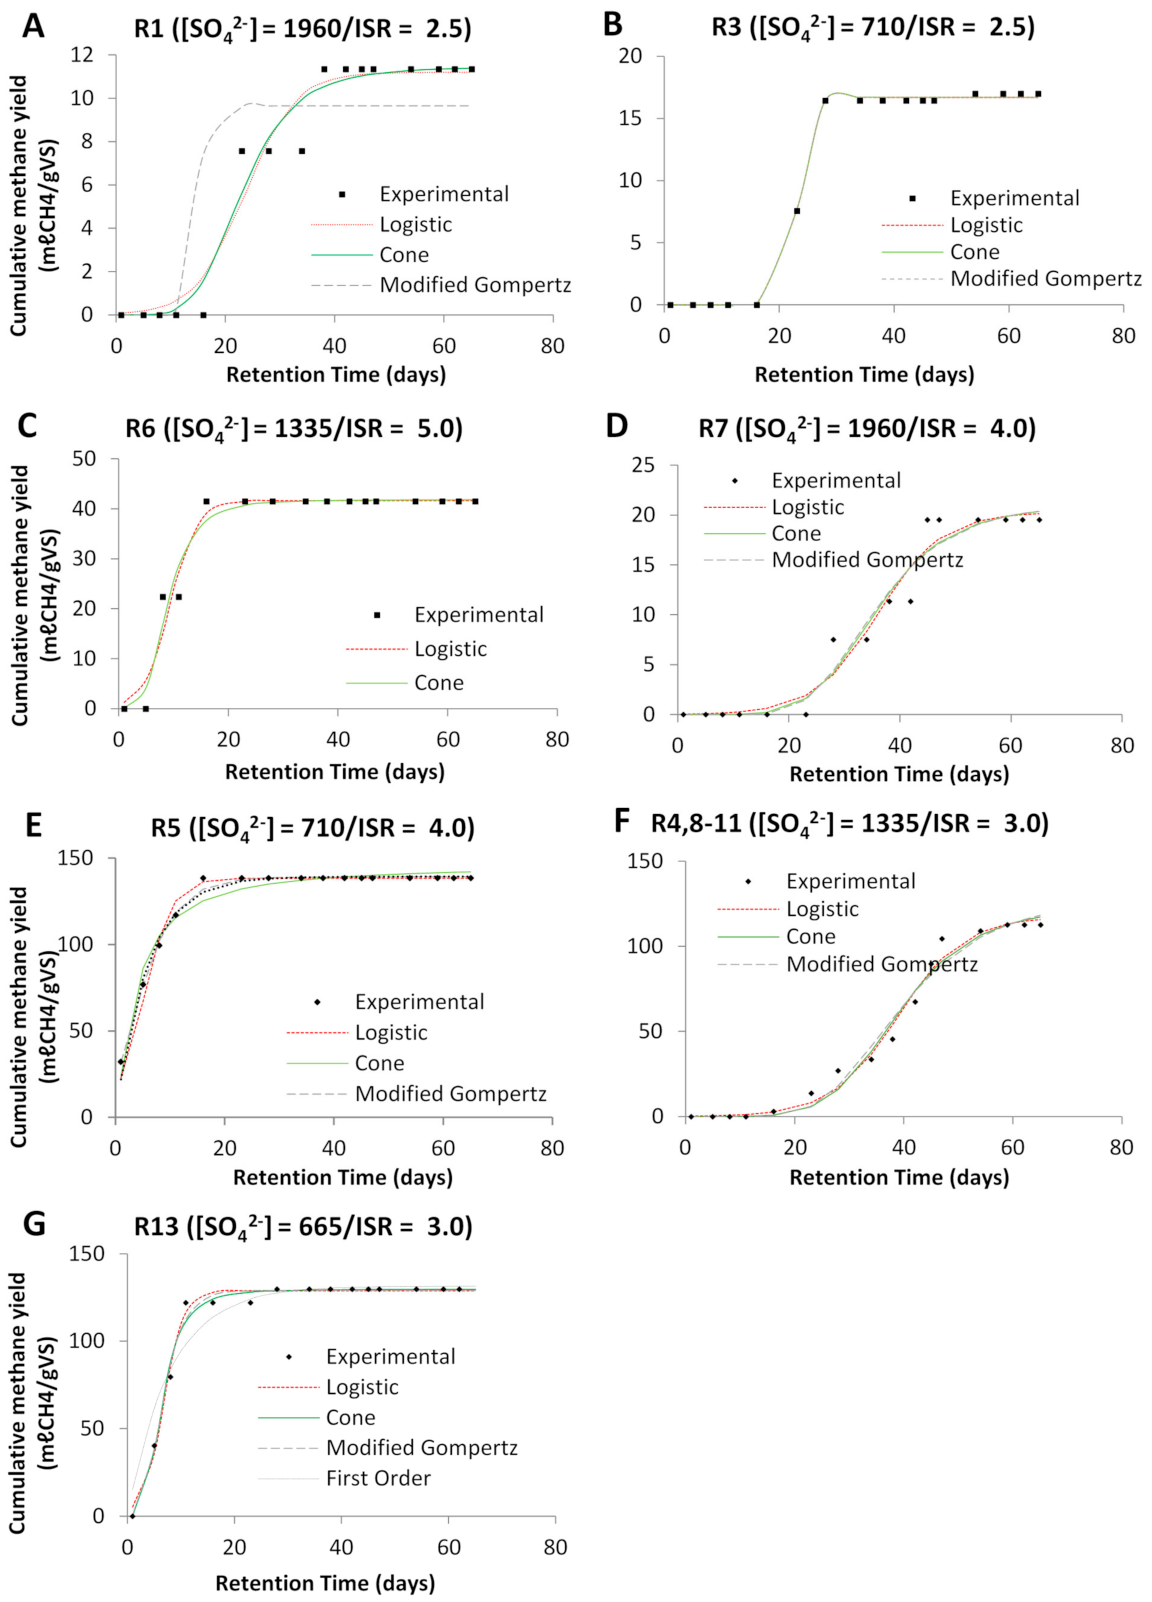
- Models perfectly fitted in the order Logistic > Cone > modified Gompertz > first order
1. Introduction
2. Materials and Methods
2.1. Sampling
2.2. Analytical Methods
2.3. Biomethane Potential Experiments
Biogas Sampling and Analysis
3. Results and Discussion
3.1. Characteristics of Ostrich Tannery Effluent
3.1.1. Chemical and Biological Oxygen Demand and Solids Concentrations in the Ostrich Tannery Effluent
3.1.2. Concentration of Nitrogen, Carbon and Volatile Organic Acids in the Ostrich Tannery Effluent
3.1.3. Inorganic Characteristics of Ostrich Tannery Effluents
3.1.4. Metal Characteristics of Ostrich Tannery Wastewater
3.2. Biochemical Methane Potential Experiments
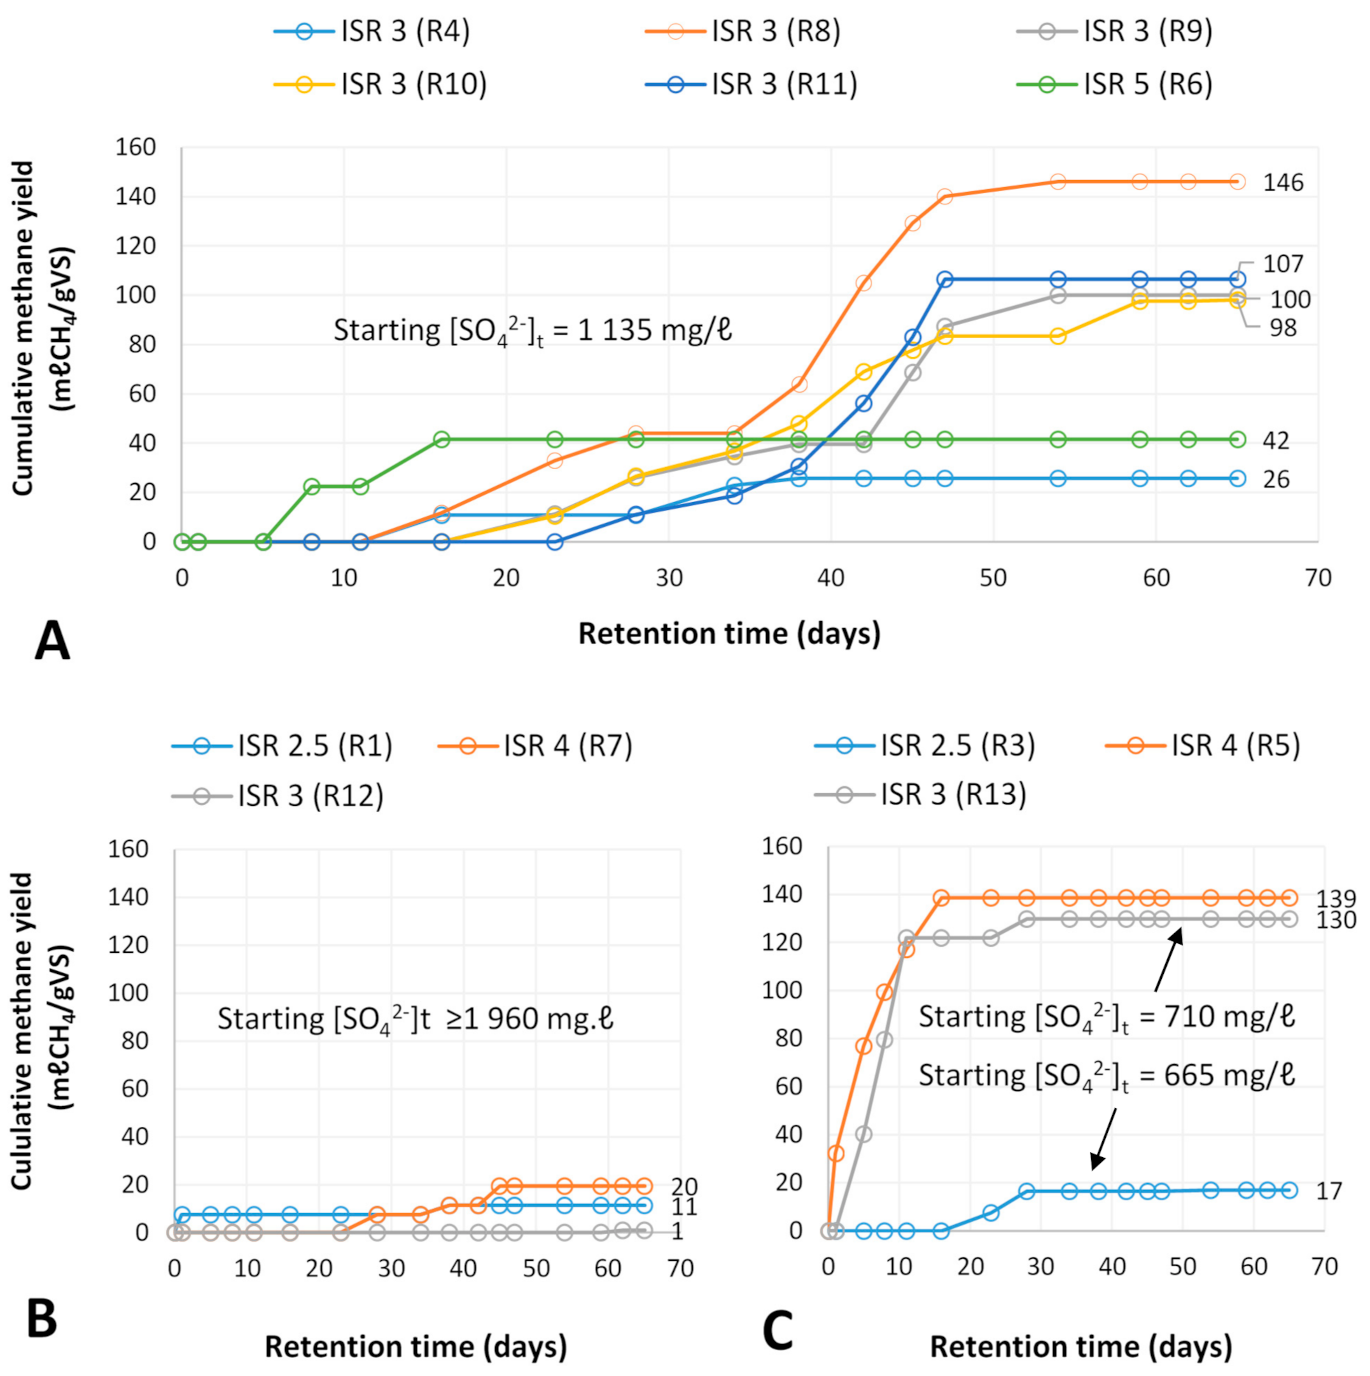
3.2.1. Cumulative Methane Generation
3.2.2. Hydrolysis and pH Changes
3.2.3. Acidogenesis, Acetogenesis and Changes in Volatile Organic Acid Concentration
3.2.4. Sulfidogenesis, Sulfite Oxidation and Methanogenesis
3.2.5. Metal Inhibition or Stimulation and Macronutrient Limitation
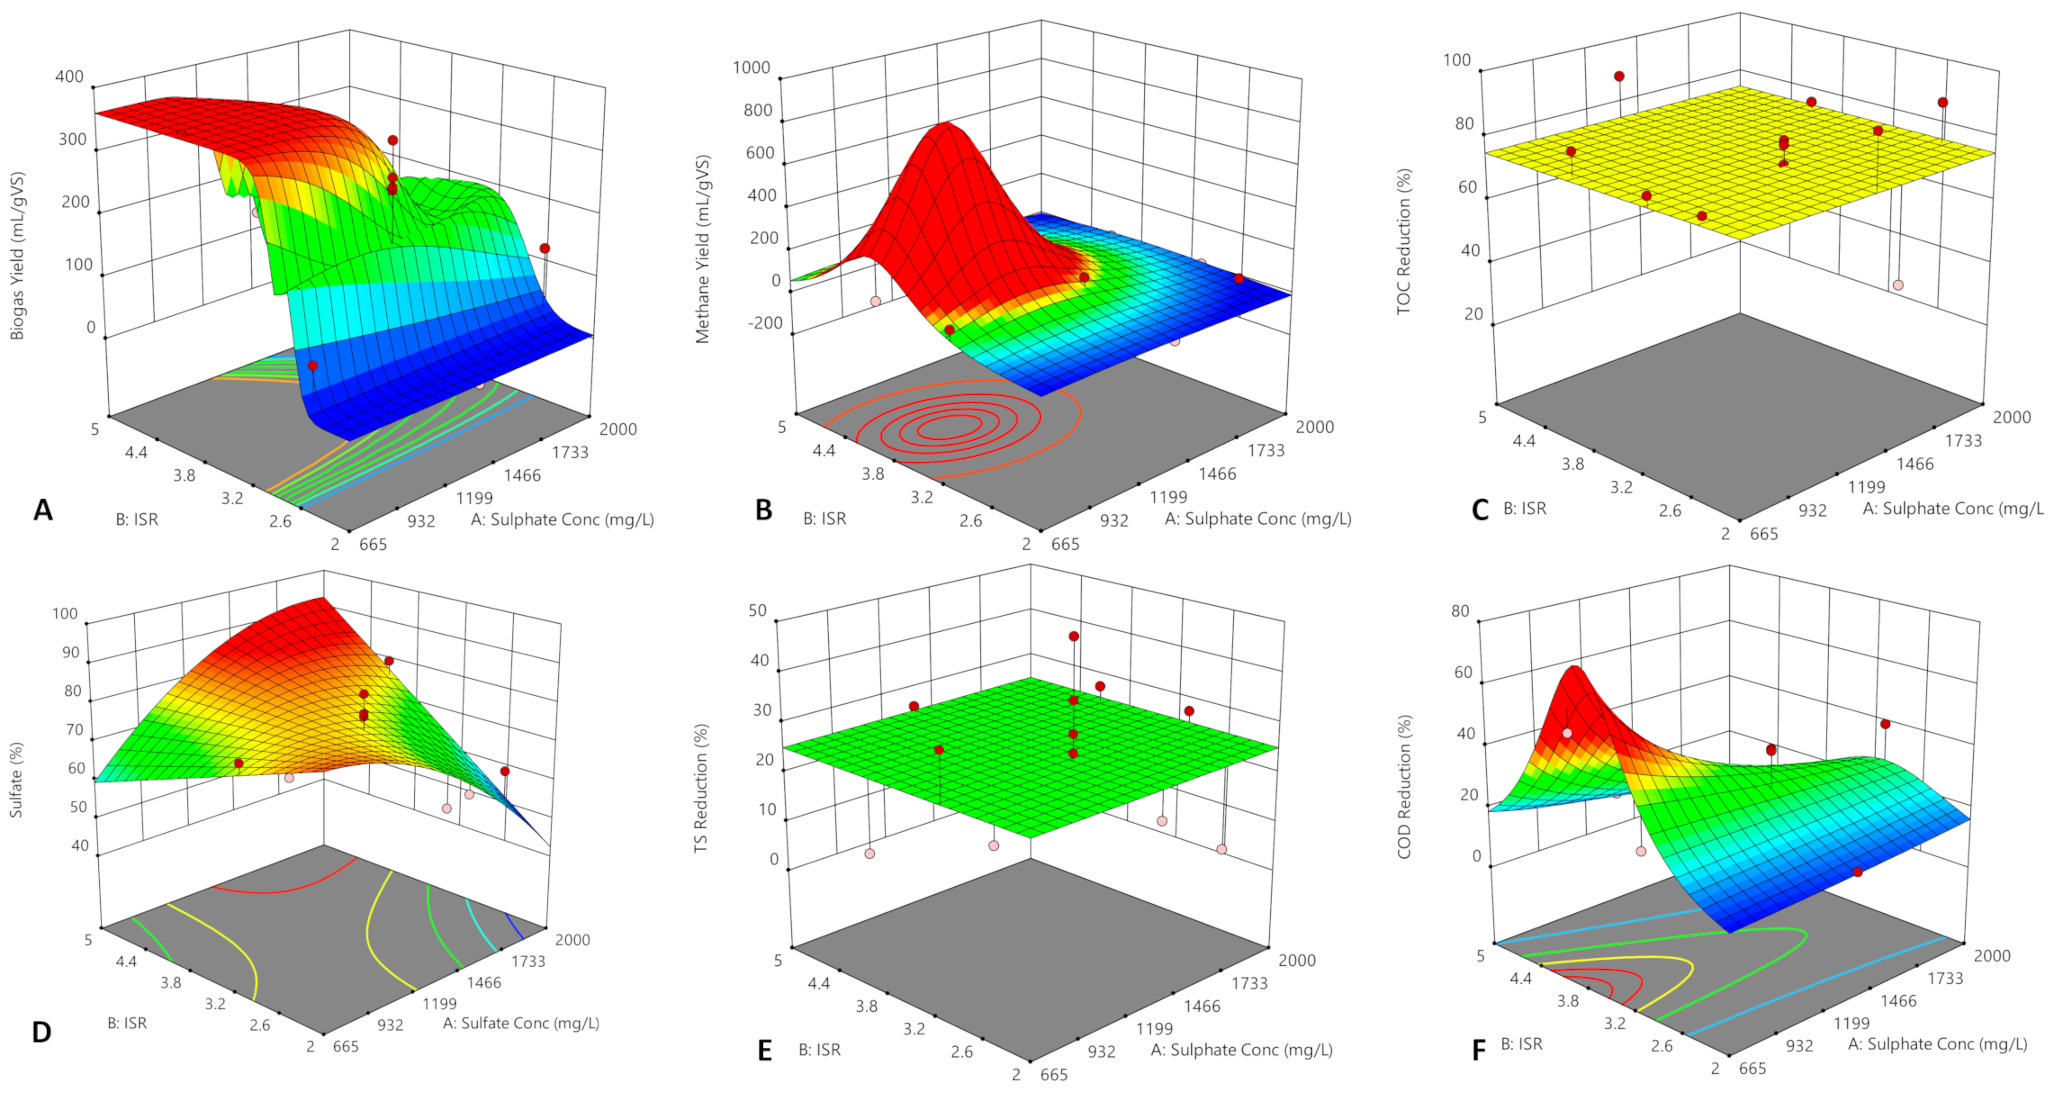
3.3. Optimisation of Cumulative Methane Yield and Anaerobic Biodegradability
3.3.1. Water Reuse
3.3.2. Correlative Analysis of Variables on Methane Yield and Anaerobic Biodegradability
3.4. Kinetic Study of Cumulative Methane Production
3.5. Conclusions
Author Contributions
Funding
Institutional Review Board Statement
Informed Consent Statement
Data Availability Statement
Acknowledgments
Conflicts of Interest
Abbreviations
| A | ultimate methane yield |
| Alk | total alkalinity |
| ANOVA | Analysis of variance |
| BOD | biological oxygen demand |
| CH4 | methane |
| C/N | carbon to nitrogen ratio |
| H2 | hydrogen |
| H/SRT | hydraulic/solid retention time |
| K | rate constant |
| NH3/NH4 | ammonia/um |
| Pb | lead |
| sulfate | |
| TKN | total Kjeldahl Nitrogen |
| TOC | total organic carbon |
| TWAS | tannery waste activated sludge |
| T/VS | total/volatile solids |
| AAE | acetic acid equivalents |
| AMs | aceticlastic methanogens |
| Bo | biodegradability |
| CCD | central composite design |
| Cl | chloride |
| Cu | copper |
| HMs | hydrogenotrophic methanogens |
| ISR | inoculum to substrate ratio |
| Mg | magnesium |
| Ni | nickel |
| r | Pearson’s correlation |
| SRB | sulfate reducing bacteria |
| TL | tanning liquor |
| TP | total phosphate |
| TWW | tannery wastewater |
| UACF | upflow anaerobic contact filter |
| AD/AcoD | anaerobic digestion/codigestion |
| ASBR | anaerobic sequencing batch reactor |
| BMP | biochemical methane potential |
| Ca | calcium |
| COD | chemical oxygen demand |
| Fe | iron |
| sulfide species | |
| IOT | integrated ostrich tannery |
| Na | sodium |
| OLR | organic loading rate |
| S0 | elementary sulfur |
| SWW | slaughterhouse wastewater |
| TN | total nitrogen |
| TS | total solids |
| TWWTP | TWW treatment plant |
| UASB | upflow anaerobic sludge blanket |
References
- Buljan, J.; Král, I. The Framework for Sustainable Leather Manufacture; UNIDO: Vienna, Austria, 2015; pp. 1–203. [Google Scholar]
- Buljan, J.; Král, I. Introduction to Treatment of Tannery Effluents; UNIDO: Vienna, Austria, 2011; pp. 1–69.
- Kanagaraj, J.; Velappan, K.C.; Babu, N.K.C.; Sadulla, S. Solid Wastes Generation in the Leather Industry and Its Utilization for Cleaner Environment: A Review. J. Sci. Ind. Res. 2006, 65, 541–548. [Google Scholar] [CrossRef]
- Akyol, Ç.; Demirel, B.; Onay, T.T. Recovery of Methane from Tannery Sludge: The Effect of Inoculum to Substrate Ratio and Solids Content. J. Mater. Cycles Waste Manag. 2014, 17, 1–8. [Google Scholar] [CrossRef]
- Buljan, J. Costs of Tannery Waste Treatment. In Leather and Leather Products Industry Panel; UNIDO: Leon, France, 2005; pp. 1–25. [Google Scholar]
- Mpofu, A.B.; Oyekola, O.O.; Welz, P.J. Co-Digestion of Tannery Waste Activated Sludge with Slaughterhouse Sludge to Improve Organic Biodegradability and Biomethane Generation. Process Saf. Environ. Prot. 2020, 131, 235–245. [Google Scholar] [CrossRef]
- Mpofu, A.B.; Oyekola, O.O.; Welz, P.J. Anaerobic Treatment of Tannery Wastewater in the Context of a Circular Bioeconomy for Developing Countries. J. Clean. Prod. 2021, 296, 126490. [Google Scholar] [CrossRef]
- American Public Health Association; American Water Works Association; Water Environment Federation. Standard Methods for the Examination of Water and Wastewater, 23rd ed.; Baird, R., Bridgewater, L., Rice, E., Eds.; American Public Health Association; American Water Works Association; Water Environment Federation: Washington, DC, USA, 2017.
- Holliger, C.; Alves, M.; Andrade, D.; Angelidaki, I.; Astals, S.; Baier, U.; Bougrier, C.; Buffière, P.; Carballa, M.; De Wilde, V.; et al. Towards a Standardization of Biomethane Potential Tests. Water Sci. Technol. 2016, 74, 2515–2522. [Google Scholar] [CrossRef]
- Mpofu, A.B. Optimisation of the Anaerobic Treatment of Secondary Tannery Sludge for Biogas Production and Solids Reduction; Cape Peninsula University of Technology: Cape Town, South Africa, 2018. [Google Scholar]
- Angelidaki, I.; Sanders, W. Assessment of the Anaerobic Biodegradability of Macropollutants. Rev. Environ. Sci. Biotechnol. 2004, 3, 117–129. [Google Scholar] [CrossRef]
- Zhang, R.; El-Mashad, H.M.; Hartman, K.; Wang, F.; Liu, G.; Choate, C.; Gamble, P. Characterization of Food Waste as Feedstock for Anaerobic Digestion. Bioresour. Technol. 2007, 98, 929–935. [Google Scholar] [CrossRef]
- Bhattacharya, P.; Roy, A.; Sarkar, S.; Ghosh, S.; Majumdar, S.; Chakraborty, S.; Mandal, S.; Mukhopadhyay, A.; Bandyopadhyay, S. Combination Technology of Ceramic Microfiltration and Reverse Osmosis for Tannery Wastewater Recovery. Water Resour. Ind. 2013, 3, 48–62. [Google Scholar] [CrossRef] [Green Version]
- Sri Bala Kameswari, K.; Kalyanaraman, C.; Umamaheswari, B.; Thanasekaran, K. Enhancement of Biogas Generation during Co-Digestion of Tannery Solid Wastes through Optimization of Mix Proportions of Substrates. Clean Technol. Environ. Policy 2014, 16, 1067–1080. [Google Scholar] [CrossRef]
- Berhe, S.; Leta, S. Anaerobic Co-Digestion of Tannery Waste Water and Tannery Solid Waste Using Two-Stage Anaerobic Sequencing Batch Reactor: Focus on Performances of Methanogenic Step. J. Mater. Cycles Waste Manag. 2018, 20, 1468–1482. [Google Scholar] [CrossRef]
- Appels, L.; Lauwers, J.; Degrve, J.; Helsen, L.; Lievens, B.; Willems, K.; Van Impe, J.; Dewil, R. Anaerobic Digestion in Global Bio-Energy Production: Potential and Research Challenges. Renew. Sustain. Energy Rev. 2011, 15, 4295–4301. [Google Scholar] [CrossRef]
- Buyukkamaci, N.; Filibeli, A. Volatile Fatty Acid Formation in an Anaerobic Hybrid Reactor. Process Biochem. 2004, 39, 1491–1494. [Google Scholar] [CrossRef]
- Gao, S.; Zhao, M.; Chen, Y.; Yu, M.; Ruan, W. Tolerance Response to in Situ Ammonia Stress in a Pilot-Scale Anaerobic Digestion Reactor for Alleviating Ammonia Inhibition. Bioresour. Technol. 2015, 198, 372–379. [Google Scholar] [CrossRef] [PubMed]
- Mpofu, A.B.; Welz, P.J.; Oyekola, O.O. Anaerobic Digestion of Secondary Tannery Sludge: Optimisation of Initial PH and Temperature and Evaluation of Kinetics. Waste Biomass Valorization 2020, 11, 873–885. [Google Scholar] [CrossRef]
- Chen, Y.; Cheng, J.J.; Creamer, K.S. Inhibition of Anaerobic Digestion Process: A Review. Bioresour. Technol. 2008, 99, 4044–4064. [Google Scholar] [CrossRef] [PubMed]
- Guerrero, L.; Chamy, R.; Jeison, D.; Montalvo, S.; Huiliñir, C.; Guerrero, L.; Chamy, R.; Jeison, D.; Montalvo, S. Behavior of the Anaerobic Treatment of Tannery Wastewater at Different Initial PH Values and Sulfate Concentrations. Environ. Sci. Heal. 2013, 48, 1073–1078. [Google Scholar] [CrossRef]
- Deublein, D.; Steinhauser, A. Biogas from Waste and Renewable Resources, 1st ed.; John Wiley & Sons: Weinhem, Germany, 2008. [Google Scholar] [CrossRef]
- Lin, C.-Y. Effect of Heavy Metals on Volatile Fatty Acid Degradation in Anaerobic Digestion. Water Res. 1992, 26, 177–183. [Google Scholar] [CrossRef]
- Zayed, G.; Winter, J. Inhibition of Methane Production from Whey by Heavy Metals—Protective Effect of Sulfide. Appl. Microbiol. Biotechnol. 2000, 53, 726–731. [Google Scholar] [CrossRef]
- Thanh, P.M.; Ketheesan, B.; Yan, Z.; Stuckey, D. Trace Metal Speciation and Bioavailability in Anaerobic Digestion: A Review. Biotechnol. Adv. 2016, 34, 122–136. [Google Scholar] [CrossRef] [PubMed]
- Feijoo, G.; Soto, M.; Méndez, R.; Lema, J.M. Sodium Inhibition in the Anaerobic Digestion Process: Antagonism and Adaptation Phenomena. Enzyme Microb. Technol. 1995, 17, 180–188. [Google Scholar] [CrossRef]
- Saxena, S.; Saharan, V.K.; George, S. Modeling & Simulation Studies on Batch Anaerobic Digestion of Hydrodynamically Cavitated Tannery Waste Effluent for Higher Biogas Yield COD TS. Ultrason. Sonochem. 2019, 58, 104692. [Google Scholar] [CrossRef]
- Achouri, O.; Panico, A.; Ph, D.; Derbal, K.; Ph, D.; Pirozzi, F. Effect of Chemical Coagulation Pretreatment on Anaerobic Digestion of Tannery Wastewater. J. Environ. Eng. 2017, 1–5. [Google Scholar] [CrossRef]
- Rajagopal, R.; Massé, D.I.; Singh, G. A Critical Review on Inhibition of Anaerobic Digestion Process by Excess Ammonia. Bioresour. Technol. 2013, 143, 632–641. [Google Scholar] [CrossRef] [PubMed]
- Amani, T.; Nosrati, M.; Sreekrishnan, T.R. Anaerobic Digestion from the Viewpoint of Microbiological, Chemical, and Operational Aspects—A Review. Environ. Rev. 2010, 278, 255–278. [Google Scholar] [CrossRef]
- Gerardi, M.H. The Microbiology of Anaerobic Digesters; John Wiley & Sons: Hoboken, NJ, USA, 2003. [Google Scholar]
- O’Flaherty, V.; Lens, P.; Leahy, B.; Colleran, E. Long-Term Competition between Sulphate-Reducing and Methane-Producing Bacteria during Full-Scale Anaerobic Treatment of Citric Acid Production Wastewater. Water Res. 1998, 32, 815–825. [Google Scholar] [CrossRef]
- Sabumon, P.C. Development of a Novel Process for Anoxic Ammonia Removal with Sulphidogenesis. Process Biochem. 2008, 43, 984–991. [Google Scholar] [CrossRef]
- Sabumon, P.C. Development of the Sulphidogenesis Cum Ammonia Removal Process for Treatment of Tannery Effluent. Water Sci. Technol. 2008, 58, 391–397. [Google Scholar] [CrossRef] [PubMed]
- Moraes, B.S.; Souza, T.S.O.; Foresti, E. Effect of Sulfide Concentration on Autotrophic Denitrification from Nitrate and Nitrite in Vertical Fixed-Bed Reactors. Process Biochem. 2012, 47, 1395–1401. [Google Scholar] [CrossRef]
- Ariunbaatar, J.; Scotto Di Perta, E.; Panico, A.; Frunzo, L.; Esposito, G.; Lens, P.N.L.; Pirozzi, F. Effect of Ammoniacal Nitrogen on One-Stage and Two-Stage Anaerobic Digestion of Food Waste. Waste Manag. 2015, 38, 388–398. [Google Scholar] [CrossRef]
- Utgikar, V.P.; Harmon, S.M.; Chaudhary, N.; Tabak, H.H.; Govind, R.; Haines, J.R. Inhibition of Sulfate-Reducing Bacteria by Metal Sulfide Formation in Bioremediation of Acid Mine Drainage. Environ. Toxicol. 2002, 17, 40–48. [Google Scholar] [CrossRef]
- Vazifehkhoran, A.H.; Shin, S.G.; Triolo, J.M. Use of Tannery Wastewater as an Alternative Substrate and a Pre-Treatment Medium for Biogas Production. Bioresour. Technol. 2018, 258, 64–69. [Google Scholar] [CrossRef] [PubMed] [Green Version]
- Agustini, C.B.; da Costa, M.; Gutterres, M. Tannery Wastewater as Nutrient Supply in Production of Biogas from Solid Tannery Wastes Mixed through Anaerobic Co-Digestion. Process Saf. Environ. Prot. 2019, 135, 38–45. [Google Scholar] [CrossRef]
- Daryapurkar, R.A.; Nandy, T.; Kaul, S.N.; Deshpande, C.V.; Szpyrkowicz, L. Evaluation of Kinetic Constants for Anaerobic Fixed Film Fixed Bed Reactors Treating Tannery Wastewater. Int. J. Environ. Stud. 2001, 58, 835–860. [Google Scholar] [CrossRef]
- Department of Water Affairs. Revision of General Authorisations in Terms Section 39 of the National Water Act, 1998 (Act Number 36 of 1998); Gorvenment Printing Works: Pretoria, South Africa, 2013; pp. 1–32.
- Maqbool, A.; Ali, S.; Rizwan, M.; Ishaque, W.; Rasool, N.; ur Rehman, M.Z.; Bashir, A.; Abid, M.; Wu, L. Management of Tannery Wastewater for Improving Growth Attributes and Reducing Chromium Uptake in Spinach through Citric Acid Application. Environ. Sci. Pollut. Res. 2018, 25, 10848–10856. [Google Scholar] [CrossRef]
- Thangamani, A.; Rajakumar, S.; Ramanujam, R.A. Anaerobic Co-Digestion of Hazardous Tannery Solid Waste and Primary Sludge: Biodegradation Kinetics and Metabolite Analysis. Clean Technol. Environ. Policy 2010, 12, 517–524. [Google Scholar] [CrossRef]
- Thangamani, A.; Suseela, R.; Ramanujam, R.A. Biomethanation Potential of Animal Fleshing and Primary Sludge and Effect of Refractory Fraction of Volatile Solids. J. Environ. Sci. Sustain. Soc. 2009, 3, 29–34. [Google Scholar] [CrossRef]
- Li, L.; He, Q.; Zhao, X.; Wu, D.; Wang, X.; Peng, X. Anaerobic Digestion of Food Waste: Correlation of Kinetic Parameters with Operational Conditions and Process Performance. Biochem. Eng. J. 2018, 130, 1–9. [Google Scholar] [CrossRef]


| Parameter | Batch 1 | Batch 2 | Batch 3 | Batch 4 | Batch 5 | Batch 6 | Mean | SD |
|---|---|---|---|---|---|---|---|---|
| TOC (mg/L) | 2467 | 3380 | 4530 | 9080 | 485 | 820 | 3460 | 3148 |
| COD (mg/L) | 7945 | 8143 | 7903 | 15690 | 4387 | 7235 | 8551 | 3768 |
| BOD (mg/L) | 3532 | 1472 | 1542 | 1515 | 1531 | 1552 | 1857 | 821 |
| VOAt (mg/L AAE) | 3070 | 2800 | 2440 | 2480 | 2120 | 1800 | 2452 | 456 |
| TN (mg/L) | 440 | 235 | 180 | 260 | 220 | 530 | 311 | 140 |
| TAN (mg/L NH3-N) | 18.8 | 13.5 | 16.2 | 41.0 | 13.2 | 9.60 | 18.7 | 11.3 |
| NO3 (mg/L) | 143.8 | 39.0 | 28.6 | 18.7 | 11.5 | 54.7 | 49.4 | 48.7 |
| TP (mg/L PO42−-P) | 6.65 | 5.10 | 5.05 | 17.8 | 5.00 | 4.90 | 7.41 | 5.11 |
| (mg/L) | 1114 | 626 | 352 | 424 | 173 | 1186 | 646 | 417 |
| HS− (mg/L) | ND | 2.38 | 5.70 | 2.20 | 0.00 | 0.12 | 2.08 | 2.31 |
| Cl (mg/L) | 2038 | 1547 | 1294 | 1022 | 911 | 2369 | 1530 | 576 |
| TS (g/L) | 7.85 | 8.07 | 8.38 | 19.4 | 5.53 | 4.69 | 8.98 | 5.30 |
| TVS (g/L) | 3.61 | 4.06 | 4.97 | 14.6 | 2.82 | 2.32 | 5.40 | 4.61 |
| K (mg/L) | 11.7 | 19.9 | 13.2 | 12.3 | 10.7 | 6.6 | 12.4 | 4.3 |
| Na (mg/L) | 1477 | 1315 | 1953 | 2789 | 964 | 754 | 1542 | 740 |
| Fe (µg/L) | 3272 | 3081 | 606 | 497 | 193 | 282 | 1322 | 1446 |
| Ca (mg/L) | 11.7 | 24.0 | 24.2 | 6.9 | 17.6 | 16.8 | 16.9 | 6.8 |
| Mg (mg/L) | 19.4 | 15.5 | 39.5 | 55.3 | 14.9 | 13.2 | 26.3 | 17.2 |
| Zn (µg/L) | 1568 | 674 | 439 | 401 | 229 | 198 | 585 | 511 |
| Cu (µg/L) | 304 | 136 | 16.6 | 65.9 | 12.7 | 12.1 | 91.2 | 115 |
| Co (µg/L) | 7.7 | 4.7 | 1.6 | 1.9 | 44.2 | 1.9 | 10.3 | 16.8 |
| Cd (µg/L) | 2.27 | 1.08 | 0.18 | 0.27 | 0.18 | 0.18 | 0.69 | 0.85 |
| Ni (µg/L) | 73.1 | 18.4 | 18.7 | 21.3 | 5.6 | 8.4 | 24.2 | 24.7 |
| Cr (µg/L) | 766 | 57 | 1094 | 350 | 584 | 136 | 498 | 395 |
| Pb (µg/L) | 8.4 | 2.3 | 4.8 | 6.8 | 5.2 | 4.1 | 5.3 | 2.1 |
| Al (µg/L) | 1798 | 2366 | 583 | 624 | 85 | 101 | 926 | 941 |
| Alk (g/L CaCO3) | 245 | 236 | 330 | 264 | 297 | 308 | 280 | 37.0 |
| EC (mS/cm) | 8.22 | 8.27 | 8.81 | 11.87 | 4.04 | 3.61 | 7.47 | 3.13 |
| pH | 6.49 | 6.73 | 7.33 | 7.09 | 6.92 | 6.93 | ND | ND |
| TVS:TS | 0.46 | 0.50 | 0.59 | 0.76 | 0.51 | 0.49 | ND | ND |
| BOD:COD | 0.44 | 0.18 | 0.20 | 0.10 | 0.35 | 0.21 | ND | ND |
| C:N | 5.61 | 14.38 | 25.17 | 34.92 | 2.20 | 1.55 | ND | ND |
| VFA:Alk | 12.5 | 11.9 | 7.39 | 9.39 | 7.14 | 5.84 | ND | ND |
| 7.13 | 13.0 | 22.4 | 37.0 | 25.3 | 6.10 | ND | ND | |
| COD:TVS | 2.20 | 2.00 | 1.59 | 1.07 | 1.56 | 3.12 | ND | ND |
| Reactor | B:ISR | Biogas Yield | Methane Yield | Biodegradability Indicators (% Reduction) | ||||||
|---|---|---|---|---|---|---|---|---|---|---|
| TOC | Sulfate | TS | VS | COD | ||||||
| (mg/L) | (mL/gVSadded) | (mL/gVSadded) | % | (%) | (%) | (%) | (%) | (%) | ||
| R1 | 1960 | 2.5 | 129 | 12.0 | 9.30 | 87.6 | 59.7 | 11.7 | 15.2 | 16.6 |
| R2 | 1335 | 2.0 | 4.97 | 1.71 | 34.4 | 93.1 | 63.4 | 11.5 | 19.2 | 13.8 |
| R3 | 710 | 2.5 | 83.6 | 17.0 | 20.3 | 76.2 | 77.1 | 20.1 | 28.5 | 19.2 |
| R4 | 1335 | 3.0 | 79.8 | 25.7 | 32.2 | 81.3 | 73.6 | 19.3 | 26.7 | 24.4 |
| R5 | 710 | 4.0 | 361 | 93.3 | 25.9 | 82.5 | 68.0 | 29.1 | 40.9 | 52.0 |
| R6 | 1335 | 5.0 | 180 | 41.5 | 23.1 | 88.3 | 81.1 | 26.0 | 55.0 | 10.8 |
| R7 | 1960 | 4.0 | 110 | 19.5 | 17.7 | 77.1 | 80.4 | 28.3 | 33.3 | 14.9 |
| R8 | 1335 | 3.0 | 337 | 146 | 43.4 | 82.7 | 80.4 | 26.1 | 30.5 | 43.6 |
| R9 | 1335 | 3.0 | 260 | 100 | 38.5 | 69.0 | 85.3 | 49.2 | 51.7 | 24.6 |
| R10 | 1335 | 3.0 | 265 | 102 | 38.5 | 61.3 | 79.6 | 37.0 | 40.8 | 43.0 |
| R11 | 1335 | 3.0 | 280 | 103 | 36.9 | 75.3 | 75.0 | 35.8 | 37.7 | 24.3 |
| R12 | 2000 | 3.0 | 9.13 | 1.02 | 11.2 | 23.2 | 49.3 | 19.0 | 27.5 | 39.3 |
| R13 | 665 | 3.0 | 290 | 130 | 44.8 | 78.5 | 77.8 | 29.0 | 35.4 | 25.5 |
| Models | Std Dev | Overall F Test p-Value | F Test (LOF) p Value | R2 | Adj R2 | Adeq Prec | AIC |
|---|---|---|---|---|---|---|---|
| Biogas-Quadratic | 2.41 | 0.0012 | 13.8 | 0.87 | 0.81 | 15.4 | 71.9 |
| CH4-Quadratic | 0.005 | 0.032 | 4.87 | 0.77 | 0.61 | 6.4 | −83.6 |
| TOC-Mean | ND | ND | ND | ND | ND | ND | 112 |
| Sulfate-Quadratic | 6.87 | 0.027 | 4.72 | 0.71 | 0.55 | 7.70 | 99.3 |
| TS-Mean | ND | ND | ND | ND | ND | ND | ND |
| VS-Mean | ND | ND | ND | ND | ND | ND | ND |
| COD-Quadratic | 0.01 | 0.003 | 10.7 | 0.84 | 0.76 | 10.9 | −68.7 |
| Reactor | Model | Kinetic Parameters | Adj R2 | p Value Prob > F | AIC | RMSE | ||||
|---|---|---|---|---|---|---|---|---|---|---|
| A (mLCH4/gVS) | µm (mLCH4/gVSd) | λ (d) | K | n | ||||||
| R1 (1960/2.5) | Cone | 11.5 | ND | ND | 0.043 | 4.92 | 0.965 | 0.44 | 90.5 | 0.46 |
| Logistic | 11.2 | 0.61 | 14.4 | ND | ND | 0.956 | 0.41 | 105 | 0.51 | |
| First order | 13.0 | 0.03 | ND | ND | ND | 0.827 | 0.08 | 195 | 1.02 | |
| Gompertz | 3.55 | 0.69 | 13.5 | ND | ND | 0.676 | 0.23 | 235 | 1.38 | |
| R3 (710/2.5) | Logistic | 16.7 | 3.63 | 20.9 | ND | ND | 0.999 | 0.50 | 99.0 | 0.11 |
| Cone | 16.7 | ND | ND | 0.043 | 21.9 | 0.999 | 0.50 | 99.2 | 0.11 | |
| Gompertz | 6.14 | 1.76 | 22.7 | ND | ND | 0.999 | 0.50 | 99.2 | 0.11 | |
| First order | 28.8 | 0.02 | ND | ND | ND | 0.831 | 0.18 | 251 | 1.57 | |
| R4 (1335/3.0) | Logistic | 26.5 | 1.06 | 12.9 | ND | ND | 0.955 | 0.45 | 209 | 1.13 |
| Gompertz | 9.99 | 0.36 | 20.6 | ND | ND | 0.951 | 0.45 | 213 | 1.18 | |
| Cone | 28.2 | ND | ND | 0.04 | 3.25 | 0.949 | 0.46 | 217 | 1.20 | |
| First order | 47.3 | 0.015 | ND | ND | ND | 0.883 | 0.24 | 272 | 1.84 | |
| R5 (710/4.0) | Gompertz | 51.2 | 4.20 | 2.75 | ND | ND | 0.996 | 0.50 | 183 | 0.93 |
| First order | 139 | 0.172 | ND | ND | ND | 0.984 | 0.43 | 270 | 1.82 | |
| Logistic | 138 | 13.40 | 0 | ND | ND | 0.979 | 0.38 | 286 | 2.06 | |
| Cone | 146 | ND | ND | 0.27 | 1.22 | 0.966 | 0.47 | 319 | 2.65 | |
| R6 (1335/5.0) | Gompertz | 15.3 | 1.71 | 7.80 | ND | ND | 0.968 | 0.45 | 222 | 1.25 |
| Cone | 41.9 | ND | ND | 0.112 | 3.78 | 0.966 | 0.44 | 225 | 1.29 | |
| Logistic | 41.6 | 4.32 | 4.59 | ND | ND | 0.961 | 0.42 | 234 | 1.37 | |
| First order | 43.3 | 0.083 | ND | ND | ND | 0.883 | 0.23 | 306 | 2.40 | |
| R7 (1960/4.0) | Logistic | 20.3 | 0.88 | 24.5 | ND | ND | 0.962 | 0.46 | 165 | 0.81 |
| Cone | 21.1 | ND | ND | 0.03 | 5.60 | 0.960 | 0.47 | 168 | 0.83 | |
| Gompertz | 7.72 | 0.31 | 32.2 | ND | ND | 0.960 | 0.47 | 169 | 0.83 | |
| First order | 25.0 | 0.02 | ND | ND | ND | 0.763 | 0.04 | 285 | 2.04 | |
| R8; R9; R10 & R11 (1335/3.0) | Logistic | 117 | 4.82 | 26.7 | ND | ND | 0.987 | 0.50 | 314 | 2.55 |
| Cone | 124 | ND | ND | 0.025 | 5.68 | 0.982 | 0.48 | 337 | 3.04 | |
| Gompertz | 46.6 | 1.55 | 35.3 | ND | ND | 0.979 | 0.49 | 347 | 3.29 | |
| First order | 38.0 | 0.021 | ND | ND | ND | 0.437 | 0.03 | 648 | 4.81 | |
| R13 (665/3.0) | Logistic | 129 | 17.5 | 3.12 | ND | ND | 0.991 | 0.47 | 265 | 1.75 |
| Gompertz | 47.5 | 6.43 | 5.55 | ND | ND | 0.991 | 0.49 | 267 | 1.77 | |
| Cone | 130 | ND | ND | 0.15 | 3.44 | 0.990 | 0.50 | 271 | 1.83 | |
| First order | 132 | 0.125 | ND | ND | ND | 0.939 | 0.29 | 389 | 4.54 | |
Publisher’s Note: MDPI stays neutral with regard to jurisdictional claims in published maps and institutional affiliations. |
© 2021 by the authors. Licensee MDPI, Basel, Switzerland. This article is an open access article distributed under the terms and conditions of the Creative Commons Attribution (CC BY) license (http://creativecommons.org/licenses/by/4.0/).
Share and Cite
Mpofu, A.B.; Kibangou, V.A.; Kaira, W.M.; Oyekola, O.O.; Welz, P.J. Anaerobic Co-Digestion of Tannery and Slaughterhouse Wastewater for Solids Reduction and Resource Recovery: Effect of Sulfate Concentration and Inoculum to Substrate Ratio. Energies 2021, 14, 2491. https://0-doi-org.brum.beds.ac.uk/10.3390/en14092491
Mpofu AB, Kibangou VA, Kaira WM, Oyekola OO, Welz PJ. Anaerobic Co-Digestion of Tannery and Slaughterhouse Wastewater for Solids Reduction and Resource Recovery: Effect of Sulfate Concentration and Inoculum to Substrate Ratio. Energies. 2021; 14(9):2491. https://0-doi-org.brum.beds.ac.uk/10.3390/en14092491
Chicago/Turabian StyleMpofu, Ashton B., Victoria A. Kibangou, Walusungu M. Kaira, Oluwaseun O. Oyekola, and Pamela J. Welz. 2021. "Anaerobic Co-Digestion of Tannery and Slaughterhouse Wastewater for Solids Reduction and Resource Recovery: Effect of Sulfate Concentration and Inoculum to Substrate Ratio" Energies 14, no. 9: 2491. https://0-doi-org.brum.beds.ac.uk/10.3390/en14092491