Article

Minimum Leading Edge Protection Application Length to Combat Rain-Induced Erosion of Wind Turbine Blades

1
Faculty of Aerospace Engineering, Delft University of Technology, Kluyverweg 3, 2629 HS Delft, The Netherlands
2
SINTEF Ocean AS, Otto Nielsens veg 10, 7052 Trondheim, Norway
3
SE Blades Technology, B.V. Jan Tinbergenstraat 290, 7559 ST Hengelo (Overijssel), The Netherlands
4
Department of Marine Technology, Norwegian University of Science and Technology (NTNU), 7052 Trondheim, Norway
5
Department of Engineering Sciences, University of Agder, 4879 Grimstad, Norway
*
Author to whom correspondence should be addressed.
Submission received: 23 January 2021 / Revised: 27 February 2021 / Accepted: 8 March 2021 / Published: 15 March 2021
(This article belongs to the Special Issue Advancements in Leading Edge Erosion Science of Wind Turbine Blades)

Abstract

:
Leading edge erosion (LEE) repairs of wind turbine blades (WTBs) involve infield application of leading edge protection (LEP) solutions. The industry is currently aiming to use factory based LEP coatings that can applied to the WTBs before they are shipped out for installation. However, one of the main challenges related to these solutions is the choice of a minimum LEP application length to be applied in the spanwise direction of the WTBs. Generally, coating suppliers apply 10–20 m of LEP onto the blades starting from the tip of the blade using the “rule of thumb”, and no studies in the literature exist that stipulate how these LEP lengths can be calculated. In this study, we extend the scope of a recently developed long-term probabilistic framework to determine the minimum LEP application length required for WTBs to combat rain-induced erosion. A parametric study is performed where different wind turbines with varying power ratings of 2.1 MW to 15 MW at different Dutch sites ranging from inland to coastal are considered. The results of the study show that the LEP application length is sensitive to the choice of the site, as well as the turbine attributes. Further, LEP lengths for WTBs are found to be the highest for turbines installed at coastal sites and turbines with higher power ratings. A detailed investigation is further performed to check the sensitivity of the LEP application length with the wind turbine parameters. The results of the study are expected to provide guidelines to the industry for efficient repair strategies for WTBs.

Graphical Abstract

1. Introduction

1.1. Background

The consistent demand of reducing the carbon footprint in the energy sector has motivated the growth of renewable energy resources. Among all the resources, wind energy has high reliability, plentiful existence, along with matured technical advancements given that power from wind had been harnessed using wind turbines for many years [1]. It has been predicted that by 2050, wind energy will meet 35% of total global electricity needs [2], and thus, it is expected to have a three- to ten-fold increase in installation of both onshore and offshore wind turbines in the global energy market.
Given that the power produced from wind energy increases with the rotor swept area along with the cube of the wind speed, there is a high demand to deploy wind turbines with large power ratings in coastal and offshore water [3,4,5]. These trends are advantageous for the industry as fewer wind turbines are required to meet the energy demands of a given wind farm [1]. However, on the other hand, turbines with high power ratings pose complex challenges to the wind turbine owners and operators. For instance, large size wind turbine blades (WTBs) rotating at high tip speeds, in the range of 70–110 m/s [6,7,8], when exposed to harsh weather conditions such as rain (Figure 1a) suffer material degradation at their leading edges ((Figure 1b). This causes local surface roughening, mass loss, and failure of the material at the leading edge, and this issue is referred to as rain-induced leading edge erosion (LEE) of WTBs [9,10]. In addition, LEE of WTBs reduces the aerodynamic efficiency of a WTB, requires costly repair and maintenance activities, and is associated with the large downtime of a wind turbine [11,12]. It has been found that LEE can reduce annual energy production (AEP) by up to 1.5–2%, which means an annual income loss of up to 3.5 million Euros for a typical offshore wind farm [13,14].
Figure 1. (a) Wind turbine exposed to rain field. (b) Examples of the leading edge erosion (LEE) of wind turbine blades (WTBs) (source: Vattenfall group [15], TNO [16], and DURALEDGEproject [17]).
Energies 14 01629 g001
Given that LEE is a complex problem, several efforts are being made to enhance the lifetime of a typical WTB in operation. One of the methods that is used in the industry is to develop and apply specialized leading edge protection (LEP) coating solutions to the WTBs [18]. These LEP solutions can include tape, paste, epoxy, metal tiles, thermoplastic shields, and polyurethane segments, among others [19]. Currently, these specialized LEP solutions are chosen when the erosion damages are observed on the WTBs during inspection [20]. Thus, infield repair campaigns (Figure 2a,b) are arranged where wind turbine (WT) technicians use rope access [21,22] and suspended platforms to perform repair and apply LEP solutions at the WT site. Given that this operation is costly, unsafe, and coupled with other challenges such as a limited weather window of operation [23], as well as the temperature sensitivity of LEP materials [24], the industry is looking for alternatives. Specialized LEP solutions are being developed in the industry that can be utilized in the blade factory (Figure 2c) before the blades are shipped out to the site for installation. For instance, Polytech ELLE [25] has developed factory based LEP solutions referred to as “swim cap” [26] for applying LEP in the factory under a controlled environment that will prevent premature failure of these solutions. The company uses precast pre-curved polyurethane shell segments tailored to the specific leading edge shapes, which are applied on the blade surface. It is claimed by the company [27] that once the LEP applications are applied on the WTB before they are put into operation, the repair activities associated with rain-induced erosion will be reduced to a minimum. Thus, it is expected that the blades will be in operation throughout their lives, and the AEP of the WTs will be maintained at their design levels. Other companies such as Siemens Gamesa Renewable Energy (SGRE) have developed and implemented a similar range of factory based products for their WTBs [28]. Recently, a technical journalist, Mr. Eize de Vries, mentioned an in-factory LEP application process [28]: ”Repairing rotor blades once they have suffered leading-edge erosion damage is costly and time-consuming, so prevention is definitely better than cure”.
The in-factory LEP application on WTBs has many advantages as discussed above; however, there are challenges related to the design and application of such an LEP solution. The main outstanding issues are (a) the in situ performance reliability of LEP solutions, (b) the effects of the LEP solution on the blade’s overall aerodynamic performance, as well as (c) the minimum LEP application length requirements in the spanwise direction of the WTB. These issues are discussed briefly below, and then, the novelty and the scope of the current paper are defined.
Figure 2. (a) Infield LEE repair. (b) Leading edge protection (LEP) on a WTB. (c) Factory based LEP application (source: Belzona Ltd [29] and Cortes et al. [30]).
Energies 14 01629 g002

1.2. Challenges

One of the main challenges related to the infield LEP application is (a) the in situ performance reliability of these coating solutions. Currently, the performance of a typical LEP solution is generally expressed in lab hours, where these materials are tested in pulsating jet erosion tests (PJETs) or the Whirling Arm Rain Erosion Tester (WARER). The test procedure [31] involves first applying LEP solutions onto a representative composite coupon followed by rain erosion investigation under a few extreme rain loading cases such as rain intensity between 30 and 35 mm/h, a droplet size of 2 mm, and impact velocity in the range of 150–200 m/s. However, note that LEE is generally described as a fatigue process caused by repetitive rain droplet impact [32]. Thus, it is important to measure the erosion contribution from all possible rain loading conditions expected at a site, given that rain is a stochastic process and is described by statistical distributions [33]. Consequently, these lab-scale estimates do not provide a complete picture of coating performance at full scale and only indicate a comparison reference of one coating against another. As a result, it has been observed that many LEP solutions fail prematurely infield, and thus, the chances of these in-factory applied LEP solutions requiring repairs within a few years of operation are high. Therefore, it is essential to develop methods that can correlate erosion occurring at lab scale to their performances at full scale.
Given that these LEP solutions are added on top of an already optimized blade geometry (Figure 3a,b), another challenge is related to (b) the effects of LEP solutions on the aerodynamic performance of WTBs. The presence of these solutions are expected to cause “device drag” [34], which is due to disturbance to the natural development of the boundary layer at the airfoil. Note that this issue is equally challenging for both infield and in-factory based LEP application, and thus, some works can be found in the literature investigating this aspect. References [34,35] experimentally investigated the influence of leading edge tapes on the aerodynamic performance of small airfoils having a low Reynolds number ( 5 e 5 and 1.85 e 6 , respectively). The LEP solutions were applied along the airfoil in the chordwise direction (Figure 3a) at different positions along the pressure and suction side and were subjected to wind tunnel tests. It was found in the study that these LEP solutions decreased the lift-to-drag ratios in the range of 10–15%. Note that these studies correspond to low Reynolds’ numbers, and these values do not relate to existing rotors currently running in offshore conditions. Recently, similar investigations were carried out by [36], where the effects of Armour EDGE thermoplastic shields on the aerodynamic performance of 5 MW WTB were investigated at below and rated wind conditions. It was found in their study that there was a negligible impact of these LEP solutions on the aerodynamic performance at below rated conditions. However, at rated wind conditions, there was a reduction of the lift-to-drag ratio in the range of 4%. Given that these investigations are sensitive to the airfoil type, as well as the LEP solutions, more investigations are required in the future to ascertain that the addition of these LEP solutions does not cause significantly high device drag.
In the above discussion, the main emphasis was placed on the LEP placement along the chordwise direction of the WTB. However, another important challenge is (c) the minimum LEP application length requirements in the spanwise direction of a WTB (Figure 3b) that would influence the added extra weight to the WTB in addition to the aerodynamic effects discussed before. In the industry, these LEP solutions are applied in the order of 10–20 m [25,37] from the blade tip, and these estimates are determined using the “rule of thumb” by coating suppliers. However, there are no studies in the literature that stipulate how these LEP lengths can be calculated. Furthermore, these estimates are expected to vary with the site conditions of the turbine and different wind turbine configurations. The site specific sensitivity comes from the fact that different sites have varying rain and wind loading, and this presents varying erosion damage rates for LEP solutions. Furthermore, the LEP application length requirement would vary with turbine specification. This is because the impact energy during the droplet impact at any given section of a WTB would depend on the rotor speed, the hub height, as well as the blade length, and these parameters are specific to a given turbine type. Therefore, methods are required to tailor important design parameters of LEP solutions.

1.3. Scope and Novelty of The Current Work

In this study, we focus on the above-discussed first and third aspects related to the challenges of factory based LEP application. First, the correlation of lab-scale LEP performance to in situ full scale coating lifetime is done by extending the scope of a recently developed long-term probabilistic framework [38]. Using this framework, an analysis procedure is presented that can be used to determine the minimum LEP application length required in the spanwise direction of WTBs. A parametric study is presented that includes three different wind turbines with varying power ratings of 2.1 MW to 15 MW and seven different Dutch sites ranging from inland to coastal. A polyurethane based coating material is included where droplet erosion experiments are performed, and the results are used to validate the erosion model used in the framework. To the authors’ knowledge, there have been no such studies in the literature that are related to the presentation of a framework that determines the LEP application length for WTBs, and thus, this marks the novelty of the current work. The contents of the paper are arranged as follows. Section 2 discusses the framework and analysis procedure used to calculate the LEP application length. Section 3 presents the methodology, as well as the details of the parametric study. Section 4 presents experimental investigations and a validation study for the erosion model. Section 5 discusses the results. Finally, Section 6 concludes the paper.

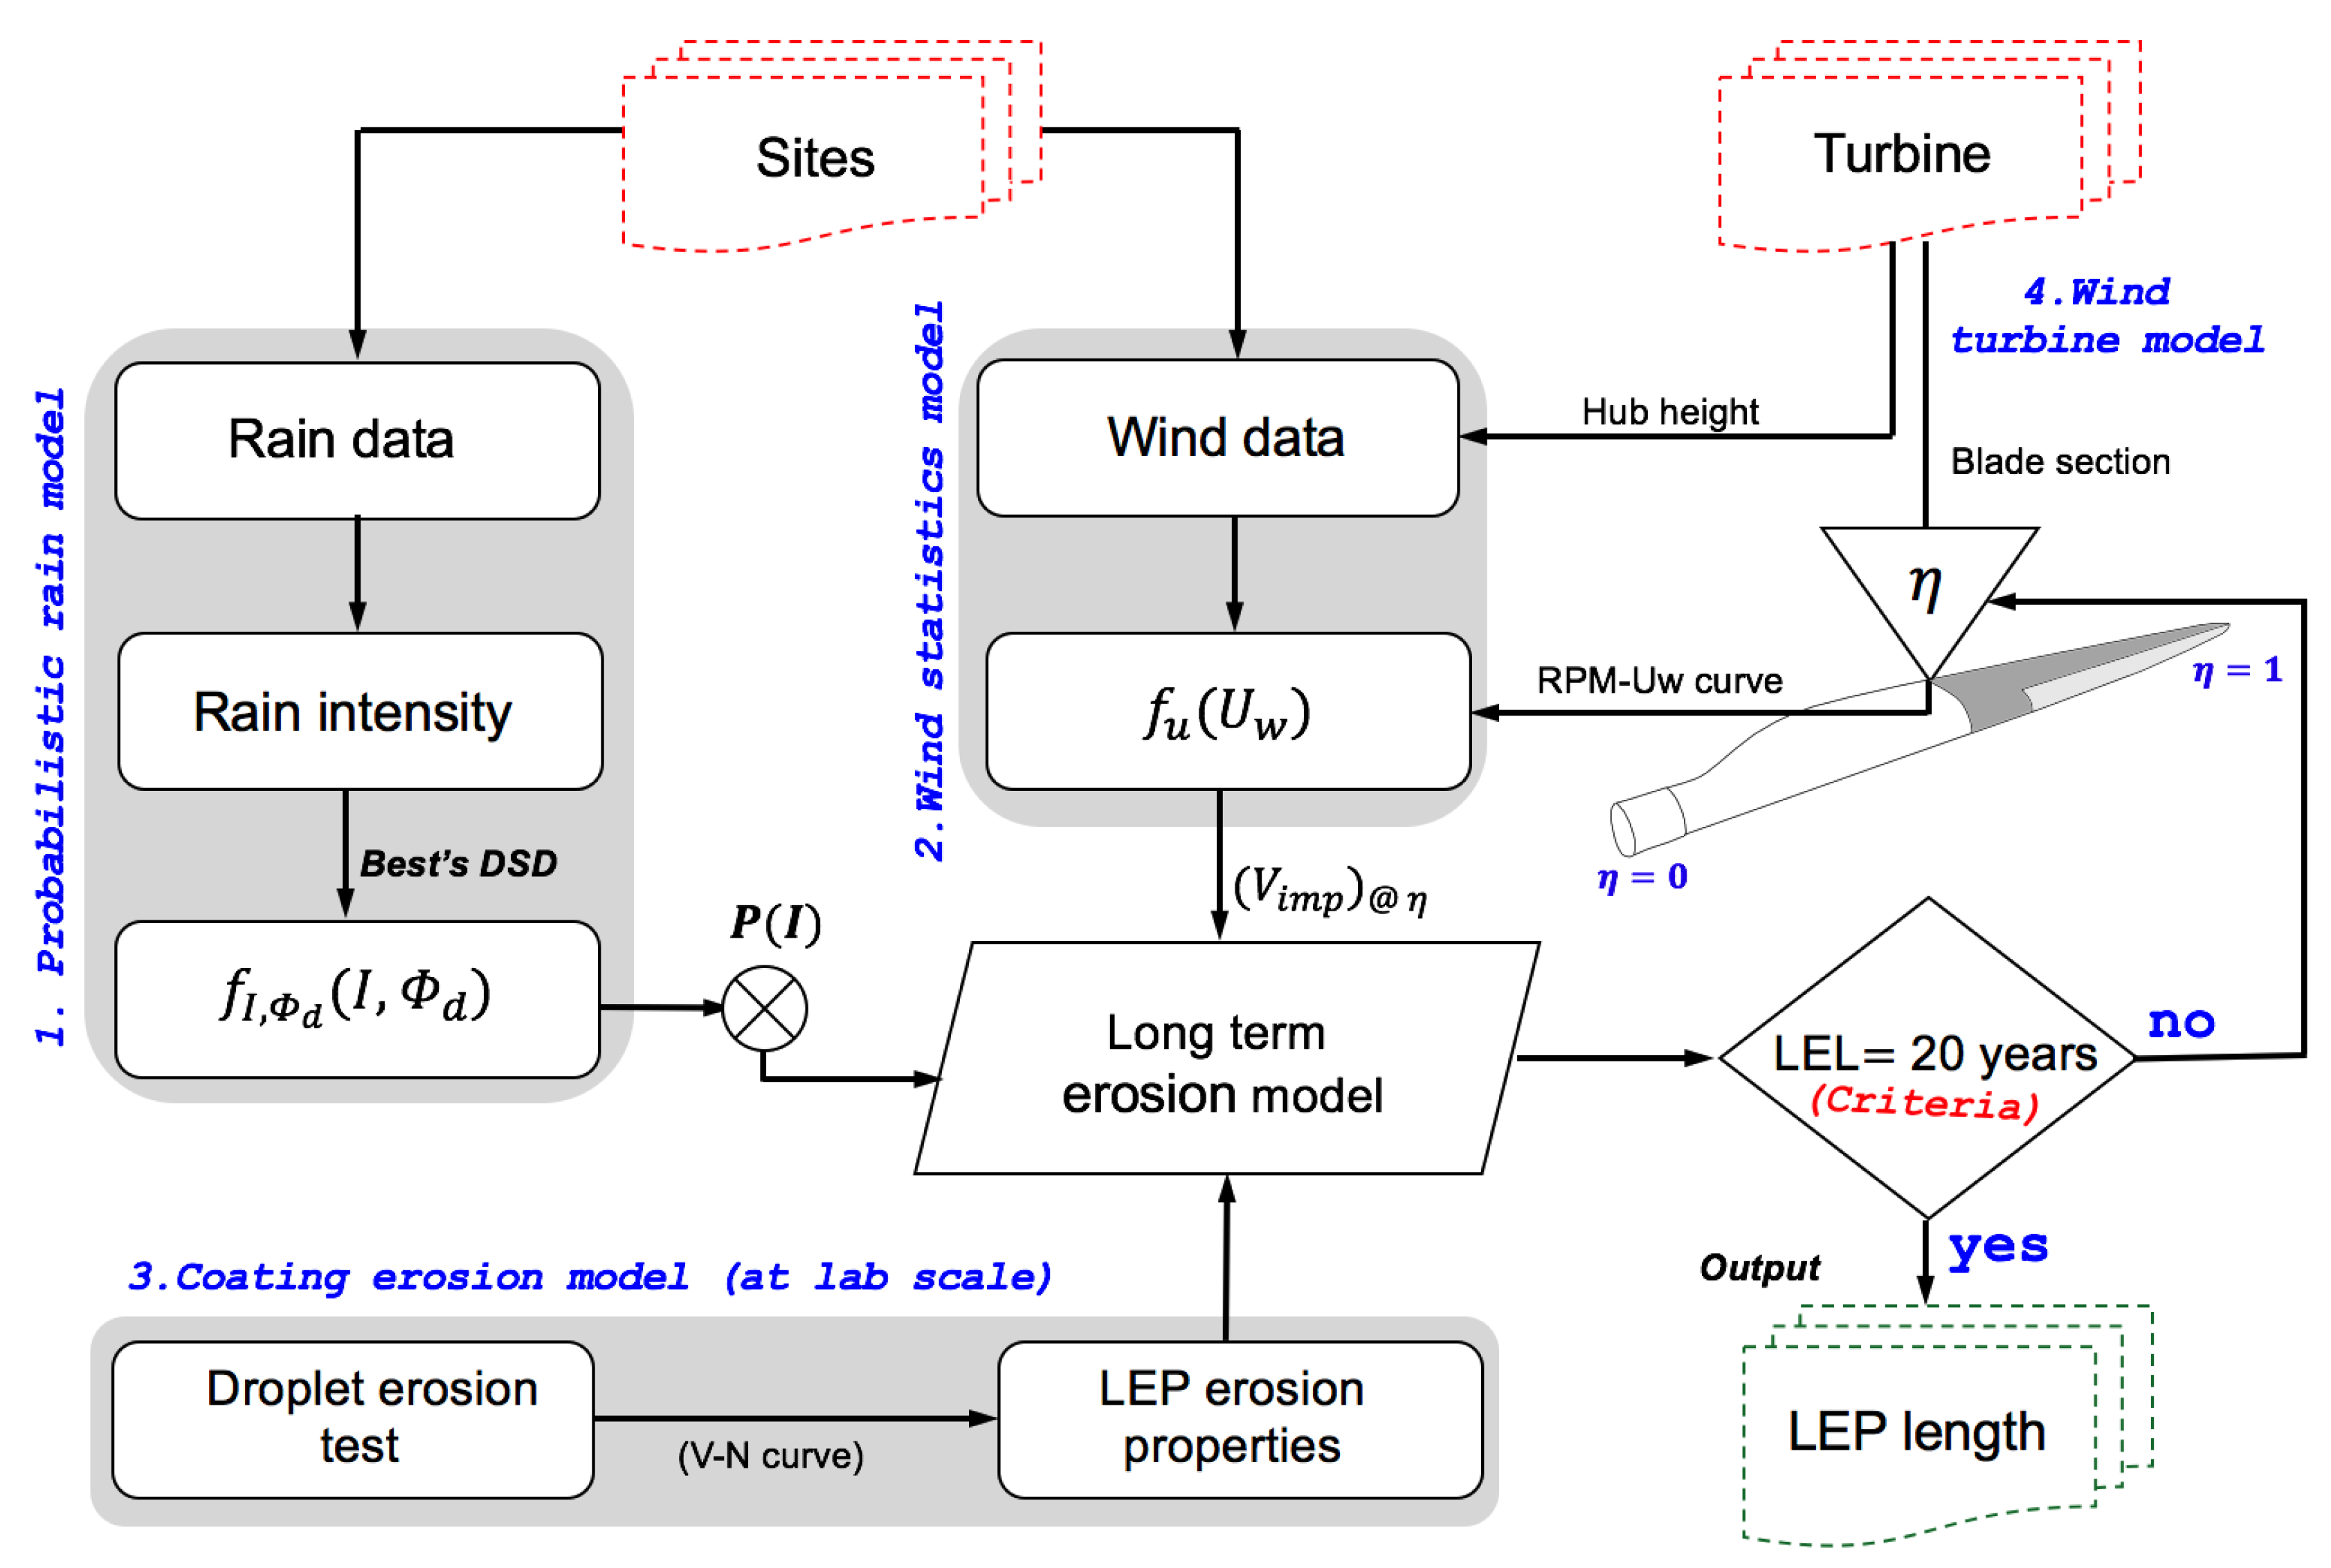
2. Analysis Procedure

Figure 4 presents the flowchart describing the general structure of a long-term probabilistic erosion framework that is used to calculate the minimum LEP application length for a WTB. The framework used in this study was developed in our previous work [38], and one of the merits of the framework is that it predicts the leading edge lifetime (LEL) of the WTB coating at full scale. The framework combines rain and wind characteristics of a given site through (1) probabilistic rain and (2) wind statistical models that describe the rain loading on a WTB during its service life together with the (3) coating erosion model that quantifies the coating lifetime at lab scale. Finally, (1), (2), and (3) are coupled with a long-term erosion model along with (4) a wind turbine model, by the use of which the site-specific leading edge lifetime (LEL) of a WTB coating system is determined at full scale. In the original framework proposed in [38], the lifetime of a coating system could only be calculated at the outermost section of the blade tip ( R = L B ); see Figure 5. At the blade tip, the highest impact speed of the rain droplets on the blade is expected. In this study, the existing framework was extended by including a new modeling feature (shown in the triangle shaped box in Figure 4 and marked by η ) to account for erosion calculations at different sections along the blade length. In this way, the minimum LEP application length can be calculated.
η represents different sections along the blade length (defined from the root towards the blade tip) and is defined by:
η = R L b ; where 0 R L b and 0 η 1
In the above equation, R is defined as the radial position of the section from the blade root, L b is the total blade length, η = 0 corresponds to the blade root, and η = 1 corresponds to the blade tip. To determine the LEP application length, the LEL of a wind turbine coating system is calculated using the flowchart at different values of η along the blade span. A criterion is defined to obtain the threshold along the blade length ( η c r i c ) below which there is no erosion damage expected during the service life. ( η c r i c ) is a point along the blade length where the LEL exceeds the service life of the blade (assumed to be 20 years in this study). Only the regions in the blade require LEP application that lie between η c r i c and the blade tip ( η = 1 ). The minimum LEP application length ( L m i n ) is then defined as:
L m i n = L b ( η c r i c L b ) = L b ( 1 η c r i c )

3. Methodology and Details of the Parametric Study

3.1. Methodology

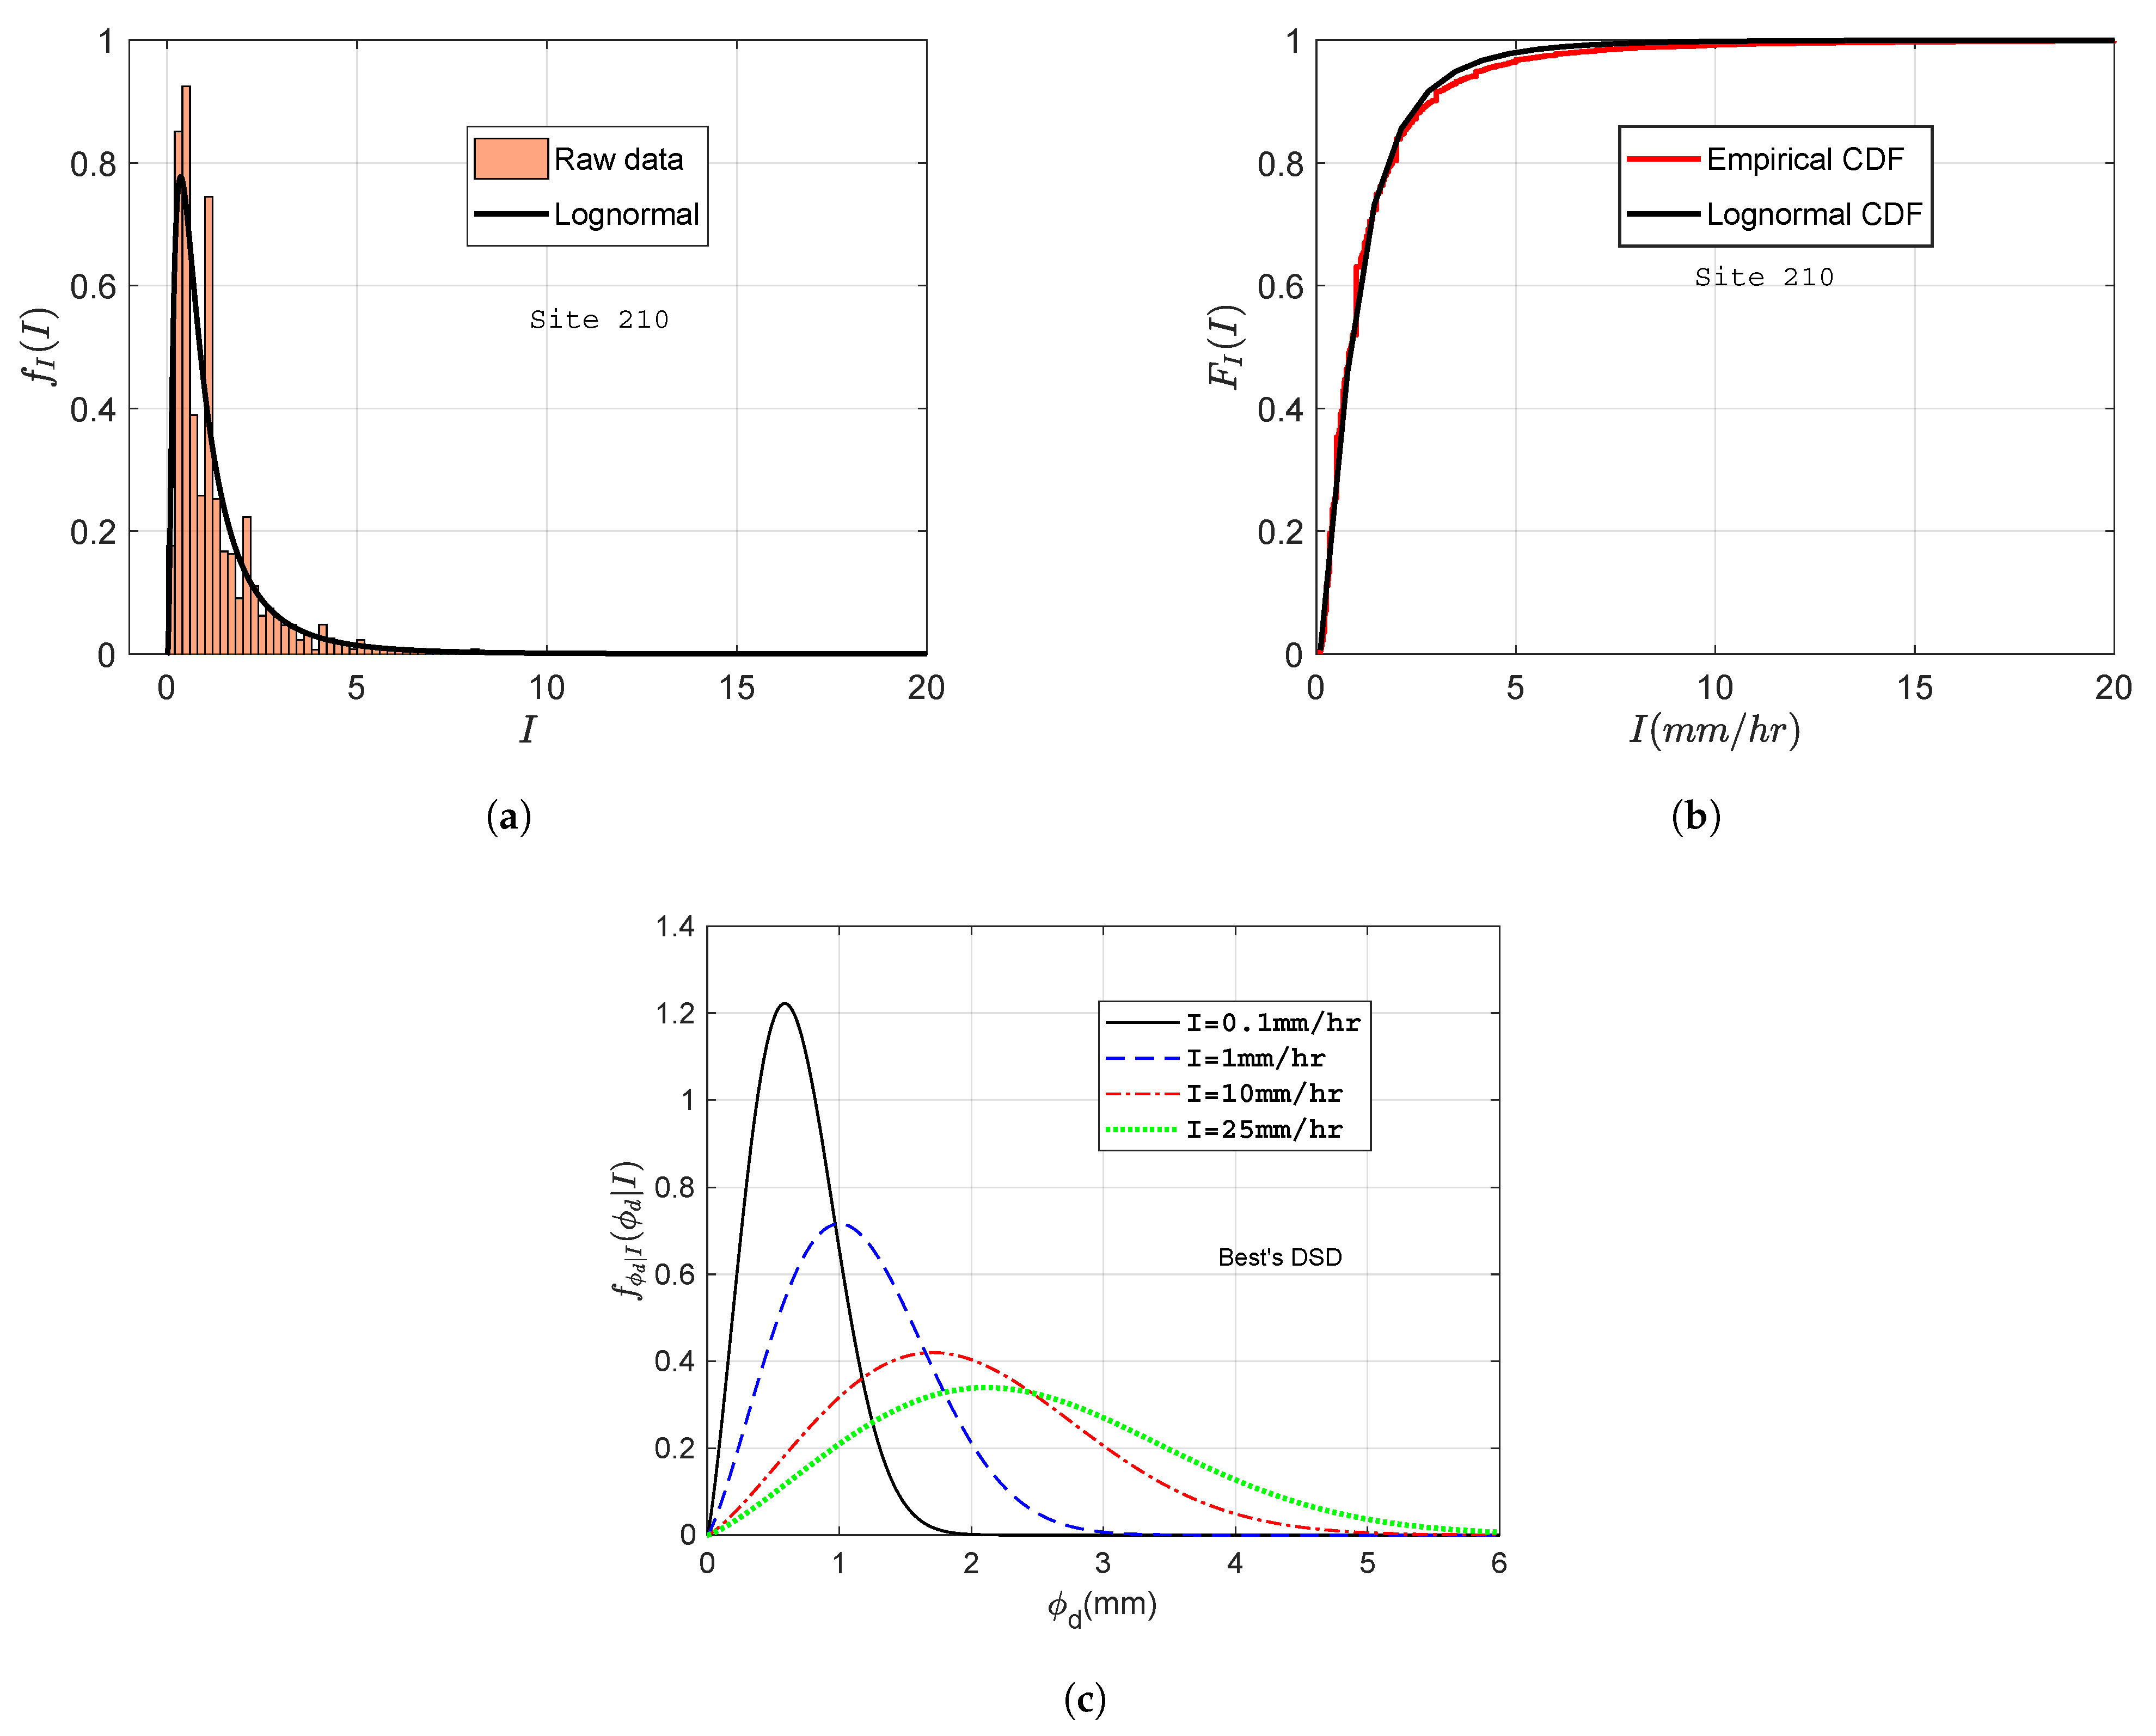
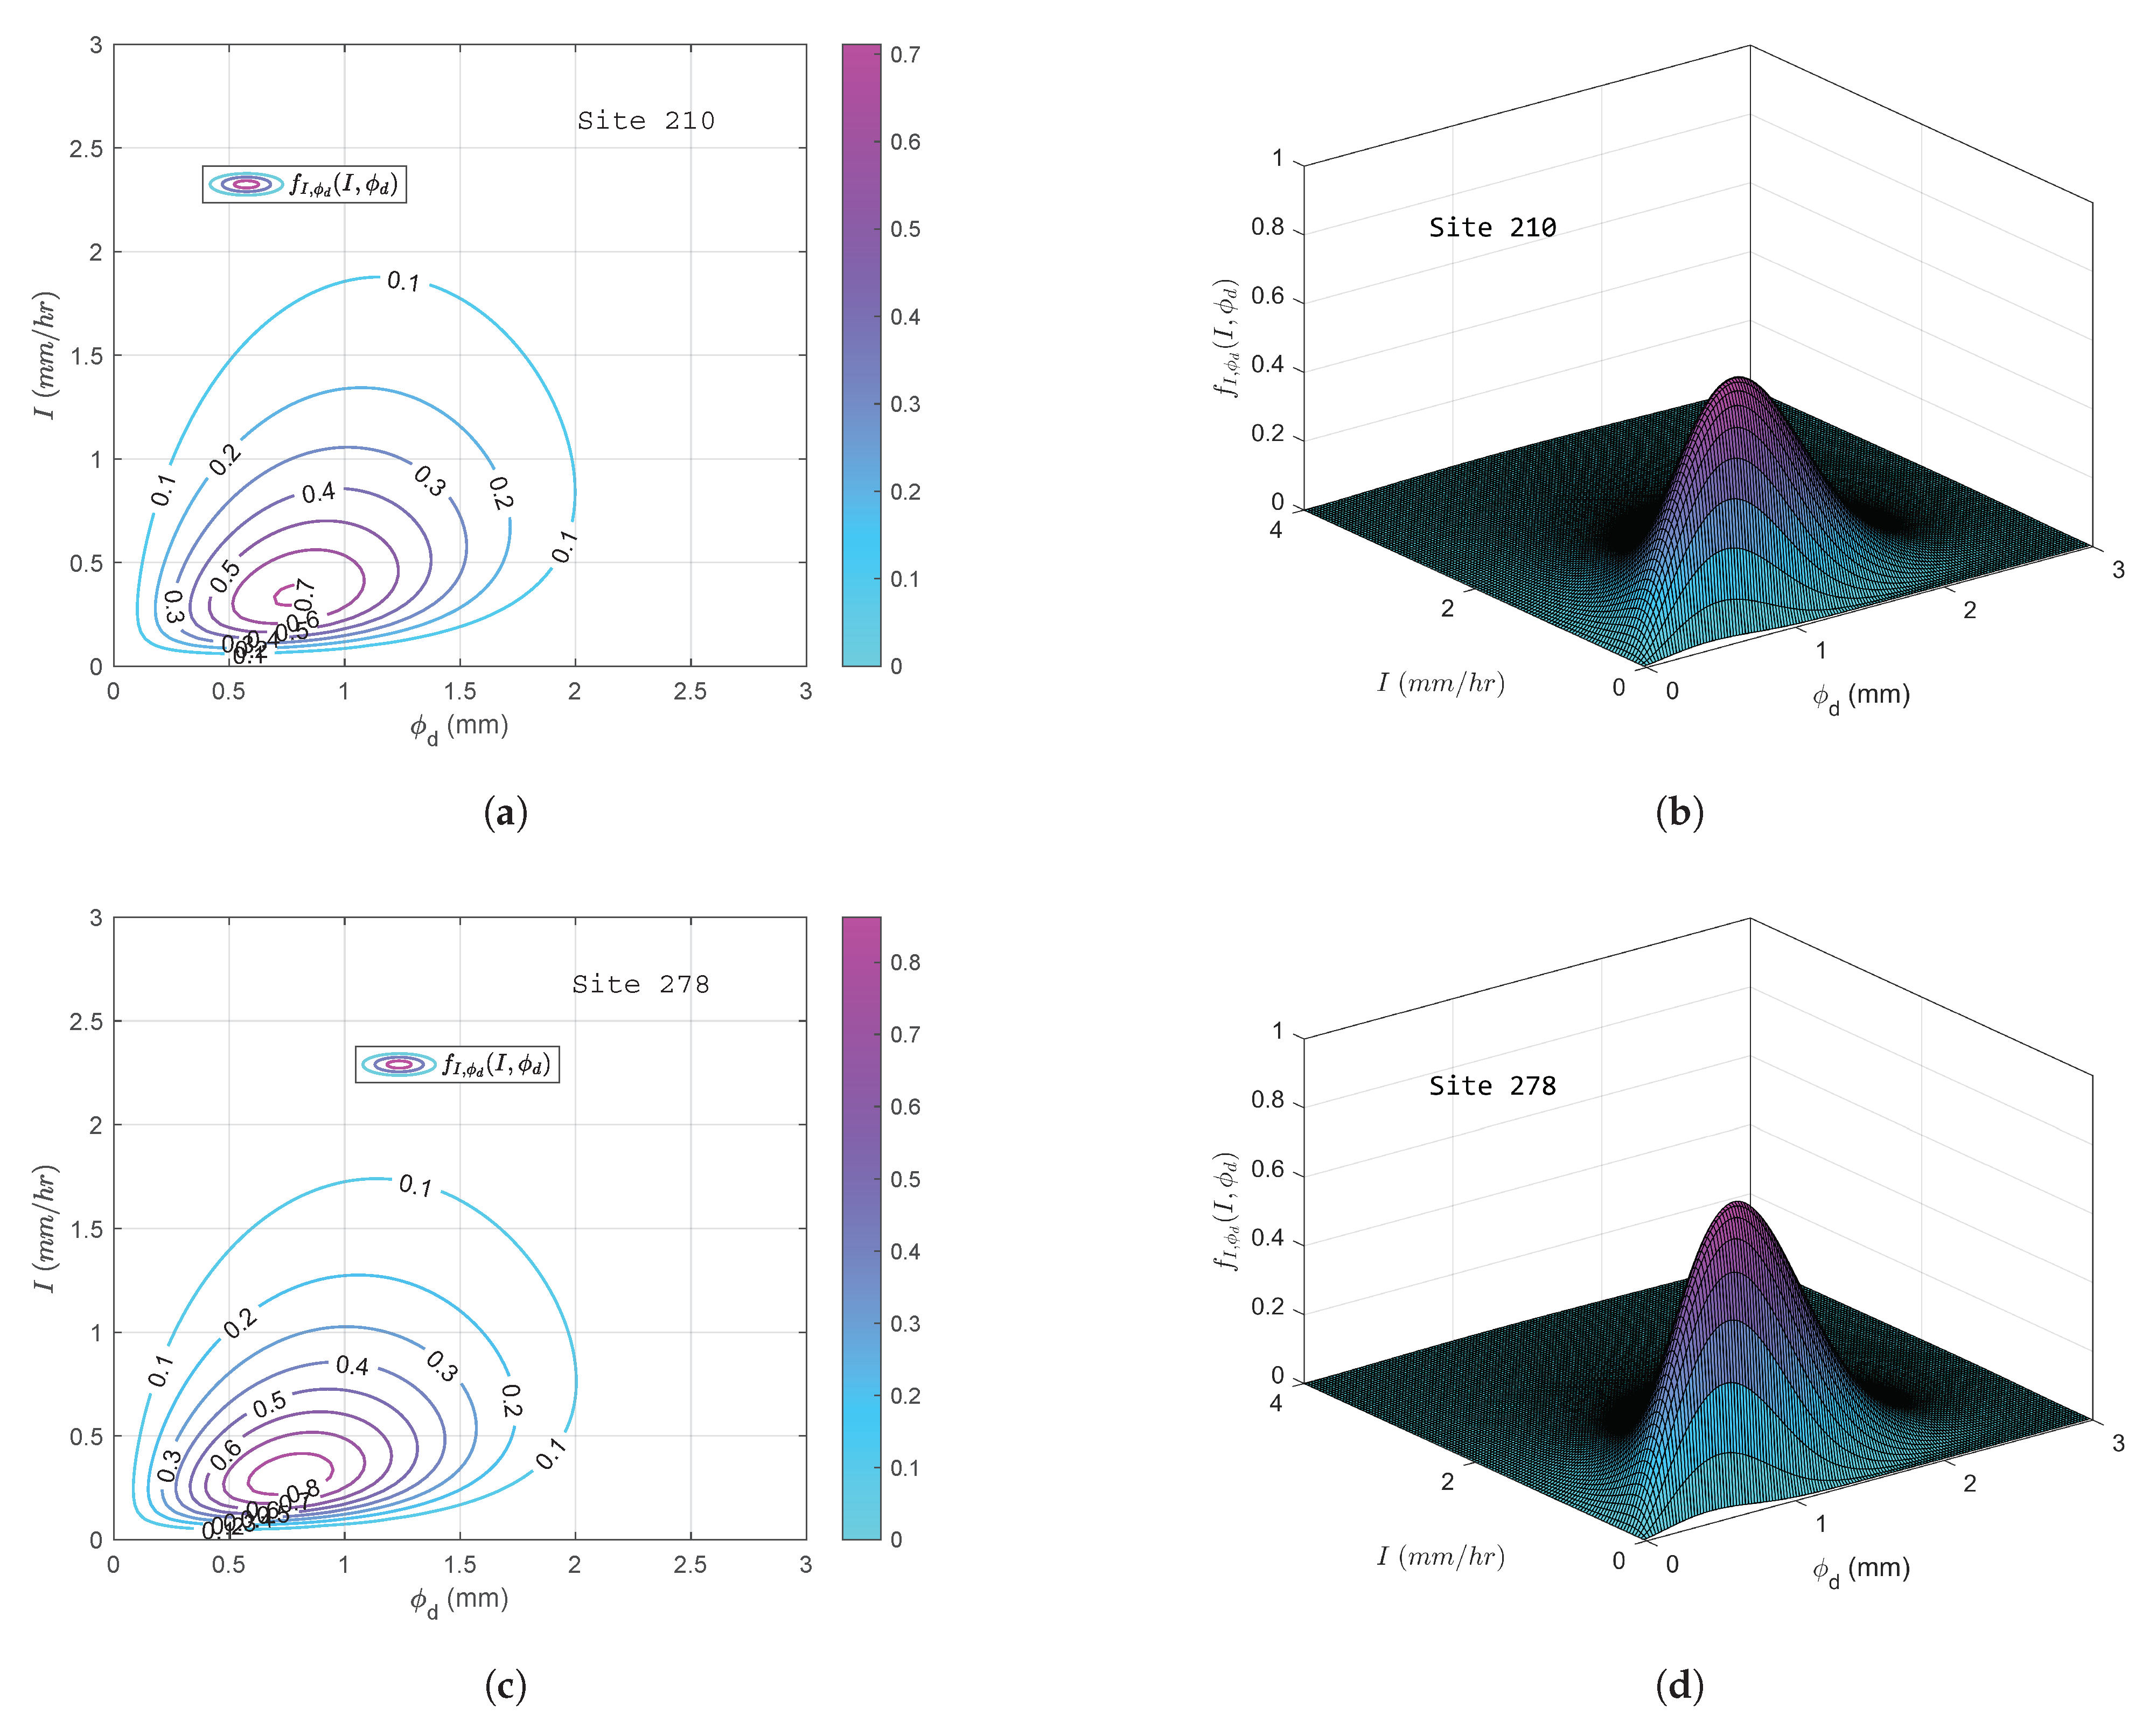
3.1.1. Probabilistic Rainfall Model

The first input in the framework is the probabilistic rainfall model that describes the measured precipitation data for a given site through the joint probability distribution of rain droplet size and rain intensity ( f I , ϕ d ( I , ϕ d ) ) along with a correction factor ( P ( I ) ) that takes into account the period of time when no rain intensity is calculated for a given site. Since the droplet size and rain intensity are dependent random variables, their joint distribution is given by the relation:
f I , ϕ d ( I , ϕ d ) = f I ( I ) · f ϕ d | I ( ϕ d | I )
where f I ( I ) defines the marginal probability density function (PDF) of rain intensity and f ϕ d | I ( ϕ d | I ) represents the probability density function (PDF) of droplet size, also referred to as DSD.
The marginal distribution of rain intensity ( f I ( I ) ) in the framework is obtained by fitting the rain intensity data using the log normal distribution. This distribution was found suitable for representing rain intensity data in our previous work [38]. The probability density function (PDF) of the log normal distribution is given by:
f ( x ) = 1 2 π σ x e ( ln ( x ) μ x ) 2 / 2 σ x 2 ; x > 0 , and σ x > 0
where μ x is the mean and σ x is the standard deviation of the logarithmic data, being the log normal distribution parameters, and they are obtained by the maximum likelihood estimation method (MLE) method. Further, the DSD is obtained by fitting droplet size recorded at a site to a two parameter Weibull distribution.
Note that both the distributions—marginal distribution of rain intensity and DSD—are site specific. However, in this study, the site-specific marginal distribution of rain intensity ( f I ( I ) ) is known for each site through historical meteorological data. The droplet size data were not available for all the sites considered, and hence, the empirical Best’s DSD was used, which describes the distribution of droplet sizes for a given rain intensity. The DSD is given by the equation:
F ϕ d | I ( ϕ d | I ) = 1 e x p ϕ d 1.3 I 0.232 2.25
where F ϕ d | I ( ϕ d | I ) is defined as the cumulative distribution function (CDF) of the DSD. I is defined as the rainfall intensity expressed in mm/h, and ϕ d is the droplet diameter expressed in mm. Further, as discussed, ( P ( I ) ) is included in the framework, which is defined as the percentage of the occurrence of rain of a given intensity at a given site during the blade service life. This parameter is used as a correction factor to the joint PDF of rain intensity and droplet size as this distribution is calculated by only considering the wet periods for the site. However, it is known that the precipitation events are non-continuous, and there are times when there are no rain intensities recorded at a given site; thus, no rain-induced erosion damages are expected on the blade. Thus, P ( I ) for a site is determined from the raw rain data according to the rainfall category described in Table 1.
Table 1. Classification of rainfall types to calculate P ( I ) (the definition of P1, P2, P3, and P4 taken from [39]).
Type of RainfallRange of Intensity (mm/h)
Dry periodNo I recorded
Light rainfall (P1) 0 < I < 2.5
Moderate rainfall (P2) 2.5 I < 10
Heavy rainfall (P3) 10 I < 50
Very heavy/violent rainfall (P4) I 50

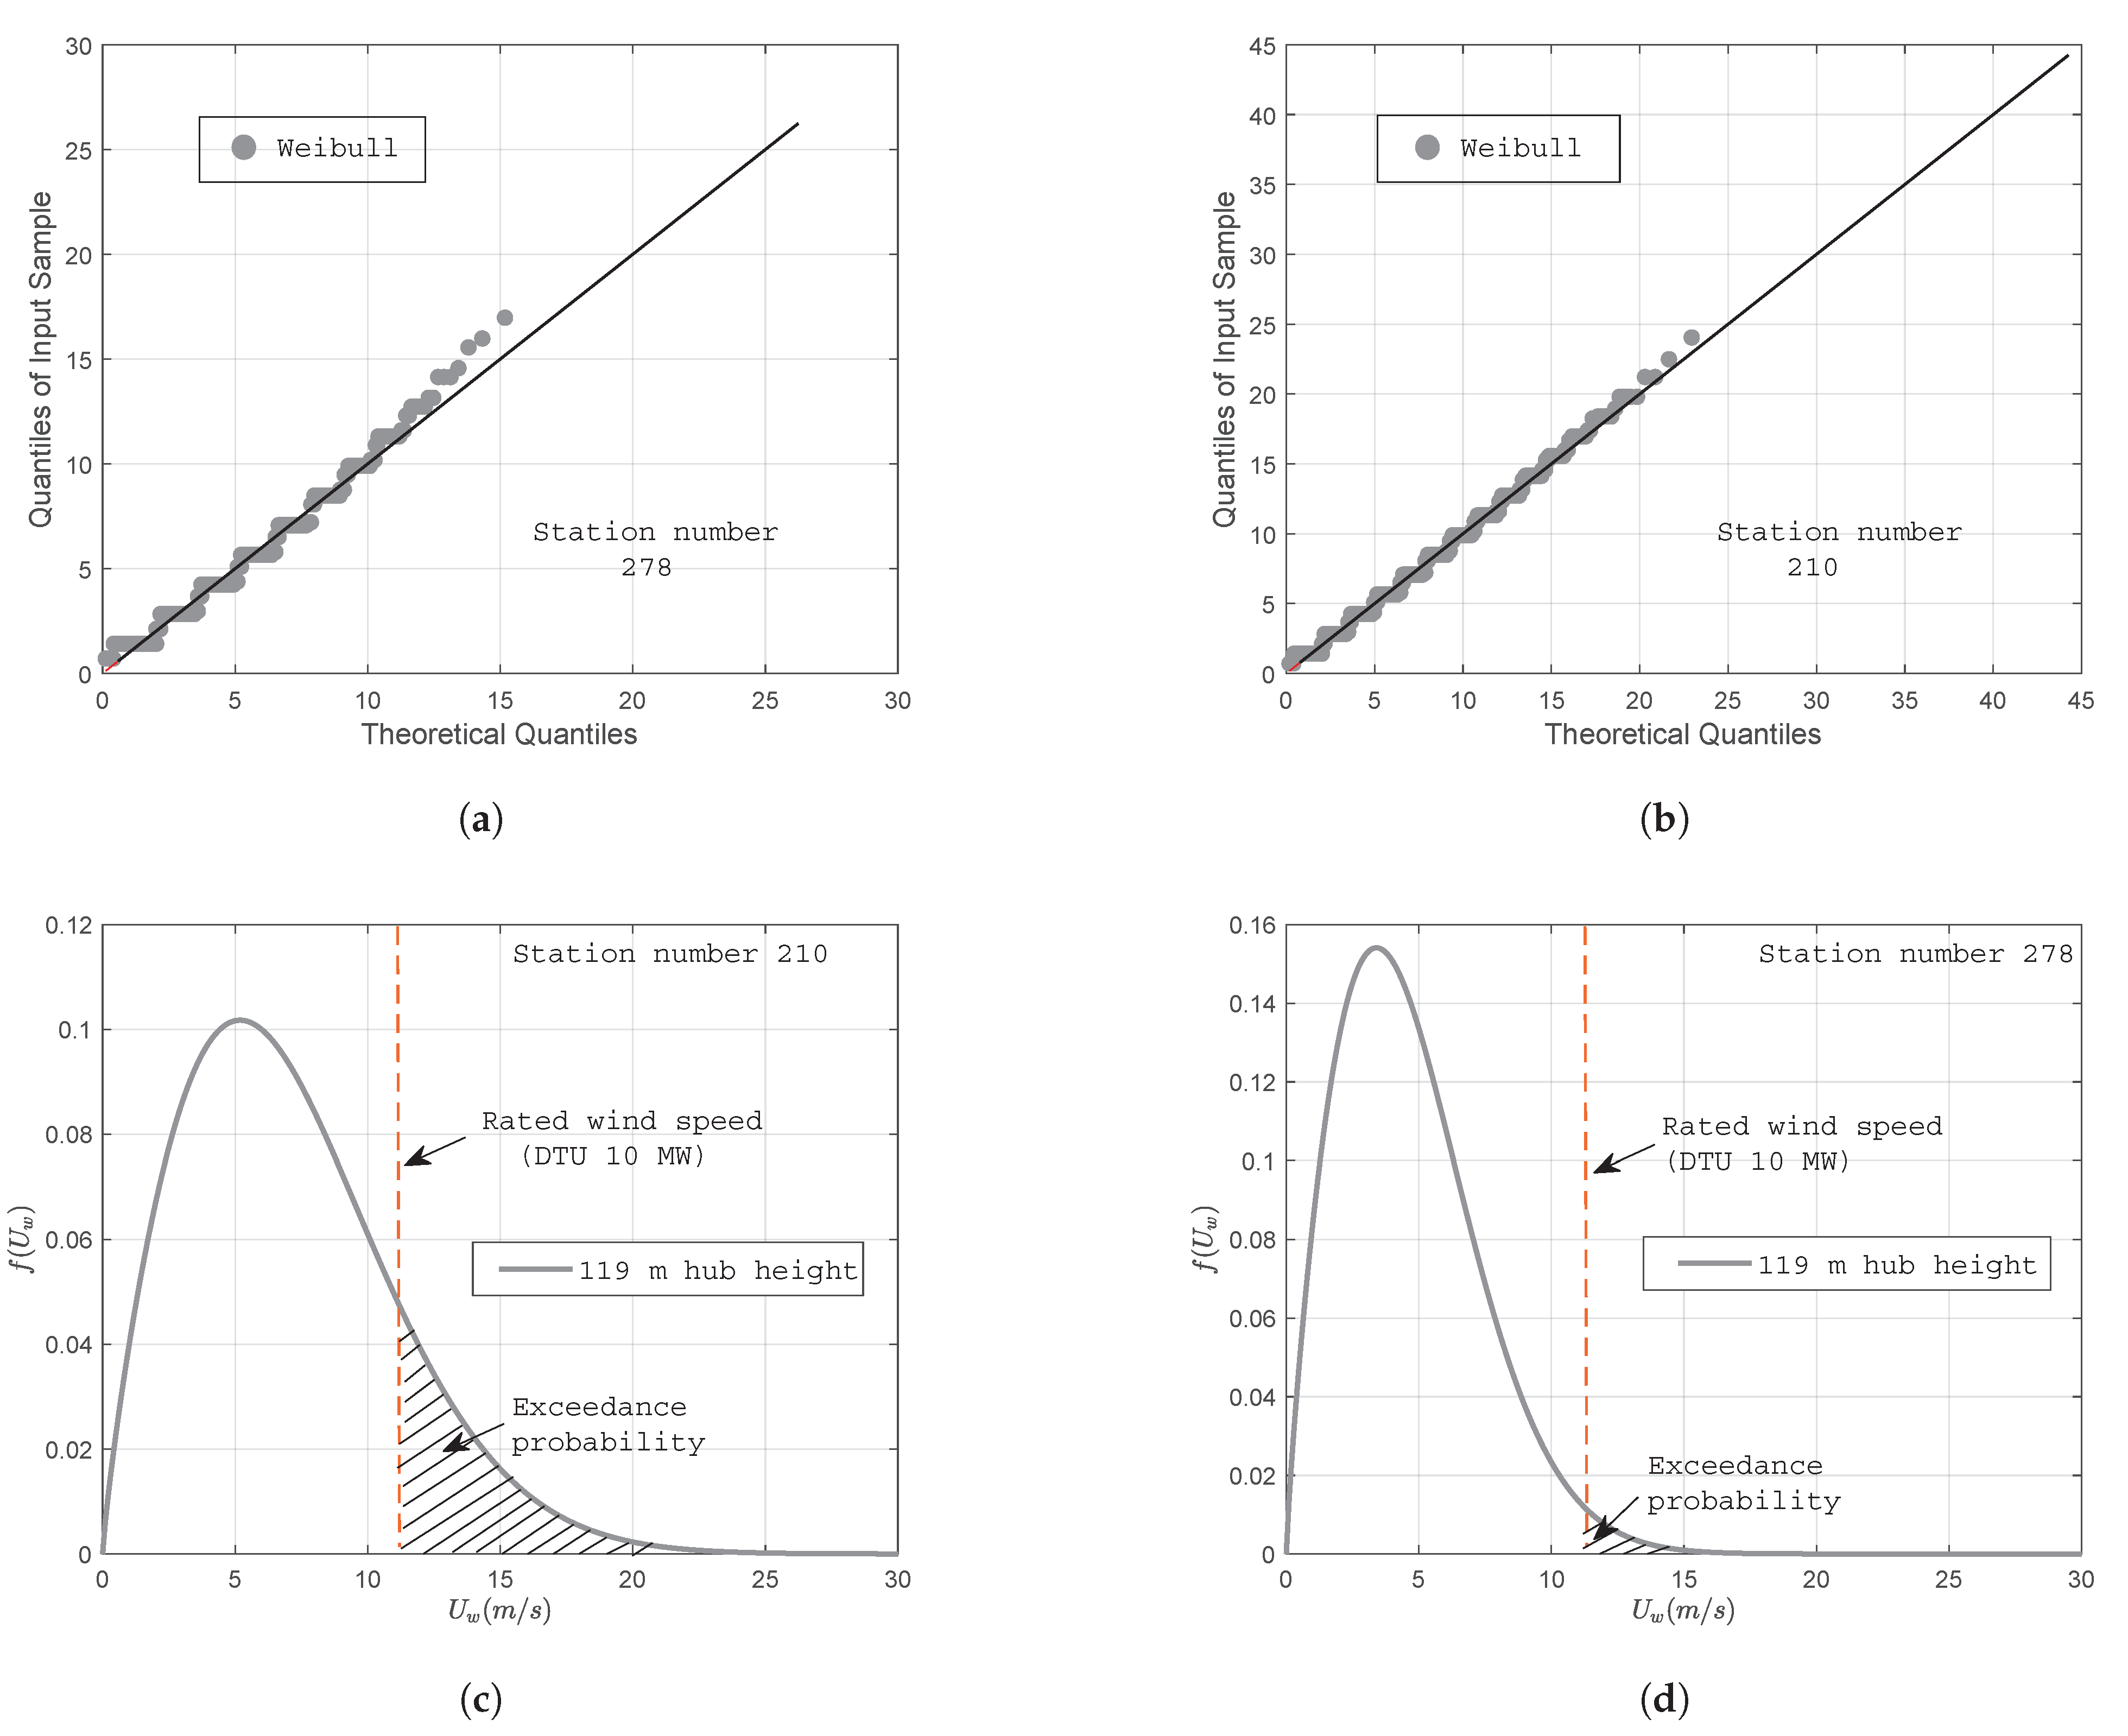
3.1.2. Wind Statistical Model

The wind statistics for a given site is described by the marginal distribution of wind speed at the hub height. This distribution is related to the speed with which the wind turbine blade will rotate during the operation. This will determine the impact speed, the resulting stresses, and subsequent damage of the LEP solution. The marginal distribution of the wind speed is given by the two parameter Weibull distribution, which is found to fit the wind speed data satisfactorily in the literature. The distribution is given by:
f U w ( u ) = α u β u u β u α u 1 · e x p u β u α u
where α u is the shape parameter and β u is the scale parameter. Both parameters are obtained by using the maximum likelihood estimation (MLE) method. Note that generally, the wind speed data are recorded at the reference height of 10 m, and thus, the data are corrected using the power law to account for the wind speed at the hub height. The power law is defined by:
U w ( z ) = U w ( z r ) · z z r α
where U w ( z ) and U w ( z r ) in the above equation are the mean wind speed at the desired height and at the reference height of 10 m, respectively. In the above equation, α , which is the power law exponent, is assumed as 0.14 based on the recommendations in [40].

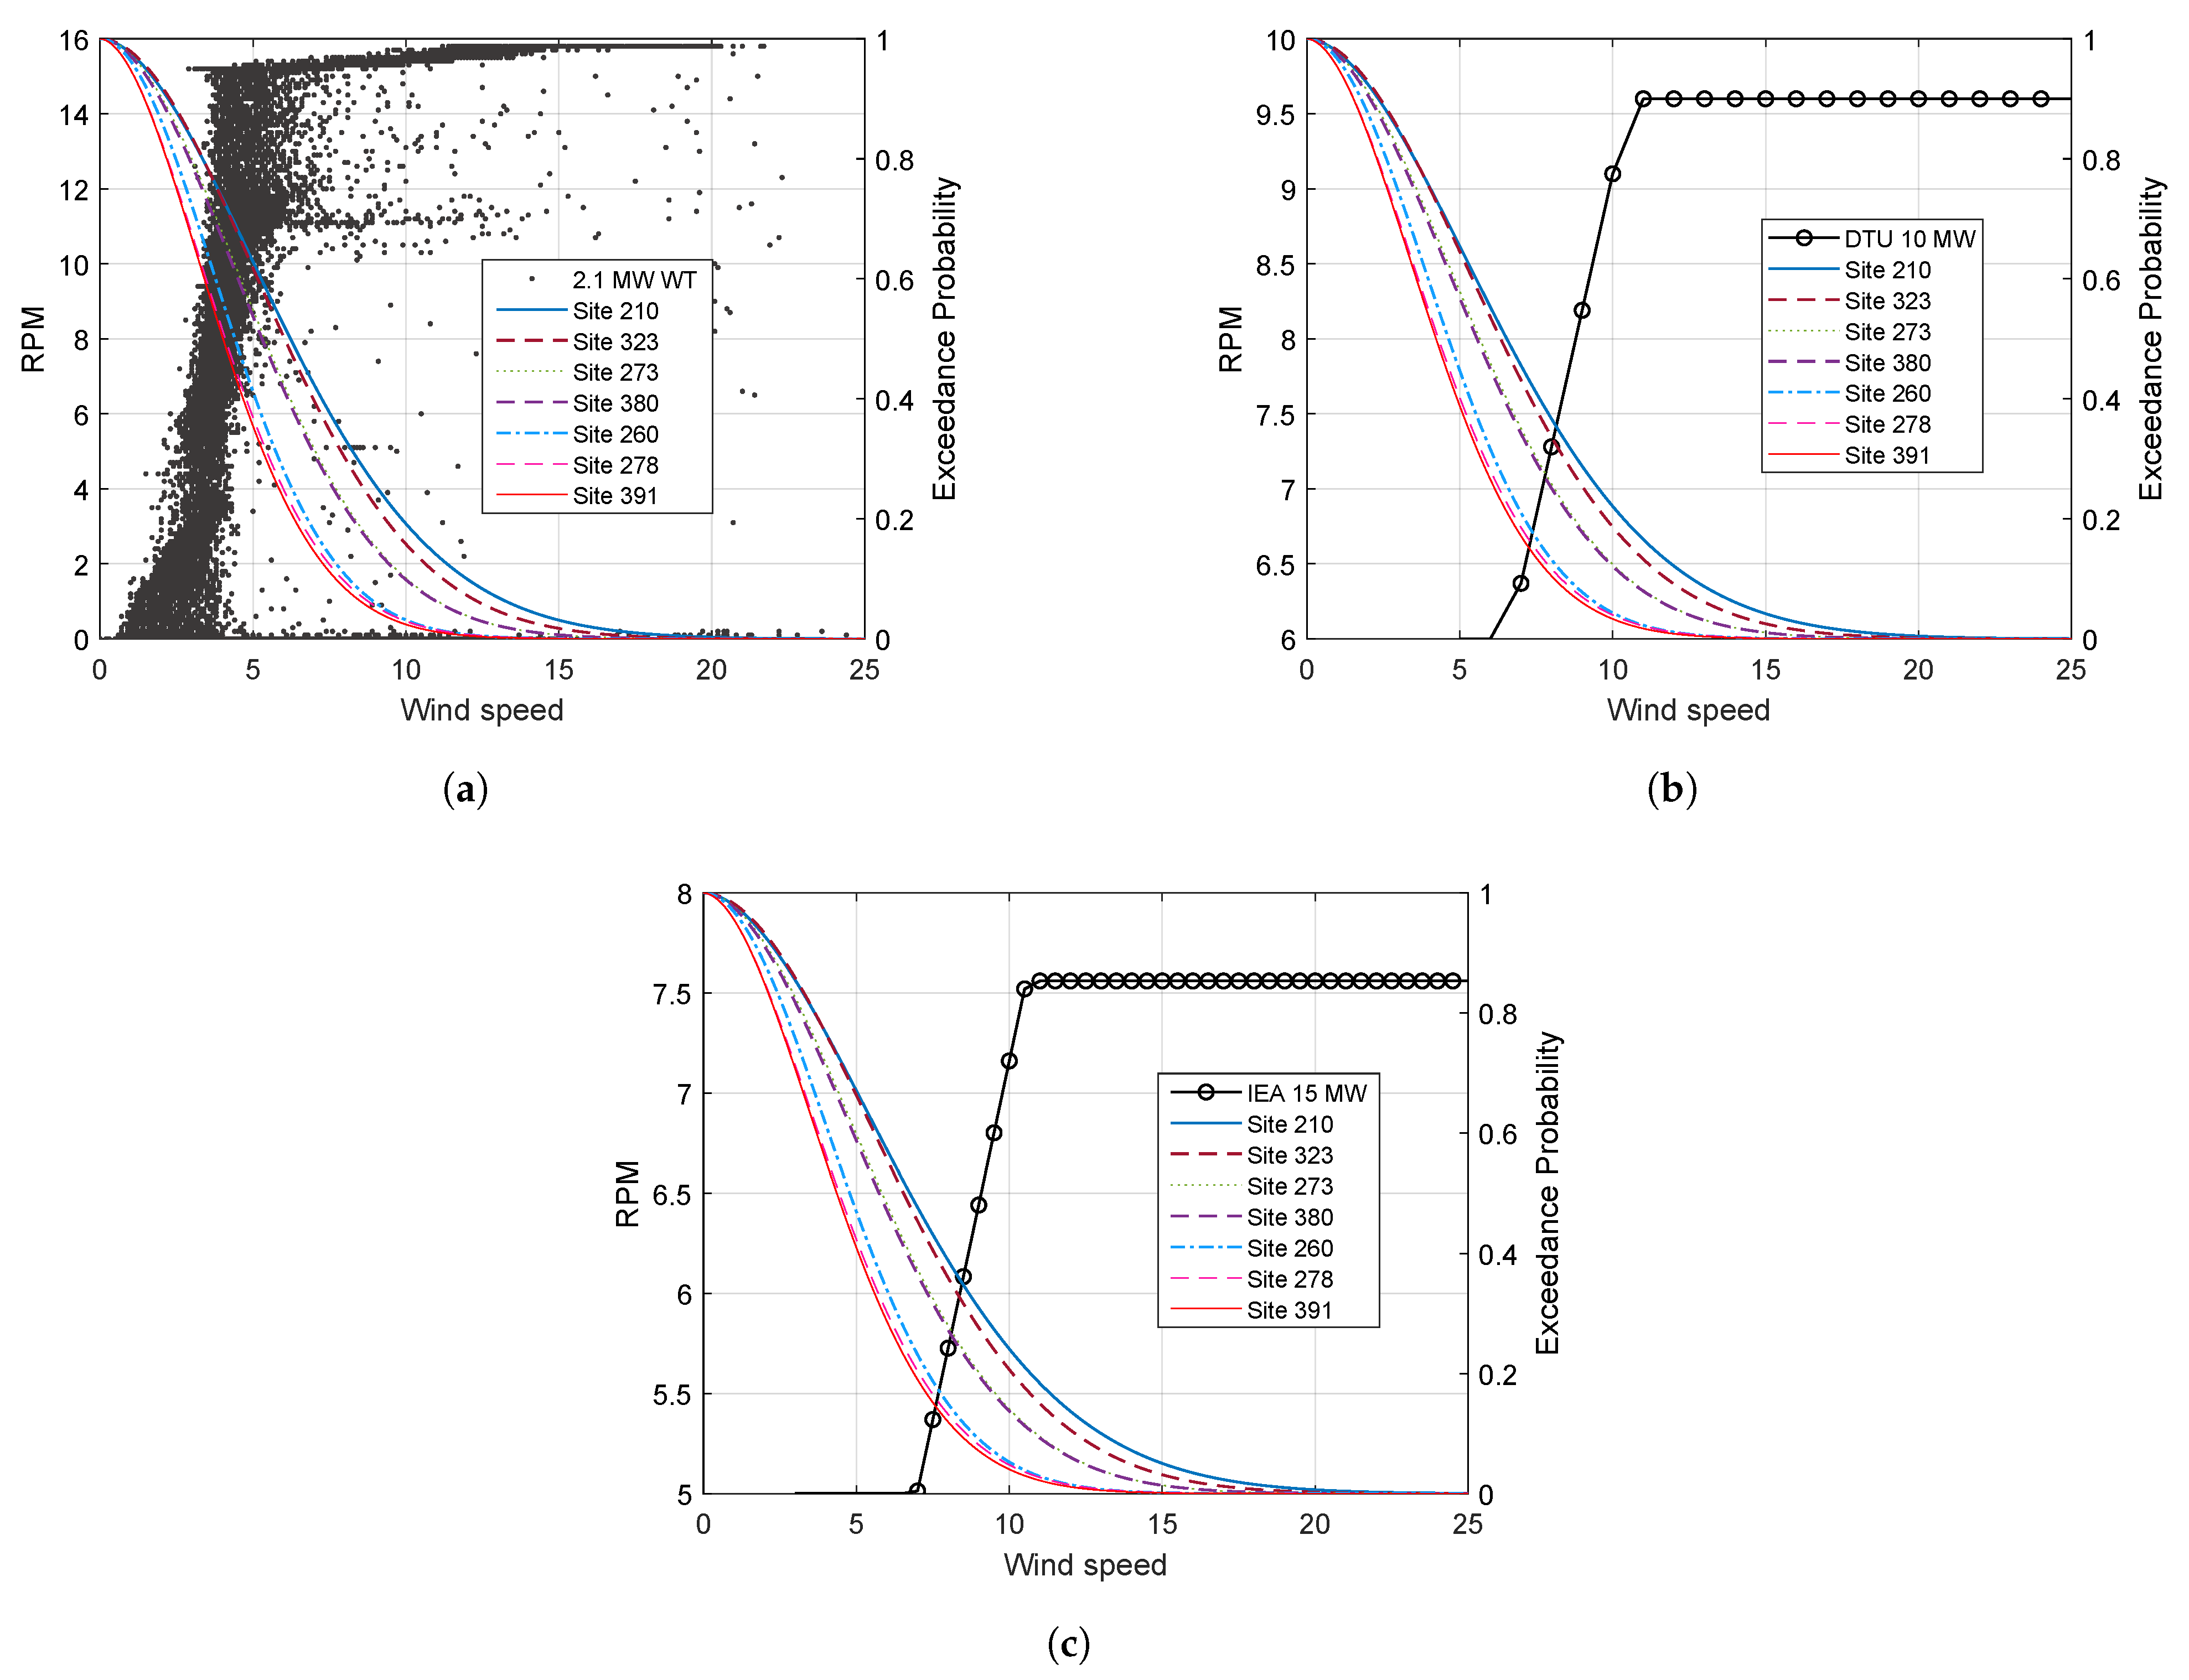
3.1.3. Wind Turbine Model

The wind turbine model is included in the framework for representing the turbine attributes that are essential for erosion analysis. It is possible to model a wind turbine in detail using aeroelastic simulation tools and analyze erosion at varying azimuth angles during the blade rotation. However, in this work, for simplicity, the wind turbine model is simply defined as a rigid body, and erosion is calculated at the azimuth angle where there is the highest impact speed expected between blade and rain droplet. Furthermore, the WTB is assumed as a straight line element and is discretized with smaller sections that determine η in the calculation. Further, the wind turbine is described with other specifications such as the hub height, as well as the RPM- U w curve, and these attributes determine the rotor speed under different wind conditions.

3.1.4. Coating Erosion Model

The coating erosion model in the framework accounts for the lab-scale erosion lifetime of a coating system, also referred to as short-term erosion damage. Principally, this model is complimentary to the lab erosion tests performed in WARER or PJET, where the samples are subjected to the accelerated rain droplet impact. In this study, Springer’s surface fatigue model [41] is utilized, which determines the maximum number of impacts ( N i c ( I , ϕ d , U w ) ) for which there is no damage to the LEP coating. This parameter is also referred to as the incubation period, and N i c ( I , ϕ d , U w ) is given by the following equation:
N i c ( I , ϕ d , U w , η ) = 7 · 10 6 · S P 5.7
for different deterministic combinations of rain and wind loading cases. In the above equation, S is the erosive strength of the coating material defined by:
S = 4 σ u ( m 1 ) 1 2 ν
where σ u , m , and ν are the ultimate tensile strength, Wöhler slope, and Poisson’s ratio of the coating material, respectively. P is the water hammer pressure defined by:
P = ρ w · c w · V i m p ( I , ϕ d , U w , η ) 1 + ρ w c w ρ s c s
where ρ w and c w are the density of water (1000 kg/m 3 ) and the speed of sound in water (1480 m/s) and ρ s and c s are the density of the coating and the speed of sound in the coating material, respectively. V imp in the above equation is defined as the maximum value of the impact speed expected between an individual raindrop and the blade during the rotation. V i m p ( I , ϕ d , U w , η ) is approximately given by:
V i m p ( I , ϕ d , U w , η ) = V b l a d e + V t g
where V b l a d e is defined as the blade sectional speed and depends on U w and η , whereas V tg is defined as the perpendicular terminal speed of individual rain droplets and is dependent on the rain intensity (I), and the corresponding rain droplet size ( ϕ d ). V tg (in m/s) is given by the relation [42]:
V t g ( I , ϕ d ) = 9.65 10.3 e 0.6 ϕ d
Further, the number of rain droplets that will hit the blade per m2 during rotation is given by:
N i ( I , ϕ d , U w , η ) = q ( I , ϕ d ) · V i m p ( I , ϕ d , U w , η ) · β d ( ϕ d )
where q is the number of droplets in a given rainfall and is given by:
q = 530.5 I V t g ϕ d 3
where I is the intensity defined in mm/h. Furthermore, β d is the fraction of droplets that will hit the blade during rotation (impingement efficiency) and is given by the relation [43]:
β d = 1 e 15 ϕ d
Finally, the short-term erosion damage rate D ˙ i S T ( I , ϕ d , U w , η ) for a given rain and wind loading described by deterministic combinations of I , ϕ d , and U w is given by:
D ˙ i S T ( I , ϕ d , U w , η ) = N i ( I , ϕ d , U w , η ) N i c ( I , ϕ d , U w , η ) · 4 π ϕ d 2
Note that it is essential to experimentally obtain the Wöhler slope, as well as other material parameters to be used in the Springer’s surface fatigue model (see Equation (9)) for the LEP material. In this study, we use a polyurethane (PU) based LEP material, and the parameters are obtained by performing droplet erosion experiments. In addition, the experimental results are also used to validate the use of Springer’s surface fatigue model for the LEP coating degradation prediction. The experimental procedure and validation method are briefly discussed in Section 4.

3.1.5. Long-Term Erosion Model

All the input models discussed so far are finally fed to a “long-term erosion model” that aids in the calculation of the coating lifetime at full scale. The long-term erosion damage rate of coating is given by the weighted sum of the short-term erosion damage rate contributed from all possible rain and wind conditions that could occur during the blade’s service life together with their probability of occurrence. The long-term erosion damage rate at a given section η is given by:
D ˙ i L T ( η ) = i j k D ˙ i S T ( I , ϕ d , U w , η ) · f I , ϕ d ( I i , ϕ d j ) · P ( I i ) · f U w ( U w k ) Δ I Δ ϕ d Δ U w
where D ˙ i L T ( η ) 1 implies the end of the incubation time.
One of the important checks during the analysis is to make sure that all possible rain and wind conditions for a given site are included in the analysis. Thus, it is essential to check that the area under the PDF curve is approximately one, i.e., the equation below is satisfied:
i j k f I , ϕ d ( I i , ϕ d j ) · f U w ( U w k ) d I · d ϕ d · · d U w 1
Finally, the LEL for the blade coating system at a given η , in years ( t years ), is defined by:
t y e a r s ( η ) = 1 D ˙ i L T ( η ) · ( 365 · 24 )
where D ˙ i L T ( η ) is defined in h 1 .

3.2. Parametric Case Studies

In this study, rain and wind data were obtained for seven different sites in the Netherlands (Figure 6; Table 2) from the KNMIdatabase for the period of the last 25 years. These seven sites were chosen in such a way that different geographical locations all around the Netherlands were taken into account. For instance, Site 323 (Wilhelminadorp) and Site 210 (Valkenburg) are coastal sites, while other sites are mostly inland. Furthermore, Site 380 (Maastricht) is a site having the highest altitude in the Netherlands (114.3 m) compared to other sites. Further, three different wind turbines with varying power ratings—operational 2.1 MW wind turbine, DTU 10 MW wind turbine, and IEA 15 MW wind turbine—were chosen for the analysis. Their RPM- U w is shown in Figure 6b,d, and their detailed specifications that are important for erosion analysis are mentioned in Table 3. Note that unlike the DTU 10 MW and IEA 15 MW WT, the 2.1 MW WT considered in the study is a real operational WT, and its RPM- U w curve is obtained from SCADA database.

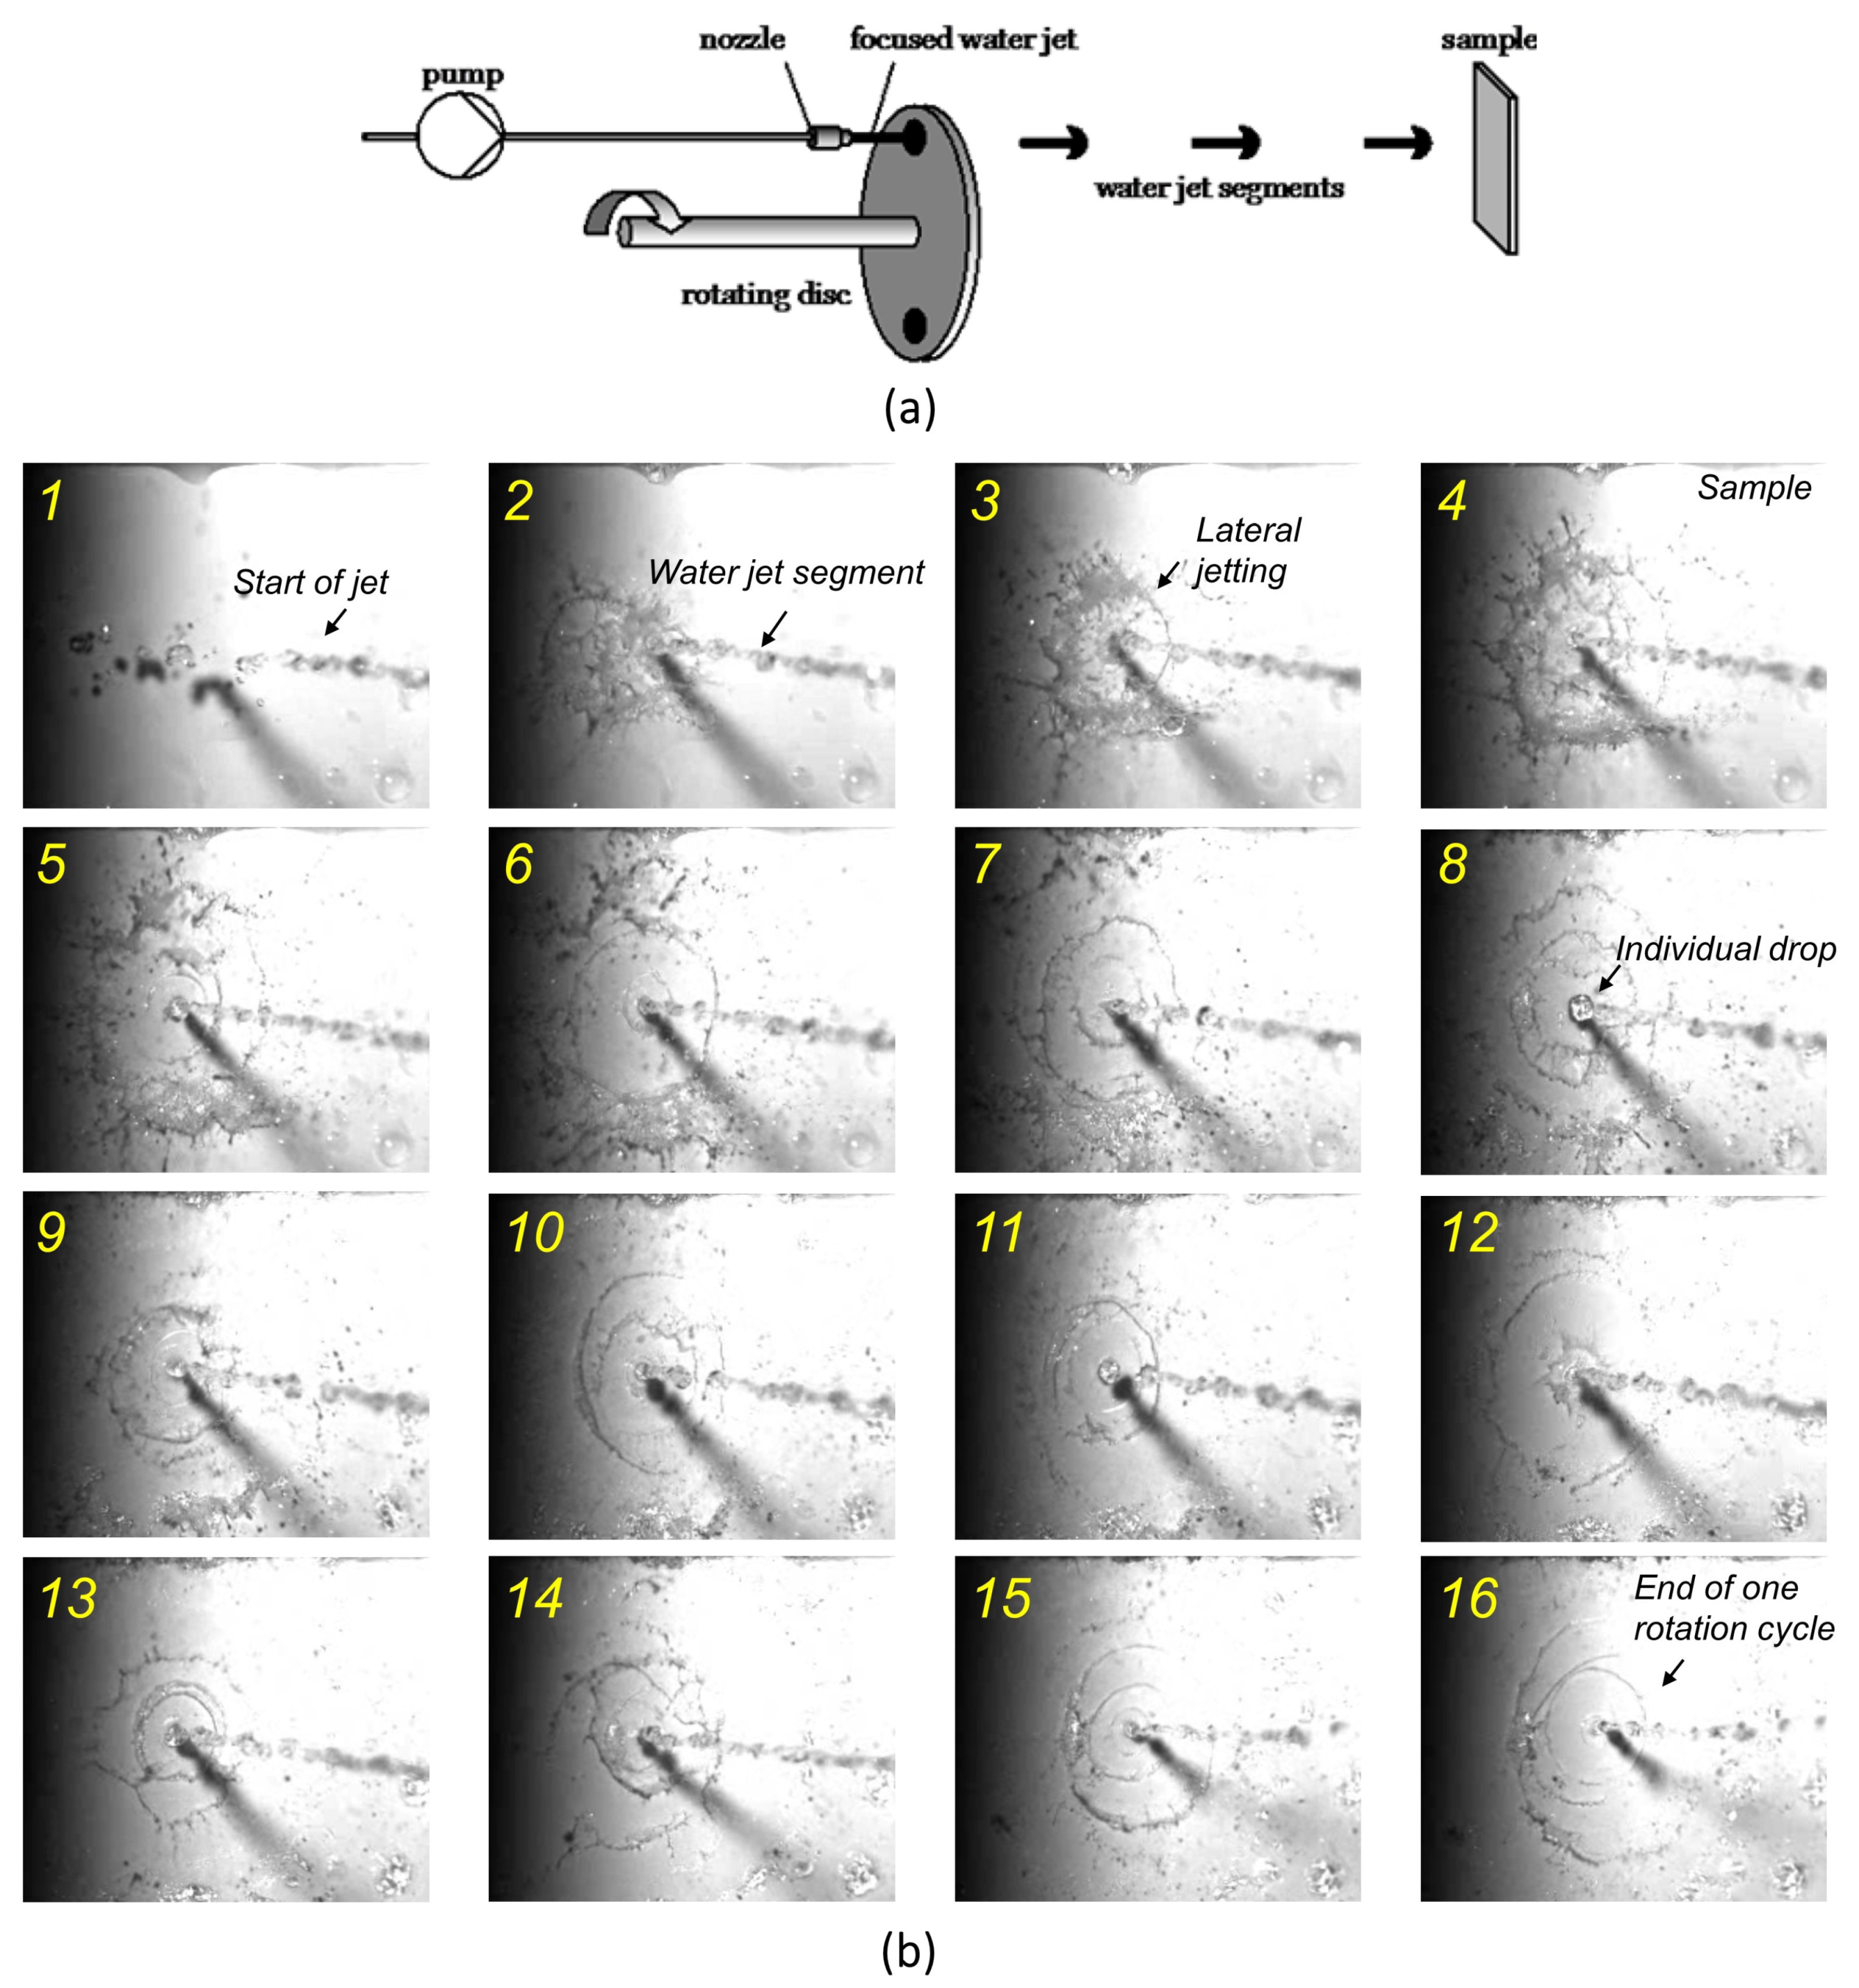
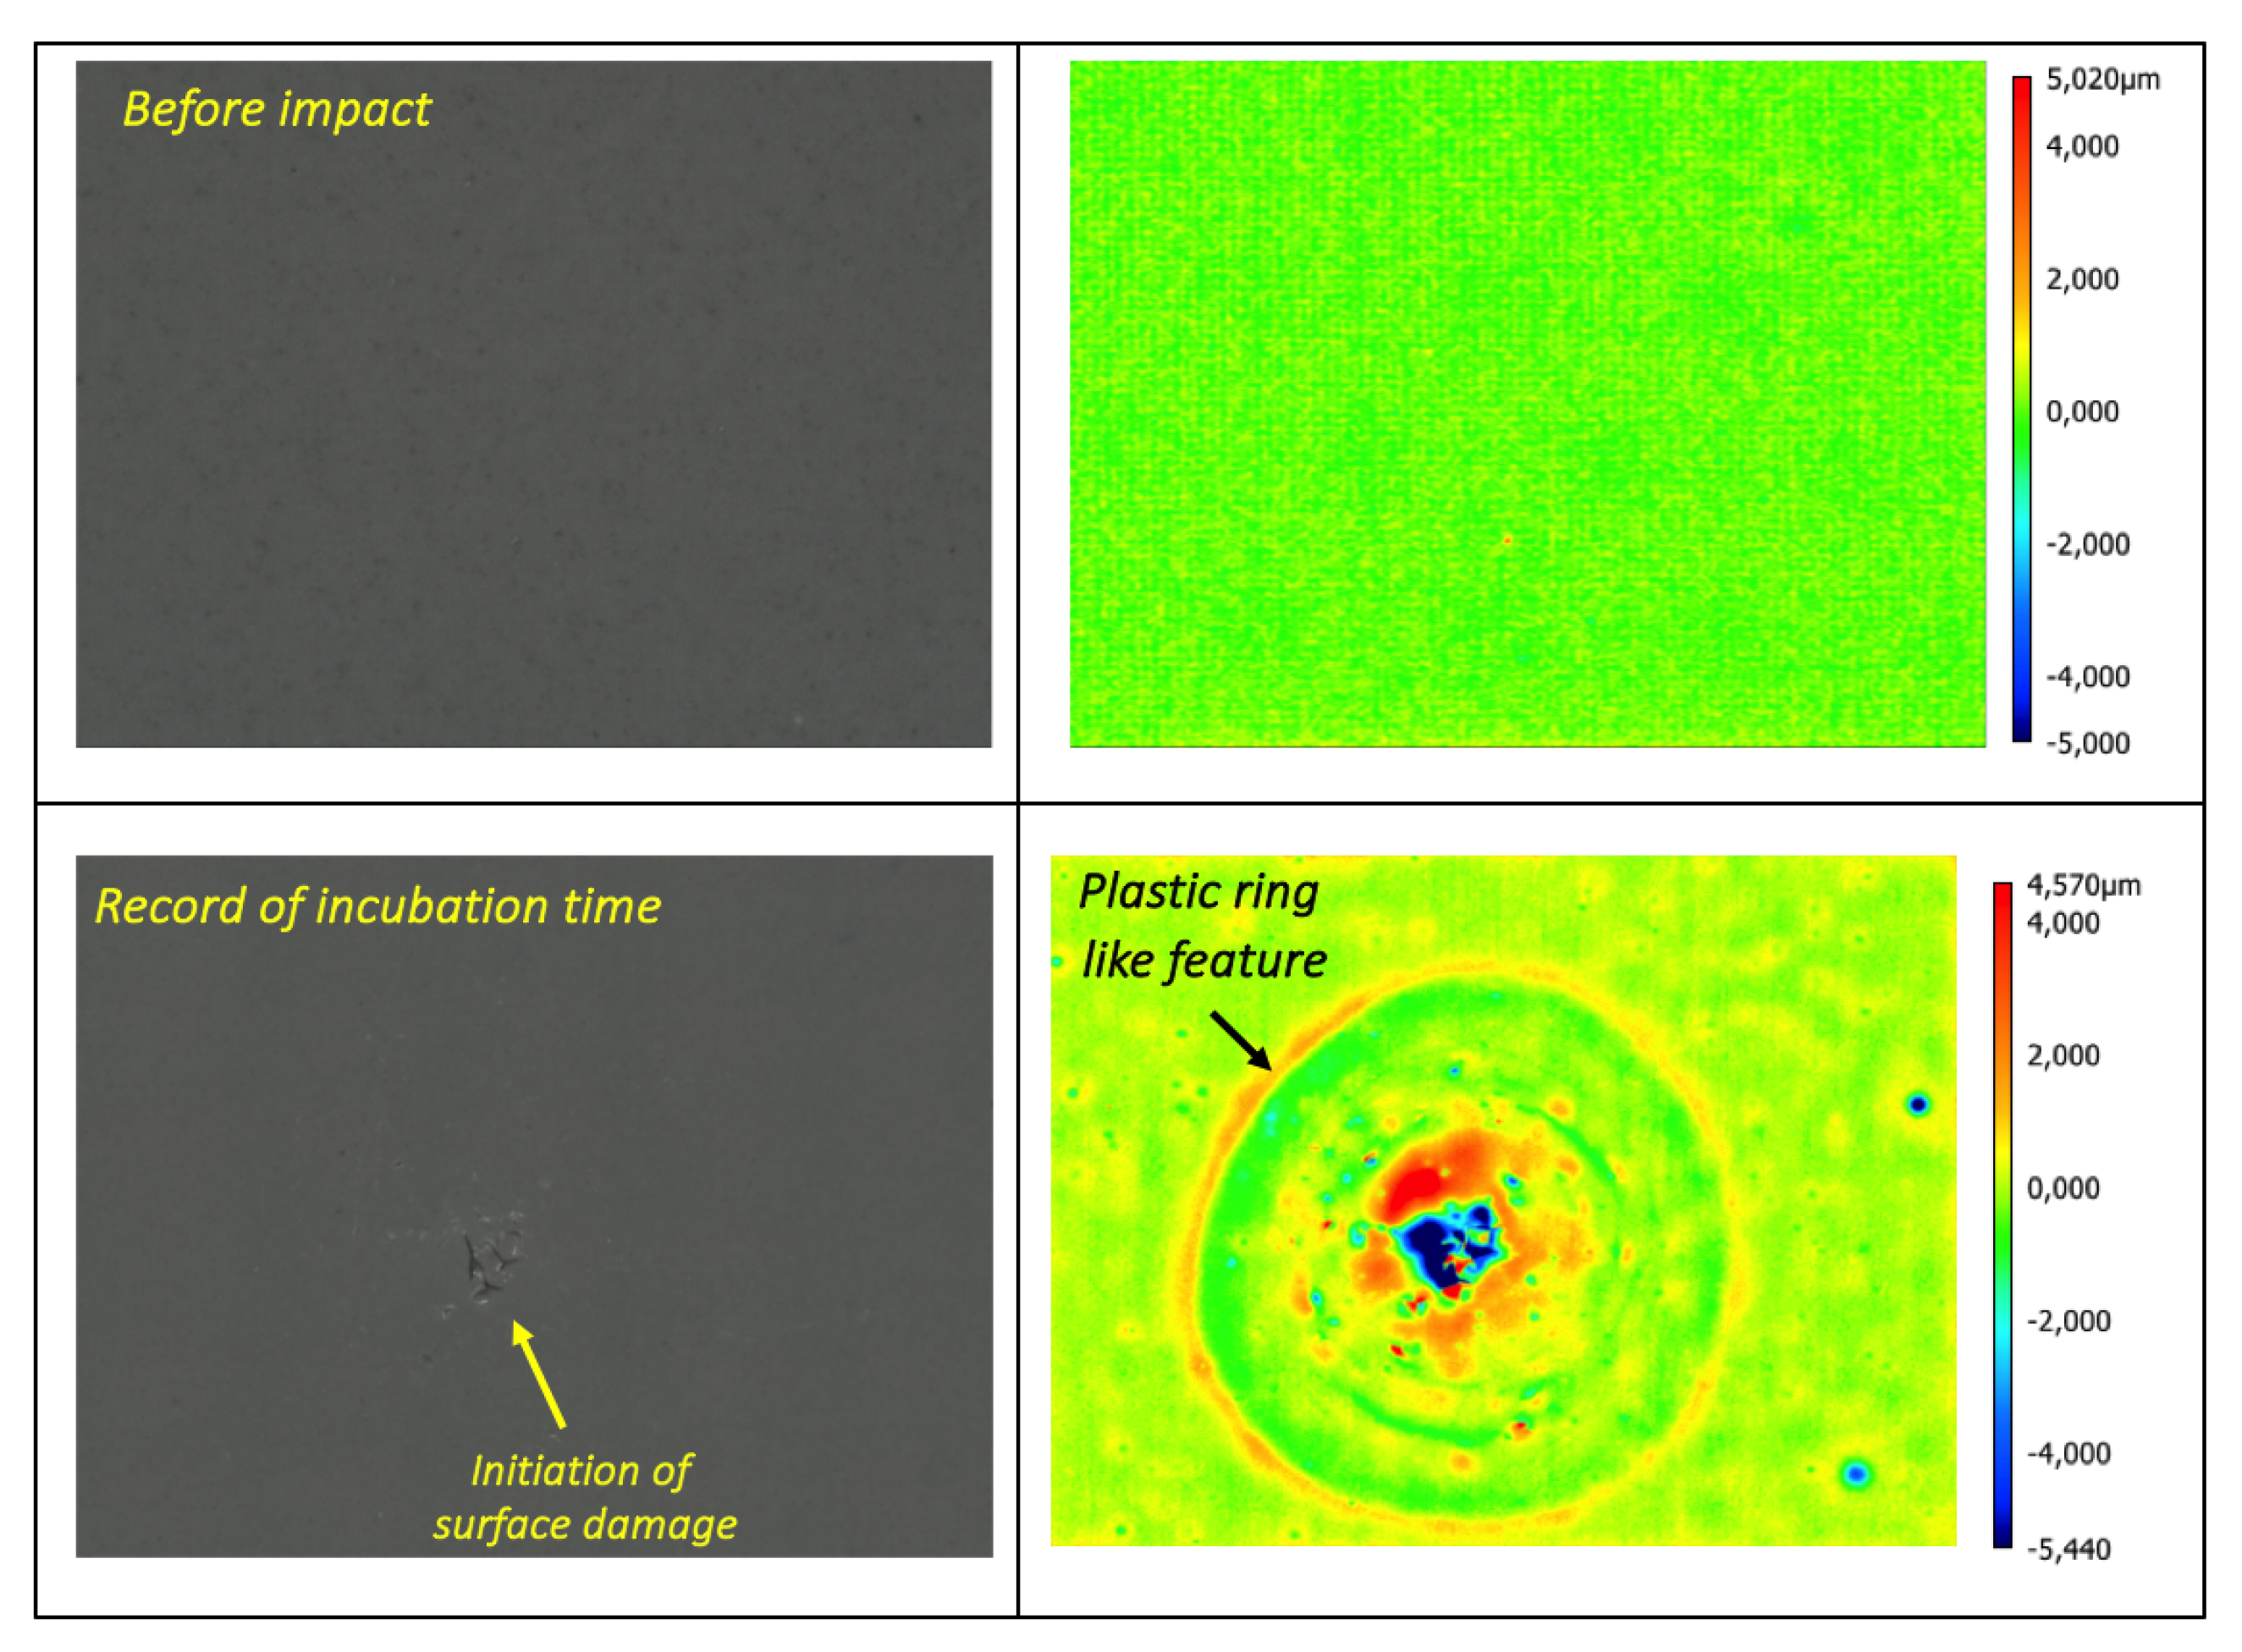
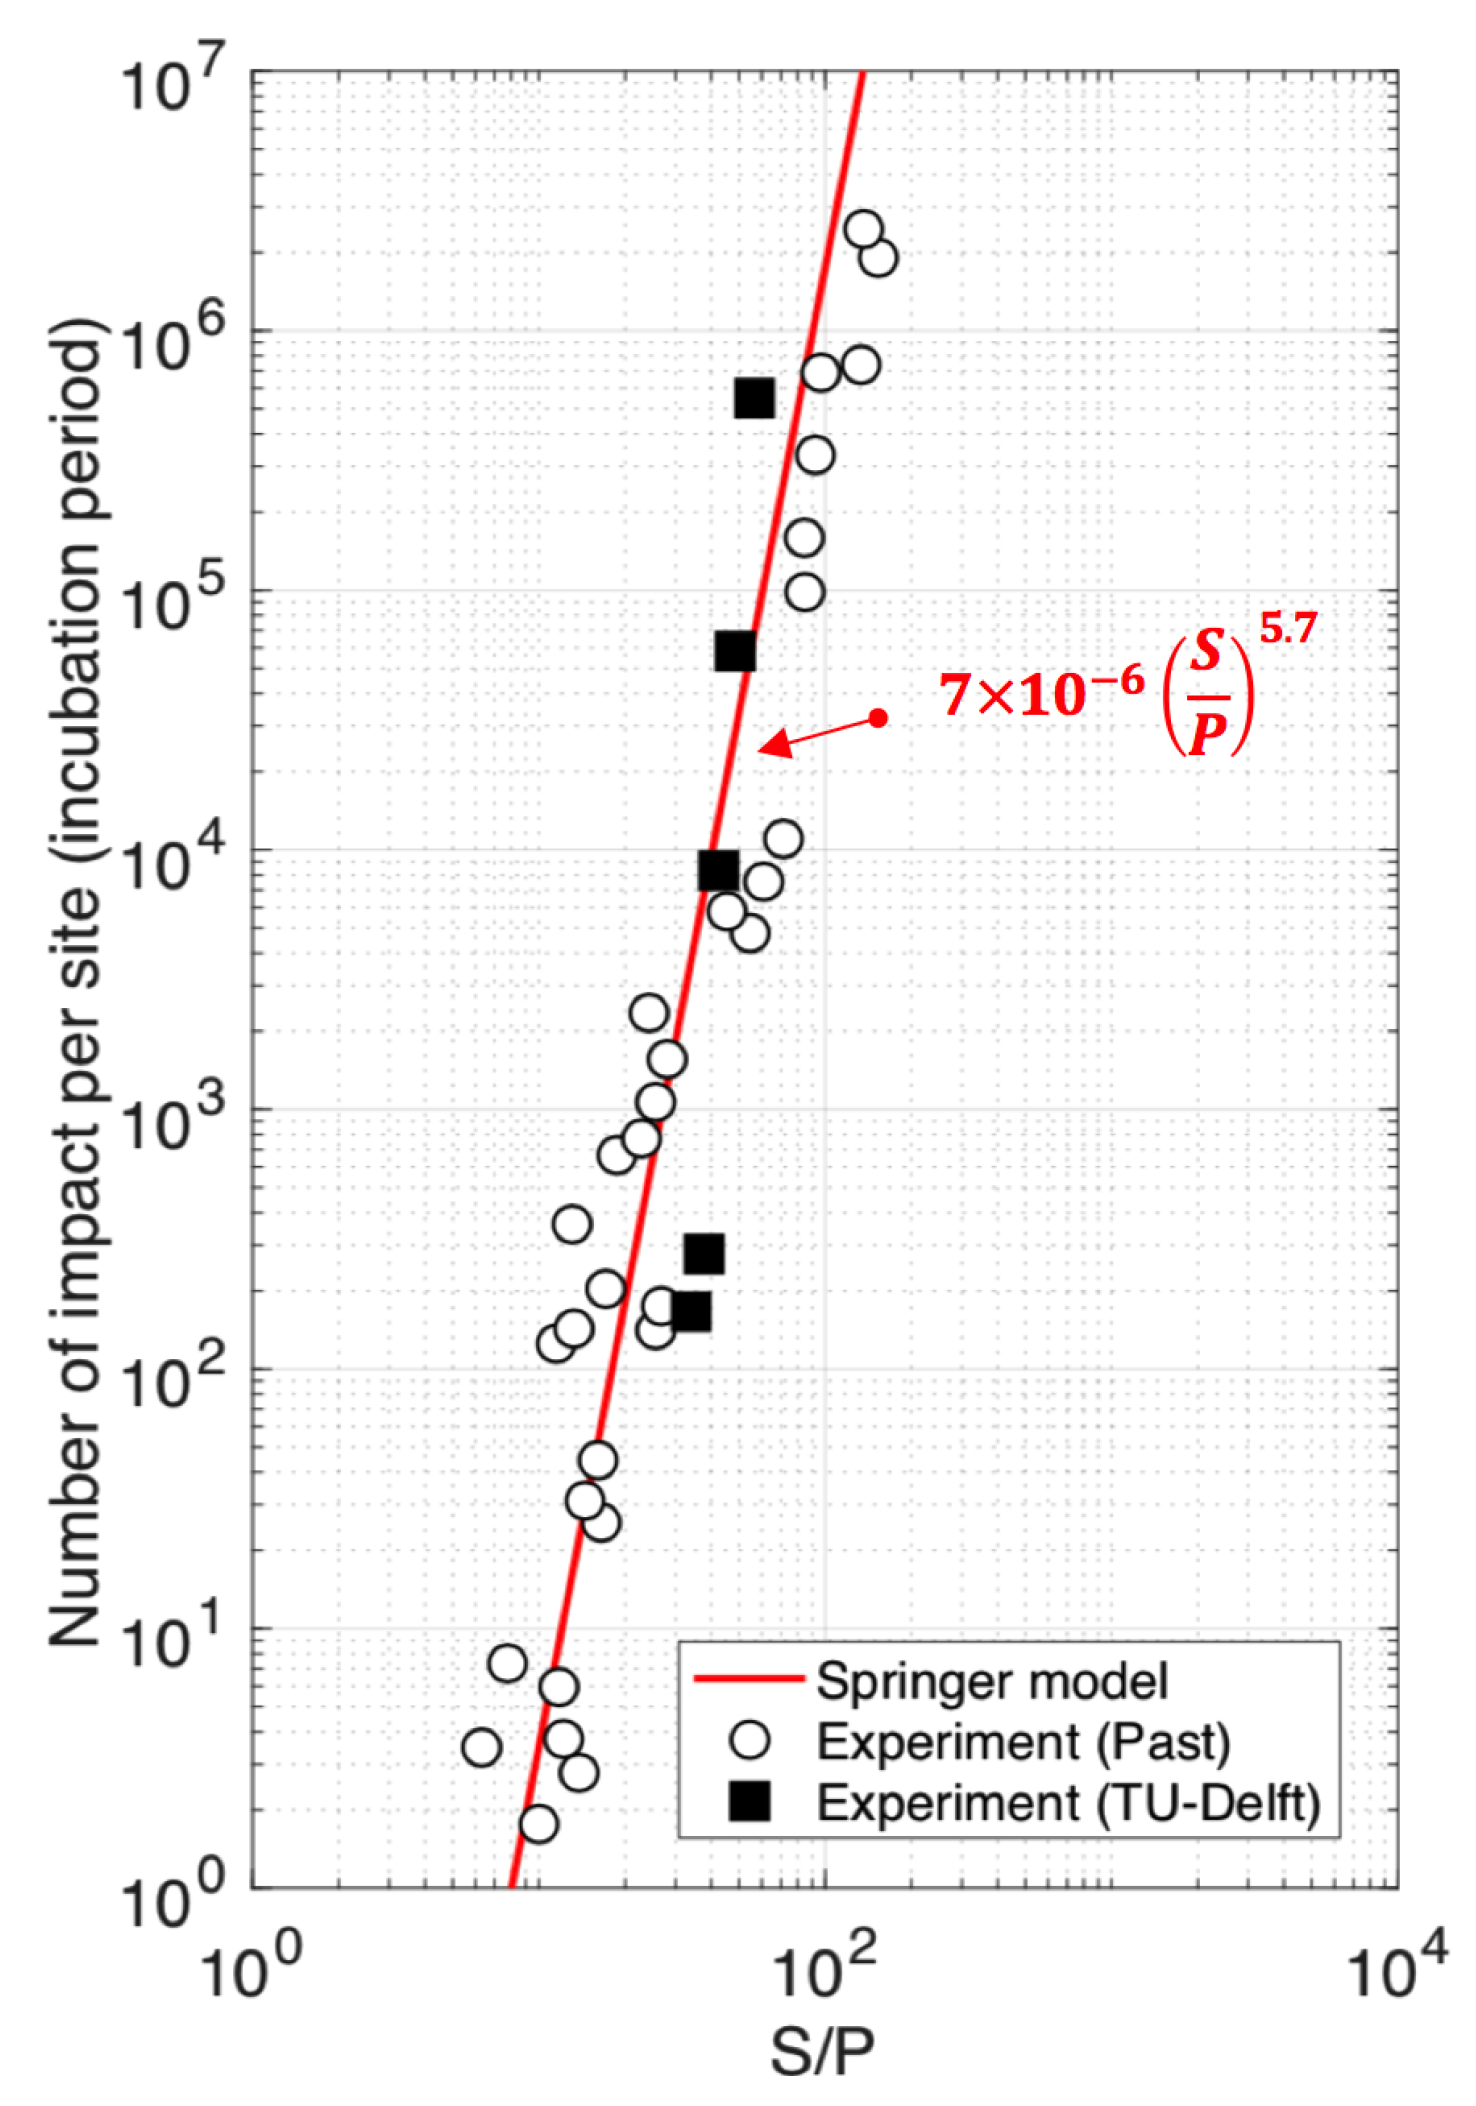
4. Experiments: Validation of Springer’s Surface Fatigue Model

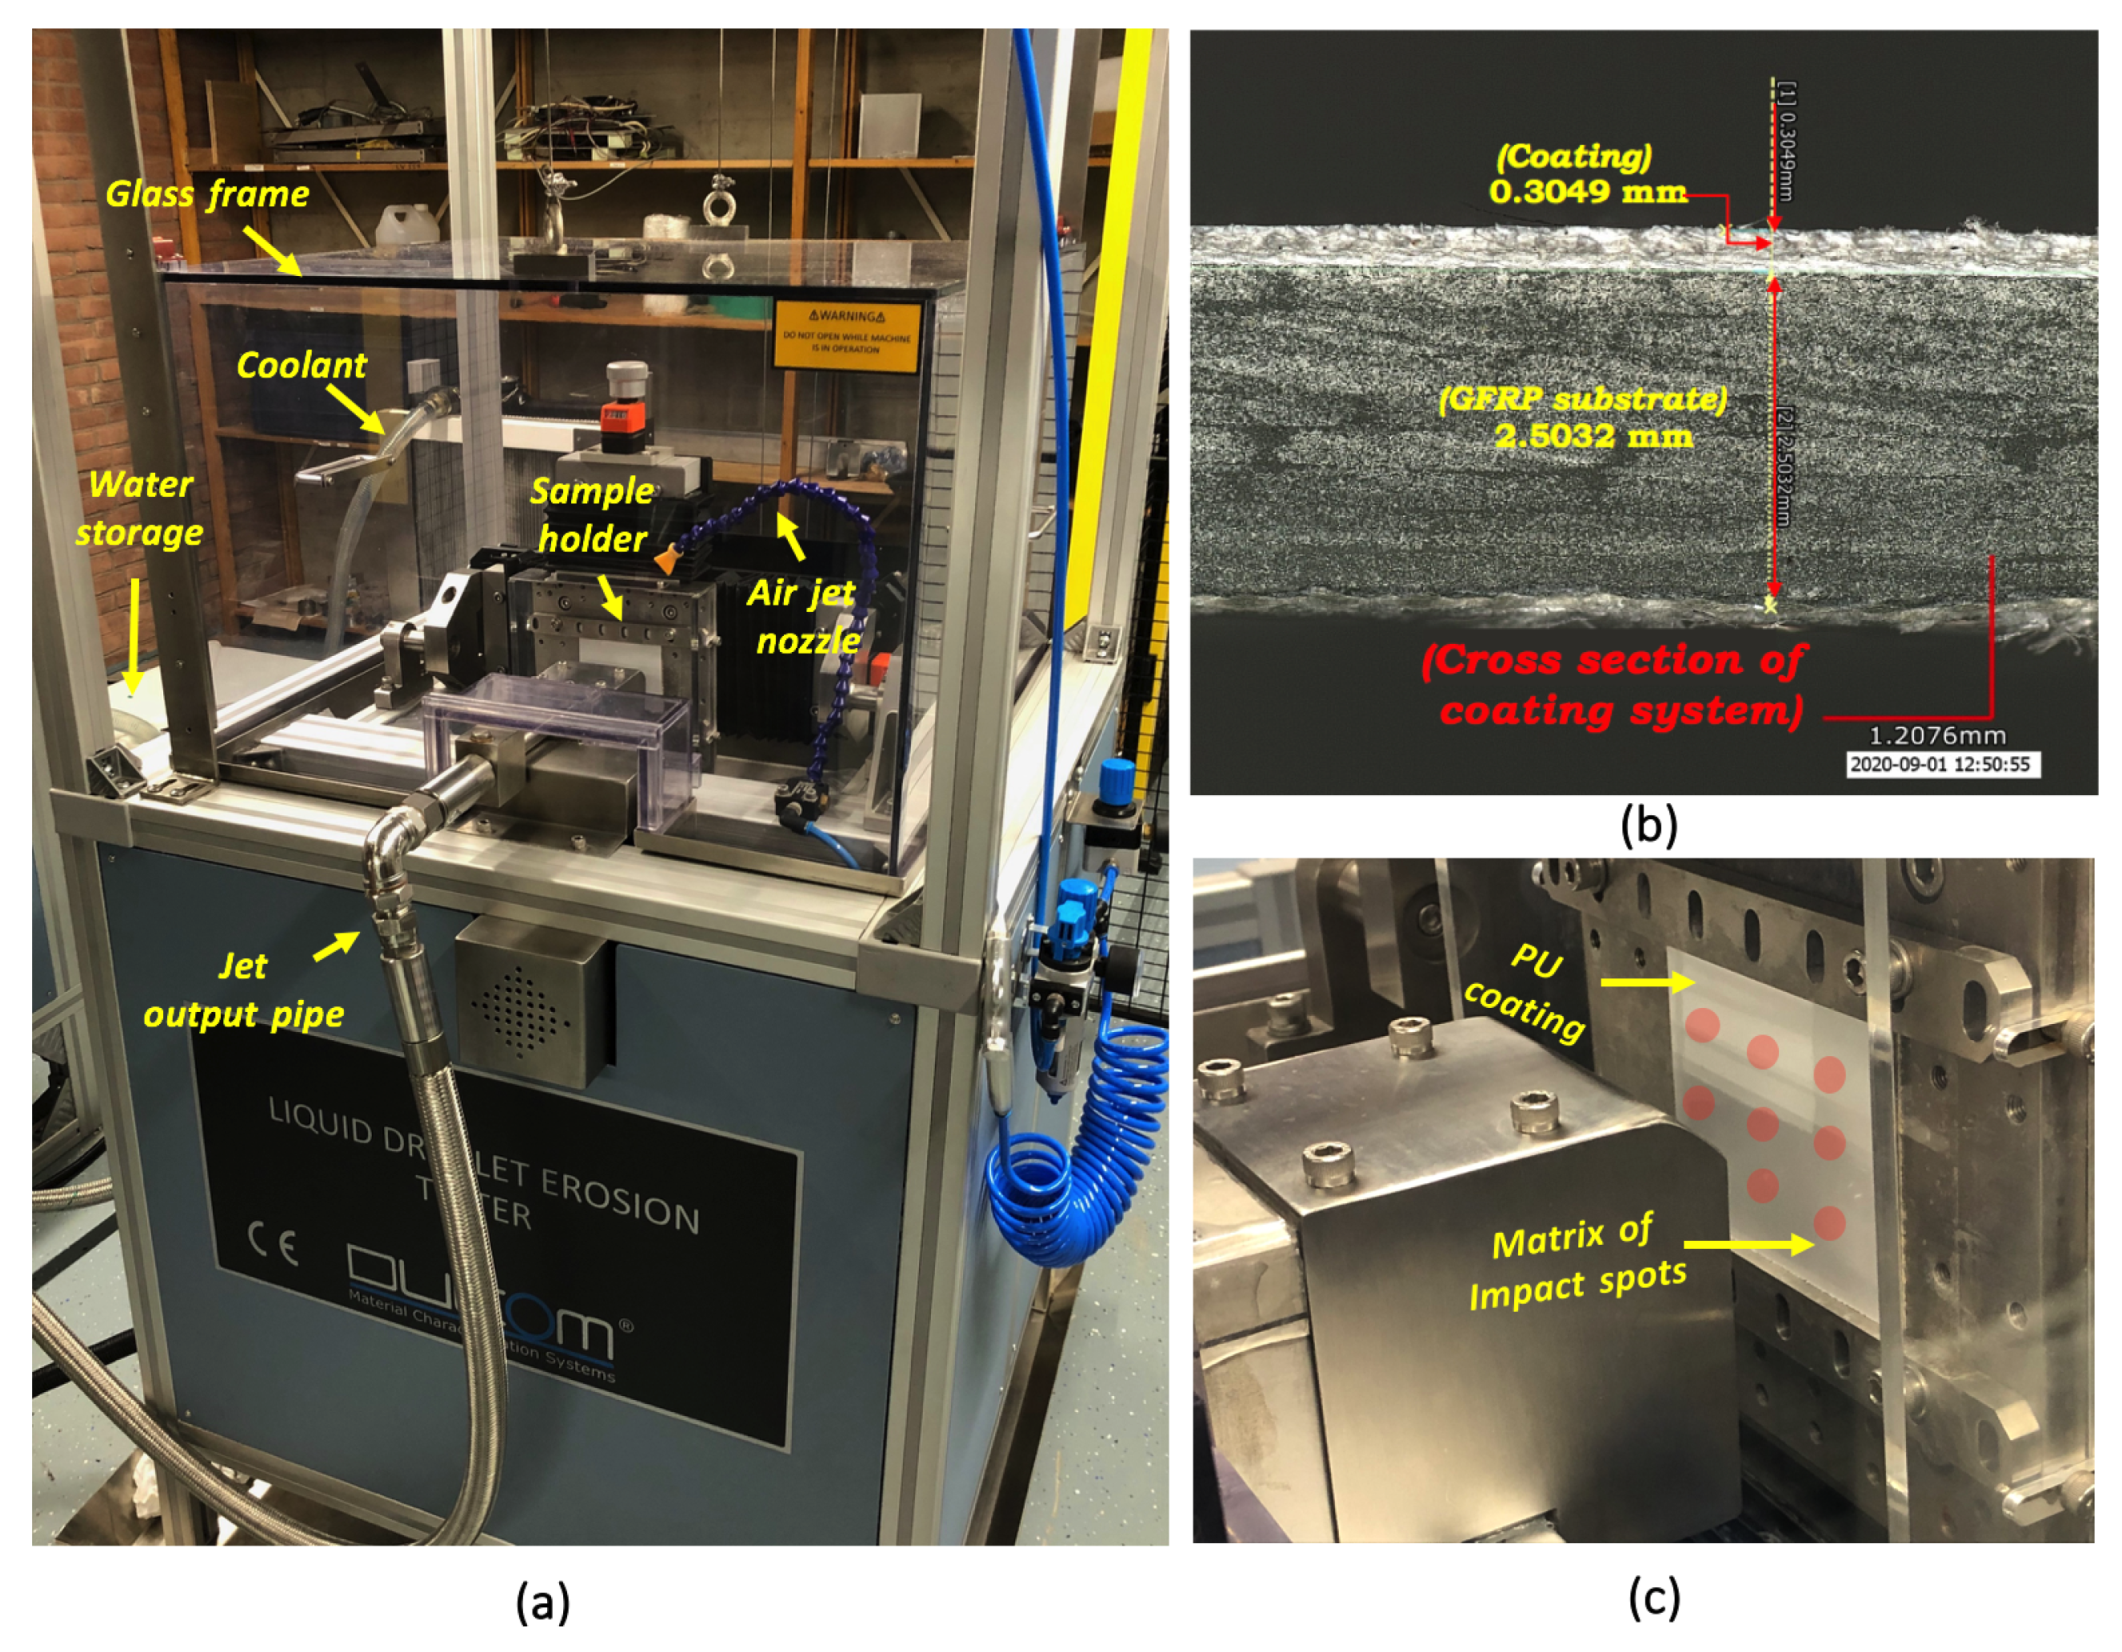
4.1. Experimental Procedure

To validate Springer’s surface fatigue model used in the framework, an experimental investigation was performed using the Ducom droplet erosion tester (Figure 7a). The droplet erosion tester is a pulsating water jet (PJET) instrument, which can be used to quantify the erosion performance of the coating by repetitive droplet impingement on the sample.
As mentioned in the previous section, a PU based LEP coating system was used in the study, and its cross-section is shown in Figure 7b. It can be seen that the LEP thickness is around 0.3 mm, whereas the thickness of the glass fiber composite (GFRP) substrate is approximately 2.5 mm. The GFRP plate was manufactured in-house using a vacuum infusion process with layup representing the realistic stacking sequence of the composite layers found at the leading edge of a wind turbine blade. After the panels were obtained, they were sent to the PU based LEP supplier to apply the coating according to the industrial standards used in practice.
For validation, the erosion test was carried out for five distinct droplet impact speeds ranging between 120 and 200 m/s, a droplet size of 2 mm, and a droplet impingement angle of 90°. A matrix modulation approach was used where the coated sample having a dimension of 8 cm × 8 cm was divided into 9 distinct matrix points, as shown in Figure 7c, and each of the points represents a test case with a chosen input parameter. Furthermore, to include variability in the test, five different coated samples were considered for each input parameter. The variability was considered within the same sample, as well as the samples obtained from different batches. Further, in the test, an impact frequency of 27 Hz was used, which was simulated using a rotating disc (Figure 8a) equipped inside the erosion tester. The rotating disc has two holes whose diameter is equal to the desired droplet size, and the disc cuts the focused water jet into individual water segments. The individual water segments then impact the sample (see Figure 8b), and the droplet jetting phenomenon was also simulated during the test, which is an essential phase of droplet impingement onto the coated surface. Furthermore, for each combination of test parameters, the incubation period was measured, and the number of droplets (N) until the incubation time for different impact velocities ( V d ) was recorded. The incubation period is defined in the study as the point of time when the evidence of the first initiation of surface damage is observed during the tests (Figure 9). Note that a ring-like feature (indicating plastic deformation) is also observed on the coated surface, as seen in the figure, along with the surface damage.

4.2. Validation Methodology

There are three important steps to validate Springer’s surface fatigue model with experimental results obtained for the LEP coating subjected to droplet impingement tests. These are: (a) the estimation of the Wöhler slope for the LEP material using the V d -N curve, (b) the conversion of the test results into a normalized Springer’s dimensionless form of S / P , and (c) finally, comparing the results with Springer’s fatigue line. The first step where the Wöhler slope is obtained was comprehensively discussed in our previous work [38]. The equation obtained for the LEP coating is:
N = 9.9 e 40 · V d 16.92
where the Wöhler slope for the LEP material is obtained as 16.92. Other material parameters of the LEP coating are also tabulated in Table 4. Once the Wöhler slope is obtained, the second step is to normalize the erosion test results in the form of Springer’s dimensionless parameter S / P given by:
S P = 4 · σ u · ( m 1 ) · ( ρ s · c s + ρ w · c w ) ( 1 2 · ν ) · ( ρ w · c w · ρ s · c s · V d )
Once the results are normalized, the last step is to compare the number of impacts obtained for the incubation period ( N i ) from the experiments with Springer’s fatigue line described by Equation (8). For this, N i is plotted on a log-log scale with S / P on the x-axis and N i on the y-axis, and the curve is overlapped with Springer’s analytical surface fatigue line (see Figure 10, where Springer’s analytical surface fatigue line is represented by a red solid line, experimental results from the study by black square dots, and experimental results from the literature by white circular dots). It can be seen from the graph that since the points obtained from the experiment are close to Springer’s fatigue line, it can be inferred that the erosion of the LEP material can be reliably described by Springer’s surface fatigue model.

5. Results and Discussion

In this section, we first present the results related to the probabilistic rain and wind model that makes up the site-specific input parameters for the erosion framework to calculate the LEP application length. Then, we discuss the results for the LEP length obtained for different WTBs based on parametric studies. Finally, statistical methods like correlation and regression analysis are performed to check the sensitivity of the LEP application length calculation with turbine-specific parameters.

5.1. Probabilistic Rain Model

Figure 11a–c presents the results for the probabilistic rain model for the coastal Site 210 (Valkenburg). As discussed before, the first step is to fit the rain intensity data of the site to a log normal distribution and extract its distribution parameters. It can be seen from Figure 11a that the rain intensity data fit the log normal distribution satisfactorily, and the distribution parameters are tabulated in Table 5 ( μ = 0.16 and σ = 0.86 ) for this site. A comparison of the empirical CDF with the theoretical CDF shown in Figure 11b clearly confirms that the rain data are well represented by a log normal distribution. Note that rain intensity data are strictly skewed to the right, and most of the rain is below 5 mm/h, while there is hardly any rain with an intensity above 10 mm/h. This can also be seen in Table 5 where the parameter P ( I ) for the site is described. The table shows that it is only 11.86% of the total time when the rain intensity is recorded at the site, and this accounts for the total wet periods in the rain dataset. Out of this, almost 10.34% is associated with light rainfall conditions ( I < 2.5 mm/h) and 1.42% with moderate rainfall conditions ( 2.5 < I < 10 mm/h), and the occurrence of heavy and very heavy rainfall conditions is negligible.
The above distribution is then combined with Best’s DSD (Figure 11c) to obtain the joint PDF of rain intensity and droplet size for the considered site. Best’s DSD describes the distribution of droplet size contained in a rain of a given intensity. For instance, there are more fractions of large rain droplet sizes in a rain of 25 mm/h compared to a rain with an intensity of 1 mm/h. Figure 12a,b presents the joint distribution of rain intensity and droplet size calculated for Site 210. The joint PDF is dominated by light rainfall conditions ( I < 2.5 mm/h) together with rain droplets of a size less than 2 mm ( ϕ d < 2 mm). The joint PDF describes the probability of simultaneous occurrences of rain of a given intensity together with rain droplets of a given size and determines the rain loading on the WTB at a given site. For instance, the probability of occurrence of rain having an intensity of 1 mm/h and the associated droplet size being 1 mm for Site 210 is around 0.325 (32%). A similar analysis was performed for all the other sites considered in the study, and the distribution parameters are described in Table 5. For instance, Figure 12c,d presents the joint PDF for rain intensity and droplet size for one of the inland sites (Site 273, Heino). The figure clearly shows that this distribution is site specific given that the range of intensity, the rain droplet size, and their associated probabilities differ compared to Site 210.

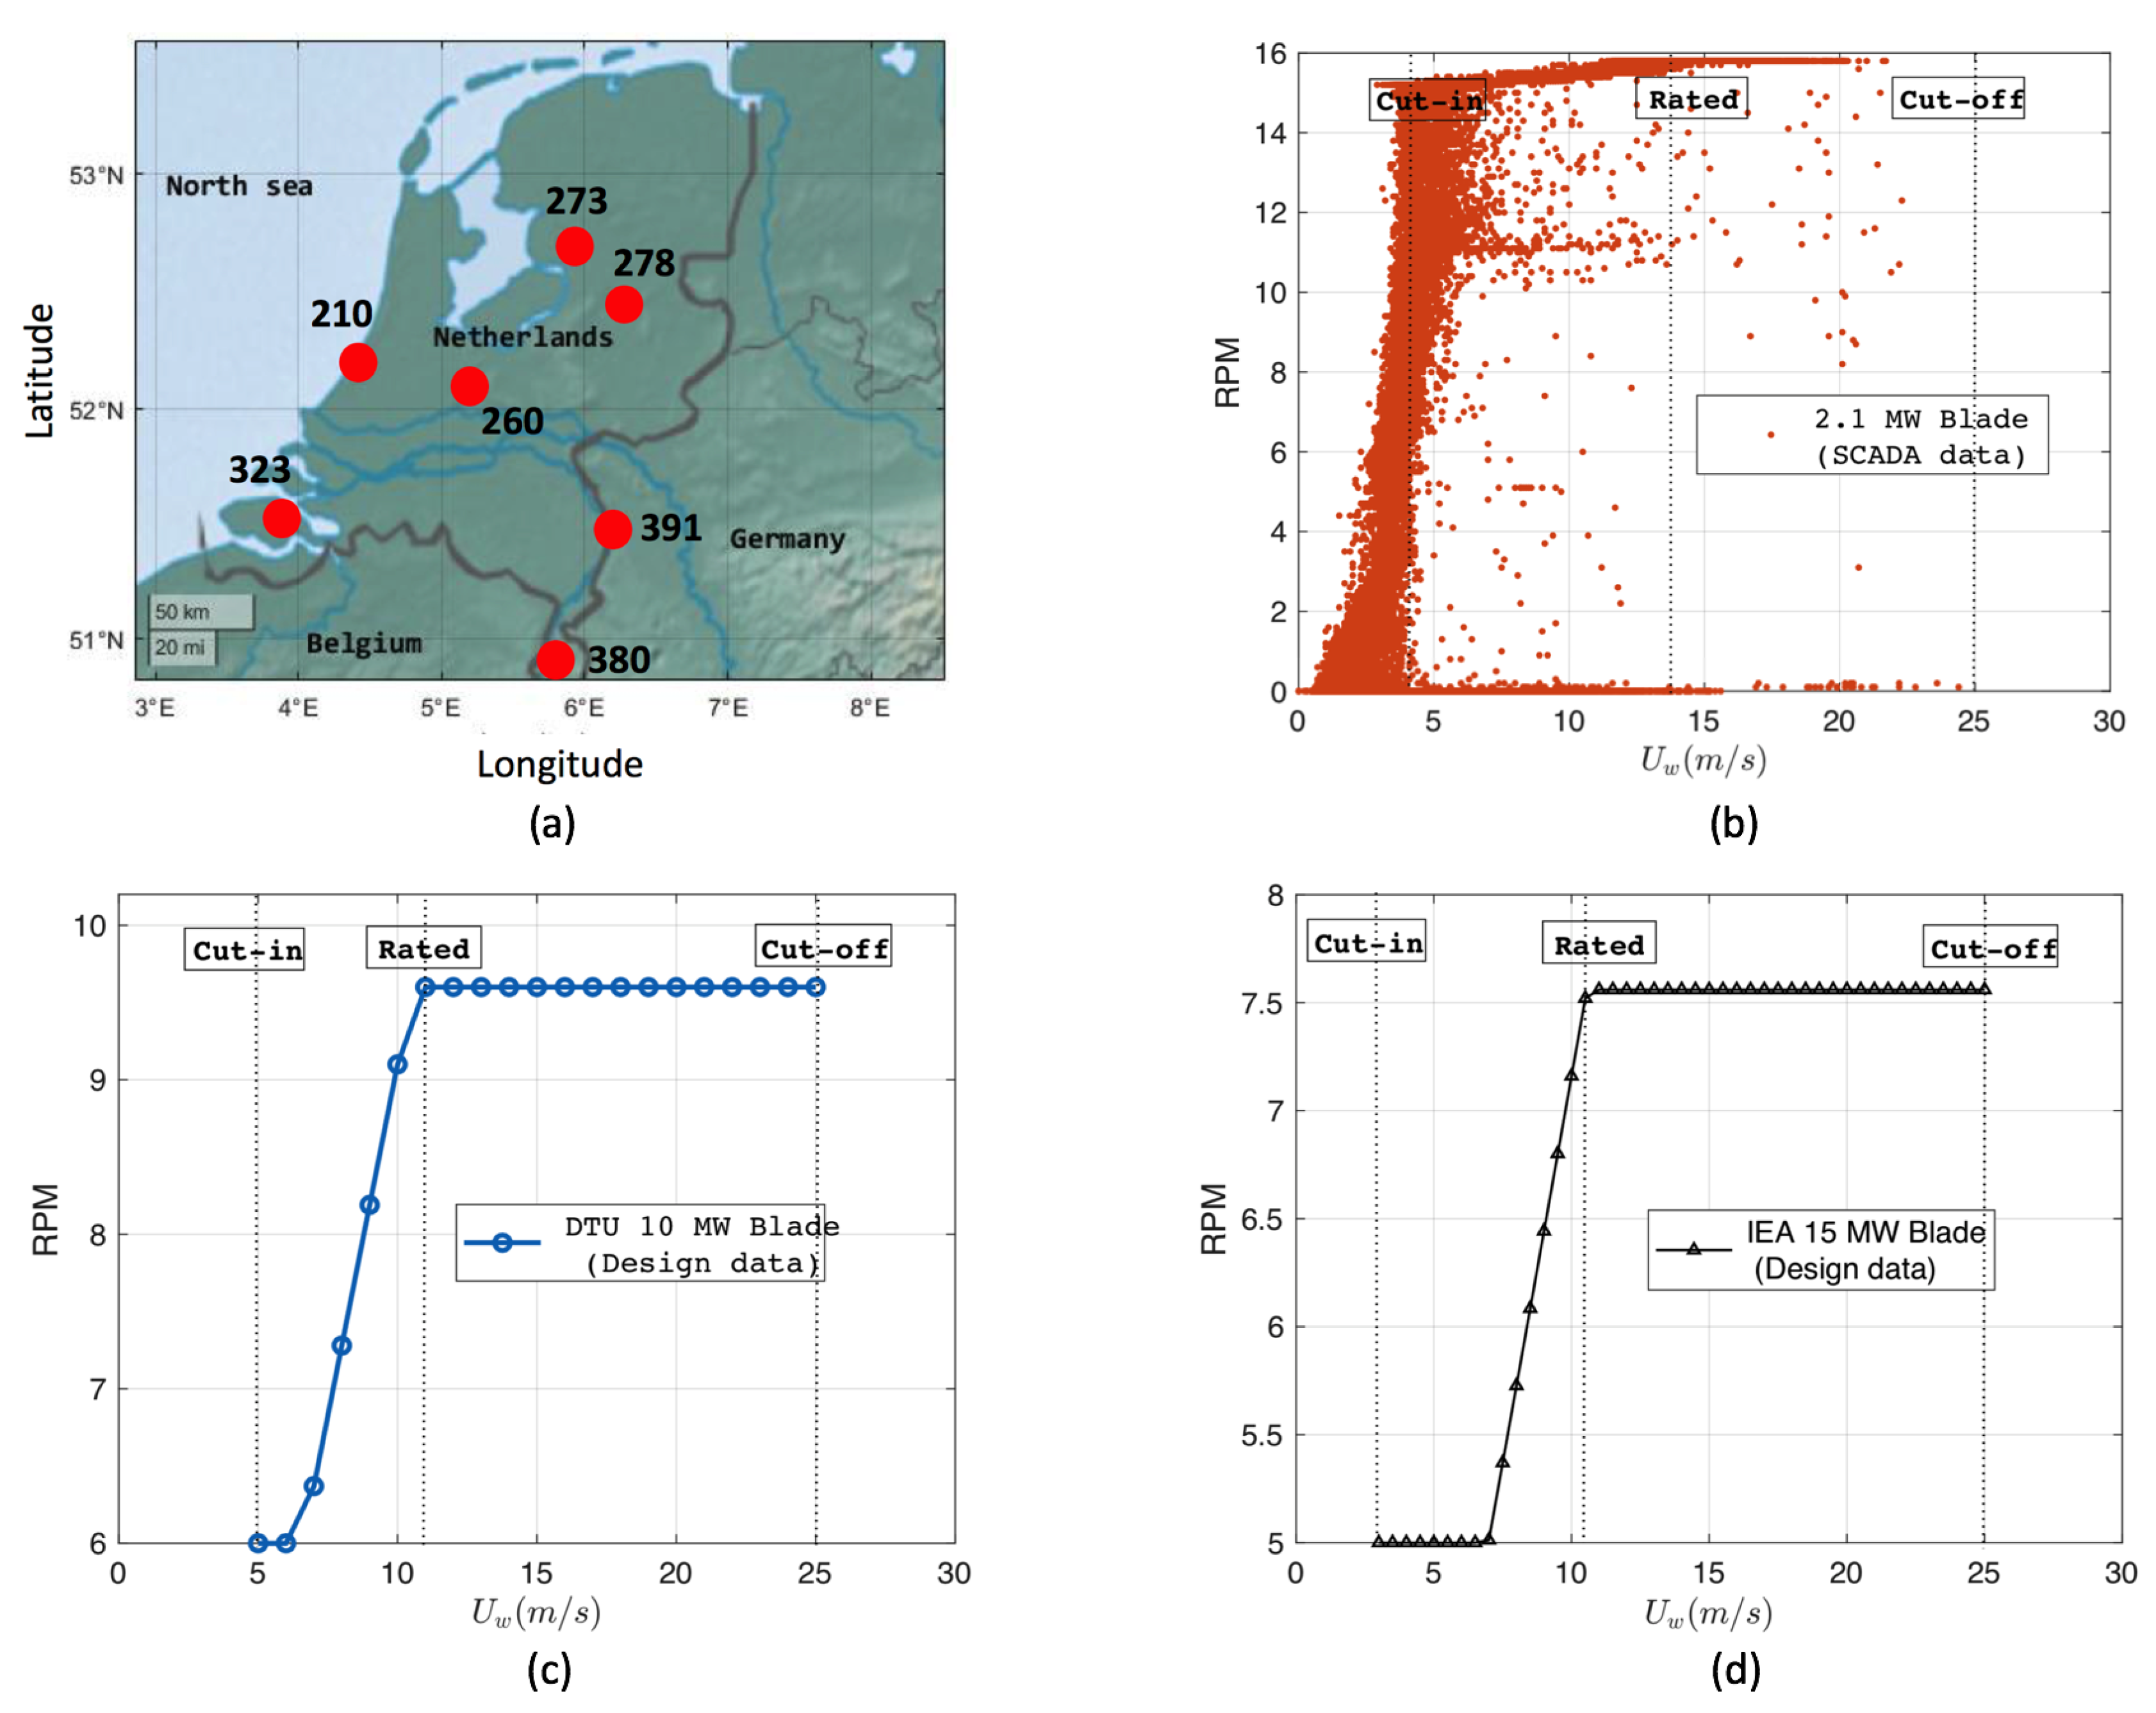
5.2. Wind Statistics Model

Figure 13a,b presents two parameter Weibull probability papers fitted with raw wind speed data for Site 210 (Valkenburg; coastal) and Site 278 (Heino;inland), respectively. Note that the wind speed raw data used here were corrected to a hub height of 119 m to represent wind for the DTU 10 MW wind turbine. The wind speed data for both sites was found to be accurately represented by the Weibull distribution. The distribution parameters were then extracted for these sites ( α u , β u ) and are summarized in Table 5. It can be seen from the table that the scale parameter ( β u ) of the coastal sites is greater than the inland sites. This is true for all the sites mentioned in Table 5, i.e., the closer a site is to the coast, the larger the associated wind scale parameter is. Based on the obtained distribution parameters, the marginal PDF of the wind speed for coastal and inland sites is shown in Figure 13c,d, respectively. As expected, the distribution of the wind speed for the coastal site has a higher value of the mode, and there is higher range of wind speeds compared to the inland sites.
The above discussed results about the varying wind attributes of coastal and inland sites were expected to have a significant effect on the LEE calculations. It was expected that the blade would rotate at its highest tip speed when the wind speed at a given site was above the rated wind speed of a wind turbine. In this way, above the rated wind, there would be a higher impact speed with which the blade impacts the rain droplets during precipitation, which is critical to the overall erosion calculation. A parameter that describes the wind erosivity of a given site is the probability of the exceedance of the rated wind condition for a given wind turbine. For instance, in Figure 13c,d, a vertical line corresponding to the rated wind speed of the DTU 10 MW blade (rated wind speed of 11.2 m/s) is shown. It can be clearly seen from the figure that for the coastal site, there is a larger area under the PDF curve past the rated wind conditions compared to the inland site in Figure 13d. This area under the curve is the probability of the exceedance of the rated wind condition ( U r w s ). Therefore, it can be said that a turbine located at a coastal site has a higher probability of the exceedance of the rated wind conditions, implying faster erosion of the LEP coating, as the blade would be rotating at its highest tip speed for a large period of time. The exceedance distribution function (EDF) of any given wind speed can be quantified using the marginal distribution of the wind speed using the following equation:
P ( U w > w ) = 1 F ( w ) = w f U w ( u ) d U w
Figure 14a–c compares the EDF of the wind speed for three different turbines and all seven sites considered in this paper. In each of the graphs, the EDF is overlapped with the RPM- U w curve of the wind turbine. It can be seen from the figure that for all three turbines, the probability of the exceedance of the rated wind conditions is higher for the coastal sites compared to the inland sites. Another interesting observation is that the exceedance probabilities of the wind speeds between cut-in and rated wind conditions for all the sites are higher for a 2.1 MW WT compared to 10 MW and 15 MW WTs. This is attributed to the fact that there is a major difference in the RPM- U w curve of the 2.1 MW WT compared to the DTU 10 MW and IEA 15 MW WT. The 2.1 MW WT is an operational WT and has a relatively uniform tip speed for all ranges of wind conditions (15 RPM-17 RPM between cut-in to rated), and the slope of the line that joins the cut-in and rated wind has a higher gradient. In addition, this operational WT also has a few points in Figure 14a that correspond to blade rotation below the cut-in wind due to the effects of inertia. On the other hand, the DTU 10 MW and IEA 15 MW WT are reference based idealized turbines and have higher variability in the tip speed between cut-in and rated wind conditions. Further, since these turbines are modeled numerically, there is strictly no rotation of the blade below the cut-in wind speed. As a result, it was expected that the 2.1 MW WT would rotate at its extreme tip speed (75 m/s) even at lower wind speed below the rated wind condition, and this would have a decisive effect on the leading edge erosion calculations discussed in the next section.

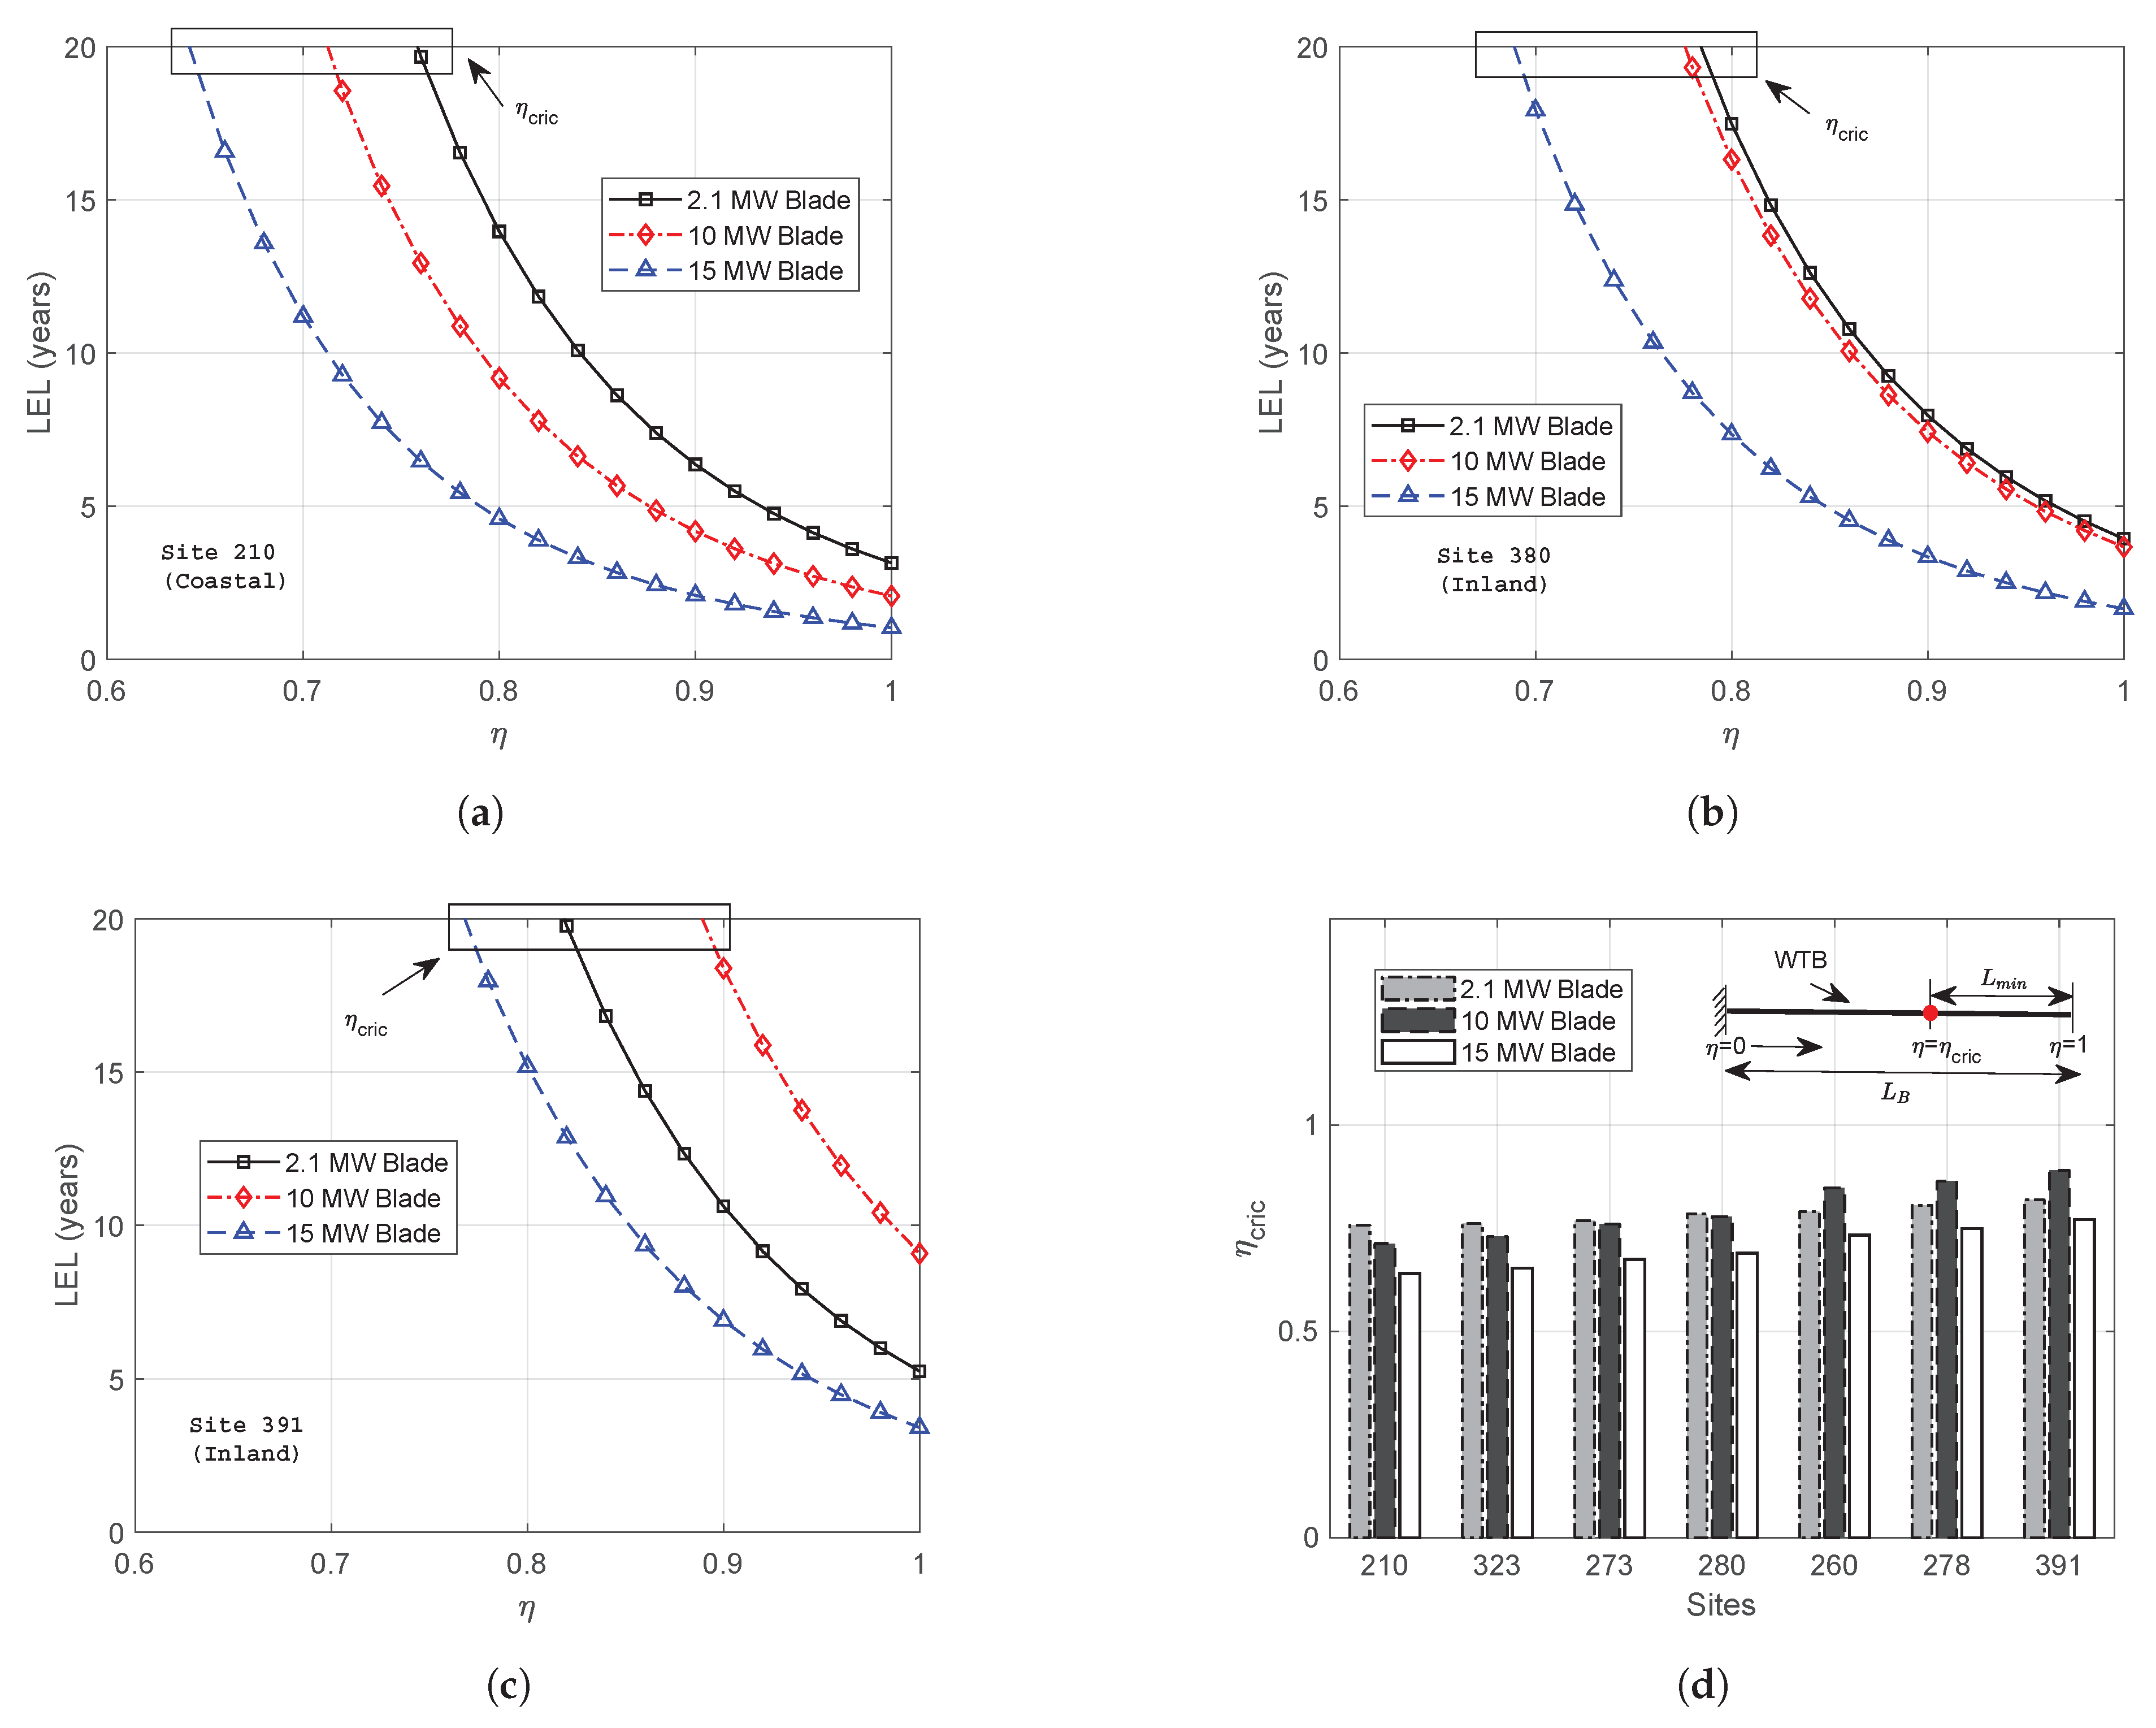
5.3. Determination of Leading Edge Lifetime and LEP Application Length

Figure 15a–c presents the comparison of the LEL calculated at different sections along the blade length ( 0.6 η 1 ) for three different wind turbines (2.1 MW, 10 MW, and 15 MW). The comparisons in the figures were done with respect to the coastal Site 210 (Figure 15a), the inland Site 380 (Figure 15b), which is associated with the highest altitude, and Site 391 (Figure 15c), which is the most inland site. The point where the LEL curve in the figure exceeds the value of 20 years (towards the blade root from the tip) corresponds to η c r i c and is marked in the figures with a rectangular box. As discussed before, η c r i c is the threshold limiting point along the blade length below which there are no erosion damages expected during the service life. Only those regions in the blade require LEP, which lie between η c r i c and the blade tip ( η = 1 ).
There are a few important observations that can be made from Figure 15a, which represents the LEE calculations explicitly for the coastal Site 210: (a) For all the wind turbine blades, the LEL is found to be the smallest at η = 1 , which corresponds to the blade tip. Further, the value of LEL increases rapidly from the tip towards the inner region of the blade in a non-linear fashion. This is expected as the blade tip is associated with the highest rotational speed, which reduces as we move away from the blade tip towards the root. (b) At η = 1 (blade tip), the LEL is found to be the lowest for the 15 MW wind turbine followed by the DTU 10 MW and 2.1 MW WTs. This is because the IEA 15 MW WT is associated with the largest tip speed and the highest hub height. (c) η c r i c is found to be the smallest for the 15 MW WT followed by the DTU 10 MW and 2.1 MW WTs. This result implies that the threshold limiting point ( η c r i c ) of erosion damage along the wind turbine blade is far from the blade tip for the case of the 15 MW wind turbine compared to the 10 MW and 2.1 MW WTs. This result is critical for the estimation of the LEP application length and will be discussed later.
An important observation can be seen in the Figure 15b,c, where the LELs for the 2.1, 10, and 15 MW wind turbines are compared at different η for the inland Sites 380 and 391, respectively. It is seen that the distance between the LEL curves of the 2.1 and 10 MW WT at different η is reduced significantly for Site 380 compared to the coastal Site 210. Furthermore, for Site 391, which is the most inland site, the LEL curve for the 10 MW WT is above the LEL curve of the 2.1 MW WT. This implies that for the inland site, the LEL of the 2.1 MW wind turbine is less compared to the 10 MW wind turbine. This is expected as the 2.1 MW wind turbine is an operational wind turbine and has a relatively uniform tip speed for all ranges of wind condition (15 RPM–17 RPM between cut-in to rated), as discussed previously. Thus, the blade will be rotating at its highest tip speed even for lower wind speeds, causing a higher rate of erosion at the inland Site 391. Another important implication is that the limiting threshold point below which there are no erosion damages in the blade is relatively closer from the blade tip for the case of the 10 MW compared to the 2.1 MW blade (for the inland Site 391). This limiting point can be shown explicitly by comparing η c r i c for different turbines and sites in Figure 15d. It can be clearly seen that for any given site, η c r i c is smallest for the IEA 15 MW wind turbine. However, the trend in η c r i c varies for the case of the 10 MW and 2.1 MW wind turbines, especially while moving from coastal to inland sites. At coastal sites (Site 210, Site 323), η c r i c is smaller for the 10 MW blade compared to the 2.1 MW turbine blade given that the exceedance probability of the rated wind condition for the 10 MW wind turbine is higher at the coastal site. On the other hand, as we move farther from the coast towards the inland sites, the η c r i c for the 10 MW WT becomes larger than that of the 2.1 MW WT.
In the above results, where η c r i c is found to be lesser for the 2.1 MW WT compared to the 10 MW WT, it is not necessary that the total eroded blade length be larger in magnitude for the case of the 2.1 MW WT. This is because the total blade length over which erosion can occur depends on η c r i c , as well as the total blade length ( L B ); see Equation (2). Since the blade length for 10 MW WT is twice the 2.1 MW WT, the total eroded blade length will be higher for the 10 MW blade. This is shown in Figure 16a–c, where the LELs for all three WTs are compared for all seven sites at different sections along the blade lengths. Here, instead of using η c r i c along the x-axis, the true blade length (from the root towards the tip) is used for the comparison of LELs. The total eroded blade length is found to be the highest for the 15 MW WT (which ranges between the blade’s radial position 75 m < R < 117 m for all sites), followed by the 10 MW WT (which ranges between 62 m < R < 86.4 m for all sites) and the 2.1 MW WT (which ranges between 33 m < R < 44 m for all sites). Furthermore, the total eroded blade length is found to be the highest for the coastal sites compared to the inland sites, given that the coastal sites are associated with higher median rainfall intensity, as well as higher wind speeds. It is also interesting to note that Maastricht (Site 380), which has the highest altitude, is found to have a larger length of eroded blade compared to the turbines at the surrounding inland locations. This is primarily because the site is associated with higher wind speeds and larger exceedance probability for rated wind conditions compared to surrounding inland sites. It is also interesting to note that the difference in the total eroded blade lengths calculated for the 2.1 MW WT has less variability (which ranges between 33 m < R < 44 m for all sites) compared to the DTU 10 MW and the IEA 15 MW WT. This is due to the reason stated before that the RPM- U w curve of the 2.1 MW WT has a relatively uniform tip speed for all ranges of wind conditions (15 RPM-17 RPM), compared to the DTU 10 MW and the IEA 15 MW WT.
Finally, based on the above discussions, the minimum LEP application length ( L m i n ) for the WTBs can be calculated. Figure 17a–c presents the LEP application length calculated for the 2.1 MW WT, the DTU 10 MW WT, and the IEA 15 MW WT for all the seven Dutch sites. It can be seen from the figure that for a given site, the LEP application length requirement increases with increasing power ratings of the WTs. For instance, the LEP application length requirements are in the range of 8–11 m for the 2.1 MW blade, 9–25 m for the 10 MW blade, and 27–42 for the IEA 15 MW turbine. This can also be clearly seen from the bar chart in Figure 18, where for any given site, the LEP application length requirement is found to be the largest for the turbine with the highest power ratings. Furthermore, for any given WT, the LEP application length requirement is found to be the highest for the coastal sites and reduces with sites located more inland. For instance, Site 210 has the highest LEP application length requirement compared to Site 391, which is the site located further inland. It is again interesting to note that Maastricht (Site 380), which has the highest altitude, is found to have a relatively higher LEP application length requirement compared to the surrounding inland locations. Furthermore, the difference in the range of the LEP application length requirements for WTBs has less variability for the 2.1 MW WT (8–11m for all sites) compared to the DTU 10 MW WT (9–25 m for all sites) and the IEA 15 MW WT (27–42 m for all sites). Figure 18b presents the minimum LEP application length ( L m i n ) against η c r i c for three different WTs. As expected, the LEP application length is negatively related to η c r i c , i.e., the smaller the value of η c r i c , the higher the LEP application length is. In addition, the curve is highest for the IEA 15 MW WT, followed by the 10 MW WT and the 2.1 MW WT.
Finally, a statistical investigation using correlation analysis was carried out to check which of the wind turbine parameters were strongly related to the estimates of the LEP application lengths. For this purpose, the Pearson correlation coefficient was used to calculate linear relationships between variables and to check how the characteristics of a variable change in proportion to the changes in the other variable. In addition, a simple linear regression analysis was also performed to relate quantitatively the LEP application length to wind turbine-specific parameters and establish the linear equations describing the line of best fit. These investigations will aid the blade manufacturer and designers to choose a suitable range of an in-factory LEP application length, especially for those combinations of turbine parameters for which the analysis was not considered in this paper. Figure 19a–d presents the LEP application length related to the turbine attributes: power rating (Figure 19a), blade length (Figure 19b), blade tip speed (Figure 19c), and hub height (Figure 19d), respectively. In each of the figures, the linear trend is drawn, and the corresponding linear equations, as well as the correlation coefficient (r) are shown explicitly. Further, the average value of the LEP application length is used, and the standard deviation in the graph represents variation due to different sites considered in the analysis. This is also represented in the figures by rectangular boxes and is marked with “C”, which relates to the coastal site, and “I”, which relates to the inland sites. It can be clearly seen from all the graphs that there is a positive correlation between the LEP application length and all the wind turbine parameters: power rating, blade length, blade tip speed, and hub height. However, this correlation is found to be strongest with the hub height ( r = + 0.962 ), followed by blade length ( r = + 0.954 ), the power rating of the wind turbine ( r = + 0.942 ), and finally, with the blade tip speed ( r = + 0.881 ). The reason that the LEP application length has the least correlation with the blade tip speed is because this parameter only describes erosion at the tip and does not explicitly give information about how each section of the blade is rotating. On the other hand, the highest correlation is found between the LEP application length and the hub height, as well as the LEP application length and the blade length. This is advantageous as both pieces of information are available to the designers before LEP application lengths are applied.

6. Conclusions

To tackle the issue of the LEE of WTBs, specialized LEP solutions such as factory based LEP coatings are being developed that can be utilized in the blade factory before blades are shipped out to the site for installation. One of the main challenges related to these LEP solutions is the choice of a minimum LEP application length to be applied in the spanwise direction of the WTB. In this study, we extend the scope of the long-term probabilistic framework developed in our previous study to determine the minimum LEP application length required for WTBs to combat rain-induced erosion. The parametric study includes three different turbines with varying power ratings, 2.1 MW WT, 10 MW WT, and 15 MW WT, at seven different Dutch sites varying from coastal to inland. The following are the main conclusions from the study:
1.
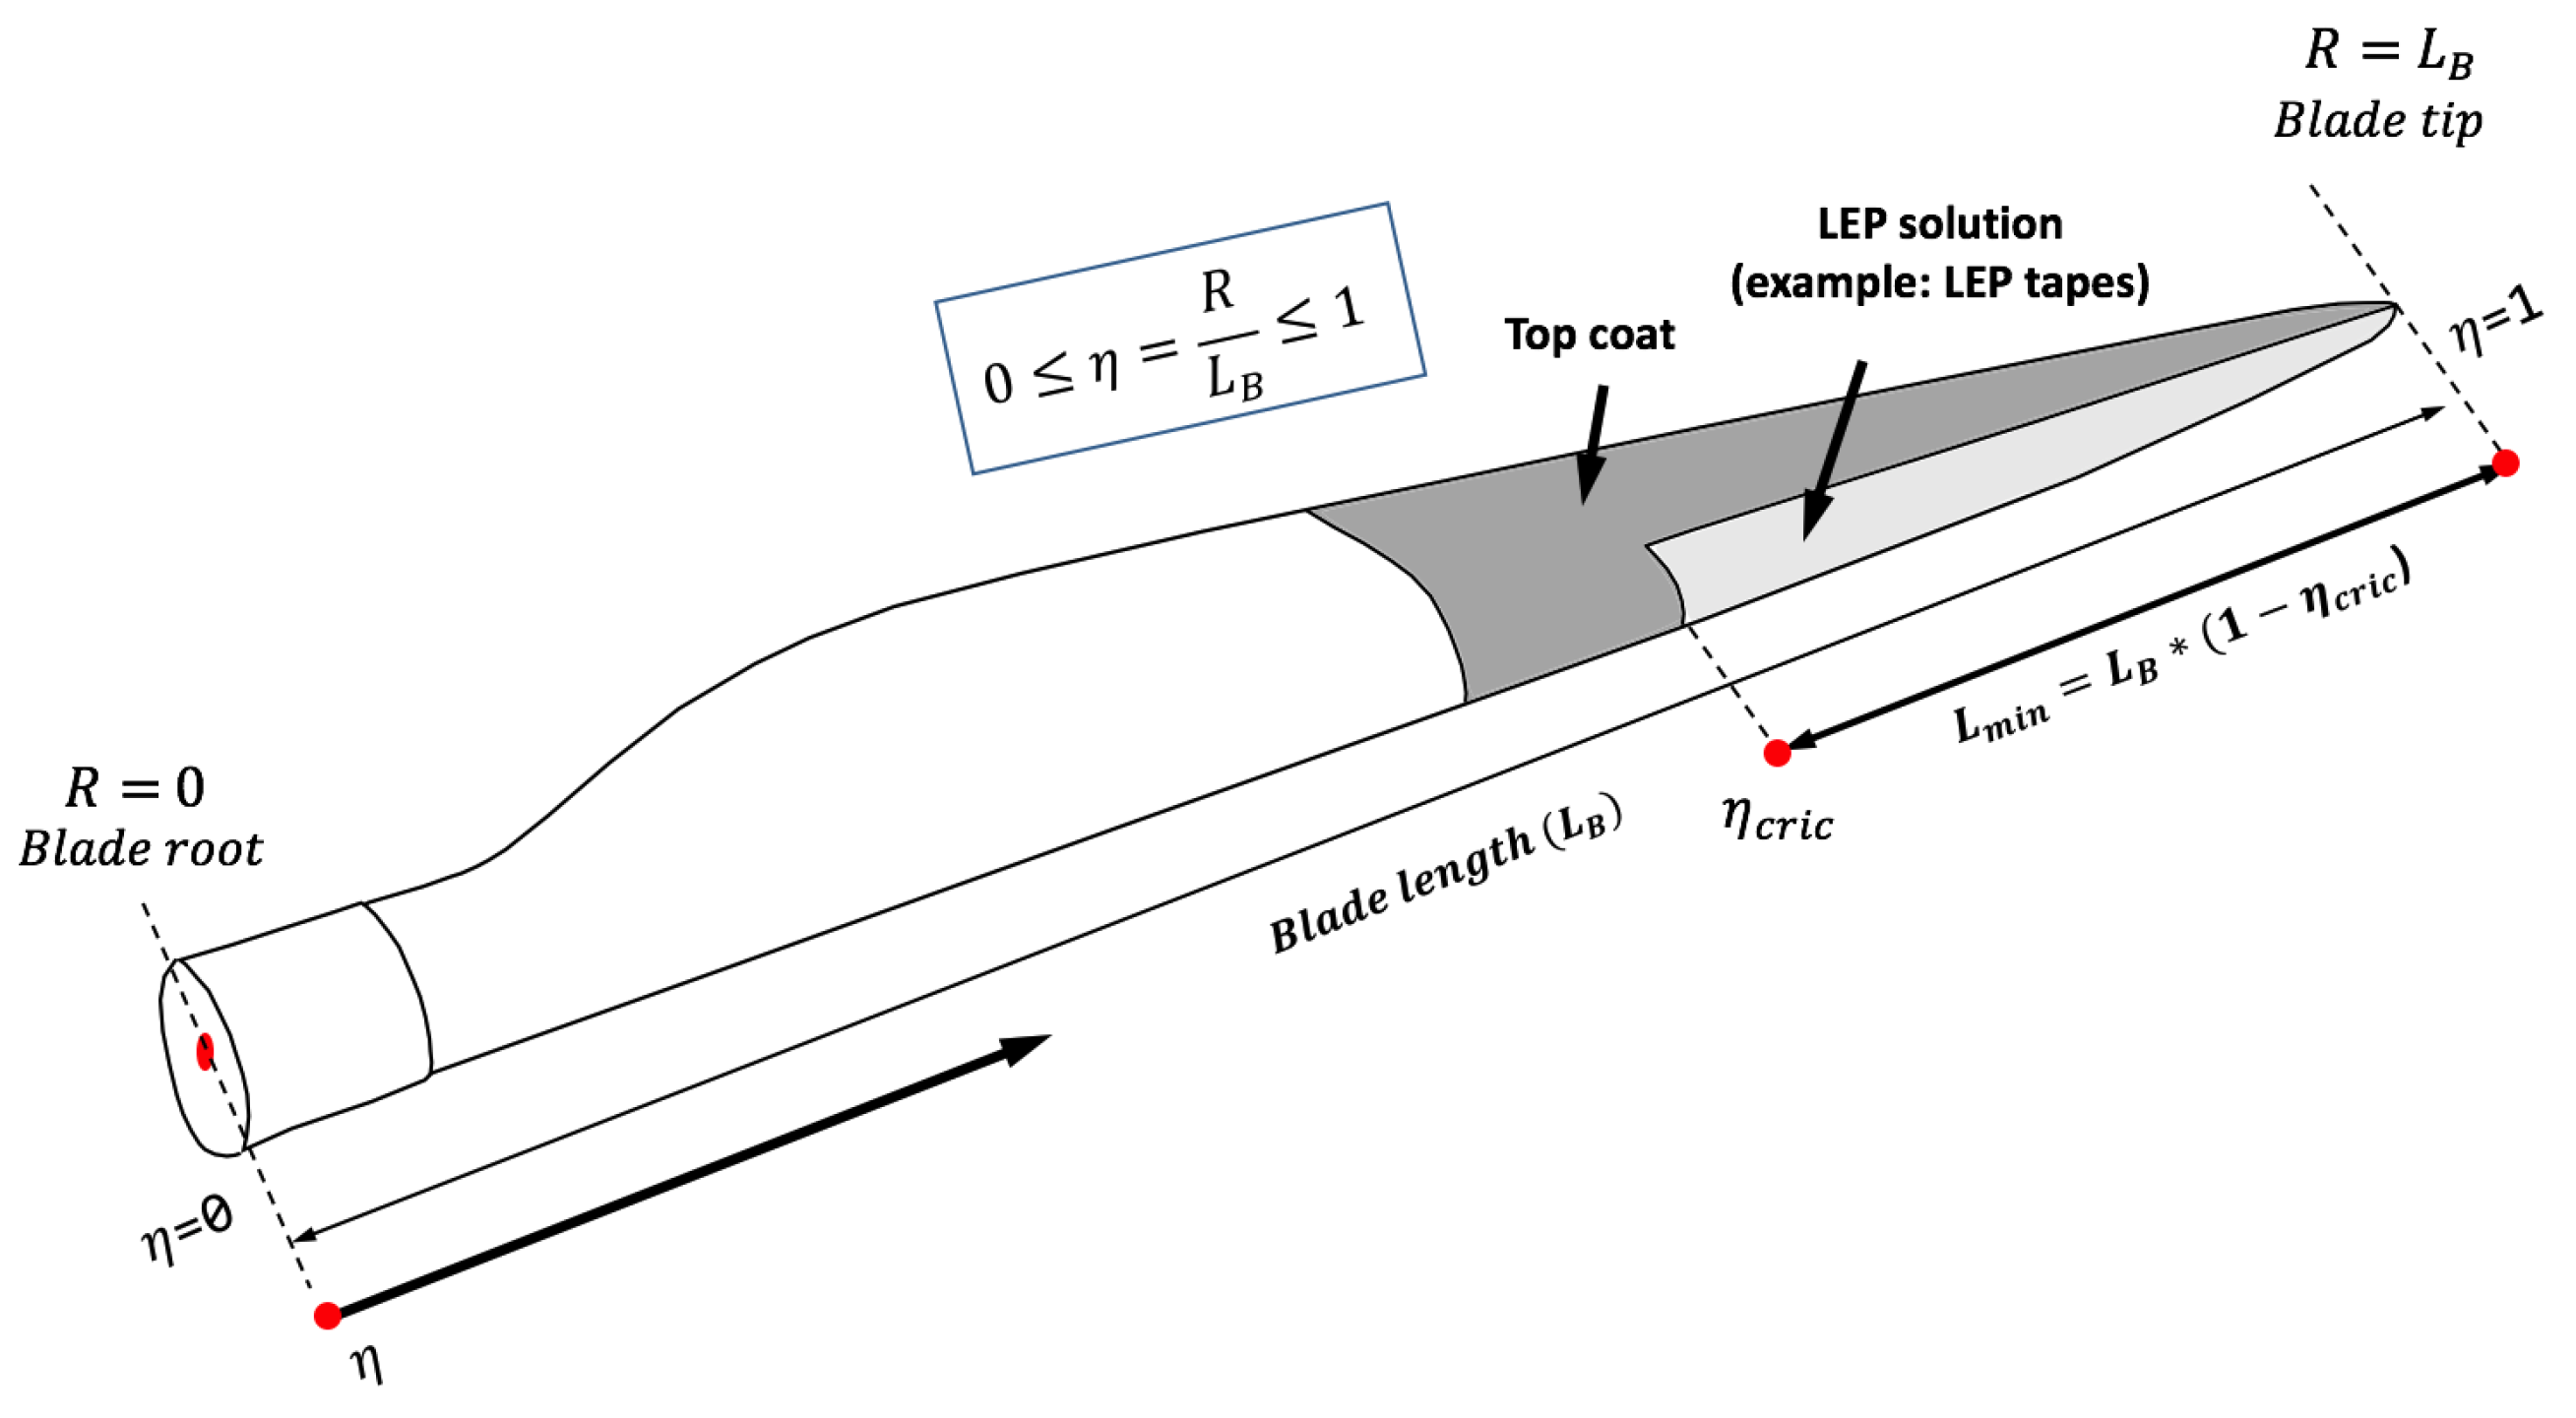
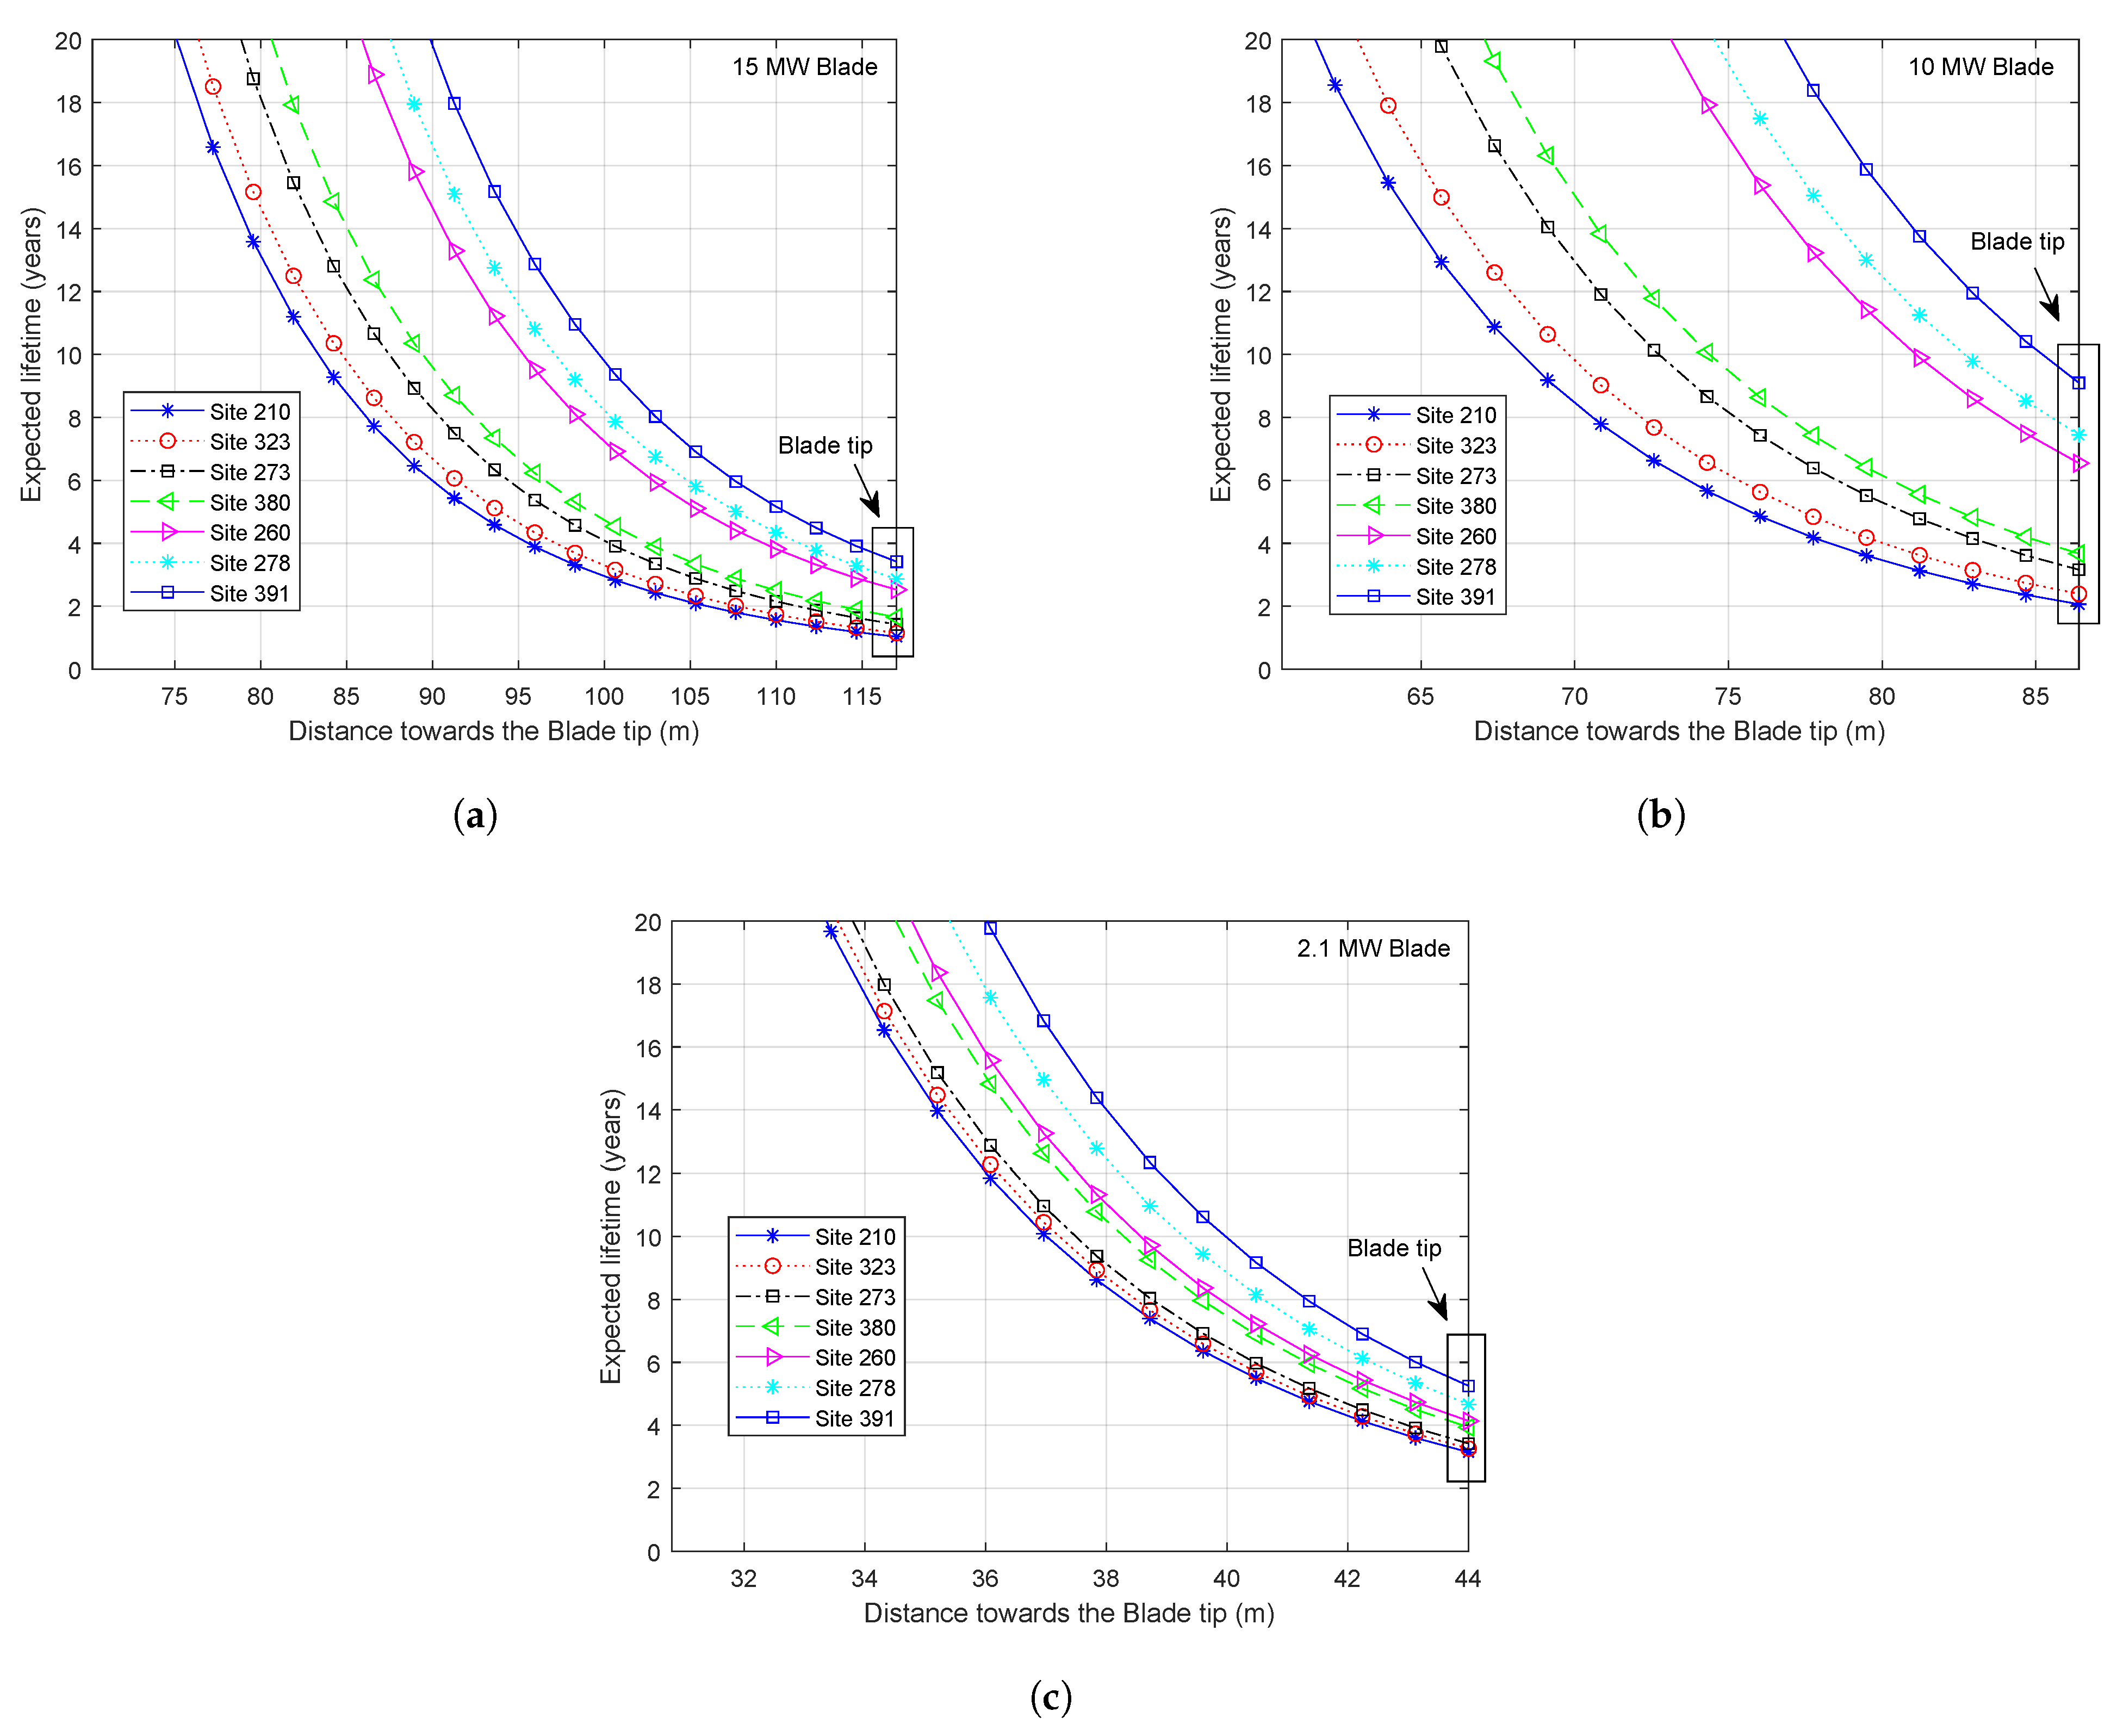
It was found in the study that for any given WT, the LEL is found to be the lowest at the blade tip, and this value increases rapidly from the tip towards the inner region of the blade in a non-linear fashion. A parameter ( η c r i c ) was defined that refers to the limiting point along the blade length below which there are no erosion damages expected during the blade’s service life. This parameter calculates the expected eroded blade length, as well as the LEP applications required for the WTB. For the coastal sites, it was found that this parameter η c r i c is smallest for the 15 MW WT, larger for the 10 MW WT, and even larger for the 2.1 MW WT. However, for the sites further inland, η c r i c for the 10 MW WT becomes larger than that for the 2.1 MW WT.
2.
The total eroded blade length during the service life due to precipitation was found to be the highest for the 15 MW WT (which ranges between the blade’s radial position 75 m < R < 117 m for all sites) followed by the 10 MW WT (which ranges between 62 m < R < 86.4 m for all sites) and the 2.1 MW WT (which ranges between 33 m < R < 44 m for all sites). Furthermore, the total eroded blade length was found to be the highest for the coastal sites compared to the inland sites.
3.
An experimental investigation was performed to validate Springer’s surface fatigue model for describing the coating incubation time at lab scale. The droplet erosion test results were compared with Springer’s analytical surface fatigue line, which were found to have a close agreement.
4.
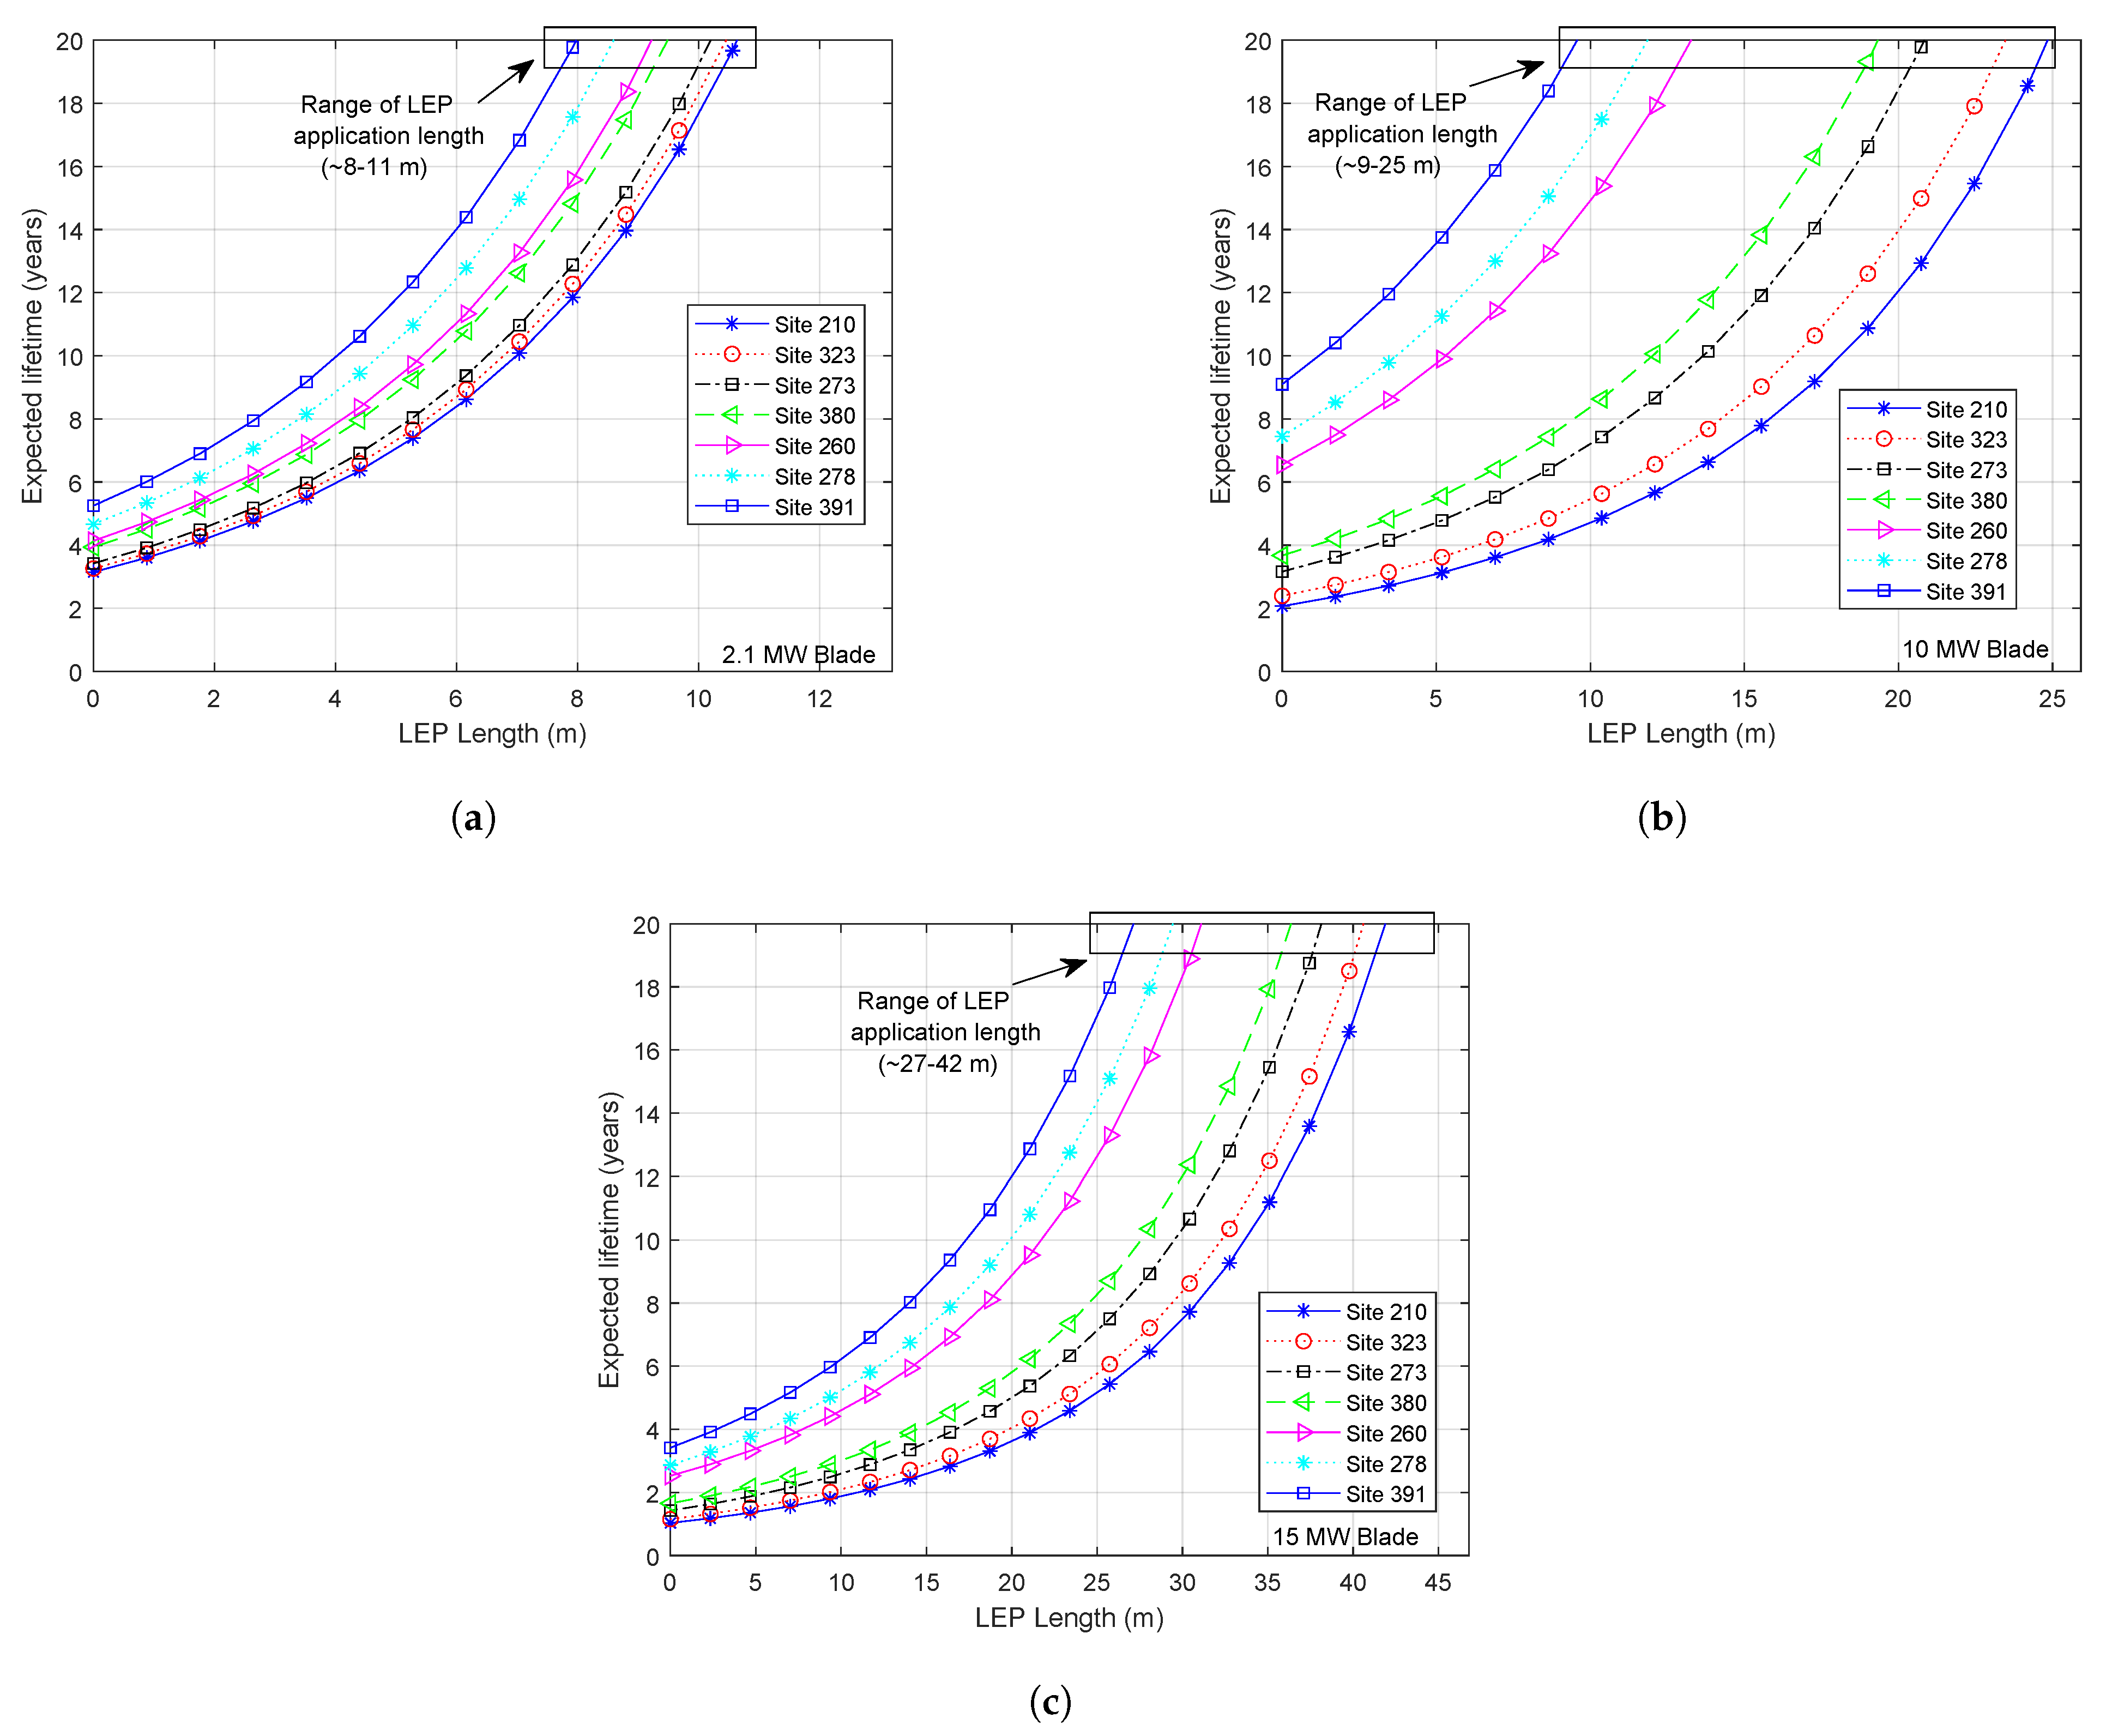
It was found in the study that for a given site, the LEP application length requirement increases with increasing power ratings of the WT. For instance, the LEP application length requirements are in the range of 8–11 m for the 2.1 MW blade, 9–25 m for the 10 MW blade, and 27–42 m for the IEA 15 MW turbine. Furthermore, for any given WT, the LEP application length requirement was found to be the highest for the coastal sites and reduced with sites located more inland.
5.
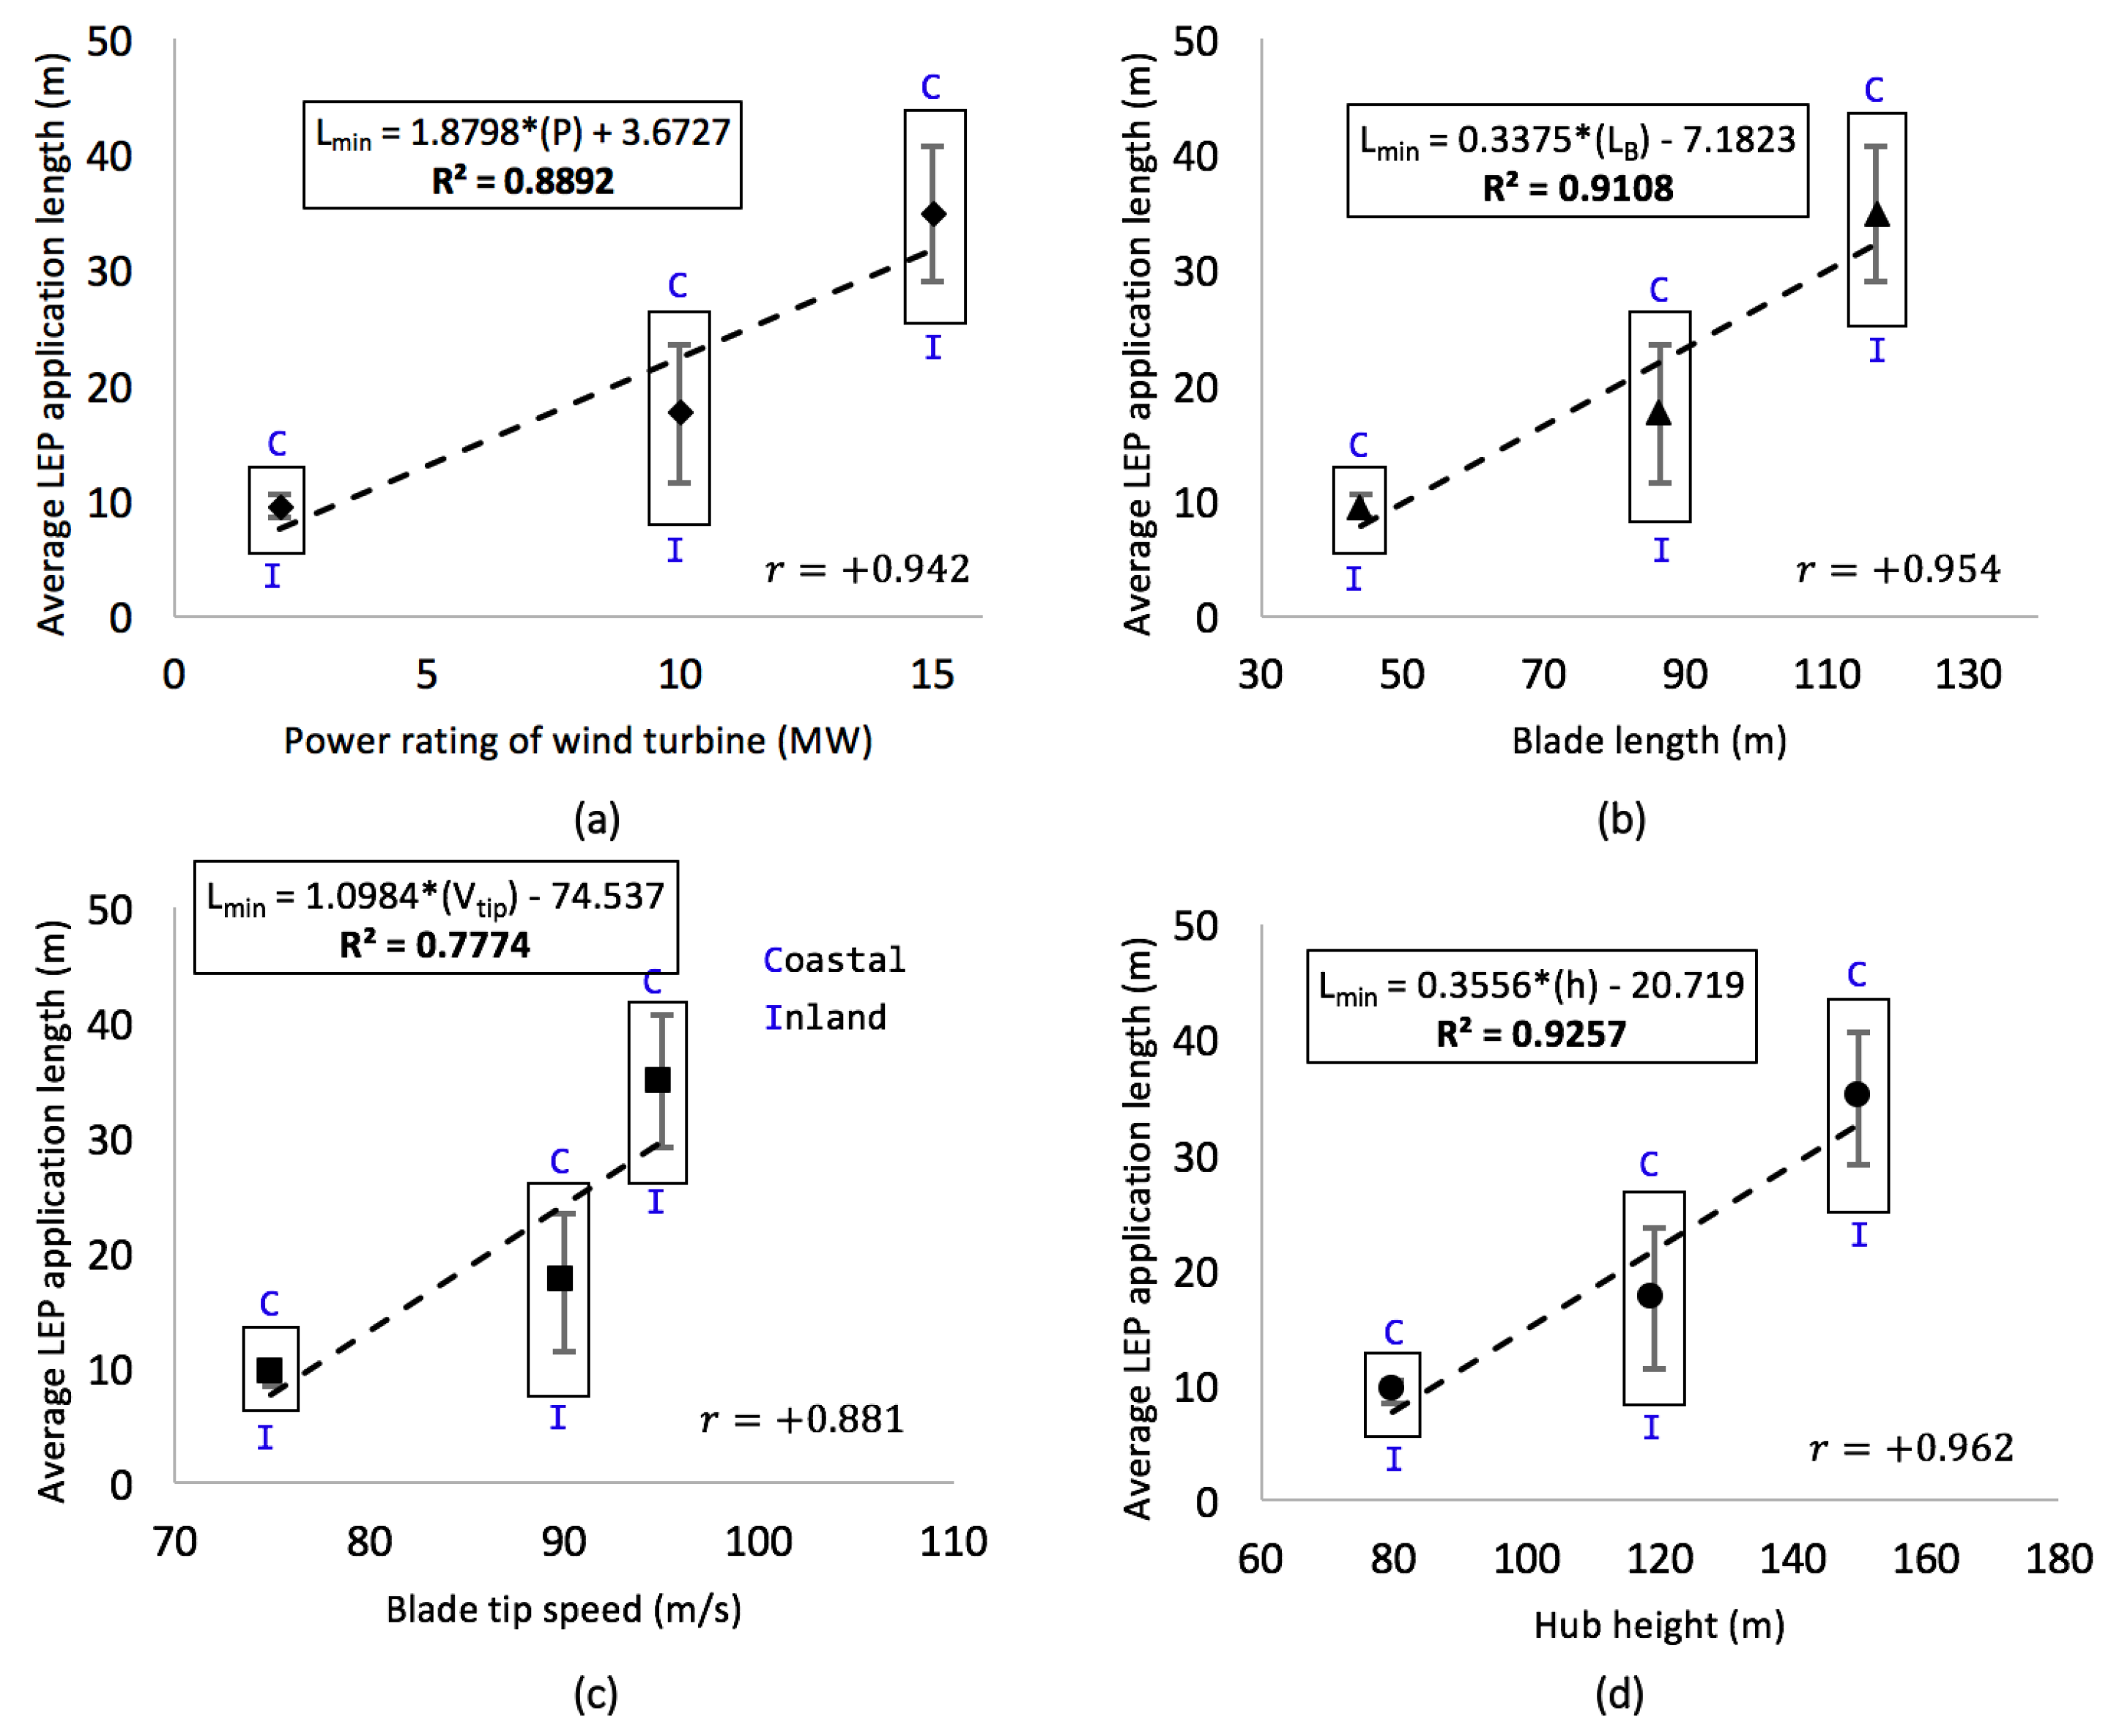
It was found in the study that the LEP application length has the strongest relationship with the hub height, followed by blade length, the power rating of the wind turbine, and finally, with the blade tip speed. A linear regression model was developed to establish the linear equations describing the line of best fit between the LEP application length and turbine-specific parameters. These equations will aid the industry to choose a suitable range of in-factory LEP application lengths, especially for those combinations of turbine parameters for which the analysis was not considered in this paper.

Author Contributions

All authors contributed substantially to the discussion and writing of the paper. All authors read and agreed to the published version of the manuscript.

Funding

This research was funded by WINDCORE project having subsidy scheme TSE–18–04–01–Renewable energy project with project number TEHE118013. Authors highly appreciate the financial support.

Data Availability Statement

Not application.

Acknowledgments

This work was made possible through the WINDCORE project having subsidy scheme TSE–18–04–01–Renewable energy project with project number TEHE118013. The authors highly appreciate the financial support. The authors also appreciate the in-kind support of consortium partners in the WINDCORE project for their discussions, which helped us to improve the quality of our work.

Conflicts of Interest

The authors declare no conflict of interest.

References

  1. Verma, A.S.; Jiang, Z.; Vedvik, N.P.; Gao, Z.; Ren, Z. Impact assessment of a wind turbine blade root during an offshore mating process. Eng. Struct. 2019, 180, 205–222. [Google Scholar] [CrossRef]
  2. IRENA. Future of Wind: Deployment, Investment, Technology, Grid Integration and Socio-Economic Aspects (A Global Energy Transformation Paper); International Renewable Energy Agency: Abu Dhabi, UAE, 2009; Available online: https://www.irena.org/-/media/Files/IRENA/Agency/Publication/2019/Oct/IRENA_Future_of_wind_2019.pdf (accessed on 11 September 2020).
  3. Burton, T.; Jenkins, N.; Sharpe, D.; Bossanyi, E. Wind Energy Handbook; John Wiley & Sons: Hoboken, NJ, USA, 2011. [Google Scholar]
  4. Verma, A.S.; Jiang, Z.; Ren, Z.; Gao, Z.; Vedvik, N.P. Response-Based Assessment of Operational Limits for Mating Blades on Monopile-Type Offshore Wind Turbines. Energies 2019, 12, 1867. [Google Scholar] [CrossRef] [Green Version]
  5. Verma, A.S.; Jiang, Z.; Gao, Z.; Vedvik, N.P. Effects of a passive tuned mass damper on blade root impacts during the offshore mating process. Mar. Struct. 2020, 72, 102778. [Google Scholar] [CrossRef]
  6. Keegan, M.H.; Nash, D.; Stack, M. Modelling Rain Drop Impact on Offshore Wind Turbine Blades. ASME Turbo Expo 2012. 2012. Available online: https://strathprints.strath.ac.uk/36575/5/Nash_DH_Stack_MM_Pure_Modelling_Rain_Drop_Impact_of_Offshore_Wind_Turbine_Blades_Jun_2012.pdf (accessed on 11 September 2020).
  7. Keegan, M.H.; Nash, D.; Stack, M. On erosion issues associated with the leading edge of wind turbine blades. J. Phys. Appl. Phys. 2013, 46, 383001. [Google Scholar] [CrossRef] [Green Version]
  8. Verma, A.S.; Castro, S.G.; Jiang, Z.; Teuwen, J.J. Numerical investigation of rain droplet impact on offshore wind turbine blades under different rainfall conditions: A parametric study. Compos. Struct. 2020, 241, 112096. [Google Scholar] [CrossRef]
  9. Fraisse, A.; Bech, J.I.; Borum, K.K.; Fedorov, V.; Johansen, N.F.J.; McGugan, M.; Mishnaevsky, L., Jr.; Kusano, Y. Impact fatigue damage of coated glass fibre reinforced polymer laminate. Renew. Energy 2018, 126, 1102–1112. [Google Scholar] [CrossRef] [Green Version]
  10. Verma, A.S.; Castro, S.G.; Jiang, Z.; Hu, W.; Teuwen, J.J. Leading edge erosion of wind turbine blades: Effects of blade surface curvature on rain droplet impingement kinematics. J. Physics: Conf. Ser. 2020, 1618, 052003. [Google Scholar]
  11. Herring, R.; Dyer, K.; Martin, F.; Ward, C. The increasing importance of leading edge erosion and a review of existing protection solutions. Renew. Sustain. Energy Rev. 2019, 115, 109382. [Google Scholar] [CrossRef]
  12. Chen, J.; Wang, J.; Ni, A. A review on rain erosion protection of wind turbine blades. J. Coatings Technol. Res. 2019, 16, 15–24. [Google Scholar] [CrossRef]
  13. Papi, F.; Balduzzi, F.; Ferrara, G.; Bianchini, A. Uncertainty Quantification on the Effects of Rain-Induced Erosion on Annual Energy Production and Performance of a Multi-MW Wind Turbine. Renew. Energy 2020, 65, 701–715. [Google Scholar]
  14. Verma, A.; Jiang, Z.; Ren, Z.; Hu, W.; Teuwen, J. Effects of onshore and offshore environmental parameters on the leading edge erosion of wind turbine blades: A comparative study. J. Offshore Mech. Arct. Eng. 2020, 1–31. [Google Scholar] [CrossRef]
  15. Picture Taken under Permission from Vattenfall Group. Available online: https://group.vattenfall.com/what-we-do (accessed on 22 September 2020).
  16. Picture Taken under Permission from TNO. Available online: https://www.tno.nl (accessed on 29 September 2020).
  17. Picture Taken under Permission from DURALEDGE Project. Available online: http://www.duraledge.dk (accessed on 23 September 2020).
  18. Rempel, L. Rotor blade leading edge erosion-real life experiences. Wind. Syst. Mag. 2012, 11, 22–24. [Google Scholar]
  19. weatherguardwind.com. Leading Edge Erosion: A BIG Problem For Wind Turbine Operators. Available online: https://weatherguardwind.com/leading-edge-erosion/ (accessed on 1 December 2020).
  20. Mishnaevsky, L., Jr. Repair of wind turbine blades: Review of methods and related computational mechanics problems. Renew. Energy 2019, 140, 828–839. [Google Scholar] [CrossRef]
  21. Mishnaevsky, L., Jr.; Thomsen, K. Costs of repair of wind turbine blades: Influence of technology aspects. Wind Energy 2020, 27, 2247–2255. [Google Scholar] [CrossRef]
  22. Hayashi, S.; Takei, T.; Hamamura, K.; Ito, S.; Kanawa, D.; Imanishi, E.; Yamauchi, Y. Moving mechanism for a wind turbine blade inspection and repair robot. In Proceedings of the 2017 IEEE/SICE International Symposium on System Integration (SII), Taipei, Taiwan, 11–14 December 2017; pp. 270–275. [Google Scholar]
  23. Verma, A.S.; Gao, Z.; Jiang, Z.; Ren, Z.; Vedvik, N.P. Structural Safety Assessment of Marine Operations From a Long-Term Perspective: A Case Study of Offshore Wind Turbine Blade Installation. In Proceedings of the ASME 2019 38th International Conference on Ocean, Offshore and Arctic Engineering, Scotland, UK, 9–14 June 2019. [Google Scholar]
  24. Austin-Morgan, T. The Value of Leading Edge Protection has Never been Greater Now Wind Power is the Largest Renewable Energy Source in Europe. Available online: https://www.materialsforengineering.co.uk/engineering-materials-features/the-value-of-leading-edge-protection-has-never-been-greater-now-wind-power-is-the-largest-renewable-energy-source-in-europe/182597/ (accessed on 17 November 2020).
  25. ELLE’, P. ELLE™ Puts an End to Leading Edge Erosion, Downtime and Costly Repairs to Your Blades. Available online: https://www.polytech.com/products-solutions/elle-leading-edge-protection/ (accessed on 17 November 2020).
  26. Gerdes, J. How a ‘Swim Cap’ Could Extend the Life of Wind Turbine Blades. Available online: https://www.greentechmedia.com/articles/read/swim-cap-extend-the-life-of-wind-turbine-blades (accessed on 17 November 2020).
  27. ELLE’, P. Polytech ELLE™ Puts an End to Leading Edge Erosion, Downtime and Costly Repairs to Your Blades. Available online: https://www.polytech.com/media/1339/polytech-elle-factory-solution.pdf (accessed on 11 September 2020).
  28. De Vries’, E. SGRE Brings Leading-Edge Protection as Retrofit. Available online: https://www.windpowermonthly.com/article/1663378/sgre-brings-leading-edge-protection-retrofit (accessed on 17 November 2020).
  29. Moorthikal, D. Putting Belzona’s Leading Edge Protection Coating to the Test. Available online: https://blog.belzona.com/belzona-1341-leading-edge-protection/ (accessed on 17 November 2020).
  30. Cortés, E.; Sánchez, F.; O’Carroll, A.; Madramany, B.; Hardiman, M.; Young, T.M. On the material characterisation of wind turbine blade coatings: The effect of interphase coating–laminate adhesion on rain erosion performance. Materials 2017, 10, 1146. [Google Scholar] [CrossRef] [Green Version]
  31. DNVGL. DNVGL Standard DNVGL-RP-0171 Testing of Rotor Blade Erosion Protection Systems. Available online: https://rules.dnvgl.com/docs/pdf/DNVGL/RP/2018-02/DNVGL-RP-0171.pdf (accessed on 17 November 2020).
  32. Amirzadeh, B.; Louhghalam, A.; Raessi, M.; Tootkaboni, M. A computational framework for the analysis of rain-induced erosion in wind turbine blades, part I: Stochastic rain texture model and drop impact simulations. J. Wind. Eng. Ind. Aerodyn. 2017, 163, 33–43. [Google Scholar] [CrossRef] [Green Version]
  33. Verma, A.S.; Jiang, Z.; Marco, C.; Verhoef, H.; van der Mijle Meijer, H.; Castro, S.G.; Teuwen, J.J. A probabilistic rainfall model to estimate the leading-edge lifetime of wind turbine blade coating system. Renew. Energy 2020. under review. [Google Scholar]
  34. Giguère, P.; Selig, M.S. Aerodynamic effects of leading-edge tape on airfoils at low Reynolds numbers. Wind. Energy Int. J. Prog. Appl. Wind. Power Convers. Technol. 1999, 2, 125–136. [Google Scholar]
  35. Sareen, A.; Sapre, C.A.; Selig, M.S. Effects of leading-edge protection tape on wind turbine blade performance. Wind. Eng. 2012, 36, 525–534. [Google Scholar] [CrossRef]
  36. Kyle, R.; Wang, F.; Forbes, B. The effect of a leading edge erosion shield on the aerodynamic performance of a wind turbine blade. Wind Energy 2020, 23, 953–966. [Google Scholar] [CrossRef]
  37. Performance Composite Delivery Service. Leading Edge Erosion. Available online: http://www.thebladedoctors.com/projects/153-leading-edge-protection.html (accessed on 11 December 2020).
  38. Verma, A.S.; Jiang, Z.; Ren, Z.; Marco, C.; Verhoef, H.; van der Mijle Meijer, H.; Castro, S.G.; Teuwen, J.J. A probabilistic long-term framework for site-specific erosion analysis of wind turbine blades: A case study of 31 Dutch sites. Wind Energy 2021. in production. [Google Scholar]
  39. Herring, R.; Dyer, K.; Howkins, P.; Ward, C. Characterisation of the Offshore Precipitation Environment to Help Combat Leading Edge Erosion of Wind Turbine Blades. Wind. Energy Sci. Discuss. 2020, 5, 1399–1409. [Google Scholar] [CrossRef]
  40. 61400-3, I. Wind Turbines, Part 3: Design Requirements for Offshore Wind Turbines. 2009. Available online: http://www.ishare5.com/dodownload.action?key=1358&f=IEC+61400-3+Wind+turbines+-+Part+3++Design+requirements+for+offshore+wind+turbines.pdf&r=2.23MB&rid=10423239 (accessed on 11 December 2020).
  41. Springer, G.S.; Baxil, C. A model for rain erosion of homogeneous materials. In Erosion, Wear, and Interfaces with Corrosion; ASTM International: Conshohocken, PA, USA, 1974. [Google Scholar]
  42. Atlas, D.; Srivastava, R.; Sekhon, R.S. Doppler radar characteristics of precipitation at vertical incidence. Rev. Geophys. 1973, 11, 1–35. [Google Scholar] [CrossRef]
  43. Papadakis, M.; Wong, S.C.; Rachman, A.; Hung, K.E.; Vu, G.T.; Bidwell, C.S. Large and Small Droplet Impingement Data on Airfoils and Two Simulated Ice Shapes. 2007. Available online: https://ntrs.nasa.gov/api/citations/20070034950/downloads/20070034950.pdf (accessed on 11 December 2020).
  44. Keegan, M.H.; Nash, D.; Stack, M. Wind Turbine Blade Leading Edge Erosion: An Investigation of Rain Droplet and Hailstone Impact Induced Damage Mechanisms. Ph.D. Thesis, University of Strathclyde, Glasgow, Scotland, 2014. [Google Scholar]
  45. Class Instrumentation Ltd. Class Instrumentation Ltd Ultrasonic Sound Velocity Table. Available online: http://www.classltd.com/sound_velocity_table.html (accessed on 3 May 2018).
  46. 3M Wind Blade Protection Coating W4600 Technical Data Sheet and Application Guide. 2014. Available online: https://multimedia.3m.com/mws/media/978868O/3m-wind-blade-coating-w4600-app-guide-and-technical (accessed on 9 November 2020).
Figure 3. LEP application along the (a) chordwise direction and (b) spanwise direction of WTBs.
Energies 14 01629 g003
Figure 4. Analysis procedure considered in the study. LEL, leading edge lifetime.
Energies 14 01629 g004
Figure 5. Different mathematical parameters defined for a WTB with the LEP solution.
Energies 14 01629 g005
Figure 6. (a) Dutch sites considered in the analysis; RPM- U w curves for (b) 1.5 MW, (c) 10 MW, and (d) 15 MW WTs.
Energies 14 01629 g006
Figure 7. (a) Ducom droplet erosion tester; (b) cross-section of tested sample; (c) matrix modulation approach for test.
Energies 14 01629 g007
Figure 8. (a) Rotating disc; (b) water segments impacting the sample at different time instants.
Energies 14 01629 g008
Figure 9. Surface scan of the coated sample before and after the droplet erosion tests.
Energies 14 01629 g009
Figure 10. Validation of Springer’s erosion model with the experimental results.
Energies 14 01629 g010
Figure 11. (a) Comparison of the log normal distribution with raw rain intensity data (Site 210); (b) comparison of theoretical vs. empirical CDF (Site 210); (c) Best’s DSD.
Energies 14 01629 g011
Figure 12. Joint PDF of I and ϕ d for (a) Site 210 (2D contour plot), (b) Site 210 (3D surface plot), (c) Site 278 (2D contour plot), and (d) Site 278 (3D surface plot).
Energies 14 01629 g012
Figure 13. Weibull probability paper with wind data for Sites (a) 210 and (b) 278; Marginal PDF for Sites (c) 210 (d) 278 along with rated wind speed (11.2 m/s) of DTU 10 MW wind turbine.
Energies 14 01629 g013
Figure 14. Exceedance distribution function (EDF) of wind speed together with the RPM- U w curve for a (a) 2.1 MW, (b) 10 MW, and (c) 15 MW WT.
Energies 14 01629 g014
Figure 15. LEL calculated for a 2.1 MW, 10 MW, and 15 MW WT at different η for Sites (a) 210, (b) 380, and (c) 391. (d) Comparison of η c r i c for all cases.
Energies 14 01629 g015
Figure 16. LEL calculated for seven different sites at different blade sections for the (a) IEA 15 MW WT, (b) 10 MW WT, and (c) 2.1 MW (Site 210: most coastal and Site 391: most inland).
Energies 14 01629 g016
Figure 17. Range of the LEP application length for the (a) 2.1 MW, (b) 10 MW, and (c) 15 MW WT for different sites ( L m i n corresponds to L E L = 20 years).
Energies 14 01629 g017
Figure 18. (a) Minimum LEP application length for the 2.1 MW, 10 MW, and 15 MW WT (Site 210: most coastal and Site 391: most inland). (b) Minimum LEP application length relation with η c r i c .
Energies 14 01629 g018
Figure 19. Correlation and regression analysis of the LEP application length with turbine-specific parameters. (a) Power rating. (b) Blade length. (c) Blade tip speed. (d) Hub height.
Energies 14 01629 g019
Table 2. Details of different Dutch sites considered in the analysis.
Station NumberSite NameLongitude ( ° East)Latitude ( ° North)Altitude (m)
210Valkenburg4.43052.171−0.200
260De Bilt5.18052.1001.900
273Marknesse5.88852.703−3.300
278Heino6.25952.4353.600
323Wilhelminadorp3.88451.5271.400
380Maastricht5.76250.906114.300
391Arcen6.19751.49819.500
Table 3. Details of wind turbine specifications considered in the analysis.
Turbine Specs2.1 MWDTU 10 MWIEA 15 MW
Blade length44 m86.4 m117 m
Hub height80 m119 m150 m
Max. tip speed75 m/s90 m/s95 m/s
Cut-in wind speed4 m/s4 m/s3 m/s
Rated wind speed14 m/s11.4 m/s10.59 m/s
Cut-off wind speed25 m/s25 m/s25 m/s
Table 4. Properties for the PU coating [44].
ρ s c s σ u m ν
1100 kg/m 3 [44]1900 m/s [45]37 MPa [46]16.920.3 [44]
Table 5. Details of the distribution parameters for different Dutch sites.
St.No. α u β u P 1 (%) P 2 (%) P 3 (%) P 4 (%) P total (%) μ σ
2101.838.2510.341.420.1000.000911.86−0.160.86
2601.965.7710.601.270.0900.001211.96−0.250.87
2731.937.0610.701.180.1020.002111.98−0.270.85
2781.825.4310.361.070.0940.000411.52−0.320.85
3231.947.9110.171.230.0810.001011.48−0.240.83
3801.906.979.901.020.0940.001211.02−0.350.92
3911.855.329.490.990.0860.000810.56−0.320.87
Publisher’s Note: MDPI stays neutral with regard to jurisdictional claims in published maps and institutional affiliations.

