Article

Experimental Procedures & First Results of an Innovative Solid Oxide Fuel Cell Test Rig: Parametric Analysis and Stability Test

by
Luca Del Zotto
1,
Andrea Monforti Ferrario
2,
Arda Hatunoglu
1,
Alessandro Dell’Era
3,
Stephen McPhail
2 and
Enrico Bocci
1,*
1
Department of Engineering Sciences, Università degli Studi Guglielmo Marconi, 00193 Rome, Italy
2
ENEA, Italian National Agency for New Technologies, Energy and Sustainable Economic Development, Department of Energy Technologies and Renewable Sources (TERIN-PSU-ABI), 00123 Rome, Italy
3
Dipartimento di Scienze di Base e Applicate per l’Ingegneria, Sapienza University of Rome, 00161 Rome, Italy
*
Author to whom correspondence should be addressed.
Submission received: 1 March 2021 / Revised: 26 March 2021 / Accepted: 31 March 2021 / Published: 7 April 2021
(This article belongs to the Special Issue Air-Cooled Fuel Cells)

Abstract

:
Solid Oxide Fuel Cells are a promising technology for Solid Oxide Fuel Cells (SOFC) are a promising technology For high-efficiency electrochemical conversion of a vast range of fuel gas mixtures, thigh operating temperature conditions (650–900 °C) represent a challenge both at system level and at laboratory testing level, in terms of material properties and performance dynamics. In this work a detailed procedural analysis is presented for an innovative all-ceramic compact SOFC test rig and first experimental testing results are reported in terms of polarization curves obtained under parametric variation of operating conditions (H2 content, air ratio λ and temperature) and short-term voltage stability test under load (140 h at 0.3 A/cm2). The electrochemical characterization results confirm the validity of the used all-ceramic cell holder, showing excellent cell performances in terms of polarization. H2 content has the most impact on SOFC performance, followed by temperature and finally air ratio, whose impact in the analyzed range is hardly seen. From the short-term stability test, the test bench setup reliability is demonstrated, showing no significant performance degradation after 140 continuous hours under load, which confirms the high quality and reproducibility of the results.

1. Introduction

Fuel cells are a key component in the hydrogen value chain [1,2], covering the conversion step from chemical energy to electrical energy form through an electrochemical redox reaction of various fuel gases [3] for a vast range of applications [4,5,6]. The electrochemical nature of energy conversion within fuel cells allows higher efficiency values (well over 50% chemical-to-electrical efficiency and up to 75–80% for the most efficient fuel cell technologies) with respect to typical thermo-electric conversion systems (around 30% chemical-to-electrical efficiency) which are limited by the thermodynamics of the combustion process [7,8]. In addition, the electrochemical conversion of fuels emits water vapour at the outlet of the fuel electrode, avoiding CO2 or hazardous emissions otherwise present in combustion flue gases of conventional thermo-electric conversion systems [9,10].
High temperature cells (mainly solid oxide & molten carbonate [11]) operate between 600–900 °C in relation to the ionic conductivity conditions of the electrolyte [12,13,14]. In general, high temperatures favour the thermodynamic processes occurring inside the fuel cell, obtaining higher current/power densities and electrical efficiencies above 70%, and provide the possibility to recover high-grade heat, obtaining global efficiencies of above 85% [8]. High temperature conditions allow the use of non-noble materials at the electrodes (e.g., Ni) instead of noble materials (e.g., Pt) which are used in low temperature fuel cells [14,15], although operating conditions are more difficult to manage, materials are subject to more stressful thermo-mechanical loads, and dynamic capability is limited [14,16]. In addition, high temperature fuel cells are more robust regarding carbonaceous fuels (especially for CO poisoning [4,13,17]), being able to process hydrocarbon fuels (e.g., CH4, bio/syngas mixtures, natural gas, etc.) thanks to the internal reforming occurring at such temperatures with Ni catalyst presence—provided that a suitable steam-to-carbon ratio is observed [18,19,20]. The sum of such characteristics allows Solid Oxide Fuel Cells (SOFCs) to represent a suitable technological coupling option for Combined Heat and Power (CHP) applications fed by conventional and unconventional fuels (e.g., natural gas, bio-syngas mixtures, etc.) positioning SOFCs as a key component of a low-carbon energy matrix and closing a high efficiency, zero-emission energy cycle with minimal emissions [21,22,23].
In this context, laboratory testing represents a crucial step between technology development and commercial uptake. Electrochemical characterization of small samples (button cells, single cells) is useful to obtain performance data at contained cost on the basic components of fuel cell systems, reducing as much as possible performance-altering effects at stack or system level. Detailed analysis of electrochemical performance is a necessary step to be able to understand the fuel cell physiochemical phenomena and to scale-up the behaviour trends under different operating conditions (operating temperature, fuel supply, oxidant supply, etc.) at system level, both in stationary and dynamic conditions (details are reported in Section 1.1). From a laboratory point of view, the operating conditions and nature of the SOFC assembly leads to challenges in terms of materials management, test bench setup & procedures and performance stability for which specific test rigs must be used, such as the ceramic holder used in this work, in order to maximize data quality and replicability (details are reported in Section 1.2).
In this work a Ni-YSZ/YSZ/GDC-LSCF (Ni-Yttria-Stabilized Zirconia/Yttria Stabilized Zirconia/Gadolinia Doped Ceria-Lanthanum Strontium Cobalt Ferrite) SOFC button cell assembly (Ø 3 cm; ≈7 cm2) provided by SOLIDpower [24] is tested. While electrolyte layer (YSZ) covers the whole surface of the supporting anode layer (Ni-YSZ), the cathode layer (GDC-LSCF) geometry is an inscribed square (2 × 2 cm) with respect to the supporting anode layer, reducing the active surface of the button fuel cell to 4 cm2. The main aim of this work is to present the first experimental results of an innovative all-ceramic SOFC test rig, providing a procedural guideline in terms of experimental setup & procedure which can be replicated for state-of-the-art, anode-supported SOFC (Ni-YSZ/YSZ/GDC-LSCF) button cell (Ø 3 cm) assembly testing.
The paper is organized as follows: Section 1.1 provides a brief technology review of the Solid Oxide Fuel Cell technology—which is considered necessary for the successive interpretation of the experimental results, and Section 1.2 provides some practical considerations regarding SOFC testing at laboratory scale; Section 2 reports the experimental setup, procedures and parameter calculation methods followed throughout the campaign; in Section 3 the experimental results are reported. Two sets of results in terms of polarization curves are presented, the first (Section 3.1) analyzing the influence of hydrogen content at the anodic chamber, oxygen ratio at the cathodic chamber and temperature. The second set of results (Section 3.2) assesses the stability of the test bench, showing the fuel cell voltage during a short-term stability test of 140 h under a constant load of 1 A. Experimental results are discussed in Section 3.2 with respect to other comparable experimental works. In Section 4 the conclusions are drawn.
The full experimental dataset is made available in the Supplementary Materials for all the analyzed conditions.

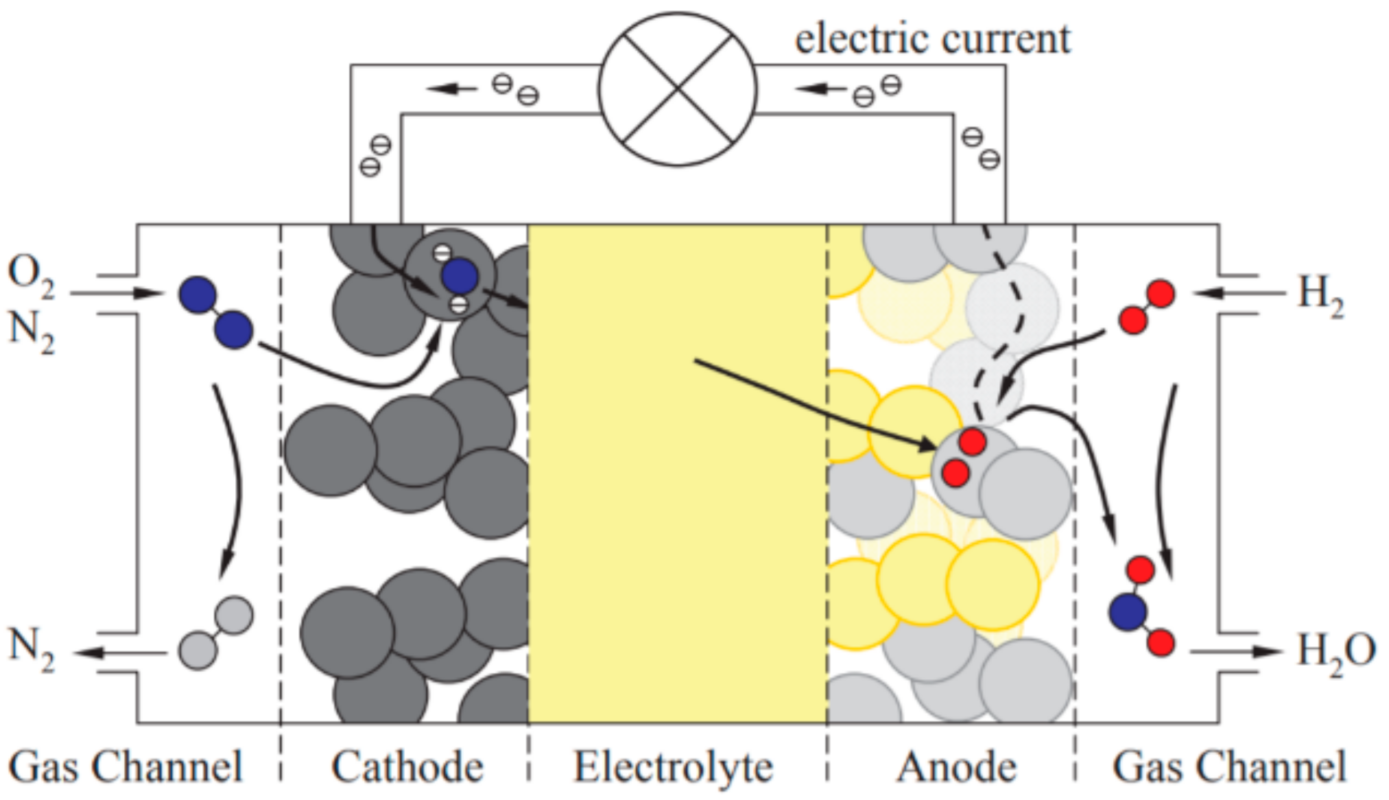
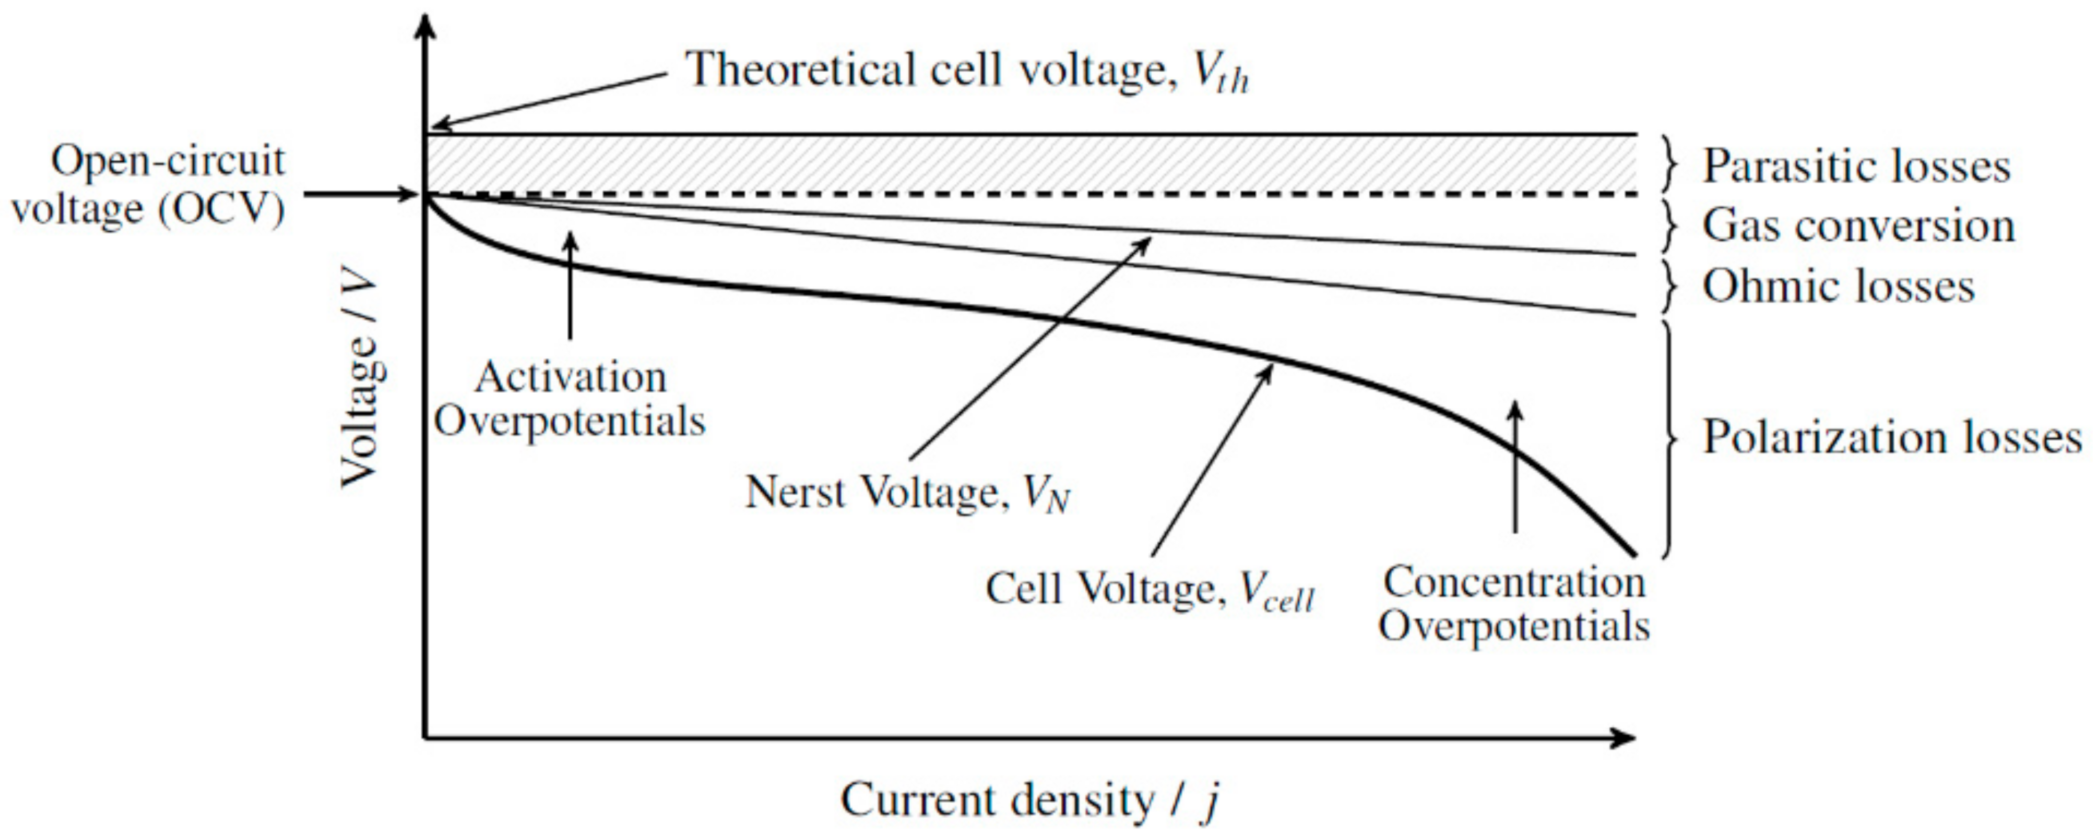
1.1. Solid Oxide Fuel Cells—Brief Technology Overview

Solid Oxide Fuel Cells consist of high temperature electrochemical conversion systems whose operating principle is based on redox reactions of a fuel (hydrogen or other compatible fuels) in an electrolyte-electrode assembly [18,25]. In Figure 1 a schematization of the SOFC technology is illustrated.
The denomination of said category of fuel cells is related to the electrolyte, which is composed of a ceramic oxide (state of the art material is Yttria-Stabilized Zirconia “YSZ”—where an 8% Y2O3 content is usually the most commonly used formulation) which becomes an ionic conductor at high temperatures (between 750–900 °C, according to the electrolyte thickness) [18]. The electrolyte layer remains an electronic insulator at all temperatures and provides a gas tight layer avoiding cross-leakage of fuel or oxidant. Moreover, the electrolyte material is stable to both reducing and oxidizing environments other than presenting good mechanical and thermal stability characteristics (provided that thermal expansion coefficients of anode, cathode and electrolyte are compatible) [26]. Following the fuel flow (here assumed as only hydrogen for simplicity), H2 flows through the porous anode compartment (typically constituted of Ni with additional YSZ to increase the Triple Phase Boundary “TPB” (regions where gas, electronic conducting phase and ionic conducting phase coexist, named) [11] and avoid Ni grain growth [27]) where it is diffused from the bulk layer towards the functional layer at the electrode–electrolyte interface (TPB region); here H2 is oxidized in the catalytic active sites by the O2− ions releasing electrons in an external electrical circuit (anode semi-reaction, Equation (1)).
H 2   + O 2 H 2 O g   +   2 e
In turn, the O2− ions crossing the ionic conductive electrolyte are obtained from the reduction of the O2 feed (or air feed) at the cathode caused by the flow of electrons between the electrodes (cathode semi-reaction, Equation (2)). Typical cathode materials are catalytic perovskites such as Lanthanum Strontium Manganite “LSM” or Lanthanum Strontium Cobalt Ferrite “LSCF” [26], an oxide (Gadolinia Doped Ceria “GDC”, Yttria Doped Ceria “YDC”) interlayer is usually added to avoid reactivity between LSCF and YSZ electrolyte and avoid the diffusion of cathode compounds towards the electrolyte [28,29,30].
1 2 O 2 +   2 e   O 2    
As shown in the global reaction (Equation (3)) H2 and O2 are consumed, producing H2O at the anode (which is evacuated together with the unreacted fuel). Electrical power is generated at the terminals of the electrode pair, according to the fuel cell voltage and current, together with high-grade heat (considering the high operating temperature) [8].
H 2 +   1 2 O 2 H 2 O g  
Other than the electrochemical conversion pathway (which is solely dependent on the cell current) concurrent chemical reactions (reforming and shift reactions) can occur in the anode chamber thanks to the high operating temperature and Ni catalyst presence, allowing the use of a wide spectrum of hydrocarbon fuels as previously described [20,31].
In order to assess the electrochemical performances of a fuel cell the voltage is the first and most typically monitored indicator [32]. From a thermodynamic point of view, the maximum voltage that can be obtained from a single cell (electrolyte & electrode pair) in Open Circuit Voltage “OCV” conditions, defined for a giving operating temperature and gas composition, is named Nernst potential EN (Equation (4)) [18,33,34].
E N O C V   =   Δ G 0 2 F   +   R T 2 F ln p H 2   p O 2 0.5 p H 2 O
ΔG represents the Gibbs’ free energy variation related to the electrochemical reaction (Equation (3)), R is the universal gas constant (8.314 J/(mol K)), T (K) is the operating temperature, F is the Faraday constant (96,485 C/mol) and pi is the partial pressure (bar) of the gas species i, which under atmospheric operating conditions can be simplified to the volumetric content (%vol). The first term represents the ideal voltage E 0 in standard conditions (298 K, 1 bar) while the second term represents a correction coefficient in terms of actual operating conditions [35,36]. The deviation of the OCV from EN provides an indication of parasitic losses, mainly in terms of gas leakages and electrical dispersion.
In turn, the SOFC performance under electrical load conditions is usually assessed via IV polarization curves, where the voltage trend is strongly non-linear with the current conditions due to various physiochemical phenomena (mainly charge and gas transfer) occurring internally to the fuel cell itself. A typical IV curve profile is shown in Figure 2.
Starting from the OCV the Vcell profile is characterized by a sharp drop at low current density, due to the energy required to overcome the energy barriers at the active sites (so called activation losses), followed by a near-linear region affected mostly by the ohmic losses determined by the sum of the ionic conductivity of the electrolyte layer and the electronic conductivity of the electrodes. Finally, at high current densities a second sharp voltage drop is observed (so called concentration losses), caused by localized undersupply of fuel gas at the TPB respect to the gas requested by the high current load, exceeding the gas diffusion capacity through the electrode pores. Short-term persistence in such operating conditions has a highly detrimental effect for the electrode microstructure, causing localized anode delamination and consequent irreversible degradation of the fuel cell performance. Temperature effect is dual: while it reduces E N O C V (Equation (4)) from a thermodynamic point of view, from a kinetic point of view it increases the material ionic conductivity of the electrolyte, strongly reducing the cell resistance in the ohmic region [25,36,37], but decreasing the electrical conductivity of the current collector.
Overall polarization losses are given by the sum of activation and concentration losses. Finally, in the case of unconventional fuel supply to the SOFC, additional losses related to the chemical conversion processes are added [31].

1.2. Solid Oxide Fuel Cells—Laboratory Scale Considerations

The characteristics of the different fuel cell technologies are reflected at laboratory scale. From a cell point of view low temperature fuel cells are relatively simpler and quicker to characterize, due to near-ambient operating conditions and immediate response of the sample to a change in the input conditions [32]. Thermo-mechanical conditions also allow simpler materials and test bench management. As a downside, the noble catalyst materials are expensive and the electrolyte material presents limited chemical compatibility [14]. Additional balance of the plant is required at membrane and electrode level (water management, pressurization, purging etc.) [35,38,39]. Instead, high temperature fuel cells require a temperature-controlled environment with a complex thermal balance of plant, and long start-up/shut-down procedures must be followed with longer stabilization times [40,41,42]. High operating temperature represents a challenge for materials both from the gas sealing point of view (typically Si-based sealing materials [43]) and from the thermo-mechanical and corrosive resistance point of view (at current collector level) [44]. The differences in current/power densities entails smaller samples for high temperature fuel cells, reducing material amount and cost [13,14,45]. In addition, the thermal load significantly impacts the performance stability of the sample, with little possibility for thermal cycling, cold-stops or re-use of the same sample for further multiple testing [46]. From a fuel quality point of view, as previously described, low temperature fuel cells strictly require high hydrogen purity while high temperature fuel cells are able to process a wide range of fuels, including hydrocarbon [13,20,31].
In Table 1 the main characteristics at system and laboratory level are summarized.

2. Materials and Methods

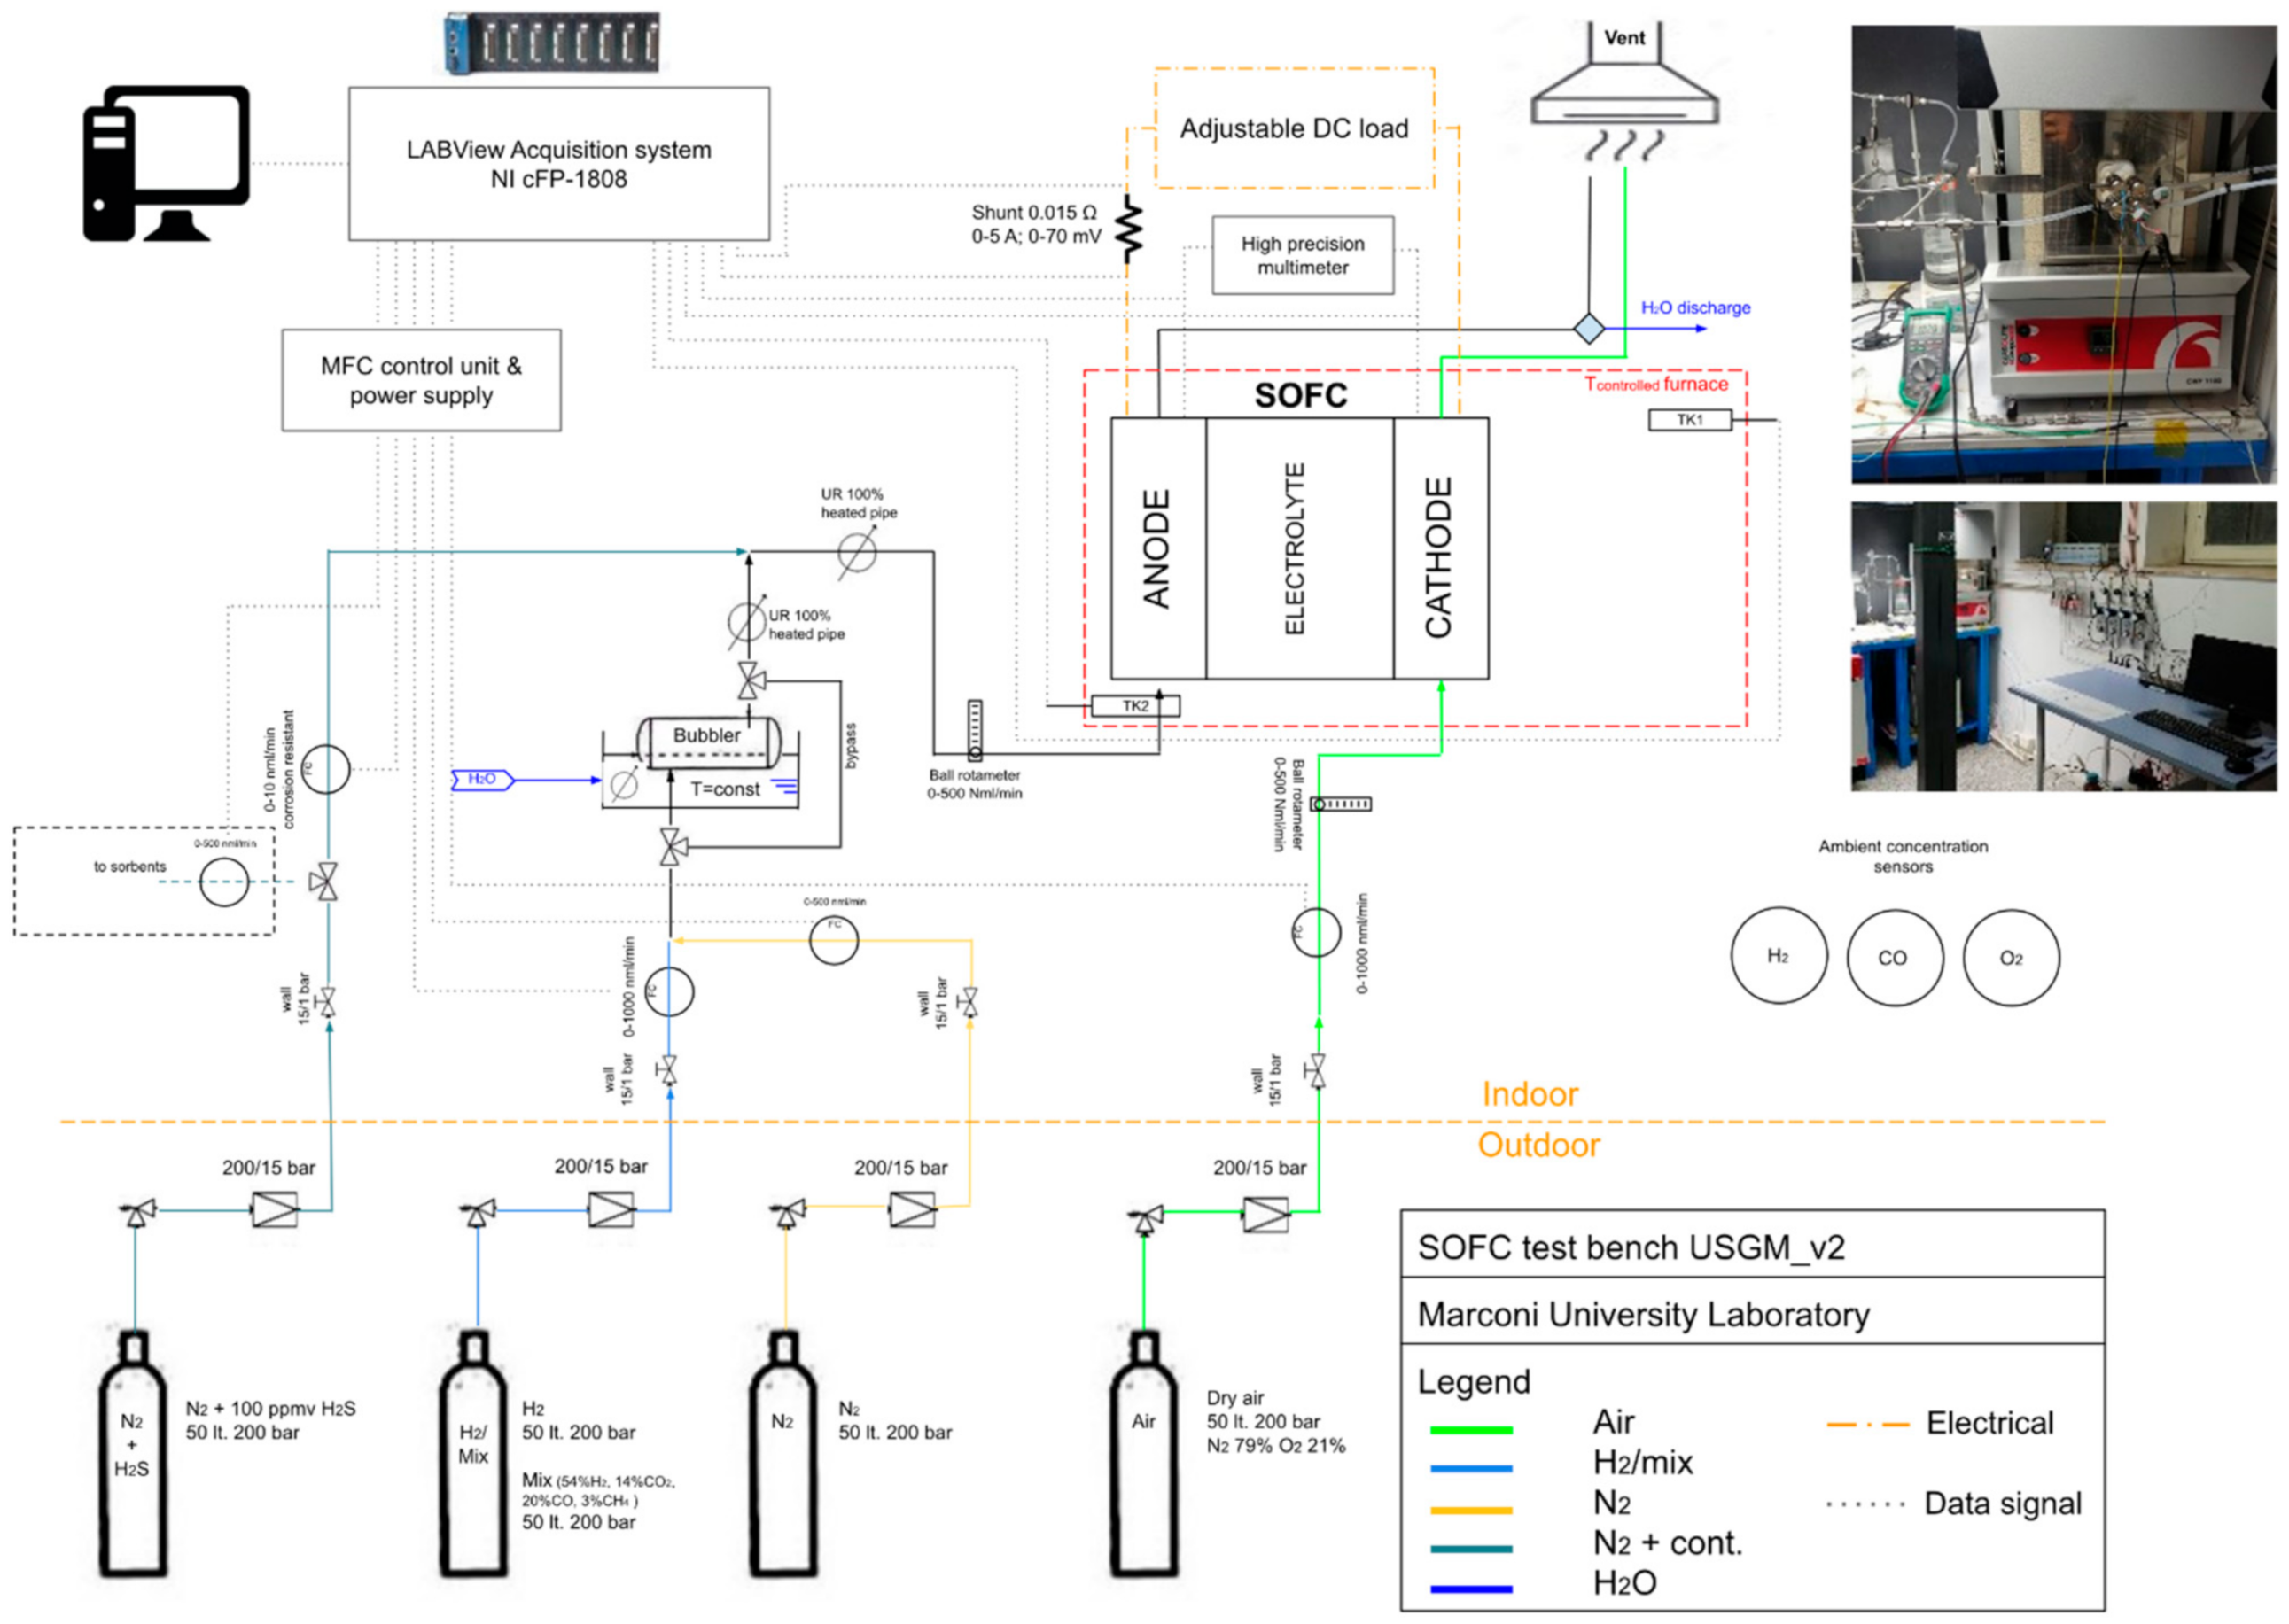
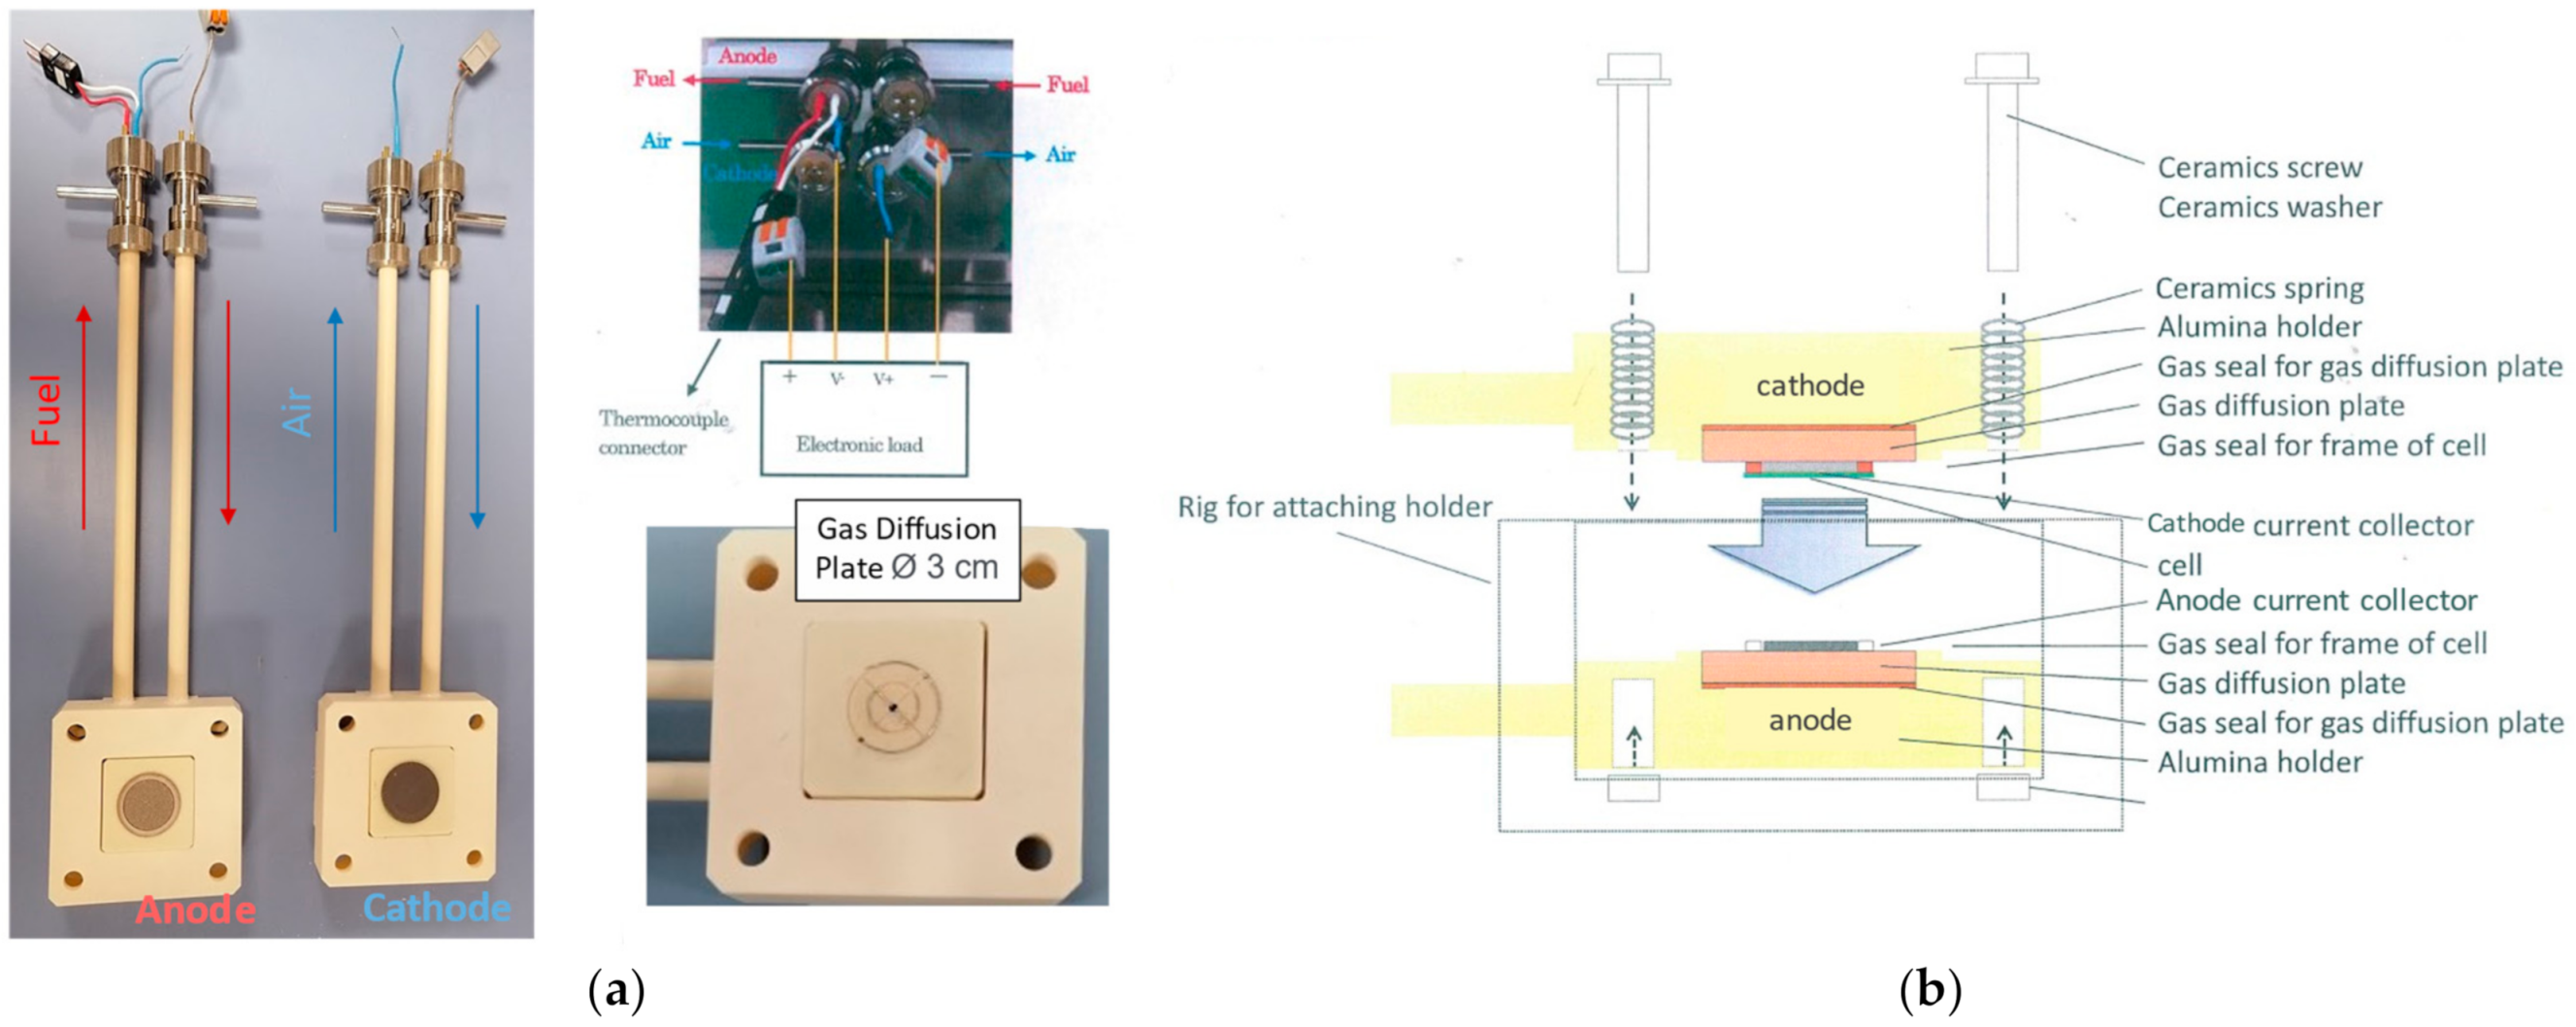
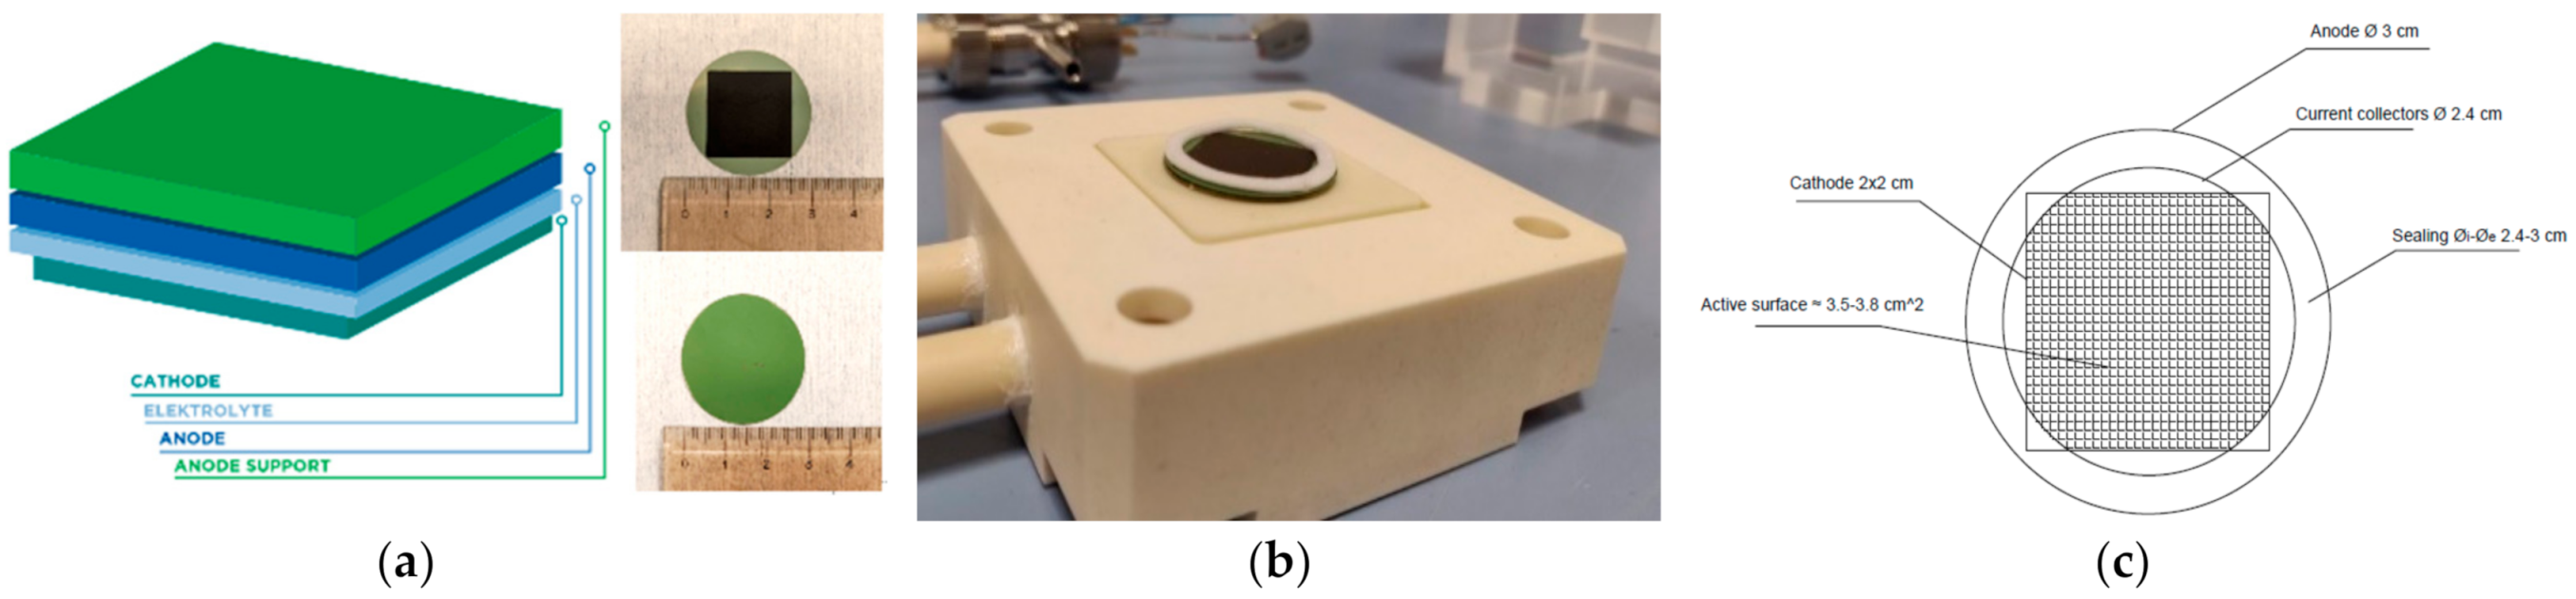
2.1. Experimental Setup & Procedures

The experimental set-up overall scheme is shown in Figure 3. The detailed description of each section of the test bench is reported below.
A programmable furnace Carbolite Gero CWF 11/13 3216 (30–3000 °C) is used to obtain a temperature-controlled chamber for the SOFC operation. The furnace is controlled both for the temperature ramp during the start-up/shut-down phase and to maintain a constant and uniform operating temperature for the SOFC (between 700–800 °C) during operation. The furnace temperature is controlled via a PID controller acting on a closed loop control, acting in turn on the temperature reading from the thermocouple TK1 (type K) installed inside the furnace. An additional thermocouple TK2 (type K) is installed at the anode inlet to monitor the inlet gas feed temperature.
The gas distribution system consists of four lines of pure (N2, H2), mixed (air, syngas) and contaminated (N2+ contaminant) gases stored in steel cylinders (50 L × 200 bar) to feed the SOFC unit under different conditions. The fuel (H2 or syngas) is mixed with N2 to calibrate different desired fuel compositions in the anode compartment. A separated line for contaminants (diluted in N2) is foreseen to add contaminants in a controllable way to the anode inlet in order to analyze degradation effects. The cathode flow is composed of compressed air as the only oxidant. The gas pressure is reduced at the first stage (outdoor) from 200 bar to 5–15 bar and at the second stage (in-door) from 5–15 bar to the operating pressure of the test bench (around 3 bar). Mass Flow Controllers “MFC” (Bronkhorst EL-Flow) and ball rotameter are used in order to control the flow rate of each selected gas and to monitor the total flow rate to both electrodes, respectively. The MFCs are connected to their control unit via RS232 serial communication protocol and successively connected to the data acquisition system. The outlet streams are collected (water from the anode outlet is discharged) and are safely vented via the chemical hood to the atmosphere.
A gas bubbler kept at constant temperature by a hot-plate magnetic stirrer device (Heidolph MR Hei-Tec) is integrated to the system in order to humidify the anode flow as a function of the temperature at the bubbler. Temperature controlled line heaters are foreseen for the whole length downstream of the bubbler in order to constantly heat the inlet feed and avoid water condensation. In case of dry gas feed, the whole bubbler section is bypassed.
An electronic DC load (PeakTech 2275; 0–36 V; 0–30 A; 1 mV resolution; ± 0.03–0.1% full scale accuracy) is used in galvanostatic mode for electrochemical characterization. The current setpoint is double-checked by introducing a series shunt resistor (0.015 Ω; 0–5 A; 0–70 mV) from which the actual current can be measured without significantly affecting the cell voltage. In any case, the voltage is read by a high precision voltmeter (Mastech MS8229; 400 mV–400 V; 1 mV resolution; ±0.7% full scale accuracy) from separate voltage wires in order reduce signal interference due to the current flow in the DC load and the voltage drop across the shunt.
The data acquisition and control system consist of a National Instruments cFP-1808 field point module which reads input signals from the instrumentation (thermocouples, MFCs, voltmeters, shunt) and is connected to the Local Area Network (LAN) via ethernet cable. A custom LabVIEW software is used from a local PC in order to monitor and control the system.
An innovative All-Ceramics SOFC Test Holder from CHINO Corporation [47] has been used, depicted in Figure 4. The used holder consists of a closed setup built entirely in alumina, designed specifically for Ø 3 cm button cells or 5 × 5 cm single cells. Thanks to the ceramic properties the thermal and electrical insultation is maximized with respect to typical metal-based, open setup configurations [40,48]. Gas tightness in the SOFC assembly is obtained by gas sealings and by spring loading (also in ceramic material), calibrated according to the cell type (anode supported or electrolyte supported cell). The gas is distributed radially in the gas distribution plates at both the anode and cathode side, reducing the risk of possible gas leakages for improper sealing with respect to longitudinal gas distribution approaches. The outlet gas is collected at the periphery and discharged in the outlet alumina tubes, to which the metal terminals are attached. The DC load is externally connected to the terminals and the pre-mounted voltage and current wires pass inside the alumina tubes. Electrical insulation is enhanced by using current wires and voltage sensing wires to reduce parasitic currents.
The SOFC assembly used is schematized and illustrated in Figure 5a. Annular glass sealings (Øext 3 cm, Øint 2.4 cm) are applied to both sides of the cell (Figure 5b). A Ni mesh current collector (Ø 2.4 cm) is used for the anode side while a Ag mesh current collector is used for the cathode side (Ø 2.4 cm). The sealing slightly reduces the active surface available at the cathode side to ≈3.5–3.8 cm2 (Figure 5c). Conservatively, an active surface of 3.5 cm2 has been considered for further calculations.

2.2. Experimental Campaign Design

The assembled SOFC unit is positioned into the controlled temperature furnace and the followed start-up and reduction procedure is as follows [44,50]:
  • During the start-up, the temperature is ramped up at a 1 °C/min rate until reaching the desired temperature (to reach 750 °C, approximately 12 h are required) while purging anode & cathode with inert gases (N2 100 Nml/min and air 100 Nml/min for anode and cathode respectively) for the whole duration of the temperature ramp; the furnace is left to stabilize until the desired temperature is constant;
  • The anode reduction phase (once reached temperature stabilization) is obtained by initially flowing from 1 h a small amount of hydrogen in the total anode flow (H2 = 10%vol = 15 Nml/min; N2 = 90% = 135 Nml/min) in order to initiate the electro-oxidation reaction at the anode side. Successively, standard conditions (50%/50% H2/N2) are reached varying both gases with incremental steps of ±5 Nml/min each 5 min; the cathode air flow rate is increased to 250 Nml/min to operate under over-stoichiometric air ratio conditions;
  • Once the cell has stabilized for at least 1 h in standard conditions, desired conditions can be set. Related to each change of condition a stabilization time of 1 h is observed in order to guarantee steady state operation.
Two experimental campaigns are carried out operating on the same fuel cell, after being initialized as described above. The first campaign is meant to carry out a parametric analysis to assess the effect of the gases fed to the different anodic/cathodic chambers and the effect of different operating temperatures. The performance of the cell in terms of IV curve is assessed for each operating condition. The second campaign assessed the short-term stability of the setup, maintaining the cell continuously under an electric load current equal to 1 A for 140 h while monitoring the cell voltage. In addition, a full polarization curve is performed at the beginning of the test (t = 0 h) every 24 h (t = 24 h; 48 h; 72 h; 96 h; 120 h; 144 h) and at the end of the test (t = 140 h) to assess the performance trend of the fuel cell over the whole current spectrum and not only at the current setpoint.
For the parametric analysis one parameter at a time is varied while all other parameters are kept in standard conditions (Anode: H2/N2 = 50%vol = 75 Nml/min; Cathode: air 250 Nml/min; T = 750 °C; stabilized). In this way the effect of each variable is assessed separately, without considering superposed effects of different parameters. Table 2 summarizes the testing conditions for the parametric analysis experimental campaign.
Hydrogen content is varied at the anodic chamber (10/25/50/75/90%vol) while nitrogen content is varied accordingly to compensate the hydrogen variation and maintain the constant total anodic flow rate equal to 150 Nml/min (which is standard for button cells, resulting around 20–40 Nml/cm2). At the oxygen electrode, the air flow rate is varied to achieve different values of air ratio λ (0.5/1/2), as defined in Equation (5) as the ratio between the provided oxygen volumetric quantity (provided as 21% of the cathodic air flow rate) and the stoichiometric requirement of oxygen with respect to the nominal hydrogen flow rate at the anode chamber, according to the stoichiometry of the hydrogen electro-oxidation reaction [51,52].
λ = Q O 2 Q O 2 , s t o i c h     =   21 %   Q a i r , c a t 0.5   Q H 2 , a n
where Q i is the volumetric flow rate (Nml/min) of the i-th component. It can be noted from Table 2 that different λ values are obtained by modifying the total cathodic flow rate, due to the fact that an independent O2-only line is not available in the experimental setup (it must be noted that the λ = 0.5 case is based on the inlet gas stoichiometry, and does not necessarily imply that the cell will operate in under-stoichiometric condition, since not all of the H2 content reacts in the fuel cell, according to the imposed current load). Standard conditions (air 250 Nml/min; O2 52.5 Nml/min) correspond to λ = 1.4, hence a slightly over-stoichiometric condition.
Temperature is varied (700/750/800 °C) within the operational window of SOFC technology by ramping the temperature of the furnace at a ramp rate of 1 °C/min to the new desired temperature. When a new temperature setpoint is set, the system is left under stabilization for at least 1 h to ensure that the performance curves are under steady-state conditions.
The polarization curve is obtained by sweeping the cell current from Open Circuit Voltage “OCV” at 0 A, with discrete incremental steps of 0.1 A until reaching 3.5 A (≈1 A/cm2) or reducing the cell voltage below 750 mV, whichever event comes first. In each current step the electronic DC load is operated in galvanostatic mode. The voltage threshold of 750 mV has been introduced to preserve the integrity of the fuel cell during the whole experimental campaign and to avoid introducing eventual irreversible degradation due to deep polarization which could alter the results. The average value of voltage is considered for each current setpoint [44,53]. The power measurement is obtained directly by multiplying the current and the cell voltage; specific values (current density, power density) are obtained by dividing the respective quantities by the active surface (considered conservatively equal to 3.5 cm2) as previously described.
The short-term stability test is taken out by using the same electronic DC load in galvanostatic mode with a steady-state current setpoint equal to 1 A (≈0.3 A/cm2) for 140 consecutive hours [54]. It must be acknowledged that the current loading is rather low with respect to the cell capability; however, it can be considered acceptable since the aim of the short-term stability test is to validate the ceramic test bench used and not to obtain high fuel cell performances. Each 24 h during the test the cell is depolarized to perform a full IV curve as described above to assess the performance trend through time, successively the cell is again polarized at the current value of 1 A (≈0.3 A/cm2). At the end of the test a deeper IV curve is repeated (cell voltage down to 700 mV) to check if any degradation issue id identified beyond the usual current operating range.

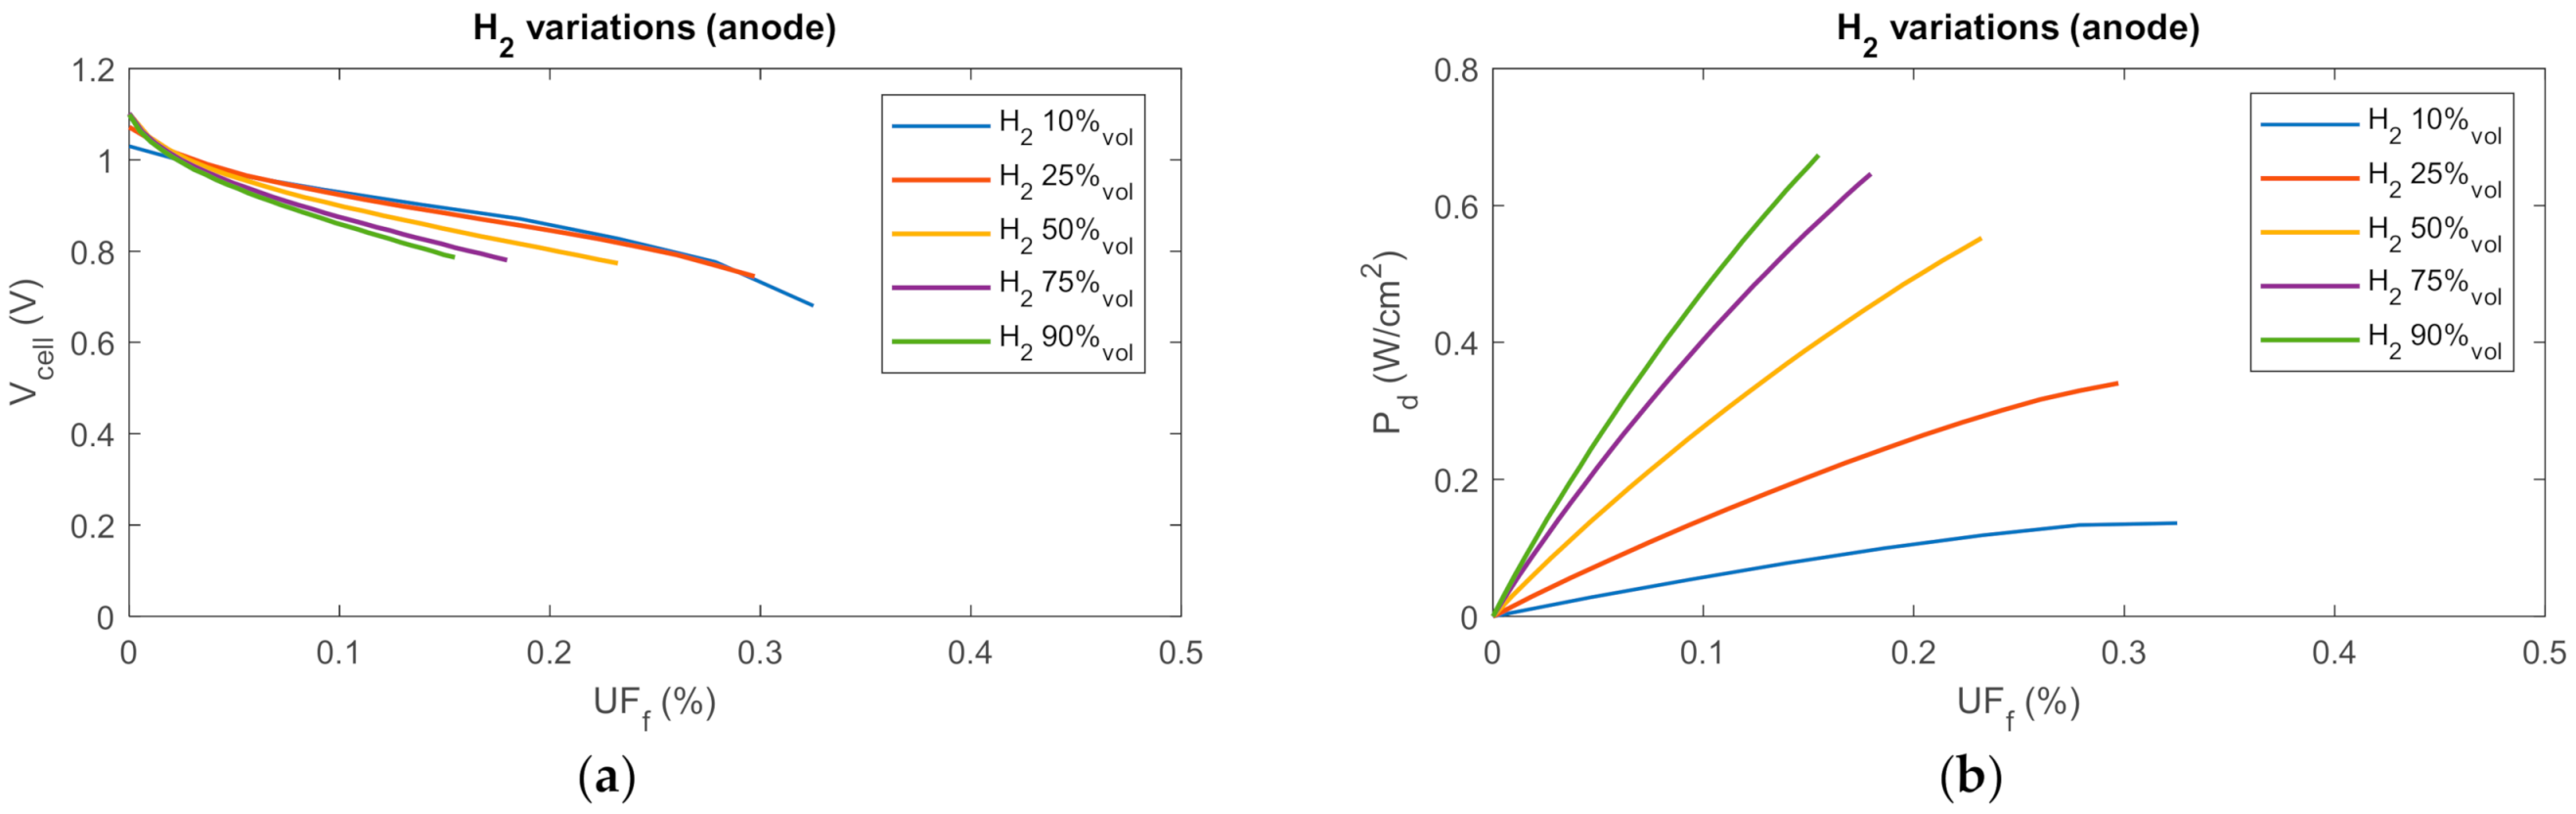
2.3. Parameter Calculation—Utilization Factor and Area Specific Resistance

From the cell measurements various indirect quantities can be derived which are representative of the fuel cell operation. In particular, the fuel Utilization Factor “UFf” (electrochemical), oxidant Utilization factor “UFo (electrochemical) and Area Specific Resistance “ASR” are derived, as defined in Equations (6)–(8):
U F f = Q H 2 , r Q H 2 , a n = I 2 F   · 22.414   · 60 · 1000 Q H 2 , a n
U F o = Q O 2 , r Q O 2 , c a t = I 2 F · 22.414   · 60 · 1000 21 %   Q a i r , c a t
A S R = R cell   S cell = Δ V cell I Δ I     S cell
where: Q   is the volumetric flow rate (Nml/min) of each species—the subscript r meaning “reacted”; I is the cell current and F is the Faraday constant (96,485 C/mol). It should be noted that the Utilization Factors (fuel and oxidant)—as defined in Equation (6) and Equation (7)—are purely related to the electrochemical conversion pathway.
The UFf term provides an indication of the amount of fuel consumed in the electrochemical process respect to the total inlet amount. The theoretical UFf depends on the cell current, which determines the amount of reactant involved in the anode half reaction (Equation (1)). However, from an experimental point of view [55] the UFf is affected by concomitant chemical reactions which convert the hydrogen content in the fuel gas and other conditions leading to a not useful consumption of fuel gas such as fuel leakage. In the present study, only the theoretical UFf is analysed since the numerical determination of the outlet H2 content is currently unavailable at the test bench.
A strong technological limitation in fuel cells is represented by the UFf range. Values of UFf close to the unity are not desired, resulting in localised fuel starvation and consequent non-uniform conditions throughout the cell surface [18]. For this reason, a UFf range of 60–80% is desired in fuel cell stacks (even lower in terms of once-through UFf at single cell level [56]) to preserve integrity. At system level, anode outlet recirculation devices (blowers or ejectors) are often integrated to maximize fuel economy [57,58].
Instead, UFo is typically low (λ values as high as 5–8) at both stack and button cell scale, since oxidant is usually fed in highly over-stoichiometric conditions without representing a relevant cost to the system [34,52,59,60].
The ASR (Ω cm2) is a typical performance parameter, especially for high temperature fuel cells, representing the slope of the IV curve, normalized to the cell active surface. The ASR can be defined for each operating point of the IV curves; however it can be given as a one-time value (ASRohm) for the ohmic region, for which it is nearly constant [50,61].

3. Results & Discussion

As previously discussed, the results of the two experimental campaigns are presented and discussed separately. The main and most relevant results are presented and discussed while the full result dataset with all 24 test cases results and respective elaborations can be found in the Supplementary Materials Section.

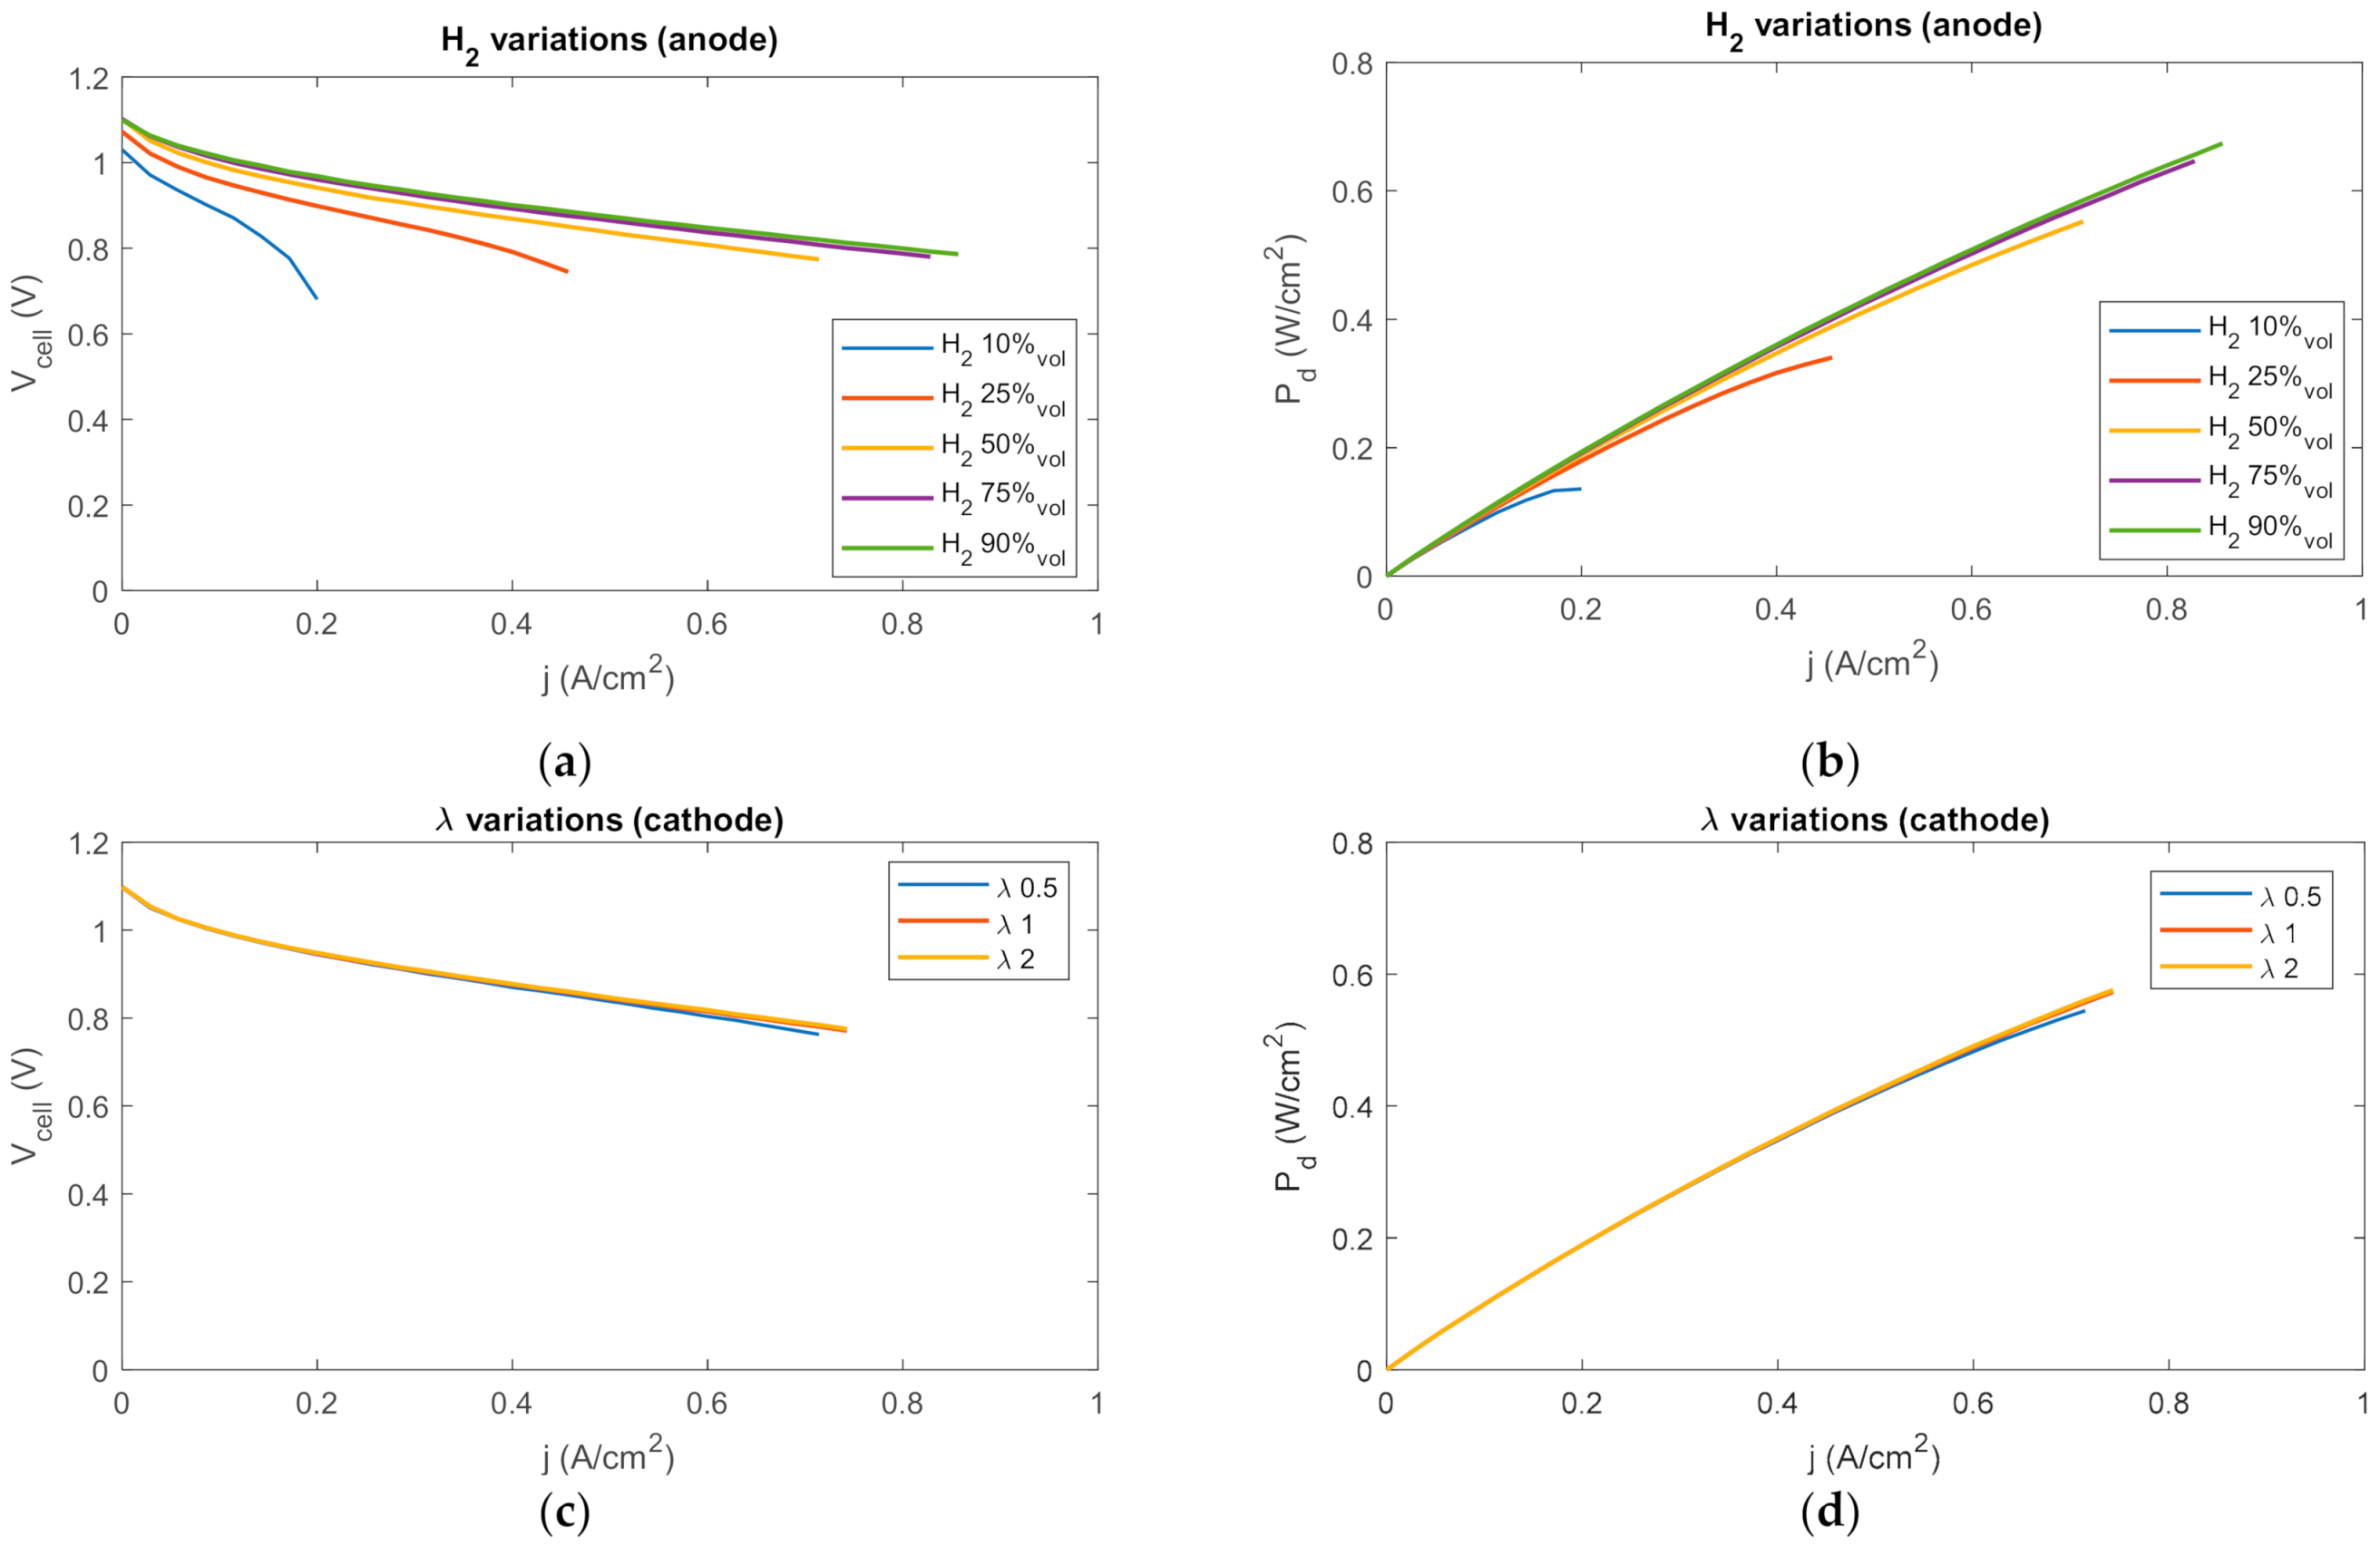
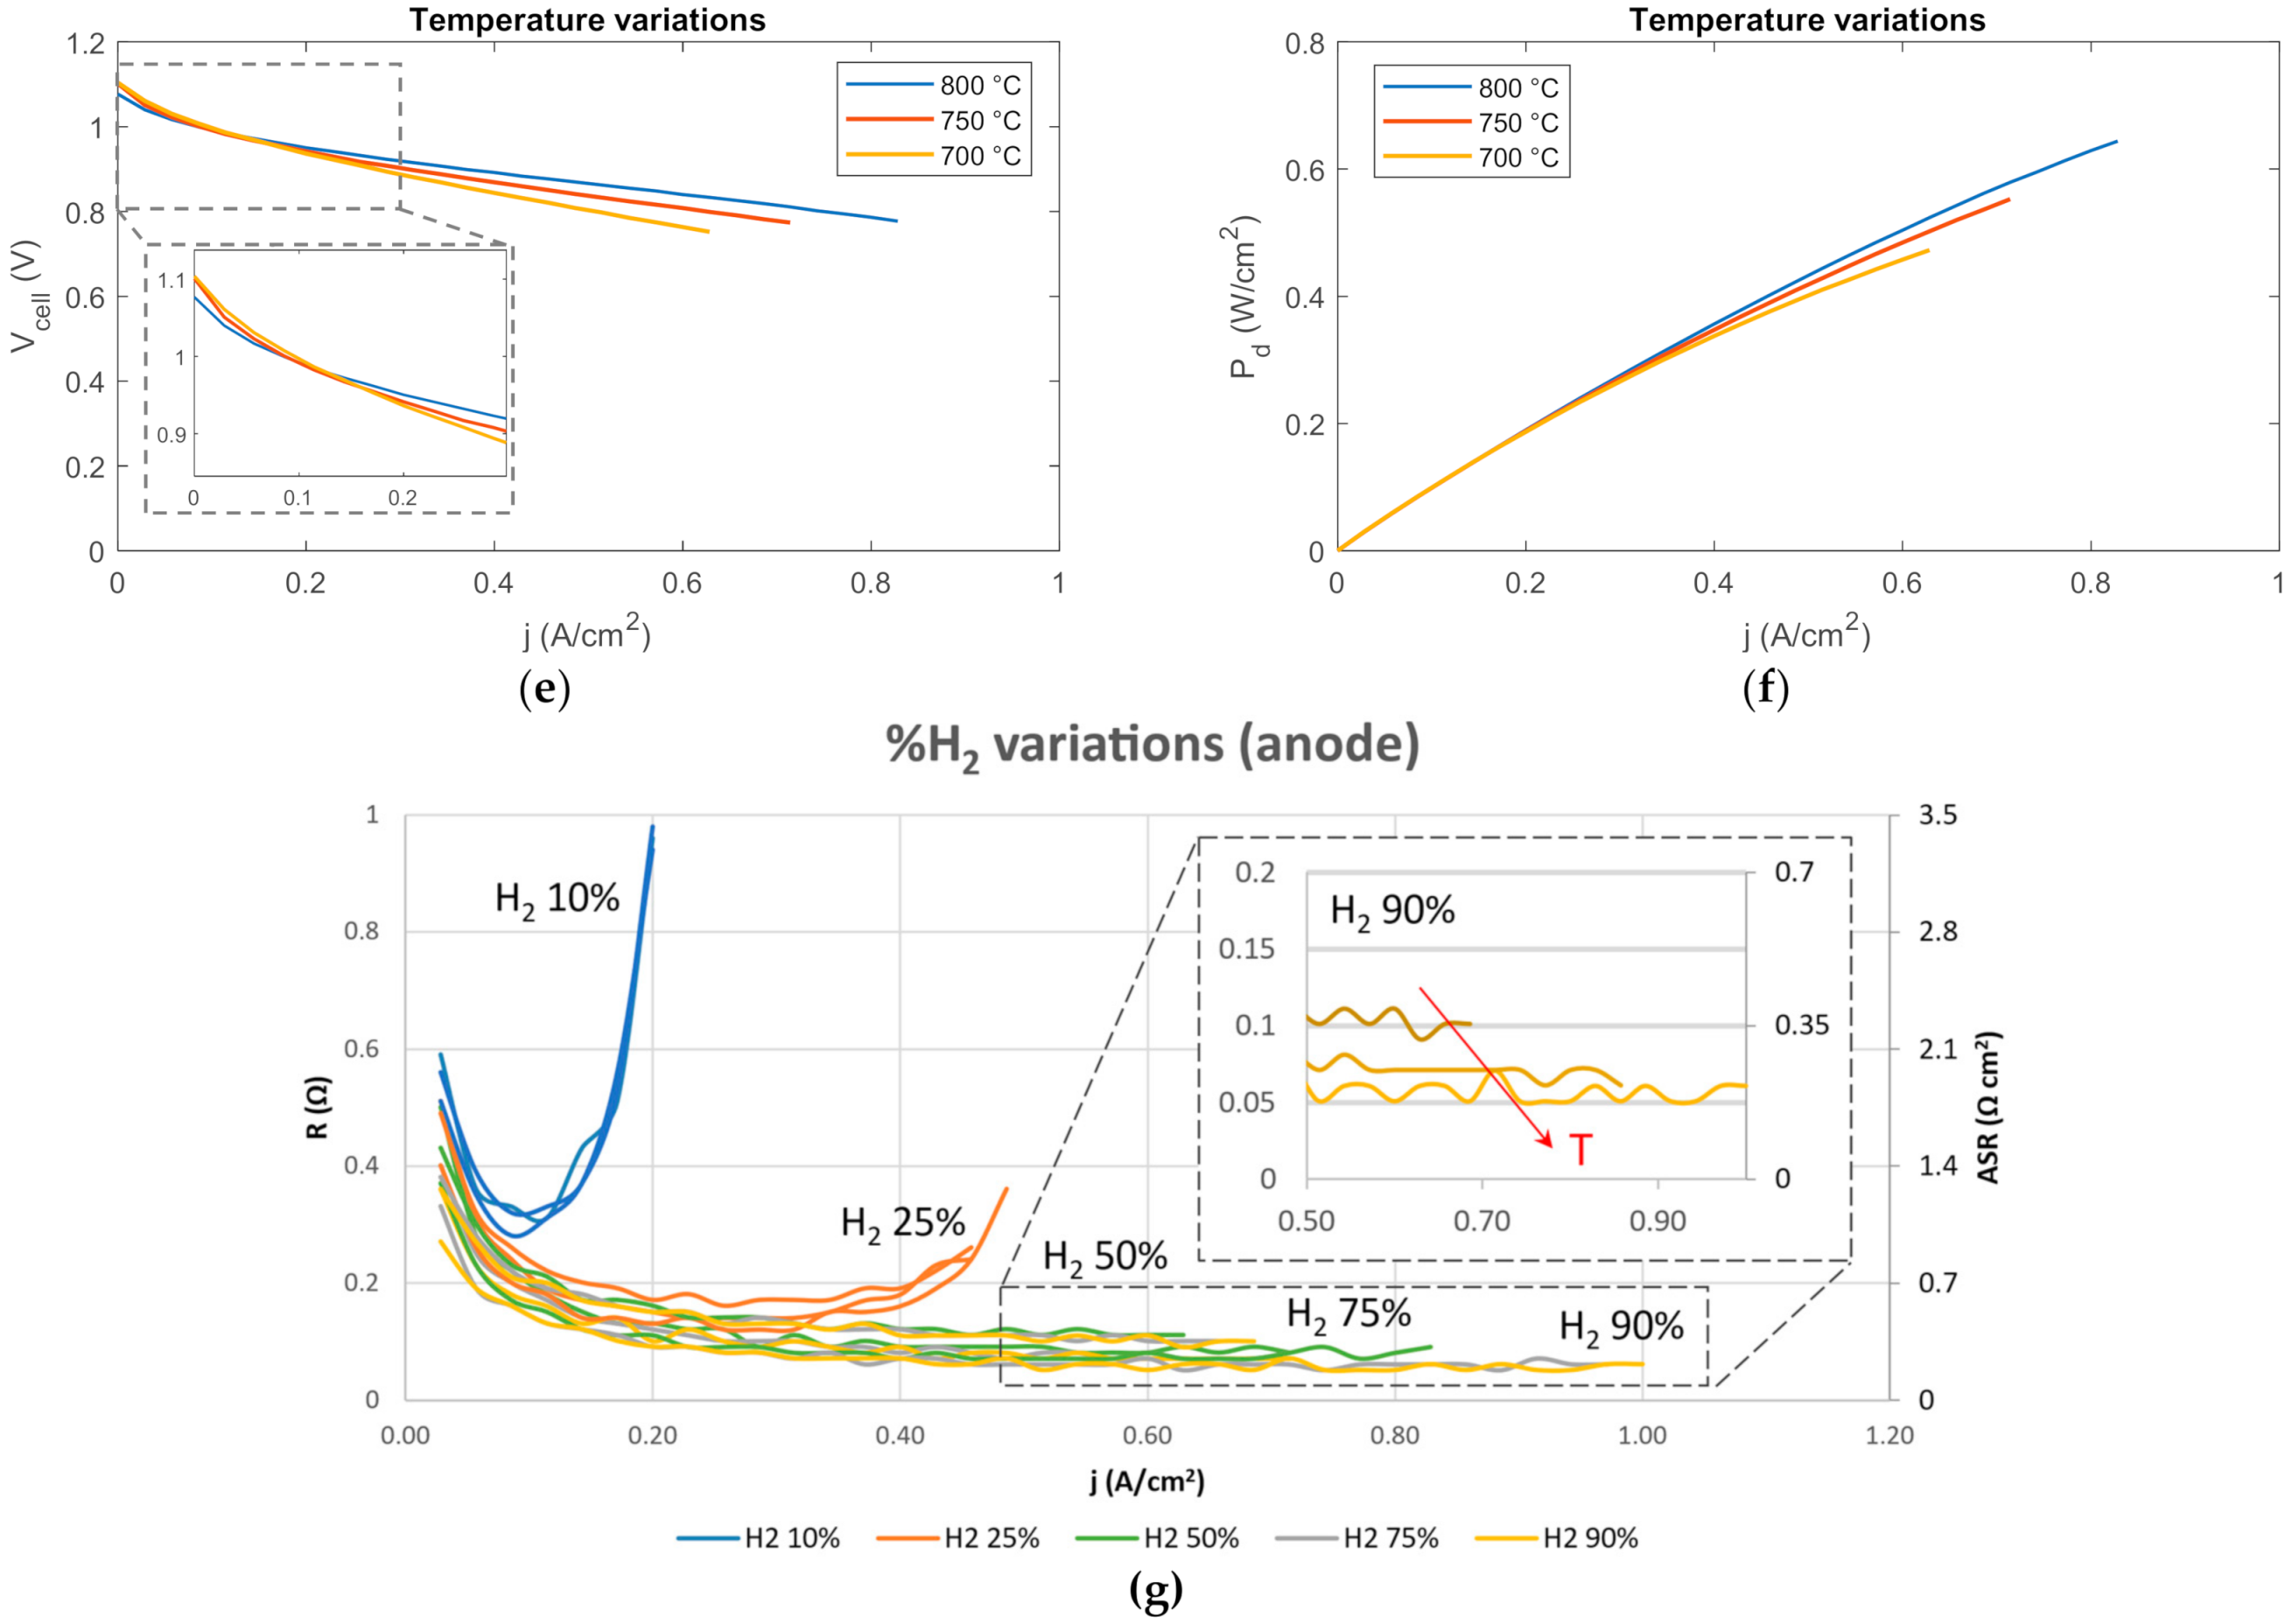
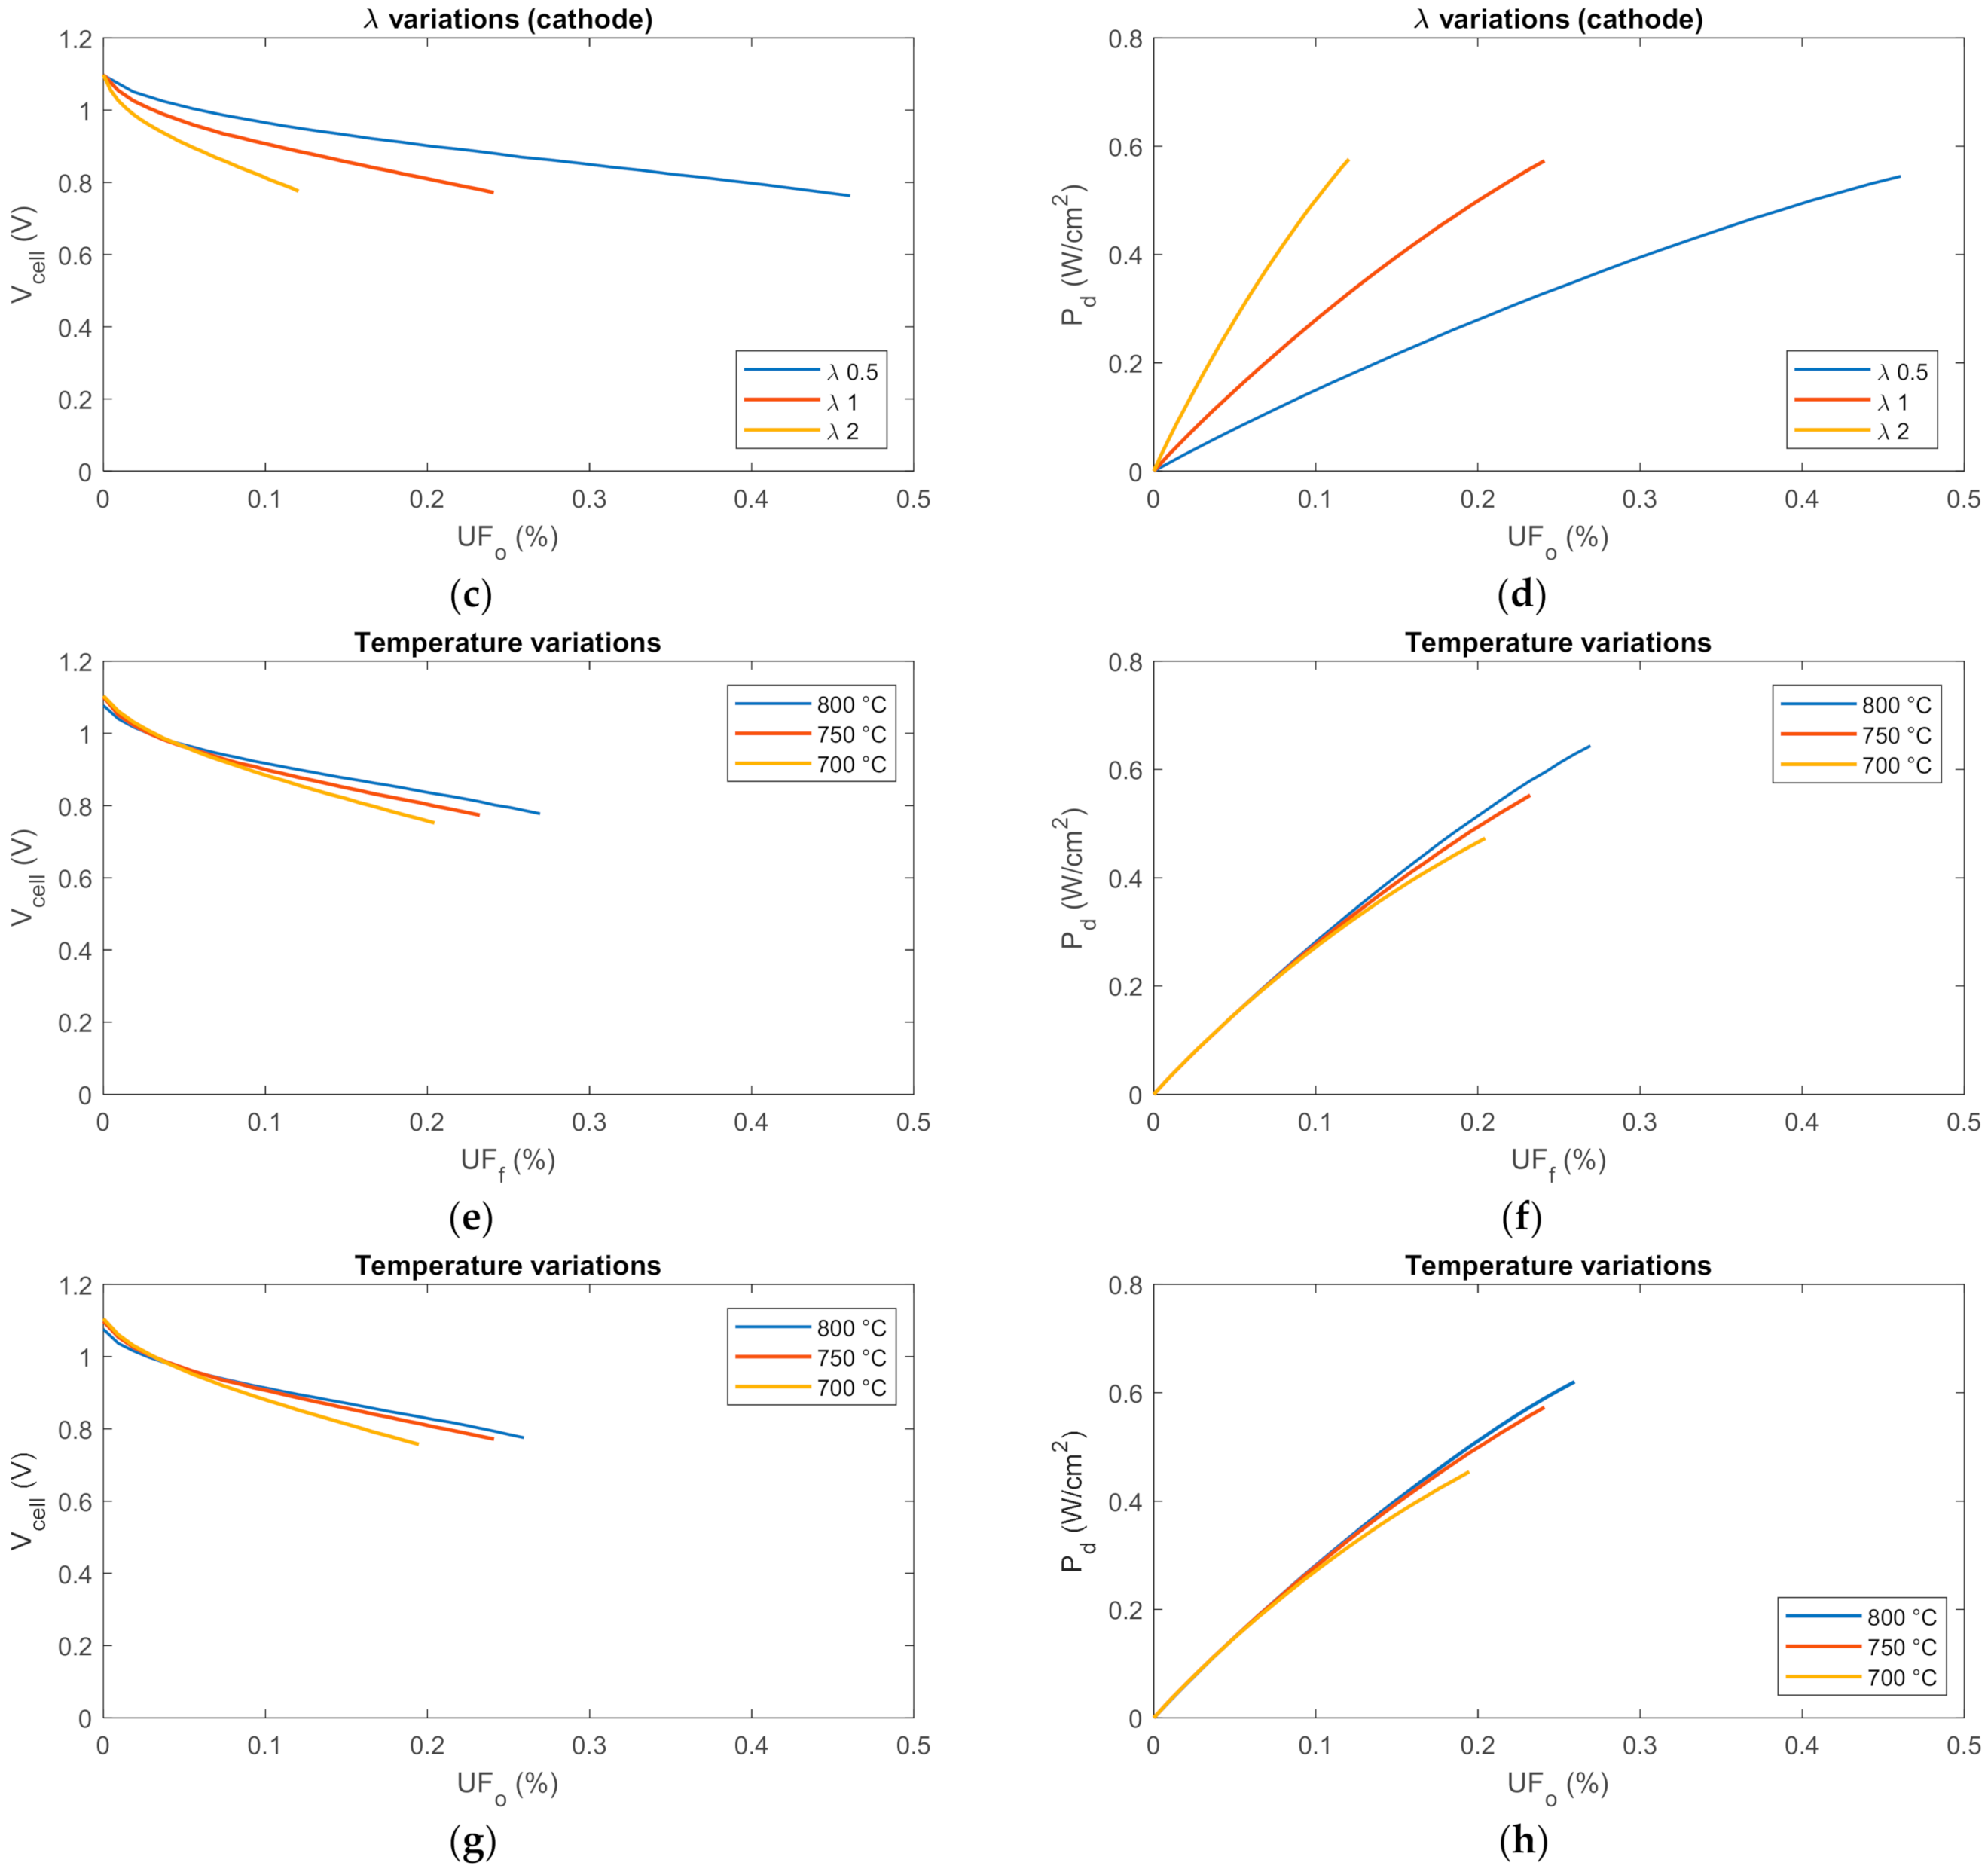
3.1. Parametric Analysis

The parametric analysis is carried out by setting the inlet compositions (anodic and cathodic) according to the selected range of the analyzed parameters (H2%vol, λ) described in Table 2 and repeated in 3 different temperatures (700, 750, 800 °C). The summarized parametric analysis results are reported in Figure 6a–f. In Figure 6g the internal resistance trend is illustrated and ASR range in the ohmic region is assessed. In Figure 7 the voltage and power profiles are plotted vs. the UFf and UFo according to the tested conditions.
Overall, the results follow the expected trends and are stable through time. The OCV values are all above 1 V, showing a good performance respect to the Nernst potential which is equal to 1.18 V in reference conditions (T = 298 K; ptot = 1 bar; pH2 = 1 bar; pO2 = 1 bar; H2O(g)) and between 1.04–1.14 V in tested conditions (T = 973–1073 K; ptot = 1 bar; pH2 = 0.1–0.9 bar; pO2 = 0.21 bar; H2O(g)). The high OCV values also mean that there is very little reactant leakage thanks to the radial gas distribution pathway at both anode and cathode side, and overall sealing is good. From the IV and IP results (Figure 6) it can be observed that the parameter with greater impact on the cell performance is the inlet H2 content, followed by temperature and finally λ, which barely affects the polarization curves in the analyzed variation envelope. Quite low values of Utilization Factor (both fuel and oxidant) are reached, due to the limited cell surface and relatively high input flow rates which is common in button cell testing.
From Figure 6a it can be observed that higher H2 concentrations (50%; 75%; 90%) show reduced voltage drops (i.e., reduced both activation and concentration losses), longer IV curves (reaching current values up to around 0.7–0.85 A/cm2 without dropping the voltage below the 750 mV threshold) and a more linear behavior, increasing the permanence in the ohmic region. On the other hand, a reduced H2 content (10%; 25%) shows shorter IV curves with voltage drops due to concentration losses occurring in an earlier stage (the voltage threshold is reached for values of current as low as 0.3–0.4 A/cm2 for H2 25%vol and below 0.3 A/cm2 A for H2 10%vol). This is attributable to a higher fuel content which improves both the thermodynamic E N O C V (Equation (4)) and the kinetics of the cell reactions, by increasing the available gas which can be oxidized at the active sites of the TPB. The effects observed in the IV curve are reflected in the IP curve (Figure 6b), where high H2%vol cases achieve higher maximum power values (around 0.7 W/cm2) with rather linear trend, lower H2%vol cases generate lower power (as low as 0.15 W/cm2 for H2 10%vol) and show a power loss with non-linear tendency due to the concentration losses. On the other hand, an increased inlet H2 concentration entails lower UFf at equal current loading (Figure 7a) since the fuel inlet flow rate Q H 2 , a n is increasing (Equation (6)). On one hand higher UFf values can be achieved with lower H2%vol cases. This is because at equal current, more fuel is being consumed with respect to the inlet flow. On the other hand, lower UFf cases suffer lower performances: in fact, from a power point of view (Figure 7b), higher UFf cases (lower H2%vol) achieve lower output power. This aspect is relevant in fuel cell stacks, where a trade-off must be found between stack performance and fuel utilization in each cell unit [34,56].
The effect of temperature is shown in Figure 6e,f and Figure 7e–h. As previously discussed in Section 1.1, the temperature has a dual impact, in terms of OCV and in terms of reaction kinetics. The OCV obtained in standard conditions (H2 50%vol; λ = 1.4) at 800 °C (1.077 V) is approximately 3% lower with respect to the OCV in equal conditions at 700 °C (1.104 V). At lower current densities the 700 °C case also presents a higher voltage respect to the higher temperature cases due to the beneficial effect of a higher starting OCV. Instead, under higher load the trend of Vcell at 800 °C is in average 4% higher than Vcell at 700 °C under equal current, with a maximum differential up to 80 mV (10% increase) at 0.6 A/cm2. Such improvement is mainly due to a reduced ionic conductivity of the electrolyte, which strictly relates to the cell internal resistance & slope of the linear portion of the IV curve. The polarization curve at 800 °C also reaches 30% higher values of current (up to 0.85 A/cm2) compared to its respective case at 700 °C (0.65 A/cm2) without reaching the minimum threshold (Figure 6e). The inversion point (where the higher operating temperature curves intersect the lower operating temperature curves) can be observed between 0.15 A/cm2 and 0.3 A/cm2, between the activation region and the ohmic region, while for currents above 0.3 A/cm2 the high temperature cases are always more performant. The trends of the power curves (Figure 6f) show that the 800 °C case can generate up to 35% more maximum power (at increased current) with respect to the 700 °C case. The analysis of the UF curves (Figure 7e–h) shows that the 700 °C is more performant il the first portion of the curves (up to UF—fuel and oxidant—equal to around 0.1) while the 800 °C case achieves higher maximum UFf, UFo and produced power thanks to the capacity to reach higher currents without overcoming the Vcell threshold.
Similar results are found in literature for comparable button cell/single cell testing & characterization setups for varying H2 content and temperature in terms of polarization curves [36,42,52,59,62,63,64], but also in terms of Electrochemical Impedance Spectroscopy data analyzed with the Distribution of Relaxation Times or Equivalent Circuit Modeling techniques [40,65,66,67].
The effect of λ on the IV and IP curves (Figure 6c,d) is hardly appreciated; in fact, only the λ = 0.5 case shows any relevant difference (around 1% difference) with respect to the other analyzed cases (λ = 1; λ = 2). However, by analyzing the UFo (Figure 7c,d), even with λ = 0.5, the O2 stoichiometry is always met (maximum UFo 0.5) due to the low values of UFf. Aligned to what was described for H2 content, lower λ cases entail higher oxidant ratios since at equal current more oxidant is consumed with respect to the cathode inlet flow. In this way lower λ cases can achieve higher UFo values and can obtain higher voltage levels at equal UFo, since the cell current required is lower, entailing lower overpotentials. However, a lower current entail that lower λ cases achieve lower power at equal UFo values with respect to higher λ cases. Overall, from the obtained results it seems that a variation of the cathode flow in the analyzed range does not significantly affect the cell performance.
The results are aligned with comparable literature in terms of polarization curves [42,68] and more advanced electrochemical impedance analyses [40,67,68]. However, in such works the O2 variation at the cathode side is typically obtained by diluting/enriching the cathode feed (or providing a pure O2 flow), rather than decreasing the total cathode air flow rate as in the present case.
The analysis of the cell internal resistance and ASR (Figure 6g) shows that after a peak at low current density due to activation losses (Rcell up to 0.25–0.6 Ω; ASR up to 0.8–2.1 Ω cm2), the cell resistance drops, reaching the linear region of the IV curve (R & ASR near-constant [69]) except for the H2 10%vol and H2 25%vol cases. These two cases show an increasing resistance trend for increasing current, clearly due to diffusive behavior caused by lack of fuel in the active sites. For the other cases (H2 50%vol onwards) most of the measurements lie below 0.15 Ω (ASR < 0.5 Ω cm2) from 1 A onwards without showing dramatic resistance increases due to concentration losses (avoided by imposing the voltage threshold). An increase in operating temperature reduces the overall resistance [52,66] other than allowing to reach higher values of current without reaching the voltage threshold, as previously discussed. The effect of λ is barely observed on the resistance, for which it has not been reported for brevity (full results are available in the Supplementary Materials Section). Overall, the obtained values for ASRohm for the cases H2 50%vol are below 0.5 Ω cm2, which is considered a suitable operation range for SOFC unit cells, as found in literature [48,50].
In Table 3 a comparative summary is reported between some examples of examined literature and the present work in terms of SOFC type, testing conditions, electrochemical investigation techniques, observed effects and used housing.

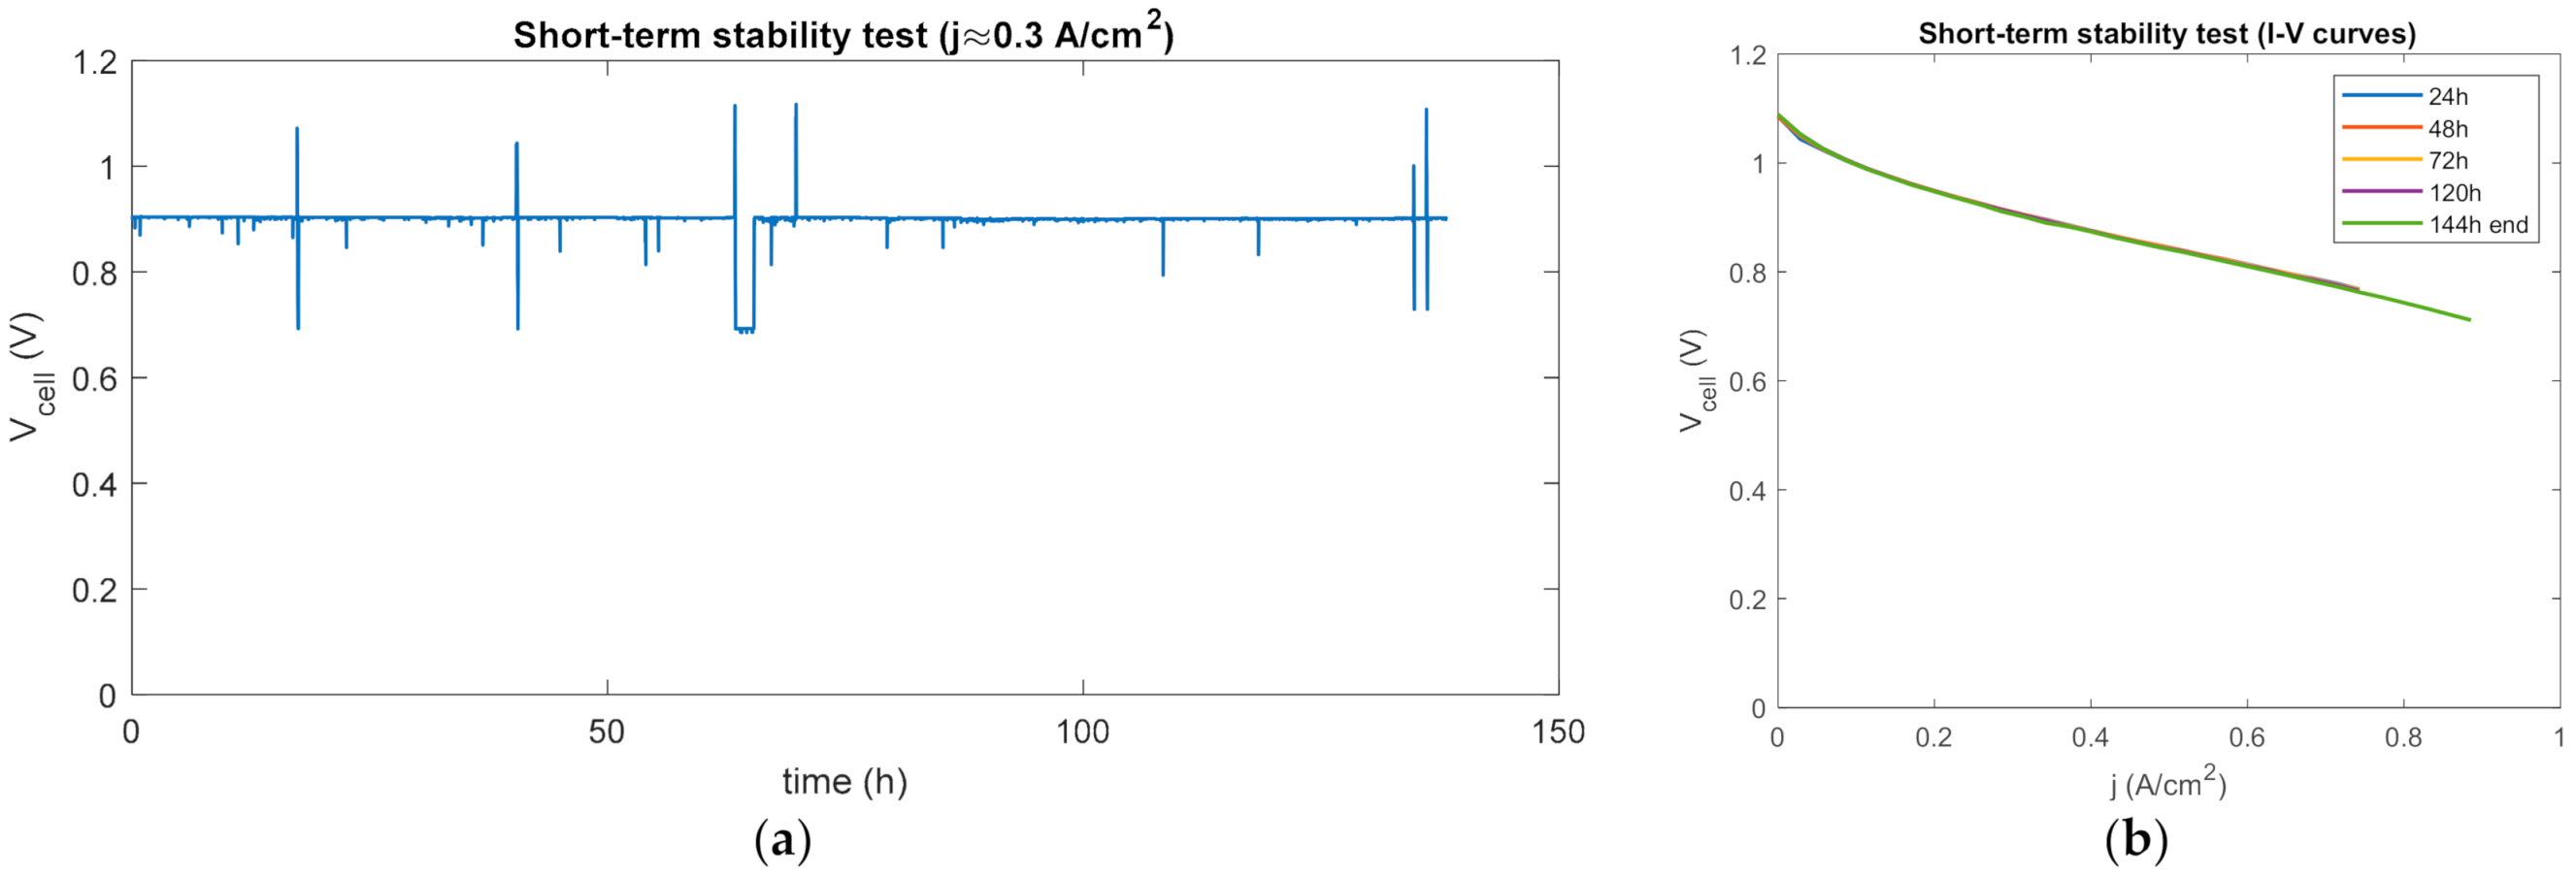
3.2. Short-Term Stability Test

After performing the parametric analysis, a short-term stability test under load (1 A i.e., ≈0.3 A/cm2; H2/N2 50/50%vol) was run on the SOFC sample for 140 h consecutively. Therefore, the cell operated more than 140 h due to the previous parametrization campaign. The cell voltage acquisition is illustrated in Figure 8.
The results (Figure 8) show that both the experimental setup and the cell performance stability is proven, given the near constant trend of the voltage through time under a constant load of 1 A (≈0.3 A/cm2). Non-stationary points in the voltage profile are related to measurement error or unforeseen events (disconnections of the acquisition system or errors in the DC load setting). The steady state voltage is equal to 0.903 V. No short-term performance degradation effect was observed throughout the test, confirmed by overlapping daily IV curves. Even with a final deep polarization up to 0.85 A/cm2 (otherwise up to 0.7 A/cm2) performed at the end of the test (t = 140 h) no significant degradation was identified. The results demonstrate the stability and reliability of the SOFC test rig setup, both from a cell point of view and from an instrumentation point of view.
Similar results are obtained by publicly available data from SOLIDPower at short-stack level tested in reformate conditions for t > 4000 h (T = 750 °C, 0.41 A/cm2) [24].

4. Conclusions

In this work a detailed analysis of laboratory procedures (setup, assembly, materials, control, etc.) of an innovative all-ceramic compact SOFC test rig is presented and first experimental testing results of an anode supported, state-of-the-art (Ni-YSZ/YSZ/GDC-LSCF) SOFC button cell assembly are reported. Two experimental campaigns have been taken out: in the first the cell performances in terms of polarization curves is assessed under parametric variation of operating conditions (H2 content, air ratio and temperature); in the second a short-term endurance test under load (140 h consecutively at ≈0.3 A/cm2) is performed.
Overall, excellent results in term of IV curves are obtained with the used all-ceramic test rig (steady state voltage of 0.903 V at ≈0.3 A/cm2 load) thanks to minimal gas leakages and electrical parasitic losses. From the results it is seen that H2 content has the most impact on the SOFC performance, showing a strong correlation between H2 content and IV performance. Low H2 content cases (<25%vol) are characterized by higher local UFf values, causing fuel starvation at high current densities. Such a condition is related to the entrance in the diffusive region, which is characterized by sharp voltage drops and increasing ASR values. Temperature has a dual effect on the SOFC performance. On the one hand an increase in temperature reduces the OCV following the Nernst equation, and on the other hand the overall cell resistance is reduced due to improved overpotential kinetics and improved electrolyte ionic conductivity. Temperature has a dual effect: on the one hand higher temperatures yield higher OCV values; on the other hand, from an operational point of view the cell IV performances are improved. In fact, for current values of above 0.15–0.3 A/cm2 the temperature-driven improvement of the reaction kinetics and electrolyte ionic conductivity is predominant with respect to its unfavorable effect on the OCV, achieving higher Vcell (thus lower voltage drop and ASR) compared to lower temperature cases, with the capacity to reach higher maximum current loads before reaching the voltage threshold. Finally, the impact of the air ratio λ is hardly seen in the analyzed range. In fact, only a slight underperformance is observed in low air cases (λ = 0.5), although stoichiometry of the oxidation reaction is always locally met (UFo < 1) due to the low UFf on the fuel side, which is a limitation in button cell testing. Further analysis is required in terms of O2 depletion (impact in lean H2 conditions, oxygen dilution with N2 at cathode inlet, analysis of lower λ ratios) which is left for future work.
From the short-term endurance test, the test bench setup reliability is demonstrated, showing no significant voltage degradation after 140 continuous hours under load, which confirms the high quality and reproducibility of the results.

Supplementary Materials

Author Contributions

Conceptualization, E.B. and L.D.Z.; methodology, A.M.F. and L.D.Z.; validation, A.M.F.; investigation, A.M.F., A.H., L.D.Z. and A.D.; resources, A.M.F., A.D.; data curation, A.M.F. and A.H.; writing—original draft preparation, A.M.F. and A.H.; writing—review and editing, A.M.F. and L.D.Z.; visualization, A.M.F.; supervision, L.D.Z., E.B., S.M. and A.D.; project administration, L.D.Z. and E.B.; funding acquisition, L.D.Z. and E.B. All authors have read and agreed to the published version of the manuscript.

Funding

This research and APC was funded by the H2020 project BLAZE, grant number 815284.

Institutional Review Board Statement

Not applicable.

Informed Consent Statement

Not applicable.

Data Availability Statement

Full experimental dataset is made available in the Supplementary Materials Section.

Acknowledgments

The H2020 project BLAZE, grant number 815284 is acknowledged. SOLIDpower S.p.A. is acknowledged for providing the SOFC samples materials. Colleagues from ENEA (TERIN-PSU-ABI) are acknowledged for providing guidance for experimental testing setup and procedures.

Conflicts of Interest

The authors declare no conflict of interest.

References

  1. International Energy Agency. The future of fuel: The future of hydrogen. Report 2019, 2012, 12–15. [Google Scholar] [CrossRef]
  2. FCH-JU Fuel Cell & Hydrogen Joint Undertaking; Hydrogen Roadmap Europe: Brussels, Belgium, 2019. [CrossRef]
  3. Buffo, G.; Marocco, P.; Ferrero, D.; Lanzini, A. Power-to-X and Power-to-Power Routes. Chapter 15: Solar Hydrogen Production; Elsevier Inc.: Amsterdam, The Netherlands, 2019. [Google Scholar] [CrossRef]
  4. Felseghi, R.A.; Carcadea, E.; Raboaca, M.S.; Trufin, C.N.; Filote, C. Hydrogen fuel cell technology for the sustainable future of stationary applications. Energies 2019, 12, 4593. [Google Scholar] [CrossRef] [Green Version]
  5. Barbir, F. Fuel Cell Applications—Ch. 10. In PEM Fuel Cells, 2nd ed.; Elsevier: Amsterdam, The Netherlands, 2013. [Google Scholar] [CrossRef]
  6. FCH-JU Fuel Cell & Hydrogen Joint Undertaking. Fuel Cells and Hydrogen for Green Energy in European Cities and Regions. 2018. Available online: https://www.fch.europa.eu/sites/default/files/181123_FCHJU_Regions_Cities_Final_Report_FINAL.pdf (accessed on 6 April 2021).
  7. Staffell, I.; Scamman, D.; Abad, A.V.; Balcombe, P.; Dodds, P.E.; Ekins, P.; Shah, N.; Ward, K.R. The role of hydrogen and fuel cells in the global energy system. Energy Environ. Sci. 2019, 12, 463–491. [Google Scholar] [CrossRef] [Green Version]
  8. Dincer, I.; Rosen, M.A. Chapter 18—Exergy Analysis of Fuel Cell Systems. Exergy Energy Environ. Sustain. Dev. 2013, 363–382. [Google Scholar] [CrossRef]
  9. Melideo, D.; Ortiz-Cebolla, R.; Weidner, E. Life Cycle Assessment of Hydrogen and Fuel Cell Technologies; JCR Joint Research Centre: Brussels, Belgium, 2020. [Google Scholar]
  10. McPhail, S.J.; Conti, B.; Kiviaho, J. The Yellow Pages of SOFC Technology—International Status of SOFC Deployment; VTT Technical Research Centre of Finland Ltd.: Espoo, Finland, 2017. [Google Scholar]
  11. Mcphail, S.J.; Aarva, A.; Devianto, H.; Bove, R.; Moreno, A. SOFC and MCFC: Commonalities and opportunities for integrated research. Int. J. Hydrog. Energy 2010, 36, 10337–10345. [Google Scholar] [CrossRef]
  12. Steilen, M.; Jörissen, L. Hydrogen Conversion into Electricity and Thermal Energy by Fuel Cells: Use of H2-Systems and Batteries. Electrochem. Energy Storage Renew. Sources Grid Balanc. 2015, 143–158. [Google Scholar] [CrossRef]
  13. U.S. Department of Energy. Fuel Cells Factsheet; U.S. Department of Energy: Washington, DC, USA, 2015; pp. 23–54. [CrossRef]
  14. Pachauri, R.K.; Chauhan, Y.K. A study, analysis and power management schemes for fuel cells. Renew. Sustain. Energy Rev. 2015, 43, 1301–1319. [Google Scholar] [CrossRef]
  15. Kotowicz, J.; Węcel, D.; Jurczyk, M. Analysis of component operation in power-to-gas-to-power installations. Appl. Energy 2018, 216, 45–59. [Google Scholar] [CrossRef]
  16. Arias, J. Hydrogen and Fuel Cells in Japan; EU-Japan Centre for Industrial Cooperation: Tokyo, Japan, 2019; pp. 1–145. [Google Scholar]
  17. Cassir, M.; Jones, D.; Ringuedé, A.; Lair, V. Electrochemical devices for energy: Fuel cells and electrolytic cells. In Handbook of Membrane Reactors; Woodhead Publishing: Sawston, UK, 2013; Volume 2, pp. 553–606. [Google Scholar] [CrossRef]
  18. U.S. Department of Energy. Fuel Cell Handbook, 7th ed.; U.S. Department of Energy: Washington, DC, USA, 2004. [CrossRef]
  19. Baharudin, L.; Watson, M.J. Hydrogen applications and research activities in its production routes through catalytic hydrocarbon conversion. Rev. Chem. Eng. 2017, 34, 43–72. [Google Scholar] [CrossRef]
  20. Pumiglia, D.; Vaccaro, S.; Masi, A.; McPhail, S.J.; Falconieri, M.; Gagliardi, S.; Della Seta, L.; Carlini, M. Aggravated test of Intermediate temperature solid oxide fuel cells fed with tar-contaminated syngas. J. Power Sources 2017, 340, 150–159. [Google Scholar] [CrossRef]
  21. Bocci, E.; Di Carlo, A.; McPhail, S.; Gallucci, K.; Foscolo, P.; Moneti, M.; Villarini, M.; Carlini, M. Biomass to fuel cells state of the art: A review of the most innovative technology solutions. Int. J. Hydrog. Energy 2014, 39, 21876–21895. [Google Scholar] [CrossRef]
  22. Bocci, E.; Zotto, L.; Del Ferrario, A.M.; Marcantonio, V.; Di Giuliano, A.; Savuto, E.; Barisano, D.; McPhail, S.; Della Pietra, M. First Results of the H2020-LC-SC3-RES-11 Blaze Project: Biomass Low Cost Advanced Zero Emission Small-to-Medium Scale Integrated Gasifier Fuel Cell Combined Heat and Power Plant. In Proceedings of the 8th European Fuel Cell Technology and Applications Piero Lunghi Conference EFC19, Naples, Italy, 9–11 December 2019. [Google Scholar]
  23. Aravind, P.; Cavalli, A.; Patel, H.C.; Recalde, M.; Saadabadi, A.; Tabish, A.; Botta, G.; Tattai, A.T.; Teodoru, A.; Hajimolana, Y.; et al. Opportunities and Challenges in Using SOFCs in Waste to Energy Systems. ECS Trans. 2017, 78, 209–218. [Google Scholar] [CrossRef]
  24. Bertoldi, M.; Bucheli, O.F.; Ravagni, A. Development, Manufacturing and Deployment of SOFC-Based Products at SOLIDpower. ECS Trans. 2017, 78, 117–123. [Google Scholar] [CrossRef]
  25. Kromp, A. Model-Based Interpretation of the Performance and Degradation of Reformate Fueled Solid Oxide Fuel Cells; KIT Scientific Publishing: Karlsruhe, Germany, 2013. [Google Scholar] [CrossRef]
  26. Dwivedi, S. Solid oxide fuel cell: Materials for anode, cathode and electrolyte. Int. J. Hydrog. Energy 2020, 45, 23988–24013. [Google Scholar] [CrossRef]
  27. Prakash, B.S.; Kumar, S.S.; Aruna, S. Properties and development of Ni/YSZ as an anode material in solid oxide fuel cell: A review. Renew. Sustain. Energy Rev. 2014, 36, 149–179. [Google Scholar] [CrossRef]
  28. Khan, M.Z.; Mehran, M.T.; Song, R.-H.; Lee, J.-W.; Lee, S.-B.; Lim, T.-H.; Park, S.-J. Effect of GDC interlayer thickness on durability of solid oxide fuel cell cathode. Ceram. Int. 2016, 42, 6978–6984. [Google Scholar] [CrossRef]
  29. Railsback, J.; Choi, S.H.; Barnett, S.A. Effectiveness of dense Gd-doped ceria barrier layers for (La,Sr)(Co,Fe)O3 cathodes on Yttria-stabilized zirconia electrolytes. Solid State Ionics 2019, 335, 74–81. [Google Scholar] [CrossRef]
  30. Kim, S.J.; Choi, G.M. Stability of LSCF electrode with GDC interlayer in YSZ-based solid oxide electrolysis cell. Solid State Ionics 2014, 262, 303–306. [Google Scholar] [CrossRef]
  31. Silva-Mosqueda, D.M.; Elizalde-Blancas, F.; Pumiglia, D.; Santoni, F.; Boigues-Muñoz, C.; McPhail, S.J. Intermediate temperature solid oxide fuel cell under internal reforming: Critical operating conditions, associated problems and their impact on the performance. Appl. Energy 2019, 235, 625–640. [Google Scholar] [CrossRef]
  32. Vivas, F.J.; Heras, A.D.L.; Segura, F.; Andújar, J.M. Cell voltage monitoring All-in-One. A new low cost solution to perform degradation analysis on air-cooled polymer electrolyte fuel cells. Int. J. Hydrog. Energy 2019, 44, 12842–12856. [Google Scholar] [CrossRef]
  33. Steinberger-Wilckens, R. Solid Oxide Fuel Cells. In Fuel Cells Waste-to-Energy Chain; McPhail, S.J., Ed.; Springer: Berlin/Heidelberg, Germany, 2012; pp. 109–122. [Google Scholar] [CrossRef]
  34. Margalef, P.; Brown, T.; Brouwer, J.; Samuelsen, S. Conceptual design and configuration performance analyses of polygenerating high temperature fuel cells. Int. J. Hydrog. Energy 2011, 36, 10044–10056. [Google Scholar] [CrossRef] [Green Version]
  35. Marangio, F.; Santarelli, M.; Cali, M. Theoretical model and experimental analysis of a high pressure PEM water electrolyser for hydrogen production. Int. J. Hydrog. Energy 2009, 34, 1143–1158. [Google Scholar] [CrossRef]
  36. Yahya, A.; Ferrero, D.; Dhahri, H.; Leone, P.; Slimi, K.; Santarelli, M. Electrochemical performance of solid oxide fuel cell: Experimental study and calibrated model. Energy 2018, 142, 932–943. [Google Scholar] [CrossRef]
  37. Boigues-Muñoz, C.; Pumiglia, D.; McPhail, S.J.; Santori, G.; Montinaro, D.; Comodi, G.; Carlini, M.; Polonara, F. More accurate macro-models of solid oxide fuel cells through electrochemical and microstructural parameter estimation—Part II: Parameter estimation. J. Power Sources 2015, 286, 321–329. [Google Scholar] [CrossRef] [Green Version]
  38. Fan, L.; Zhang, G.; Jiao, K. Characteristics of PEMFC operating at high current density with low external humidification. Energy Convers. Manag. 2017, 150, 763–774. [Google Scholar] [CrossRef]
  39. Steinberger, M.; Geiling, J.; Oechsner, R.; Frey, L. Anode recirculation and purge strategies for PEM fuel cell operation with diluted hydrogen feed gas. Appl. Energy 2018, 232, 572–582. [Google Scholar] [CrossRef]
  40. Muñoz, C.B.; Pumiglia, D.; McPhail, S.J.; Montinaro, D.; Comodi, G.; Santori, G.; Carlini, M.; Polonara, F. More accurate macro-models of solid oxide fuel cells through electrochemical and microstructural parameter estimation—Part I: Experimentation. J. Power Sources 2015, 294, 658–668. [Google Scholar] [CrossRef] [Green Version]
  41. Della Pietra, M.; McPhail, S.; Prabhakar, S.; Desideri, U.; Nam, S.; Cigolotti, V. Accelerated test for MCFC button cells: First findings. Int. J. Hydrog. Energy 2016, 41, 18807–18814. [Google Scholar] [CrossRef]
  42. Thambiraj, N.; Waernhus, I.; Suciu, C.; Vik, A.; Hoffmann, A.C. Single-Cell Tests to Explore the Reliability of Sofc Installations Operating Offshore. Energies 2020, 13, 1624. [Google Scholar] [CrossRef] [Green Version]
  43. Weil, K.S. The state-of-the-art in sealing technology for solid oxide fuel cells. JOM 2006, 58, 37–44. [Google Scholar] [CrossRef]
  44. Skrzypkiewicz, M. Setup of a Test Bench and Testing the Single Solid Oxide Fuel Cell at Various Temperatures. Ph.D. Thesis, University of Akureyri, Akureyri, Island, 2009; p. 61. [Google Scholar]
  45. EERA European Energy Research Alliance. Key Performance Indicators (KPIs) for FCH Research and Innovation, 2020–2030; EERA European Energy Research Alliance: Brussels, Belgium, 2020. [Google Scholar]
  46. Pan, J.; Yang, J.; Yan, D.; Pu, J.; Chi, B.; Li, J. Effect of thermal cycling on durability of a solid oxide fuel cell stack with external manifold structure. Int. J. Hydrog. Energy 2020, 45, 17927–17934. [Google Scholar] [CrossRef]
  47. Chino Corporation. Fuel Cell Holder SOFC 2021:2–4. Available online: https://www.directindustry.com/prod/chino-corporation/product-14570-1689368.html (accessed on 1 February 2021).
  48. U.S. Fuel Cell Council. Introduction to Solid Oxide Fuel Cells Button Cell Testing; U.S. Fuel Cell Council: Washington, DC, USA, 2007. [Google Scholar] [CrossRef]
  49. SolidPower. BlueGEN Technology 2021. Available online: https://www.solidpower.com/en/bluegen-technology2/ (accessed on 2 January 2021).
  50. Hauch, A. Solid Oxide Electrolysis Cells—Performance and Durability. Ph.D. Thesis, Technical University of Denmark, Roskilde, Denmark, October 2007. [Google Scholar]
  51. Patcharavorachot, Y.; Arpornwichanop, A. Investigation of a Proton-Conducting SOFC with Internal Autothermal Reforming of Methane; Elsevier, B.V.: Amsterdam, The Netherlands, 2012; Volume 30. [Google Scholar] [CrossRef]
  52. Chnani, M.; Péra, M.; Glises, R.; Kauffmann, J.M. Macroscopic Model of Solid Oxide Fuel Cell Stack for Integrating in a Generator Simulation. In Proceedings of the 7th European SOFC Forum, Lucerne, Switzerland, 29 June–2 July 2006. HAL Id: Hal-00582361 2011. [Google Scholar]
  53. Joint Research Centre, Institute for Energy Petten. Testing the Voltage and Power as Function of Current Density: Polarisation Curve for a SOFC Single Cell; Test Module TM SOFC M01; JRC Technical Reports; Joint Research Centre, Institute for Energy Petten: Petten, The Netherlands, 2010. [Google Scholar]
  54. Endurance Project. Handbook of Test Procedures and Protocols Project Endurance Handbook of Test. Available online: http://www.durablepower.eu/images/downloads/hoe/ENDURANCE-Handbook-of-Test-Procedures-and-Protocols.pdf (accessed on 6 April 2021).
  55. Yousefkhani, M.B.; Ghadamian, H.; Daneshvar, K.; Alizadeh, N.; Troconis, B.C.R. Investigation of the Fuel Utilization Factor in PEM Fuel Cell Considering the Effect of Relative Humidity at the Cathode. Energies 2020, 13, 6117. [Google Scholar] [CrossRef]
  56. Garcia, P.; Fernandez, L.M.; Garcia, C.A.; Jurado, F. Comparative Study of PEM Fuel Cell Models for Integration in Propulsion Systems of Urban Public Transport. Fuel Cells 2010, 10, 1024–1039. [Google Scholar] [CrossRef] [Green Version]
  57. Zhu, Y.; Cai, W.; Li, Y.; Wen, C. Anode gas recirculation behavior of a fuel ejector in hybrid solid oxide fuel cell systems: Performance evaluation in three operational modes. J. Power Sources 2008, 185, 1122–1130. [Google Scholar] [CrossRef]
  58. Liso, V.; Nielsen, M.P.; Kær, S.K. Influence of anodic gas recirculation on solid oxide fuel cells in a micro combined heat and power system. Sustain. Energy Technol. Assess. 2014, 8, 99–108. [Google Scholar] [CrossRef]
  59. Nakajima, H. Electrochemical Impedance Spectroscopy Study of the Mass Transfer in an Anode-Supported Microtubular Solid Oxide Fuel Cell; Mass Transfer Advanced Aspects; INTECH Open: London, UK, 2011; Available online: www.intechopen.com (accessed on 6 April 2021).
  60. Jia, J.; Abudula, A.; Wei, L.; Shi, Y. Performance comparison of three solid oxide fuel cell power systems. Int. J. Energy Res. 2013, 37, 1821–1830. [Google Scholar] [CrossRef]
  61. Lang, M.; Bohn, C.; Couturier, K.; Sun, X.; McPhail, S.J.; Malkow, T.; Pilenga, A.; Fu, Q.; Liu, Q. Electrochemical Quality Assurance of Solid Oxide Electrolyser (SOEC) Stacks. J. Electrochem. Soc. 2019, 166, F1180–F1189. [Google Scholar] [CrossRef]
  62. Cavalli, A.; Kunze, M.; Aravind, P. Cross-influence of toluene as tar model compound and HCl on Solid Oxide Fuel Cell anodes in Integrated Biomass Gasifier SOFC Systems. Appl. Energy 2018, 231, 1–11. [Google Scholar] [CrossRef]
  63. Cavalli, A.; Bernardini, R.; Del Carlo, T.; Aravind, P.V. Effect of H 2 S and HCl on solid oxide fuel cells fed with simulated biosyngas containing primary tar. Energy Sci. Eng. 2019, 7, 2456–2468. [Google Scholar] [CrossRef] [Green Version]
  64. Barelli, L.; Bidini, G.; Cinti, G.; Gallorini, F.; Pöniz, M. SOFC stack coupled with dry reforming. Appl. Energy 2017, 192, 498–507. [Google Scholar] [CrossRef]
  65. Yang, T. Prediction of SOFC Performance with or without Experiments: A Study on Minimum Requirements for Experimental Data. Int. J. Electrochem. Sci. 2017, 12, 6801–6828. [Google Scholar] [CrossRef]
  66. Leonide, A.; Sonn, V.; Weber, A.; Ivers-Tiffée, E. Evaluation and Modeling of the Cell Resistance in Anode-Supported Solid Oxide Fuel Cells. J. Electrochem. Soc. 2008, 155, B36–B41. [Google Scholar] [CrossRef]
  67. Mogensen, M.; Electrochemical Characterization and Performance Evaluation. Roskilde, Denmark. 2010. Available online: https://orbit.dtu.dk/en/activities/electrochemical-characterization-and-performance-evaluation (accessed on 6 April 2021).
  68. Conti, B.; Bosio, B.; McPhail, S.J.; Santoni, F.; Pumiglia, D.; Arato, E. A 2-D model for Intermediate Temperature Solid Oxide Fuel Cells Preliminarily Validated on Local Values. Catalyst 2019, 9, 36. [Google Scholar] [CrossRef] [Green Version]
  69. Digiuseppe, G. Electrochemical Characterization and Mechanisms of Solid Oxide Fuel Cells by Electrochemical Impedance Spectroscopy Under Different Applied Voltages. In Proceedings of the International Conference on Fuel Cell Science, Engineering and Technology, Virtual Conference, 20–21 May 2010; Volume 2, pp. 205–220. [Google Scholar] [CrossRef]
Figure 1. Schematization of the Solid Oxide Fuel Cells (SOFC) operating principle & constituent materials [25].
Energies 14 02038 g001
Figure 2. Typical SOFC polarization curve and identification of main voltage drop mechanisms [25].
Energies 14 02038 g002
Figure 3. Experimental SOFC test bench setup scheme.
Energies 14 02038 g003
Figure 4. (a) All-Ceramic SOFC Test Holder used for the study; (b) schematization of cell assembly procedure.
Energies 14 02038 g004
Figure 5. (a) Schematic and geometry of anode-supported SOFC (Ni-YSZ/YSZ/GDC-LSCF) (Ni-Yttria-Stabilized Zirconia/Yttria Stabilized Zirconia/Gadolinia Doped Ceria-Lanthanum Strontium Cobalt Ferrite) used; (b) button cell assembly in the holder; (c) Schematic of net active surface [49].
Energies 14 02038 g005
Figure 6. Experimental performance voltage & power curves: (a,b) H2%vol variations (T = 750 °C; λ = 1.4); (c,d) λ variations (T = 750 °C; H2 50%vol); (e,f) IV curve for T variations (H2 50%vol; λ = 1.4); (g) Resistance and Area Specific Resistance curve for H2%vol variations (T = 750 °C; λ = 1.4).
Energies 14 02038 g006aEnergies 14 02038 g006b
Figure 7. Experimental performance curves vs. UFf & UFo: (a,b) UFf-H2%vol variations (T = 750 °C; λ = 1.4); (c,d) UFo-λ variations (T = 750 °C; H2 50%vol); (e,f) UFf-T variations (H2 50%vol; λ = 1); (g,h) UFo-T variations (H2 50%vol; λ = 1).
Energies 14 02038 g007aEnergies 14 02038 g007b
Figure 8. Experimental short-term stability test results: (a) cell voltage acquisition; (b) daily IV curves performed during the short-term test.
Energies 14 02038 g008
Table 1. Fuel Cell technologies overview. Advantages and disadvantages at system and laboratory level.
Fuel Cell TechnologySystem LevelLaboratory Level
AdvantagesDisadvantagesAdvantagesDisadvantages
Low temperature Fuel Cells
(Alkaline, Polymer Electrolyte Membrane, Phosphoric Acid, Direct Methanol, etc.)
Simple operating conditions
Dynamic response
Commercial system maturity
Lower efficiency
Subject to strict fuel purity levels
Noble catalysts (e.g., Pt)
Simple test bench & materials
Fast start-up/shut-down procedures
Fast characterization
Non-destructive testing
Costly catalyst material (e.g., Pt)
Limited chemical compatibility
Fuel pre-processing requirement
Low current/power density (larger surfaces)
High temperature Fuel Cells
(Solid Oxide, Molten Carbonate, etc.)
High efficiency
Heat recovery
Internal fuel processing capability
Non-noble catalyst (e.g., Ni)
Challenging operating conditions
Pre-commercial system maturity
Limited dynamic response
Economic catalyst material (e.g., Ni)
Broad range of fuels (including hydrocarbons) & internal pre-processing
High current/power density (smaller surfaces)
Complex test bench & materials
Lengthy start-up/shut-down procedures
Long stabilization
Mostly destructive testing
Table 2. Parametric analysis experimental test matrix and assumptions assessing anode H2 variation (10/25/50/75/90%vol), cathode λ variation (0.5/1/2) in different operating temperature conditions (700/750/800 °C).
T
700 °C; 750 °C; 800 °C
H2 Variations (%vol)λ Variations
Anodic Total Flow Rate
150 Nml/min
Air Composition
ca. 79% N2; 21% O2
ChamberGasUnit10%25%50%75%90%0.512
Anode gasH2Nml/min
Nml/min
1537.575112.513575
N2135112.57537.51575
Cathode gasAirNml/min25090179358
O2Nml/min52.518.7537.575
λ-1.40.512
Table 3. Comparative summary (examples) of the analyzed literature respect to the present work.
ReferenceSOFC TypeTesting ConditionsTechniqueUsed Housing
Nakajima 2010
[59]
IT anode-supported microtubular SOFCH2 25–100%vol
Qan = 80–200 Nml/min
UFf 19–57%
j 0.5 (up to 0.8) A/cm2
T = 690–790 °C
Qca 1–2 NL/min
O2 10–100%vol
UFo 5.7%
IV polarization
EIS
Quartz tube
Yahya et al. 2018
[36]
ASC (Solidpower)
Ni|YSZ|GDC-LSCF
H2 20–96%vol
H2O 4–80%vol
Qan = 500 Nml/min
j up to 0.8–1.2 A/cm2
T = 700–800 °CIV polarizationUnsealed alumina test-fixture
Thambiraj et al. 2020
[42]
ESC (Kerafol KF)
Ni|YSZ|ScSZ-LSM
H2 76%vol + CO2
Qan = 325 Nml/min
j up to 0.3–0.5 A/cm2
T = 800–900 °C
Qca 600 Nml/min
O2 4–21%vol
IV polarization
Post-mortem analysis
Ceramic housing
Leonide et al. 2008
[66]
Ni|YSZ|CGO-LSCFH2 37%vol + CO2
H2O 5–63%vol
Qan = 250 Nml/min
T = 650–850 °C
Qca 250 Nml/min
O2 1–21%vol
EIS-DRTCeramic housing
Present workASC (Solidpower)
Ni|YSZ|GDC-LSCF
H2 10–90%vol
Qan = 150 Nml/min
UFf up to ≈50%
j 0.3 (up to 0.85) A/cm2
T = 700–800 °C
Qca 250 Nml/min
O2 21%vol
UFo up to 30–40%
IV polarizationAll-ceramic compact SOFC test rig
Publisher’s Note: MDPI stays neutral with regard to jurisdictional claims in published maps and institutional affiliations.

