
Energy Acquisition of Solar-Powered Joint-Wing Aircraft Considering Mismatch Power Loss


1
School of Aeronautic Science and Engineering, Beihang University, 37 Xueyuan Road, Beijing 100191, China
2
Institute of Unmanned System, Beihang University, 37 Xueyuan Road, Beijing 100191, China
3
Yunnan Innovation Institute, Beihang University, 8 Shibo Road, Kunming 650233, China
4
Research Institute of Frontier Science, Beihang University, 37 Xueyuan Road, Beijing 100191, China
*
Author to whom correspondence should be addressed.
Energies 2022, 15(1), 157; https://0-doi-org.brum.beds.ac.uk/10.3390/en15010157
Submission received: 5 November 2021
/
Revised: 7 December 2021
/
Accepted: 22 December 2021
/
Published: 27 December 2021
(This article belongs to the Special Issue Thermal Performance, Analysis and Application of Solar Photovoltaic Systems)
Abstract
:Solar-powered aircraft can perform long-term flights with clean solar energy. However, the energy derived from solar irradiation is influenced by the time of year and latitude, which limits the energy acquisition ability of solar aircraft with a straight-wing configuration. Hence, unconventional configurations based on increasing wing dihedral to track the sun are proposed to improve energy acquisition at high-latitude regions in winter, which may involve power loss caused by mismatch in the photovoltaic system. However, mismatch loss is seldom considered and may cause energy to be overestimated. In this paper, the energy acquisition characteristics of a joint-wing configuration are presented based on the simulation of an energy system to investigate the mismatch power loss. The results indicate a 4~15% deviation from the frequently used estimation method and show that the mismatch loss is influenced by the curved upper surface, the severity of shading and the circuit configuration. Then, the configuration energy acquisition factor is proposed to represent the energy acquisition ability of the joint-wing configuration. Finally, the matching between the aircraft configuration and flight trajectory is analyzed, demonstrating that the solar-powered aircraft with an unconventional wing configuration is more sensitive to the coupling between configuration and trajectory.
1. Introduction
Solar-powered aircraft are capable of performing long flights lasting for a day and night, or even several weeks, while relying on solar energy [1]. During the daytime, they can harvest solar energy by photovoltaic (PV) arrays, which are mainly installed on their wings, and convert solar energy into electricity, which can be used directly by propulsion systems and other airborne equipment. At the same time, the excess energy is stored by rechargeable batteries for maintaining flight at night. High-altitude long-endurance (HALE) solar-powered unmanned aerial vehicles (SPUAVs) have a latent capacity for high flight altitudes (≥20 km), a wide coverage range and extremely long flight endurance; compared to satellites and airships, they are easier to deploy and have higher mobility [2,3].
Most solar-powered prototypes have the conventional configuration of straight wings with low wing load and high aspect ratio. The HP03 in the “Helios” series of UAVs developed by NASA, with a wingspan of 75 m and aspect ratio over 30, is a typical example [4]. Another example is the Zephyr series of UAVs. Zephyr 7 has a weight of 53 kg and a wingspan of 22.5 m, which broke the world record with a 336 h flight on 9 July 2010 [5,6]. Afterwards, Zephyr S achieved continuous flight for nearly 26 days and broke the previous record in 2018 [7]. Solar Impulse is the only one that has been able to fly a person on solar power; its wingspan is 63.4 m, longer than Boeing 747-300, and its weight is 1600 kg, less than 0.5% of the takeoff weight of Boeing 747-300 [8]. The design of solar-powered aircraft is severely limited in both energy acquisition and energy storage, mainly due to the low efficiency of solar cells and low specific energy of rechargeable batteries, which account for a large proportion of the total weight (from 1/3 to 1/2). For example, the lithium battery of AtlantikSolar weighs 2.92 kg, accounting for 42% of the total weight of 6.93 kg [9].
The conventional design also has disadvantages related to structure and flight range. The wing structure, having low stiffness and strength, is prone to deformation or even damage, which contributed to the fall of the “Helios” drone, the experimental failure of Facebook’s Aquila and Google’s Solara 50, and Google’s shift to the high-altitude ball [10]. It is still a considerable challenge for solar-powered aircraft to achieve long-term flights in high-latitude areas in winter because a small sun elevation means a large angle of incidence on PV modules, low direct solar irradiance and limited energy harvesting.
Unconventional wing layout designs are developed to extend the latitude and flight window of solar-powered aircraft; their main design concept is increasing dihedral and actively tracking the sun to increase the solar power captured. Such designs include the “^”-shaped wing configuration, the wing-sail configuration and the “Z” (“N”)-shaped morphing wing configuration. The “^”-shaped wing configuration was proposed to handle a high flying attitude with a low solar elevation angle and has the potential to realize sun-seeking eternal flight between the latitudes 65° and 76° [11,12]. The wing-sail configuration is developed by installing wing-sail or other active photovoltaic (PV) modules in the structure of solar-powered aircraft to improve the energy-harvesting ability [13]. The innovation of the “Z”-shaped morphing wing configuration was realized in “Odysseus”, developed by Aurora [14], and further studied in research exploring different aspects, including the morphing control without relying on actuators [15], optimal flight planning and flight control and the comparative analysis of the energy margin and energy input [16], and a similar configuration of deflectable wingtips with experiments [17]. An increase in wing dihedral provides the potential to improve the energy acquisition under the condition of low sun elevation. The joint-wing layout, because of its advantage in structure [18] and flexibility of design, is also a promising choice for solar-powered aircraft, but relevant analyses are lacking.
However, the traditional evaluation method based on the assumption of coplanar PV cells may underestimate the power loss caused by mismatch and partial shading because of the neglect of electrical characteristics. Simulations and experiments [19,20] of PV arrays with MPPT [21] indicate dramatic power loss under partial shading, which is seldom scrutinized in the energy balance design of solar aircraft. Therefore, comprehensive research of the energy acquisition characteristics of solar aircraft while accounting for partial shading, as well as the energy system, should be further studied on the basis of simulations [22,23], flight experiments [24], circuit reconfiguration [25] and energy management [26], among other aspects.
To validate the superior energy acquisition of unconventional designs, the accuracy of the evaluation of energy acquisition is crucial. The electrical characteristics of this kind of platform under the partial shading condition need to be considered in energy acquisition estimation. Energy acquisition calculation methods applied to solar-powered aircraft with unconventional designs need to be proposed.
2. Modeling
The method of estimating the energy acquisition of solar-powered aircraft with unconventional designs is shown in Figure 1. The traditional method based on the proportion of shadow area [16,17] may overestimate the energy acquisition because of 2 types of mismatch: mismatch in solar modules and mismatch in solar arrays. Mismatch in solar modules is caused by the nonuniformity of irradiation on solar cells in the same solar module. It usually leads to decreases in the current and power on account of the common series connection of solar cells. Mismatch in solar arrays is caused by the nonuniformity of irradiation (because of shading or different orientations) on solar modules in the same solar array. It usually leads to a multipower peak and a power decrease.
To take the mismatch loss into account, the estimation method of solar-powered aircraft applied to the joint-wing layout includes models of solar irradiance and the energy system and the calculation of the irradiation state of the solar modules and arrays.
2.1. Solar Irradiance Model and Transformation
The ability of the aircraft to acquire energy is mainly determined by solar irradiance. The inputs of the solar irradiance model can be divided into two main parts: solar geometry inputs and atmospheric parameter inputs [27]. Thus, the input parameters of the model include: the altitude above sea level , the number of days from 1 January , the latitude , the longitude and the local standard time . The output parameters of the model include: the direct solar irradiance , the sun elevation angle , the sun azimuth angle , and the time of sunrise and sunset and .
The direct solar irradiance can be calculated based on the KSK1997 model as [28,29]:
where is the solar constant of 1367 W/m2, is relative air mass measuring the optical path of sunlight, is the air mass after altitude correction, and is the air mass at sea level.
The solar irradiance is a mixture of multiple irradiances, which can be divided into beam, diffuse isotropic, diffuse circumsolar and albedo components. The irradiation under shading is also a mixture of the components with their contributing factors. The irradiation under shading is calculated from the original unshielded irradiation intensity .
where varies from 1 to 0 with the increase in . When is relatively low, is low, but is close to 1; in other words, the radiation under shading is more attenuated at higher values.
The position of the sun can be defined by the elevation angle and the azimuth angle , which can be calculated as:
where is the sun declination angle, is the hour angle, is the true solar time considering the error of the standard time , is the longitude of the standard time in China and defined as , and is the difference between the true solar time and the mean solar time. It must be clarified that the azimuth angle when the sun is in the north. The value of gradually increases to when the sun rotates clockwise before noon, which means that . After noon, the value of continues to increase by more than , in other words, jumping to , causing the function problem . Therefore, the calculation of should be classified.
The direction and value of solar irradiance in the Earth-fixed coordinate system can be determined according to the equations above. The direction of solar irradiance in the aircraft-carried vertical frame coordinate system can be converted by the coordinate transformation matrices and :
where is the coordinate transformation matrix from the Earth-fixed system to the aircraft-carried vertical frame, and and are the components of the velocity of the aircraft on the X- and Y-axes.
The coordinate transformation matrix from the aircraft body-fixed coordinate system to the aircraft-carried vertical frame is:
where , and are three Euler angles that indicate the aircraft attitude: the yaw angle , the pitch angle and the roll angle .
The three components of the direction of irradiance in the aircraft body-fixed coordinate system can be expressed as:
2.2. PV Array Model
PV arrays can be divided into three levels by scale: PV cell, PV module and PV array. The PV module is formed by connecting and encapsulating PV cells, sometimes multiplying bypass diodes to avoid mismatch. A series of PV modules are connected to an array. All of them have similar output characteristics under uniform irradiation.
The intersection point of the I–V curve and voltage axis is the open-circuit voltage , and the intersection point with the current axis is the short-circuit current . The maximum value of the P–V curve is the maximum power point (MPP) of the PV array. The output power of the PV array is affected by the load. Only when working at the MPP (, ) can the maximum power be achieved, which is the reason for installing a maximum power point tracker (MPPT) to adjust the load and track the MPP.
The equivalent circuit for a PV cell based on the single-diode model consists of the photocurrent source , the diode, the parallel resistance and the series resistance .
The output current can be expressed using the equivalent circuit in terms of the output voltage [30]:
where is the dark saturation current of the diode, is the emission coefficient of the diode, is the absolute temperature of the p–n junction of the diode, is the electric charge, and J/K is the Boltzmann constant. The photocurrent with temperature correction can be calculated as:
where is the irradiation intensity on the PV cell, and is the temperature coefficient of . The calculation of should consider the incident angle of the irradiation on the PV cell.
Generally, the values of , , , and are not provided by PV cell manufacturers; instead, the values of , , and under standard test conditions (STC, , ) are given, and the I–V curve can be easily measured. The unknown parameters can be determined through numerical methods based on the data extracted from the I–V curve.
When shading occurs, some of the PV cells in PV arrays are under low-illumination conditions and limit the output power of the entire array if there is no bypass diode. The maximum output power and the output current at MPP are approximately proportional to irradiation, as the output voltages at MPP rarely change. As a result, the maximum output power can be estimated by the product of irradiation intensity and the efficiency in the conceptual design. The estimation may overestimate the power under low-illumination conditions.
2.3. MPPT and DC Model
Many MPPT algorithms are capable of handling the multipeak value problem caused by partial shading, such as swarm-based particle swarm optimization (PSO), ant colony optimization and heuristic methods such as simulated annealing, grey wolf optimization and firefly algorithms [31]. Most global optimization algorithms involve swarming and randomness to jump out of local optimal values. In addition, hill-climbing algorithms and their modifications are still widely used in engineering because of their simplicity and ease of implementation. The modification of variable step size and stop oscillation conditions increases the tracking speed and decreases oscillation loss near the peak.
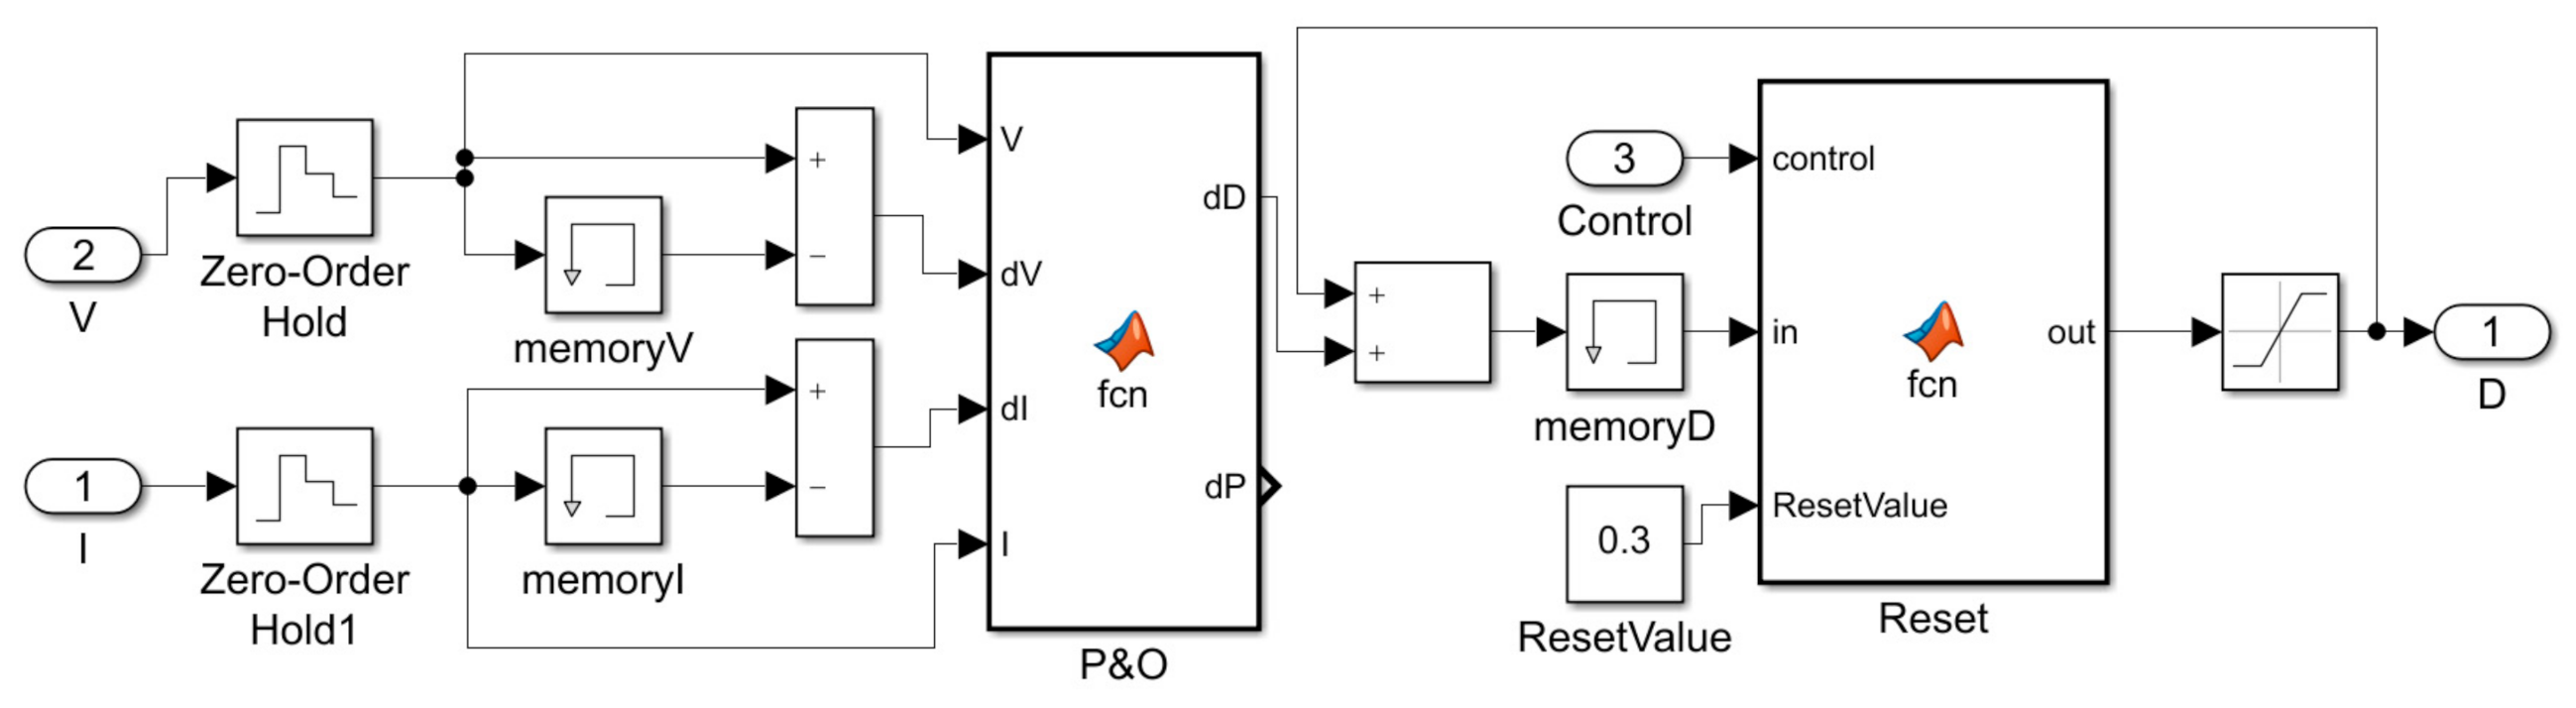
The MPPT based on a modified timed reset and stop oscillation conditions was implemented with the Matlab function in Matlab/Simulink, as shown in Figure 2. If the output power increases, the direction of perturbation is maintained; otherwise, the direction is reversed. A controller that can reset the MPPT was added to jump out of a local optimal solution when it works under nonuniform irradiation intensity.
The output of the MPPT is the duty cycle of a DC–DC (direct current to direct current) buck converter. The converter can change the load of the circuit to bring the working point of a PV array to MPP. Input voltage , input current , output voltage and output current of an ideal converter in continuous mode are related by the following equations.
where duty cycle has a range of 0–1. Hence, the output voltage is less than the input voltage. The working frequency of a general converter is too high for a 24 h simulation. Therefore, the function of the DC–DC converter is simplified by a function of load. The equivalent load of the DC–DC converter and the original load can be expressed by:
2.4. Modeling of Wing Section Considering Shading
The irradiation condition on solar cells can be obtained by a geometric method, which has a lower computational cost than the Monte Carlo method, thanks to the rectangular shape of the wings of solar-powered aircraft. Rectangles representing wing sections in the aircraft-body axis coordinate system can be expressed by the parameters of the wing, including the coordinates of the wing root leading edges and , the chord length of the wing , the wingspan , the sweep angle and the dihedral angle , as shown in Figure 3. The shading states of points on a wing section can be determined by an OR operation of all shadows cast by the wing sections above.
The shadow of the wing can be determined once the direction of solar irradiance is obtained from the solar irradiance model. The components of the direction are defined as , and , and the point of the shadow should satisfy the line equation:
The function of another plane is determined by 3 points and the plane equation below.
The normal vector of the plane is:
The projection coordinates of the point on the plane can be obtained through a matrix operation.
After, the quadrilateral shadow of the rectangle representing the wing section is determined. Whether a PV cell at coordinates is in the shadow can be determined according to the relation of the four vectors from the position of the PV cell to the end points of the quadrangle , as shown in Figure 4.
3. Integration of Simulation Models
The energy system model integrated above is based on Matlab/Simulink, as shown in Figure 5. Irradiance input is the local irradiation intensity on a set of solar cells. The DC with MPPT and the load are modeled as a controllable potentiometer connected to the solar arrays. The MPPT is reset when the power loss lasts for a while.
4. Energy Acquisition Analysis Based on 24-h Flight Simulation
The simulation of the output characteristics of the joint-wing layout in a 24 h flight was performed to reveal the effects on power losses, including those of the curved surface, shading condition and PV circuit configuration. A circular flight path was set with a radius of 36 km. The airfoil was FX 63-137. Other parameters used in the simulation are shown in Table 1.
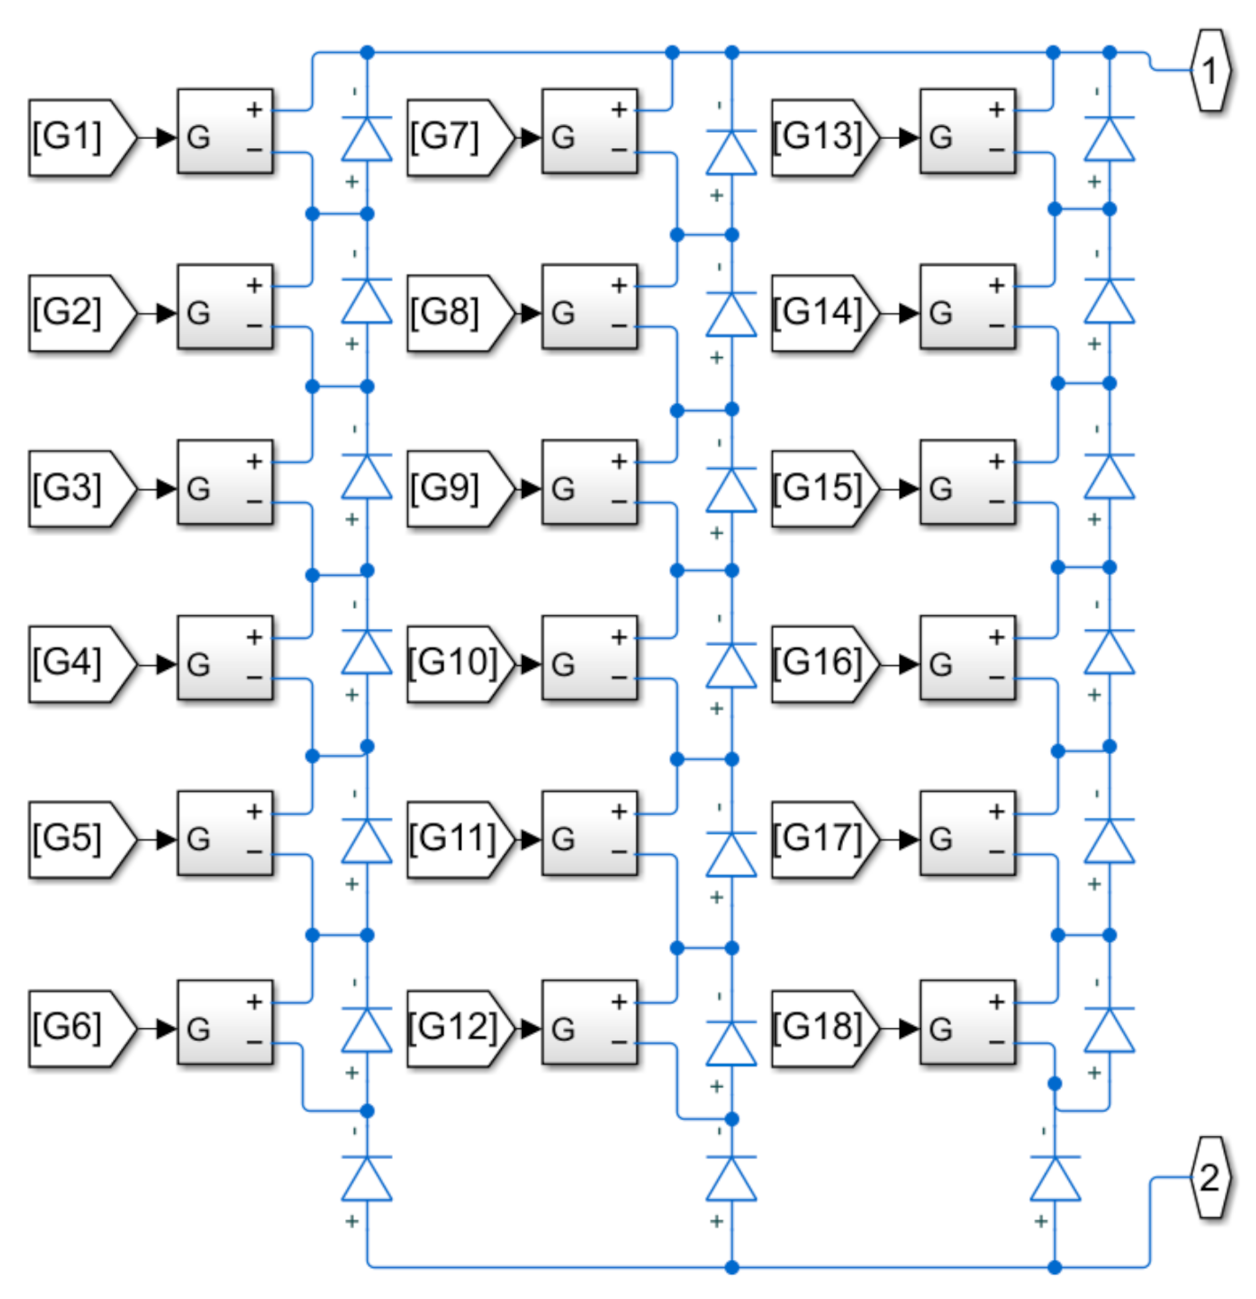
Solar arrays in the same position relative to the chord length on the surface of the wings have the same normal vectors, as solar aircraft typically have flat wings without tapering. As a result, they have the same output current, which is suitable for a series connection. Other solar arrays with different positions can be connected in series or in parallel, requiring a tradeoff between voltage and current. The combination of high voltage and low current reduces the line loss caused by resistance. However, at the same time, a converter with a wide voltage conversion range is needed. In addition, the voltage should be matched with the charging voltage of the energy storage battery as well as the working voltage of avionics and load equipment. The solar array of a wing section with a 3 × 6 series–parallel (SP) circuit configuration with bypass diodes was selected for the simulation, as shown in Figure 6.
4.1. Effects of Curved Surface and Mismatch
The simulation results of the output power are shown in Figure 7. The continuous curve in black is the output power in the simulation, and the dashed curve in red is the output power estimated by the product of the efficiency of PV arrays, MPPT and local solar irradiance on the PV cells. The integral of power, the energy acquisition in a day, is shown in Table 2.
A special feature of the unconventional configurations is indicated by the dissimilarity of the overall trends between the curves in Figure 7a,b, which is caused by varying the direction and wing dihedral. The shading condition occurred in the morning, with a time range of 6:30–7:30, during which depression occurred and the two curves have larger gaps, resulting in more than 50% power loss in the interim, as shown in the enlarged view of Figure 7b. Therefore, the estimation based on only solar efficiency will underestimate the power loss and be less accurate under shading conditions.
The mismatch loss of wing sections 1 and 2 has a value of 5.49% and is caused by the curved upper surface of the wing, which can be explained by the inconsistency of irradiation input to PV modules, as shown in Figure 8. The 18 curves of 18 modules can be divided into 3 series because PV modules whose curves are in the same series are mounted along the span direction, which means that they are coplanar.
The mismatch loss caused by partial shading is 0.11%, obtained by the difference between the total loss and the wing surface loss in Table 2. The sudden drops in the curve in Figure 8b illustrate the occurrence of shading, corresponding to the fluctuation of the output power. The loss is not significant; however, it will rise under frequent shading conditions.
4.2. Effects of the Severity of Shading
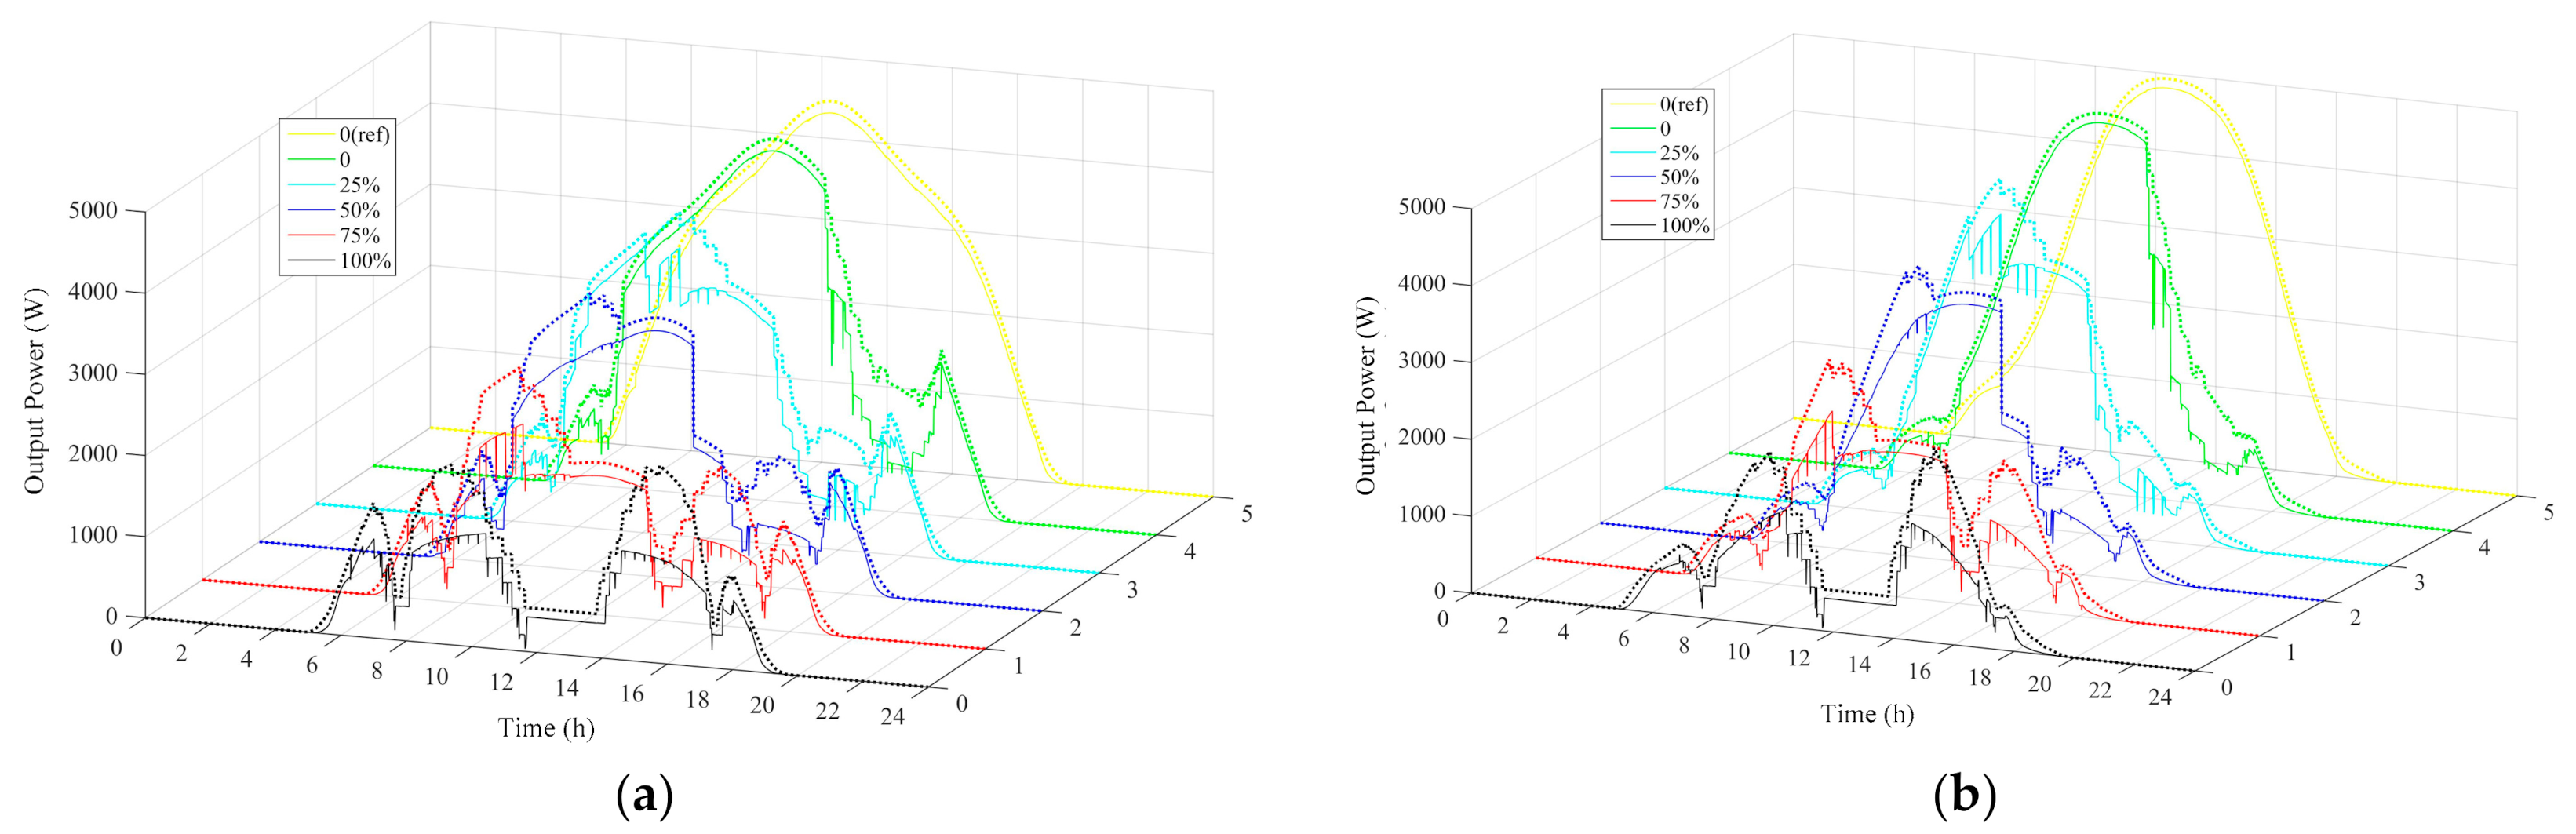
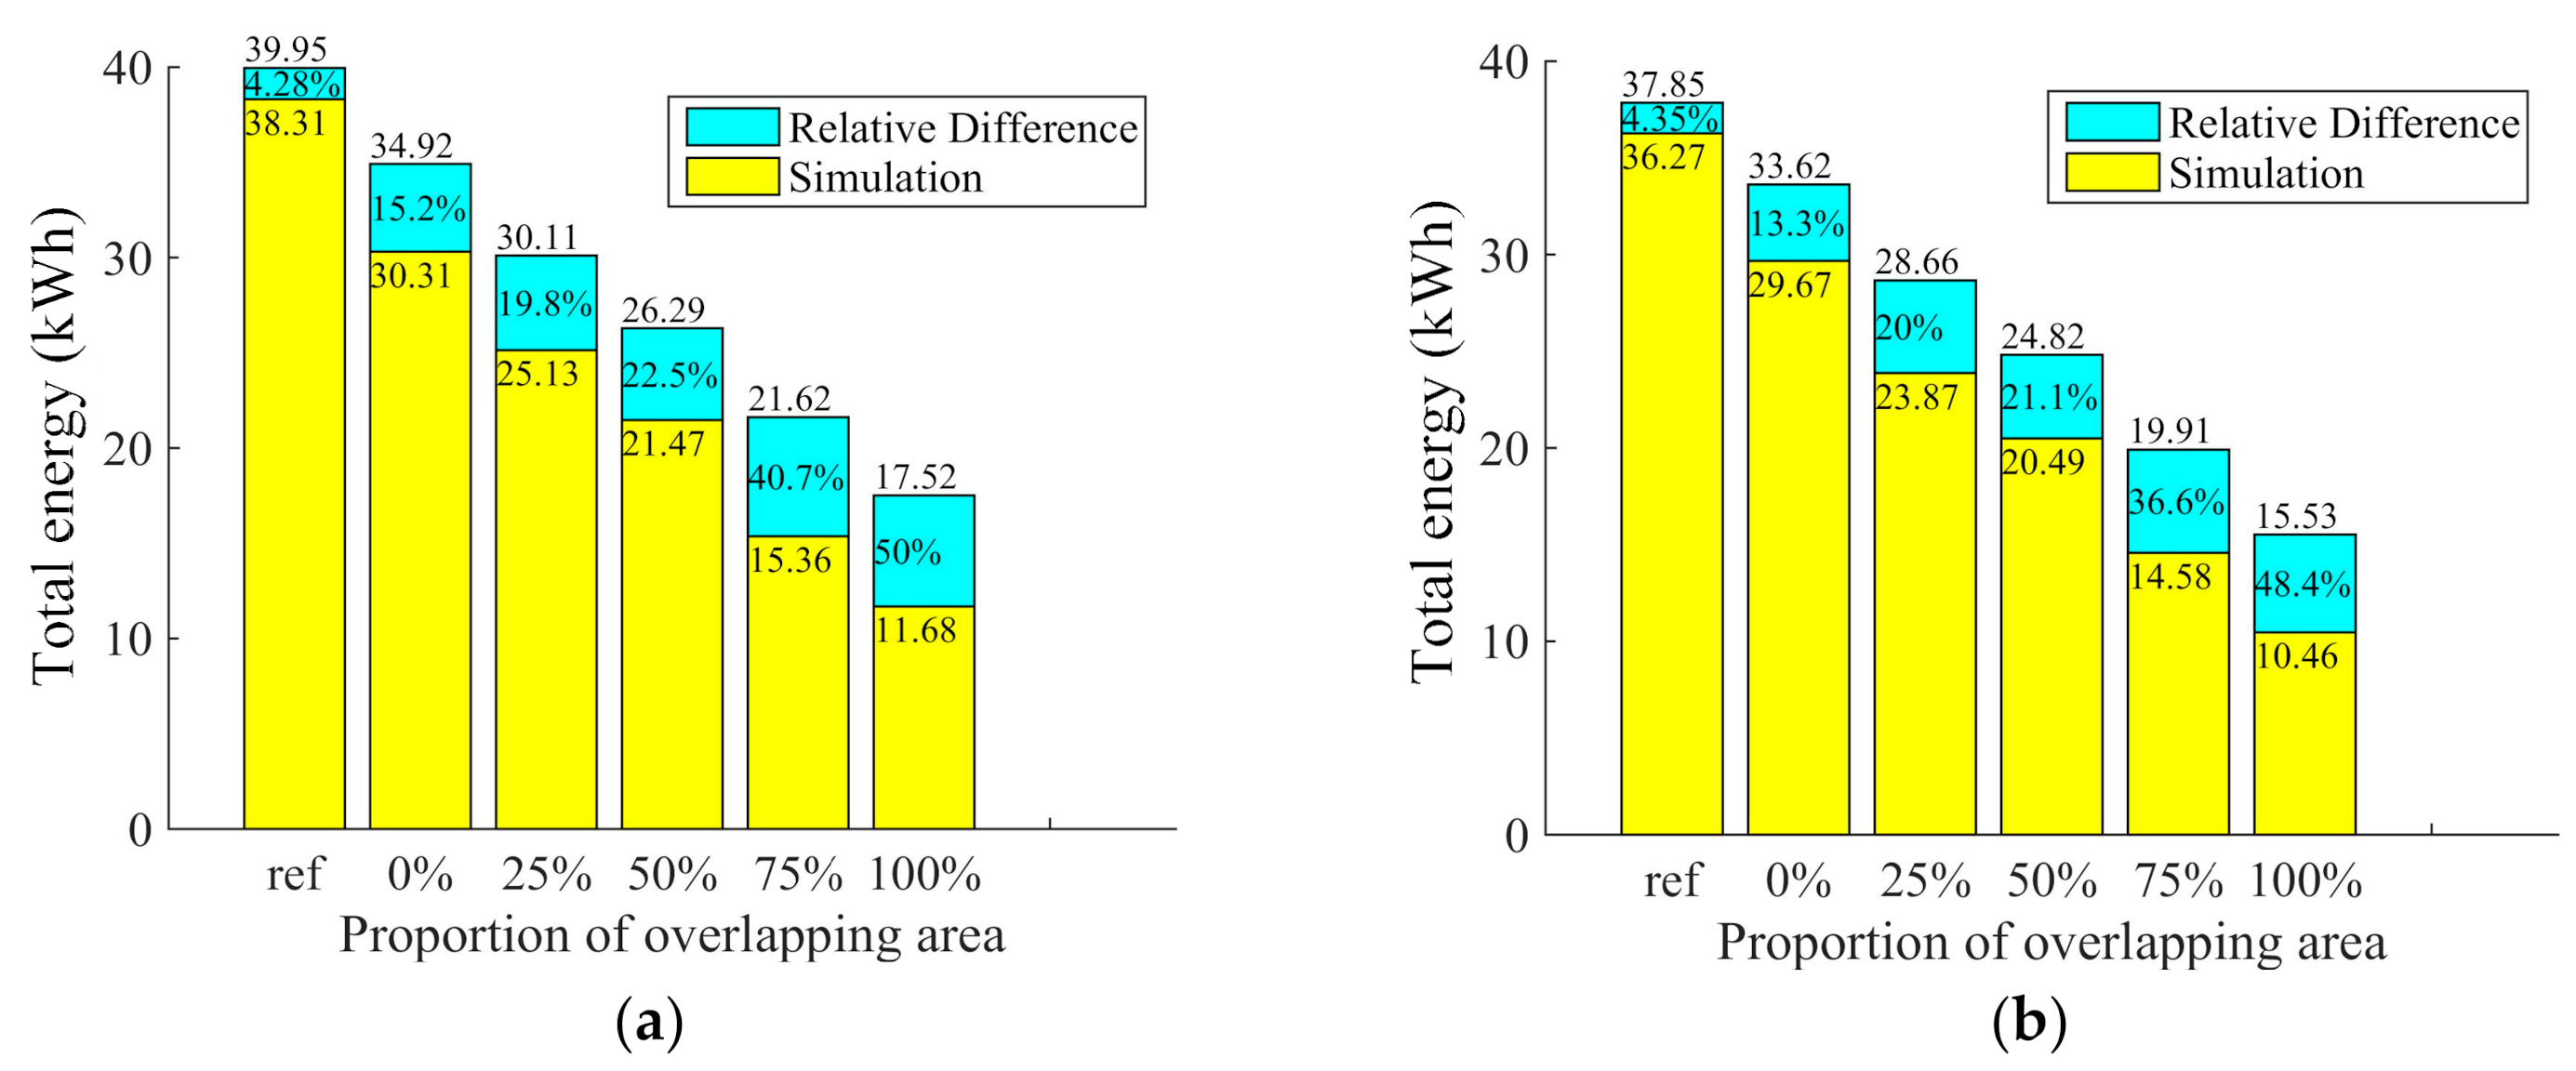
To probe into the energy acquisition under more severe partial shading, a larger overlapping area of the wing sections and more frequent shading were simulated. The increase in the overlapping area can alleviate the torsion stress at the actual joint structure of the wing sections, but it aggravates the frequency of shading. The sweep angle is set to 0, and the positions of wing sections 1 and 2 are gradually moved so that the overlapping area, if viewed from above, varies from 0 to 100%, as shown in Figure 9. The simulation results of the energy acquisition of wing sections 3 and 4 (1 and 2 are not influenced by shading) are shown in Figure 10 and Figure 11.
The energy harvested in a day decreases with the increase in the overlapping area, and the power loss increases as well, indicating that the estimation without mismatch will be less accurate when the shading is severe. The lines in yellow and green show the main decrease in the output energy caused by shading from 14:00 to 17:00. Then, the overlapping area increases to 25%, as well as the time range of shading, as indicated by the line in cyan. However, the green line, which represents the values before shading occurs, has the same trend as the line in yellow; in other words, the main cause of the decrease is the time range of shading. Later, the overlapping area continues to increase, and all lines in cyan, blue, red and black are descending, which means that the main cause of the decrease is the severity of the shading, since the time range of partial shading almost covers the whole flight. The output power is reduced on account of shading in two aspects: time range and severity. Once the overlapping area of wing sections reaches 50%, the power loss is up to 20%. When the upper and lower wing sections are not staggered, the overlapping area between them reaches 100%, and the difference is as high as 50%.
The energy harvested by the aircraft is the sum of the energy harvested by the four wing sections. Therefore, the energy losses of the whole aircraft caused by mismatch are 4.9%, 9.4%, 11.4%, 11.3%, 15.0% and 15.5% when the overlapping area is the reference value, 0%, 25%, 50%, 75% and 100%, respectively. The mismatch loss of the reference overlapping area is caused by the curved surface and different orientations of PV modules.
4.3. Effects of Different PV Configurations
Different circuit configurations of PV modules were studied to alleviate the power loss under partial shading. The different configurations of PV arrays that have the same output characteristics under STC were also modeled and simulated. The configurations include the series–parallel (SP) configuration, the total cross-tied (TCT) configuration and the bridge-linked (BL) configuration, as shown in Figure 12. The configurations without bypass diodes were simulated, as well. The results of the simulations are shown in Table 3 and Figure 13.
The results reveal the positive impact of bypass diodes and the TCT configuration. The TCT configuration with bypass diodes harvested the most energy, more than 1.2% of the most common SP configuration with diodes, while the SP configuration without diodes harvested the least energy, less than 3.7% of the SP configuration with diodes. The PV modules without bypass diodes decreased the current of the whole series when it was shaded, causing greater output power loss, as the power of the SP configuration without diodes remained low, with values forming a straight line from 15:00 to 17:00 in Figure 13a. The TCT configuration with bypass diodes had less power loss under the shading condition, as shown in Figure 13b.
The deviation of various circuit configurations can be explained by the I–V curve of the PV arrays under partial shading conditions, as shown in Figure 14. The distribution, number and location of the peaks of different configurations are the same; in other words, the deviations are mainly caused by the local peak shape of the curve instead of the overall trend.
5. The Energy Acquisition Ability Obtained by the Configuration Energy Acquisition Factor
5.1. The Configuration Energy Acquisition Factor
In addition to continuous simulation, the energy system model can be used to illustrate the inherent energy acquisition ability of a specific configuration by calculating a configuration energy acquisition factor that indicates the energy acquisition ability versus the illumination direction, expressed by and , as shown in Figure 3.
where is the output power, is the efficiency of the solar arrays, is the solar irradiance on the aircraft, and is the total area of solar arrays.
While the total output power of solar arrays under STC is tested, the output power of the aircraft can be obtained as:
Therefore, characterizes the energy acquisition response to different irradiation inputs. The values of the straight-wing layout and joint-wing layout in the aircraft body-fixed coordinate system demonstrate the energy acquisition ability of different layouts, as shown in Figure 15. Their inhomogeneity determines the inhomogeneity of irradiation and energy. The arrows are the normal vectors of solar modules.
Both wing configurations gain more energy when the sun elevation is high. However, Figure 15b shows a collapsed area along the direction of the wing section overlap, indicating the power loss caused by partial shading and mismatch. Another noteworthy phenomenon is that the energy acquisition when = 0° and = 180° is greater than the energy acquisition when = 0° and = 0°. This is due to generally backward normal vectors of the upper airfoil.
The influences of different dihedrals were also studied. versus and of the joint-wing layout when wing dihedral = 10° and 30° are shown in Figure 16. The increases in dihedral improve the energy acquisition ability at low , especially when is near 90°, but reduce the energy acquisition ability at high . It is remarkable that the collapsed areas have complex geometry, which indicates that the changes in the dihedral angle have complicated effects on the energy acquisition ability because of the interaction between partial shading and the energy system, mainly reflected in the mismatch of PV arrays. The depth of the collapsed areas reveals considerable power loss occurring in the condition of partial shading, illustrating the necessity of accurately modeling the energy system.
5.2. Optimal Flight Direction
The output power can be calculated by transforming the flight path into the path of solar direction in the aircraft body-fixed coordinate system once the of the aircraft is computed. Then, the energy acquisition of a geometrically complex configuration with a specific energy system can be quickly obtained while considering the mismatch. For instance, the path of the solar direction corresponding to a circular flight path with a radius of 36 km is shown in Figure 17. The path can be optimized to the optimal , where takes the maximum value at a specific ; in other words, the maximum energy is harvested if the flight maintains the optimal .
The optimal of the joint-wing configuration and straight-wing configuration at each was extracted by finding the maximum value, as shown in Figure 18. At low , the joint-wing configuration gains the biggest advantage when is near 90°, while the straight-wing configuration shows the best energy acquisition at high . The optimal values of the straight-wing are almost all 180° because of the backward airfoil shape. It is notable that the optimal values of the joint-wing layout are along the edge of the irregular collapsed area, which demonstrates that the optimal flight strategy of the joint-wing configuration needs careful calculation.
The energy acquisition of two configurations in a day with different flight strategies is compared in Figure 19 and Table 4. The joint-wing layout configuration with larger dihedral benefits the most from the change in strategy, the energy increase of which is 5.54% compared to the output power curve with many sags and 55% more than the energy increase of 3.57% for the straight-wing configuration.
The different sensitivities illustrate that more attention should be paid to the selection of the flight strategy or optimization of the flight trajectory for a configuration with severe or frequent shading. Configurations with larger wing dihedrals have better performance when the solar elevation relative to the aircraft is low, making them suitable for application in winter and at high latitudes; however, they may encounter greater power loss caused by shading. Different configurations adapt to different irradiation conditions defined by altitude and time. The matching between irradiation and energy acquisition characteristics determines the most applicable configuration.
6. Conclusions
In this paper, the energy acquisition model of solar-powered aircraft with a joint-wing design accounting for partial shading and the mismatch problem is established by the integration of a solar model, an energy system model and wing geometry. The effects of the airfoil surface, the severity of shading and circuit configurations are analyzed to clarify the energy acquisition characteristics when considering mismatch based on a 24 h flight simulation. Then, the configuration energy acquisition factor is proposed to describe the inherent energy acquisition ability of a specific configuration as well as flight optimization. The main conclusions can be summarized as follows.
- Mismatch should be considered in the energy acquisition estimation of unconventional solar-powered aircraft involving partial shading; otherwise, the energy will be overestimated by 4~15%. The simulation results show that dramatic power loss of over 50% occurs under shading conditions, leading to notable energy loss, especially when the shading is frequent or severe, and is influenced by wing dihedral, the upper chamber, the flight trajectory and the energy system. Among them, the geometry of the layout design has prominent effects, while the effects of circuit configurations and airfoils are less than 4.9% and 5.5%, respectively.
- The energy acquisition ability of solar aircraft with unconventional designs can be characterized by the configuration energy acquisition factor. The response of energy acquisition to different irradiation inputs can be visually compared and matched with flight missions. Careful estimation is needed, as the irregularity of the collapsed area indicates sudden changes in energy harvesting.
- Solar-powered aircraft with unconventional designs are more sensitive to the flight path, which makes flight strategy development important. Configurations with more shading problems benefit more from the change in strategy. A flight along the optimal azimuths along the edge of shading gains 3.4% more energy.
This study mainly emphasizes the necessity to consider the mismatch problem of solar arrays in solar-powered aircraft with unconventional configurations when estimating the energy acquisition. Further studies may focus on the multidisciplinary optimization of the design [32], flight path optimization [33] and energy management [34] for solar-powered aircraft with unconventional configurations. Hopefully, the flight range of solar-powered aircraft will be extended.
Supplementary Materials
The following are available online at https://0-www-mdpi-com.brum.beds.ac.uk/article/10.3390/en15010157/s1, Supplementary File S1: Data and Model.
Author Contributions
Conceptualization, X.J. and K.S.; funding acquisition, K.S.; investigation, M.S.; methodology, X.J.; project administration, K.S.; software, X.G. and M.S.; validation, X.J.; writing—original draft, X.J.; writing—review and editing, K.S. All authors have read and agreed to the published version of the manuscript.
Funding
This research was funded by the National Natural Science Foundation of China under Grant No. 51775021.
Institutional Review Board Statement
Not applicable.
Informed Consent Statement
Not applicable.
Data Availability Statement
The data presented in this study are available in Supplementary Materials.
Acknowledgments
This work was supported by the National Natural Science Foundation of China under Grant No. 51775021, the Fundamental Research Funds for the Central Universities under Grant No. YWF-18-BH-Y-165, Key Laboratory of Aircraft Advanced Design Technology (Beihang University) Ministry of Industry, and the fifth youth top talent support program of Beihang University.
Conflicts of Interest
The authors declare no conflict of interest. The funders had no role in the design of the study; in the collection, analyses, or interpretation of data; in the writing of the manuscript; or in the decision to publish the results.
References
- Sri, K.R.B.; Aneesh, P.; Bhanu, K.; Natarajan, M. Design analysis of solar-powered unmanned aerial vehicle. J. Aerosp. Technol. Manag. 2016, 8, 397–407. [Google Scholar] [CrossRef]
- Zhang, L.C.; Li, J.; Jiang, Y.; Du, H.F.; Zhu, W.Y.; Lv, M.Y. Stratospheric airship endurance strategy analysis based on energy optimization. Aerosp. Sci. Technol. 2020, 100, 105794. [Google Scholar] [CrossRef]
- Shan, C.; Lv, M.Y.; Sun, K.W.; Gao, J. Analysis of energy system configuration and energy balance for stratospheric airship based on position energy storage strategy. Aerosp. Sci. Technol. 2020, 101, 105844. [Google Scholar] [CrossRef]
- Noll, T.E.; Brown, J.M.; Perez-Davis, M.E.; Ishmael, S.D.; Tiffany, G.C.; Gaier, M. Investigation of the Helios Prototype Aircraft Mishap Volume I Mishap Report. 2004. Available online: https://www.nasa.gov/centers/dryden/history/pastprojects/Helios/index.html (accessed on 7 August 2017).
- Wilkins, G. Design and Implementation of a Power System for a Solar Unmanned Aerial Vehicle; University of Johannesburg: Johannesburg, South Africa, 2011. [Google Scholar]
- Gao, X.Z.; Hou, Z.X.; Guo, Z.; Chen, X.Q. Reviews of methods to extract and store energy for solar-powered aircraft. Renew. Sustain. Energy Rev. 2015, 44, 96–108. [Google Scholar] [CrossRef]
- Air Force Technology. Zephyr S High-Altitude Pseudo-Satellite (HAPS). 2018. Available online: https://www.airforce-technology.com/projects/zephyr-s-high-altitude-pseudo-satellite-haps (accessed on 1 March 2020).
- Abbe, G.; Smith, H. Technological development trends in solar-powered aircraft systems. Renew. Sustain. Energy Rev. 2016, 60, 770–783. [Google Scholar] [CrossRef]
- Oettershagen, P.; Melzer, A.; Mantel, T.; Rudin, K.; Stastny, T.; Wawrzacz, B.; Hinzmann, T.; Leutenegger, S.; Alexis, K.; Siegwart, B. Design of small hand-launched solar-powered UAVs: From concept study to a multi-day world endurance record flight. J. Field Robot. 2017, 34, 1352–1377. [Google Scholar] [CrossRef] [Green Version]
- D’Oliveira, F.A.; De Melo, F.C.L.; Devezas, T.C. High-altitude platforms-present situation and technology trends. J. Aerosp. Technol. Manag. 2016, 8, 249–262. [Google Scholar] [CrossRef]
- Zhu, X.F.; Hou, Z.X.; Zhang, J.T.; Liu, D.N. Sun-seeking eternal flight of solar-powered airplane. J. Aerosp. Eng. 2014, 27, 06014004. [Google Scholar] [CrossRef]
- Wu, M.J.; Shi, Z.W.; Ang, H.S.; Xiao, T.H. Theoretical study on energy performance of a stratospheric solar aircraft with optimum Λ-shaped rotatable wing. Aerosp. Sci. Technol. 2020, 98, 105670. [Google Scholar] [CrossRef]
- Chang, M.; Zhou, Z.; Wang, R. Primary parameters determination for year-round solar-powered aircraft of wing-sail type at higher latitudes. Acta Aeronaut. Et Astronaut. Sin. 2014, 35, 1592–1603. [Google Scholar]
- Next Energy News. Aurora Odysseus UAV to Stay Aloft for Five Years on Solar Power. 2008. Available online: http://www.nextenergynews.com/news1/next-energy-news4.25.08b.html (accessed on 25 April 2008).
- Mardanpour, P.; Hodges, D.H. Passive morphing of flying wing aircraft: Z-shaped configuration. J. Fluids Struct. 2014, 44, 17–30. [Google Scholar] [CrossRef]
- Wu, M.J.; Shi, Z.W.; Xiao, T.H.; Ang, H.S. Energy optimization and investigation for Z-shaped sun-tracking morphing-wing solar-powered UAV. Aerosp. Sci. Technol. 2019, 91, 1–11. [Google Scholar] [CrossRef]
- Wu, M.J.; Xiao, T.H.; Ang, H.S. Investigation of a morphing wing solar-powered unmanned aircraft with enlarged flight latitude. J. Aircr. 2017, 54, 1995–2003. [Google Scholar] [CrossRef]
- Cavallaro, R.; Demasi, L. Challenges, ideas, and innovations of joined-wing configurations: A concept from the past, an opportunity for the future. Prog. Aerosp. Sci. 2016, 87, 1–93. [Google Scholar] [CrossRef]
- Moballegh, S.; Jiang, J. Modeling, prediction, and experimental validations of power peaks of PV arrays under partial shading conditions. IEEE Trans. Sustain. Energy 2014, 5, 293–300. [Google Scholar] [CrossRef]
- Piccoli, E.; Dama, A.; Dolara, A.; Leva, S. Experimental validation of a model for PV systems under partial shading for building integrated applications. Sol. Energy 2019, 183, 356–370. [Google Scholar] [CrossRef]
- Mirza, A.F.; Mansoor, M.; Ling, Q.; Yin, B.Q.; Javed, M.Y. A Salp-Swarm Optimization based MPPT technique for harvesting maximum energy from PV systems under partial shading conditions. Energy Convers. Manag. 2020, 209, 112625. [Google Scholar] [CrossRef]
- Sahin, M.E.; Blaabjerg, F. A hybrid PV-battery/supercapacitor system and a basic active power control proposal in MATLAB/Simulink. Electronics 2020, 9, 129. [Google Scholar] [CrossRef] [Green Version]
- Bonthagorla, P.K.; Mikkili, S. Optimal PV array configuration for extracting maximum power under partial shading conditions by mitigating mismatching power loss. CSEE J. Power Energy Syst. 2019. [Google Scholar] [CrossRef]
- Gang, B.G.; Kwon, S. Design of an energy management technique for high endurance unmanned aerial vehicles powered by fuel and solar cell systems. Int. J. Hydrogen Energy 2018, 43, 9787–9796. [Google Scholar] [CrossRef]
- Rajani, K.; Ramesh, T. Maximum power enhancement under partial shadings using modified Sudoku reconfiguration. CSEE J. Power Energy Syst. 2020, 7. [Google Scholar] [CrossRef]
- Lei, T.; Yang, Z.; Lin, Z.C.; Zhang, X.B. State of art on energy management strategy for hybrid-powered unmanned aerial vehicle. Chin. J. Aeronaut. 2019, 32, 1488–1503. [Google Scholar] [CrossRef]
- Antonanzas-Torresa, F.; Urracab, R.; Poloc, J.; Perpiñán-Lamigueiro, O.; Escobar, R. Clear sky solar irradiance models: A review of seventy models. Renew. Sustain. Energy Rev. 2019, 107, 374–387. [Google Scholar] [CrossRef]
- Kumar, L.; Skidmore, A.K.; Knowles, E. Modelling topographic variation in solar radiation in a GIS environment. Int. J. Geogr. Inf. Sci. 1997, 11, 475–497. [Google Scholar] [CrossRef]
- Iabal, M. Chapter 1 sun-earth astronomical relationships. In An Introduction to Solar Radiation; Academic Press: New York, NY, USA, 1983; pp. 3–27. [Google Scholar] [CrossRef]
- Pillai, D.S.; Rajasekar, N.; Ram, J.P.; Chinnaiyan, V.K. Design and testing of two phase array reconfiguration procedure for maximizing power in solar PV systems under partial shade conditions (PSC). Energy Convers. Manag. 2018, 178, 92–110. [Google Scholar] [CrossRef]
- Mohapatra, A.; Nayak, B.; Das, P.; Mohanty, K.B. A review on MPPT techniques of PV system under partial shading condition. Renew. Sustain. Energy Rev. 2017, 80, 854–867. [Google Scholar] [CrossRef]
- Yun, J.Y.; Hwang, H.Y. Technology identification, evaluation, selection, and optimization of a hale solar aircraft. Appl. Sci. 2020, 10, 7593. [Google Scholar] [CrossRef]
- Ni, W.; Bi, Y.; Wu, D.; Ma, X. Energy-optimal trajectory planning for solar-powered aircraft using soft actor-critic. Chin. J. Aeronaut. 2021, in press. [Google Scholar] [CrossRef]
- Zhang, Z.J.; Ji, R.T.; Wang, Y.; Chang, M.; Sha, J.; Mao, D.L. An improved energy management strategy for the solar powered unmanned aerial vehicle at the extreme condition. J. Energy Storage 2021, 43, 103114. [Google Scholar] [CrossRef]
Figure 1.
Energy acquisition estimation of solar-powered aircraft.

Figure 2.
MPPT model based on modified hill-climbing algorithm.

Figure 3.
Wing sections and parameters of joint-wing layout.

Figure 4.
Shading states of P.

Figure 5.
Model of energy system.

Figure 6.
PV circuit configuration of a wing section.

Figure 7.
Output power of different wing sections over a period of 24 h. (a) Output power of wing section 3. (b) Output power of wing section 4.
Figure 7.
Output power of different wing sections over a period of 24 h. (a) Output power of wing section 3. (b) Output power of wing section 4.

Figure 8.
Irradiation inputs to PV modules. (a) PV modules on airfoil curve. (b) Irradiation inputs of wing section 4.
Figure 8.
Irradiation inputs to PV modules. (a) PV modules on airfoil curve. (b) Irradiation inputs of wing section 4.

Figure 9.
Proportion of overlapping area.

Figure 10.
Output powers of different overlapping areas in 24 h. (a) Output power of wing section 3. (b) Output power of wing section 4.
Figure 10.
Output powers of different overlapping areas in 24 h. (a) Output power of wing section 3. (b) Output power of wing section 4.

Figure 11.
Energy acquisition of different overlapping areas. (a) Total energy of wing section 3. (b) Total energy of wing section 4.
Figure 11.
Energy acquisition of different overlapping areas. (a) Total energy of wing section 3. (b) Total energy of wing section 4.

Figure 12.
Models of different PV configurations. (a) SP circuit configuration. (b) BL circuit configuration. (c) TCT circuit configuration.
Figure 12.
Models of different PV configurations. (a) SP circuit configuration. (b) BL circuit configuration. (c) TCT circuit configuration.

Figure 13.
Energy acquisition of different circuit configurations. (a) Output power of wing section 3. (b) Output power of wing section 3.
Figure 13.
Energy acquisition of different circuit configurations. (a) Output power of wing section 3. (b) Output power of wing section 3.

Figure 14.
Output characteristics of different circuit configurations. (a) Partial shading conditions. (b) I–V curve.
Figure 14.
Output characteristics of different circuit configurations. (a) Partial shading conditions. (b) I–V curve.

Figure 15.
Energy acquisition ability in aircraft body-fixed coordinate system. (a) of straight-wing layout. (b) of joint-wing layout.
Figure 15.
Energy acquisition ability in aircraft body-fixed coordinate system. (a) of straight-wing layout. (b) of joint-wing layout.

Figure 16.
Energy acquisition factor versus and .

Figure 17.
Energy acquisition estimation based on .

Figure 18.
Optimal with the value of .

Figure 19.
Output power of different configurations with different flight strategies.


Table 1.
Settings of the simulation.
| Parameter | Value | Parameter | Value |
|---|---|---|---|
| Flight attitude | 20 km | Position of wing sections 1, 2 | (−6.1 m, 0, −2.7 m) |
| Flight date | 173 (22 June) | Position of wing sections 3, 4 | (0,0,0) |
| Flight latitude | 40° N | Chord length | 2 m |
| Flight longitude | 120° E | Wingspan | 30 m |
| Flight time | 0–24 h | Dihedral angle of wing sections 1, 2 | 10° |
| Flight path | 36 km circling | Sweep angle of wing sections 1, 2 | 15° |
Table 2.
Total energies obtained in a day.
| Wing Section | 1 | 2 | 3 | 4 | Sum |
|---|---|---|---|---|---|
| Energy acquisition in 24 h by simulation (kWh) | 37.42 | 37.42 | 37.68 | 35.80 | 148.31 |
| Energy acquisition in 24 h by efficiency (kWh) | 39.47 | 39.47 | 39.86 | 37.81 | 156.61 |
| Mismatch loss | 5.49% | 5.49% | 5.78% | 5.64% | 5.60% |
Table 3.
Energy acquisition of wing section 3 in a day of different PV configurations.
| Circuit Configuration | SP | BL | TCT | |||
|---|---|---|---|---|---|---|
| without Diode | with Diodes | without Diode | with Diodes | without Diode | with Diodes | |
| Energy Acquisition (kWh) | 29.18 | 30.31 | 29.34 | 30.65 | 29.47 | 30.66 |
| Compared to SP with Diodes | −3.7% | 0 | −3.2% | 1.1% | −2.8% | 1.2% |
Table 4.
Energy acquisition of different configurations with different flight strategies.
| Configuration | Flight Strategy | Energy Increase | |
|---|---|---|---|
| Circling | |||
| Joint-wing layout (dihedral = 10°) | 146.218 kWh | 151.299 kWh | 3.47% |
| Joint-wing layout (dihedral = 30°) | 137.746 kWh | 145.382 kWh | 5.54% |
| Straight-wing | 147.484 kWh | 152.743 kWh | 3.57% |
Publisher’s Note: MDPI stays neutral with regard to jurisdictional claims in published maps and institutional affiliations. |
© 2021 by the authors. Licensee MDPI, Basel, Switzerland. This article is an open access article distributed under the terms and conditions of the Creative Commons Attribution (CC BY) license (https://creativecommons.org/licenses/by/4.0/).
Share and Cite
MDPI and ACS Style
Ji, X.; Sun, K.; Guo, X.; Sun, M. Energy Acquisition of Solar-Powered Joint-Wing Aircraft Considering Mismatch Power Loss. Energies 2022, 15, 157. https://0-doi-org.brum.beds.ac.uk/10.3390/en15010157
AMA Style
Ji X, Sun K, Guo X, Sun M. Energy Acquisition of Solar-Powered Joint-Wing Aircraft Considering Mismatch Power Loss. Energies. 2022; 15(1):157. https://0-doi-org.brum.beds.ac.uk/10.3390/en15010157
Chicago/Turabian StyleJi, Xinzhe, Kangwen Sun, Xiao Guo, and Mou Sun. 2022. "Energy Acquisition of Solar-Powered Joint-Wing Aircraft Considering Mismatch Power Loss" Energies 15, no. 1: 157. https://0-doi-org.brum.beds.ac.uk/10.3390/en15010157
Note that from the first issue of 2016, this journal uses article numbers instead of page numbers. See further details here.