
The Effect of Inert Fuel Compounds on Flame Characteristics


1
Institute of Process Engineering, Brno University of Technology, Technická 2896/2, 616 69 Brno, Czech Republic
2
Eveco Brno, s.r.o., Hudcova 76d, 621 00 Brno-Medlánky, Czech Republic
*
Author to whom correspondence should be addressed.
Energies 2022, 15(1), 262; https://0-doi-org.brum.beds.ac.uk/10.3390/en15010262
Submission received: 29 November 2021
/
Revised: 23 December 2021
/
Accepted: 27 December 2021
/
Published: 31 December 2021
(This article belongs to the Special Issue Recent Advances in the Design, Modeling and Numerical Simulations of Low-Emission Burners)
Abstract
:To describe the effects of inert compounds in gaseous fuel, experiments on three different process burners (staged fuel burner, staged air burner, and low-calorific burner) were carried out. The tested burners are commercially available, but they were specially designed for experimental usage. Tests were carried out in the semi-industrial burner testing facility to investigate the influence of inert gases on the flame characteristics, emissions, and heat flux to the combustion chamber wall. Natural gas was used as a reference fuel, and, during all tests, thermal power of 500 kW was maintained. To simulate the combustion of alternative fuels with lower LHV, N2 and CO2 were used as diluents. The inert gas in the hydrocarbon fuel at certain conditions can lower NOx emissions (up to 80%) and increase heat flux (up to 5%). Once incombustible compounds are present in the fuel, the higher amount of fuel flowing through nozzles affects the flow in the combustion chamber by increasing the Reynolds number. This can change the flame pattern and temperature field, and it can be both positive and negative, depending on actual conditions.
1. Introduction
To fulfill demands based on documents such as the so-called green deal for Europe [1], it is necessary to provide new design solutions and optimize process burners for various alternative fuels. One of the possibilities is the simultaneous or alternate combustion of gaseous fuels such as natural gas and fuels from alternative sources (biogas plants, pyrolysis plants, algae [2]). Alternative fuels produced, for example, in biogas stations and pyrolysis units are characterized by their variable composition. Thus, their combustion can cause problems. Alternative fuels with a lower heating value (LHV) are usually combusted in burners specifically designed for the combustion of a particular fuel. The LHV in this type of fuel is lowered by the presence of inert gases (nitrogen, carbon dioxide, and others). To sustain sufficient energy power in the furnaces or boilers, it is necessary to deliver a higher amount of fuel into the combustion chamber (compared with the combustion of natural gas). Usually, conventional burners initially designed for the combustion of natural gas and fuels with similar LHV are not designed to be used along with low-calorific fuels. Therefore, it is usually necessary to change the burner design. On the other hand, a vast amount of non-combustible particles can be a reason to use alternative low-calorific fuels because of their ability to lower temperature peaks and thus reduce the effect of thermal NOx nucleation. The utilization of alternative fuels can also be a solution to abide by increasingly stringent legislative limits.
Existing research that deals with the combustion of gaseous fuels with inert compounds (usually carbon dioxide, nitrogen, argon, water, and water vapor) and their effects on flame characteristics and CO and NOx emissions can be divided into two basic categories. The first category is the dilution of the noble fuel, such as methane or natural gas (including research with biogas—usually 60% vol. CH4, 40% vol. CO2), with the inert compound. On the other hand, the second category contains experiments with synthetic gases (syngas) or waste gases composed of combustible compounds such as methane, hydrogen, and carbon monoxide and containing incombustible elements.
Several research groups have investigated the combustion of diluted gaseous fuels with hydrocarbons as the main combustible component. For example, Li et al. [3] conducted experiments and numerical simulations to add nitrogen, carbon dioxide, argon, and water vapor into methane. The addition of steam to the methane flame was also examined by Zhao et al. [4]. The influence of superheated water vapor and CO2 on methane/air premixed flames was experimentally investigated by Kobayashi et al. [5,6]. To summarize, dilution by water and water vapor, once added to the flame, significantly lowers NOx emissions in the flue gas. Moreover, after steam addition, a change was observed in the decomposition of methane into OH radicals. Furthermore, the steam added into the flame resulted in a decrease in the OH concentration in the flame; thus, at the same time, it was possible to observe a decrease in CH radicals, which resulted in the suppression of prompt NOx. It was also observed that the effect of dilution by CO2 is higher than dilution by water, i.e., when recycled flue gas is used, CO2 is predominant. Moreover, Park et al. [7] revealed that the addition of H2O significantly influenced NO nucleation.
More studies regarding the reduction of NOx emissions where inert gases such as CO2 and N2 were added to the fuel were conducted by Glarborg et al. [8], Rangrazi et al. [9], Devi et al. [10] (combustion of biogas), and Salvador et al. [11] (addition of N2). These experiments revealed that the reaction of CO2 with hydrocarbons could contribute to CO formation, which can lead to near-burner corrosion and slagging. Moreover, it was found that Ar dilution is less effective than N2 dilution regarding reducing NOx formation. Reduction of NOx can be achieved by increasing the air surplus (reduction up to 30%), but when the air is fully substituted with nitrogen, the reduction can be 60%. Furthermore, during experiments with biogas, Dai et al. [12] revealed that a higher concentration of CO2 and lower fuel temperature created unstable conditions for combustion. Furthermore, Hinton et al. [13] found out that the higher pressure of biogas led to a decrease in burning velocity; however, a higher biogas temperature had the opposite effect.
For example, the combustion of syngas and its dilution was examined by Chun et al. [14]. Among the results described above, it was discovered that an increase in N radicals leads to more significant NOx production. Kiedrzynska et al. [15] used CFD to analyze the co-combustion of natural gas and syngas in an unmodified burner. It was found that it is possible to add only a small amount of syngas (up to 10% of thermal share) before reaching the burner limit. Furthermore, interchangeability between natural gas and other renewable gases was studied by Maznoy et al. [16]. The research was mainly focused on stability limits, radiation efficiency, and CO/NOx emissions, which were studied during the experiments. The addition of CO2 reduced NOx emissions but formed a colder flame, which resulted in a CO emission increase. It was confirmed that fuel interchangeability is possible and can increase the radiation efficiency in radial burners. Dai et al. [12] also examined flame stability, where it was discovered that a lower ratio of methane in fuel motivated the flame lifting, while, on the other hand, yellow tipping was motivated by a higher methane content. Flame stability was also partly investigated by Song et al. [17]. A vast amount of an inert compound can negatively affect flame stability, and when a specific limit is reached, the flame can extinguish.
From the review, it is possible to see the effect on multiple parameters once an inert compound is present in the gaseous fuel. However, most studies have been carried out in laboratory conditions, or their results were acquired by computer simulation, which used data from measurements on small-scale devices. The authors of this study carried out experiments on a semi-industrial facility that had similar parameters to some of the smaller furnaces. The main contribution of this study to the previous research is the description of the changes in the heat flux, but also the clarification and validation of prior results regarding the NOx emissions and especially inflame temperatures, which are described by temperature profiles. Furthermore, three burners with different designs were used and compared regarding the emissions, flame characteristics, flame temperatures, and heat flux. This study aimed to reveal the possibilities of fuel interchangeability in conventional process burners and to find limits while increasing the amount of inert compounds in the fuel.
2. Materials and Methods
2.1. Test Equipment
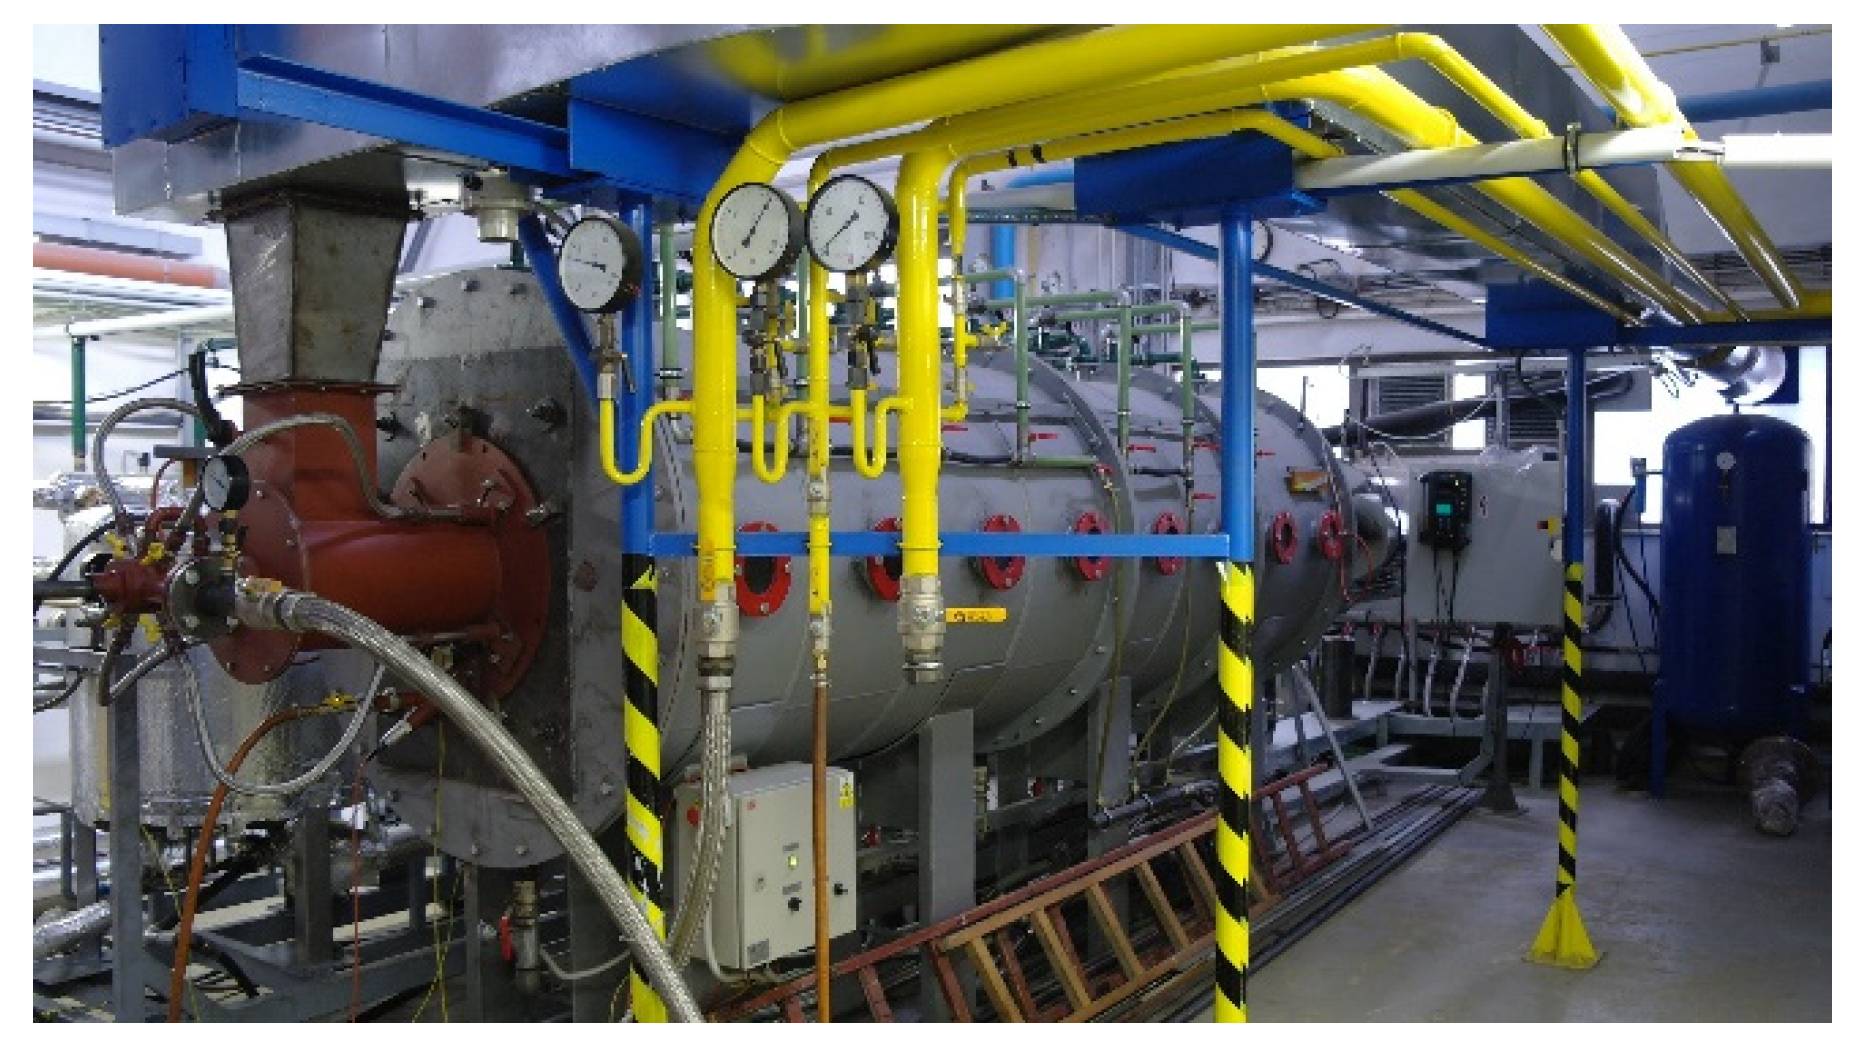
Combustion tests were carried out at the burner testing facility (Figure 1). The facility is designed to perform combustion tests of burners with thermal power up to 1.8 MW and collect experimental data for the further assessment and verification of numerical simulation results. During the combustion test with low-calorific fuels, the burners’ thermal output was set to 500 kW (and kept at this value during each test), and parameters such as NOx and CO emissions, flue gas temperature, heat flux to the wall of the combustion chamber as a measure of thermal efficiency, distribution of in-flame temperatures in the horizontal symmetry plane of the combustion chamber, and the stability, shape, and dimensions of the flame were investigated. In addition, thermal power was released by the combustion of transit natural gas (for average composition, see Table 1), further diluted with inert gases such as nitrogen and carbon dioxide, to investigate their effect on the flame characteristics.
The central apparatus of the facility is a two-shell horizontal water-cooled combustion chamber with an inner diameter of 1 m and an outer length of 4 m. The front and the rear side of the chamber are insulated with a high-temperature fibrous lining with a thickness of 100 mm. The cooling shell of the combustion chamber is divided into seven individual sections with an independent supply of cooling water. Each section is equipped with sensors to measure the flow rate, inlet, and outlet temperature of cooling water. Water flow rate is measured by turbine flow meters, and inlet and outlet temperatures are measured by resistance thermometers placed in the steel sheath.
Before the flue gas is released into the atmosphere, it flows from the combustion chamber through the flue gas stack. There are three measurement and sampling spots for measuring the pressure in the combustion chamber, flue gas temperature, and flue gas composition. The flue gas analysis and flue gas temperature measurements are provided by the flue gas analyzer TESTO 350-XL. The analysis box is equipped with electrochemical sensors for the real-time measurement of O2, CO, CO2, NO, and NO2 concentrations in the dry flue gas. The flue gas temperature is measured using an R-type thermocouple.
Combustion air is supplied to the front of the combustion chamber using a high-pressure fan equipped with a frequency converter. The maximum fan output is approximately 4500 mN3/h with a maximum overpressure of 11.2 kPa. The air duct is also equipped with a preheating unit for combustion air pre-treatment. Therefore, combustion air can be preheated up to 500 °C.
The testing facility is equipped with a sophisticated data collection and safety system. The system for data collection enables automatic data collection every second or two minutes and data collection upon the operator’s request. Collected data include flow rates, pressures, and temperatures of combustion air, fuel, inert gases, and cooling water. The safety system ensures the safe and reliable operation of the testing facility using the information from the sensors, e.g., it prevents preheating of cooling water and flame blow-off.
2.2. Methodology
The experiment was first carried out with the reference fuel—in this case, natural gas (composition Table 1). All the results obtained with low-calorific fuels were compared to this reference fuel. Low-calorific fuels are specific for their content of non-combustible compounds, which lower the LHV, but there is at least one flammable compound. Thus, the following combustion tests of low-calorific fuels required a combustible component—in this case, natural gas. Even though methane is usually only combustible in syngas or biogas, methane was substituted with natural gas during the experiment due to its similar Wobbe’s number (methane—50.7 MJ/m3, available natural gas—50.5 MJ/m3).
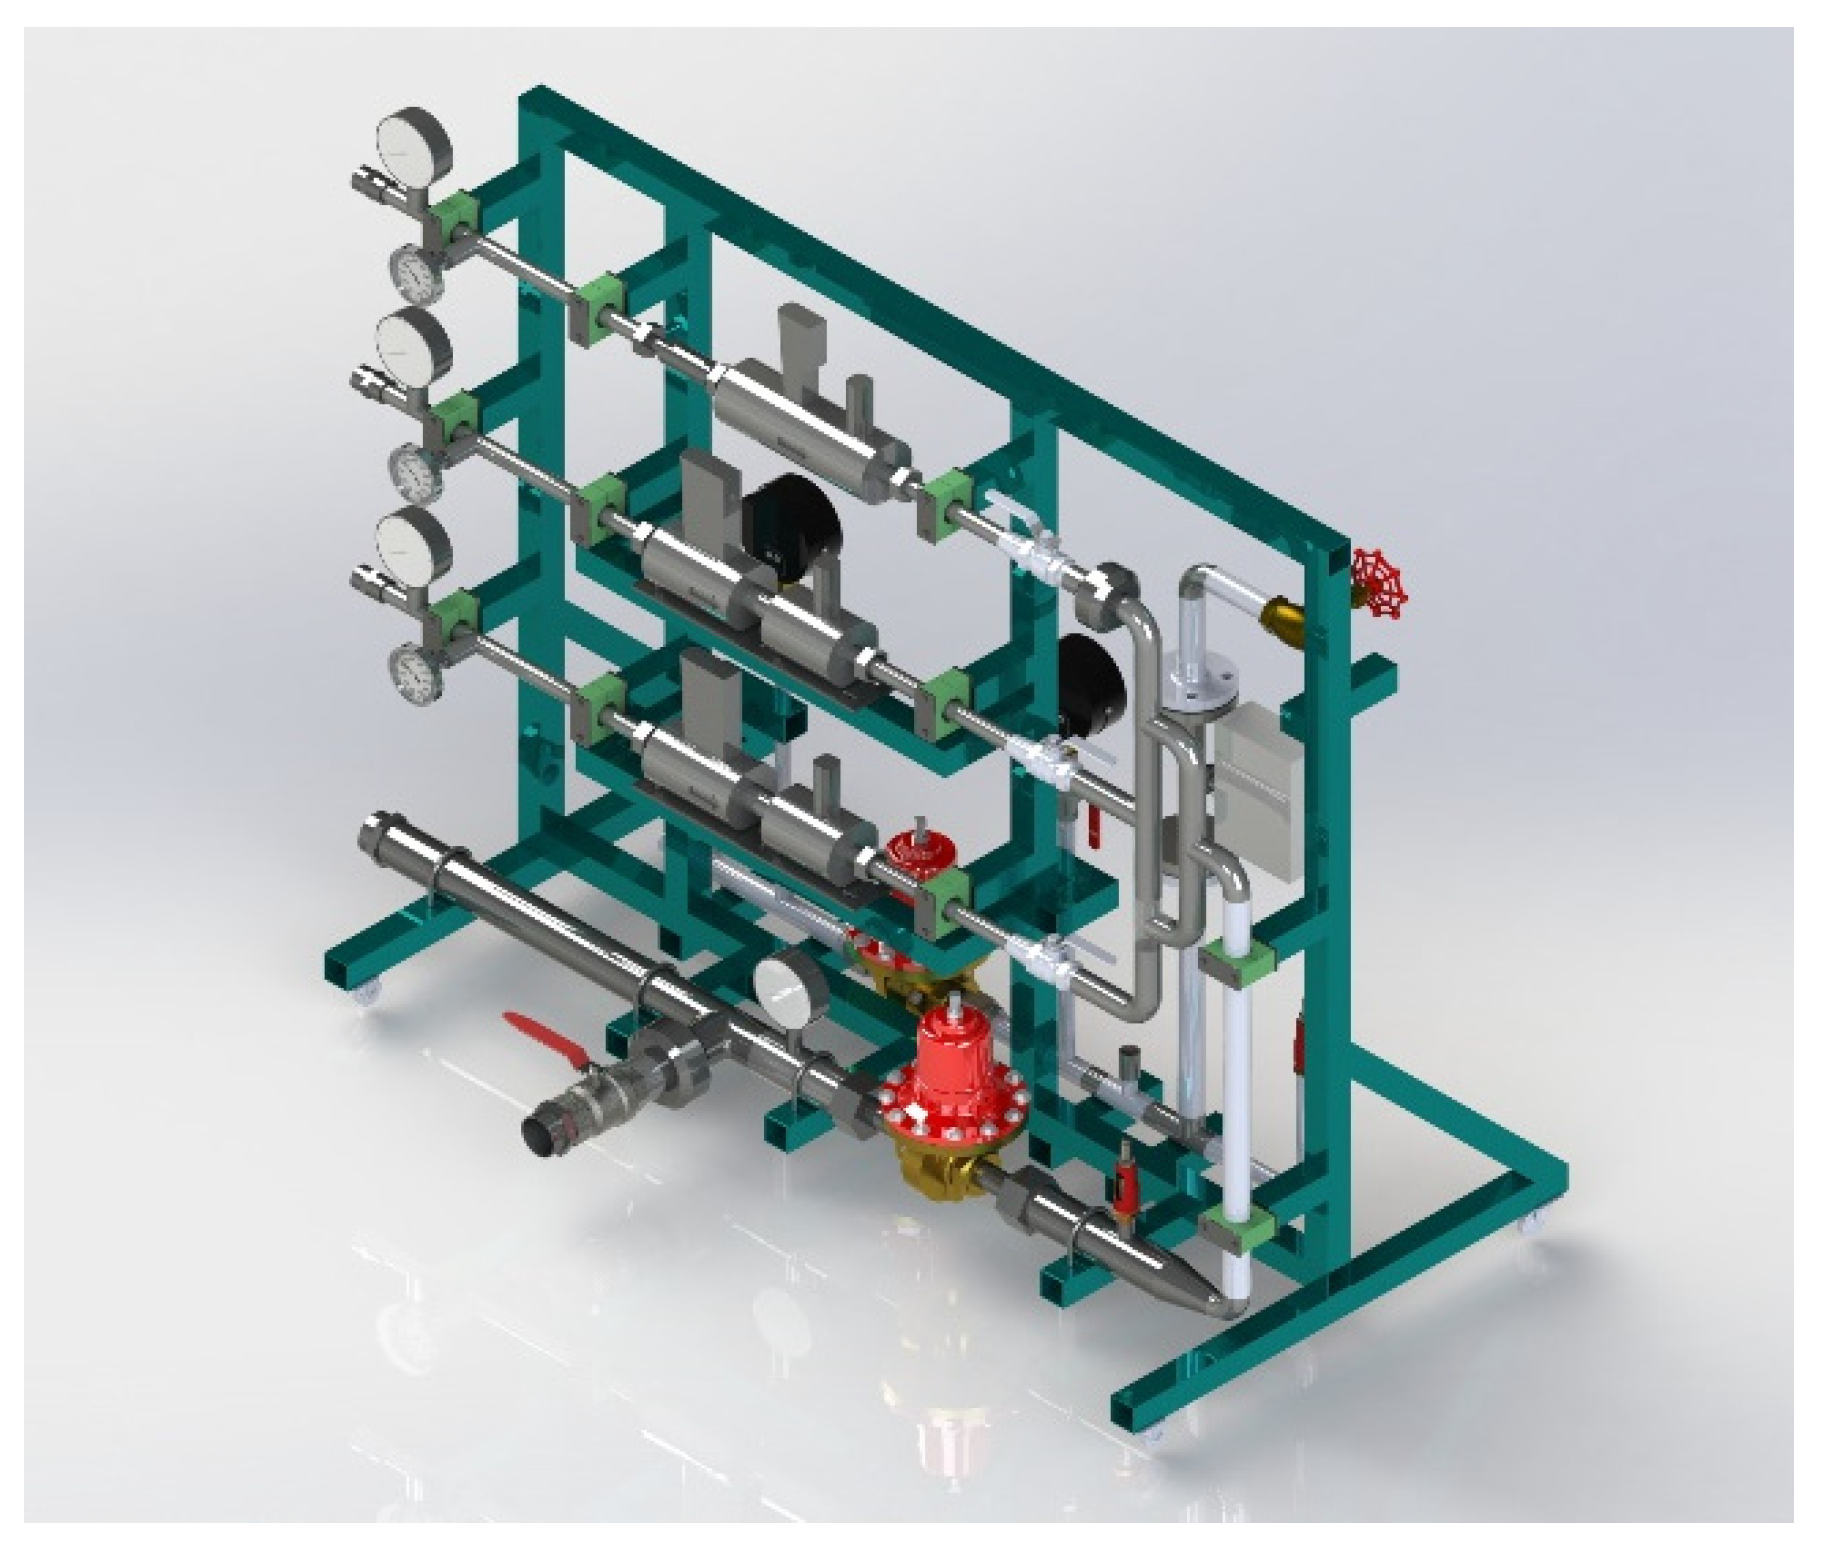
The mixing station ensured proper mixing of inert gases and combustible components, as shown in Figure 2. The station can mix four streams (methane—up to 100 mN3/h, hydrogen—up to 500 mN3/h, carbon dioxide—up to 300 mN3/h, and nitrogen—up to 300 mN3/h). Each stream is regulated and measured by Bronkhorst and M + W instruments pilot valves; the flow of gases can be precisely regulated, measured, and recorded. In addition, fuel parameters can be regulated by changing the fuel composition. Therefore, LHV can vary in the range from 5 to 35 MJ/m3.
Hydrogen and inert gases were supplied in bundles pressurized up to 200 bar (300 bar in the case of nitrogen). Their pressure was reduced to 8 bar (the calibration pressure of the flowmeters) before flowing into the mixing station. Then, these gases were mixed, creating a combustible mixture. The limitation of the whole unit was the pressure of the natural gas, which was available only at the overpressure at 0.1 bar. Therefore, the pressure of the hydrogen and inert gas mixture was further decreased before mixing with natural gas and before entering the burner.
At first, to verify the possibility of fuel interchangeability, tests were carried out on two different types of conventional experimental burners. This means that several parameters can be easily changed on each burner to achieve the required combustion parameters (flame shape, emissions, etc.). Each burner was adjusted for the combustion of the natural gas to achieve optimal results regarding the NOx emission and flame stability. Each experiment was carried out while combusting a fuel equivalent of 500 kW.
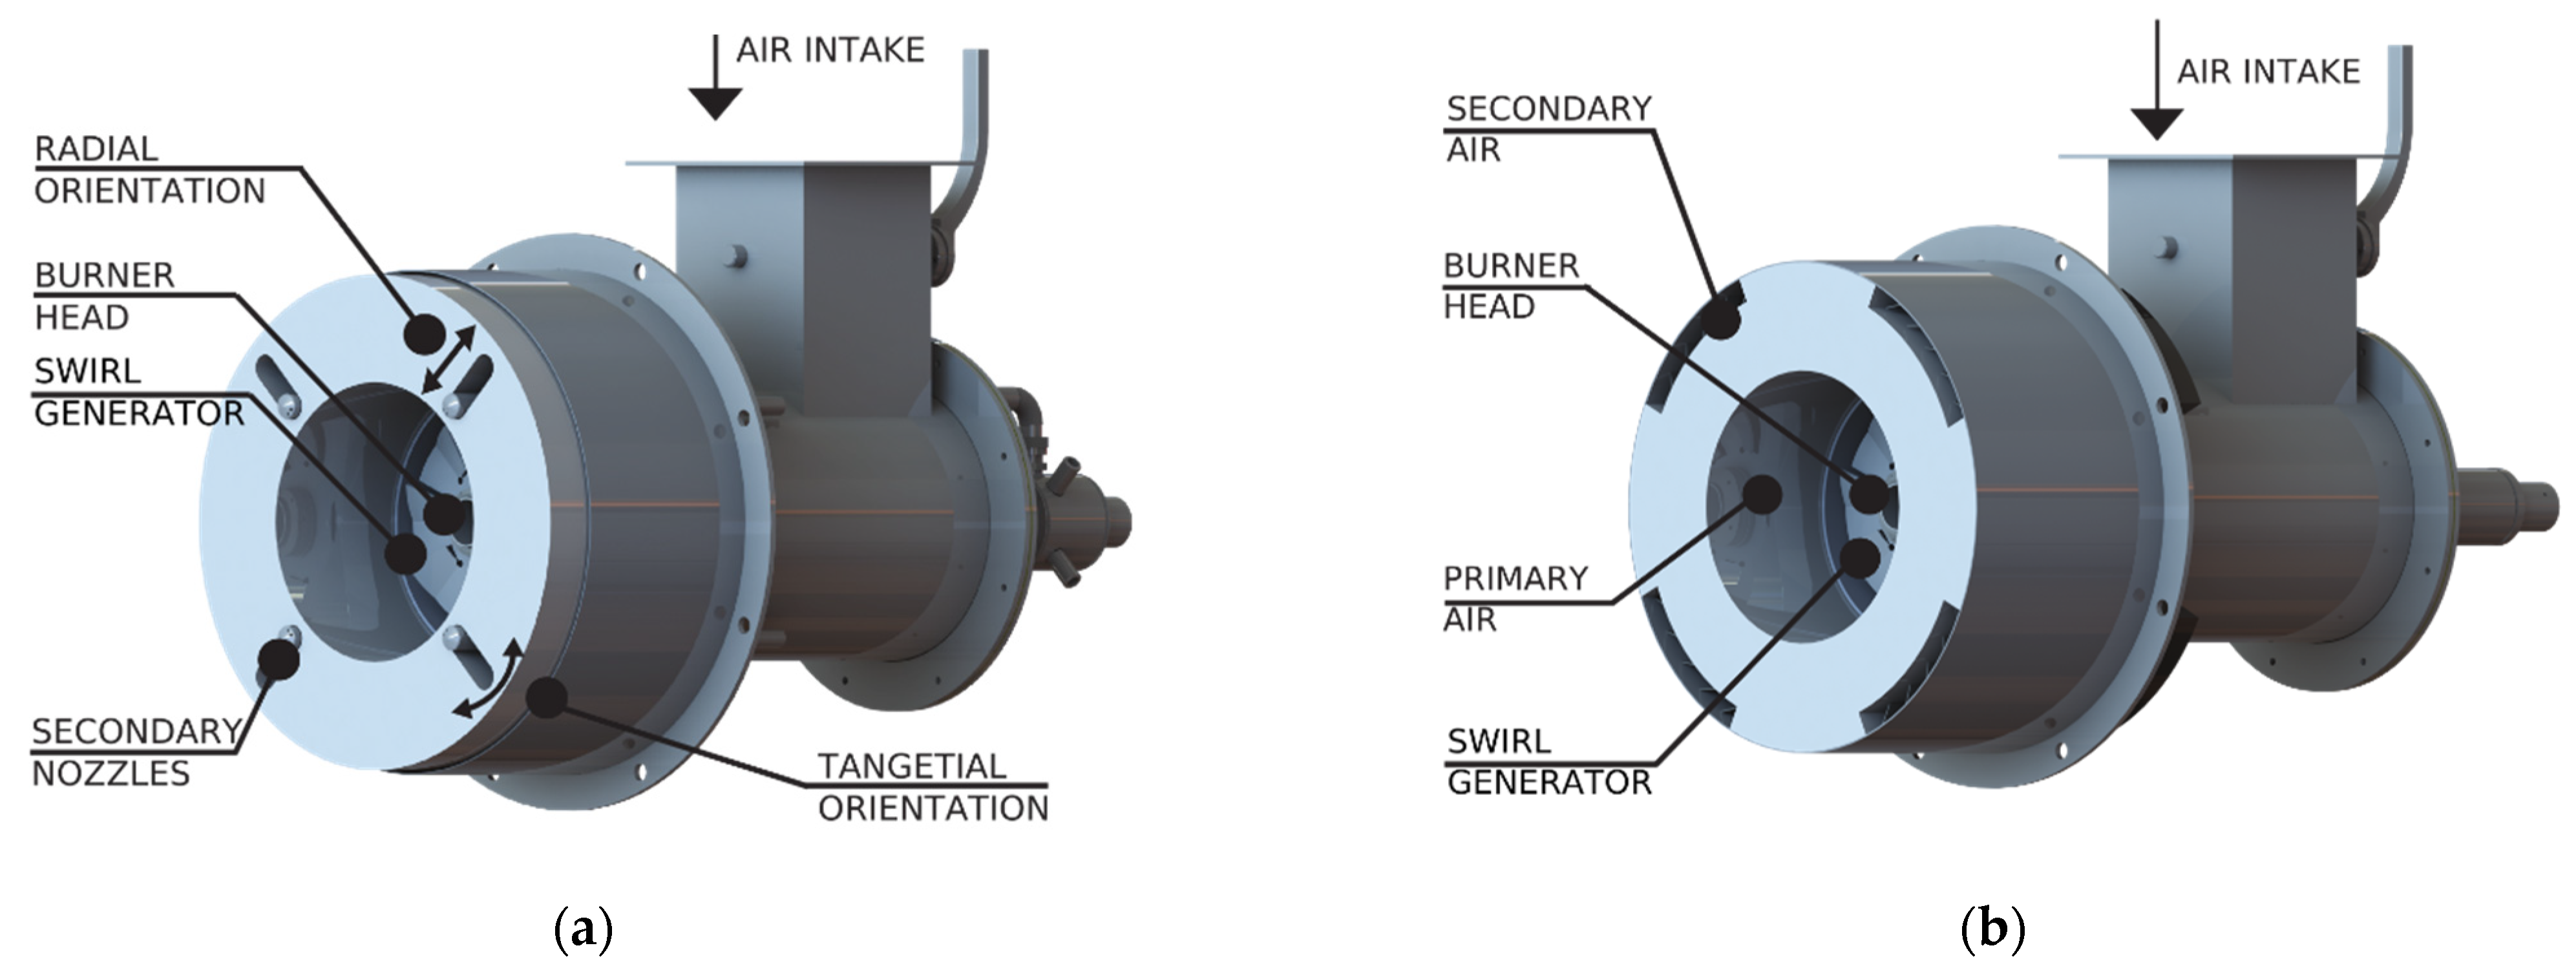
For the first series of experiments, a low-NOx gas-staged burner with alterable geometry (denoted as Burner A) was used. This burner can be operated either in the primary or secondary regime with more fuel ports. Fuel enters the combustion chamber through 12 ports in the primary regime, distributed on two circular arcs. In the secondary regime, four secondary nozzles are used for fuel injection. These nozzles can be positioned in axial, radial, and tangential directions. Burner A can be seen in Figure 3a and is capable of turndown 1:7.
The second burner (Burner B) used for testing is shown in Figure 3b. This burner is designed as an air-staged burner. The ratio between the primary and secondary air can be changed due to the interchangeable inner placings. Modulation of the airflow positively affects the flame dilution, and it can eliminate temperature peaks where thermal NOx is formed. The primary fuel head has 16 ports distributed in two circular fields, where one of the fields (the closest to the flame holder) stabilizes the flame, while the other is designed to deliver the maximal thermal output. The burner is capable of turndown 1:10.
Both burners were ignited and stabilized with the injector burner with a thermal output of 18 kW.
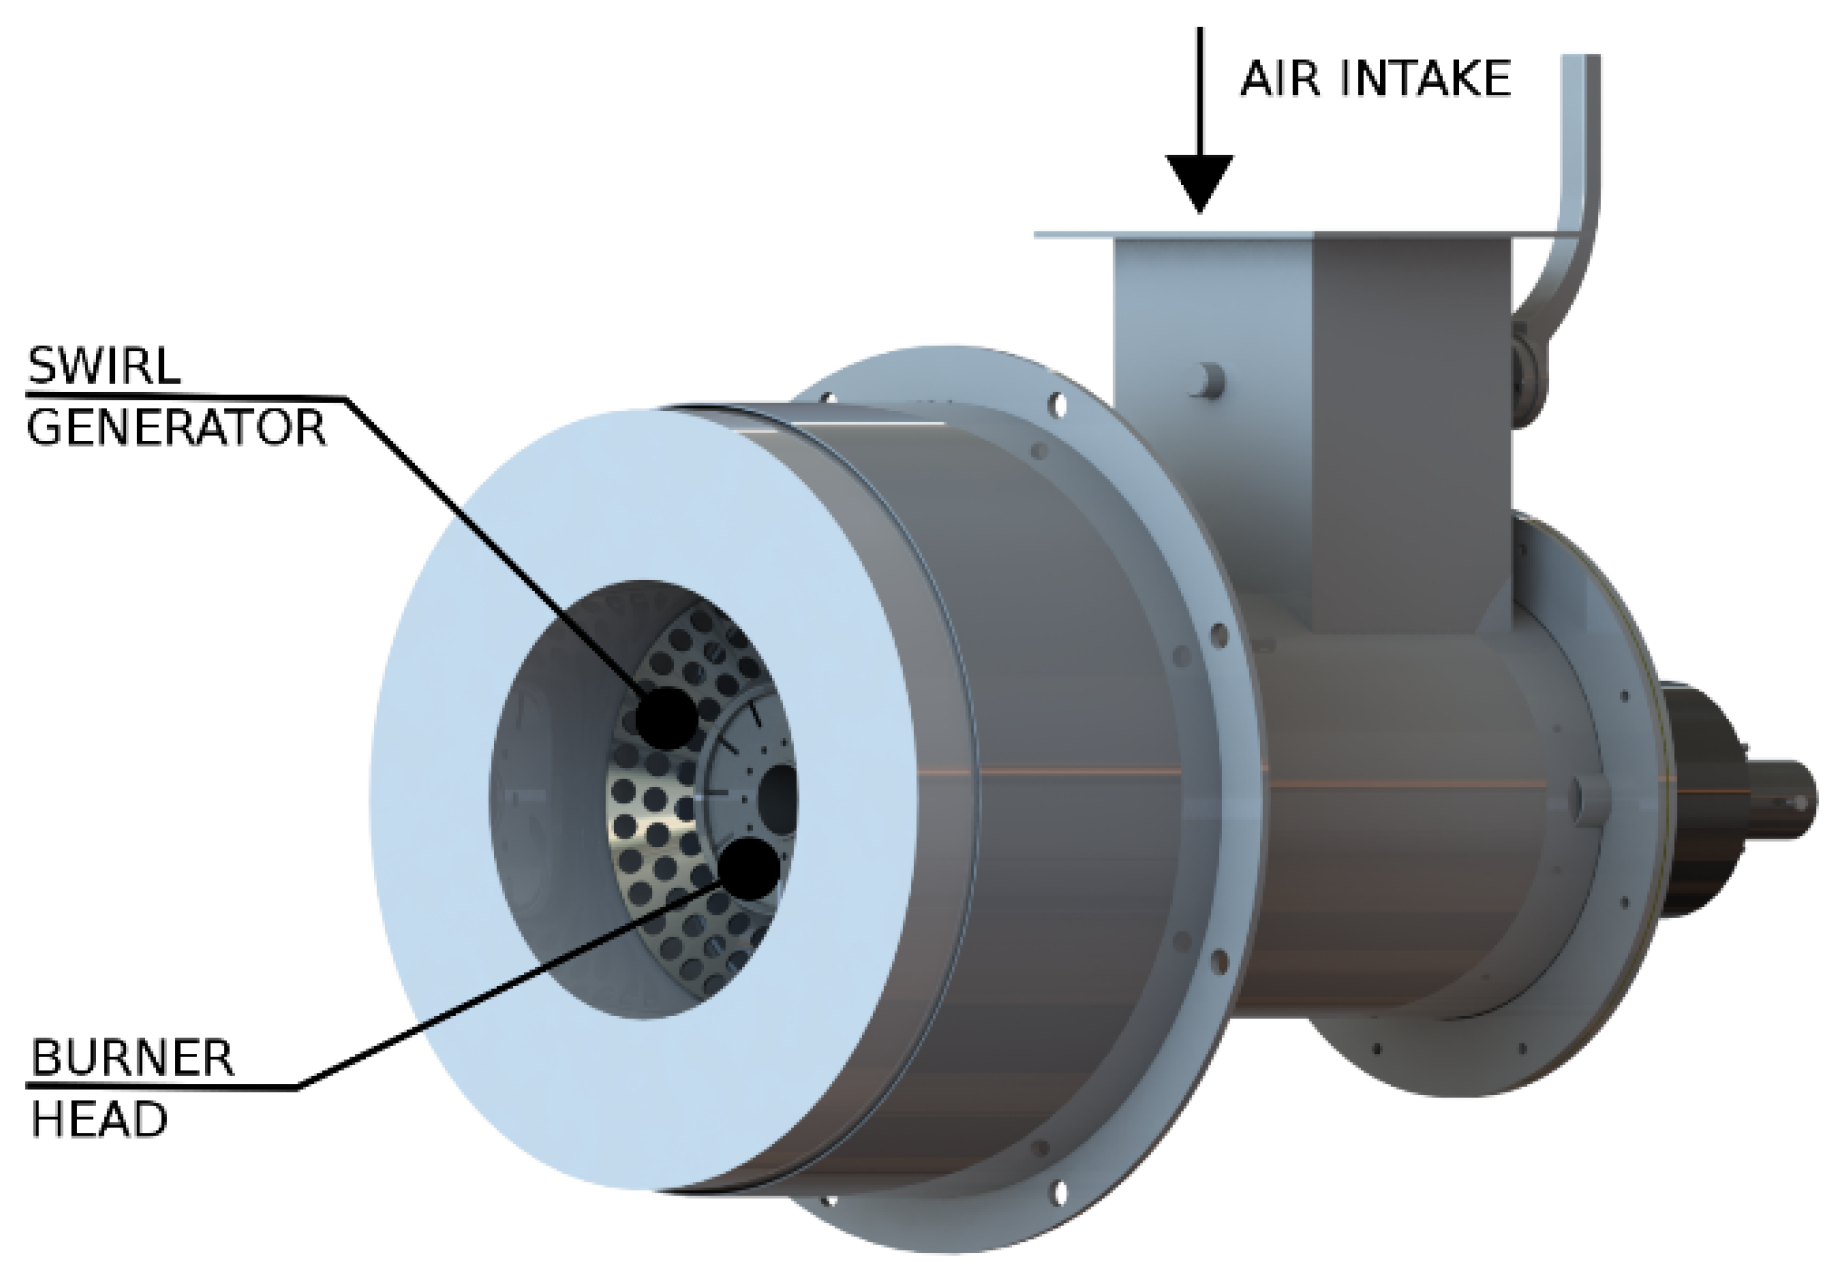
After the experiments with the two conventional burners and preliminary data evaluation, it was evident that in order to combust low-calorific fuels and achieve desired fuel flow rates, a different burner had to be used. This step was necessary mainly due to operational problems (especially the ability to reach the desired thermal output while combusting low-calorific fuel) detected using the above burners. The used burner (Burner C, Figure 4) reflects all the existing findings. The calculated dimensions and the final geometry were designed to combust low-calorific fuel with the minimal LHV of 6.9 MJ/mN3. This value is the minimum (for thermal power of 1500 kW) achievable using the presented mixing station. Low-calorific fuel with this LHV can deliver maximal thermal power, either 750 or 1500 kW, depending on the geometry of the burner head and parameters of the fuel. Burner C is designed to use the same windbox as Burner A. Therefore, it is possible to easily retrofit a conventional burner with the low-calorific burner by changing the inner placing. This burner is designed as an experimental device; many parts are replaceable and modular. For example, different types of flame holders and burner heads with different geometries and fuel distribution can be used. The main feature of the burner is that fuel and air are not staged, but both are delivered as a single stream. Once mixed in the combustion chamber, they appear as homogenous flames. Both burners’ head and swirl generator were designed to generate a turbulent flow to ensure proper low-calorific fuel and air mixing, i.e., perfect combustion.
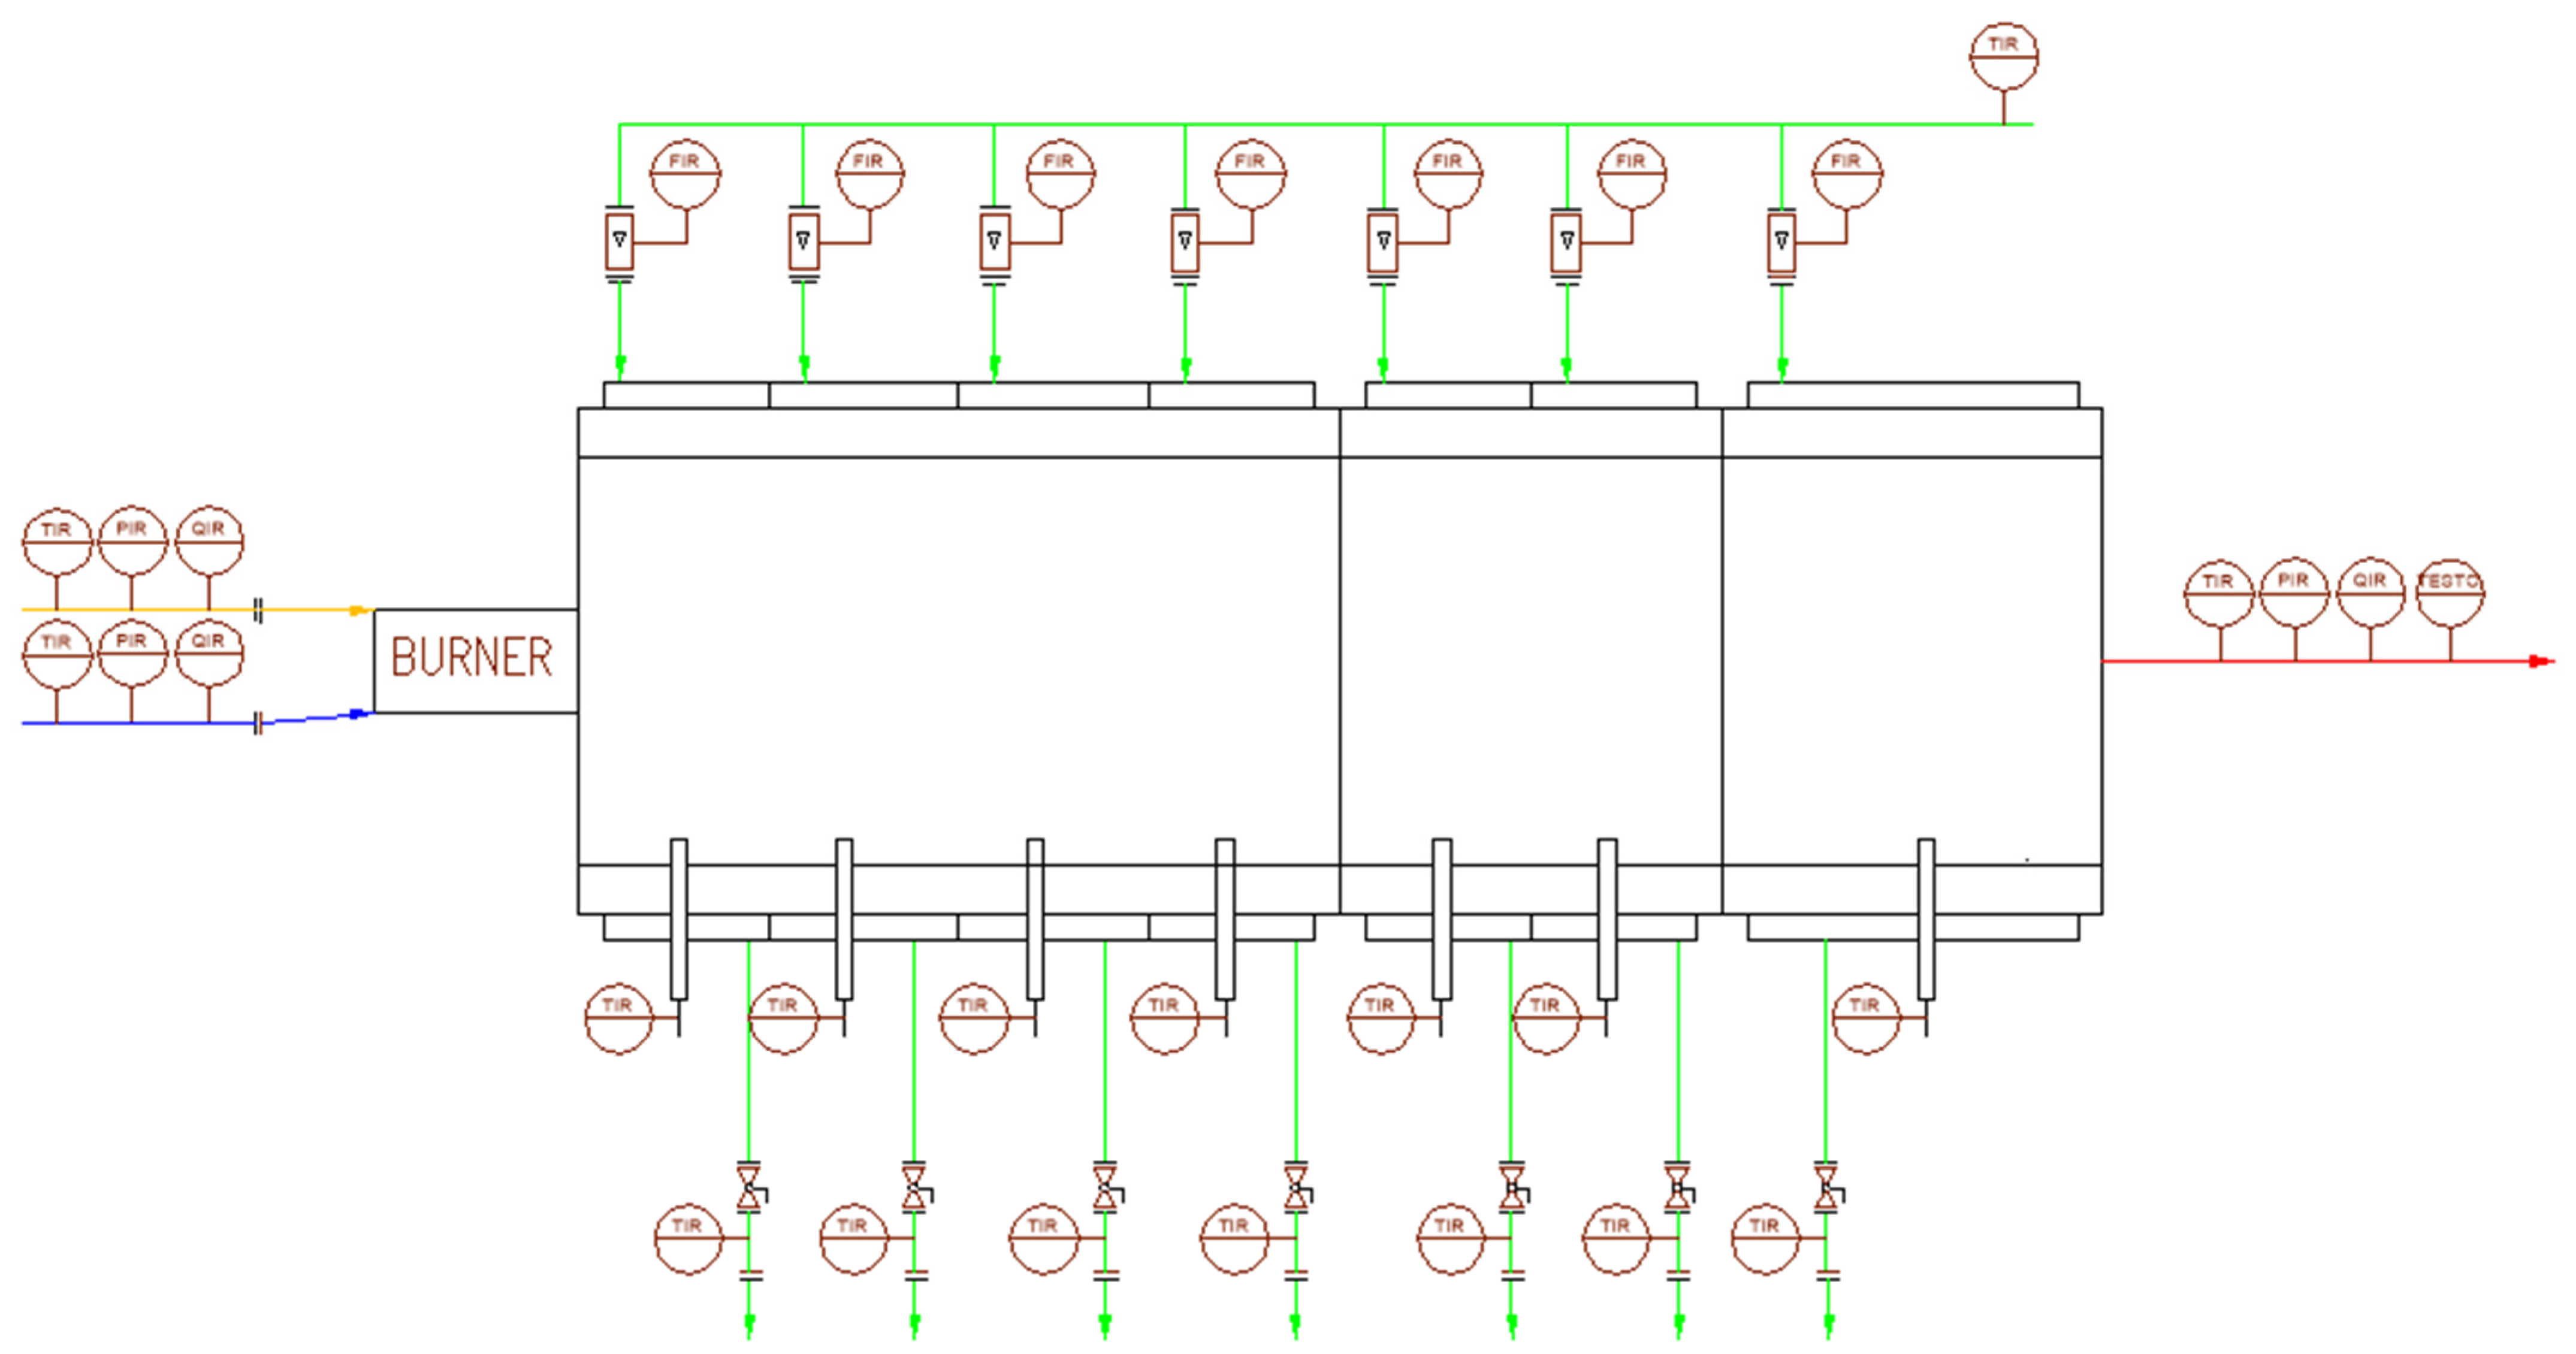
Different operational parameters were observed in the experiment. In the first test (TEST A), the influence of CO2 and N2 addition into the noble fuel on NOx emissions, flue gas temperature, and flame stability was investigated. Due to the different burner geometries, which limited the overall fuel amount that could be burned under certain conditions, an experimental matrix for each test was created to show the differences between the experiments. After each change in the combustion parameters, the combustion chamber operated for 30 min before the measurements were recorded in order to eliminate the fluctuations in the data and ensure optimal results. Furthermore, all the stated emission results were measured at 3% O2 in the flue gas at the sampling spot in the flue gas duct before connecting to the chimney. The technological scheme of the combustion chamber is shown in Figure 5.
TEST B was focused on the flame temperature. For this test, R-type thermocouples were used to measure the temperature in the horizontal plane of the flame. In total, eight R-type thermocouples were used to cover the temperatures along the horizontal plane of symmetry. Measuring points were located 50 cm from each other along the whole combustion chamber. Each thermocouple was connected to the Graphtec midi LOGGER GL220, which recorded the measured values. Temperatures were measured at six different positions: near the wall (5 cm), 10, 20, 30, 40, and 50 cm from the wall.
TEST C was focused on measurements of heat flux into the wall of the combustion chamber. This was allowed due to the unique construction of the combustion chamber, divided into seven different sections and equipped with thermocouples and flowmeters to measure cooling water properties to calculate the overall heat flux.
During TEST A, limits (both in design and technological) for each burner were revealed. Thus, for TEST B and TEST C, only a few different fuel compositions were selected, which were adjusted according to the results obtained during TEST A and to obtain data describing the trend without unnecessary waste of the fuel. Before each test, conditions in the combustion were stabilized; it was vital to control the flow rate of fuel and combustion air to achieve stable conditions. Although measurements were conducted in exact intervals, maximum effort was used to ensure the repeatability and accuracy of each test.
3. Results
3.1. TEST A—Emissions, Flame Stability, Flue Gas Temperature
The experiments with Burner A revealed that the construction of this burner is not sufficient for a dilution higher than 10 mN3/h (LHV 28.67 MJ/m3) of CO2 and 20 mN3/h (LHV 24.58 MJ/m3) of N2, as is evident from the experimental matrix for TEST A (Table 2). The limitation was that the burner head, originally designed for noble fuels, could not distribute more fuel. It was evident that it would be possible to achieve a higher flow rate with higher overpressure of fuel, but this change would affect the comparison of the results. Even though the amount of the added inert gases was low and the reduction of NOx in the flue gas was lower, it was possible to observe signs of dependence. The difference between the effect of N2 and CO2 is also evident. CO2 as a larger molecule can absorb much more heat, i.e., reduce the flame temperature, reducing NO molecules’ nucleation. Therefore, both inert gases had a direct impact on flame characteristics. A higher amount of inert gas in the fuel finally resulted in the instability of the flame. At flow rates of 20 mN3/h of CO2 and 30 mN3/h of N2, the flame core became much colder, and a high amount of CO was measured in the flue gas. It could also be noticed that the flame with more inert gas in the fuel changed its color from yellow to blue and became much more stable (the flame was visually sharper) until it reached the turning point, and the flame had the tendency to quench. Results of TEST A for Burner A are shown in Table 3.
The geometry of Burner B was designed for a higher thermal output than that of Burner A. Therefore, it is possible to add more inert gases into the fuel. This burner combusts all the fuel in the primary regime, and, for NOx reduction, the secondary air distribution is used. In both primary and secondary regimes, up to 60 mN3/h (LHV 15.64 MJ/m3) of CO2 and N2 was added. All the fuel was in a single stream, creating better burning conditions for low-calorific fuel compared to Burner A. Hence, it was possible to achieve higher flow rates with good flame stability. The reduction of NOx was rapid, and its trend was apparent. Assumptions from the measurement with Burner A were confirmed. CO2 affects the reduction more than N2, as is evident from the results in Table 4. In both cases, a higher content of non-combustible compound resulted in higher outlet nozzle velocities. This phenomenon improved the flame stability and intensified the mixing of fuel and combustion air. Although the flame was stable during the whole process/test, the color of the flame turned from yellow to blue as the flame temperature dropped. The experimental matrix for Burner B is shown in Table 4, while the measured values are summarized in Table 5.
Burner C was designed for high flow rates at the burner head; therefore, the flame was unstable during the combustion of natural gas without any nitrogen or carbon dioxide. As a result, fuel mixing with combustion air was insufficient, and it was possible to observe a long flame (3 m). The addition of nitrogen and carbon dioxide changed the flame characteristics, the flame became shorter, and almost all the yellow color in the flame was substituted with the blue color. With the addition of 120 mN3/h of N2 in the fuel, the flame was only 1.5 m long, or 1 m for CO2. Due to the high velocity at the tip of the burner head, proper mixing of fuel and combustion air was ensured because of the high turbulent flow.
Nevertheless, the burner was designed even for higher flow rates. It was impossible to increase the ratio of inert compounds in the fuel because of the insufficient flow from the bundles. The regime with CO2 addition was evaluated as highly problematic; at high flow rates, such as 120 mN3/h of CO2, the remaining CO2 in the cylinders completely froze off, and a further increase in flow rate was not possible. The experimental matrix for Burner C is shown in Table 6, and the measured values are displayed in Table 7.
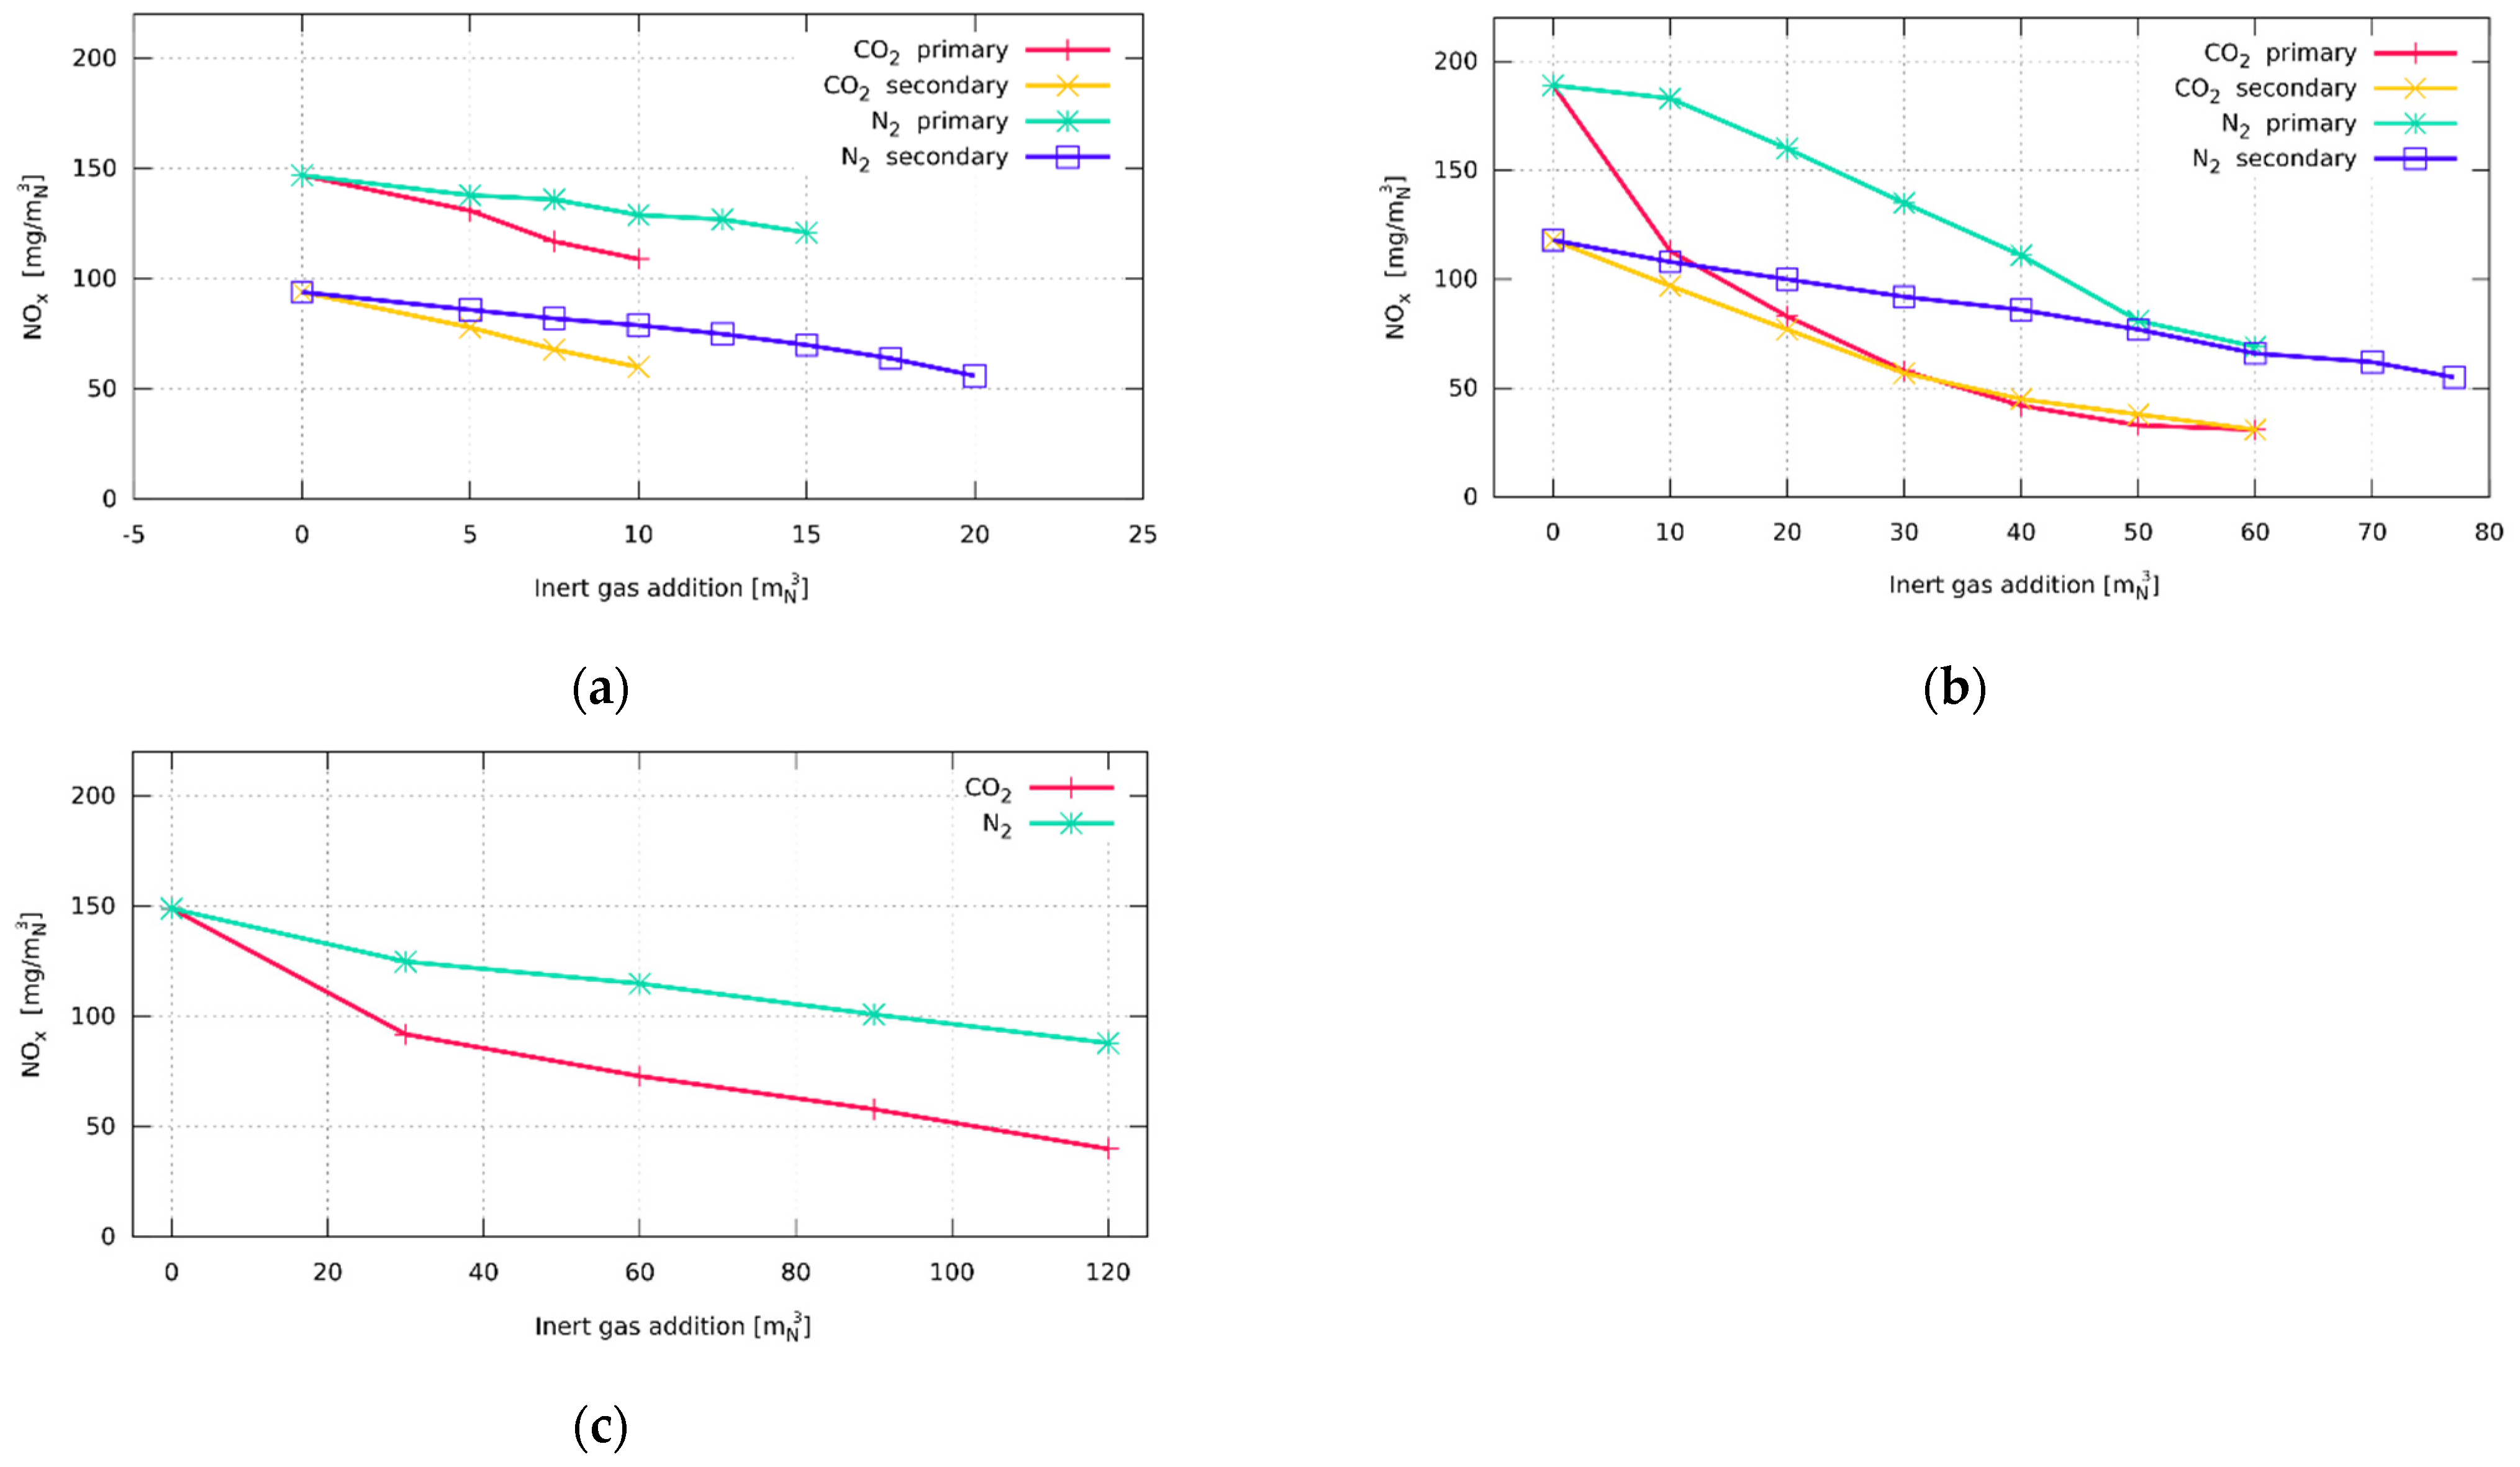
The measured values for all regimes indicated in the previous matrixes were displayed in graphs in order to understand the acquired data better. In all figures, a similar trend is visible. When inert gas was added, measured NOx in the flue gas started to drop, corresponding with the temperature decrease. The values for the burner with staged fuel distribution can be seen in Figure 6a. Since added inert gases were relatively low, the change was also mild. Figure 6b shows a more significant decrease, where measured data for the burner with staged air are presented. A similar pattern can be observed in Figure 6c, displaying measured values on a low-calorific burner.
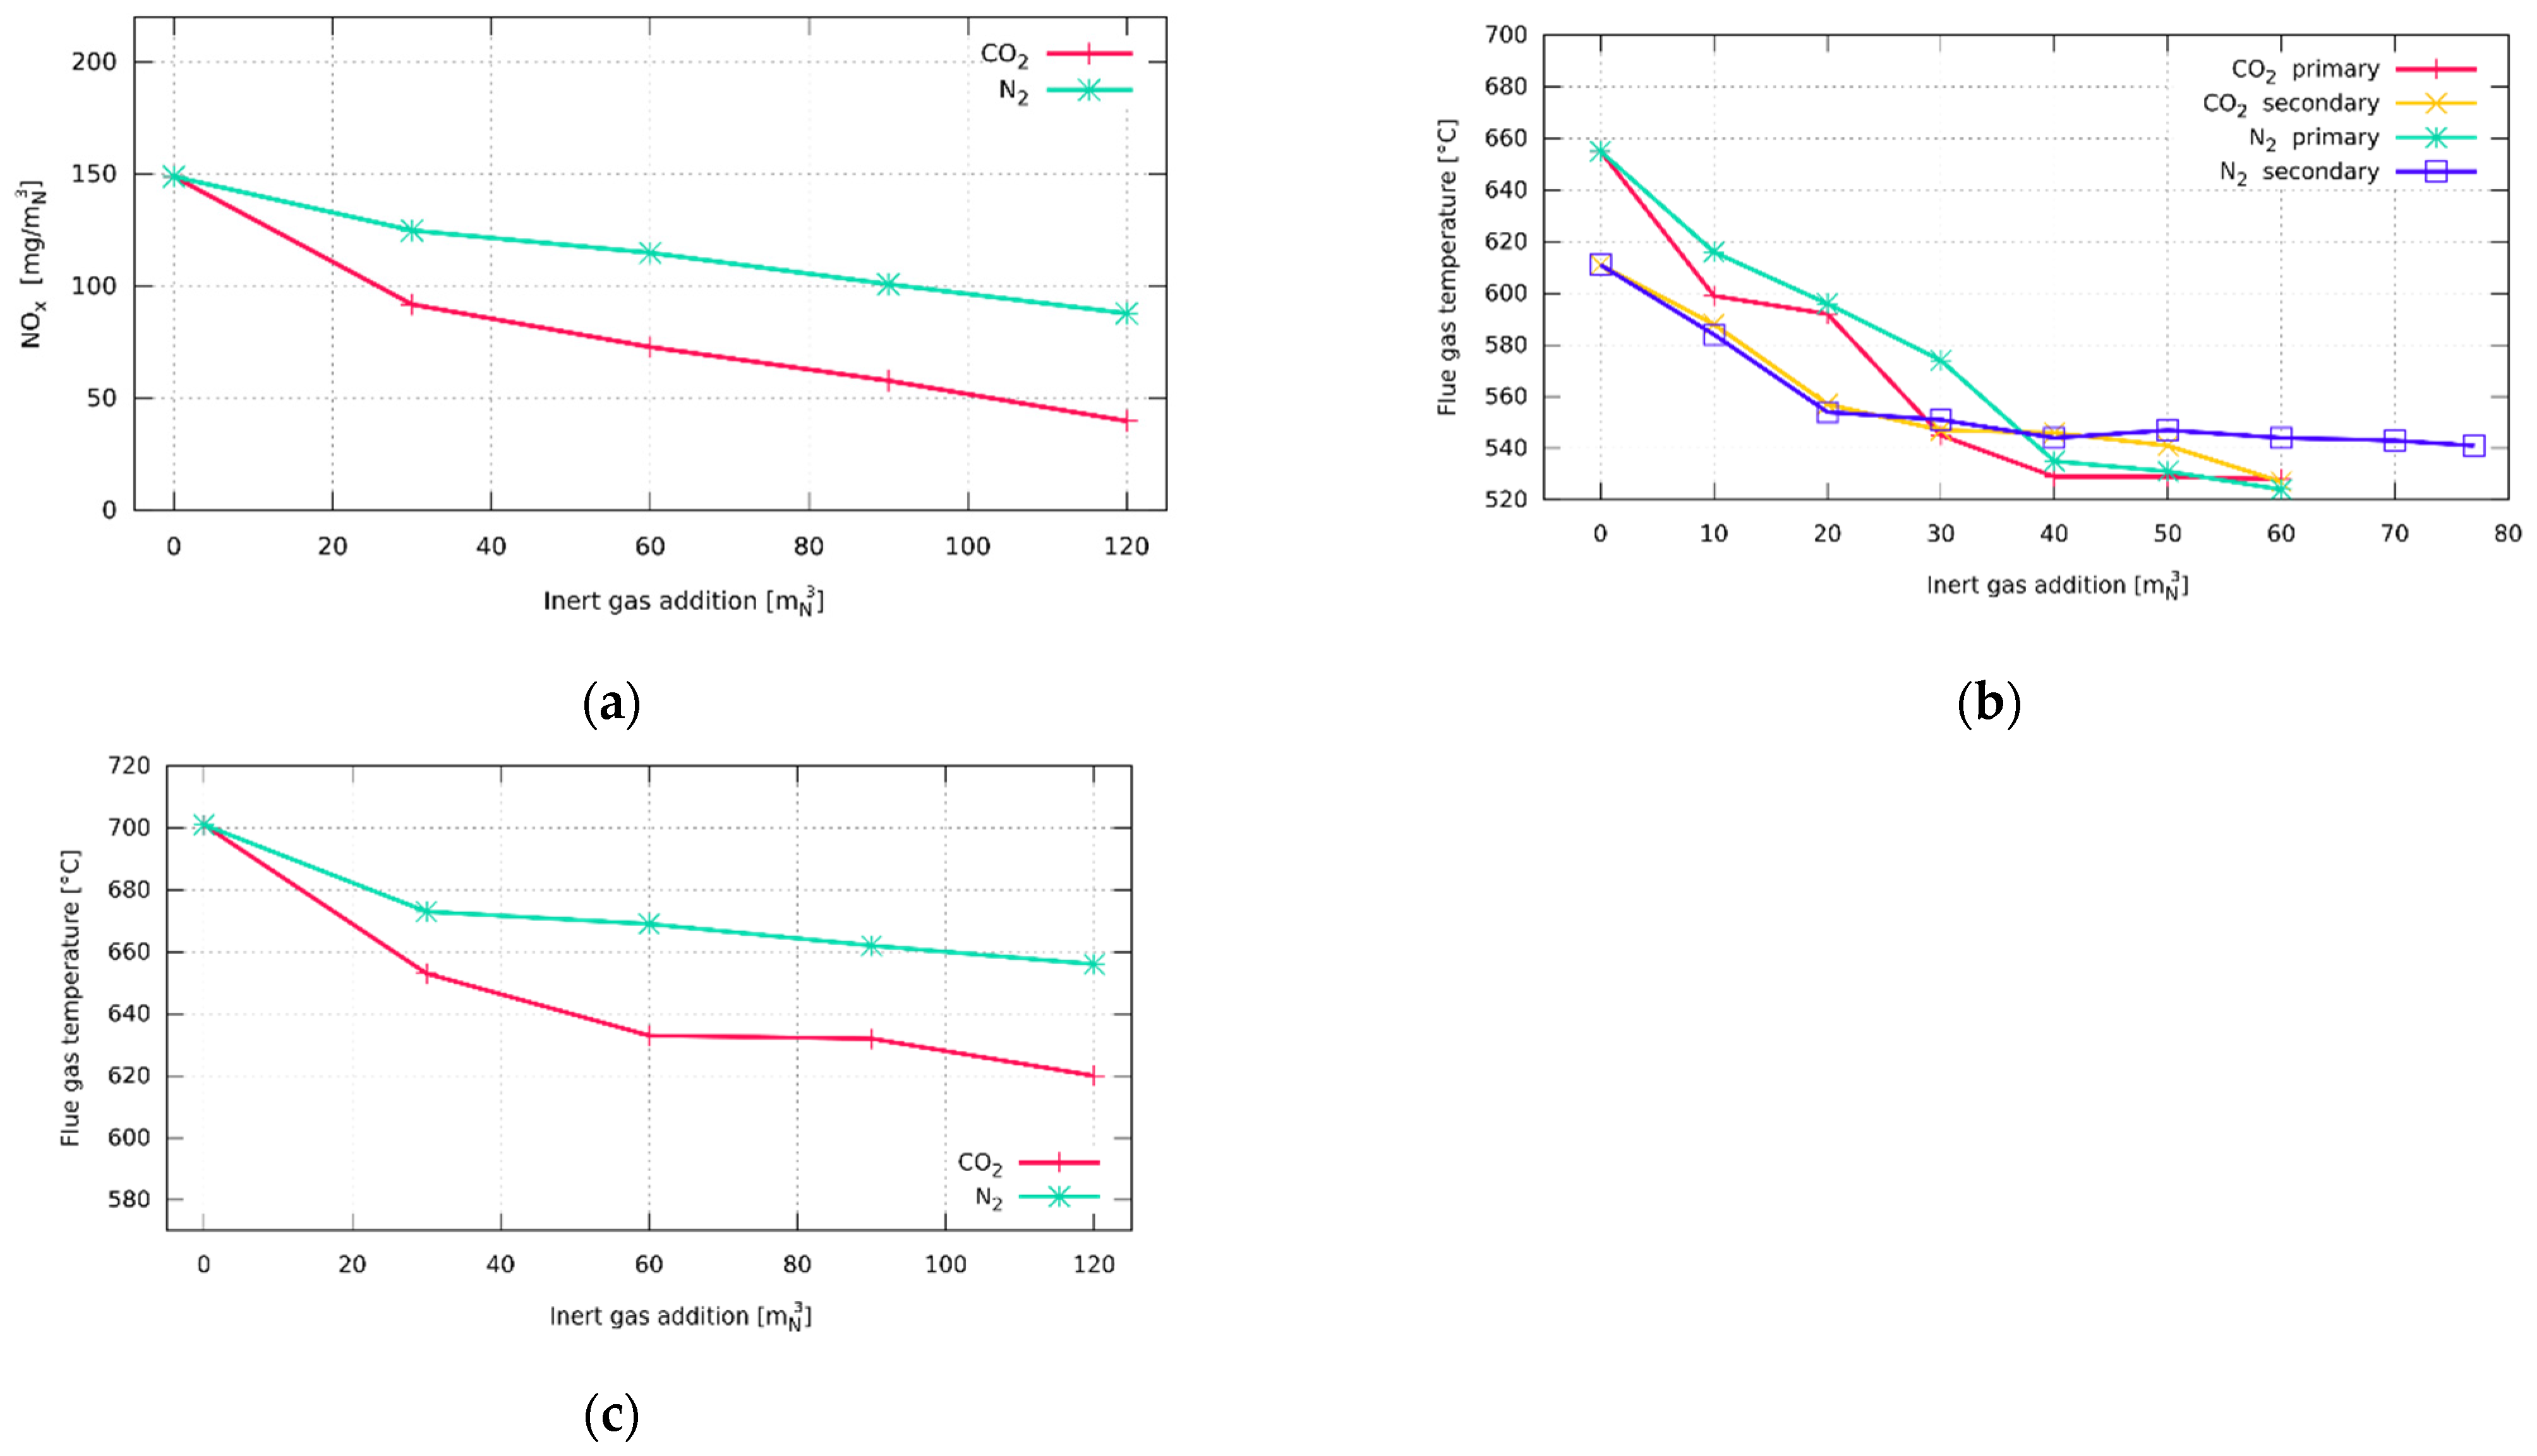
Temperatures of the flue gas are also presented in the graphs in Figure 7. As mentioned above, when inert gas is present in the fuel, it immediately impacts the temperature, which, in general, decreases. The values for the burner with staged fuel distribution can be seen in Figure 7a. In this case, the opposite trend is evident. The temperature is increasing with added inert gas. The cause of this could be the higher outlet speed of the fuel, which leads to enhanced mixing and a more intensive reaction. Figure 7b shows a decrease, where measured data for the burner with staged air are presented. A similar pattern can be observed in Figure 7c, displaying measured values on a low-calorific burner.
3.2. TEST B—Inflame Temperature
During the second sequence of the experiment, the temperature in the horizontal plane of the flame was measured. Although different fuel compositions were selected, both conventional burners were used to carry out the test. The amount of added diluent can be seen in the experimental matrix shown in Table 5. These data are valid for Burners A and B. Even though it was possible to achieve higher dilution for Burner A to ensure high flame stability and compare both inert gases at the same volumetric flow rate, temperatures had to be measured with the addition of 10 mN3/h for both inert gases. Temperature measurements on Burner C followed, and the experimental matrix for this burner was identical to those for previous tests (Table 8).
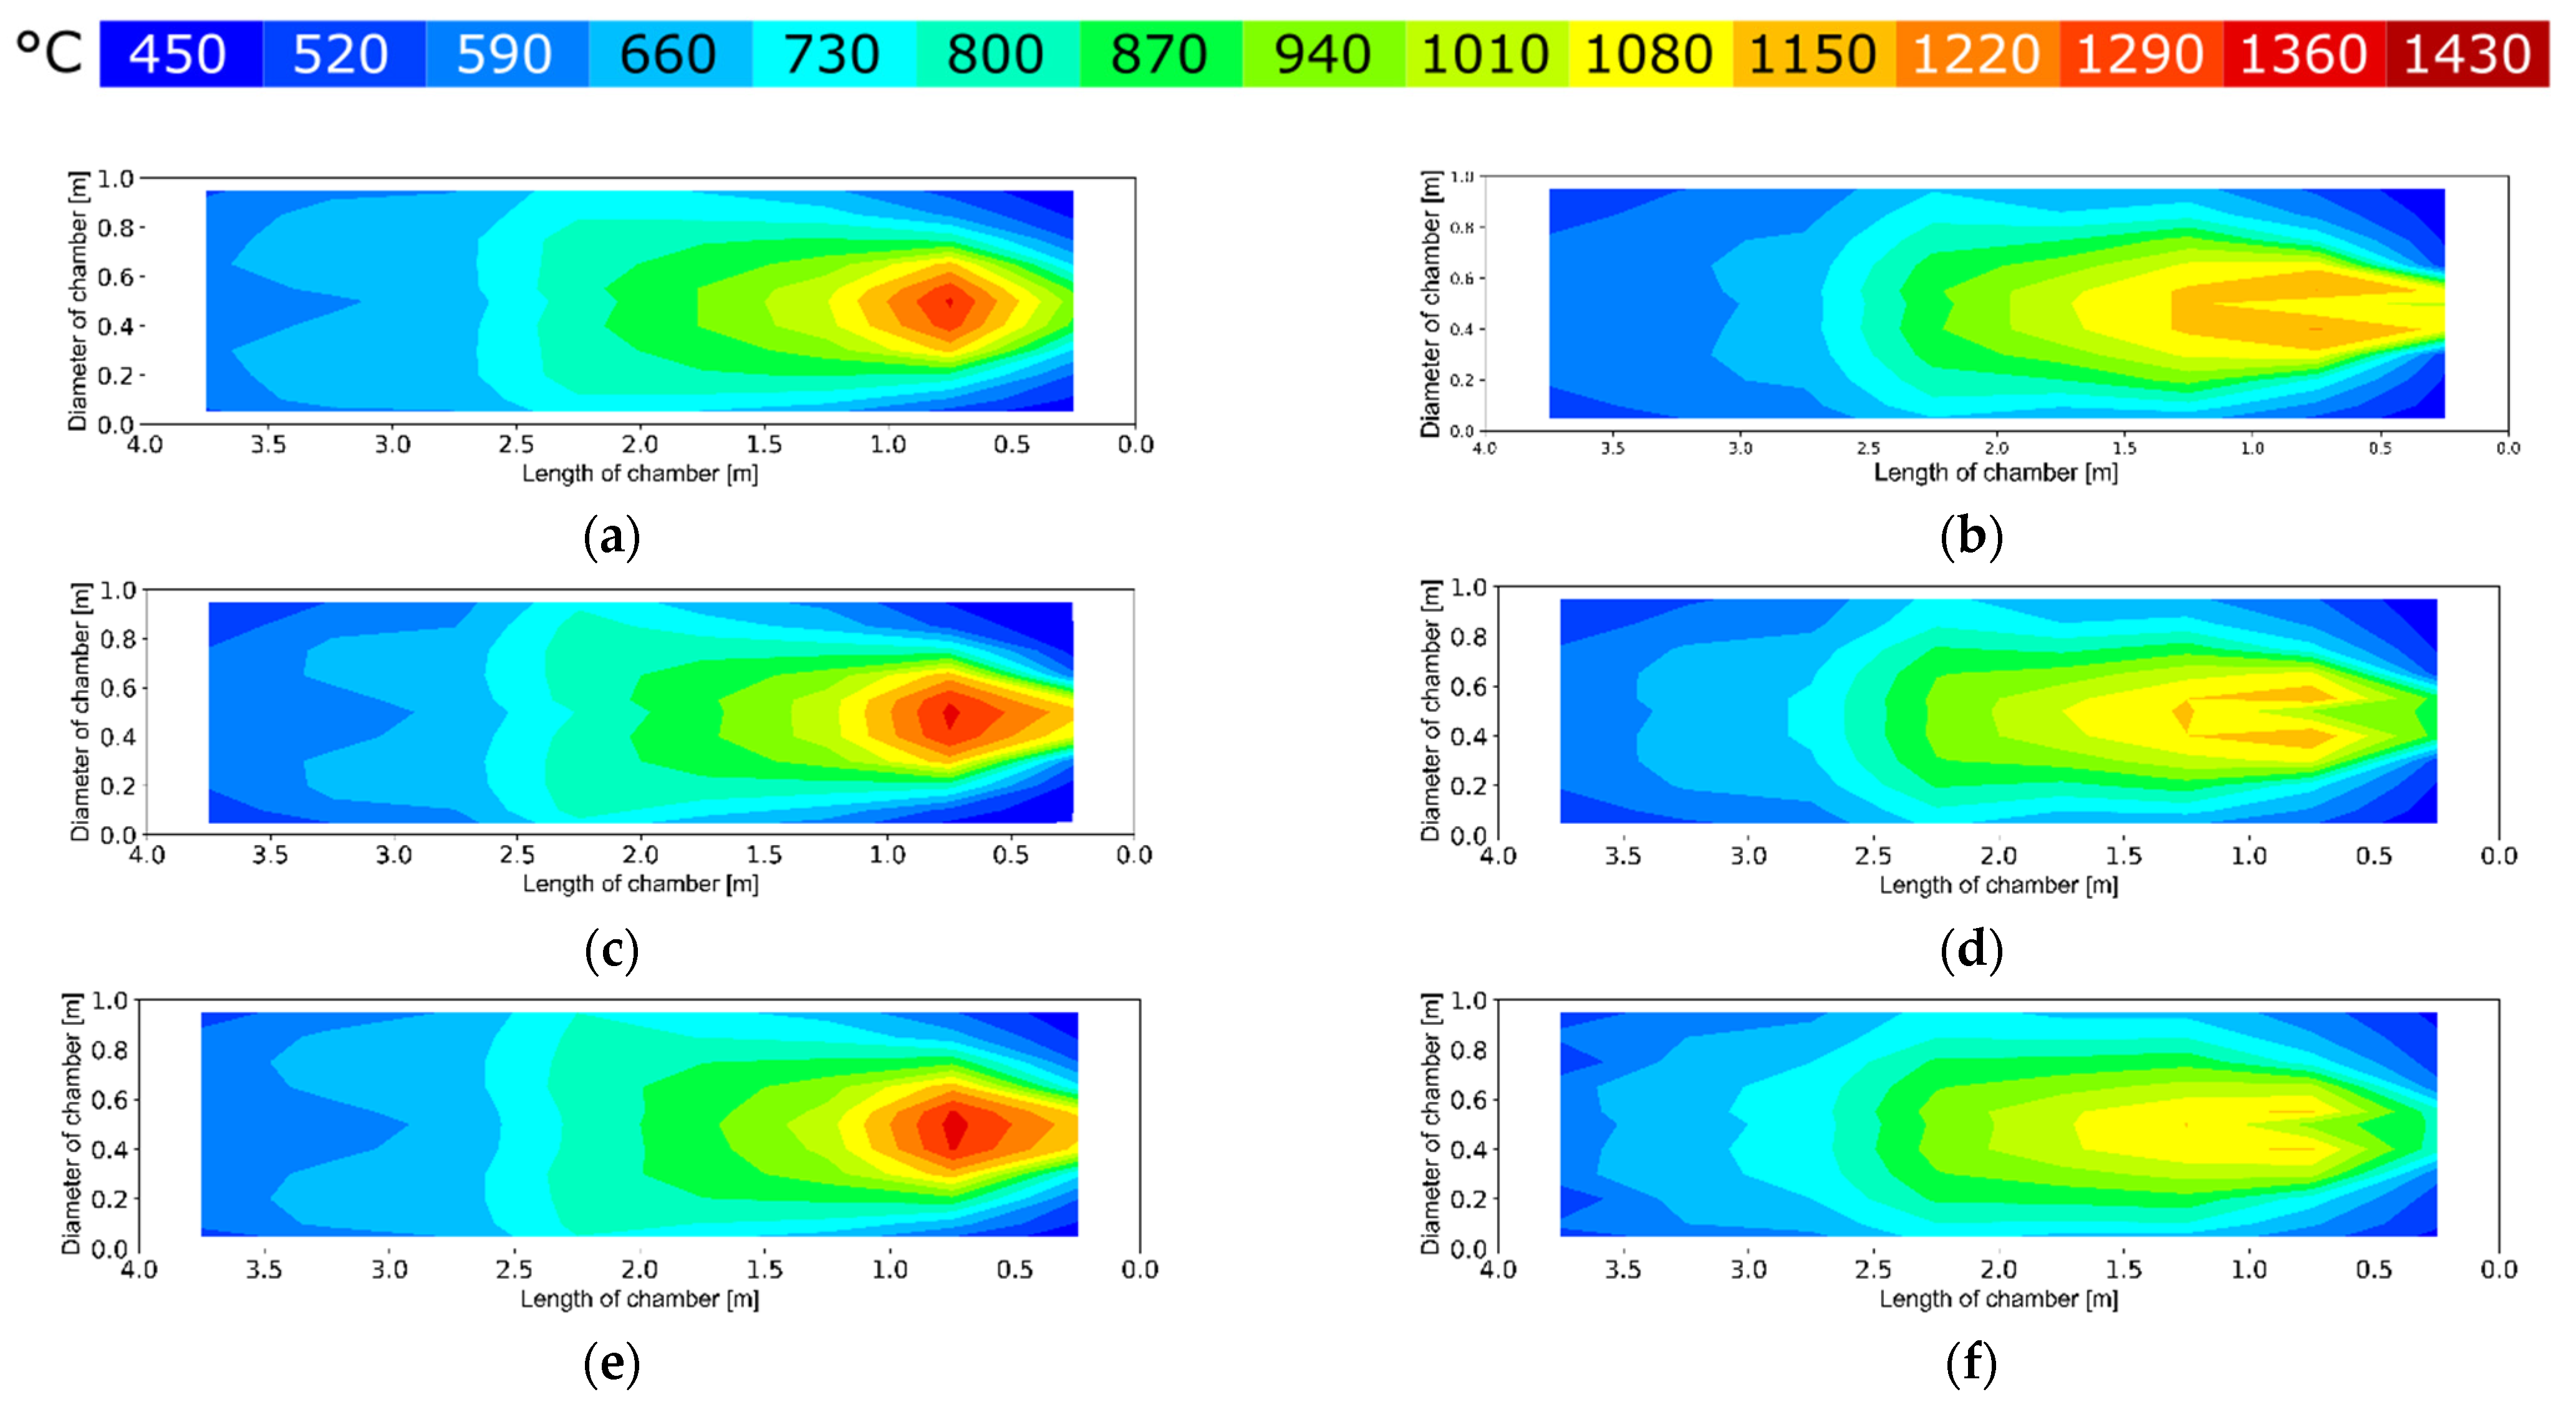
Measured inflame temperatures for Burner A, operated in both primary and secondary regimes, are shown in Figure 8. Each figure represents different fuel compositions; on the left-hand side, temperature measurements were obtained in the primary regime, where all the fuel was distributed through the center of the burner. It is possible to observe the change in the temperature field when the inert gas is present in the fuel (higher for CO2, more minor for N2). A basic pattern with no inert gas addition is shown in Figure 8a. It is possible to see temperatures approaching 1350 °C. When adding both N2 and CO2, it is possible to see an intensified flame in the core (higher temperatures) but with a slight drop towards the end of the chamber. When CO2 was added, the flame was slightly colder than with N2, but core temperatures were still higher than during the combustion of the natural gas. Even with this phenomenon, NOx dropped, as described in the previous section. A temperature decrease is evident when the secondary regime is compared to the primary regime once the inert gas is added. It is also apparent that the flame pattern is different from the primary regime. In the secondary regime flame, the core was wider and longer, and, close to the exit of the combustion chamber, the temperature dropped significantly. Temperatures measured when combusting the natural gas without any inert gas are shown in Figure 8b; temperature patterns measured in the secondary regime can be seen on the right-hand side. The addition of the inert gas resulted in a temperature decrease all over the flame, and it is evident that CO2 absorbed more heat than N2. Only in the flame core during the primary regime, a minor increase in the temperature in the flame core is noticeable. However, even with this change, the measurement of NOx emissions was lower after the natural gas dilution, as was discussed previously.
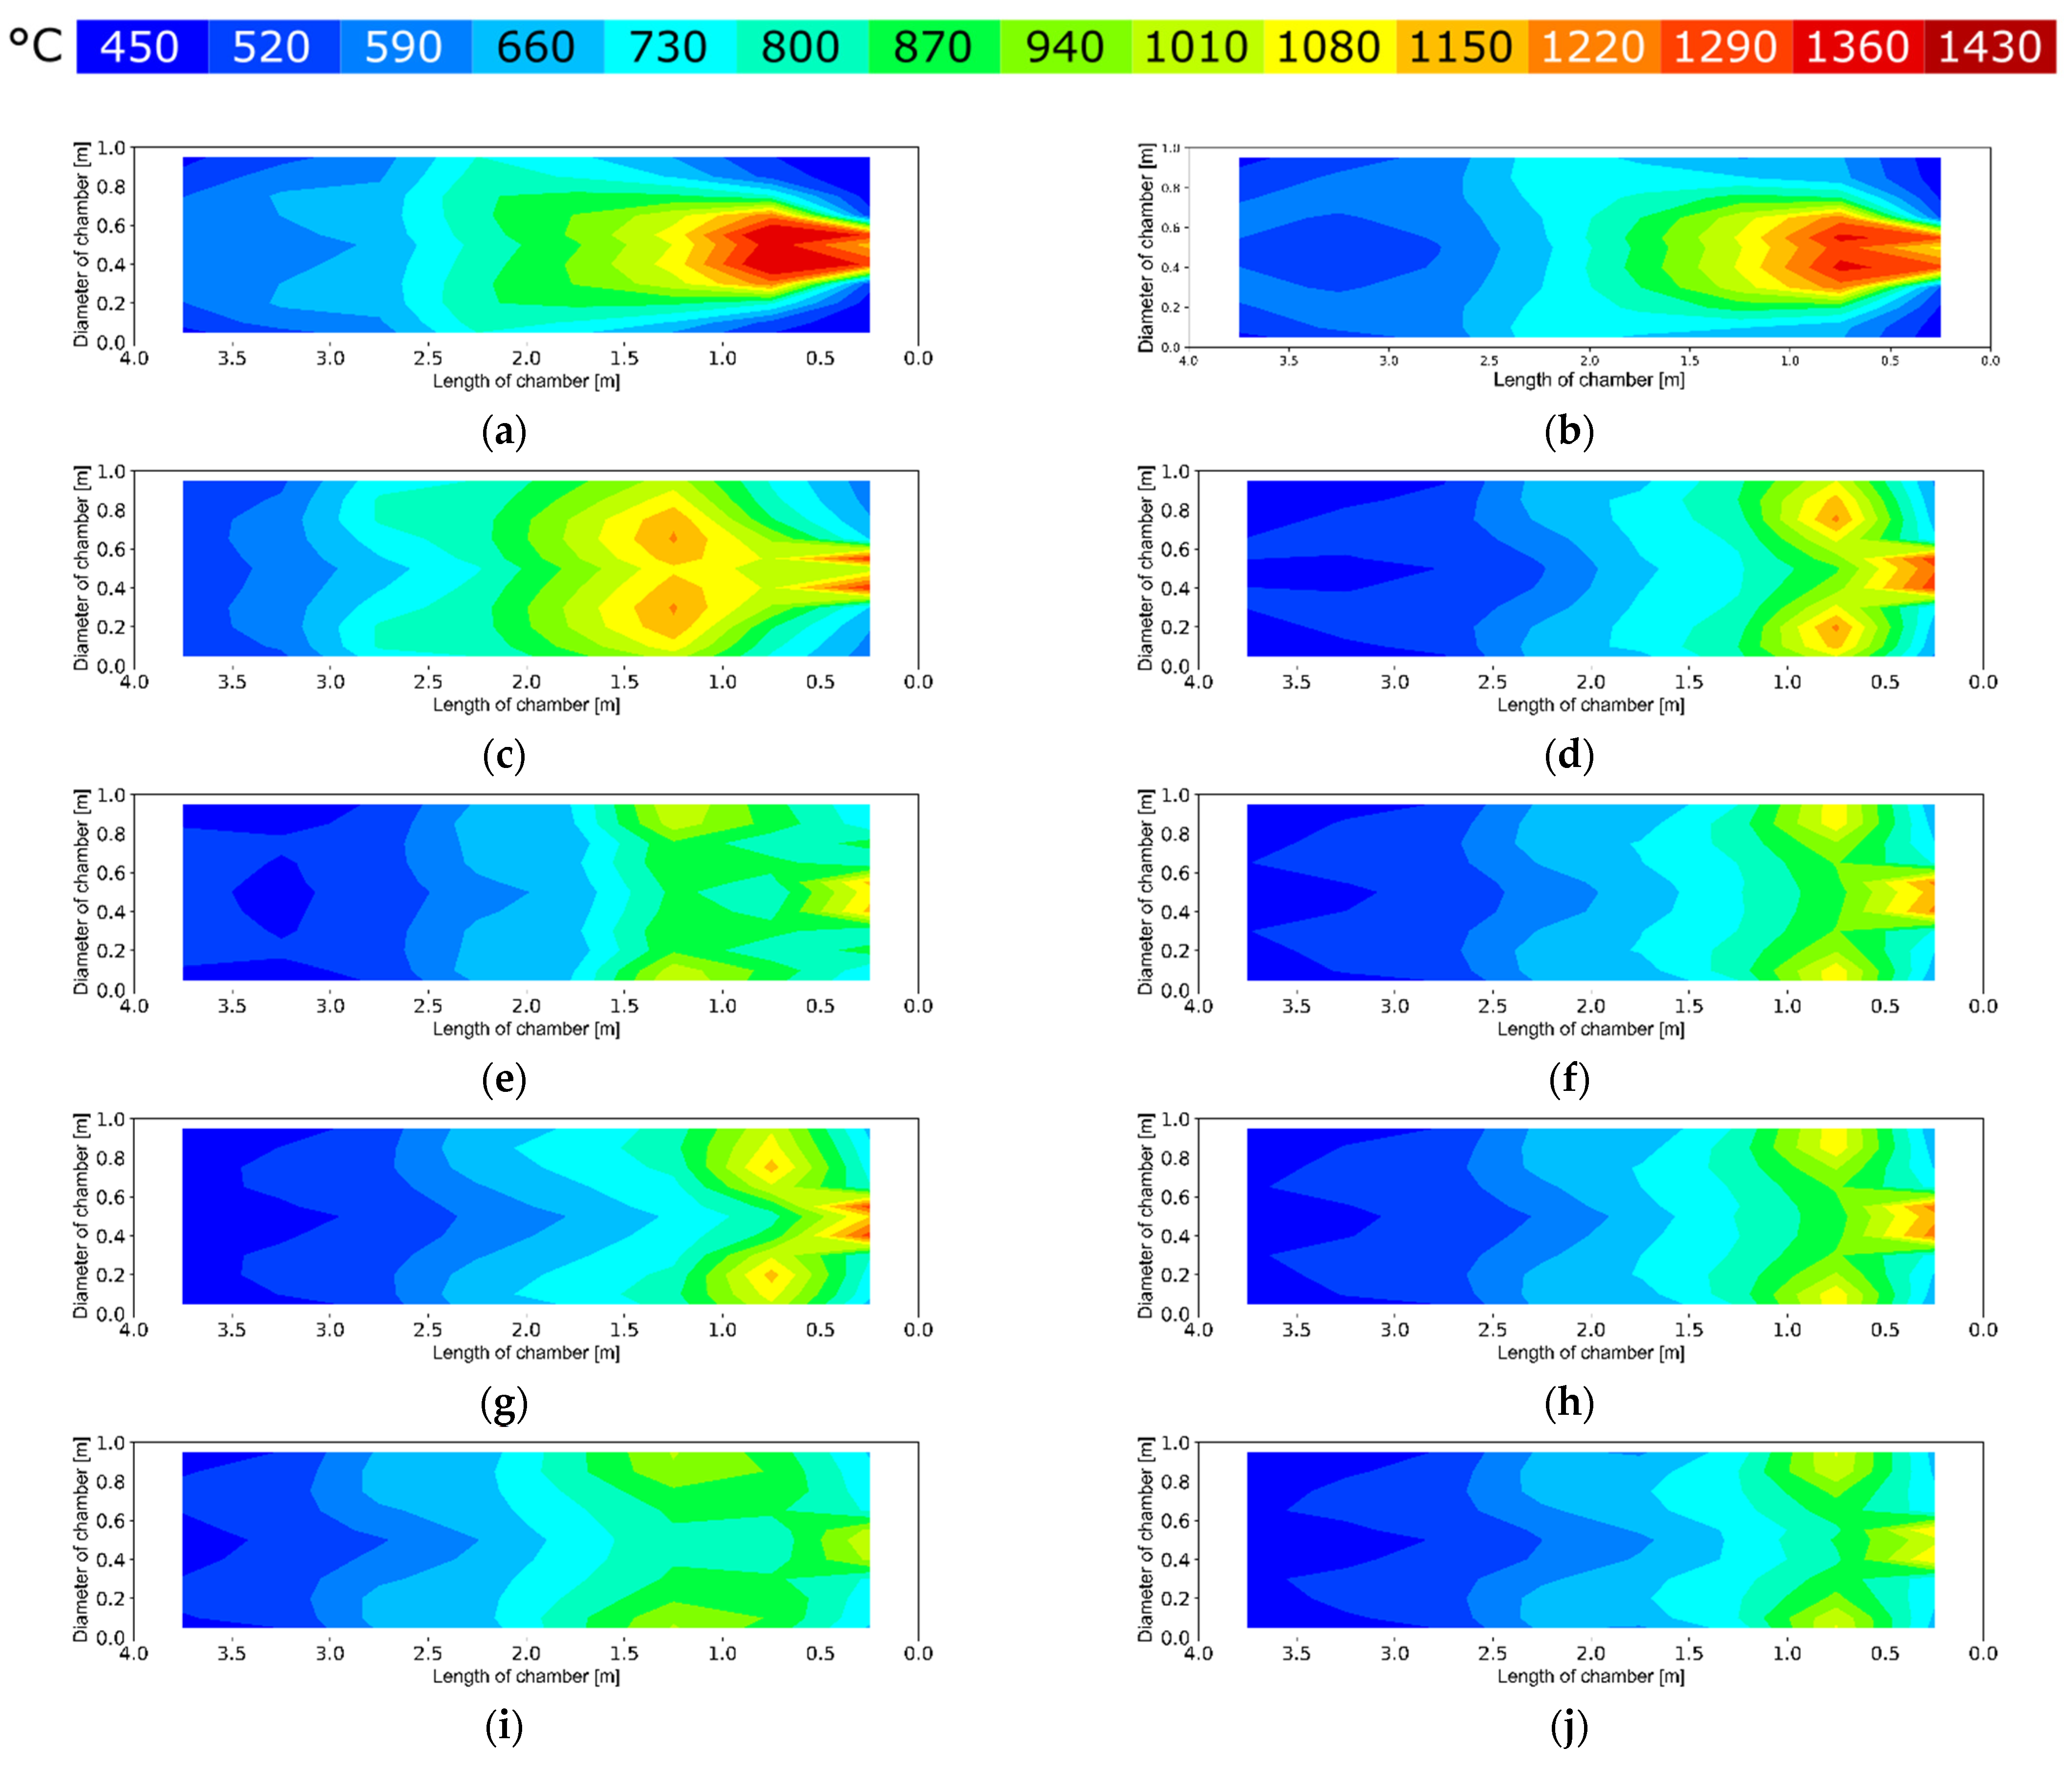
A more significant change in temperature distribution was observed in the experiment with Burner B, as is evident from Figure 9. With natural gas combustion, in both the primary and secondary regimes, temperatures approaching 1350 °C can be seen. The flame in the primary regime tends to be longer and narrower, with higher temperatures in the core of the flame, while a shorter and wider flame is observed in the secondary regime. When the inert gas was added, the flame became shorter and wider. Moreover, the flame core was shortened, and it was possible to observe single fuel streams coming out of the ports on the burner head. These findings were confirmed when the temperature fields were analyzed. In both regimes, the flame was cooled down by the inert gases, and it was possible to see a reduction in peak temperatures, as is obvious from Figure 9; most of the heat was released in the first half of the combustion chamber. Increasing the concentration of inert gas in the fuel resulted in a significant temperature drop in the second half of the chamber.
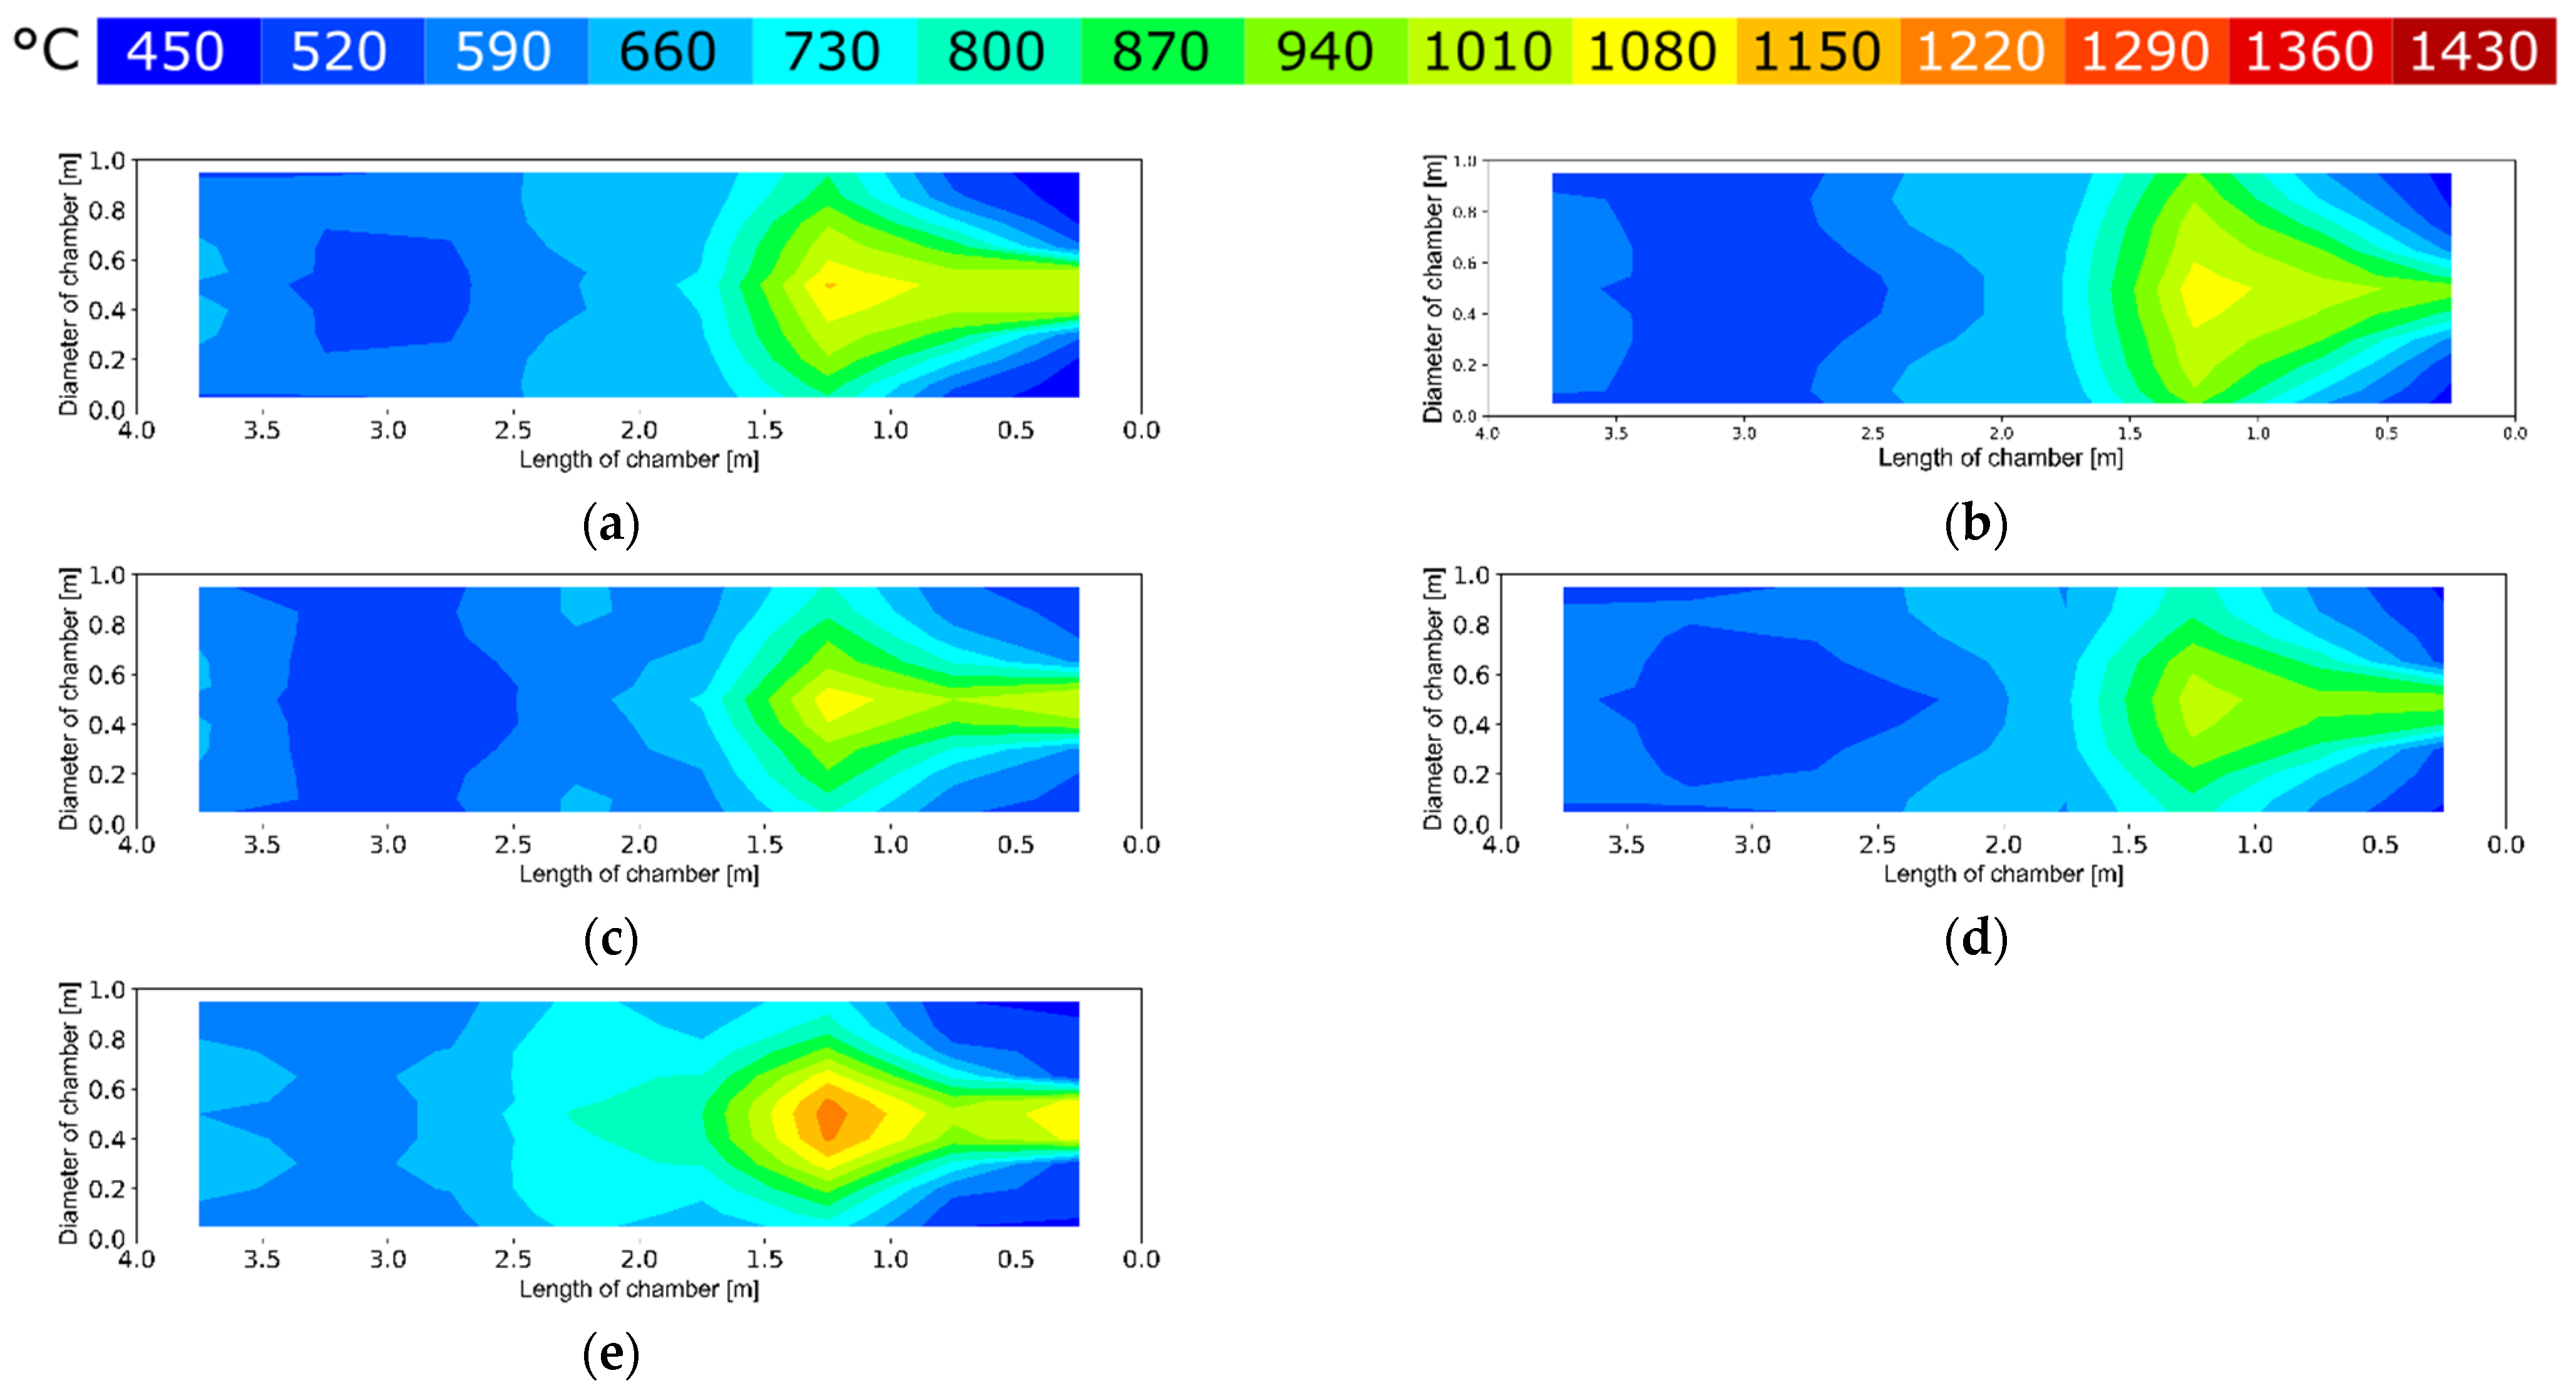
The head of Burner C was explicitly designed for the combustion of low-calorific fuel (i.e., larger fuel volume) and did not perform well when combusting the natural gas. Therefore, the improper mixing described in TEST A is also evident in Figure 10e. Once the inert gas was added, the flame was stabilized, and mixing was improved. The trend observed in the previous experiments was confirmed. CO2 has a much higher capacity to absorb more heat and lower the temperature of the flame. Even though the test was carried out with the dilution of 30 and 90 mN3/h of both N2 and CO2, measured temperatures are not presented because the difference was not significant.
3.3. TEST C—Heat Flux
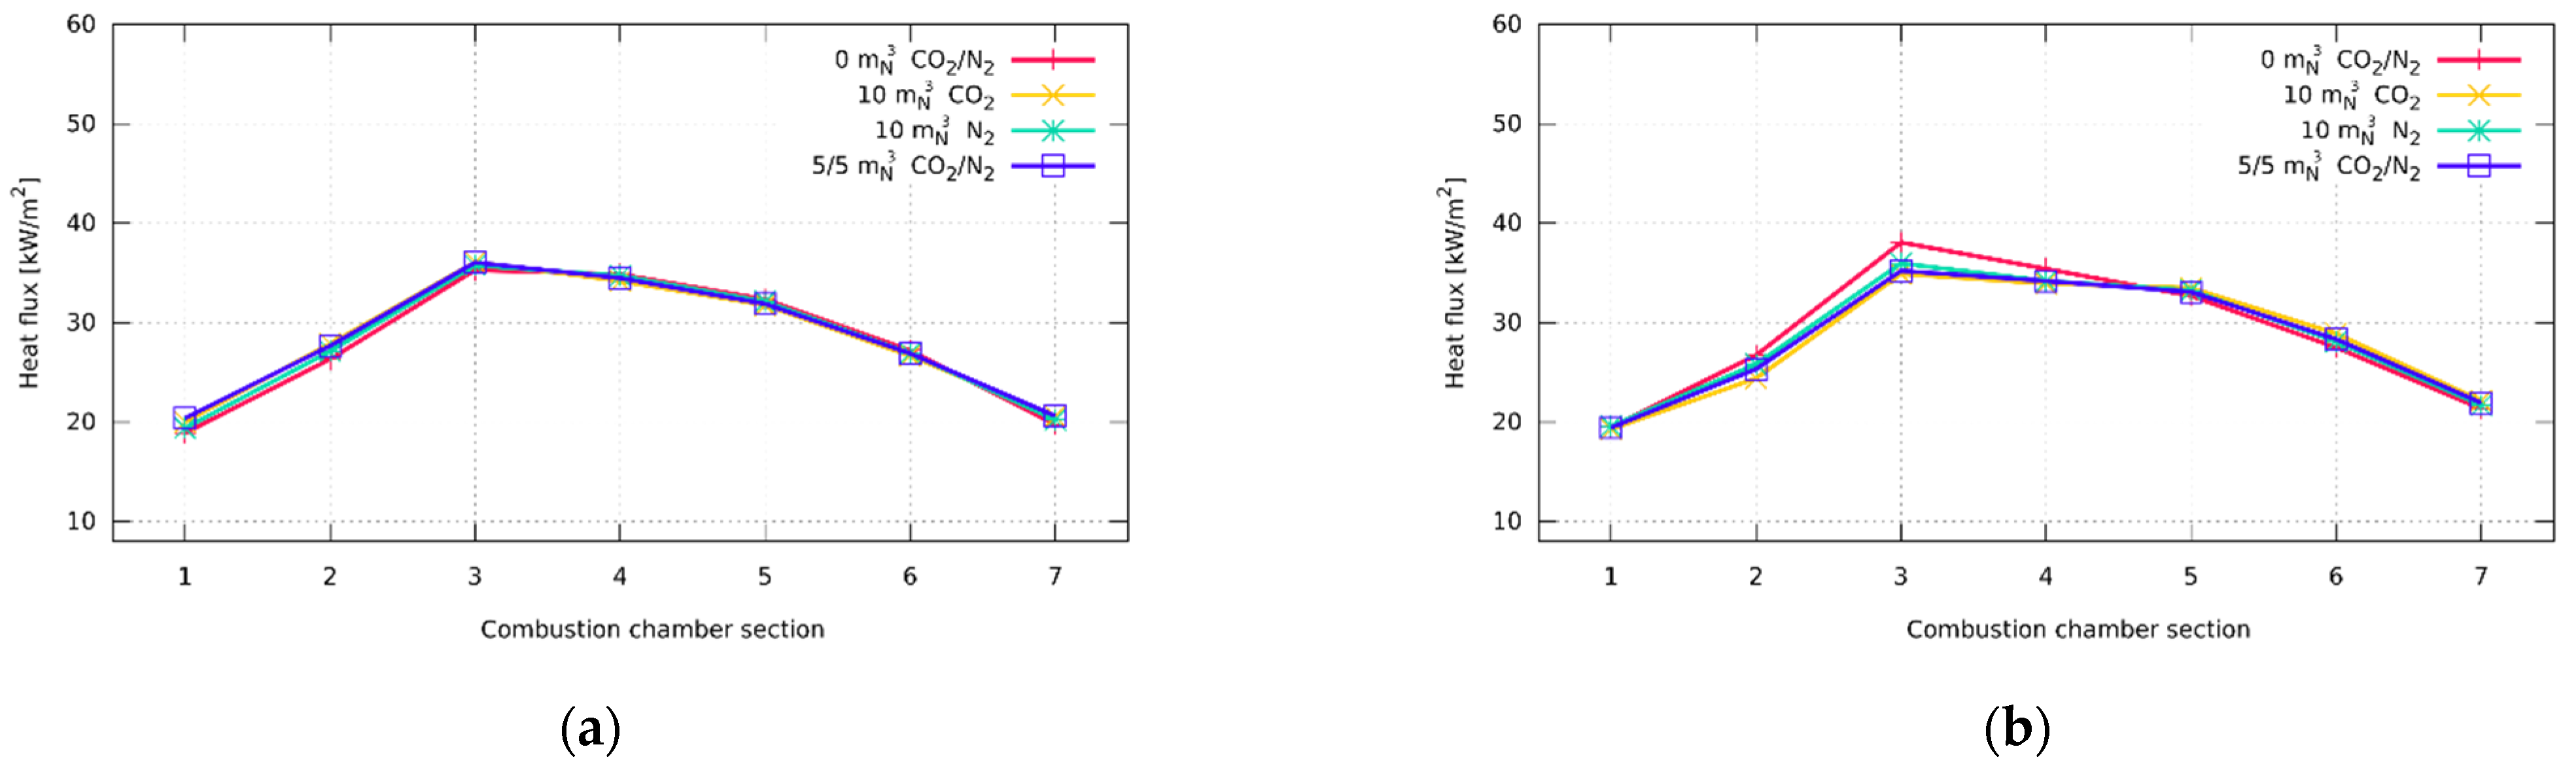
Once the data collection of the heat flux started, the cooling water flow was kept constant in all combustion chamber sections, and the temperature difference between the inlet and outlet was measured. The heat flux was evaluated after a strictly defined interval when the system was stabilized. Comparing the collected data on the Burner A, it is almost impossible to describe any changes in the heat flux because, after the addition of inert gas, only a small change in the heat flux distribution in the chamber could be observed. Furthermore, the total heat flux remained almost without any major changes. In other words, the added amount of inert gas was not sufficient to conclude the direction of a trend, as can be seen in Figure 11. Only in the secondary regime, after the inert gas addition, a decrease in transferred heat flux in the third section could be seen as a result of lower temperatures in the flame core.
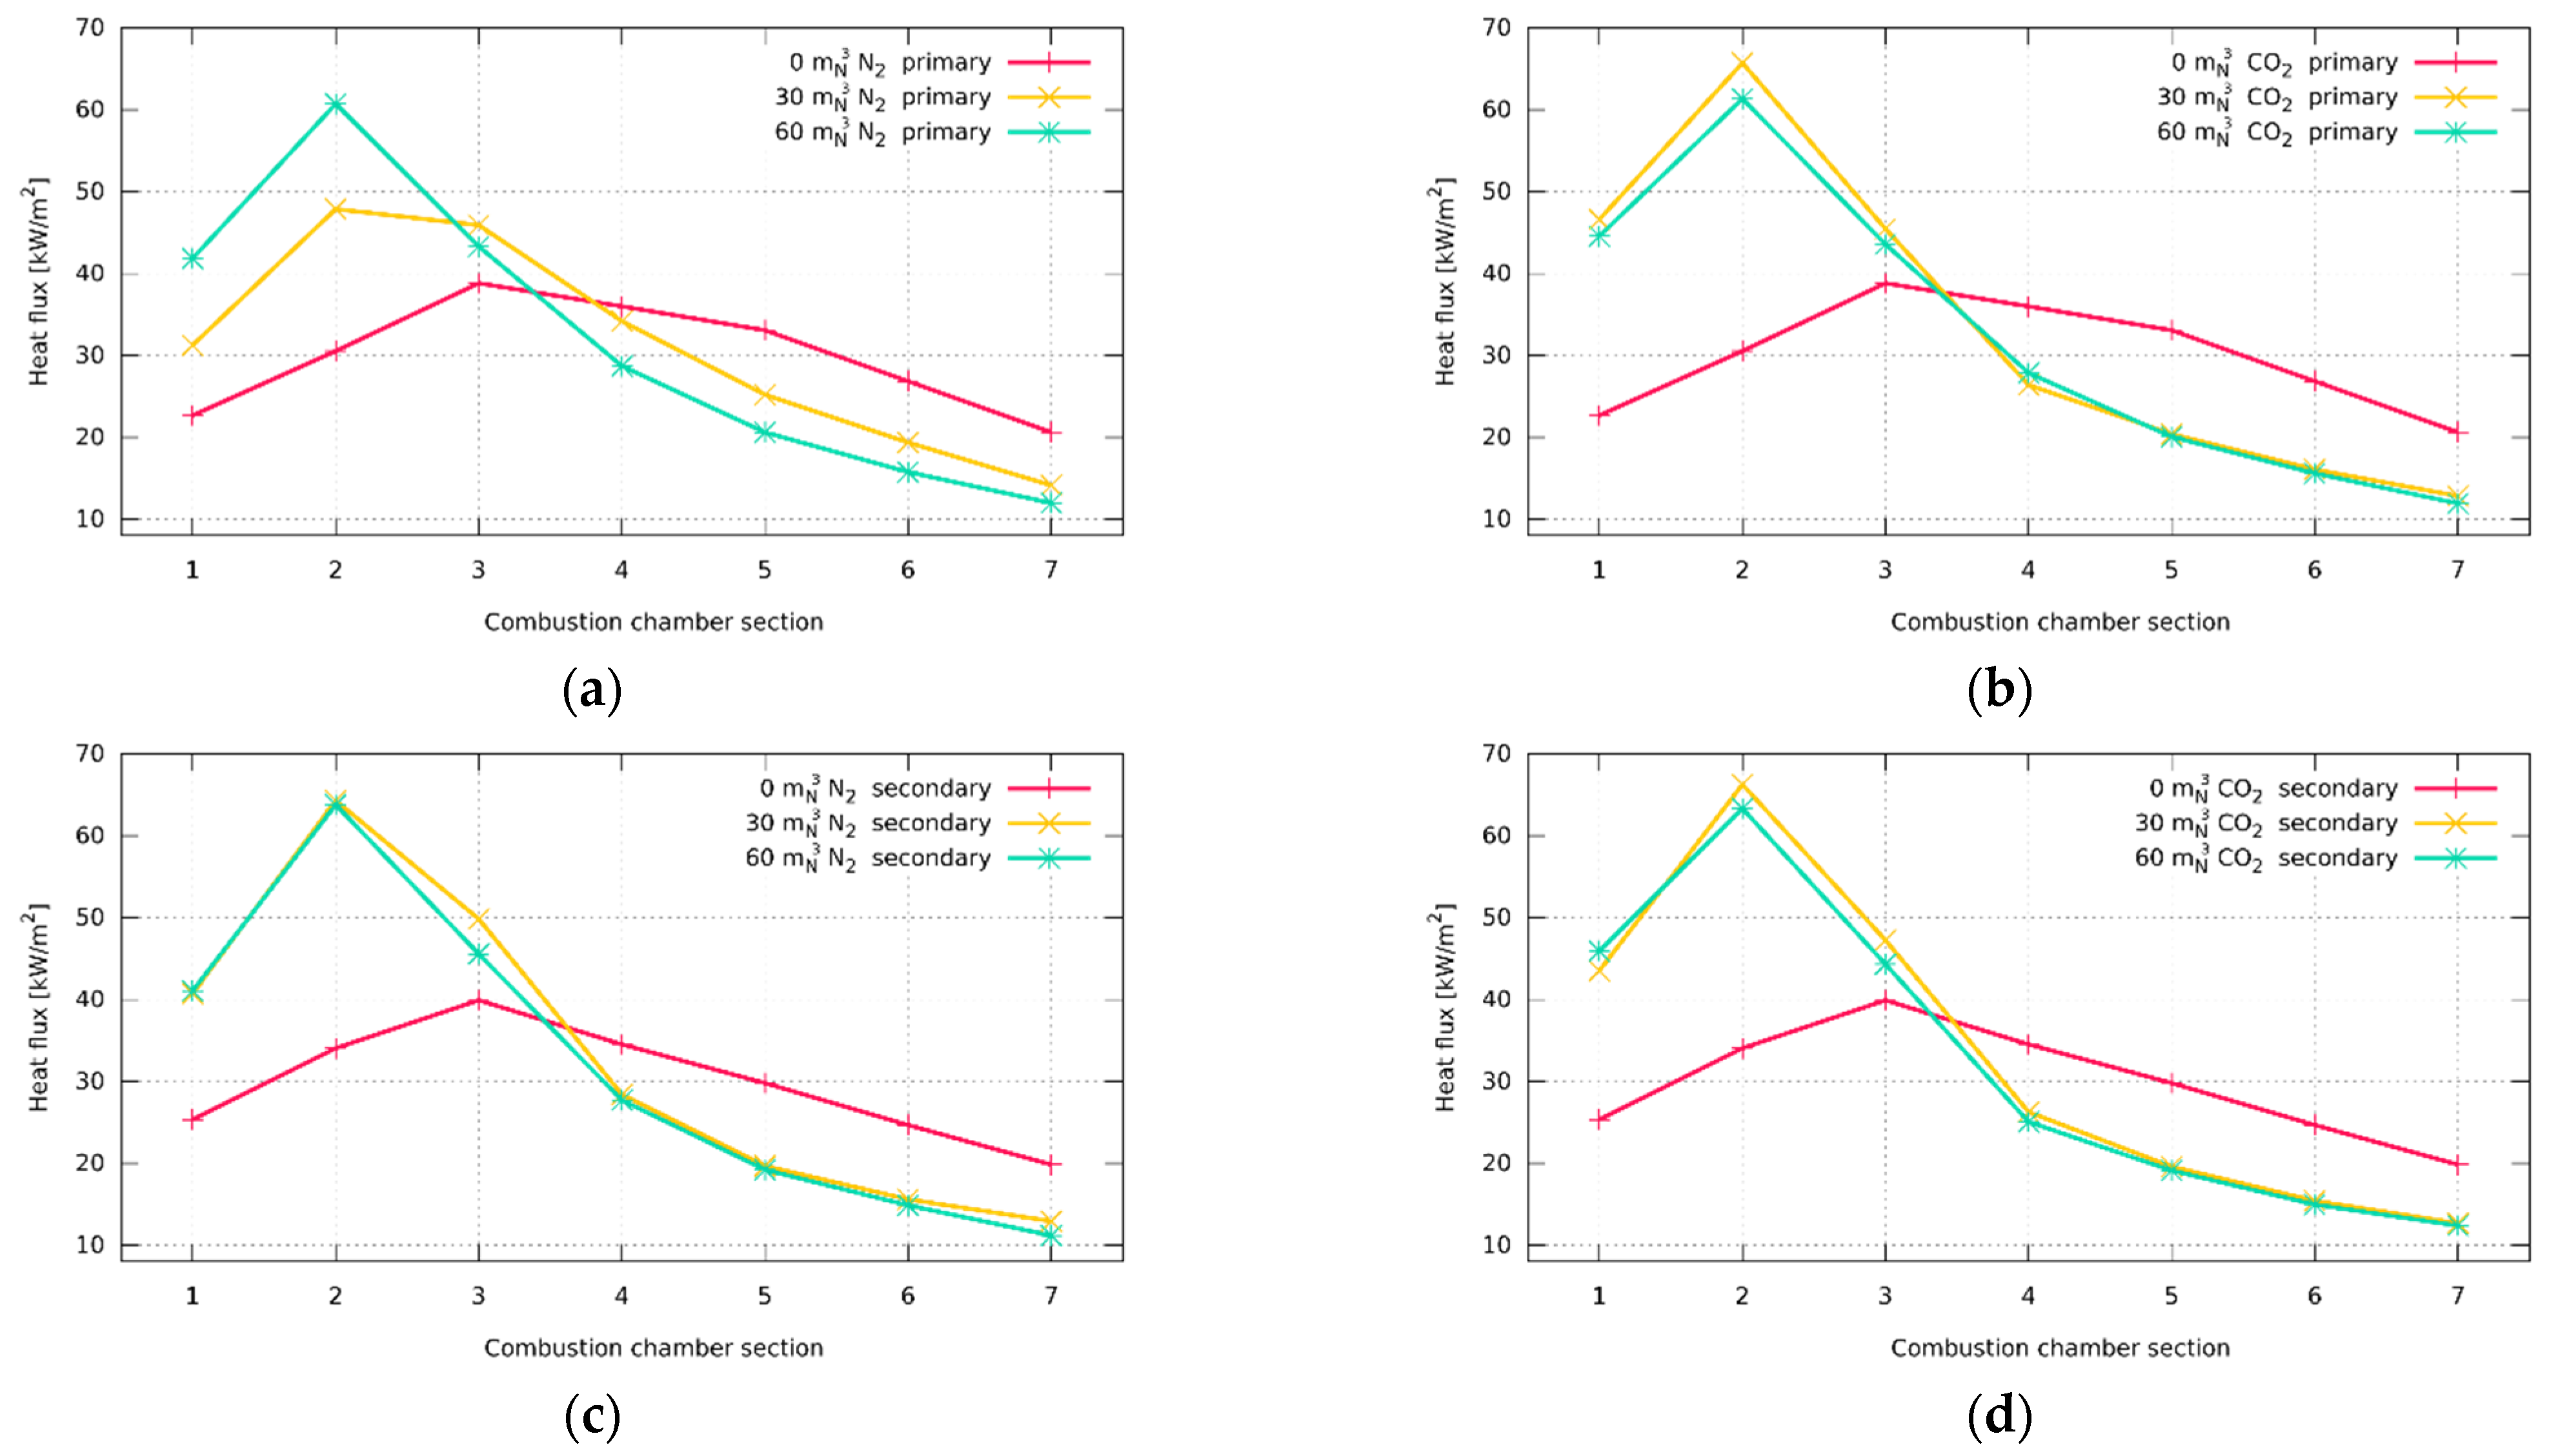
Despite only slight differences in heat flux in Burner A, the trend was more obvious in Burner B after adding a diluent. In the primary regime, a change in transferred heat flux could be observed after adding 30 mN3/h of N2 when more heat was transferred in the first three sections of the combustion chamber compared with the combustion of natural gas. Even more apparent changes in the heat flux distribution occurred after the fuel was diluted with 60 mN3/h of N2. Similarly, when CO2 was added to the flame, most of the heat flux was transferred closer to the burner tile, corresponding with the flame temperatures’ distribution. The flame became much shorter when the inert compound was added, and high-temperature fields were shifted towards the burner stone. A similar trend could be described once the burner was operated in the secondary regime. Most of the heat flux was transferred in the first half of the combustion chamber. Both inert gases had a similar effect, as is shown in Figure 12.
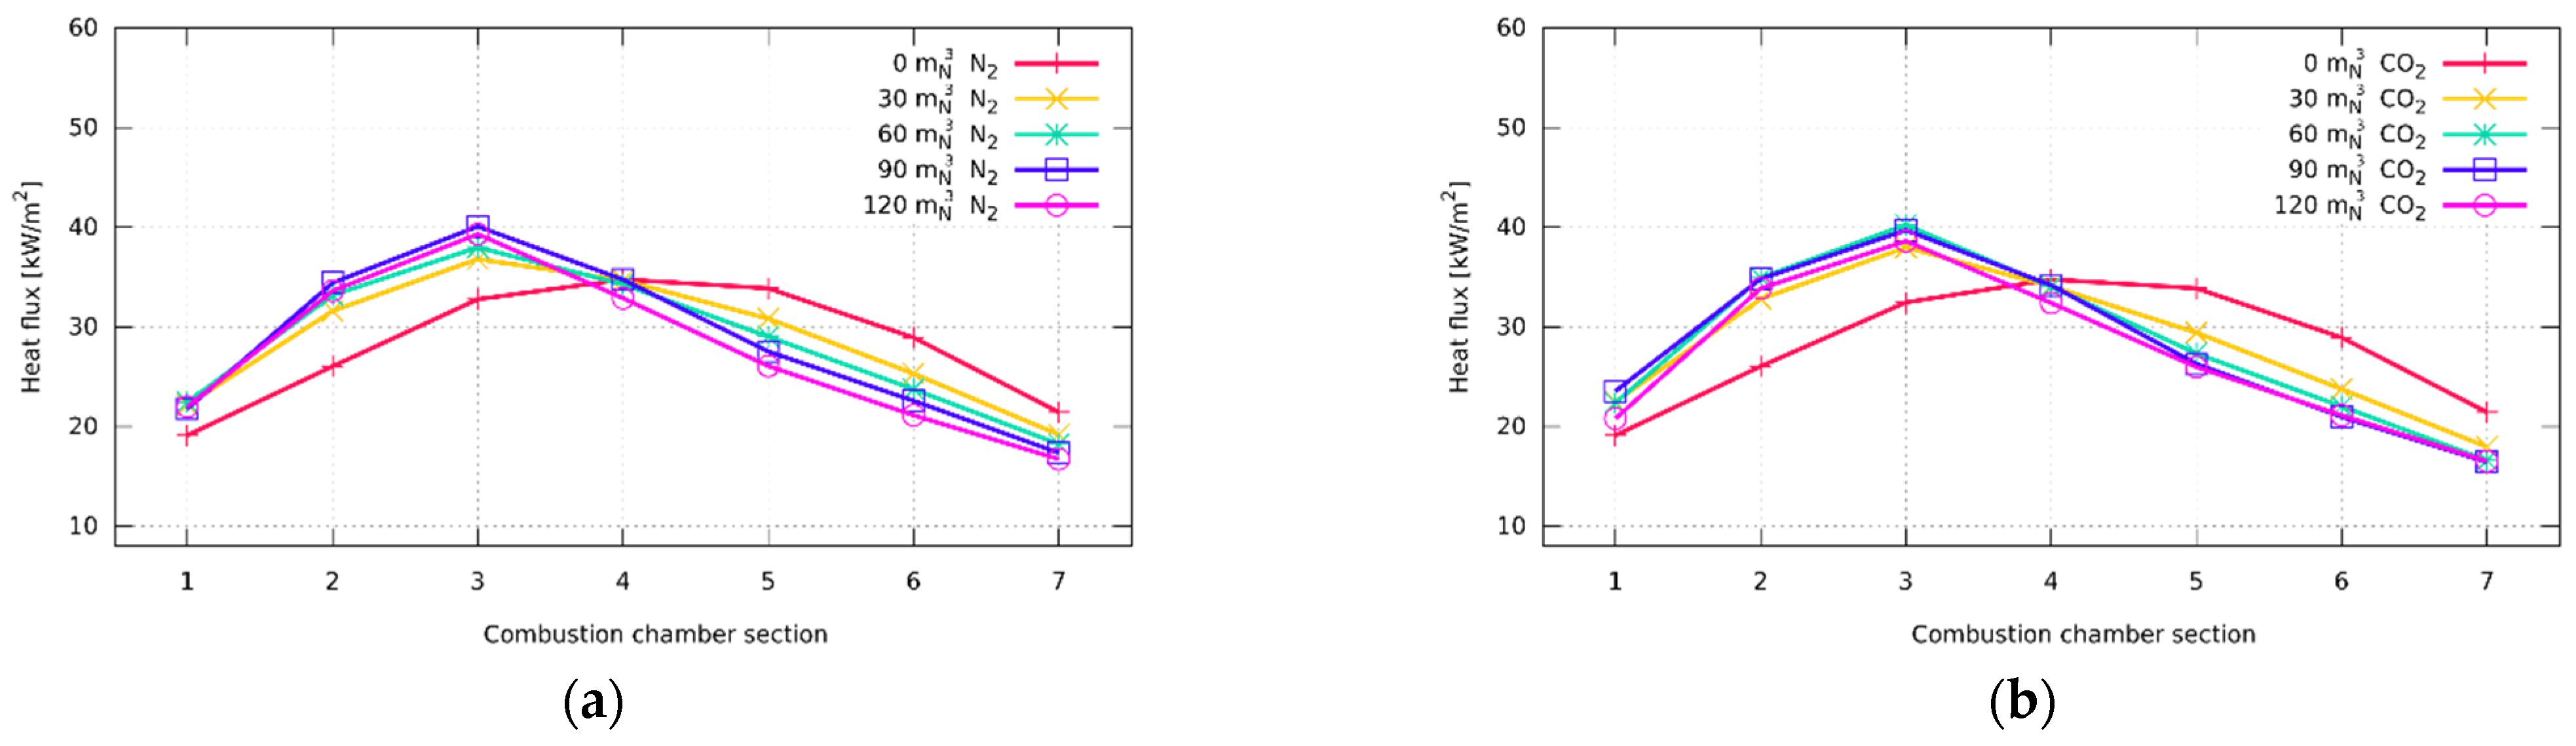
Evaluation of the data collected in the Burner C combustion test revealed similar trends after both N2 and CO2 addition. The most significant difference was visible after adding 30 mN3/h of CO2. A further increase in inert gas flow did not cause a significant difference. It was essential to stabilize the flame even with a small amount of enlargement of the fuel to improve the outlet velocities. Although more inert gas was added to the fuel, it did not cause a significant fluctuation in the heat flux absorption in single sections. The evaluated data are shown in Figure 13.
The error analysis of heat flux was performed according to Equation (1) for the standard deviation of calculated heat flux to the wall of the i-th chamber’s section [kW/m2]. Variables in the equations are heat flux, —standard deviation of water flow rate through the i-th chamber’s section [m3/h], —volumetric flow rate of cooling water through the i-th chamber’s section [m3/h], —the standard deviation of the outlet temperature of cooling water out of the i-th chamber’s section [°C], —the standard deviation of the inlet temperature of cooling water in the chamber [°C], —the outlet temperature of cooling water out of the i-th chamber’s section [°C].
For the first section, the most significant error in all measurements was less than ±5%, while it was usually less than ±3% in the other sections.
4. Conclusions
The use of alternative fuels in standardized burners without any modification is limited. It is possible to inject the alternative low-calorific fuel into the nobble one, but the amount has to be specified beforehand so that the operating conditions can remain stable. The burner can usually handle the fuel combustion with a significantly lower LHV than initially designed, but its ability to deliver thermal power will decrease. This is mainly due to the higher amount of fuel flowing through nozzles initially designed to process fuel with a much higher LHV. Moreover, to provide stable combustion conditions on conventional burners while combusting low-calorific fuel, it is necessary to support the flame core to stabilize the flame, which could blow off due to the increased partial pressure of incombustible components.
Both inert gases (N2 and CO2) can decrease peak temperatures in the flame, resulting in lower NOx emissions. However, CO2 can absorb more heat than N2, and it can be more beneficial for NOx emission-wise. When combusting in the burner with a staged gas distribution, even a minor fuel dilution with 16% vol. of N2 (26% wt) or CO2 (34% wt) can reduce NOx up to 30%. When the fuel dilution is higher, the reduction can be even more rapid. This was proven on the burner with secondary air-staged distribution, where the reduction in NOx was ca. 80% (dilution of the fuel 55% vol. of N2 (67% wt) or CO2 (74% wt) can significantly affect NOx reduction up to 80%). A similar pattern was also apparent with the combustion tests in the low-calorific burner.
A crucial factor that has to be considered is the flame shape. When the inert gas is added to the fuel, its volume increases, and the outlet nozzle velocity increases; this procedure can also be used to modify the flame shape and directly influence the thermal stress of the device.
The addition of inert gas into the conventional fuel can be beneficial; it can improve the efficiency of stream mixing, which directly impacts the thermal efficiency, but it is challenging to find the turning point. A further increase in the inert gas ratio has a negative effect. The evaluation of the experiments revealed that the improvement of heat flux could reach up to 5% compared to the combustion of natural gas in a conventional burner. However, the effect in the new low-calorific burner was negligible. An increased heat flux transition into the walls can be explained by the improved mixing efficiency, but a change in the partial pressure of CO2 or N2 can also play a role. Furthermore, a higher fuel volume also results in higher outlet velocities, which intensify the turbulent flue in the combustion chamber. Thus, until the turning point is reached, it can improve the heat flux towards the walls.
When co-combusting fuels, such as natural gas and biogas, it is more beneficial to equip the burner with two different sets of nozzles (if the same thermal power is expected). However, if a slight decrease in thermal power is not an issue, one set of nozzles could be used.
Future work will be focused on the data validation and optimization of the low-calorific burner.
5. Patents
Skryja, P.; Hudák, I.; Bělohradský, P.; Stehlík, P.; Vut v Brně, Brno. Czech Republic: Burner For Low Calorific Fuels. EP3364105 (B1). (2018).
Skryja, P.; Hudák, I.; Bělohradský, P.; Stehlík, P.; Vut v Brně, Brno. Czech Republic: Burner Head for Low Calorific Fuels. US2018231245A1. (2018).
Author Contributions
Conceptualization, I.H. and P.S.; methodology, I.H.; validation, I.H., J.B. and Z.J.; formal analysis, P.S.; investigation, I.H. and J.B.; writing—original draft preparation, I.H.; writing—review and editing, I.H., P.S. and J.B.; visualization, I.H.; supervision, M.K. and Z.J.; project administration, Z.J. All authors have read and agreed to the published version of the manuscript.
Funding
This research was funded by the Czech Ministry of Education, Youth, and Sports/EU Operational Programme Research, Development and Education, grant no. CZ.02.1.01/0.0/0.0/16_026/0008413 “Strategic partnership for environmental technologies and energy production”. Furthermore, the authors gratefully acknowledge the financial support provided by the Technology Agency of the Czech Republic (TACR) within the research project National Centers of Competence, specifically through the project National Centre for Energy (TN1000007).
Institutional Review Board Statement
Not applicable.
Data Availability Statement
The data presented in this study are available on request from the corresponding author.
Conflicts of Interest
The authors declare no conflict of interest.
References
- European Commission. The European Green Deal; European Commission: Brussels, Belgium, 2019. [Google Scholar]
- Zabed, H.M.; Akter, S.; Yun, J.; Zhang, G.; Zhang, Y.; Qi, X. Biogas from Microalgae: Technologies, Challenges and Opportunities. Renew. Sustain. Energy Rev. 2020, 117, 109503. [Google Scholar] [CrossRef]
- Li, S.C.; Williams, F.A. NOx Formation in Two-Stage Methane-Air Flames. Combust. Flame 1999, 118, 399–414. [Google Scholar] [CrossRef]
- Zhao, D.; Yamashita, H.; Kitagawa, K.; Arai, N.; Furuhata, T. Behavior and Effect on NOx Formation of O.H. Radical in Methane-Air Diffusion Flame with Steam Addition. Combust. Flame 2002, 130, 352–360. [Google Scholar] [CrossRef]
- Kobayashi, H.; Hagiwara, H. Effects of CO2 Dilution on Turbulent Premixed Flames at High Pressure and High Temperature. Proc. Combust. Inst. 2007, 31, 1451–1458. [Google Scholar] [CrossRef]
- Kobayashi, H.; Yata, S.; Ichikawa, Y.; Ogami, Y. Dilution Effects of Superheated Water Vapor on Turbulent Premixed Flames at High Pressure and High Temperature. Proc. Combust. Inst. 2009, 32, 2607–2614. [Google Scholar] [CrossRef]
- Park, J.; Keel, S.I.; Yun, J.H. Addition Effects of H2 and H2O on Flame Structure and Pollutant Emissions in Methane–Air Diffusion Flame. Energy Fuels 2007, 21, 3216–3224. [Google Scholar] [CrossRef]
- Glarborg, P.; Bentzen, L.L.B. Chemical Effects of a High CO2 Concentration in Oxy-Fuel Combustion of Methane. Energy Fuels 2007, 22, 291–296. [Google Scholar] [CrossRef]
- Rangrazi, A.; Niazmand, H.; Heravi, H.M. Experimental Study of Argon Dilution Effects on NOx Emission in a Non-Premixed Flame in Comparison with Nitrogen. Korean J. Chem. Eng. 2013, 30, 1588–1593. [Google Scholar] [CrossRef]
- Devi, S.; Sahoo, N.; Muthukumar, P. Experimental Studies on Biogas Combustion in a Novel Double Layer Inert Porous Radiant Burner. Renew. Energy 2020, 149, 1040–1052. [Google Scholar] [CrossRef]
- Salvador, S.; Kara, Y.; Commandré, J.-M. Reduction of NO Emissions from a VOC Recuperative Incinerator by Dilution of the Fuel Supply. Appl. Therm. Eng. 2004, 24, 245–254. [Google Scholar] [CrossRef] [Green Version]
- Dai, W.; Qin, C.; Chen, Z.; Tong, C.; Liu, P. Experimental Studies of Flame Stability Limits of Biogas Flame. Energy Convers. Manag. 2012, 63, 157–161. [Google Scholar] [CrossRef]
- Hinton, N.; Stone, R. Laminar Burning Velocity Measurements of Methane and Carbon Dioxide Mixtures (Biogas) over Wide Ranging Temperatures and Pressures. Fuel 2014, 116, 743–750. [Google Scholar] [CrossRef]
- Chun, K.W.; Chung, H.-J.; Chung, S.H.; Choi, J.H. A Numerical Study on Extinction and NOx Formation in Nonpremixed Flames with Syngas Fuel. J. Mech. Sci. Technol. 2011, 25, 2943–2949. [Google Scholar] [CrossRef]
- Kiedrzyńska, A.; Lewtak, R.; Świątkowski, B.; Jóźwiak, P.; Hercog, J.; Badyda, K. Numerical Study of Natural Gas and Low-Calorific Syngas Co-Firing in a Pilot Scale Burner. Energy 2020, 211, 118552. [Google Scholar] [CrossRef]
- Maznoy, A.; Pichugin, N.; Yakovlev, I.; Fursenko, R.; Petrov, D.; Shy, S.S. Fuel Interchangeability for Lean Premixed Combustion in Cylindrical Radiant Burner Operated in the Internal Combustion Mode. Appl. Therm. Eng. 2021, 186, 115997. [Google Scholar] [CrossRef]
- Song, F.; Wen, Z.; Dong, Z.; Wang, E.; Liu, X. Ultra-Low Calorific Gas Combustion in a Gradually-Varied Porous Burner with Annular Heat Recirculation. Energy 2017, 119, 497–503. [Google Scholar] [CrossRef]
Figure 1.
Semi-industrial burner testing facility.

Figure 2.
Model of a mixing station.

Figure 3.
Models of commonly used conventional burners: (a) burner with staged fuel distribution (Burner A); (b) burner with staged fuel distribution (Burner B).
Figure 3.
Models of commonly used conventional burners: (a) burner with staged fuel distribution (Burner A); (b) burner with staged fuel distribution (Burner B).

Figure 4.
Model of low-calorific burner designed after the first experiments (denoted as Burner C).

Figure 5.
The technological scheme of the combustion chamber.

Figure 6.
Influence of inert gas addition on total NOx emissions: (a) burner with staged fuel distribution—Burner A; (b) burner with staged air distribution—Burner B; (c) low-calorific burner—Burner C.
Figure 6.
Influence of inert gas addition on total NOx emissions: (a) burner with staged fuel distribution—Burner A; (b) burner with staged air distribution—Burner B; (c) low-calorific burner—Burner C.

Figure 7.
Influence of inert gas addition on flue gas temperature: (a) burner with staged fuel distribution—Burner A; (b) burner with staged air distribution—Burner B; (c) low-calorific burner—Burner C.
Figure 7.
Influence of inert gas addition on flue gas temperature: (a) burner with staged fuel distribution—Burner A; (b) burner with staged air distribution—Burner B; (c) low-calorific burner—Burner C.

Figure 8.
Influence of inert gas addition on flame temperatures—burner with staged fuel distribution—Burner A: (a) Primary regime without inert gas addition; (b) secondary regime without inert gas addition; (c) primary regime with the addition 10 mN3/h of N2; (d) secondary regime with the addition 10 mN3/h of CO2; (e) primary regime with the addition 10 mN3/h of CO2; (f) secondary regime with the addition 10 mN3/h of CO2.

Figure 9.
Influence of inert gas addition on flame temperatures—burner with staged air distribution—Burner B: (a) primary regime without inert gas addition; (b) secondary regime without inert gas addition; (c) primary regime with the addition 30 mN3/h of N2; (d) secondary regime with the addition 30 mN3/h of N2; (e) primary regime with the addition 60 mN3/h of N2; (f) secondary regime with the addition 60 mN3/h of N2; (g) primary regime with the addition 30 mN3/h of CO2; (h) secondary regime with the addition 30 mN3/h of CO2; (i) primary regime with the addition 60 mN3/h of CO2; (j) secondary regime with the addition 60 mN3/h of CO2.

Figure 10.
Influence of inert gas addition on flame temperatures—low-calorific burner—Burner C: (a) regime with the addition 60 mN3/h of N2; (b) regime with the addition 60 mN3/h of CO2; (c) regime with the addition 120 mN3/h of N2; (d) primary regime with the addition 120 mN3/h of CO2; (e) regime without inert gas addition.

Figure 11.
Influence of inert gas addition on heat flux distribution—burner with staged fuel distribution—Burner A: (a) primary regime; (b) secondary regime.
Figure 11.
Influence of inert gas addition on heat flux distribution—burner with staged fuel distribution—Burner A: (a) primary regime; (b) secondary regime.

Figure 12.
Influence of inert gas addition on heat flux distribution—burner with staged air distribution—Burner B: (a) nitrogen addition—primary regime; (b) carbon dioxide addition—primary regime; (c) nitrogen addition—secondary regime; (d) carbon dioxide addition—secondary regime.
Figure 12.
Influence of inert gas addition on heat flux distribution—burner with staged air distribution—Burner B: (a) nitrogen addition—primary regime; (b) carbon dioxide addition—primary regime; (c) nitrogen addition—secondary regime; (d) carbon dioxide addition—secondary regime.

Figure 13.
Influence of inert gas addition on heat flux distribution—low-calorific burner—Burner C: (a) addition of N2; (b) addition of CO2.
Figure 13.
Influence of inert gas addition on heat flux distribution—low-calorific burner—Burner C: (a) addition of N2; (b) addition of CO2.


Table 1.
Average natural gas composition during the combustion tests.
| CH4 | C2H6 | C3H8 | i-C4H8 | n-C4H8 | i-C5H10 | n-C5H10 | C6+ | CO2 | N2 | |
|---|---|---|---|---|---|---|---|---|---|---|
| [% mol.] | 96.486 | 2.593 | 0.127 | 0.043 | 0.021 | 0.005 | 0.003 | 0.024 | 0.333 | 0.365 |
Table 2.
Experimental matrix—TEST A—Burner A (● indicates that the test was carried out).
| Amount of N2 [mN3/h] | 0 | 10 | 20 | 30 | 40 | 50 | 60 | 0 | 0 | 0 | 0 | 0 | 0 |
| Amount of CO2 [mN3/h] | 0 | 0 | 0 | 0 | 0 | 0 | 0 | 10 | 20 | 30 | 40 | 50 | 60 |
| Fuel/Inert gas ratio [% vol.] | 100/0 | 83/17 | 71/29 | 62/38 | 56/44 | 50/50 | 45/55 | 83/17 | 71/29 | 62/38 | 56/44 | 50/50 | 45/55 |
| Burner A Primary regime | ● | ● | - | - | - | - | - | ● | - | - | - | - | - |
| Burner A Secondary regime | ● | ● | ● | - | - | - | - | ● | - | - | - | - | - |
Table 3.
Experimental matrix—TEST A—Burner A.
| Regime | CO2 Addition [mN3/h] | N2 Addition [mN3/h] | NOx [ppm] | NOx [mg/mN3] | Flue Gas Temperature [°C] |
|---|---|---|---|---|---|
| Primary | 0 | 0 | 72 | 147 | 629 |
| Primary | 0 | 10 | 63 | 129 | 647 |
| Primary | 10 | 0 | 53 | 109 | 654 |
| Secondary | 0 | 0 | 46 | 94 | 683 |
| Secondary | 0 | 10 | 39 | 79 | 676 |
| Secondary | 0 | 20 | 27 | 56 | 692 |
| Secondary | 10 | 0 | 29 | 60 | 682 |
Table 4.
Experimental matrix—TEST A—Burner B (● indicates that the test was carried out).
| Amount of N2 [mN3/h] | 0 | 10 | 20 | 30 | 40 | 50 | 60 | 0 | 0 | 0 | 0 | 0 | 0 |
| Amount of CO2 [mN3/h] | 0 | 0 | 0 | 0 | 0 | 0 | 0 | 10 | 20 | 30 | 40 | 50 | 60 |
| Fuel/Inert gas ratio [% vol.] | 100/0 | 83/17 | 71/29 | 62/38 | 56/44 | 50/50 | 45/55 | 83/17 | 71/29 | 62/38 | 56/44 | 50/50 | 45/55 |
| Burner B Primary regime | ● | ● | ● | ● | ● | ● | ● | ● | ● | ● | ● | ● | ● |
| Burner B Secondary regime | ● | ● | ● | ● | ● | ● | ● | ● | ● | ● | ● | ● | ● |
Table 5.
Experimental matrix—TEST A—Burner B.
| Regime | CO2 Addition [mN3/h] | N2 Addition [mN3/h] | NOx [ppm] | NOx [mg/mN3] | Flue Gas Temperature [°C] |
|---|---|---|---|---|---|
| Primary | 0 | 0 | 92 | 189 | 678 |
| Primary | 0 | 10 | 89 | 182 | 639 |
| Primary | 0 | 20 | 78 | 159 | 619 |
| Primary | 0 | 30 | 66 | 135 | 597 |
| Primary | 0 | 40 | 54 | 110 | 558 |
| Primary | 0 | 50 | 40 | 82 | 554 |
| Primary | 0 | 60 | 34 | 70 | 547 |
| Primary | 10 | 0 | 55 | 113 | 622 |
| Primary | 20 | 0 | 40 | 83 | 615 |
| Primary | 30 | 0 | 28 | 58 | 568 |
| Primary | 40 | 0 | 20 | 42 | 552 |
| Primary | 50 | 0 | 16 | 33 | 552 |
| Primary | 60 | 0 | 15 | 31 | 551 |
| Secondary | 0 | 0 | 58 | 118 | 634 |
| Secondary | 0 | 10 | 53 | 108 | 607 |
| Secondary | 0 | 20 | 49 | 100 | 577 |
| Secondary | 0 | 30 | 45 | 92 | 574 |
| Secondary | 0 | 40 | 42 | 86 | 567 |
| Secondary | 0 | 50 | 37 | 77 | 566 |
| Secondary | 0 | 60 | 32 | 66 | 566 |
| Secondary | 10 | 0 | 47 | 97 | 611 |
| Secondary | 20 | 0 | 38 | 77 | 580 |
| Secondary | 30 | 0 | 28 | 57 | 570 |
| Secondary | 40 | 0 | 22 | 45 | 569 |
| Secondary | 50 | 0 | 18 | 38 | 564 |
| Secondary | 60 | 0 | 15 | 31 | 550 |
Table 6.
Experimental matrix—TEST A—Burner C (● indicates that the test was carried out).
| Amount of N2 [mN3/h] | 0 | 30 | 60 | 90 | 120 | 0 | 0 | 0 | 0 |
| Amount of CO2 [mN3/h] | 0 | 0 | 0 | 0 | 0 | 30 | 60 | 90 | 120 |
| Fuel/Inert gas ratio [% vol.] | 100/0 | 62/38 | 45/55 | 36/64 | 29/71 | 62/38 | 45/55 | 36/64 | 29/71 |
| Burner C | ● | ● | ● | ● | ● | ● | ● | ● | ● |
Table 7.
Experimental matrix—TEST A—Burner C.
| Regime | CO2 Addition [mN3/h] | N2 Addition [mN3/h] | NOx [ppm] | NOx [mg/mN3] | Flue Gas Temperature [°C] |
|---|---|---|---|---|---|
| Primary | 0 | 0 | 73 | 149 | 701 |
| Primary | 0 | 30 | 61 | 125 | 673 |
| Primary | 0 | 60 | 56 | 115 | 669 |
| Primary | 0 | 90 | 49 | 101 | 662 |
| Primary | 0 | 120 | 43 | 88 | 656 |
| Primary | 30 | 0 | 45 | 92 | 653 |
| Primary | 60 | 0 | 36 | 73 | 633 |
| Primary | 90 | 0 | 28 | 58 | 632 |
| Primary | 120 | 0 | 20 | 40 | 620 |
Table 8.
Experimental matrix—TEST B, C—Burners A, B (● indicates that the test was carried out).
| Amount of N2 [mN3/h] | 0 | 10 | 30 | 60 | 0 | 0 | 0 |
| Amount of CO2 [mN3/h] | 0 | 0 | 0 | 0 | 10 | 30 | 60 |
| Fuel/Inert gas ratio [% vol] | 100/0 | 83/17 | 62/38 | 45/55 | 83/17 | 62/38 | 45/55 |
| Burner A Primary | ● | ● | - | - | ● | - | - |
| Burner A Secondary | ● | ● | - | - | ● | - | - |
| Burner B Primary | ● | - | ● | - | - | ● | ● |
| Burner B Secondary | ● | - | ● | - | - | ● | ● |
Publisher’s Note: MDPI stays neutral with regard to jurisdictional claims in published maps and institutional affiliations. |
© 2021 by the authors. Licensee MDPI, Basel, Switzerland. This article is an open access article distributed under the terms and conditions of the Creative Commons Attribution (CC BY) license (https://creativecommons.org/licenses/by/4.0/).
Share and Cite
MDPI and ACS Style
Hudák, I.; Skryja, P.; Bojanovský, J.; Jegla, Z.; Krňávek, M. The Effect of Inert Fuel Compounds on Flame Characteristics. Energies 2022, 15, 262. https://0-doi-org.brum.beds.ac.uk/10.3390/en15010262
AMA Style
Hudák I, Skryja P, Bojanovský J, Jegla Z, Krňávek M. The Effect of Inert Fuel Compounds on Flame Characteristics. Energies. 2022; 15(1):262. https://0-doi-org.brum.beds.ac.uk/10.3390/en15010262
Chicago/Turabian StyleHudák, Igor, Pavel Skryja, Jiří Bojanovský, Zdeněk Jegla, and Martin Krňávek. 2022. "The Effect of Inert Fuel Compounds on Flame Characteristics" Energies 15, no. 1: 262. https://0-doi-org.brum.beds.ac.uk/10.3390/en15010262
Note that from the first issue of 2016, this journal uses article numbers instead of page numbers. See further details here.