Article

Developing Novel Technologies and Services for Intelligent Low Voltage Electricity Grids: Cost–Benefit Analysis and Policy Implications

by
Alemu Moges Belay
1,*,
Sanket Puranik
1,
Ramon Gallart-Fernández
2,
Heidi Tuiskula
1,
Joaquim Melendez
3,
Ilias Lamprinos
4,
Francisco Díaz-González
5 and
Miha Smolnikar
6,7
1
Smart Innovation Norway, Håkon Melbergs vei 16, 1783 Halden, Norway
2
Estabanell Energia, C. del Rec, 28, 08401 Granollers, Spain
3
Institut d’Informàtica i Aplicacions, University of Girona, Campus Montilivi, 17003 Girona, Spain
4
Intracom S.A. Telecom Solutions, 19.7 km Markopoulou Ave., GR-19002 Peania Athens, Greece
5
Centre d’Innovació Tecnològica en Convertidors Estàtics i Accionaments (CITCEA-UPC), Department of Electrical Engineering, Universitat Politecnica de Catalunya ETS d’Enginyeria Industrial de Barcelona, C. Avinguda Diagonal, 647, Pl. 2, 08028 Barcelona, Spain
6
ComSensus d.o.o., Brezje pri Dobu 8a, SI-1233 Dob, Slovenia
7
Jožef Stefan Institute, Jamova cesta 39, SI-1000 Ljubljana, Slovenia
*
Author to whom correspondence should be addressed.
Submission received: 1 November 2021 / Revised: 3 December 2021 / Accepted: 17 December 2021 / Published: 23 December 2021
(This article belongs to the Special Issue Smart Energy Management for Smart Grid)

Abstract

:
The paper presents a set of prototype smart grid technologies and services and validates the economic viability of the proposed solution using cost–benefit analysis (CBA). The study considered the EU-funded project called RESOLVD and implemented the technologies and services in a real-life pilot. The paper focuses on the analysis of technological solutions which enhance the operational efficiency and the hosting capacity of low-voltage electricity distribution grids. The solutions provided better integration of a hybrid battery storage system, with the grid interfacing power electronics, smart gateways for the interconnection of assets at the grid edge, and sensors enhancing infrastructure observability and control. The result from the CBA indicates the economic viability of the project, high scalability, and replicability. The economic benefits were realized with the breakeven value of eight secondary substations (SS) and 16 feeders. The scenario test on the DSO’s willingness to pay for the software as a service (SaaS) revealed that the payback period can further be reduced by almost half with a higher internal rate of return (IRR) and net present value (NPV). Both the CBA and scenario tests showed RESOLVD solution can become more economically viable when deployed in largescale. Moreover, the CBA results provide evidence to the energy policy by allowing DSOs to consider both CAPEX and OPEX for better investment decisions. Further, the paper proposes an alternative business approach that shifts from grid reinforcement to service provision. The paper also discusses the research implications on energy policy and business.

1. Introduction

The green transition of energy through low-carbon pathways moves the electricity sector towards higher penetration of distributed energy resources (DERs). According to the EU’s amended Energy Efficiency Directive (EU) 2018/2002 and 2030 climate and energy framework of 2014, the EU has set a target for renewable energy of at least 32.5% and 32% share by 2030. This implies an increase in renewable resources (RES) connected to the distribution grid and will require the distribution system operator (DSO) to expand, upgrade, and modernize the infrastructure [1]. Under high DERs, DSOs face multifaceted challenges in managing LV grid networks, as they lack high-resolution grid observability and advanced control and planning systems. Challenges include frequent voltage variations, congestions, reverse power flows, and reactive power balancing [2,3,4,5]. The authors of [4] discussed how technical solutions, by providing new information about the state of medium-voltage (MV) and low-voltage (LV) networks, can improve the quality of network management.
Along with better management of the grid, DSOs need to increase their hosting capacity cost-efficiently in the part of the grid that expects more challenges as a result of the growth of intermittent renewable energy sources and mobility’s electrification to provide the distributed asset flexibility. This can be achieved by activating flexibility and coupling demand and generation [6,7]. This implies directly acting on energy assets (special focus is put on storage) and the participation of consumers/prosumers through demand response [8]. Storages are claimed to be the way to mitigate some of the distribution grid challenges [5] but are expensive [9]. To overcome all challenges, cost-effective advanced technologies need to be developed, tested, and the investment should be economically justified using a detailed cost–benefit analysis (CBA).
Nevertheless, there is no standard methodology to assess the economic viability of the technology developed, especially in the highly regulated business of the DSO. However, there are some techno-economic analysis methods proposed in the electricity domain. However, only a small amount of the research is linked to grid-scale electrical energy projects. The authors of [10] conducted a social cost–benefit analysis and developed a framework that helps the regulatory regime to assess and decide on investing grid-scale electrical energy storage (EES). The authors of [11] applied CBA to analyze the deployment of advanced metering infrastructure (AMI) by focusing on loans to check the worst-case feasibility of the project. Although CBA has been applied in smart grid projects, there is limited research focusing on technical projects.
This paper considers the case of the H2020 RESOLVD project, and describes the technologies developed to solve LV grid operation challenges. These technologies developed in the project fall under the category of (a) use of hybrid storage systems, (b) observability of the grid, (c) integration of IT systems, and (d) decision support for control of the grid. The paper presents the outcome of a detailed CBA that was performed to explore if the investment in the proposed solution is economically viable. Further, the paper presents a scalability analysis and scenario test for willingness to pay by DSO. The paper does not only validate and justify the economic soundness of intelligent LV grid management, but also lays a foundation to give insight about the future flexibility services by paving the way to reach high DER penetration through increased hosting capacity and efficiency. This shall further help DSOs to consider OPEX-related investments as a key business consideration in addition to the traditional grid upgrade (CAPEX). This enables and has implications on efficiently managing the grid and to take the advantage of the combination of the two, i.e., total expenditure (TOTEX). Furthermore, the results substantiate and shed light on how to improve the energy policy and contribute to the green transition through high DER penetration.

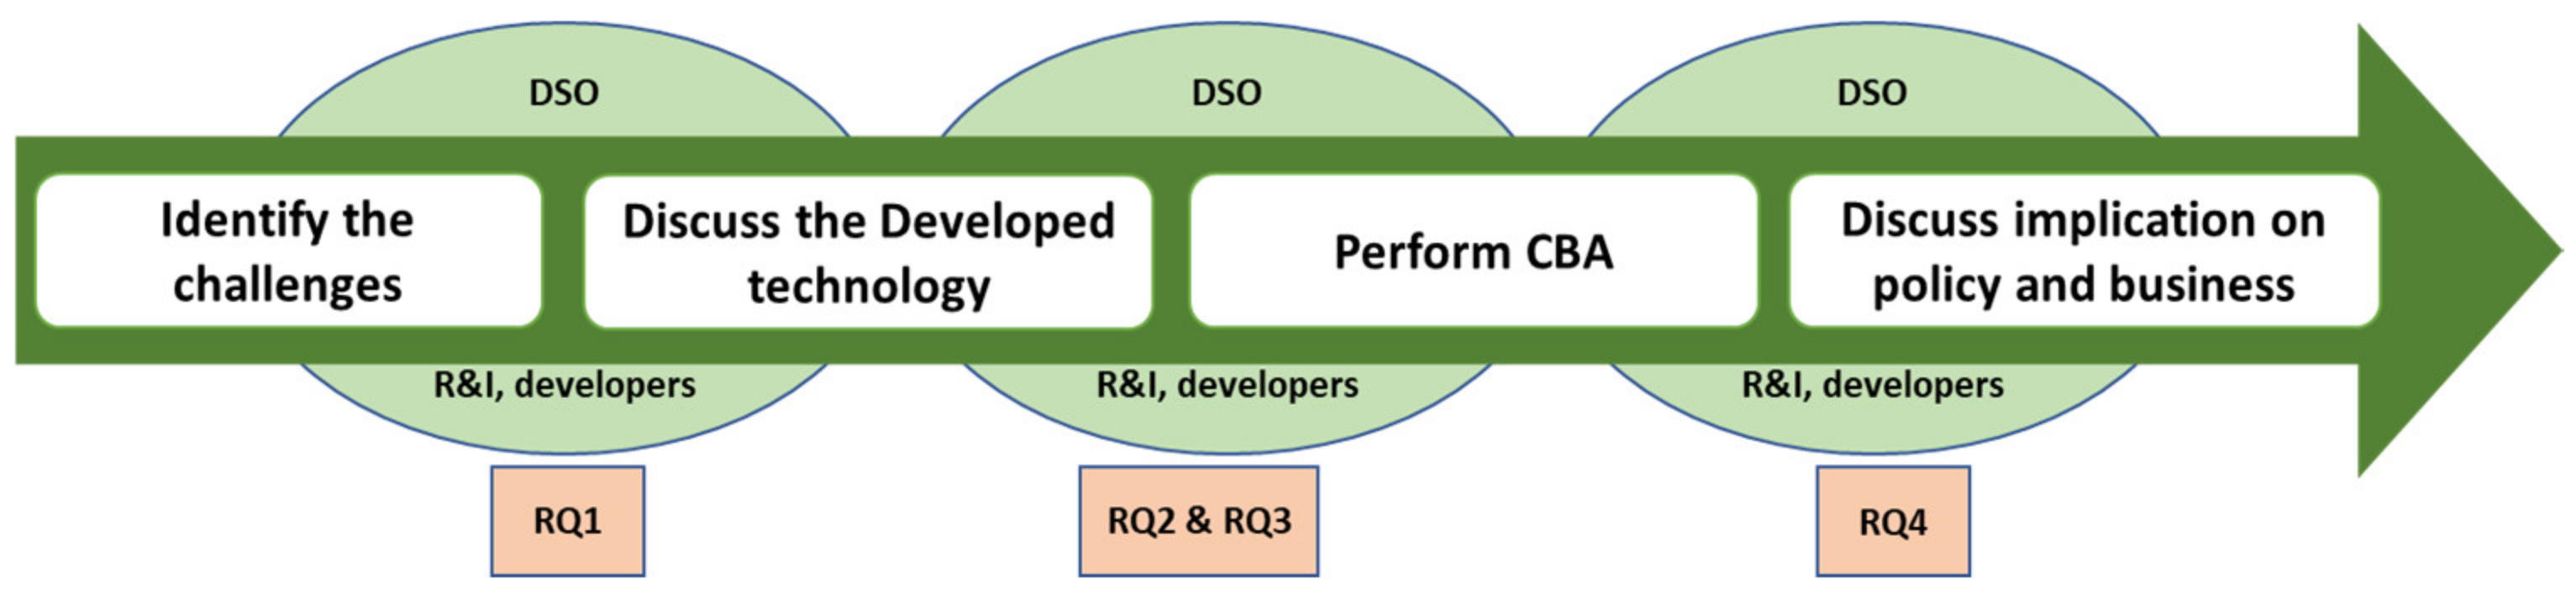
1.1. Objective and Research Questions

The objective of the paper is to demonstrate and validate the proof of concept of RESOLVD solutions and provide evidence of its economic viability in managing an intelligent LV grid operation in the context of distributed networks. This is achieved by measuring and quantifying defined KPIs for all technologies developed and implemented on the selected pilot. The research objective is achieved by answering the following four thematic research questions (RQ):
  • RQ1. How can the DSO manage intelligently the LV grid and improve the grid performance in terms of efficiency and hosting capacity?
  • RQ2. What concrete and quantifiable benefits (based on defined KPIs) can be achieved from the proposed RESOLVD solution?
  • RQ3. Are the RESOLVD hardware and software solutions economically viable and can their adoption be economically justified when compared to the business-as-usual (BAU) scenario, i.e., without RESOLVD? What will be the impact of scaling up towards large-scale deployment of RESOLVD solutions and what is its sensitivity with respect to reduction in major costs, such as software and battery?
  • RQ4. What implications does RESOLVD have to the energy policy, technology, and businesses?
To answer these questions the research framework shown in Figure 1 is followed.

1.2. Paper Organization

Section 2 is a literature review on aspects of intelligent distribution grids that are of interest for RESOLVD, i.e., grid observability, integration of energy storage systems, decision support systems for the DSOs, and integration of IT systems at the DSO level. Additionally, Section 2 provides a brief review on cost–benefit analysis (CBA) for relevant, low technology readiness level (TRL) solutions. Section 3 presents the RESOLVD concept and solution as implemented at a demonstration site. Section 4 describes the methodology used for performing CBA. Section 5 provides results and a discussion of the research questions of the paper. Section 6 presents the implication of RESOLVD technologies on business and policy. Finally, Section 7 concludes the paper.

2. Review on Intelligent Distribution Grids

2.1. Observability of the Grid

The traditional unidirectional power flow in power networks, from large generation assets to end consumers in the grid, is being progressively replaced by bidirectional ones because of the increasing penetration of distributed energy resources and active demand management of consumers. The exploitation of various types of energy storage could improve to reduce the controllable loads to support the active system management, requirement for real-time knowledge on the distribution network state [12], and monitoring of dynamic and transient events affecting the quality of supply [13]. The prerequisite towards achieving comprehensive observability of the power network is the deployment of advanced measurement technology and the provision of appropriate connectivity solutions to support data aggregation and processing. Providing the means of monitoring, analysis, prediction, control, and automation in the segment between the secondary substation and consumer’s/producer’s connection point, which is a great part of increased system dynamics that exists, allows the operator to provide resilient services, better utilization of assets, and potential delay of investment in infrastructure reinforcement, fostering the innovative solution to invest in real smart assets.
A power network is considered observable if it is possible to calculate its quasi-steady state using the available set of measurements and knowledge on current configuration [14]. The approach can either be model-driven, where graph theory, line models, and instantaneous measurements are used to estimate the state, or data-driven, where a numerical model is built using historical measurement data and instantaneous measurements are then used to derive the state from the model. The smart meter data provided by the Advanced Metering Infrastructure (AMI) are increasingly used to support various applications, such as load profiling or forecasting. Moreover, power quality meters (PMQs) are typically deployed to support the site or assets monitoring, and (micro) phasor measurement units (PMUs) are emerging to support the wide-area situation awareness. Although there are new approaches, technologies, and proposed observability solutions that could be deployed in the energy domain, the results from such technologies should be further validated and justified. In this connection, some of the proposed solutions include an automatic target detector in infrared imagery [15], a multi-remote-sensor approach, such as a deep-learning-based burned area mapping using the synergy of the satellite data and images of Sentinels 1 and 2 [16]. Moreover, there is a new method that could be potentially adopted, i.e., the use of multi-camera multi-player tracking with deep player identification [17]; however, the cost-effectiveness in a distributed energy grid context should be assessed.

2.2. Integration of Energy Storage Systems

The applications of energy storage systems (ESS) in networks are diverse and have been widely discussed in the literature [18,19]. ESS is required to provide power and energy services to upgrade the electrical grid and achieve a neutral role for DSOs and highlight its developed infrastructures. From a techno-economic perspective, there is no optimal battery type for all types of applications. Additionally, the stacking of multiple services simultaneously can result in a higher return on investment [20,21]. Thus, the development of hybrid energy storage solutions is suggested based on the combination and synergistic exploitation of various storage technologies (each providing different services). The realization of hybrid storage systems mainly depends on the ability to electrically interconnect and manage a heterogeneous grouping of storage technologies. This is triggered by advanced power electronics [22,23] and associated power-sharing algorithms [24,25,26] to manage energy in such hybrid systems to provide a variety of energy services (e.g., voltage compensation, storage, phase balancing, etc.). Aspects to consider for such power-sharing algorithms are usually the main technical performance of each storage technology embedded into the hybrid solution (e.g., energy and power ratings, cyclability, time response), and degradation mechanisms. Based on such aspects and criteria based on the power time profile, the setpoint for the hybrid solution can be evaluated—or stratified—to identify fast time-varying and low time-varying components to associate to, for instance, a lithium-ion battery and a lead-acid battery, respectively, pursuing an optimal performance. All in all, this comprises a challenging decision process involving technical aspects and providing business opportunities.

2.3. Decision Support Systems for the DSOs

The notion of a decision support system (DSS) embraces a variety of applications oriented towards short-term (i.e., grid operation), medium-term (i.e., maintenance), and long-term (i.e., grid planning) functions that usually also include visualization and simulation capabilities.
In this paper, we focus on the short-term time frame and we present DSSs that allow the operation of a smart grid in a more efficient way by scheduling grid configuration and controllable assets at the day-ahead time frame.
Such DSSs usually combine power flow solvers with algorithms that aim to maximize a specific utility function. Existing studies focus on determining the optimal static configuration of a network to minimize power losses [27,28,29,30,31]. The authors of [30] showed that voltage control and power losses were improved with a simultaneous reconfiguration and an optimal location of the distributed generation assets (DG). The same formulation was used in [29], but a different solver algorithm with better performance was used. Usually, the optimization problem involves the co-ordination of the operation of ESS with grid reconfiguration (i.e., switchgear operation), resulting in a multi-objective function. To decouple grid configuration from charge/discharge of ESS, a two-stage optimization approach has been applied [32]. In this approach, firstly, the grid configuration is set (on an hourly basis) to avoid possible critical events (congestions and over/sub voltages), and once this problem is solved, the ESS is scheduled to minimize energy exchange and losses at the substation level. The approach in [33] also considers the existence of interruptible loads that transfer the problem to the demand side and incorporate the dispatchable load costs.

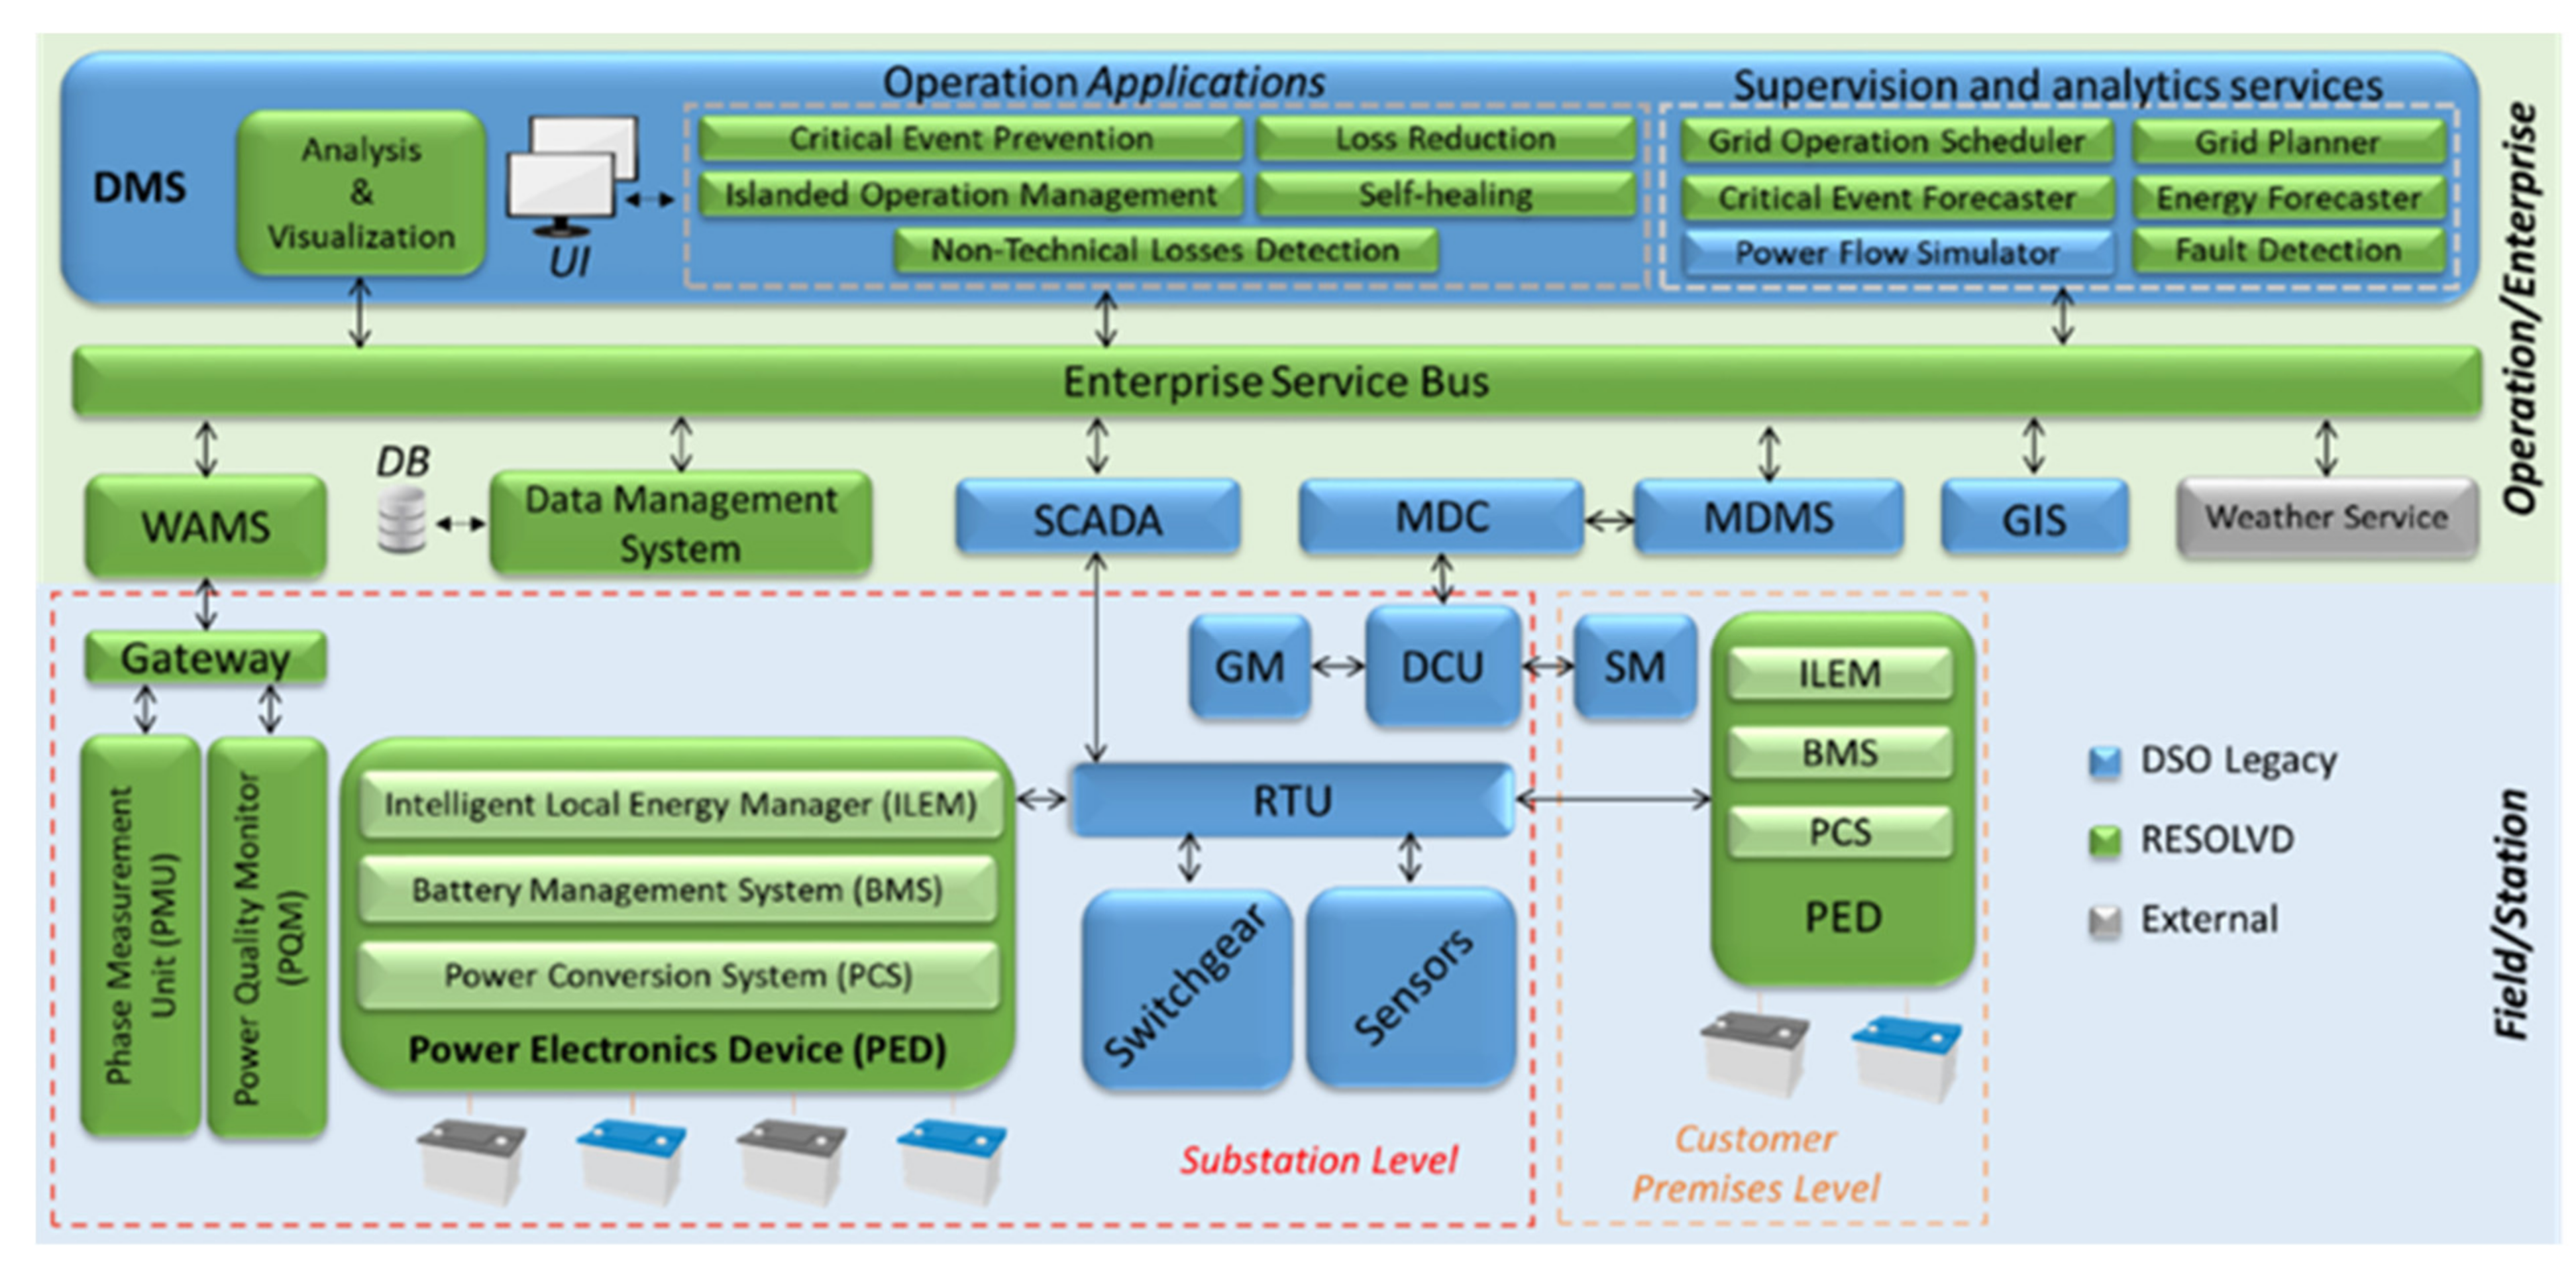
2.4. Integration of IT Systems at the DSO Level

As distribution systems gradually evolve into smart distribution systems, the DSOs’ operations centers that control them evolve in parallel, incorporating new functions. The separate IT systems operating in these control centers become more streamlined, communicating seamlessly to provide an integrated monitoring and management system. More advanced applications and analytical software provide more sophisticated analyses and automated operations. The control systems of operation centers not only help to make the grid smarter, but also help to improve support for decision-makers responsible for operations, maintenance, and planning [34]. Among the IT systems present at a DSO’s operations center, the distribution management system (DMS) is considered as one of the most critical components for the efficient operation of the distribution grid. As a fully functional unit, a DMS may include various applications, such as fault detection, isolation, and service restoration, voltage variance optimization, power flow management, etc.
According to [35], a growing number of DSOs have DMS running in their operations center. However, participants also indicated that challenges remain in developing a highly reliable and functional DMS in different respects (e.g., system integration, communication). This is just one side of the coin. In many cases, the DSO IT ecosystem is composed of many different legacy systems and subsystems, rather than a monolithic DMS. Examples of separate (nonintegrated) IT systems include customer information system; geographic information system; trouble calls center; workforce management; switch order management; AMI; SCADA, etc. On top of the above, there are several non-interconnected advanced applications that are useful for the DSOs, both at the planning and operation phase (outage planning, grid resources optimization, power quality analysis, distribution grid state estimation, etc.). These and other applications are often in need of real-time information, such as the status of switches, voltage regulator taps, capacitor banks, fault location, the status of distributed resources, and customer demand/load. This signals the need for an information exchange bus. In addition, ultimately, there is a need for integration of the decision support functions (analytics plane) with the actions’ execution functions (control plane).

2.5. Cost–Benefit Analysis for Relevant Low TRL Solutions

The development and adoption of smart grid technologies need economic validation. Some researchers have developed cost–benefit analysis (CBA) frameworks for smart grid applications. For example, the authors of [36] applied CBA to assess system management and planning tools for the electrical grid. The authors of [37] proposed, in their theoretical paper, a multi-agent systems (MAS) approach applied to the operation of power grids. The authors of [10] applied CBA on grid-scale electrical energy storage (EES) and validated the results using simulations. Similarly, authors of [38] used CBA on a virtual power plant including solar PV, flow battery, heat pump, and demand management and attempted to validate it by simulation.
In general, most of the CBAs for assessing the investment in smart grid technologies are still too conceptual and theoretical, and include many assumptions. Moreover, although there are various reports on such CBAs, the research on complete CBA and investment analysis, including scalability and willingness to pay, is not covered adequately in the literature. Unlike previous CBAs of smart grid technologies, this paper focuses on investments in the LV part of the grid.

3. RESOLVD Concept and Demonstration Pilot

3.1. The Project Concepts

The RESOLVD project aimed to improve the efficiency and the hosting capacity of distribution networks in a context of highly distributed renewable generation by introducing flexibility and control in the low-voltage (LV) grid without the participation of consumers. Specifically, the project tackles the following challenges:
  • Improvement of low-voltage grid observability.
  • Critical event forecasting. This includes day-ahead forecasting of congestions and over/under voltages due to daily variations in demand profiles with the presence of PV generation.
  • Early fault detection by exploiting the grid observability and redundancy of measurements.
  • Island management; this includes the detection of uncontrolled islanding situations and the management of ESS and frequency control in controlled LV islands.
  • Power quality improvement and loss reduction; this includes compensation of harmonics reactive power, and phase balancing with power electronics (PED).
  • Reduction of technical losses in the network by reducing imported energy and maximizing the use of renewable energy locally produced.
  • Cyber security; the design of subsystems and further integration has been submitted to rigorous analysis and tests to assure the cybersecurity of the whole solution.
To tackle these challenges, the project developed and deployed hardware and software solutions to smartly manage LV distribution grid operations and improve the grid performance. The project developed an advanced power electronic device to control and manage hybrid storage (lithium and lead-acid batteries) at the customer premises and two substations with four feeders.
Advanced power electronics with integrated storage management capabilities provide both switching and energy balancing capacities to manage energy locally. Enhanced observability of low voltage grids has been achieved by introducing cost-effective high-resolution instruments (PMUs and PQM) and exploiting smart meter data to perform energy forecasting (generation and demand aggregated at bus level). Thus, enhanced observability and improved energy control allow the introduction of day-ahead operation planning in the low voltage by scheduling three elements:
-
Switchgears: to reconfigure the grid to avoid critical events (congestions and/or over/sub voltages)
-
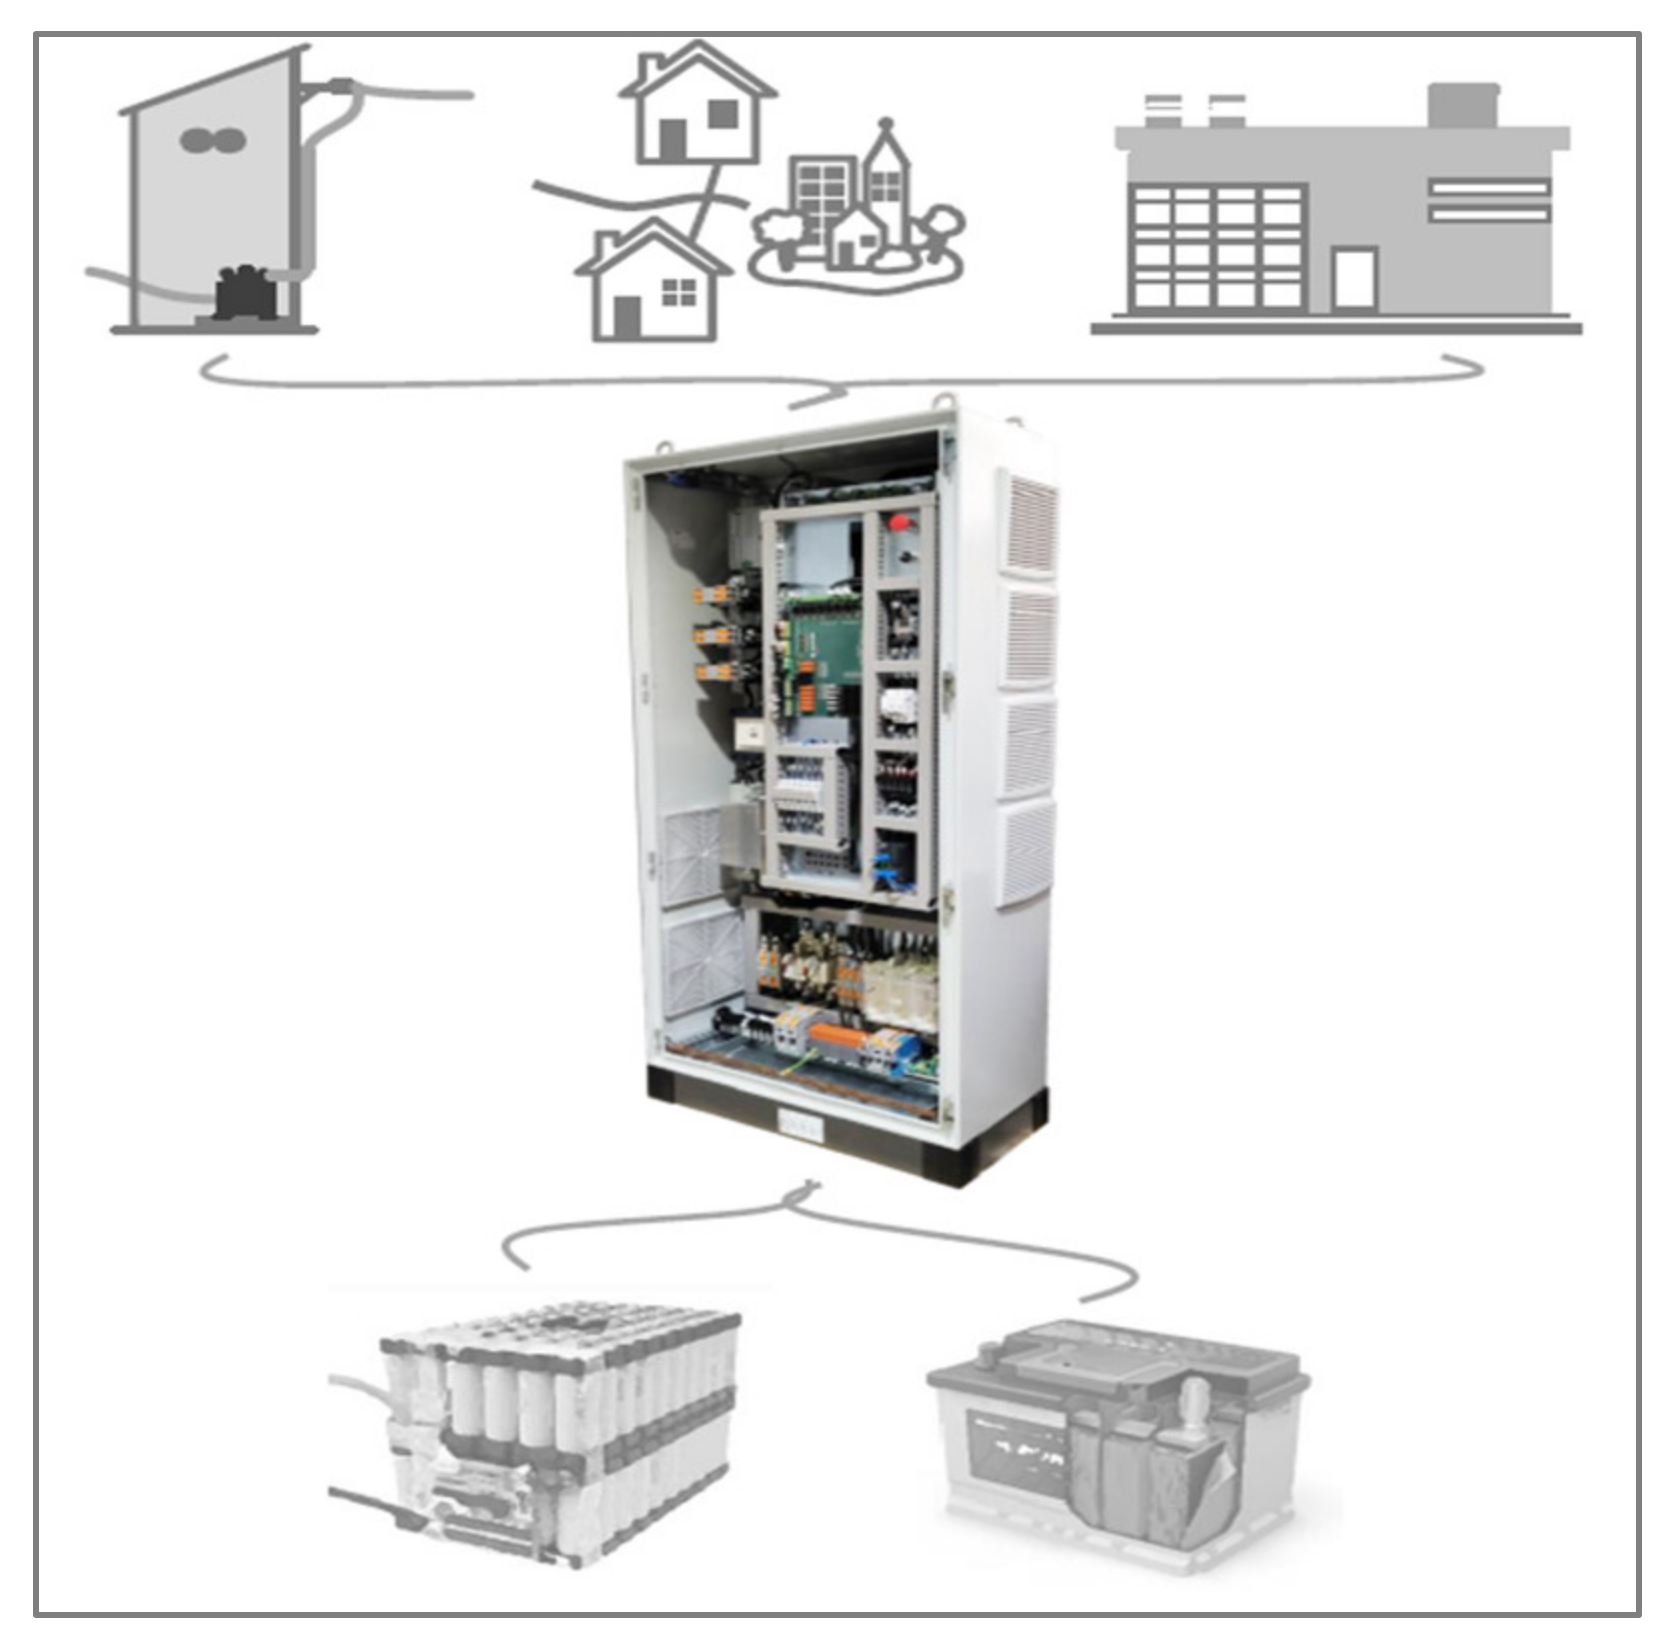
Batteries: schedule the charge/discharge of batteries according to efficient operation goals (reduce energy exchange at the substation level, peak reduction, maximal use of RES locally generated)
-
Power electronics: its activation allows reduction of losses and improves quality by compensating harmonics and reactive, balancing phases, and compensating voltage variation by injecting reactive power.
Optimal scheduling and activation of such assets are performed by decision support modules that provide services for day-ahead energy forecasting (generation and demand) based on smart meter data, detection of abnormal operation as faults and critical events (congestions and over/sub-voltage variations), and grid operation scheduling under different optimization criteria (critical event avoidance, loss and peak reduction, or maximal consumption of RES locally generated). Thus, RESOLVD builds up an enhanced low-voltage grid monitoring with (local) wide area monitoring (WAMs) capabilities to detect faults, forecast critical events (congestion voltage variations), and correct power quality issues, resulting in a better quality of supply that is more secure and efficient. RESOLVD is conceived as a set of subsystems fully interoperable with the legacy systems (such as SCADA, DMS, MDMS, and GIS) that provides enhanced low-voltage observability and day-ahead scheduling capabilities to optimally manage the grid.
The interoperation of these technologies in a secure and safe way has been implemented by considering current communication standards and putting the CIM model on the basis of the development. Integration of the overall system has been performed with an enterprise service bus (ESB) that supports all the data transactions and co-ordinates the invocation of modules according to specific decision support tasks. Next, Figure 2 shows in green the RESOLVD components and, in light blue, existing legacy systems [39].

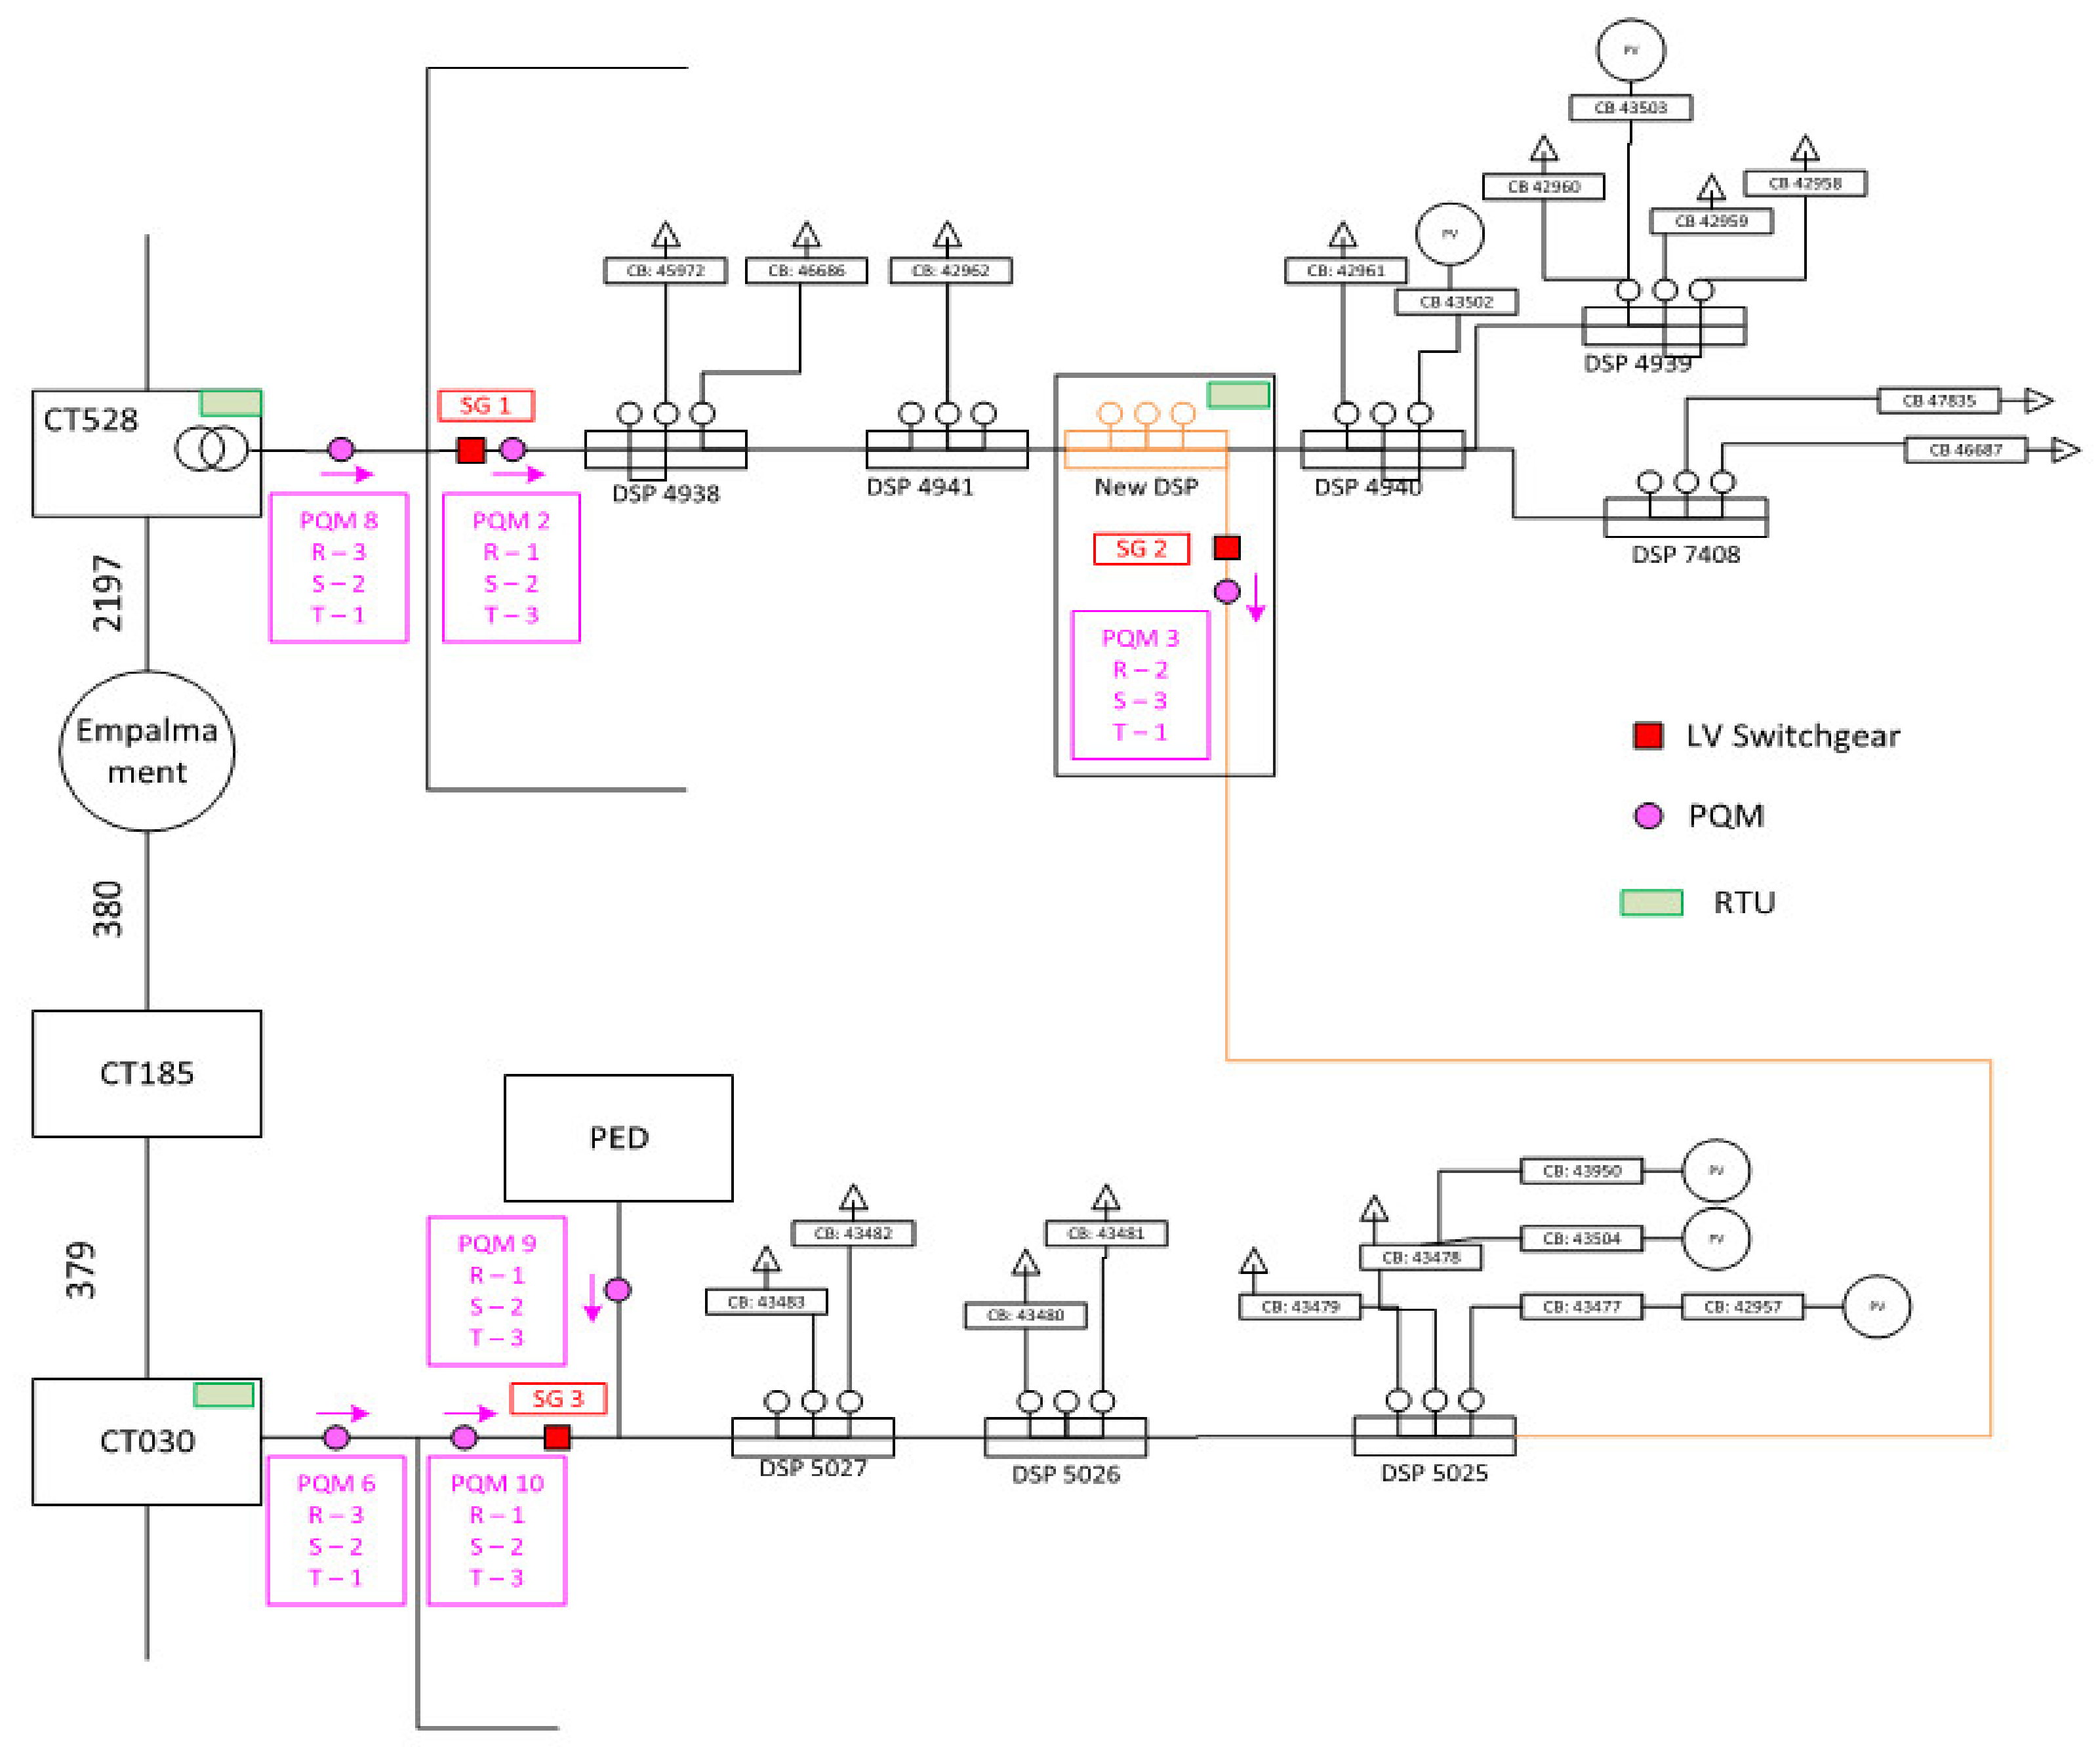
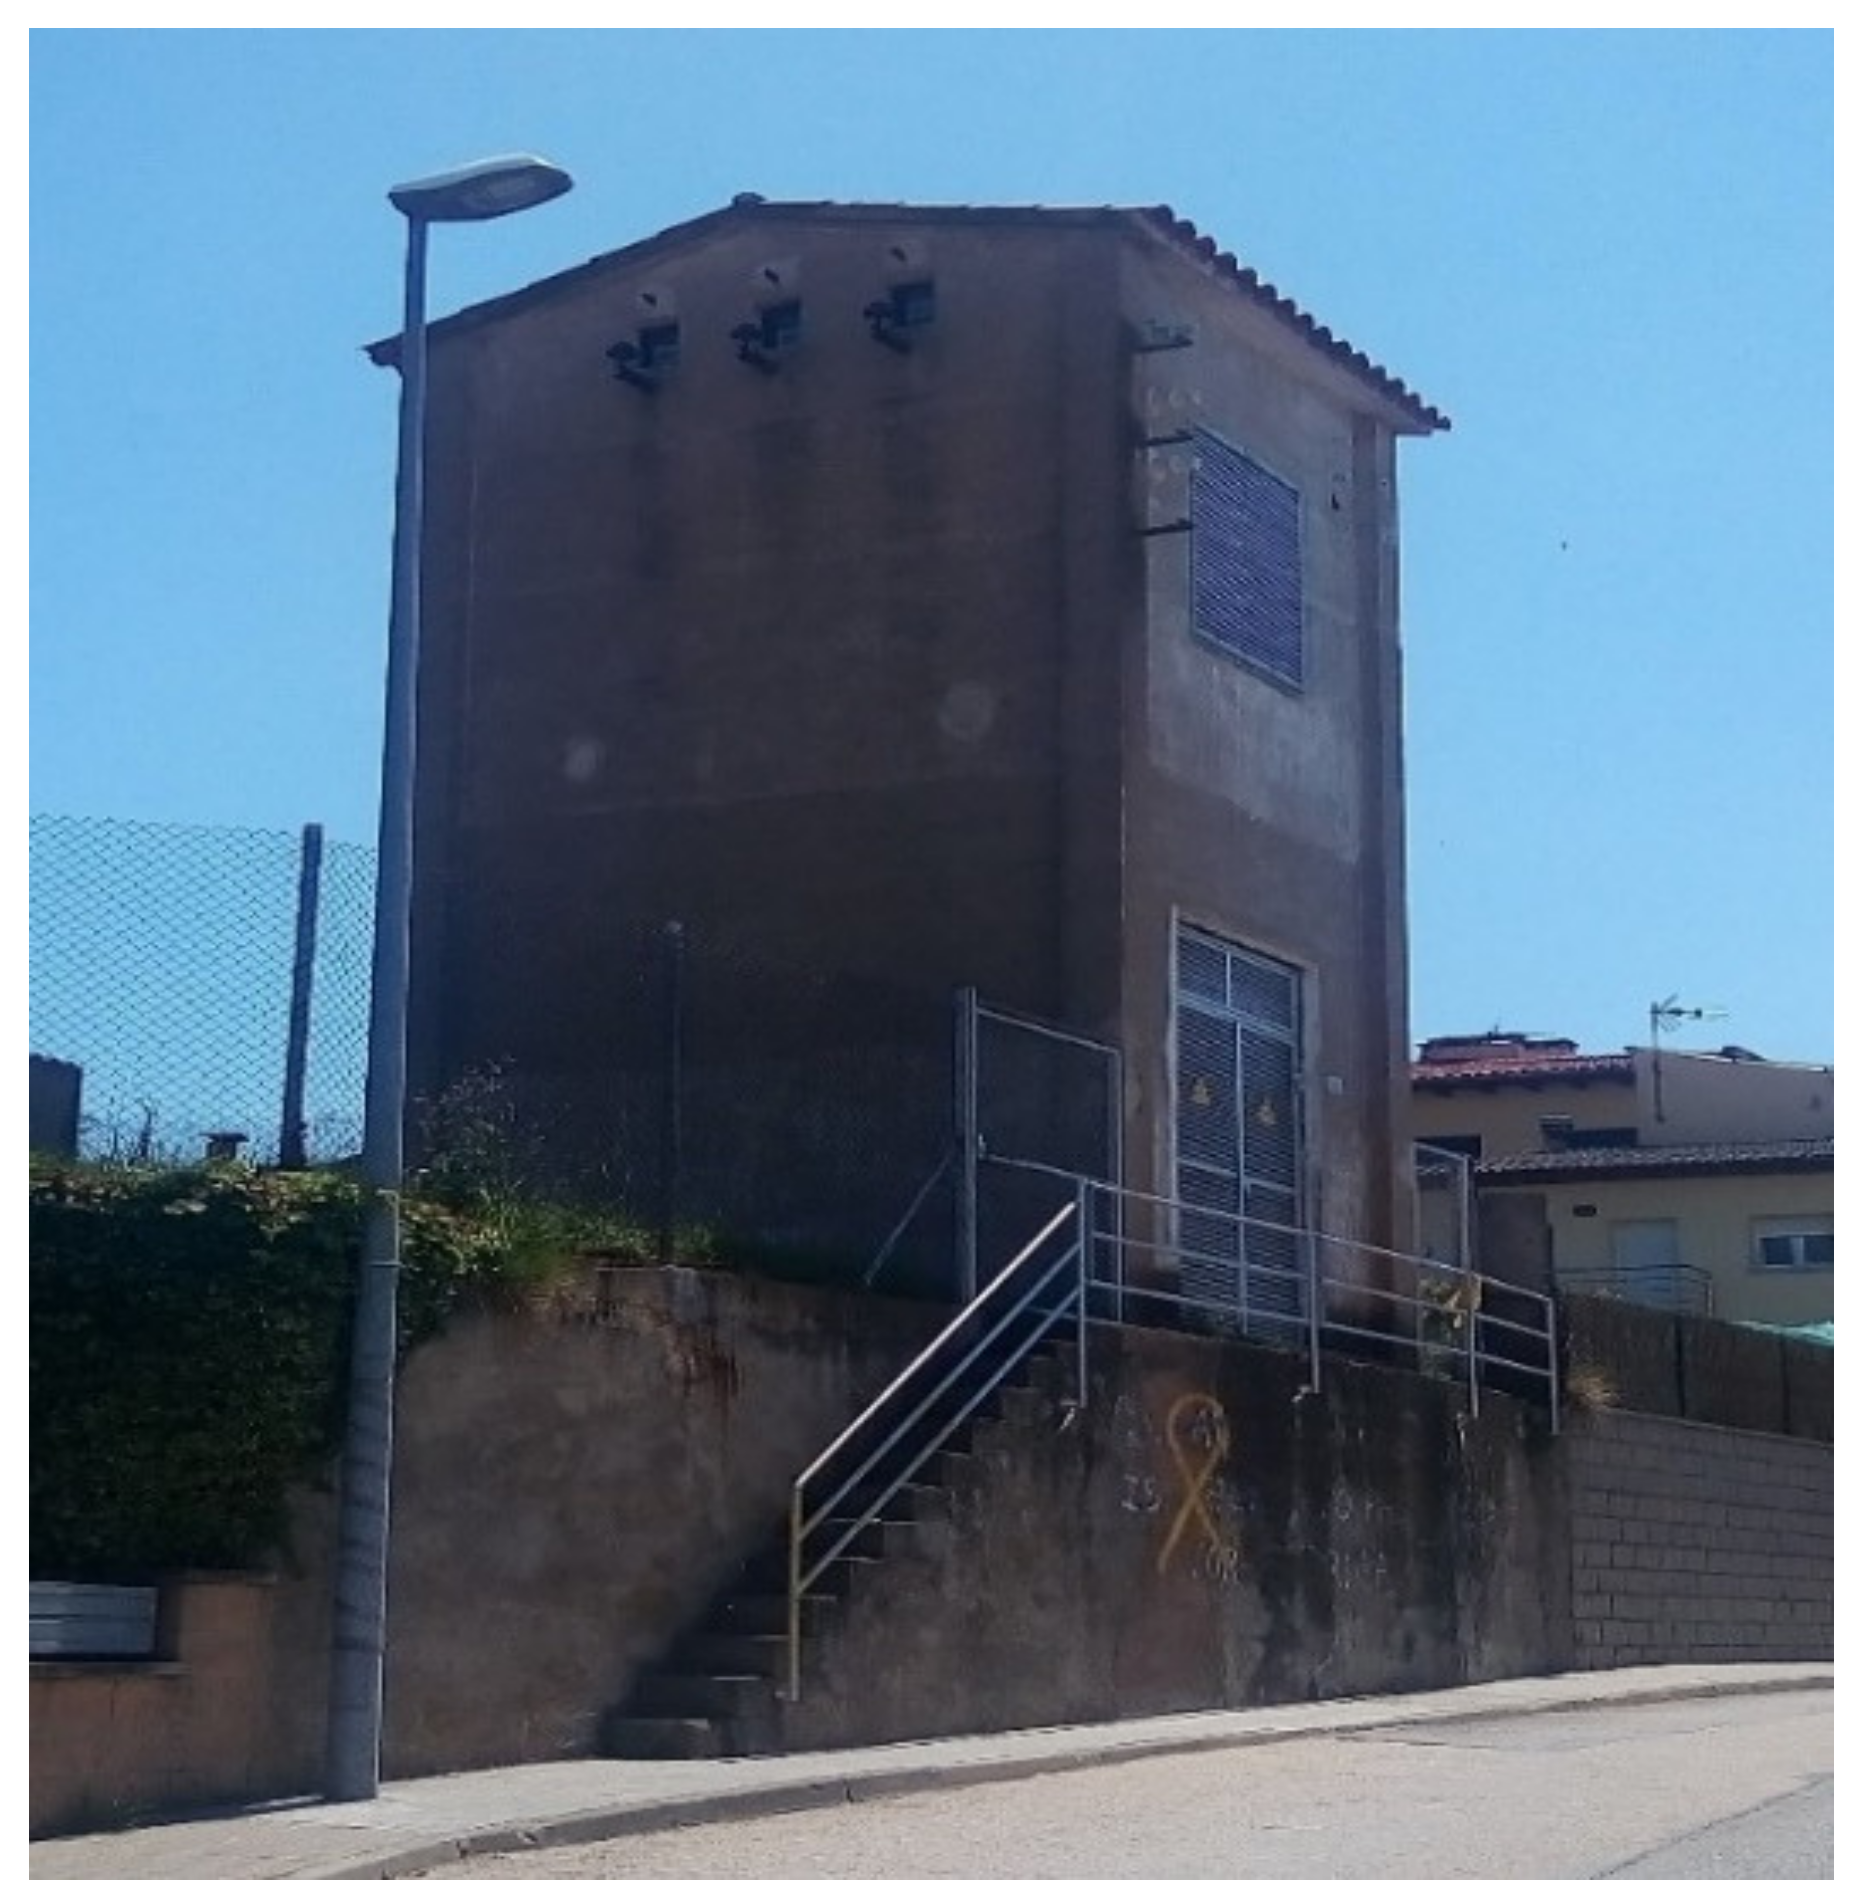
3.2. The Demonstration Pilot

The RESOLVD technology has been tested in a pilot integrated into a semi-urban area of the distribution grid operated by Estabanell Energía (EyPESA) in the province of Barcelona (Catalonia, Northeast Spain). The pilot (see Figure 3 for the schematic diagram) covers two secondary substations (SS) feeding 25 consumers and five PV plants. It is composed of two low-voltage (LV) three-phase lines, deriving from two different secondary substations (SS-A and SS-B). Blue arrows represent the supply points, while the yellow circles stand for the PV installations. The LV allows reconfiguration by operating three switchgears, also permitting operation in a ring configuration. Residential consumers are normally single-phase fed (phase + neutral or two phases).
In Table 1, the values of the rated power of the transformers and the total contracted and generation power installed are summarized. It should be noted that the MV/LV transformers are oversized with respect to the load of the area. This is because, some years ago, the two substations had to also supply two high-load factories that have now closed.
Figure 4 shows a simplified schematic representation focusing on power electronic devices’ (PED) connection with the pilot area. It should be noted that the power electronics and the batteries are installed at the beginning of one line fed by SS-B. This scheme represents the possible grid configurations that can be implemented during the test phase.
Smart meters and power quality monitors installed at the beginning of the two feeders and in the point of common coupling of the PED were installed to collect data used during the validation phase. The PED and the batteries were installed in the SS-B (Figure 5). This location has been selected for space reasons, as it consists of a two-floor building, with an empty second floor. Both the PED and batteries through the battery management system (BMS) were integrated with the SCADA through specific remote terminal unit modules.

4. Cost–Benefit (CBA) Methodology

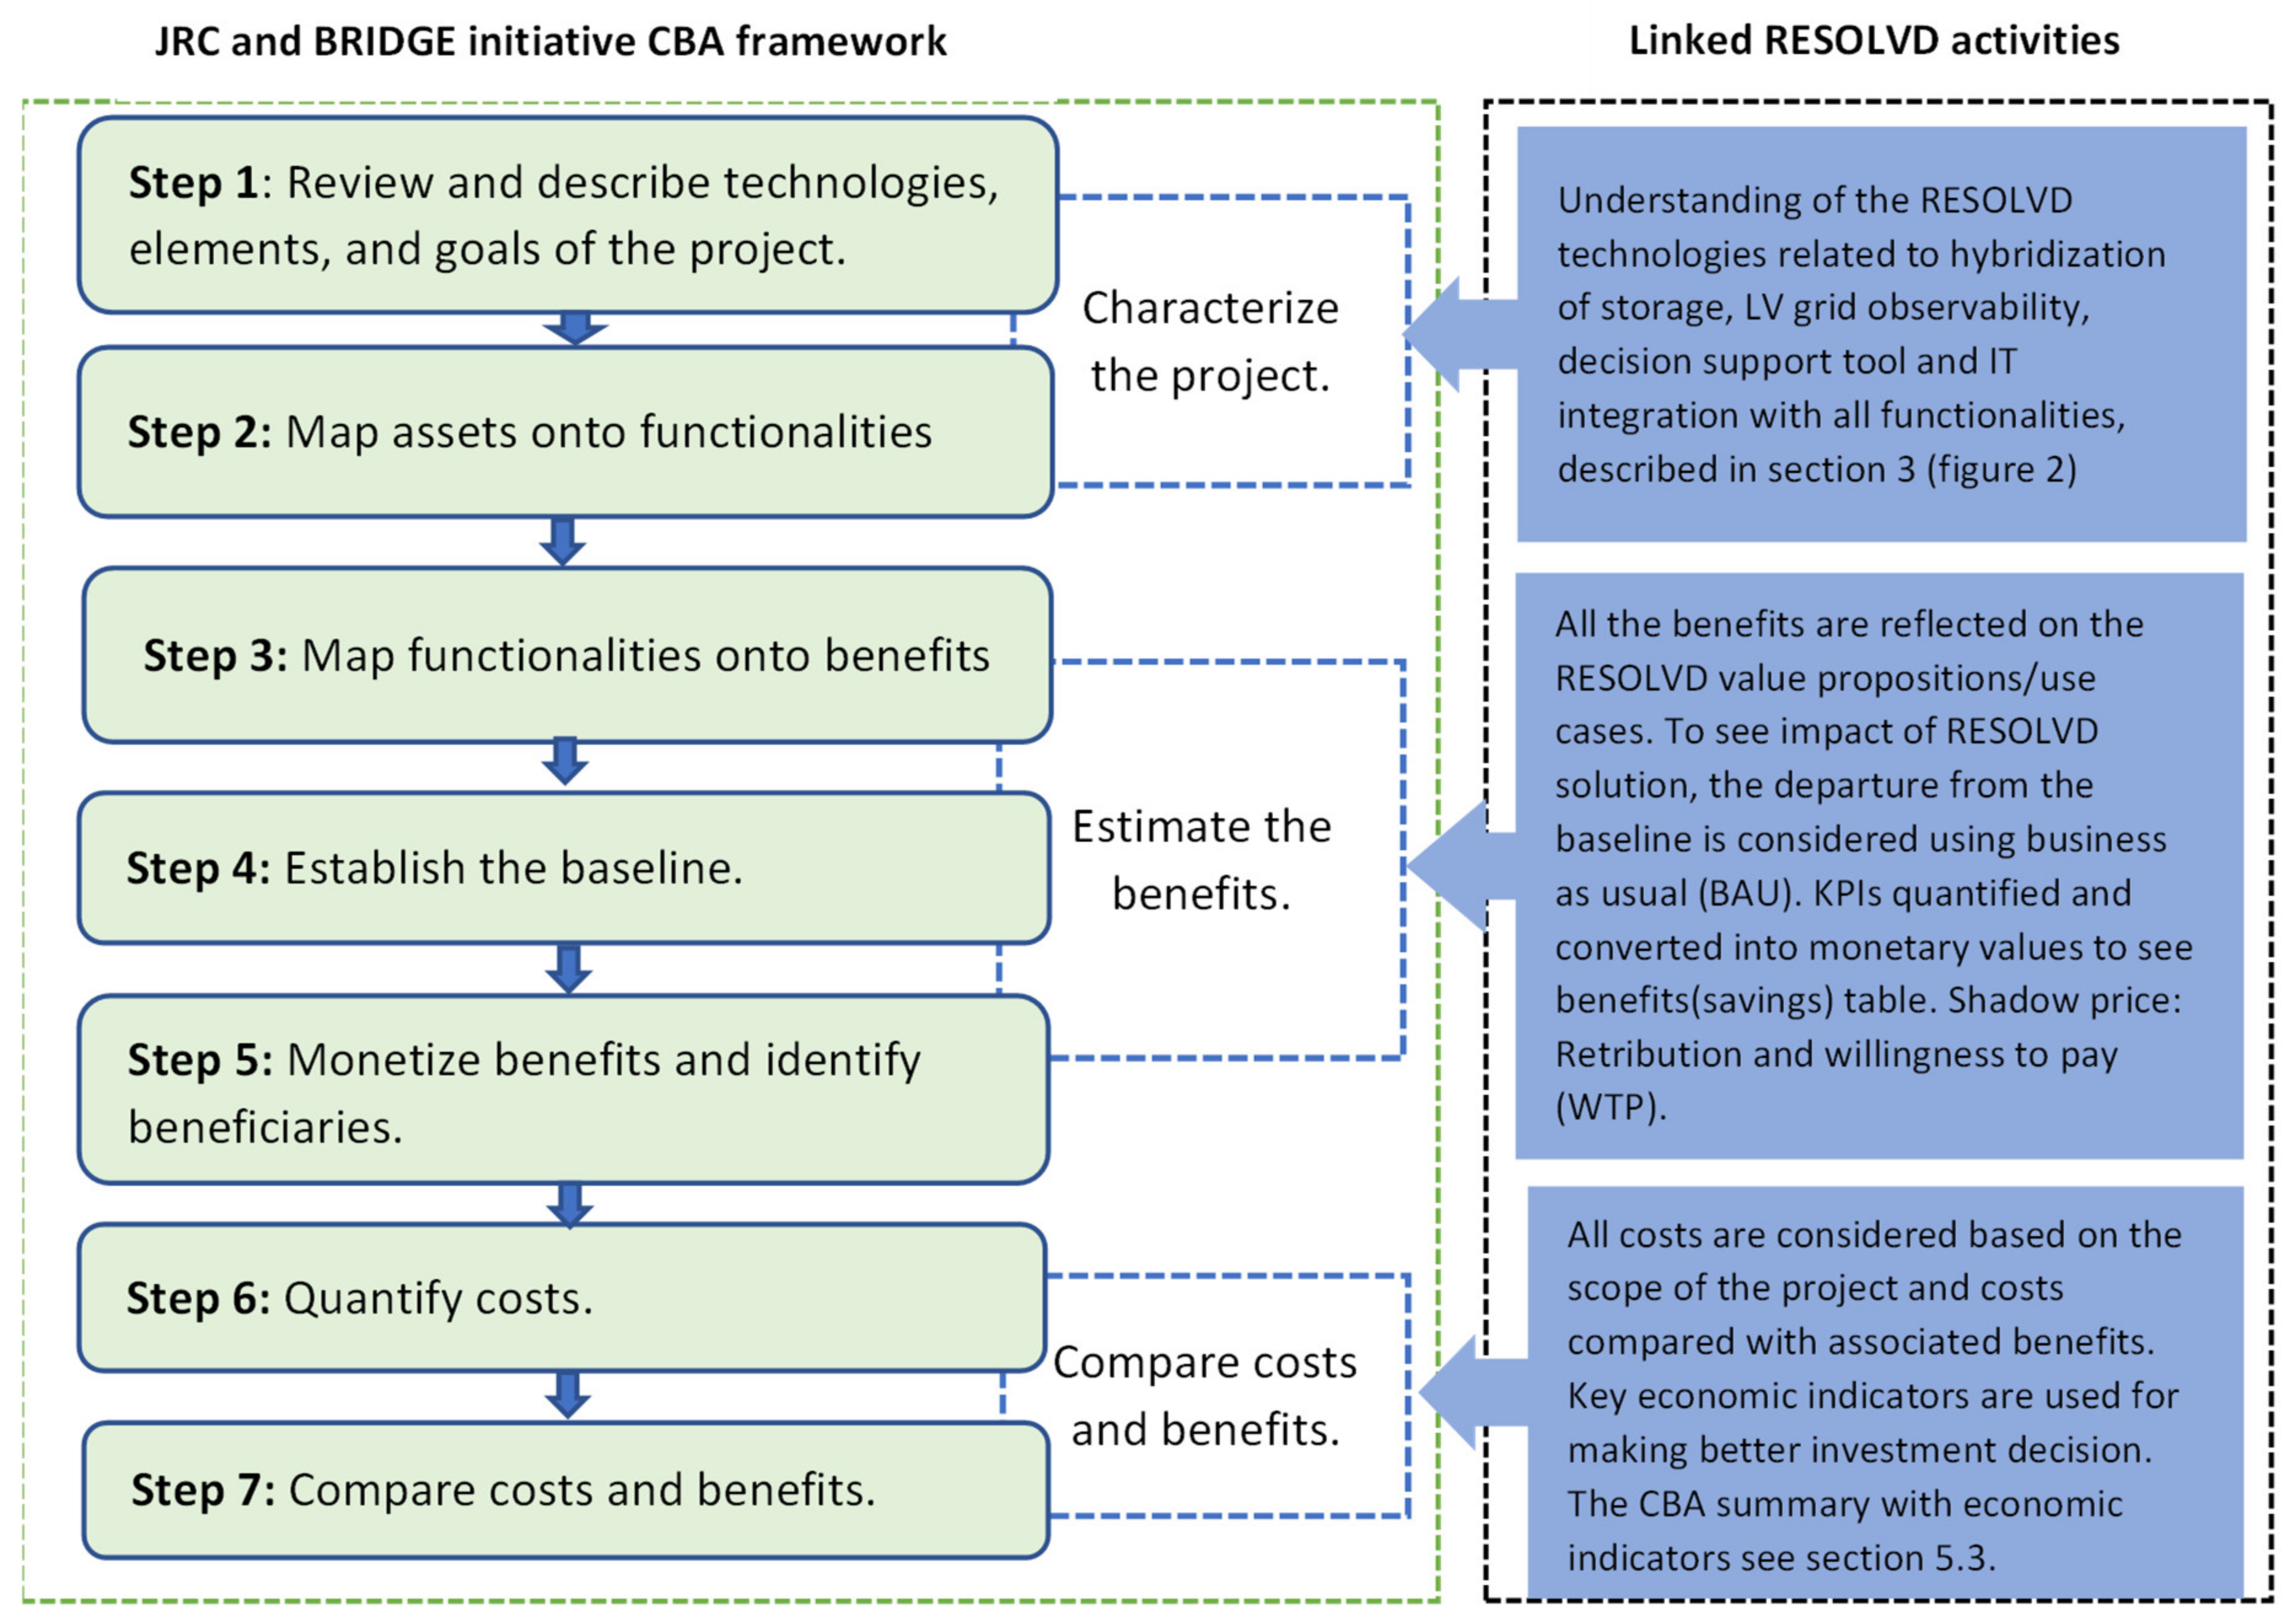
4.1. CBA Process Steps for Smart Grid Projects

CBA is an analytical tool to evaluate investments and to support policy decisions for society’s welfare [40]. In general, CBA concepts investigate the opportunity cost in a long-term perspective, which depends on a set factor, such as the sector, discount rate, forecast future costs, and other economic indicators quantified in monetary terms. The EU BRIDGE initiative and the European Commission’s Joint Research Centre (JRC) recommended the CBA framework to be followed for smart grid projects [41]. In RESOLVD, similar process steps were followed by characterizing the project, quantifying the benefits, and, finally, comparing the benefit to cost to see if the benefit outweighs the investment cost (see linked RESOLVD activities in Figure 6 highlighted in blue color).
Indicators used to perform CBA are defined in Section 4.2. Using the indicators two scenario tests were performed. The first scenario test focused on assessing the scale-up potential of the RESOLVD solution from an economic point of view. Here, the solution was scaled up from a small pilot site to selected numbers of sub-stations (SS) of the DSO. The scenario test assessed the willingness to pay (WTP) for solutions under the software as a service (SaaS) model. The WTP measures the maximum amount DSO would be willing to pay to gain the desired outcome or, alternatively, the maximum amount that DSO would be willing to pay to avoid undesirable outcomes. In the second scenario test, it was assumed that software developed under the project is provided as a service rather than as a product to the DSO. This results in different cost structures of having an annual service fee for software instead of one lump-sum cost.

4.2. Economic Indicators for CBA

In this paper, the net present value (NPV), the internal rate of return (IRR), and payback period were considered for performing the CBA analysis. NPV is calculated using formula (3), while IRR is equal to discount rate when NPV is zero. The payback period is defined as the time taken by net benefits to overcome initial investments. The benefit–cost ratio is calculated based on the sum of all present values of quantified benefits divided by the present values of all costs. All cashflows are aggregated considering the interest rate at a time ‘t’.
Benefit - cost   ratio   =   P r e s e n t   v a l u e Q u a n t i f i e d   B e n e f i t s P r e s e n t   v a l u e C o s t s
Benefit - cost   ratio   =   t = 0 N C F t B e n e f i t s 1 + i t t t = 0 N C F t C o s t s 1 + i t t
The CBA or Benefit-cost ratio can be simplified further and presented in Equation (3) including the initial investment.
N P V = t = 0 T B t C t 1 + r t I 0
where NPV = net present value; Bt = annual benefits at time t; Ct = annual costs at time t; T = lifetime of the project; I0 = initial investment cost; r = discount rate; and CFt = cashflow at time ‘t’.
Based upon consultation with DSO (also the pilot owner of the project) project lifetime was considered as 10 years, and a discount rate of 4% is favored considering current market conditions. In the EU, the projects are usually discounted using the social discount rate of 3–5% depending on the cohesion and member state countries (JRC 2012). Thus, the assumption of a 4% discount rate is within the normal range in the EU.
Quantification of costs and benefits:
The major costs and benefits are listed in Appendix A and are summarized as follows:
  • Costs: all major costs for the hardware and software development, installation, personnel, services cost, such as cyber security.
  • Shadow price: for calculating willingness to pay for SaaS, a shadow price is considered based upon other existing software used by the DSO.
  • Benefits from technical indicators: in the project, a total of 12 indicators, nine technical KPIs, including the three control indicators (CI), have been defined, which are converted into monetary values. The process of converting these indicators to monetary value is qualitatively described in Table 2. Details on the project indicators can be found under public deliverable D5.1 of the RESOLVD project [42].
  • Benefits from remuneration: these are considered based on the DSOs savings from the remuneration formula and described in the next sub-section.
Benefit from remuneration.
Some of the benefits relate to different KPIs and the benefits are calculated based on the assumption of the remuneration formula. In this connection, the Spanish Comisión para lospara los Merecados y la Compenténcia (CNMC) establishes for calendar years, by resolution and after hearing the interested parties, the remuneration recognized to each DSO for the distribution activity. Before November 15 of each year, the CNMC will submit to a public hearing the total remuneration proposal to be received the following year by each of the DSOs. The remuneration of the distribution activity recognized to the DSO (i) and in the year (n) for the performance of its activity, year n−2 will be determined by formulation (4).
R n i = R I n i + D E S P n , 15 n 2 i + T E R n , 15 n 2 i Financial   business + C O M G E S n i + R E V U n i O & M + R O T D n i Commercial   cycle + P n i + Q n i Efficiency   incentives
where:
R n i : is the return on investment to be received by company (i) in year (n).
R I n i : is the investment remuneration to be received by DSO (i) in year (n) for the facilities of distribution company i with commissioning prior to 1 January 2015.
D E S P n , 15 n 2 : is the investment remuneration to be received in the year (n) for the maneuver’s offices and distribution energy control center that have been carried out by the distribution company i in the years 2015 to n − 2, both inclusive.
T E R n , 15 n 2 : is the return on investment to be received in year n for the properties and lands associated with new electrical installations that have been carried out by the DSO (i) in the years 2015 to n − 2, both inclusive.
C O M G E S n i : is the manageable component of the remuneration to be received in year (n), which will be calculated for each DSO (i).
R E V U n i : is the remuneration for the extension of the useful life for year n that a DSO (i) will receive for all those distribution facilities, which, having exceeded their regulatory useful life, remain in service in year n − 2, if availability is proven effective of each of said facilities.
R O T D n i : is the term of remuneration for other regulated tasks that the DSO (i) has to receive for the year n for the development of these tasks in year n − 2.
P n i : is the term of incentive or penalty for the reduction of losses passed on to the DSO (i) in year (n), associated with the level of losses in its network between years n − 4 and n − 2.
Q n i : is the term of incentive or penalty to the quality of the service based on the DSO (i) year (n) associated with the supply quality indicators obtained by DSO i between years n − 4 and n − 2.
According to the Spanish remuneration equation, the KPIs of the RESOLVD project impact according to the following Table 2.

5. Results and Discussion

The results and discussion section are organized to respond point-by-point with the respective research questions presented in Section 1.1. This section discusses the four RESOLVD technologies with their novelty and main findings from the project to address the DSO challenges: (a) advanced power electronic device (PED) and storage, (b) observability, (c) decision support system (forecasting and flexibility control), and IT integration in DSO level.
Key results of the research from the RESOLVD project are the development of advanced technologies and integration for smart grid management, demonstration of these technologies in the real-life pilot, and testing the economic viability of the proposed solution supported by the DSO for the future investment in LV grid in a distributed network. The detailed findings of the research are as follows.

5.1. Developed Technology, Novelty, and Main Findings (Linked to RQ1)

Power electronic device (for multiple storage integration): As a result of the whole RESOLVD solution, and due to the PED, the DSO can improve the performance of the grid in terms of energy efficiency, since active and reactive power flows within the grid can be optimized. Energy efficiency was improved as: (i) since the PED is connected close to the consumption points in the network and partially fed them, distribution losses are minimized; (ii) the PED has been proved effective in managing voltage levels at the LV side of the transformer, and this also minimizes grid currents and transformer losses. In addition to energy efficiency, the hosting capacity of renewables of the network has been improved. Following the control setpoints from the DSO, the PED minimized transformer loading and mitigated current harmonic content in the network due to, for instance, PV inverters and nonlinear loads connected nearby. All in all, this permits the DSO to defer in time network reinforcements, while also hosting more DER. Further, the PED has been effective in acting as a voltage source in case of a mains failure. This is an attractive service for a DSO in a rural area, as in the RESOLVD project. Figure 7 below shows the integration of different batteries and the context of utilization.
The two battery types embedded into the PED are operated synergistically by a power-sharing algorithm explained in [43]. This algorithm optimizes how to split the total power the PED is to exchange with the network among the two battery types, considering their efficiency, degradation mechanisms, and state of charge. Degradation is associated to two phenomena: power stress and depth of discharge of cycles; and lithium-ion batteries are more resilient against degradation than lead-acid batteries. Thus, the power requested to the lead-acid batteries is limited, and also the depth of discharge (the minimum admissible state of charge is limited at 30%), while high-peak power needs are associated with lithium-ion batteries. This way, lead-acid batteries smoothly provide part of the total power needs the PED should exchange with the network, thus reducing the stress for the lithium-ion batteries that, in turn, are subjected to more stringent power requirements.
The front-end power electronics of the PED and the power inverters interfacing with the network are equipped with advanced algorithms to improve network waveform quality. This enables management of the reactive power, load balancing of the three phases of the network, and cancelling current harmonics. Relevant test data conducted on the performance of the PED while balancing loads of a three-phase network are conducted and presented in [44].
Sensors for observability: In designing the RESOLVD observability solution to support the implementation of use cases and testing of the KPIs, the emphasis has, on one hand, been given to the realization of appropriate metrology instruments and, on the other hand, the capability of efficient data communications and processing. The PQM instrument has been designed to observe the power quality parameters, and thereby the quality of supply or the impact of PED service in characteristic locations of the network. To support also direct interfacing to grid assets under control, it embeds a gateway functionality supporting the legacy control protocols. The embedded computing functionality allows for the implementation of moderate control schemes and schedules to allow for an autonomous operation. The design of the PMU instrument and edge computing solution target efficient implementation of advanced situation awareness applications in the distribution grid segment. The particular focus has been given to fault detection and localization to support fast service restoration [45]. Given the vast amount of measurement data produced by the PMU and no dedicated connectivity solution on disposal at deployment locations, the application consists of several interacting distributed services, each responsible for a specific sub-function. The data are preprocessed on edge for the purposes of event detection and model building, event classification is realized based on raw data snapshots aggregated from all affected locations, and localization is performed using the information on grid configuration, line models, and the pre- and post-event conditions. The connectivity towards the control center application is, for both instruments, realized via 4G cellular network. The three key components of observability developed in the project are shown in Figure 8.
Decision support toolkit (forecasting and flexibility control): Grid operation scheduling avoids exporting energy (exported 0) and, at the same time, storage is managed to reduce peaks of demand. Thus, the main contribution to loss reduction is achieved by flattening the curve. This is quantified, on average, by reducing the peak around 18% and the variability of the curve by 43%. A generalized reduction in peaks at the low-voltage grid supposes a substantial increase in efficiency of overall power system (transport losses depends on the square of current) and the consequent reduction in emissions (according to the energy mix). However, this has a cost. In the experimental pilot, the consumption of the PED and battery is around 6.5% of total energy managed (more than 4% is consumed by the PED) in the pilot. This supposes increasing the total demanded energy by around 4%. This elevated percentage is mainly because the PED is somehow oversized, and it is capable of managing larger peaks of power and amounts of energy than the pilot demand in the current state. This increase could be compensated by an increase in local production, resulting in an increase in hosting capacity. Due to the increase in energy required to run the PED and battery, it is recommended to limit the operation of the GOS only when the excess of PV is enough to compensate for this consumption. During the test, only dates 5, 8, 10, and 12 February 2021 produce an excess of generation (between 5.8 and 9.6 kWh), and this excess does not compensate the losses in the PED and the batteries (between 18.1 and 18.6 kWh). The technology developed in RESOLVD enabled the DSO to achieve the following key findings and improvements: hourly energy (aggregation of SM at bus level) forecasting error (MAPE) of 20%, peak reduction by 18%, and 0% exported energy (at SS level). Besides the key findings, the technology enables provision of the additional features revealed, such as 97.5% accuracy on fault detection (high impedance faults), 3.8% false alarm, and missed detection of 0%.
Novelty in Integrating IT systems: RESOLVD implemented a solution for integration of the novel applications of the project, not only in between them, but also with legacy systems of the DSO, by implementing an innovative and standards-based enterprise services bus (ESB) solution. Being compliant with the IEC 61968 standard, this solution comprises an integration middleware with a focus on the smart grids domain.

5.2. Quantified RESOLVD Benefits (Linked to RQ2)

All savings from each KPI and control indicator are aggregated to realize the direct benefits of the project. When available, control indicators based on existing technical standards have been used to validate the fulfillment of technical conditions (e.g., EN-50160 is the power quality standard that specifies the acceptable ranges for the parameters that define the supplied electric waveform). The benefits derived from the analyzed KPIs are quantified and summarized in Table 3 below. The results in this table show the benefits, in EUR, calculated from the changes in business-as-usual scenarios (with and without RESOLVD). Most of the KPIs are quantified but few KPIs are converted into two benefits based on the assumption of measuring two KPIs. For example, KPI-7 and KPI-8 are related to the devices and measure the accuracy of the software solution. In this case, for the CBA, hypotheses have been taken based on the benefit to locate an electrical fault and simplify the onsite work operation into a reduction in the asset stress. As some of the consortium members are business entities, some of the values are anonymized and described in some ranges instead of specific monetary values (Table 3).
The quantified benefits after the RESOLVD project implementation were calculated based on the KPIs defined and compared with the business-as-usual scenarios (BAU). All monetary values are registered in Table 3. Since some of the savings and benefits are business sensitive, the results are put in ranges for anonymity after agreement with partners. For example, in connection to the hosting capacity (HC) of the grid and in line with the project objective, the KPI-03 is defined to show the increase in DER hosting capacity in an LV network (%kVA with respect to the current maximum limit) and calculated as below.
% C h a n g e   g a i n e d = H C   w i t h   R E S O L V D H C   w i t h o u t   R E S O L V D H C   w i t h o u t   R E S O L V D × 100
189   kVA 138   kVA 138   kVA × 100 = 36.95 %
Cable capacity: 330 A
330 A × 400 V × 1732= 228,624 kVA
Assuming the power factor cosFi = 1 ➔ 228,624 kW
229 kW × 36.95% = 84.5 kW of capacity
84.5 kW × 24 h × 365 days = 740.220 kWh year
740.220 kWh year × 0.0350333 € = 25,932 €/year i.e., >25,000 Euros/year.
Similarly, the savings from the rest of the KPIs are calculated and the results are summarized in Table 3 below. For some of the KPIs, the average day-ahead price of the Spanish market is used (see Appendix B).

5.3. Cost–Benefit Analysis (Linked to RQ3)

5.3.1. Economic Viability of RESOLVD Technology

The CBA result clearly showed the economic viability of RESOLVD solution and the high scalability and replication potential of the project (see Table 4). The major savings come from increased hosting capacity, reduction of DSO investment through increased grid infrastructure flexibility, and the way to upgrade traditional assets by smart devices with inherent ability for real-time monitoring and control. This is relatively in line with one of the core project objectives of RESOLVD, and, therefore, savings from increased hosting capacity (see Figure 9) are considered to comprise a scale-up scenario with respect to the increased pilot size. This is carried out according to the DSO investment policy, which is up to 10% of the yearly investment on the grid infrastructure/upgrade and by ensuring the required additional costs are considered in the analysis. Because of high investment cost at the early stage of the project, the first CBA with the current pilot size of two substations (SS) showed the benefit/cost ratio less than 1. However, as the pilot size increases (scale-up) with all associated costs, such as a total cost for PMU, PQM, batteries, and PED, included, the benefit/cost ratio becomes greater than 1, with increased internal rate of return (IRR), NPV, and shorter payback periods (see Table 4 summary of CBA). The breakeven threshold is reached when RESOLVD solutions deploy on more than eight secondary substations (SS).
Considering the increase in the hosting capacity due to RESOLVD solution (Figure 10), the research summarized the economic indicators from the CBA in Table 4 below.

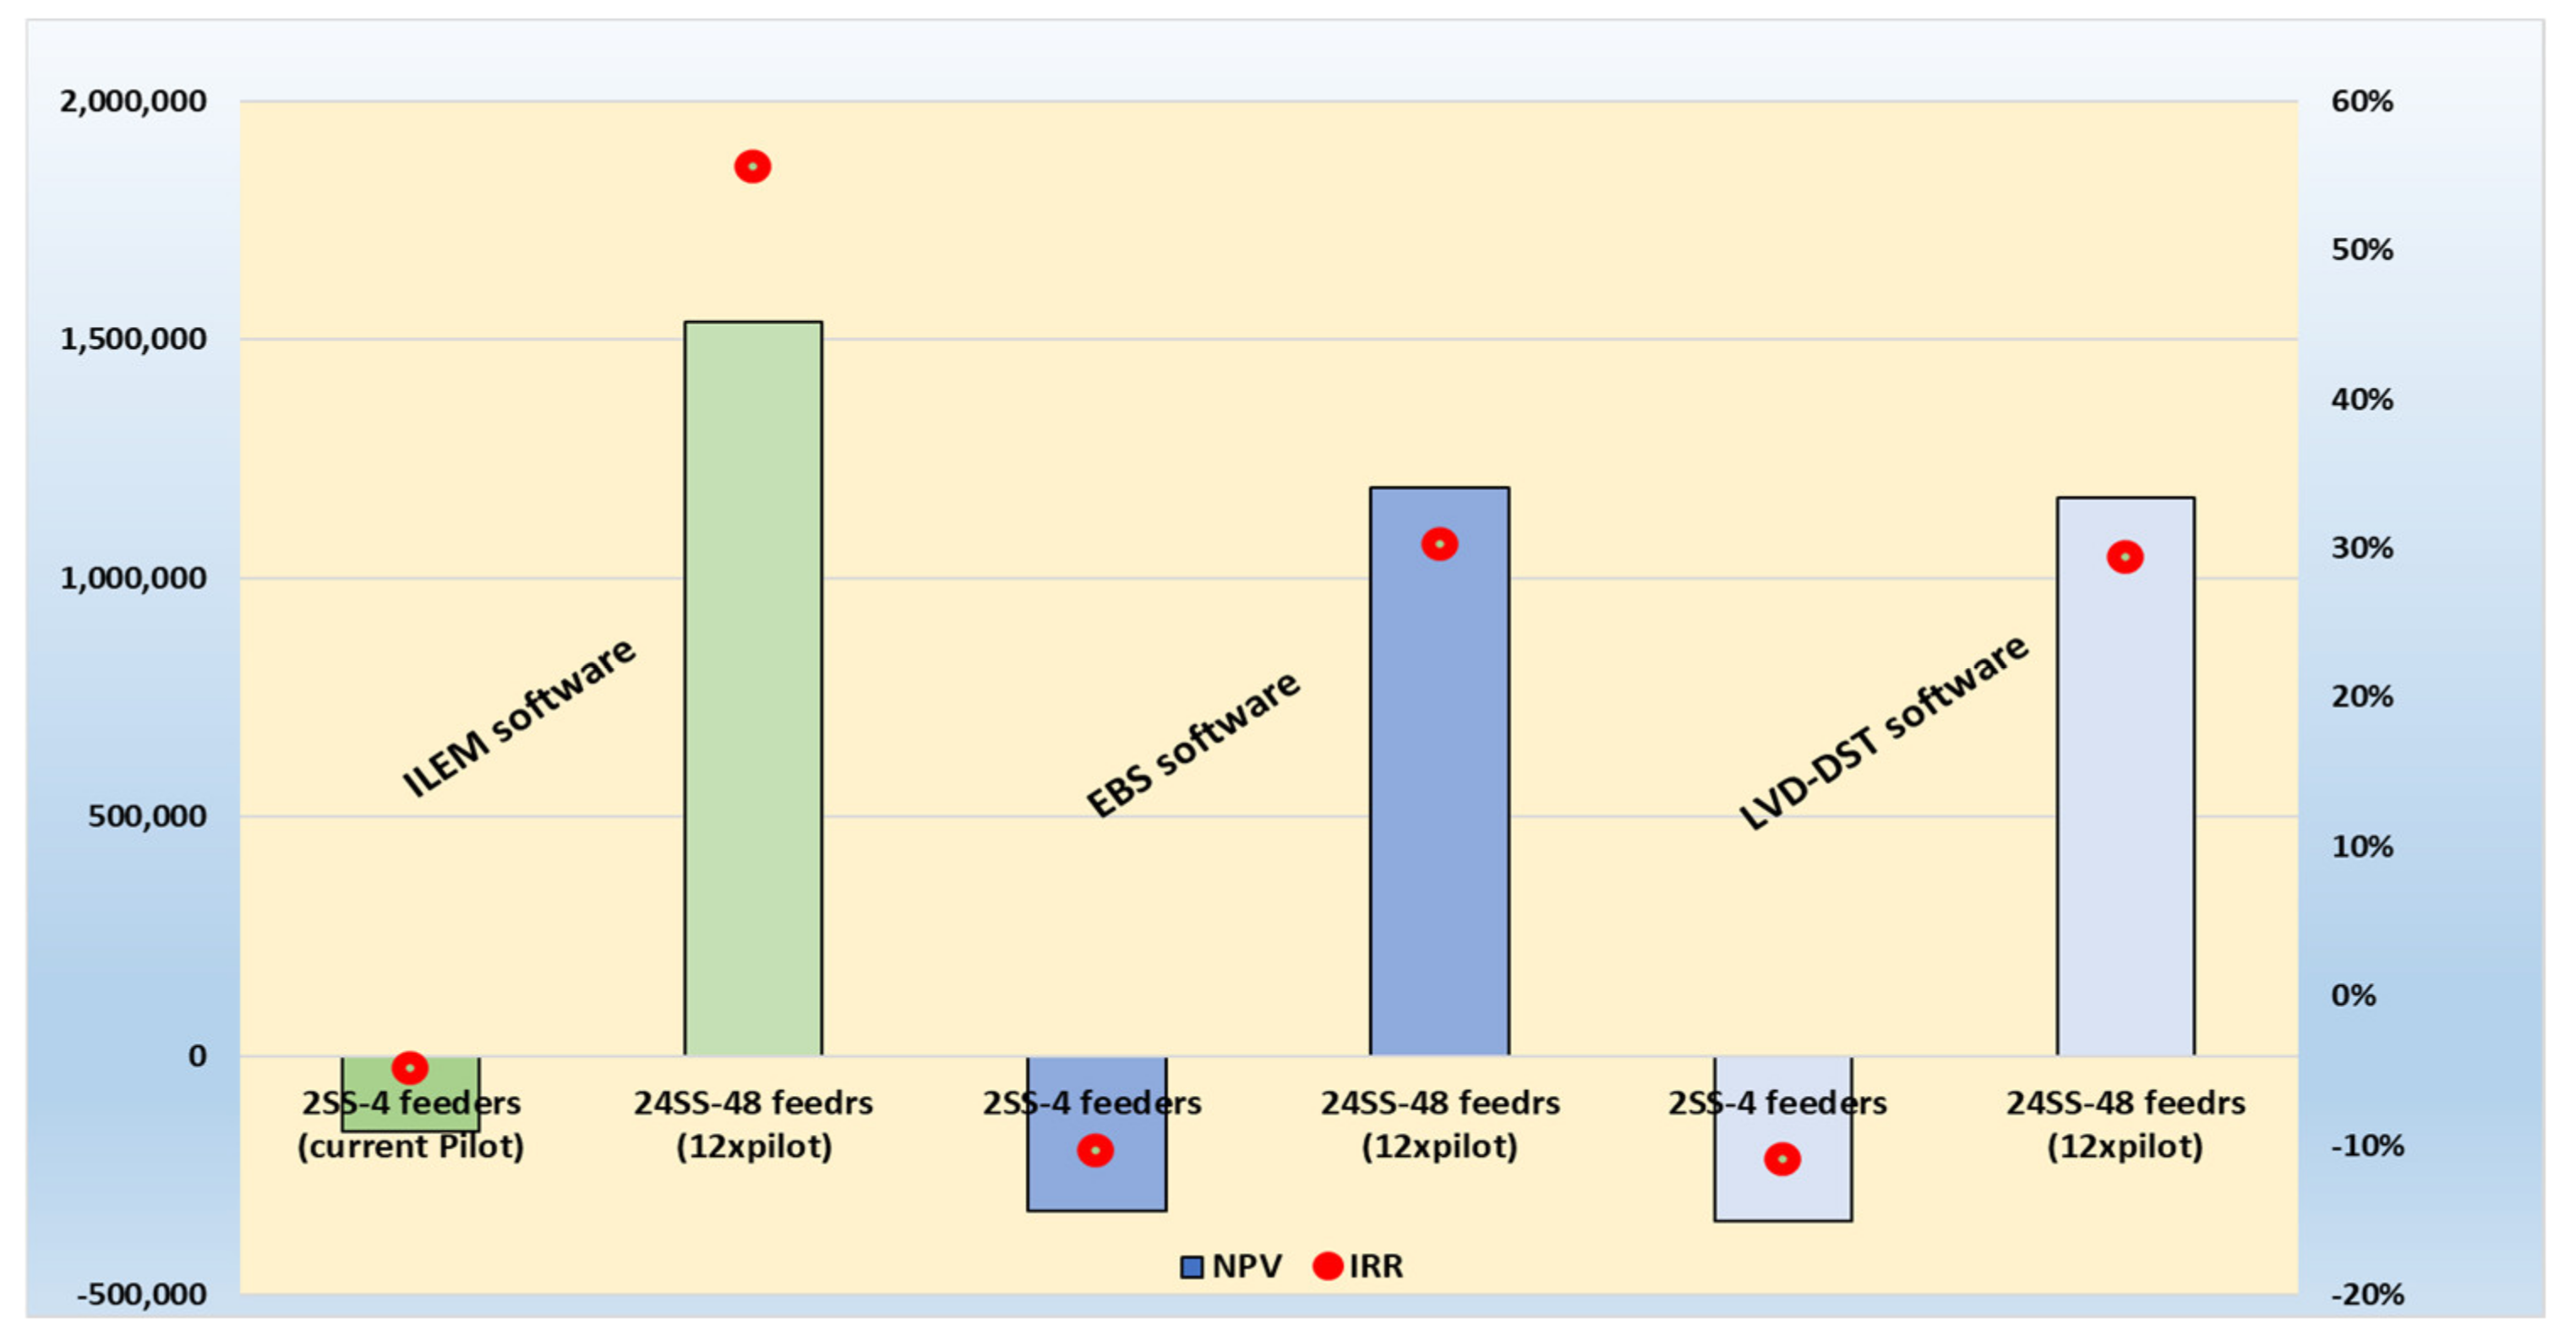
5.3.2. Scenario Test Based on the DSO Willingness to Pay (WTP) of the Software Service

From the DSO long- and medium-term energy policy perspective, to have cost-effective, reliable smart grid solutions and have security in energy supply, the WTP scenario test on major costs is needed. In this regard, one of the major costs in RESOLVD solution is software development and associated IT platform solutions. For this test, the Intelligent Local Energy Manager (ILEM) software cost was considered, which enables control and management of the PED with or without storages thanks to the link with the energy management systems (EMS) and SCADA or advanced distribution management systems (ADMS). The main reason for this test is that the regulation does not allow the DSOs to own a battery and can get the ILEM service through licensing. However, the basis for defining willingness to pay is not straightforward and, therefore, it needs to benchmark with other licensing costs. In this connection, the DSO considered similar software service costs, such as the annual licensing fee for smart meter management platforms, which is calculated based on the number of the smart meters (see Table 5).
Based on this assumption, the CBA is recalculated to test the scenario at which the DSO has a willingness to pay for the software service cost benchmarked from a similar software platform. The CBA with respect to WTP showed a positive economic indicator if the RESOLVD solutions are deployed on more than 8SS, and the payback period reduced to 2–3 years. This will give flexibility for the DSO to get the software service by involving other technology providers or aggregators while all regulatory boundaries are respected, including the battery ownership. However, the willingness to pay scenario test for the three-software platform is carried out and summarized in Table 6.
Extending the WTP scenario test with 24 SS-48 feeders, the CBA showed the payback period further reduced by close to half, with increased NPV and IRR for each software developed compared to the assumption the complete solution developed at the DSO premise (see Figure 10).

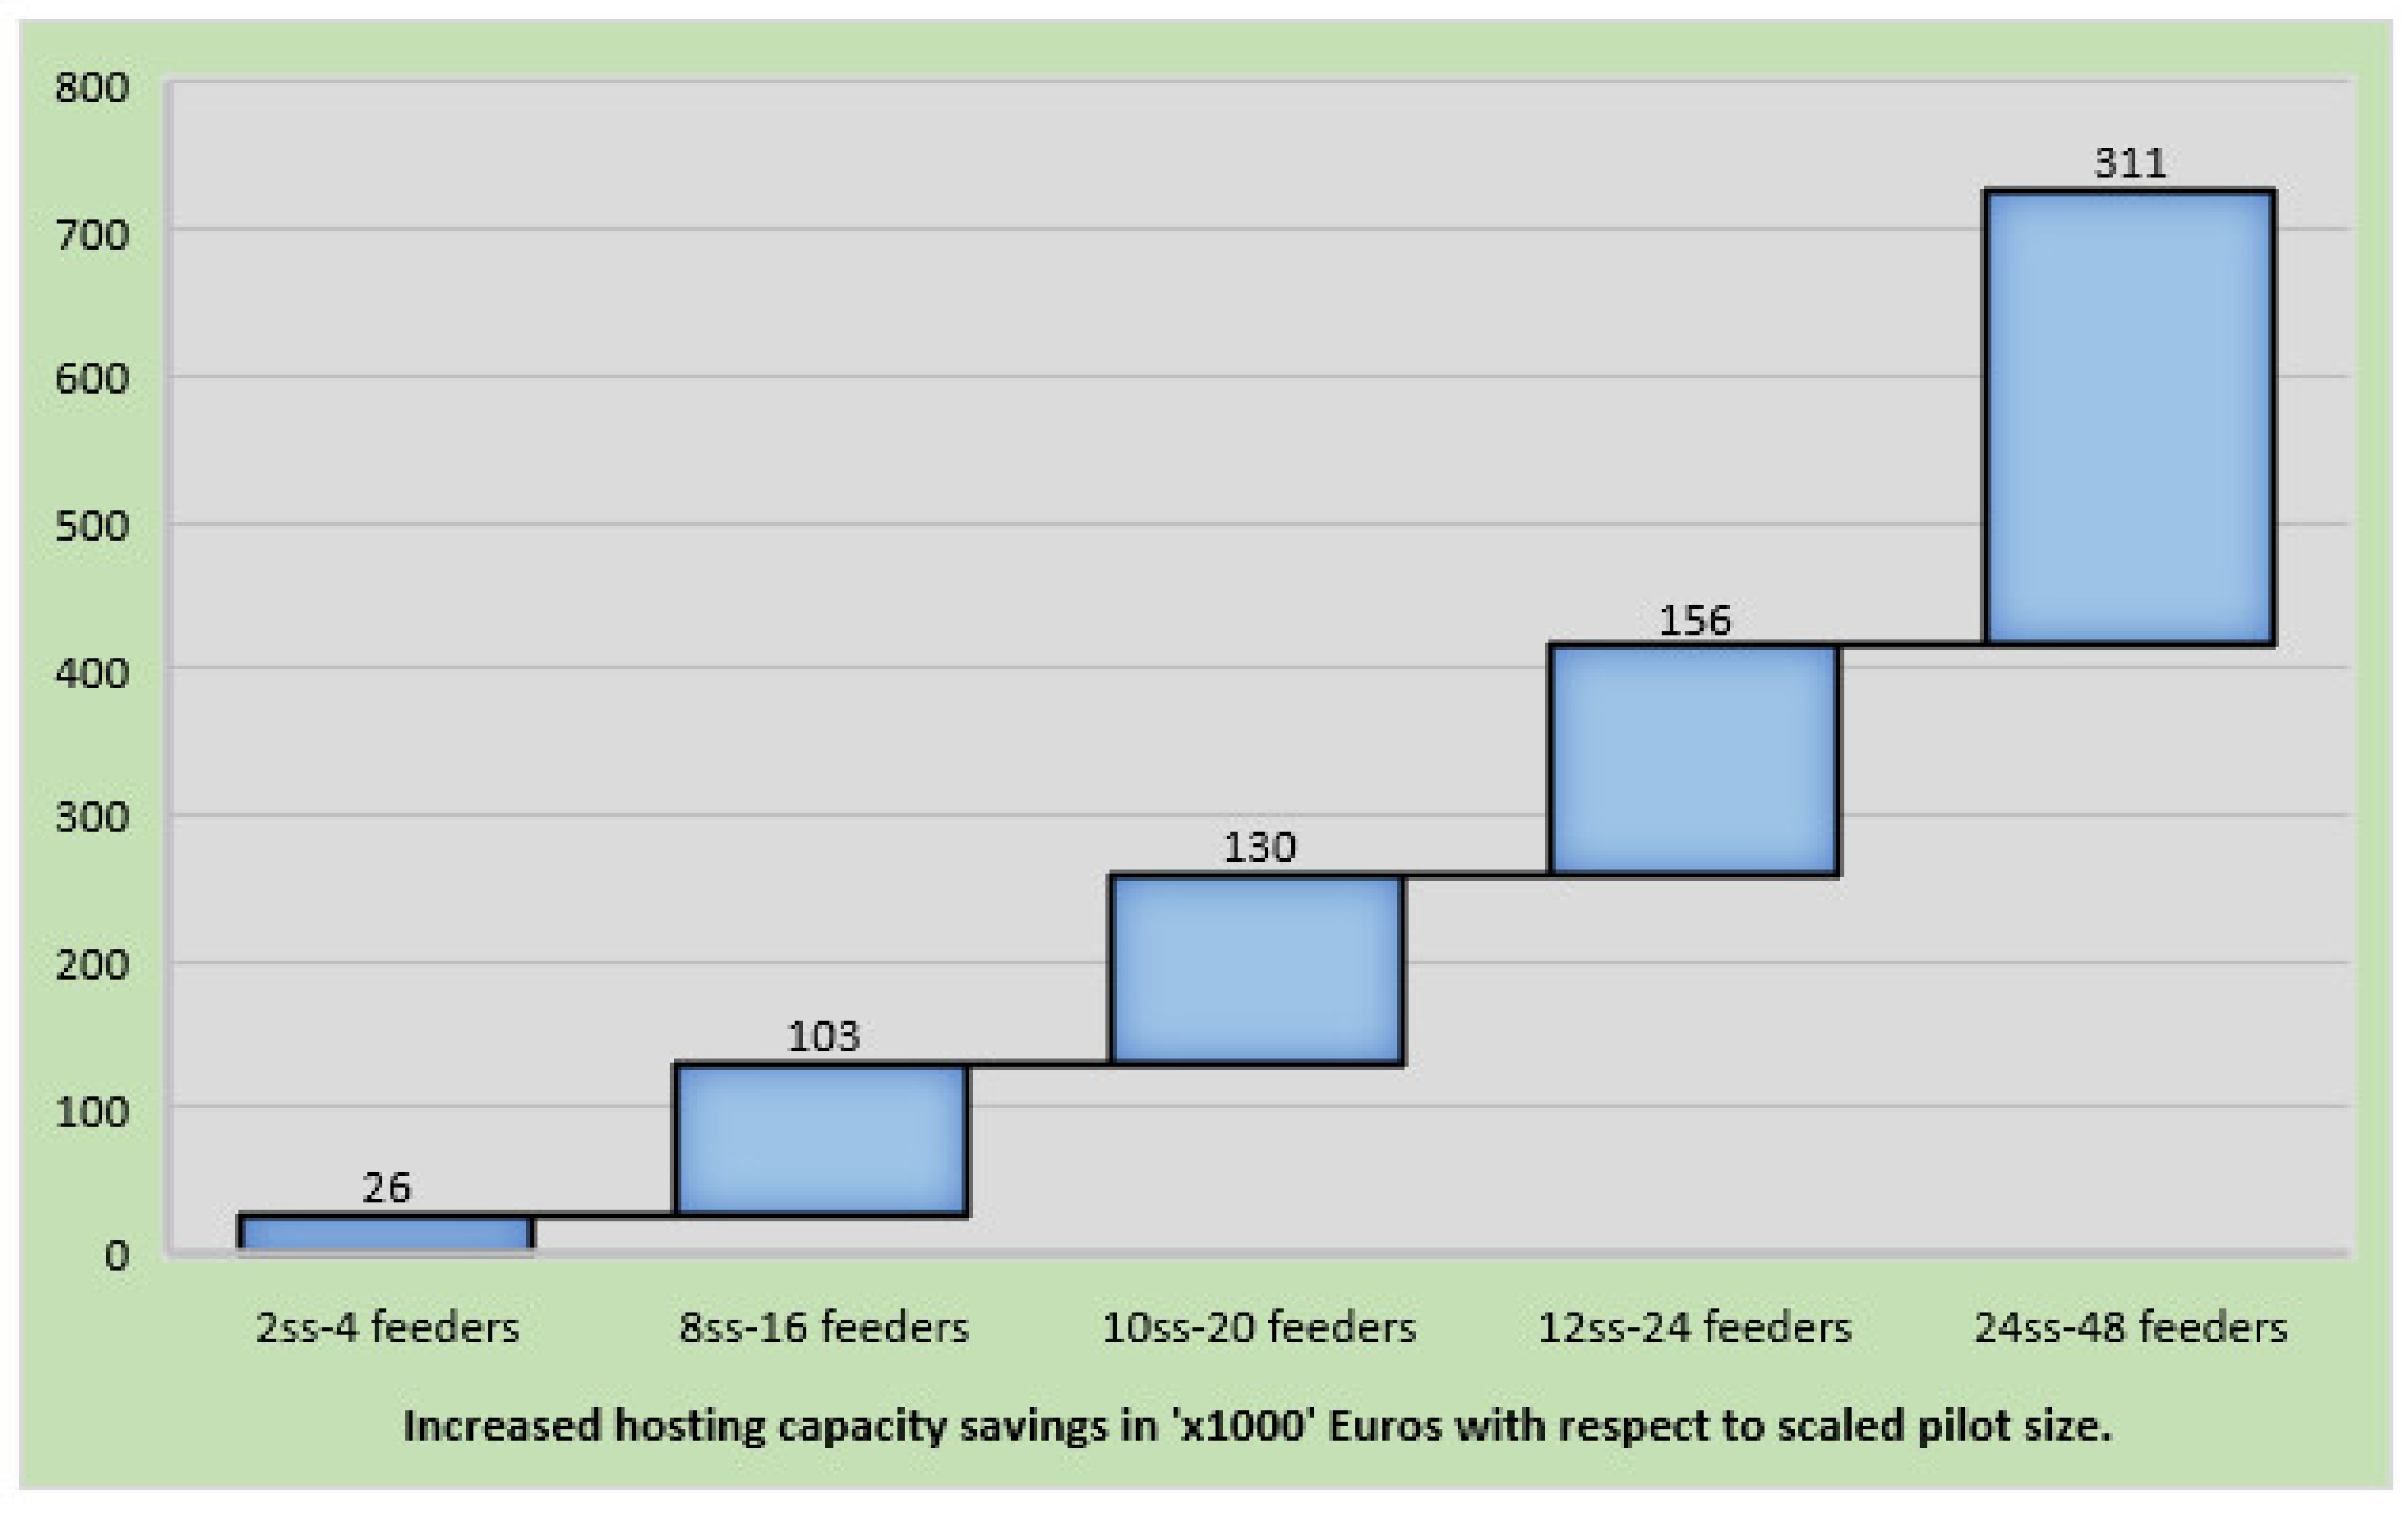
5.4. Replication and Market Potential of RESOLVD Solution

The replication and market potential of the RESOLVD solution can be looked at in two perspectives. The first one is based on the number of secondary substations available in the EU and EEA. In this regard, there is an estimated number of 4.5 million secondary substations (SS). However, as the case pilot depicted, there is the possibility that RESOLVD solution may not apply to all these substations. For example, referring to the DSO where the RESOLVD pilot was implemented, only 35% SS from the total available 907 SS could apply the solution due to different factors (e.g., physical available surfaces, the structure and topology of the distribution networks). Based on similar assumption of 35%, RESOLVD can be replicated to a large number of SS in the EU and receive a proportional benefit from increased hosting capacity, DSO investment reduction, and other associated direct and indirect benefits. From a market potential point of view, in the EU, there are about 190 large DSOs (≥100 K customers) and more than 2400 small and medium DSOs which have less than 100 K customers (See Table 7). Only within partners’ countries there are 27 large DSOs and 640 medium and small DSOs. Considering all these DSOs together with other stakeholders (aggregators, business entities/sister companies, third parties, etc.), RESOLVD could contribute to the EU targets of renewables by increasing the hosting capacity to reach high DERs and create an impact to the society at large.

6. RESOLVD Implications on Business and Policy (Linked to RQ4)

6.1. Business Implication

From WTP scenario analysis, it is found that the SaaS approach is more cost-attractive than the traditional approach of owning software. In consultation with DSO, five additional benefits of the SaaS approach have been identified, making it a more attractive option from a business perspective. These additional benefits are: (i) DSOs can obtain a predictable payment, which can be consistently budgeted in each term, (ii) SaaS removes the burden of maintaining on-site servers and software, freeing up IT staff to work on more strategic initiatives and ensuring greater solution uptime, (iii) DSOs do not have to worry about unexpected expenses associated with unplanned maintenance and/or breakdown, (iv) DSOs have access to updated software all the time, rather than buying new updates, and (v) cloud-based software can be updated in the background without any disruption to the existing deployment. Considering this attractiveness, technology developers have become interested in exploring the option of providing a complete RESOLVD solution as a service. This has been identified as an area of further research.
PED (along with storage) has shown the potential to provide multiple flexibility services to the distribution grids. It can also provide flexible services to other sectors, such as buildings, industries, and EV charging stations. Thus, there could be multiple beneficiaries of the PED, but the cost needs to justify investment for other beneficiaries. One way to make PED more cost attractive would be to stack multiple values together. From a policy perspective, DSO needs to procure these services through market mechanisms and should act as a neutral market facilitator of such services. However, market mechanisms to procure flexible services are not yet clearly defined at a local level in most of the member states. Absence of such local market limits DSOs’ ability to procure services and limits benefits derived from the value stacking capabilities of PED. Thus, for market adoption of technology such as PED, it is crucial that regulations on local energy markets are defined sooner.

6.2. Policy and Regulatory Implications

The adoption of solutions such as those developed by the RESOLVD project is directly correlated with the specific targets set by the EU and the policy linked with the measures aiming to increase the efficiency and hosting capacity of the distribution grids. The CBA outcomes presented in this paper give interesting insights, specifically to the DSOs, as to the impact that the RESOLVD solutions can have in achieving those targets/plans. The positive CBA shows that research results from the project are cost-effective in improving the hosting capacity of the existing distribution grid infrastructure, thereby deferring grid capacity investments.
From a techno-economic point of view, DSOs constantly look for ways to lower the total cost of infrastructure investments (capital expenditure, i.e., CAPEX). As demand for new infrastructure grows, DSOs look for ways to improve their management and mitigate investment risk. The CAPEX of grid expansion can be deferred by implementing technologies that improve operational efficiency of the grid, i.e., having operation expenditure (OPEX). However, DSO being a regulated business, the remuneration for investment in most of the member states in the EU is capital expenditure (CAPEX)-based. This limits DSOs to invest in innovations that are OPEX-based. An optimal mix of CAPEX and OPEX depends upon local conditions and, thus, CEER, in its recommendation to the EU commission, proposes allowing DSO to decide optimal mix. In this regard, a total expenditure (TOTEX) approach is considered promising to support innovations, as well as reduce overall costs associated with DSO business. This business approach is in line with the proposed change in business model by [46,47].
According to the new Spanish law 3/2013 (under Royal Decree-Law 1/2019), DSO remuneration may incorporate incentives, which may have positive or negative signs, to the reduction of costs of the electricity system derived from its operation or other objectives (see Section 4.2 for remuneration formula). RESOLVD results of CBA provide evidence that OPEX-based investments can be cost-effective in both increasing hosting capacity and deferring gid upgrade.

7. Conclusions

The EU energy policy principles to overcome the challenges in the field of energy include speeding up the slow progress in energy efficiency and alleviating the challenges emanating from the increasing share of renewables in a cost-effective way. This research provides concrete evidence for energy policymakers, DSOs, and technology developers by validating a complete proof of concept of RESOLVD solution in the real-life pilot to improve energy efficiency and hosting capacity with reduced investment cost.
The IT and smart LV grid solutions developed, implemented, and tested in the project RESOLVD justified the economic viability of a complete solution. The research impact was substantiated by doing a detailed cost–benefit analysis (CBA) and the results revealed that the solution offered by RESOLVD is economically viable with high scale-up and replication potential. The major savings were found from increased renewables hosting capacity and reduction in DSO investment (see Table 4 and Table 6). Both direct and indirect benefits quantified based on carefully defined KPIs, control indicators (CI), and shadow price (retribution and willingness to pay) showed positive results. These results substantiate the relevance of the proposed solution and give evidence for policymakers and other DSOs so that they can enable a speed up and facilitate the transition from the traditional grid upgrade towards intelligent grid operation and management.
Another interesting finding from the DSO, technology providers, and future smart grid business standpoint of view is the scenario test of software as a service (SaaS). The willingness to pay (WTP) scenario test based on SaaS showed that the three-software developed in the project (ILEM, ESB, and LVD-DST) reduced the payback period significantly (about 3 years on average), with higher NPV, IRR, and benefit–cost ratio. This has strong implications to the DSOs and technology developers to plan for the large-scale deployment of the solution considering the whole value chain, including manufacturing of the necessary hardware and software components for the complete solution. This paves a way forward and provides an in-depth insight to exploit the benefits gained from grid operational expenditure (OPEX) and transforms the traditional CAPEX to TOTEX. From the DSO perspective, intelligent local energy managers under the SaaS plan can make the solution economically attractive in the short term not only from the NPV values, but also from the need of high interactions with the end-user and proximity of the ILEM.
To summarize, the findings in this research strengthen the EU policy in the context of improved energy efficiency, increasing hosting capacity, and promoting low-carbon and clean energy technologies to drive the energy transition through the RESOLVD cost-effective solution, which, in turn, improves competitiveness. Further, it facilitates and speeds up the process of ensuring energy security through solidarity and co-operation between EU countries, which is one the EU energy policies (e.g., in RESOLVD, seven partners from Spain, Norway, Austria, Slovenia, and Greece involved).

Author Contributions

Conceptualization, A.M.B. and S.P.; methodology, A.M.B.; software, J.M., I.L., M.S., and F.D.-G.; validation, R.G.-F.; formal analysis, A.M.B. and S.P.; investigation, A.M.B.; resources, H.T.; data curation, A.M.B. and S.P.; writing—original draft preparation, A.M.B. and S.P.; writing—review and editing, H.T., A.M.B., S.P., J.M. and I.L.; visualization, J.M., R.G.-F., A.M.B. and S.P.; supervision, H.T.; project administration, H.T. and S.P.; funding acquisition, J.M. and H.T. All authors have read and agreed to the published version of the manuscript.

Funding

The RESOLVD project has received funding from the European Union’s Horizon 2020 research and innovation program under grant agreement No. 773715. The information and views set out in this study are those of the author(s) and do not necessarily reflect the official opinion of the European Union. Neither the European Union institutions and bodies nor any person acting on their behalf may be held responsible for the use which may be made of the information contained therein.

Institutional Review Board Statement

Not applicable.

Informed Consent Statement

Not applicable.

Data Availability Statement

Not applicable.

Conflicts of Interest

The authors declare no conflict of interest.

Abbreviations

AMIAdvanced Metering Infrastructure
BAUBusiness As Usual
BMSBattery Management System
CAPEXCapital Expenditures
CBACost–Benefit Analysis
CIMCommon Information Model
DERDistributed Energy Resource
DGDistribution Generation
DMSDistribution Management System
DSODistribution System Operator
EESElectrical Energy Storage
EFEnergy Forecaster
GISGeographic Information System
GWGateway
IEDIntelligent Electronic Device
ILEMIntelligent Local Energy Manager
JRCJoint Research Centre
KPIKey Performance Indicator
LVLow Voltage
MDMSMetering Data Management System
MVMedium Voltage
OPEXOperating Expenditure
PCSPower Conversion System
PEDPower Electronic Device
PMUPhasor Measurement Unit
PQMPower Quality Monitoring
RQResearch Question
RESRenewable Energy Source
SaaSSoftware-as-a-Service
SCADASupervisory Control and Data Acquisition
SGSmart Grids
SGTSmart Grid Technologies
SGAMSmart Grid Architecture Model
SMSmart Meter
SSSecondary Substation
TOTEXTotal Expenditure
TSOTransmission System Operator
WAMSWide Area Monitoring System
WTPWillingness-To-Pay

Appendix A

Table A1. Some list of cost and benefit attributes.
Investment Costs (Development and Service)Costs in EUR
Intelligent Local Energy Manager (ILEM) development (PED + Personnel+ batteries)xxxxxxx
Remote Terminal Unit (RTU)xxxx
Low voltage switchgear (LVSG)xxxx
Phasor Measurement Unit (PMU)xxxx
Phasor quality meter (PQM)xxxx
Operation cost(effort)xxxx (DSO retribution)
PSS power system supplyxxxx
Gatewayxxxx
Routerxxxx
EBS software platform (development cost)xxxxxxx
LVD-DST software platform/forecasting and schedulingxxxxxxx
Cyber security servicexxxxxx
Other investment costs
Replacement costxxxx
Residual cost(xx)
Revenue/SavingsSavings in EUR per Year
KPI-1: Power loss reduction due to waveform quality improvementxxx
KPI-2 Improvement of the energy profile in the secondary substationsxxxx
CI-1 Efficiency rate of the PED and the energy storage system-xxx
KPI-3 Increase of DERs hosting capacity in LV networkxxxxx
KPI-4 Reduction of DSO investmentxxxxx
CI-2 DSO operation expenditures with respect to the BAU solutionsxxxx
KPI-5 Percentage of improvement in line voltage profiles with power injection and consumptionxx
KPI-6 Rate of prevented critical events in the LV grid due to forecasting and remote control of grid actuatorsx
KPI-7Quality of online event detection in LV gridx
KPI-8 Quality and time needed for awareness and localization of grid fault MV grid (per incident 1785)xxxx
KPI-9 Quality of LV grid operation in island modexxxx
CI-3 Waveform quality in LV gridxx

Appendix B

Figure A1. Average price used for some of the KPIS to quantify the benefits (source: OMIEData).
Energies 15 00094 g0a1

References

  1. Cambini, C.; Meletiou, A.; Bompard, E.; Masera, M. Market and regulatory factors influencing smart-grid investment in Europe: Evidence from pilot projects and implications for reform. Util. Policy 2016, 40, 36–47. [Google Scholar] [CrossRef]
  2. Obi, M.; Bass, R. Trends and challenges of grid-connected photovoltaic systems—A review. Renew. Sust. Energy Rev. 2016, 58, 1082–1094. [Google Scholar] [CrossRef]
  3. Ayodele, T.R.; Jimoh, A.; Munda, J.L.; Agee, J.T. Challenges of grid integration of wind power on power system grid integrity: A review. Int. J. Renew. Energy Res. 2012, 2, 618–626. [Google Scholar]
  4. Noske, S.; Falkowski, D.; Swat, K.; Boboli, T. UPGRID project: The management and control of LV network. CIRED-Open Access Proc. J. 2017, 2017, 1520–1522. [Google Scholar] [CrossRef] [Green Version]
  5. Manzoni, A.; Castro, R. Microgeneration impact on lv distribution grids: A review of recent research on overvoltage mitigation techniques. Int. J. Renew. Energy Res. 2016, 6, 117–131. [Google Scholar]
  6. Bødal, E.F.; Del Granado, P.C.; Farahmand, H.; Korpås, M.; Olivella, P.; Munné, I.; Lloret, P. Challenges in Distribution Grid with High Penetration of Renewables. Deliverable from H2020 Project INVADE. 2018. Available online: https://h2020invade.eu/wp-content/uploads/2017/05/D5.1-Challenges-in-distribution-grid-with-high-penetration-of-renewables.pdf (accessed on 30 March 2021).
  7. Martinot, E. Grid Integration of Renewable Energy: Flexibility, Innovation, and Experience. Annu. Rev. Environ. Resour. 2016, 41, 223–251. [Google Scholar] [CrossRef]
  8. Albadi, M.; El-Saadany, E. A summary of demand response in electricity markets. Electr. Power Syst. Res. 2008, 78, 1989–1996. [Google Scholar] [CrossRef]
  9. Díaz-González, F.; Sumper, A.; Gomis-Bellmunt, O. Energy Storage in Power Systems; John Wiley & Sons: West Sussex, UK, 2016; p. 314. [Google Scholar]
  10. Sidhu, A.S.; Pollitt, M.G.; Anaya, K.L. A social cost–benefit analysis of grid-scale electrical energy storage projects: A case study. Appl. Energy 2018, 212, 881–894. [Google Scholar] [CrossRef]
  11. Padmini, V.; Omran, S.; Chatterjee, K.; Khaparde, S.A. Cost Benefit Analysis of Smart Grid: A Case Study from India. In Proceedings of the 2017 North American Power Symposium (NAPS), Morgantown, WV, USA, 17–19 September 2017; pp. 1–6. [Google Scholar]
  12. Kuhar, U.; Kosec, G.; Svigelj, A. Observability of Power-Distribution Systems: State-Estimation Techniques and Approaches; Springer: Cham, Switzerland, 2020. [Google Scholar]
  13. Saldaña-González, A.E.; Sumper, A.; Aragüés-Peñalba, M.; Smolnikar, M. Advanced Distribution Measurement Technologies and Data Applications for Smart Grids: A Review. Energies 2020, 13, 3730. [Google Scholar] [CrossRef]
  14. Pokhrel, B.R.; Bak-Jensen, B.; Pillai, J.R. Integrated Approach for Network Observability and State Estimation in Active Distribution Grid. Energies 2019, 12, 2230. [Google Scholar] [CrossRef] [Green Version]
  15. Zhang, R.; Xu, L.; Yu, Z.; Shi, Y.; Mu, C.; Xu, M. Deep-IRTarget: An Automatic Target Detector in Infrared Imagery using Dual-domain Feature Extraction and Allocation. IEEE Trans. Multimed. 2021. [Google Scholar] [CrossRef]
  16. Zhang, Q.; Ge, L.; Zhang, R.; Metternicht, G.I.; Du, Z.; Kuang, J.; Xu, M. Deep-learning-based burned area mapping using the synergy of Sentinel-1&2 data. Remote Sens. Environ. 2021, 264, 112575. [Google Scholar]
  17. Zhang, R.; Wu, L.; Yang, Y.; Wu, W.; Chen, Y.; Xu, M. Multi-camera multi-player tracking with deep player identification in sports video. Pattern Recognit. 2020, 102, 107260. [Google Scholar] [CrossRef]
  18. Díaz-González, F.; Sumper, A.; Gomis-Bellmunt, O.; Villafafila-Robles, R. A review of energy storage technologies for wind power applications. Renew. Sustain. Energy Rev. 2012, 16, 2154–2171. [Google Scholar] [CrossRef]
  19. Bullich-Massagué, E.; Cifuentes-García, F.-J.; Glenny-Crende, I.; Cheah-Mañé, M.; Aragüés-Peñalba, M.; Díaz-González, F.; Gomis-Bellmunt, O. A review of energy storage technologies for large scale photovoltaic power plants. Appl. Energy 2020, 274, 115213. [Google Scholar] [CrossRef]
  20. Brogan, P.V.; Best, R.; Morrow, J.; Duncan, R.; Kubik, M. Stacking battery energy storage revenues with enhanced service provision. IET Smart Grid 2020, 3, 520–529. [Google Scholar] [CrossRef]
  21. Forrester, S.P.; Zaman, A.; Mathieu, J.L.; Johnson, J.X. Policy and market barriers to energy storage providing multiple services. Electr. J. 2017, 30, 50–56. [Google Scholar] [CrossRef]
  22. Jing, W.; Lai, C.H.; Wong, W.S.H.; Wong, M.L.D. A comprehensive study of battery-supercapacitor hybrid energy storage system for standalone PV power system in rural electrification. Appl. Energy 2018, 224, 340–356. [Google Scholar] [CrossRef]
  23. Ren, G.; Wang, H.; Chen, C.; Wang, J. An energy conservation and environmental improvement solution-ultra-capacitor / battery hybrid power source for vehicular applications. Sustain. Energy Technol. Assess. 2021, 44, 100998. [Google Scholar] [CrossRef]
  24. Sellali, M.; Betka, A.; Djerdir, A. Power management improvement of hybrid energy storage system based on H ∞ control. Math. Comput. Simul. 2020, 167, 478–494. [Google Scholar] [CrossRef]
  25. Jing, W.; Lai, C.H.; Wong, W.S.H.; Wong, M.L.D. Dynamic power allocation of battery-supercapacitor hybrid energy storage for standalone PV microgrid applications. Sustain. Energy Technol. Assess. 2017, 22, 55–64. [Google Scholar] [CrossRef]
  26. Sinha, S.; Bajpai, P. Power management of hybrid energy storage system in a standalone DC microgrid. J. Energy Storage 2020, 30, 101523. [Google Scholar] [CrossRef]
  27. Pegado, R.; Ñaupari, Z.; Molina, Y.; Castillo, C. Radial distribution network reconfiguration for power losses reduction based on improved selective BPSO. Electric Power Syst. Res. 2019, 169, 206–213. [Google Scholar] [CrossRef]
  28. Li, P.; Xu, D.; Zhou, Z.; Lee, W.-J.; Zhao, B. Stochastic Optimal Operation of Microgrid Based on Chaotic Binary Particle Swarm Optimization. IEEE Trans. Smart Grid 2015, 7, 66–73. [Google Scholar] [CrossRef]
  29. Rajaram, R.; Kumar, K.S.; Rajasekar, N. Power system reconfiguration in a radial distribution network for reducing losses and to improve voltage profile using modified plant growth simulation algorithm with Distributed Generation (DG). Energy Rep. 2015, 1, 116–122. [Google Scholar] [CrossRef] [Green Version]
  30. Rao, R.S.; Ravindra, K.; Satish, K.; Narasimham, S.V.L. Power Loss Minimization in Distribution System Using Network Reconfiguration in the Presence of Distributed Generation. IEEE Trans. Power Syst. 2012, 28, 317–325. [Google Scholar] [CrossRef]
  31. Lopez, E.; Opazo, H.; Garcia-Santander, L.; Bastard, P. Online Reconfiguration Considering Variability Demand: Applications to Real Networks. IEEE Trans. Power Syst. 2004, 19, 549–553. [Google Scholar] [CrossRef]
  32. De Quevedo, P.M.; Contreras, J.; Rider, M.J.; Allahdadian, J. Contingency Assessment and Network Reconfiguration in Distribution Grids Including Wind Power and Energy Storage. IEEE Trans. Sustain. Energy 2015, 6, 1524–1533. [Google Scholar] [CrossRef]
  33. Cong, P.; Tang, W.; Zhang, L.; Zhang, B.; Cai, Y. Day-Ahead Active Power Scheduling in Active Distribution Network Considering Renewable Energy Generation Forecast Errors. Energies 2017, 10, 1291. [Google Scholar] [CrossRef] [Green Version]
  34. Taylor, T.; Ohrn, M. Network Management for Smart Grids—Innovative Operations Centers to Manage Future Distribution Networks. 2009. Available online: https://library.e.abb.com/public/461c2ae39130ceafc125762d0047f01f/45-49%203M901_ENG72dpi.pdf (accessed on 30 March 2021).
  35. Wang, J.; Chen, C.; Lu, X. Guidelines for Implementing Advanced Distribution Management Systems-Requirements for DMS Integration with DERMS and Microgrids; Argonne National Laboratory: Argonne, IL, USA, 2015.
  36. Alaqeel, T.A.; Suryanarayanan, S. A comprehensive cost–benefit analysis of the penetration of Smart Grid technologies in the Saudi Arabian electricity infrastructure. Util. Policy 2019, 60, 100933. [Google Scholar] [CrossRef]
  37. Basso, G.; Gaud, N.; Gechter, F.; Hilaire, V.; Lauri, F. A framework for qualifying and evaluating smart grids approaches: Focus on multi-agent technologies. Smart Grid Renew. Energy 2013, 4, 33933. [Google Scholar] [CrossRef] [Green Version]
  38. Behi, B.; Baniasadi, A.; Arefi, A.; Gorjy, A.; Jennings, P.; Pivrikas, A. Cost–benefit analysis of a virtual power plant including solar PV, flow battery, heat pump, and demand management: A western australian case study. Energies 2020, 13, 2614. [Google Scholar] [CrossRef]
  39. Frigola, J.M.; Kokos, I.; Tuiskula, H.; Marksteiner, S.; Sumper, A.; Marksteiner, S.; Gallart, R.; Smolnikar, M.; Torrent, F.F. RESOLVD-Renewable Penetration Levered by Efficient Low Voltage Distribution Grids. Specifications and Use Case Analysis. In Proceedings of the 25th International Conference on Electricity Distribution, Madrid, Spain, 3–6 June 2019. [Google Scholar]
  40. Sofia, D.; Gioiella, F.; Lotrecchiano, N.; Giuliano, A. Cost–benefit analysis to support decarbonization scenario for 2030: A case study in Italy. Energy Policy 2019, 137, 111137. [Google Scholar] [CrossRef]
  41. Giordano, V.; Onyeji, I.; Fulli, G. Guidelines for Conducting a Cost–Benefit Analysis of Smart Grid Projects; Joint Research Centre: Brussels, Belgium, 2012. [Google Scholar]
  42. Candido, L.; Gallart, R.; Coral, C.; Palma, V.; Girbau, F.; Ferrer, A.; Meléndez, J. Validation Set Up Report: Description of Scenarios, Tests and Validation Indicators; RESOLVD Deliverable D5.1. 2019. Available online: https://resolvd.eu/wp-content/uploads/2021/10/D5.1-FV.pdf (accessed on 31 October 2021).
  43. Díaz-González, F.; Aragüés-Peñalba, M.; Girbau-Llistuella, F.; Llonch-Masachs, M.; Sumper, A. A Power Sharing Algorithm for a Hybrid Energy Storage System Based on Batteries. In Proceedings of the 2019 IEEE PES Innovative Smart Grid Technologies Europe (ISGT-Europe), Bucharest, Romania, 29 September–2 October 2019. [Google Scholar]
  44. Llonch, M.; Girbau-Llistuella, F.; Díaz-González, F.; Sumper, A.; Aragüès-Peñalba, M. Deliverable 2.5: Functional Laboratory Tests on the Prototype, RESOLVD Project. Available online: https://resolvd.eu/documents/ (accessed on 31 October 2021).
  45. Sodin, D.; Rudež, U.; Mihelin, M.; Smolnikar, M.; Čampa, A. Advanced Edge-Cloud Computing Framework for Automated PMU-Based Fault Localization in Distribution Networks. Appl. Sci. 2021, 11, 3100. [Google Scholar] [CrossRef]
  46. Van den Oosterkamp, P.F.; de Joode, J.; van der Welle, A.J.; Lenstra, W.J.; Koutstaal, P.R.; van Hussen, K.; Haffner, R. The Role of DSOs in a Smart Grid Environment; Ecorys: Amsterdam, The Netherlands, 2014. [Google Scholar]
  47. Azizivahed, A.; Arefi, A.; Ghavidel, S.; Shafie-khah, M.; Li, L.; Zhang, J.; Catalão, J.P. Energy management strategy in dynamic distribution network reconfiguration considering renewable energy resources and storage. IEEE Trans. Sustain. Energy 2019, 11, 662–673. [Google Scholar] [CrossRef]
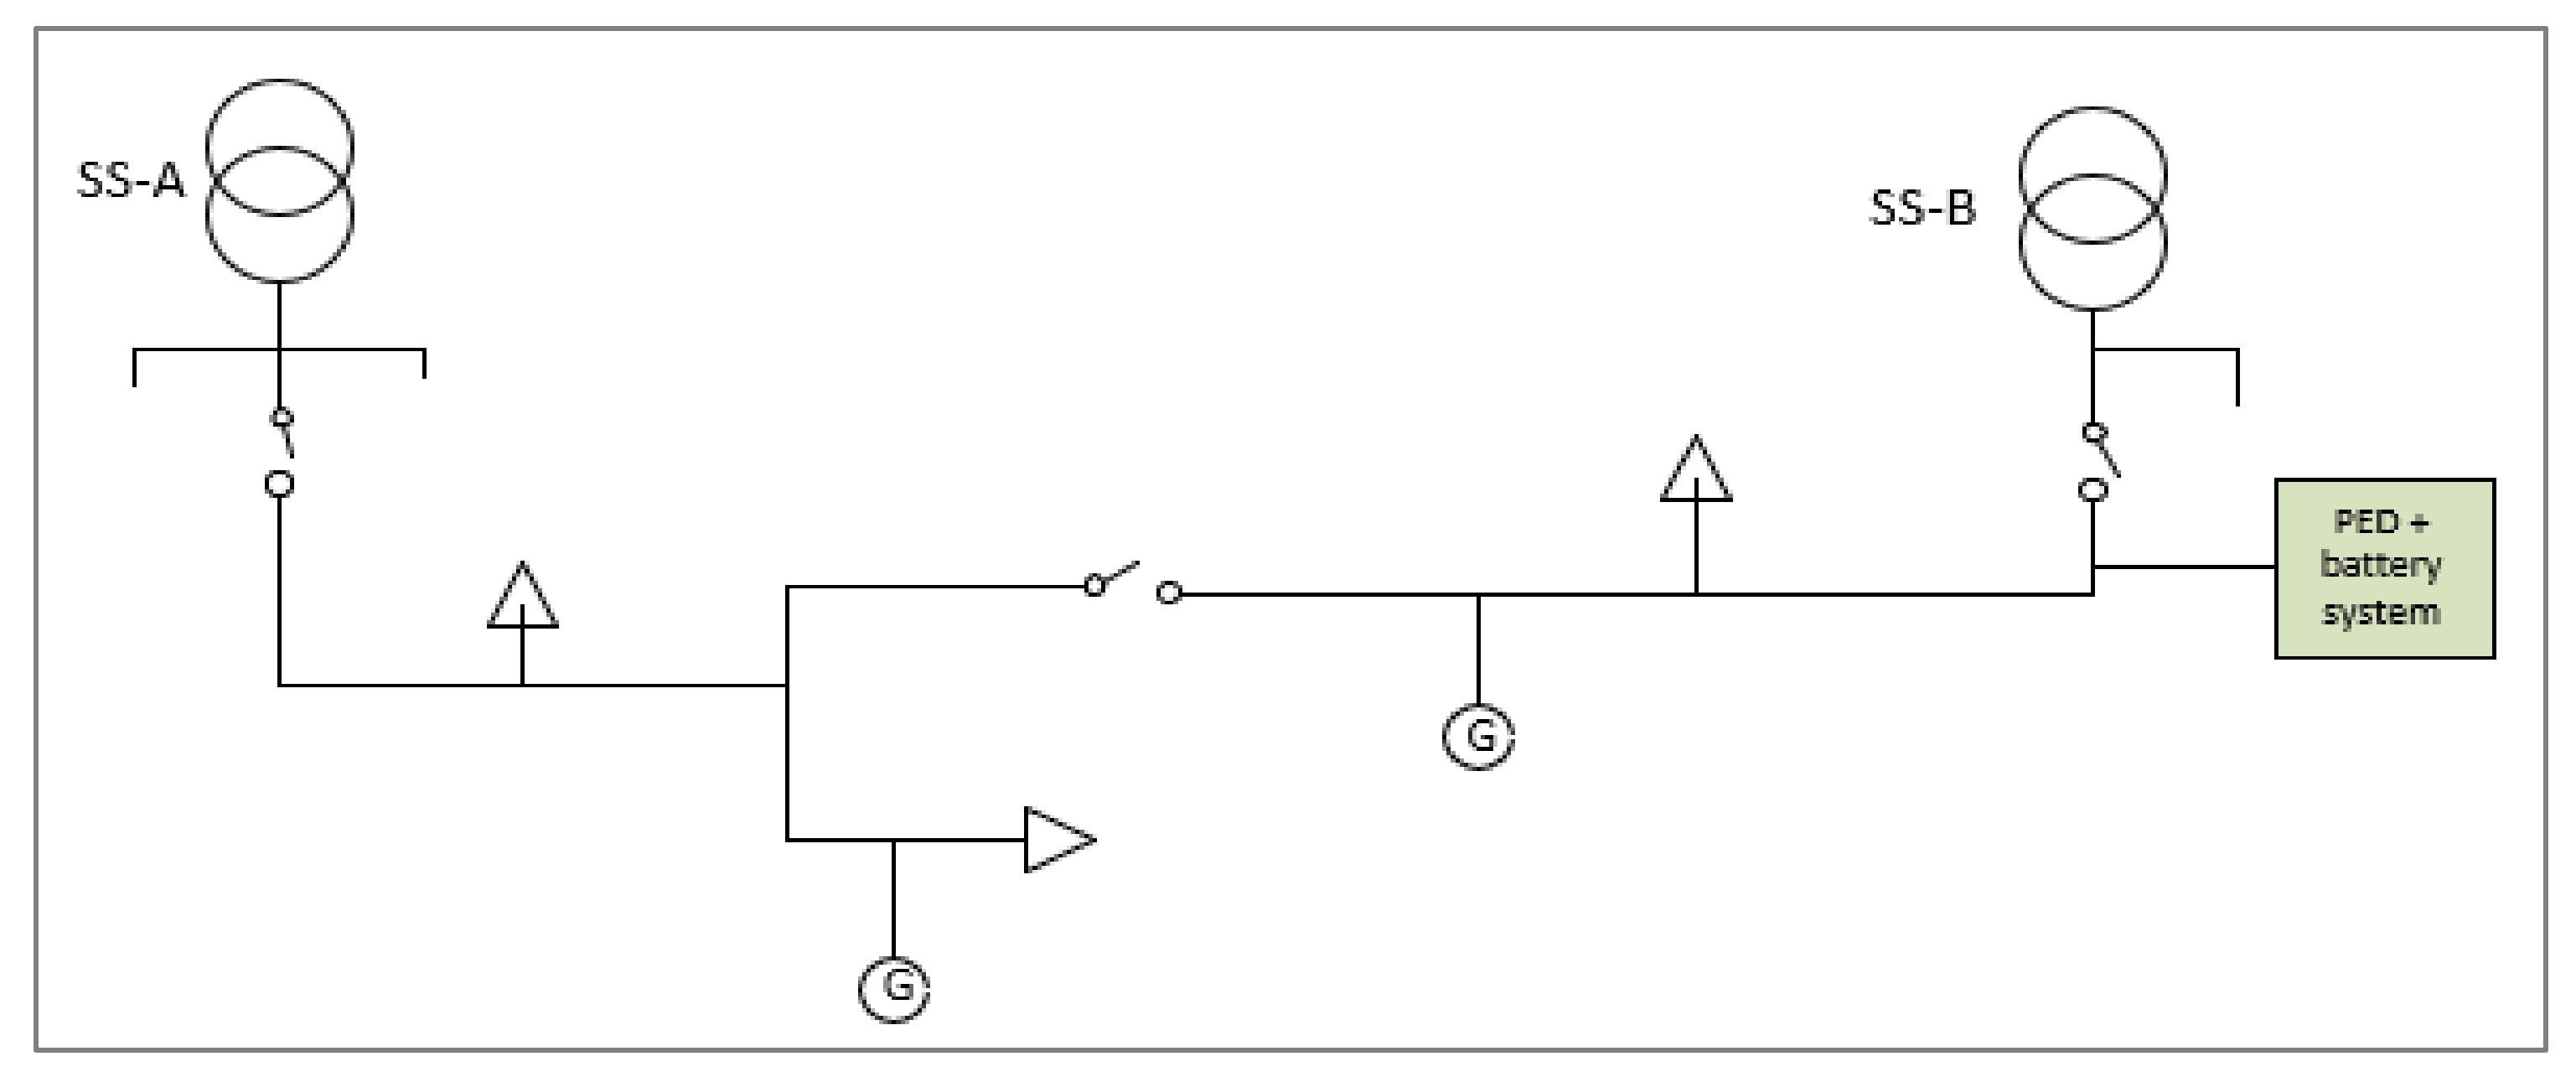
Figure 1. Research framework to answer research questions of the paper.
Energies 15 00094 g001
Figure 2. RESOLVD high-level architecture.
Energies 15 00094 g002
Figure 3. Schematic of the pilot area of RESOLVD.
Energies 15 00094 g003
Figure 4. Simple pilot schematic showing the location of PED connection.
Energies 15 00094 g004
Figure 5. A picture of SS-B where the PED and the batteries were installed.
Energies 15 00094 g005
Figure 6. CBA process steps used in RESOLVD are based on the JRC and BRIDGE initiative.
Energies 15 00094 g006
Figure 7. PED as developed in the project shows possibilities to integrate multiple batteries (at the bottom), as well as to use them in multiple contexts (on top).
Energies 15 00094 g007
Figure 8. Observability-related sensors developed in the project: (a) PQM, (b) PMU, and (c) gateway.
Energies 15 00094 g008
Figure 9. Increased hosting capacity with scale-up of RESOLVD pilot.
Energies 15 00094 g009
Figure 10. NPV (in EUR, left side of the figure) and IRR (% in the right side) based on WTP scenario for the three-software platform when the pilot is scaled up 12 times the pilot size.
Energies 15 00094 g010
Table 1. Rated power and contracted power values of SS-528 and SS-0030.
Secondary Substation (SS)SS (A) 528SS (B) 0030
Transformer rated power250 kVA630 kVA
Total contracted power138.6 kW127.8 kW
Contracted power of line in the pilot58.3 kW56.9 kW
PV power installed in the pilot12.5 kW9.9 kW
Table 2. Qualitative description of converting project indicators into benefits with linked remuneration variables.
Project IndicatorsBasic Assumptions Considered to Calculate the BenefitLinked Remuneration Variables
KPI1: Power loss reduction due to waveform quality improvementThe annual average electricity increases in the pilot feeders (17 kW) multiplied by the % loss and compared with the change from the business-as-usual scenario (BAU). P n i
KPI2: Improvement of the energy profile in the secondary substationsIn SS where PEDs are managing renewable sources. The PV energy does not flow from all distribution infrastructures from TSO link.data 1
CI1: Efficiency rate of the PED and the energy storage systemConsumption of Vdc bus, batteries technologies and PED auxiliary internal consumptions. D E S P n , 15 n 2 ,
R I n i
KPI3: Increase in DER hosting capacity in LV networkPED, batteries, and auxiliary system internal consumptions. D E S P n , 15 n 2
KPI4: Reduction in DSO investmentIn terms of traditional infrastructure investment and assuming an average distance of 100 m multiplied by new LV feeder cable plus the cost of assets upgrade. D E S P n , 15 n 2
CI2: DSO operation expenditures with respect to the BAU solutionsRegarding the remuneration for the operation and maintenance, the rule in force until 2020 (RD 1048/2013 + Order IET/2660/2015) differentiates between O&M of electrical assets (which is remunerated by unit value) and O&M of nonelectrical assets (which is remunerated by invoice). The O&M amount of electrical assets ranges from 3% to 5% of the unit investment reference value. R I n i
KPI5: Percentage of improvement in line voltage profiles with power injection and consumptionThe real and reactive power not supplied from the primary substation and provided from PED in the maximum consumption time and assuming that the active power was charged in the storage system when there was a surplus in the valley period.-
KPI6: Rate of prevented critical events in the LV grid due to forecasting and remote control of grid actuatorsAssuming average time response as a traditional way, the customer from the fault to fuse restoration is two hours. Moreover, the usual time that a user calls DSO to communicate the fault is 10 min on average. Average energy in the pilot feeders multiplied by the events that feeder fuses are blown per year assumed by DSO.-
KPI7: Quality of online event detection in LV gridFast detection of short circuits and severe faults that lead to protection (fuses). The time difference between rapid detection (the time of occurrence) compared to a conventional method in which fuse actions are protections where they are reported. I have considered it to involve a reduction in response time x kWh considering the number of end-users affected due to fuse blow. Q n i
KPI8: Quality and time needed for awareness and localization of grid fault MV gridTo localize an MV fault and isolate part of the grid on average from the historic SCADA registers in 5 h, consider wage of operator per hour. As result of this KPI, it is possible locate the fault and save in average 3.5 h. Moreover, it avoids the assets stress. Q n i
KPI9: Quality of LV grid operation in island modeIt was just tested during the functional test. The functional testcreated an electrical island for 85 min. Q n i ,
R E V U n i &
C O M G E S n i
CI3: Waveform quality in LV gridOnly affect in the part of the upstream grid from PED until the primary substation is connected the pilot feeder. P n i
Table 3. Summary of quantified benefits from RESOLVD solution.
CategoryIndicatorBusiness as Usual (BAU) without RESOLVDAfter (with) RESOLVDSaving in EUR/Year
EfficiencyKPI-01: Power loss reduction due to waveform quality improvement (W/Ω)Unknown166.7 W/Ω<1000
KPI-02: Improvement of the energy profile in the secondary substations
Sub-indicators:
(i) Losses T&D (%)
(ii) Locally generated energy use (%)
(iii) Maximum peak (%)
(i) Losses T&D is 7.3% at each SS, which is at SS-00528: 9.49 kW, SS-0030: = 8.3 kW.;
(ii) Locally generated energy use is: 2.8% and 1.27%;
(i) SS-00528: Not affected because PED is not interacted as a normal exploitation. SS-0030 reduced T&D losses = 0.5%
(ii) and (iii) Locally generated energy use and maximum peak (%) has no registered changes
1000–5000
PlanningCI-01: Efficiency rate of the PED and the energy storage system
Note: The benefit of this indicator to DSO is in higher self-consumption rate (kW).
Without PED (no PED implemented)Change registered: −4,2 kW<1000
KPI-03: Increase in DER hosting capacity in LV network (%kVA with respect to the current maximum limit)138 kVA189 kVA
Change registered: 36.95%
>25,000
KPI-04: Reduction in DSO investment (%)RetributionRetribution change registered: 22%>25,000
CI-02: DSO operation expenditures with respect to the BAU solutions (EUR per year)The O&M amount of electrical assets ranges from 3% to 5% of the unit investment reference value.Considering an investment of EUR 57.000 as a usual new building of network assets at LV level.1000–5000
Quality of serviceKPI-05: Percentage of improvement in line voltage profiles with power injection and consumption (%)NA0.03<1000
KPI-06: Rate of prevented critical events in the LV grid due to forecasting and remote control of grid actuators
Sub indicators:
(i) Precision of forecasting (%)
(ii) Time to respond to critical event (minutes)
(i) No previous data available;
(ii) It was taking 120 min
−15–40% (*) (**)
−2 min
Change registered: 118 min
N.B. (*) (**) are kept anonymous.
<1000
KPI-07: Quality of online event detection in LV grid
Sub-indicators:
(i) Accuracy (%)
(ii) Precision (%)
(iii) Miss Detections (%)
(iv) False Alarms (%)
(v) Detecting time (s)
(vi) Informing delay (s)
(i) No previous data
(ii) No previous data
(iii) No previous data
(iv) No previous data
(v) No previous data
(vi) 120 min
(i) 97.5%
(ii) 93.5%
(iii) 0%
(iv) 3.8%
(v) 1 s
(vi) 35–400 s
<1000
KPI-08: Quality and time needed for awareness and localization of grid fault MV grid (seconds)NA because RESOLVD is focused on LV level. This KPI, is focused in MV level. Moreover, the KPI measures quality of effectivity of PMU2.04 s
Impact MV (indirect benefit to the DSO due to PMU)
1000–5000 (indirect saving from MV)
KPI-09: Quality of LV grid operation in island mode (hours)0.33 h (avg. from previous year)1.417 h
Changed registers: 1.087 h
1000–5000
CI-03: Waveform quality in LV grid (%)NA (no data before RESOLVD project)0.12%<1000
N.B, (*) and (**) are the assumptions made based on: (*) Forecasting performance has large variability depending on the node and time. Large errors are due to 24h delay in having SM data available and low consumption in most consumption points. (**) Critical events were simulated in the pilot by changing line parameters, demonstrating the availability to detect and mitigate. Given the number of tests is not representative enough, the paper considers 2 incidents to calculate KPI6.
Table 4. Summary of CBA with scale-up of the pilot size.
Indicators2SS-4 Feeders
(Current Pilot)
8SS-16 Feeders10SS-20 Feeders12SS-24 Feeders24SS-48 Feeders
NPV−459 k−57 k97 k226 k1054 k
IRR−11%2%6%9%23%
Payback period>10 years9th year8th year5th year4th year
Benefit–cost ratio0.5 < 11.1 > 11.3 > 11.4 > 12.4 > 1
RecommendationNot worth investing in the current pilot size.Risky to continue with the investment.Relatively lower IRR; however, it is worth continuing with the investment.It is worth continuing with the investment.It is worth continuing with the investment.
Table 5. A basis for DSO’s willingness to pay for the software as a service fee.
Number of Supply point<10,00010,000–50,00050,000–100,000100,000–500,000500,000–1,000,000>1,000,000
Cost per supply pointEUR 1EUR 0.2EUR 0.1EUR 0.02EUR 0.01EUR 0.001
Table 6. Summary of CBA for willingness to pay scenario of the three RESOLVD software. 2SS-4 feeders represent current pilot size, and values are rounded to the nearest thousand (k).
IndicatorsILEMIT Integration SoftwareLVD-DST (Decision Support Toolkit)
2SS-4 Feeders8SS-16 Feeders2SS-4 Feeders8SS-16 Feeders2SS-4 Feeders8SS-16 Feeders
NPV−156 k305 k−323 k78 k−343 k58 k
IRR−5%17%−11%6%−8%6%
Payback period>10 years4th year>10 years6th year>10 years7th year
Benefit–cost ratio0.8 < 11.8 > 10.6 < 11.3 > 10.6 < 11.3 > 1
RecommendationNot worth investing with the current pilot size.It is worth continuing with the investment.Not worth investing with the current pilot size. Longer payback period but worth continuing with the investment.Not worth investing with the current pilot size.Longer payback period but worth continuing with the investment.
Table 7. Number of DSOs in partner countries and EU and EEA for RESOLVD replication and market.
PartnersPopulation (MN)DSO (<100 K Customers)DSO (>100 K Customers)TWh
Spain473495278
Norway5.41507118
Austria8.81381361
Greece11.12145
Slovenia21113
Total74.364027515
EU and EEA520MN (inc. UK)24001902700
Publisher’s Note: MDPI stays neutral with regard to jurisdictional claims in published maps and institutional affiliations.

