Article

Study on the Influence of Organic–Inorganic Interface Properties on Breakdown Strength and Thermal Properties of MgO/PLA Composites

1
State Grid Zhejiang Electric Power Co., Ltd., Marketing Service Center, Hangzhou 311121, China
2
State Grid Zhejiang Electric Power Co., Ltd., Hangzhou 310007, China
3
School of Electrical and Automation Engineering, Hefei University of Technology, Hefei 230009, China
*
Author to whom correspondence should be addressed.
Submission received: 4 April 2022 / Revised: 29 April 2022 / Accepted: 2 May 2022 / Published: 10 May 2022

Abstract

:
Polylactic acid (PLA) is expected to be widely used in green power equipment manufacturing due to its good mechanical properties and biodegradability. In this paper, the effects of MgO with different particle sizes and mass fractions on the thermal and electrical properties of PLA composites were studied. The experiment found that with the increase in MgO particle sizes and mass fractions, the thermal conductivity of MgO/PLA composites showed a rising trend, which was up to 165.4% higher than that of pure PLA. However, the heat resistance first increases and then decreases. For the electrical properties of MgO/PLA composites, the breakdown strength and volume resistivity decrease with an increase in MgO particle size and mass fraction. In order to further study the influence mechanism of the introduction of MgO with different particle sizes and mass fractions on the thermal and electrical properties of MgO/PLA composites, molecular dynamics simulation was used to simulate the glass transition temperature (Tg) of PLA composites doped with MgO of different particle sizes, and it was found that MgO doping weakened the movement of the PLA molecular chain segment. Using density functional theory (DFT) calculations, it was found that in the MgO and PLA system, electrons have a tendency to migrate from the PLA matrix to MgO, which causes the formation of electron traps at the inorganic–organic interface and affects its electrical properties. The purpose of this study is to provide a theoretical reference for PLA composites in the manufacture of power equipment.

1. Introduction

With the rapid development of the green power grid, polylactic acid (PLA) is expected to be widely used in power equipment manufacturing due to its good mechanical properties and biodegradability [1,2,3]. With the development of miniaturization and lightweight power equipment, it is of great significance to study PLA composite materials with better heat resistance and electric strength [4,5,6]. The main method of enhancing the thermal properties and electrical resistance of PLA composites at present is to dope inorganic particles into PLA to improve the crystallinity of PLA and form an inhibition path of electrical breakdown [7,8].
At present, there are many studies on the modification of PLA by inorganic particles. Moataz A. Elsawy et al. [9] used nanoscale chitosan particles to weaken the relaxation of PLA near the glass transition temperature, thus reducing the dielectric loss. Rui Guo et al. [10] increased the thermal conductivity of PLA by 25.71% by adding molten graphene. Feng Wu et al. [11] found that PLA grafted with SiO2 can improve the crystallinity of PLA nanocomposites, and thus increase its glass transition temperature. Muhammad Ghozali et al. [12] found that when low-concentration MgO, ZnO and TiO2 metal oxides were added to PLA membrane, the tensile strength of the composite decreased. When ZnO was added, the tensile strength of the composite decreased most significantly, while the addition of MgO had little effect on the decrease in tensile strength.
Based on the above studies, it can be found that the main means of improving the thermal properties and electrical resistance of PLA composites by doping inorganic particles is the formation of an inorganic–organic interface. The formation of an inorganic–organic interface is beneficial for improving the crystallinity of PLA at the interface, improving the thermal properties of PLA composites and inhibiting the formation of breakdown channels to improve the breakdown strength. However, most previous studies on PLA composites focus on the effect of the organic–inorganic interface on the chain segment of PLA matrix, whereas there are few studies on the thermal properties and electrical resistance of the interface itself.
MP Arrieta et al. [13] believed that the addition of inorganic particles could change the crystallinity around the polymer and affect the movement of polymer molecular chain segments, thus affecting the thermal properties of composites. Tanaka et al. [14] proposed a multi-core model of the interface between inorganic particles and polymers and believed that the formation of the interface would introduce electron traps into the materials, which would affect the electrical resistance of composites. Obviously, inorganic particles with different particle sizes form different interface scales, which will have different effects on the movement of the molecular chain and electron trap of PLA composite, resulting in changes in its thermal properties and electrical resistance. Therefore, it is of great practical significance to study the mechanism of the influence of the inorganic particle size on the thermal properties and electrical resistance of PLA composites.
In order to explore the influence of organic–inorganic interface on the thermal and electrical properties of PLA composites, MgO doping with different particle sizes was selected in this paper, and the thermal and electrical properties were tested. Meanwhile, the glass transition temperature (Tg) and molecular orbital energy level of MgO/PLA composites were calculated using molecular dynamics simulation and density functional theory (DFT), and the crystallinity and charge migration trend of PLA at the interface were predicted. The experimental results are in good agreement with the simulation results. This study aimed to provide a theoretical reference for the preparation of PLA composites used in insulation equipment.

2. Experiment and Measurement Method

2.1. Raw Materials

PLA resin particle, Shanghai Jinshan Punan Co., Ltd. (Shanghai, China), specific gravity 1.24, molecular weight 8 × 10⁵, melt density 1.08 g/cc, glass transition temperature 56 °C; 50 nm-MgO, 500 nm-MgO and 1 um-MgO were purchased from Guangzhou Metal Metallurgy Group Co., LTD. (Guangzhou, China). Their molecular weight is 40.3.

2.2. Preparation of PLA Sample Parts

The nanoparticles were mixed with polylactic acid and dried in a vacuum oven at 40 °C. The raw material was placed into a three-roller mixer and stirred for 40 min; then, this was fed to the extruder at a temperature distribution of 190 °C and pressed into a circular sheet shape of 100 mm in diameter and 1 mm in thickness. The MgO-doped PLA composite with a particle size of 50 nm and a mass fraction of 5.0 wt% was denoted as PLA-50MgO-5%.

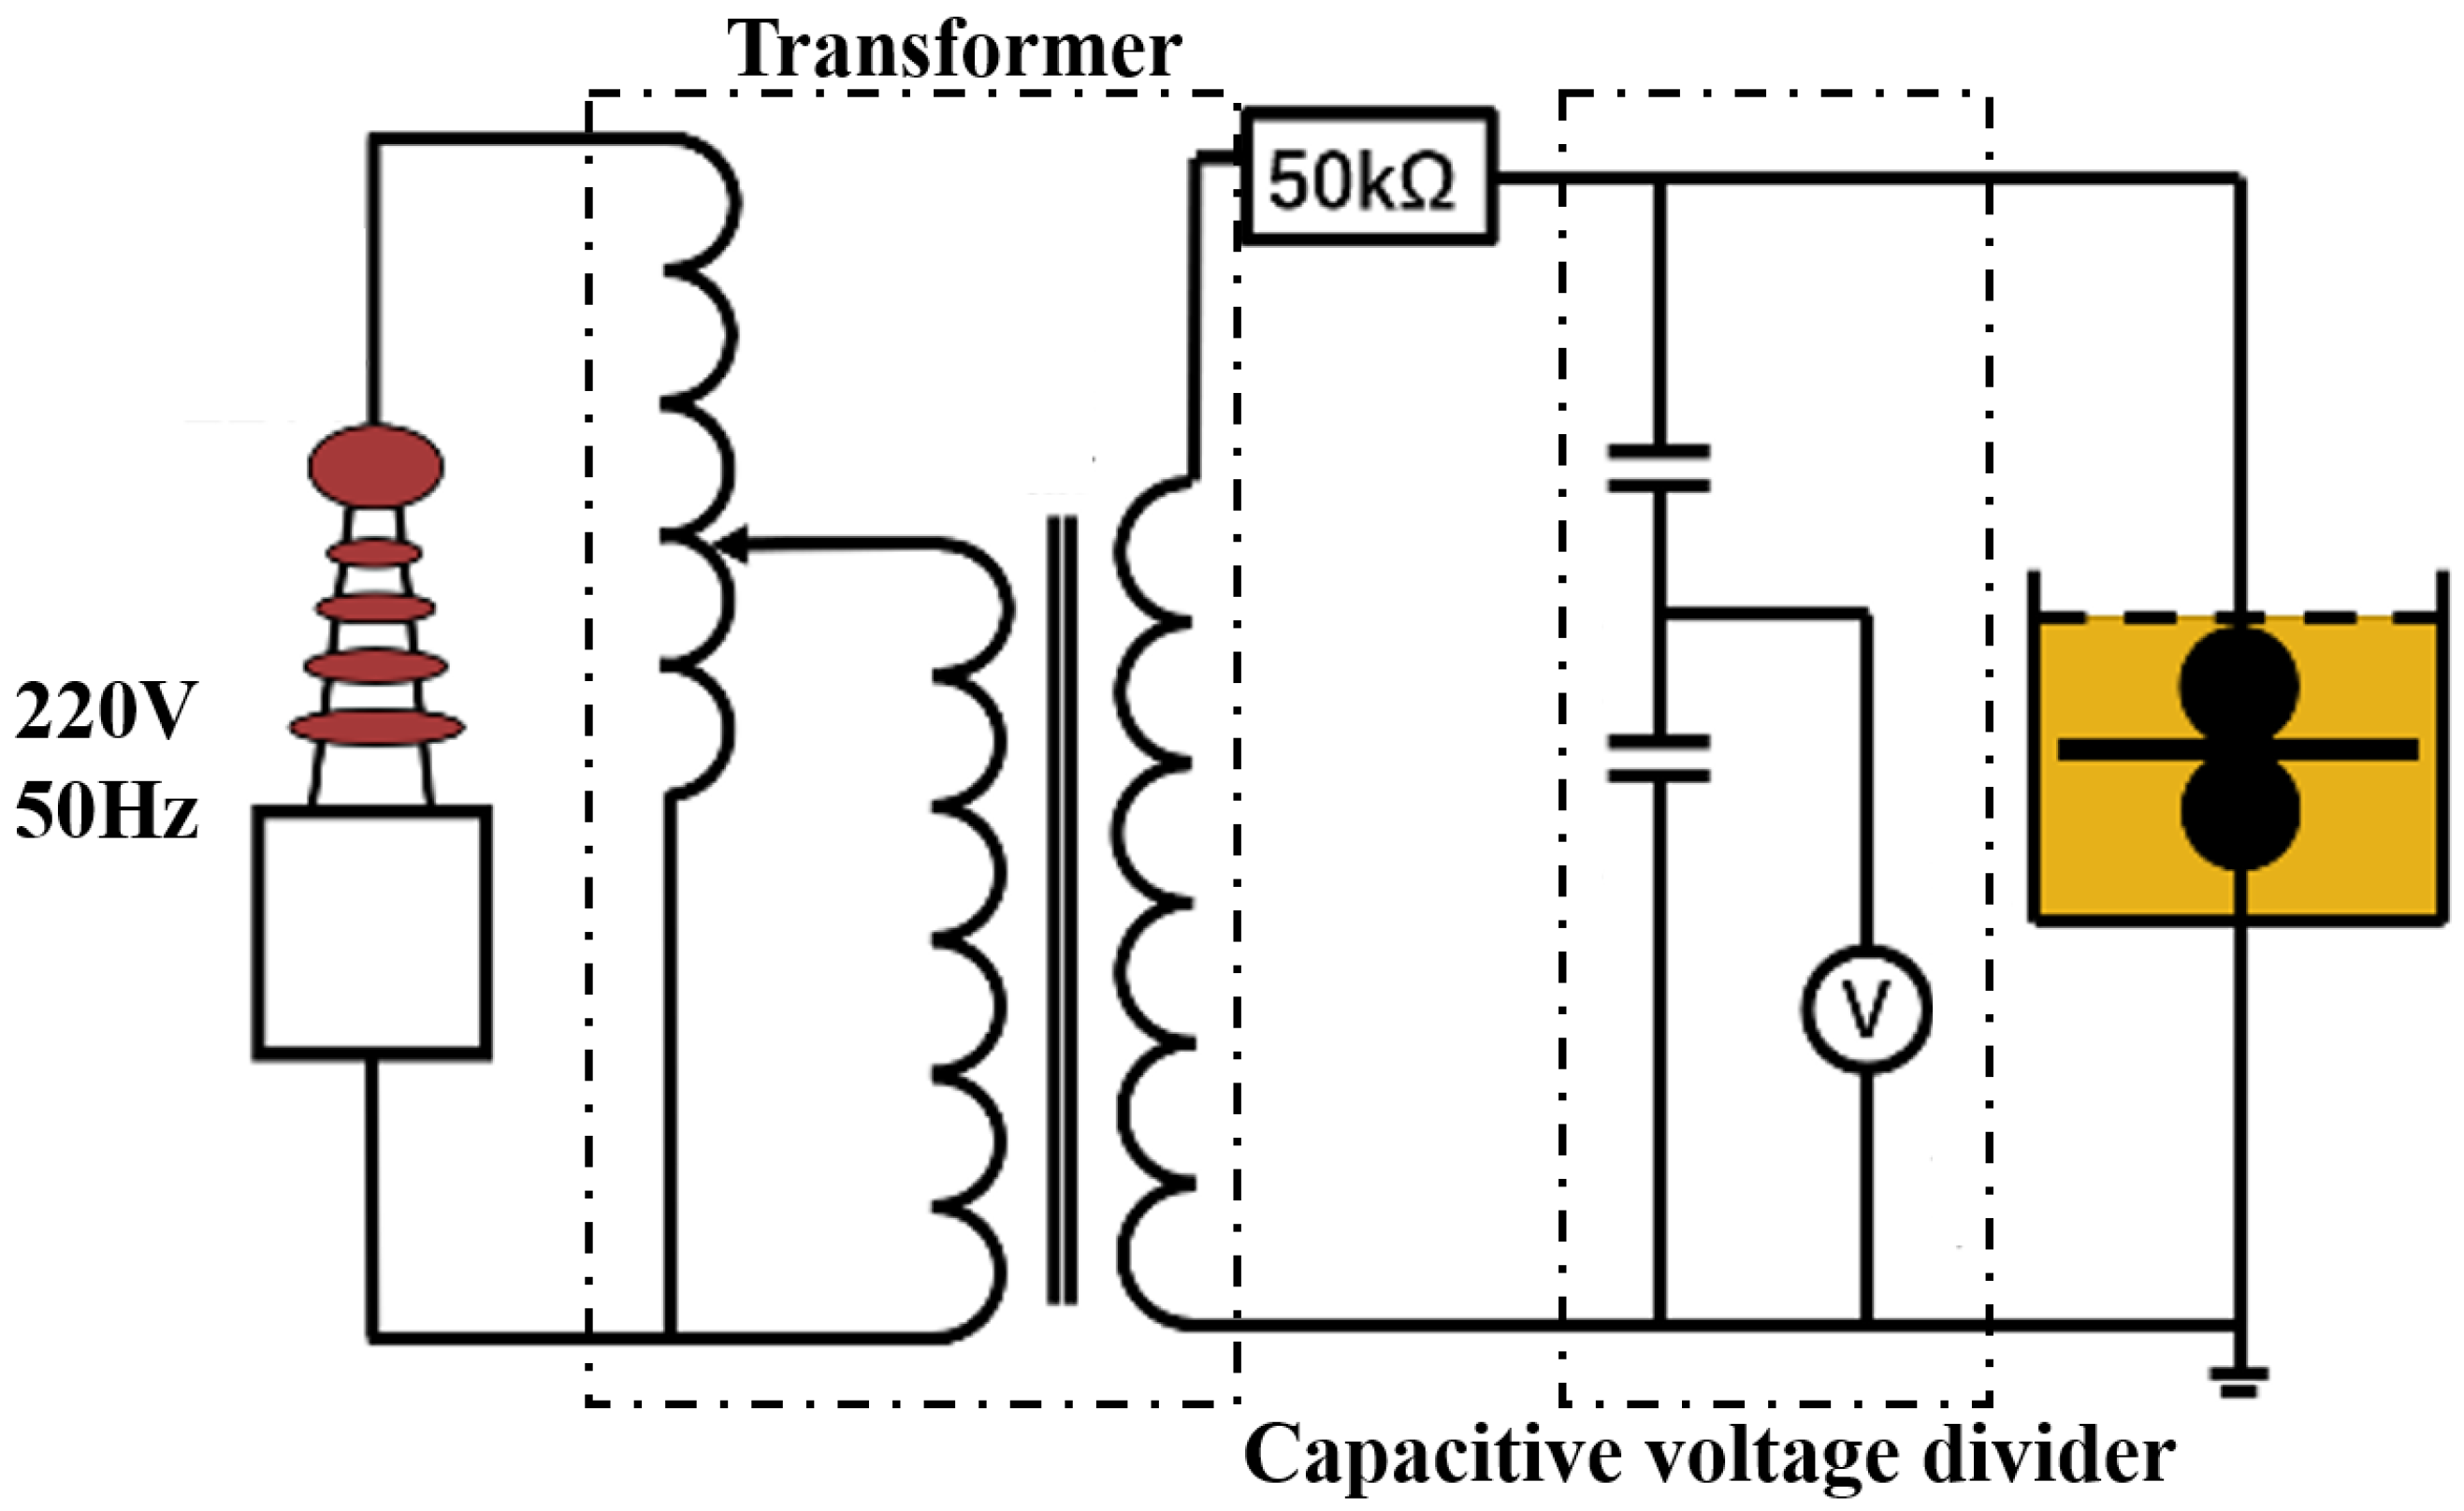
2.3. Measurement Method

In the breakdown strength test, GB/T 1408.1-2016 standard was used to measure the breakdown strength of the sample under the action of a short-time electric field at a voltage boost speed of 2 kV/s. The ambient temperature was measured at 25 °C. The test sample was a wafer with a thickness of 1 mm. The sample surface was cleaned with anhydrous ethanol before measurement and immersed in NO.25 transformer oil during measurement. The calculation results for the two-parameter Weibull distribution were adopted. Figure 1 shows the breakdown voltage test platform.
Surface Energy Dispersive Spectroscopy (EDS) was used to characterize MgO/PLA composites by scanning electron microscopy (Gemini 500). Before the test, the magnetron sputtering apparatus was used to spray gold to improve the electrical conductivity and electronic response characteristics of the filler and PLA. The thermal conductivity of MgO/PLA composites was measured by laser thermal conductivity instrument (LFA457). The glass transition temperature of MgO/PLA was measured by differential thermal differential scanning calorimeter (DSC Q2000).

3. Results and Discussion

The thermal conductivity test of MgO/PLA composites with different particle sizes and mass fractions of MgO doping is shown in Figure 2. The thermal conductivity of MgO/PLA increases with the increase in MgO particle size and mass fraction, and the thermal conductivity of PLA-1000MgO-15% is the highest, which is 165.4% higher than that of pure PLA.
From the variation trend of thermal conductivity, it can be found that the thermal conductivity of PLA-1000MgO-15% is greatly improved compared with other types of PLA composite materials. This is because MgO particles form an inorganic thermal conduction network in the PLA matrix under these conditions. The improved thermal conductivity is attributed to the high thermal conductivity of the inorganic filler MgO, which enhances the transferability of phonons in the thermal conductivity network.
Figure 3a,b show EDS images of PLA-1000MgO-5% and PLA-1000MgO-15% respectively. In Figure 3a, PLA-1000MgO-5% MgO fillers are evenly distributed in the PLA matrix, but MgO fillers are interconnected through the PLA matrix to form a “filler-PLA base-filler” thermal conductivity network. In this case, the thermal conductivity depends on the interfacial thermal resistance of MgO-PLA, resulting in no significant increase in the thermal conductivity of MgO/PLA composites. As shown in Figure 3b, the number of PLA-1000MgO-5% MgO fillers in PLA increases, which reduces the thickness of PLA matrix between fillers and makes it easier to form a “filler–filler” structure to build an inorganic thermal conduction network. In this case, phonons can conduct between fillers to reduce scattering at the interface [15].
The thermal imaging data show the highest temperature corresponding to the sample at this time, and the infrared thermal imager was used to measure the results. Figure 3 shows the thermal imaging photos of three PLA composite materials, PLA-50MgO-15%, PLA-500MgO-15% and PLA-1000MgO-15%, which were cooled naturally for 150 s from 80 °C at room temperature of 25 °C by infrared thermal imager. As can be seen from the figure, the heat dissipation rate of PLA-50MgO-15%, PLA-500MgO-15% and PLA-1000MgO-15% PLA composites successively increased. When the natural heat dissipation was 30 s, the highest PLA-1000MgO-15% temperature was 4.8 °C lower than that of PLA-50MgO-15%.
Figure 4 shows the DSC curves of PLA, PLA-50MgO-5%, PLA-500MgO-5% and PLA-1000MgO-5% PLA composites. It can be seen from the figure that the glass transition temperatures correspond to step-like inflection points of 57.00 °C, 55.34 °C and 54.83 °C, respectively. It can be observed that the melting peak and crystallization peak of PLA-1000MgO-5% are the smallest, and the melting peak and crystallization peak of PLA-50MgO-5% are the largest. The degree of crystallinity (Xc) can be used to characterize the ratio of the crystalline part of the semi-crystalline polymer. The calculation of Xc is shown as follows:
X c = Δ H m Δ H 100 × 100 %
where Δ H m is the melting heat of the sample, and Δ H 100 is the melting heat of the sample whose crystallinity reached 100%. The DSC testing software was used to calculate the crystallinity of MgO doped with different particle sizes, and the results are shown in Table 1.
The influence of surface energy was considered regarding the change in the glass transition temperature. Compared with pure PLA, MgO particles can be adsorbed on the surface of PLA molecular chain segment, thus limiting the movement of the polymer chain segment, improving the stability of polymer and increasing its glass transition temperature. Considering that the glass transition temperature is highest with a filler particle diameter of 50 nm, particles in the above atomic are larger. Considering the large particle size and the specific surface area, the particle surface energy is also the highest, because the surface atomic number, atomic lack of coordination and high surface energy give the surface atoms high activity [16]. This makes it easy to combine these particles with low surface energy polylactic acid to improve the glass transition temperature of the polymer. With the increase in particle size, the influence of surface energy on polymer bonding is weakened, and the large particle size tend to form defects when binding with the PLA matrix, which destroys the crosslinking of PLA matrix, thus reducing the glass transition temperature.
To further study the influence of particle size on the glass transition temperature of MgO/PLA composites, molecular dynamics simulation was used to simulate the influence of different MgO particle sizes on the composites. Due to the limitations of the simulation conditions, it was hard to actually simulate the nano-level MgO doping PLA. Therefore, a simulation method was adopted to refer to the experimental situation and simulate the influence of the change trend of MgO particle size on the macroscopic properties of polymers, which also has a certain reference value. The specific volume of MgO/PLA composites with particle sizes of 3 Å, 5 Å and 8 Å was simulated, as shown in Figure 5. It can be seen from Figure 5b–d that with the increase in MgO particle size, the temperature corresponding to the inflection point of the fitting line segment of the expansion rate of MgO/PLA composite is higher, at 362.4 K, 371.1 K and 380.7 K. From the perspective of simulation, when MgO particles are doped into PLA, the original free volume gap of PLA will be filled, thus reducing the free volume of the whole system. Meanwhile, since the particle size of the added MgO is 3–8 Å, the difference is too small, and therefore the influence of the hydrogen bond is more important. With the increase in particle size, the effect of the hydrogen bond is more obvious. Under the action of the hydrogen bond, the polymer bond becomes closer, so the glass transition temperature increases with the increase in particle size within a certain range.
The breakdown strength and volume resistivity of PLA doped with MgO of different particle sizes and mass fractions are shown in Figure 6 and Figure 7, respectively. As can be seen from the figure, with the increase in particle size and filler mass fraction, both the breakdown strength and volume resistivity of MgO/PLA composites first increase and then decrease. The characteristic breakdown strength and volume resistivity of PLA-50MgO-5% are the largest, at 44.69 kV/mm and 16.48   ×   10 15   Ω · cm , respectively. Compared with the 39.41 kV/mm of pure PLA, this is an increase of 13.40%.
DSC results show that the crystallinity of the polymer changes due to the change in particle size. Changes in breakdown strength and volume resistivity can be attributed to changes in the crystallinity of the polymer. The breakdown strength and volume resistivity increase with the increase in crystallinity, mainly because the free volume of MgO-doped Polylactic acid decreases with the increase in crystallinity. Therefore, as the free path of electrons decreases, it becomes difficult for them to accumulate energy in the electric field, and the probability of electron acceleration under the electric field decreases. Therefore, the breakdown strength and volume resistivity of polymers increase with the increase in particle size over a certain range [17].
To further study the mechanism of trap formation in MgO/PLA composites, functional density theory (DFT) was used to calculate the density of state (DOS) and electron orbital level structure of PLA and MgO [18]. Since the conduction bands of MgO and PLA are not continuous, it is important to consider the tendency of charge transfer. Figure 8a,b are DOS diagrams of the PLA matrix and MgO, respectively. It can be seen from the figure that the highest HOMO energy level of PLA is −12.0 eV, and the lowest LUMO energy level is 4.7 eV. The HOMO level of MgO is −4.8 eV, and the LUMO is 1.0 eV. The frontier molecular orbital energy level and Fermi energy level (as shown in Table 2) of both are quite different, which will lead to a charge transfer between them after contact, thus forming trap sites. Figure 8c shows the electron energy level structure before and after the contact between PLA and MgO. After the contact between PLA and MgO, due to the higher Fermi level of PLA, the electrons migrate from PLA to MgO until the two have the same Fermi level. This process will cause the band of PLA to bend down and the band of MgO to bend up. This means that electrons in MgO/PLA composites tend to migrate to MgO, while electrons on MgO need to cross a barrier when migrating to PLA. Therefore, this process will result in a large number of electrons being trapped at the interface between PLA and MgO, forming a deep electron trap.
For polymers containing inorganic fillers, the electron movement is mainly along the inorganic–organic interface [19]. Therefore, the deeper electron trap is conducive to improving the resistivity of MgO/PLA composites [20]. At the same time, the deep trap at the interface between PLA and MgO can slow down or hinder the migration of high-energy electrons, reduce the motion ability of electrons under a high electric field and reduce the probability of secondary electron collapse [21], and the breakdown path will be significantly inhibited.

4. Conclusions

For polymers containing inorganic fillers, the electron movement is mainly along the inorganic–organic interface. Therefore, the deeper electron trap is conducive to improving the resistivity of MgO/PLA composites. At the same time, the deep trap at the interface between PLA and MgO can slow down or hinder the migration of high-energy electrons, reduce the motion ability of electrons under high electric field and the probability of secondary electron collapse, and the breakdown path will be significantly inhibited.
(1)
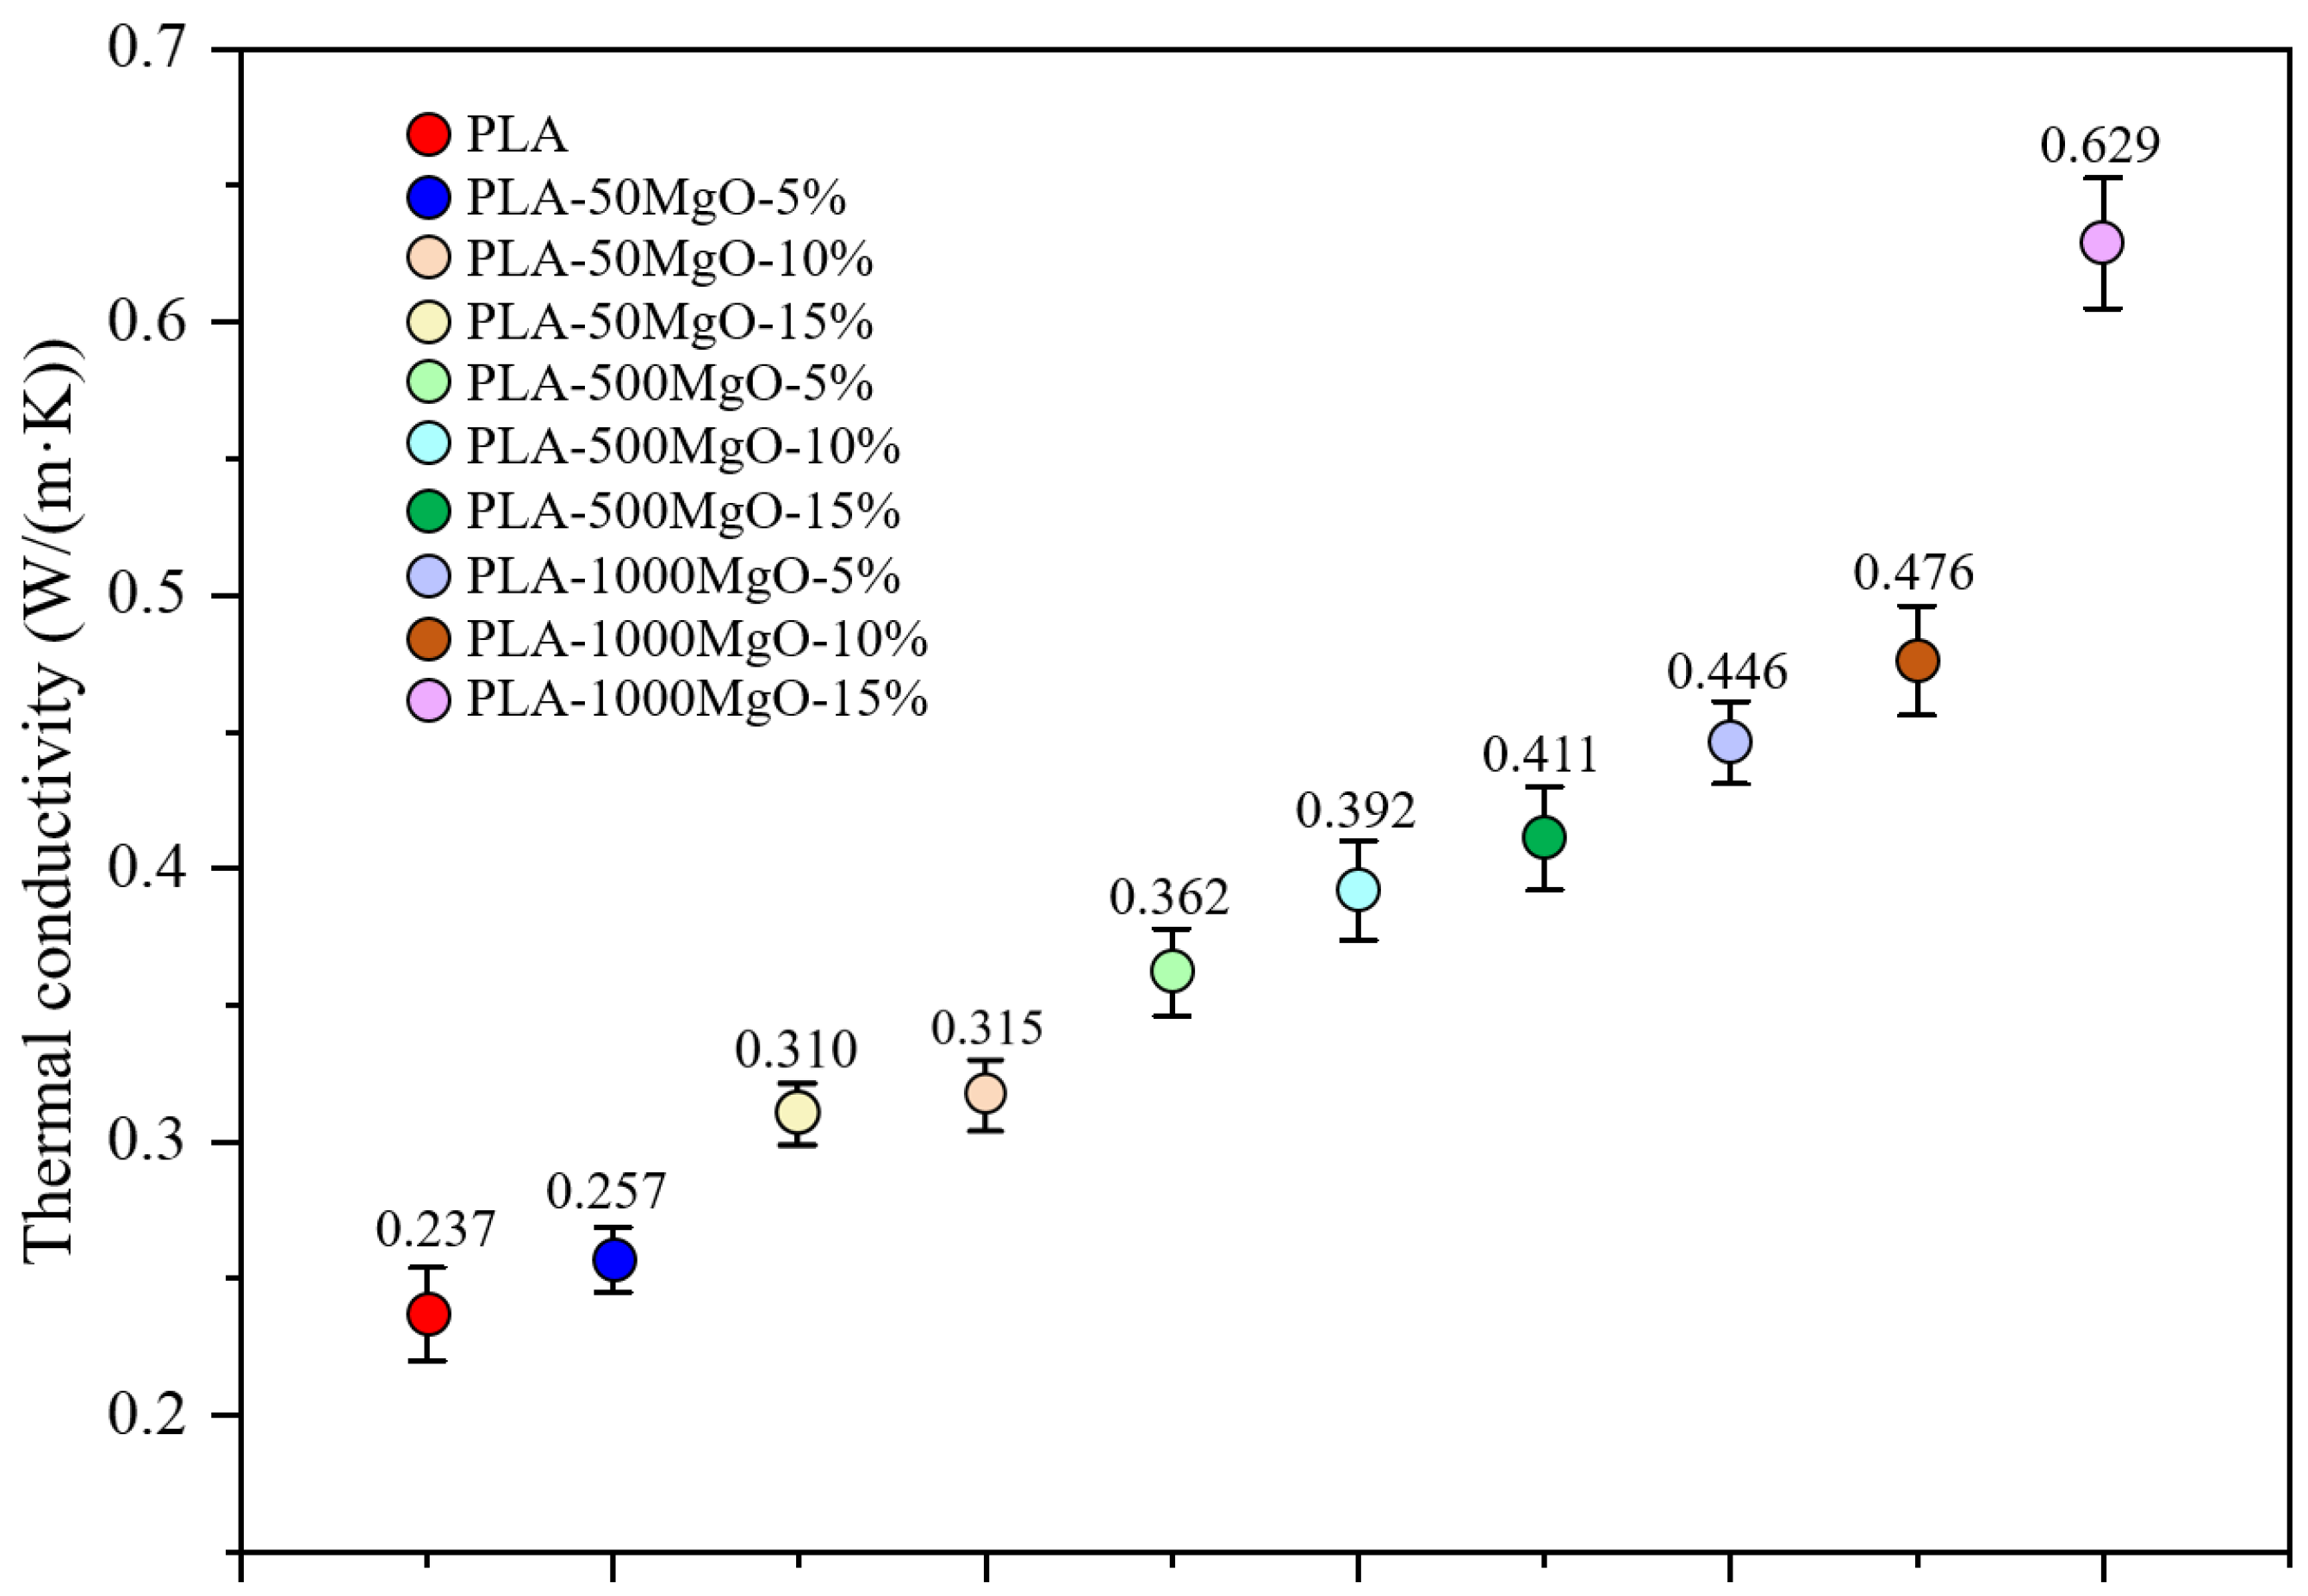
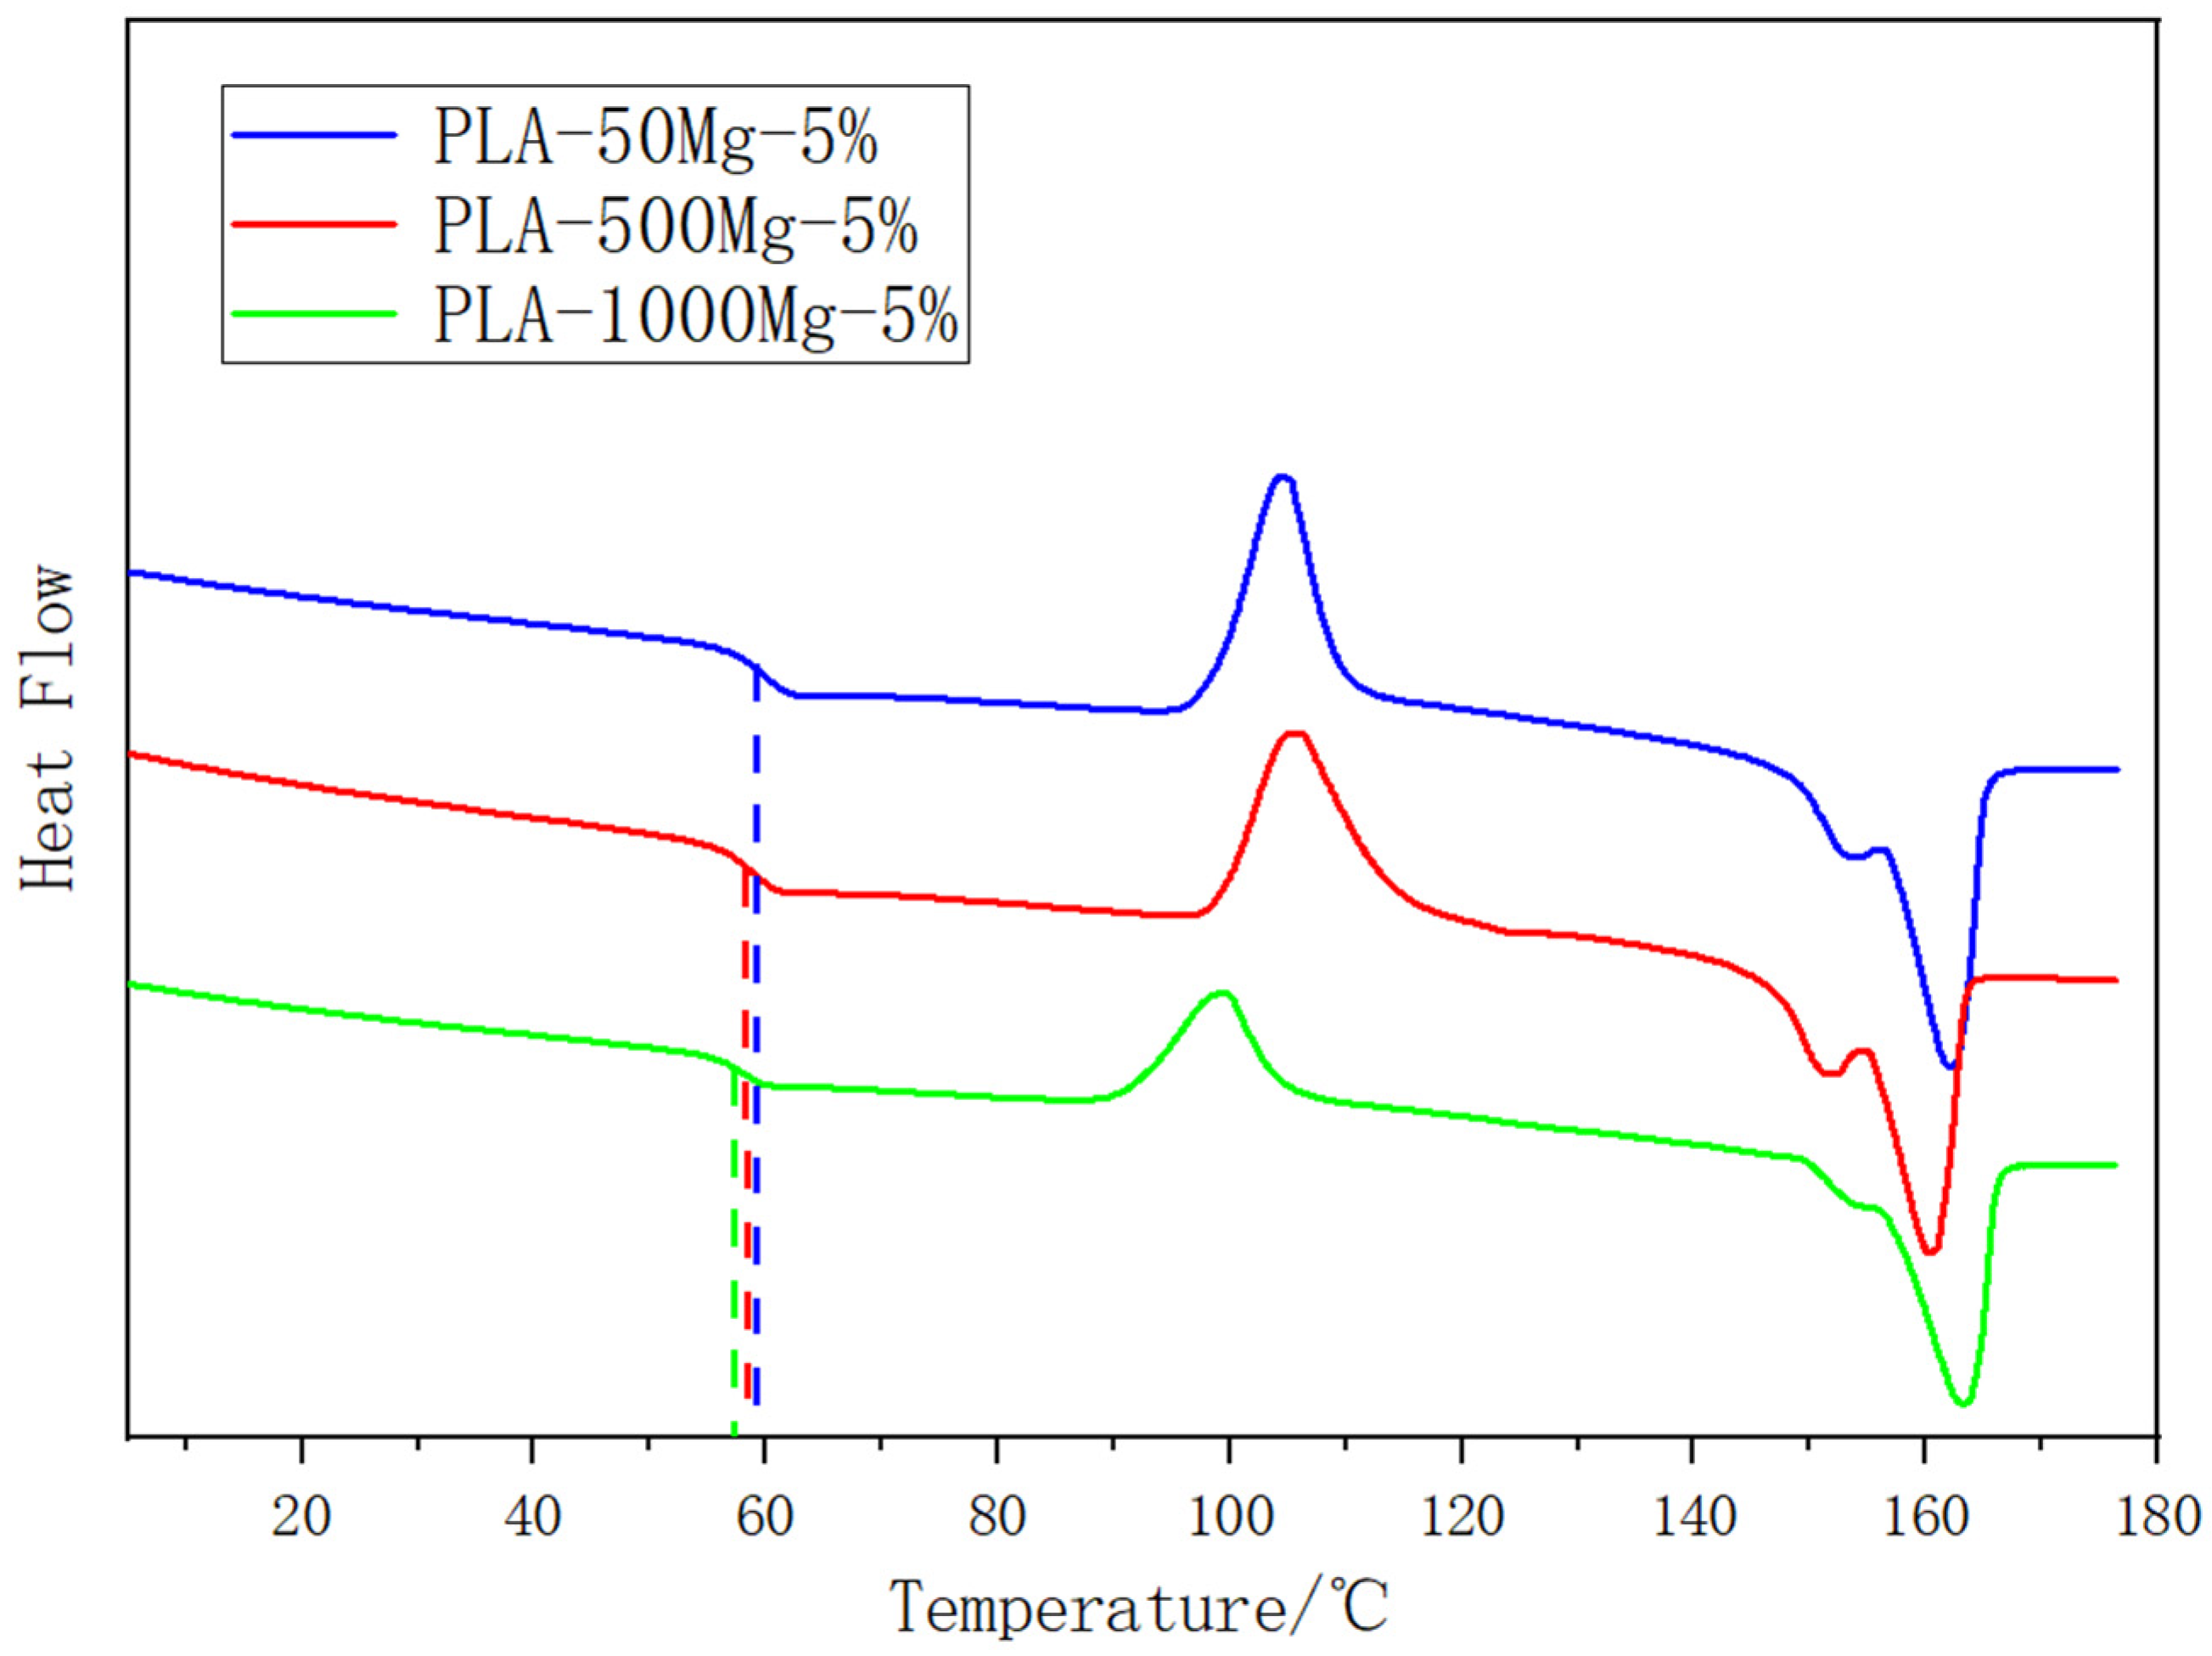
With the increase in MgO particle size and mass fraction, the thermal conductivity and Tg of MgO/PLA composites showed a trend of gradual increase, first increasing and then decreasing, respectively. The glass transition temperature reached the maximum when the particle size of MgO was 50 nm. The increase in thermal conductivity is attributed to MgO’s ability to form an inorganic thermal conductivity network in PLA. The reason why Tg first rises and then falls is that less MgO can inhibit the movement of the surrounding PLA chain segment, and when MgO is overloaded, the original PLA crosslinked structure will be destroyed.
(2)
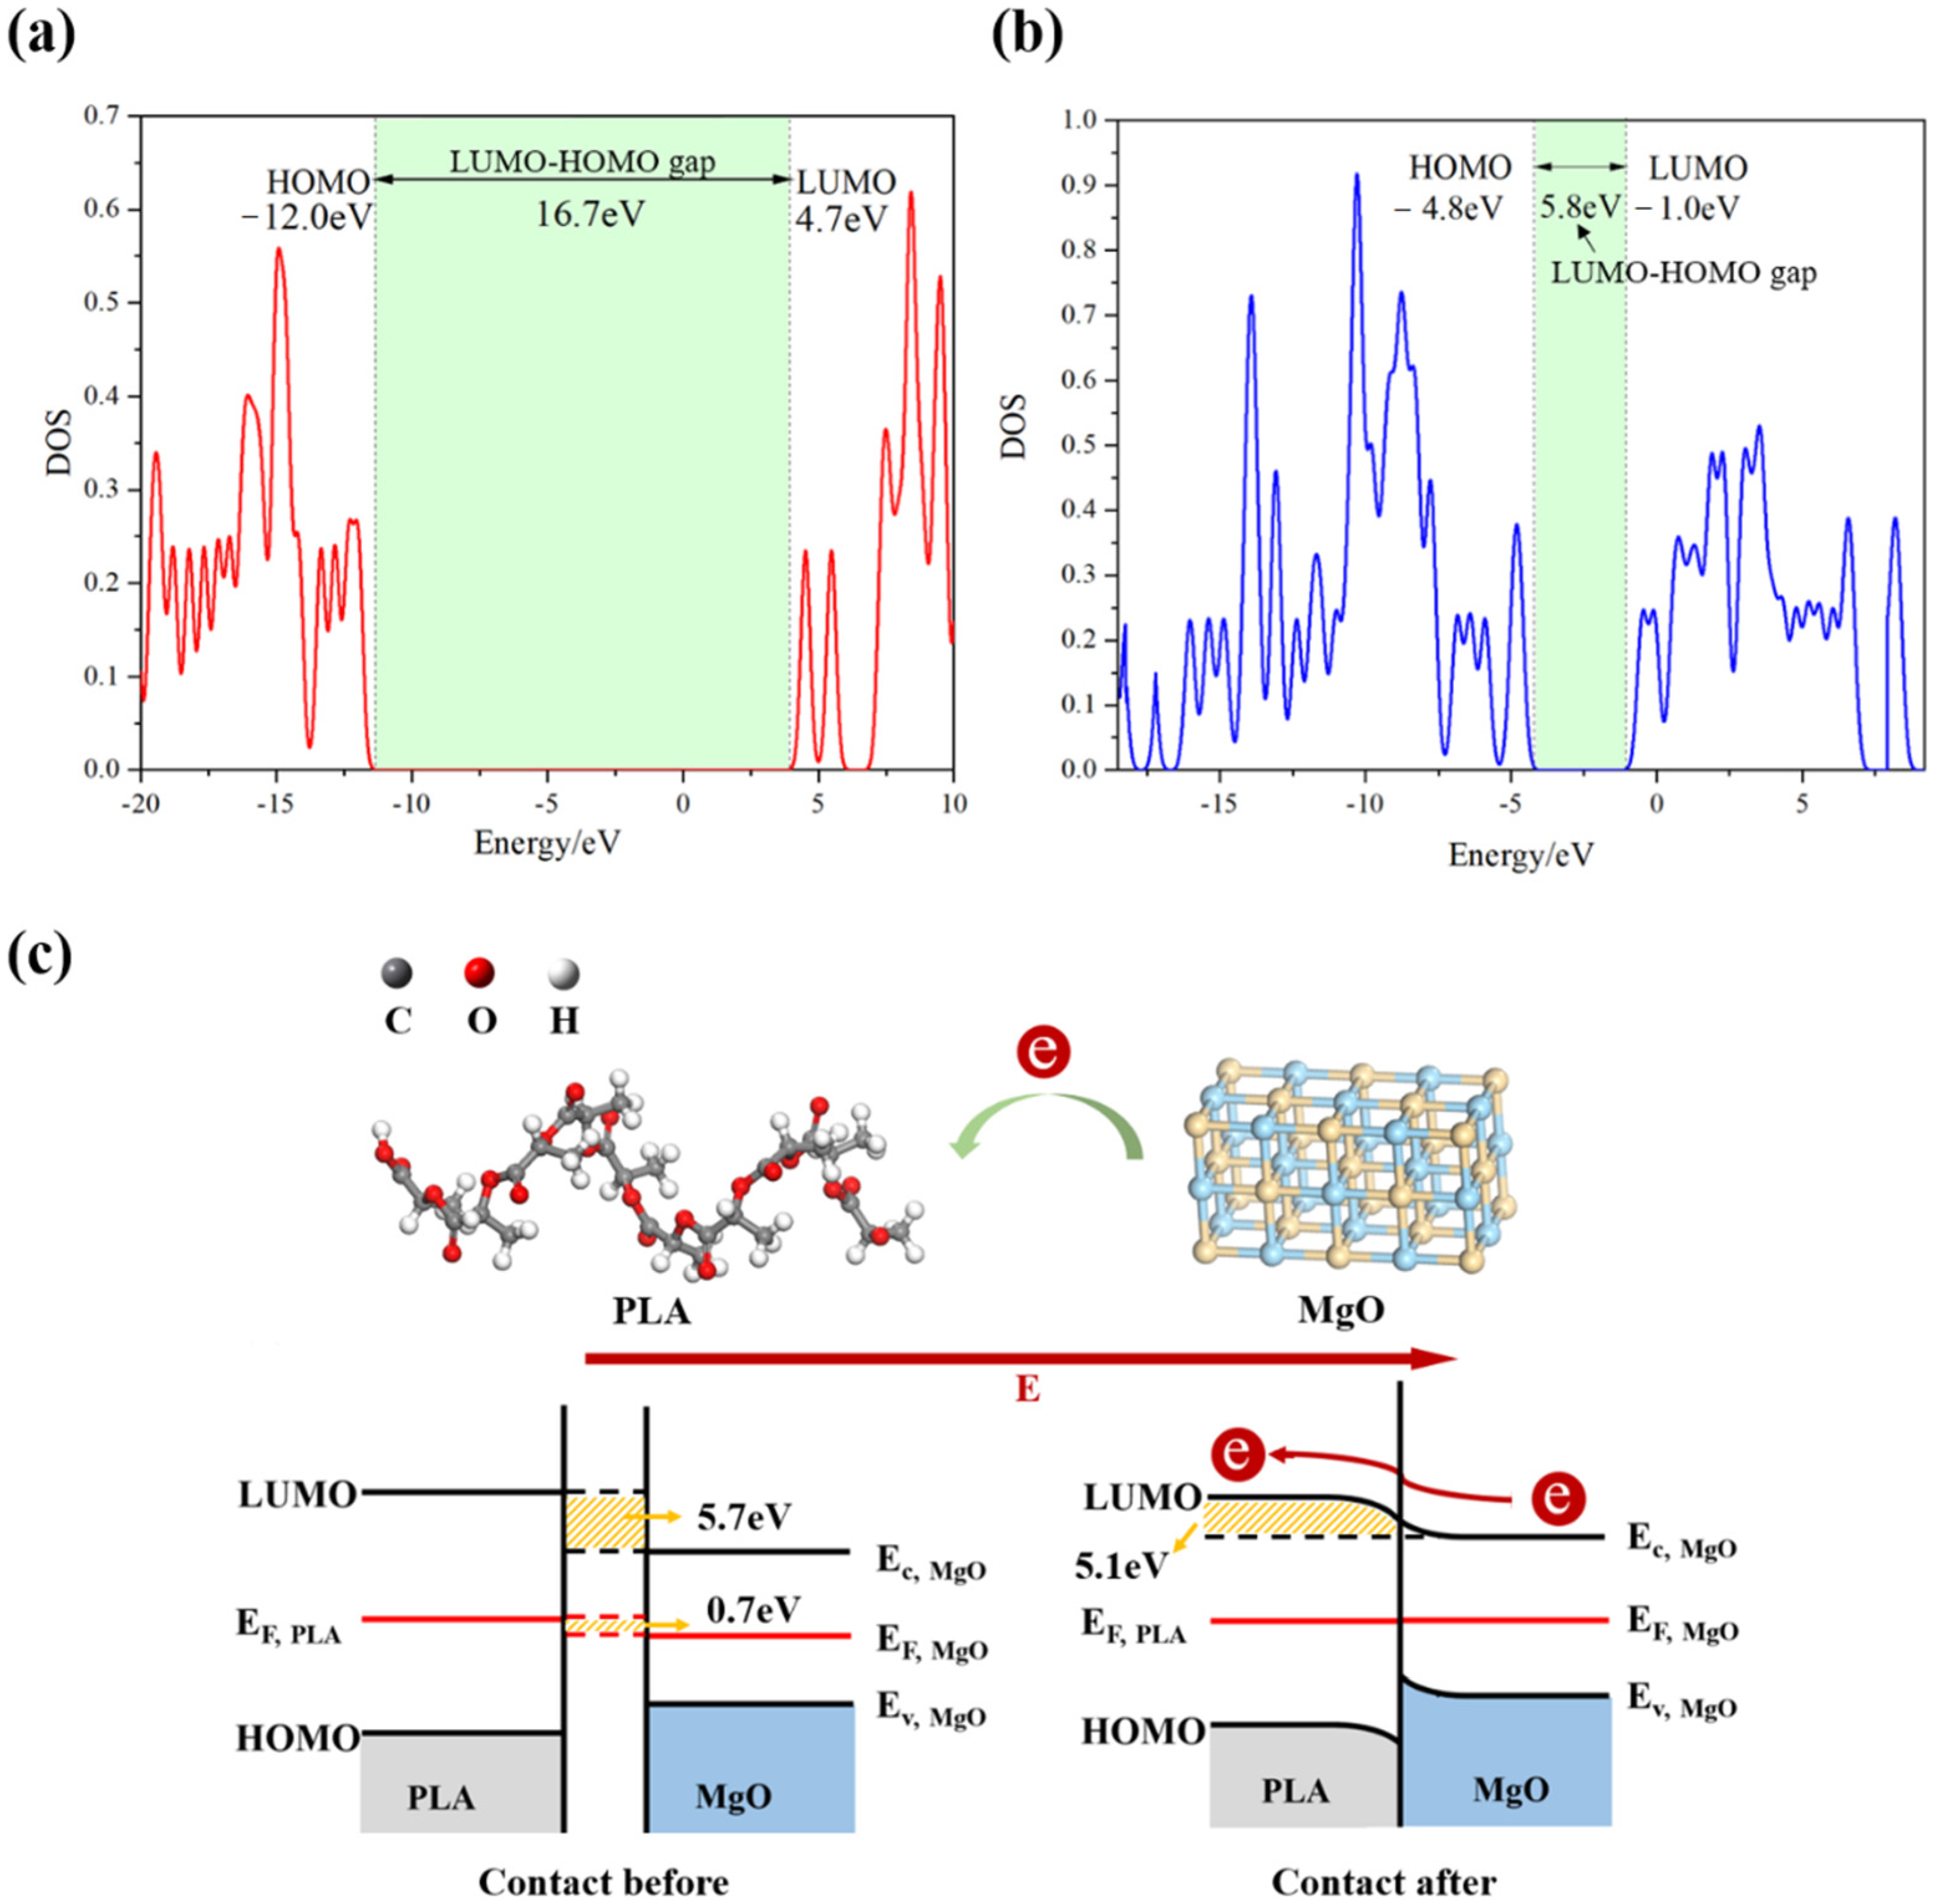
The results of molecular dynamics simulation show that the Tg of Mg/PLA composites first increased and then decreased with the increase in MgO particle size, which is qualitatively consistent with the experimental results. The DFT results show that electrons migrate from PLA to MgO in MgO/PLA composites, which provides a theoretical basis for the formation of electron traps.
(3)
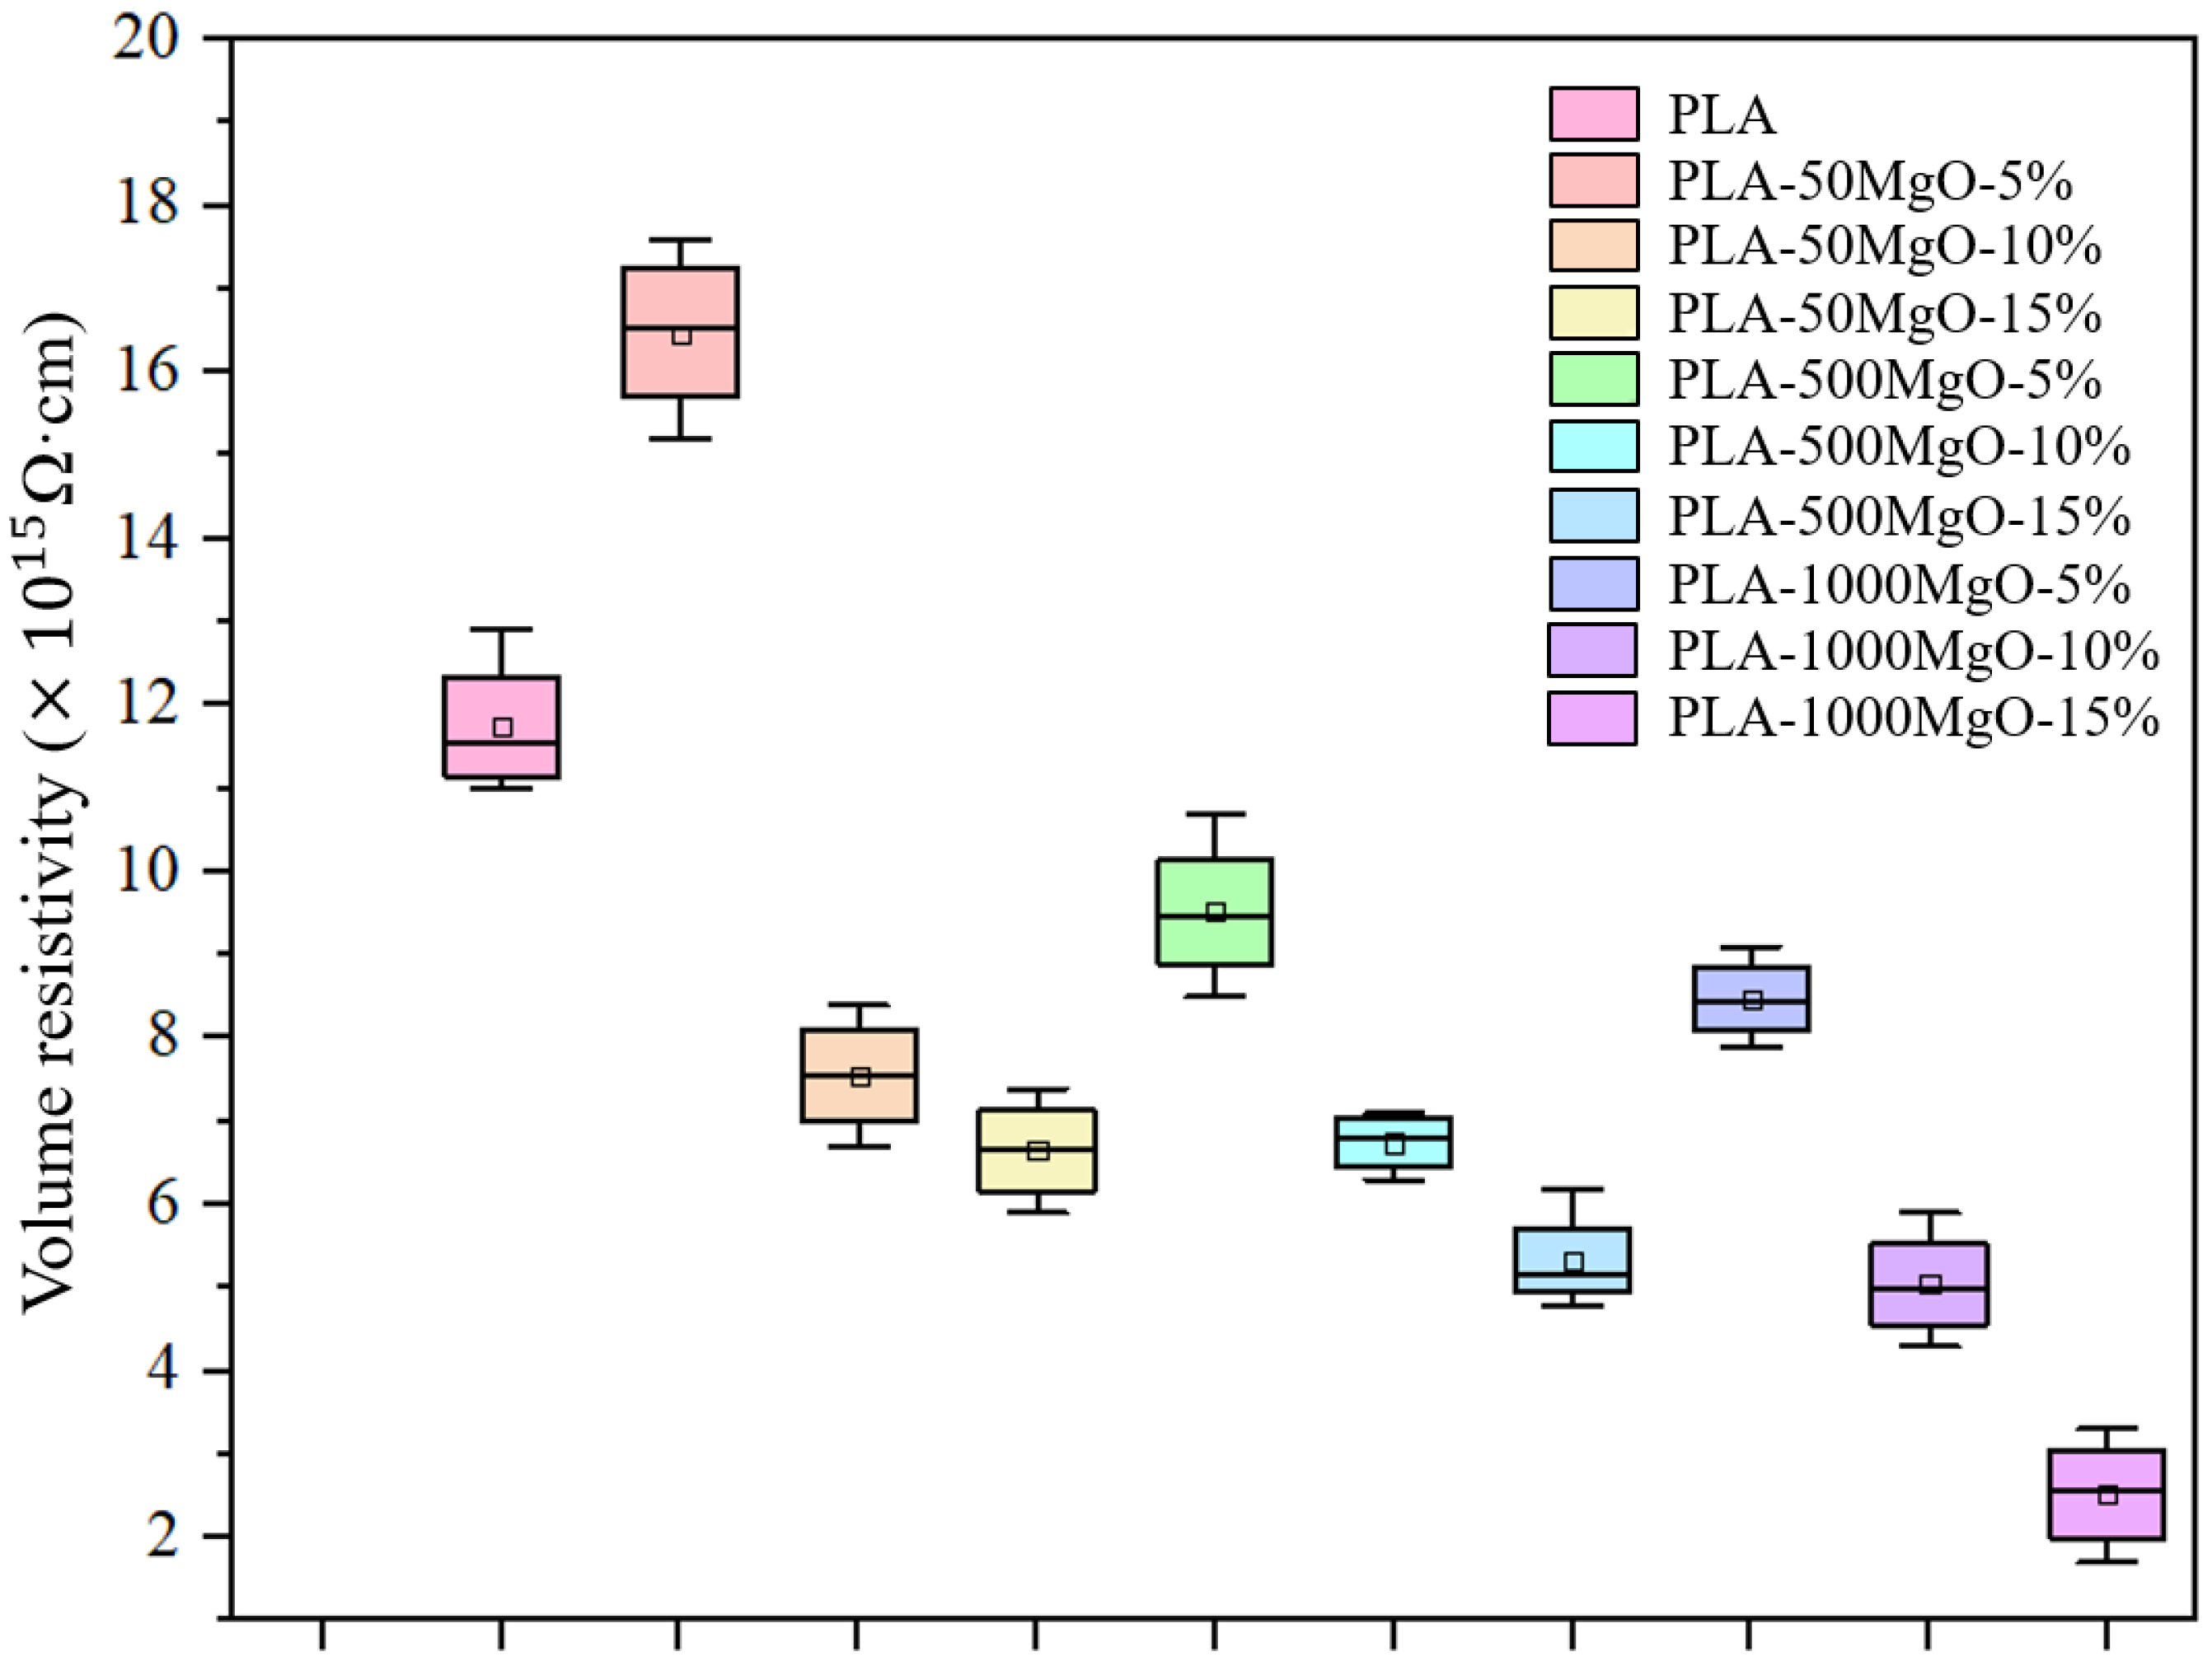
Both breakdown strength and volume resistivity first increased and then decreased with the increase in MgO particle size and mass fraction. When the particle size of MgO is 50 nm and the mass fraction is 5.0 wt%, the volume resistivity and breakdown strength of the composites reach the maximum values. This is because when the MgO load is low, traps at the organic–inorganic interface can trap electrons, limiting their movement. However, when the MgO load is high, the trap region overlaps, leading to electron conduction between interfaces, thus reducing the electrical resistance of MgO/PLA composites.
In conclusion, the optimal particle size and mass fraction of MgO should be 50 nm and 5.0 wt%, which can effectively improve the thermal and electrical properties of the composite material and make it more widely applicable in the field of application.

Author Contributions

Conceptualization, R.H. and J.F.; writing—original draft preparation, R.H.; investigation, C.L.; software, J.D.; methodology B.D.; writing—review and editing, B.D. All authors have read and agreed to the published version of the manuscript.

Funding

This paper is supported by the science and technology project of Zhejiang Electric Power Co., LTD. “Preliminary research on the Shell of eco-environmental protection low-voltage metering box” (2021ZK47).

Institutional Review Board Statement

This study did not involve humans or animals.

Informed Consent Statement

Informed consent was obtained from all subjects involved in the study.

Data Availability Statement

Not applicable.

Conflicts of Interest

The authors declare that they have no known competing financial interests or personal relationships that could have appeared to influence the work reported in this paper.

References

  1. Moustafa, H.; El Kissi, N.; Abou-Kandil, A.I.; Abdel-Aziz, M.S.; Dufresne, A. PLA/PBAT Bionanocomposites with Antimicrobial Natural Rosin for Green Packaging. ACS Appl. Mater. Interfaces 2017, 9, 20132–20141. [Google Scholar] [CrossRef] [PubMed]
  2. Scoponi, G.; Francini, N.; Iou, A.A.S. Production of Green Star/Linear PLA Blends by Extrusion and Injection Molding: Tailoring Rheological and Mechanical Performances of Conventional PLA. Macromol. Mater. Eng. 2021, 306, 2000805. [Google Scholar] [CrossRef]
  3. Scaffaro, R.; Maio, A.; Gulino, E.; Alaimo, G.; Morreale, M. Green Composites Based on PLA and Agricultural or Marine Waste Prepared by FDM. Polymers 2021, 13, 1361. [Google Scholar] [CrossRef] [PubMed]
  4. Adnan, M.M.; Tveten, E.G.; Glaum, J.; Ese, M.-H.G.; Hvidsten, S.; Glomm, W.; Einarsrud, M.-A. Epoxy-Based Nanocomposites for High-Voltage Insulation: A Review. Adv. Electron. Mater. 2019, 5, 1800505. [Google Scholar] [CrossRef]
  5. Song, Y.H.; Kim, T.; Choi, U.H. Tuning Morphology and Properties of Epoxy-Based Solid-State Polymer Electrolytes by Molecular Interaction for Flexible All-Solid-State Supercapacitors. Chem. Mater. 2020, 32, 3879–3892. [Google Scholar] [CrossRef]
  6. Qin, P.; Yi, D.; Hao, J.; Ye, X.; Gao, M.; Song, T. Fabrication of melamine trimetaphosphate 2D supermolecule and its superior performance on flame retardancy, mechanical and dielectric properties of epoxy resin. Compos. Part B 2021, 225, 109269. [Google Scholar] [CrossRef]
  7. Vidović, E.; Faraguna, F.; Jukić, A. Influence of inorganic fillers on PLA crystallinity and thermal properties. J. Therm. Anal. Calorim. 2017, 127, 371–380. [Google Scholar] [CrossRef]
  8. Toselli, M.; Saccani, A. Enhancing the thermo-oxidative stability of PLA through the use of hybrid organic–inorganic coatings. J. Appl. Polym. Sci. 2016, 133, 43897. [Google Scholar] [CrossRef]
  9. Elsawy, M.A.; Saad, G.R.; Sayed, A.M. Mechanical, Thermal, and Dielectric Properties of Poly(lactic acid)/Chitosan Nanocomposites. Polym. Eng. Sci. 2016, 56, 987–994. [Google Scholar] [CrossRef]
  10. Guo, R.; Ren, Z.; Bi, H.; Xu, M.; Cai, L. Electrical and Thermal Conductivity of Polylactic Acid (PLA)-Based Biocomposites by Incorporation of Nano-Graphite Fabricated with Fused Deposition Modeling. Polymers 2019, 11, 549. [Google Scholar] [CrossRef] [Green Version]
  11. Wu, F.; Lan, X.; Ji, D.; Liu, Z.; Yang, W.; Yang, M. Grafting polymerization of polylactic acid on the surface of nano-SiO2 and properties of PLA/PLA-grafted-SiO2 nanocomposites. J. Appl. Polym. Sci. 2013, 129, 3019–3027. [Google Scholar] [CrossRef]
  12. Arrieta, M.P.; Fortunati, E.; Dominici, F.; Rayón, E.; López, J.; Kenny, J.M. Multifunctional PLA-PHB/cellulose nanocrystal films: Processing, structural and thermal properties. Carbohydr. Polym. 2014, 107, 16–24. [Google Scholar] [CrossRef] [PubMed]
  13. Tanaka, T.; Montanari, G.C.; Mulhaupt, R. Polymer nanocomposites as dielectrics and electrical insulation-perspectives for processing technologies, material characterization and future applications. IEEE Trans. Dielectr. Electr. Insul. 2004, 11, 763–784. [Google Scholar] [CrossRef]
  14. Kim, S.J.; Hong, C.; Jang, K.-S. Theoretical analysis and development of thermally conductive polymer composites. Polymer 2019, 176, 110–117. [Google Scholar] [CrossRef]
  15. Mai, Y.; Du, B.; Liu, Q.; Zhao, Y.; Yang, W.; Yan, B. Influence of Micro@Nano-Al2O3 Structure on Mechanical Properties, Thermal Conductivity, and Electrical Properties of Epoxy Resin Composites. J. Electron. Mater. 2022, 51, 232–242. [Google Scholar] [CrossRef]
  16. Sansao, B.M.B.; Kellar, J.J.; Cross, W.M.; Schottler, K.; Romkes, A. Comparison of surface energy and adhesion energy of surface-treated particles. Powder Technol. 2021, 384, 267–275. [Google Scholar] [CrossRef]
  17. Li, D.; Zhou, L.; Wang, X.; He, L.; Yang, X. Effect of Crystallinity of Polyethylene with Different Densities on Breakdown Strength and Conductance Property. Materials 2019, 12, 1746. [Google Scholar] [CrossRef] [Green Version]
  18. Yu, K.; Ni, J.; Zhou, H.; Wang, X.; Mi, J. Effects of in-situ crystallization on poly (lactic acid) microcellular foaming: Density functional theory and experiment. Polymer 2020, 200, 122539. [Google Scholar] [CrossRef]
  19. Morita, H.; Toda, M.; Honda, T. Analysis of the end-segment distribution of a polymer at the interface of filler-filled material. Polym. J. 2016, 48, 451–455. [Google Scholar] [CrossRef]
  20. Mi, R.; Xing, Z.L.; Hao, J.H.; Hu, X.N.; Min, D.M.; Li, S.T.; Wu, Q.Z. Effect of morphology and traps on DC conductivity and breakdown of polyethylene nanocomposites. IEEE Trans. Dielectr. Electr. Insul. 2020, 27, 489–497. [Google Scholar] [CrossRef]
  21. Klein, P.; Binari, S.; Ikossi, K.; Wickenden, A.; Koleske, D.; Henry, R. Effect of deep traps on sheet charge in AlGaN/GaN high electron mobility transistors. Electron. Lett. 2001, 37, 1550–1551. [Google Scholar] [CrossRef]
Figure 1. Breakdown strength test platform.
Energies 15 03479 g001
Figure 2. Thermal conductivity of polylactic acid composites doped with different particle sizes and mass fractions of MgO.
Energies 15 03479 g002
Figure 3. (a) EDS images with particle size of 50 nm and mass fraction of 5%; (b) EDS images with particle size of 1 um and mass fraction of 15%; (c) Infrared thermal images of different MgO/PLA composites.
Energies 15 03479 g003
Figure 4. DSC of PLA/MgO composites with different particle sizes of MgO.
Energies 15 03479 g004
Figure 5. Specific volume of each system model. (a) Calculation model of MgO/PLA composites; (b) Change of specific volume of MgO/PLA composites with particle size of 3 Å (c) Change in specific volume of MgO/PLA composites with particle size of 5 Å (d) Change in specific volume of MgO/PLA composites with particle size of 8 Å.
Energies 15 03479 g005
Figure 6. Weibull distribution of breakdown strength.
Energies 15 03479 g006
Figure 7. Resistivity of different PLA composites.
Energies 15 03479 g007
Figure 8. (a) DOS of PLA matrix; (b) DOS of MgO; (c) Band structures of PLA matrix and MgO before and after contact.
Energies 15 03479 g008
Table 1. Melting heat and crystallinity parameters of MgO with different particle sizes.
SampleTg/°C Δ H m / ( J / g ) X c / %
PLA-50MgO-5%57.0030.9032.98
PLA-500MgO-5%55.3425.3927.10
PLA-1000MgO-5%54.8323.5425.12
Table 2. Electronic property parameters for PLA and MgO calculated by quantum chemical calculation.
MaterialsElectronic Property ParametersContact beforeContact after
PLALUMO levelLUMO4.7 eV4.4 eV
HOMO levelHOMO−12.0 eV−12.3 eV
Fermi levelEF,PLA−3.6 eV−3.3 eV
MgOConduction bandEC,MgO−1.0 eV−0.7 eV
Valence bandEV,MgO−4.8 eV−4.5 eV
Fermi levelEF,MgO−2.9 eV−3.3 eV
Publisher’s Note: MDPI stays neutral with regard to jurisdictional claims in published maps and institutional affiliations.

