
Predicting Electricity Imbalance Prices and Volumes: Capabilities and Opportunities


1
School of Mathematics and Statistics, University of Glasgow, Glasgow G12 8TA, UK
2
Department of Electronic and Electrical Engineering, University of Strathclyde, Glasgow G1 1XQ, UK
*
Author to whom correspondence should be addressed.
Energies 2022, 15(10), 3645; https://0-doi-org.brum.beds.ac.uk/10.3390/en15103645
Submission received: 21 April 2022
/
Revised: 10 May 2022
/
Accepted: 12 May 2022
/
Published: 16 May 2022
Abstract
:Electricity imbalance pricing provides the ultimate incentive for generators and suppliers to contract with one another ahead of time and deliver against their obligations. As delivery time approaches, traders must judge whether to trade-out a position or settle it in the balancing market at the as-yet-unknown imbalance price. Forecasting the imbalance price (and related volumes) is therefore a necessity in short-term markets. However, this topic has received surprisingly little attention in the academic literature despite clear need by practitioners. Furthermore, the emergence of algorithmic trading demands automated forecasting and decision-making, with those best able to extract predictive information from available data gaining a competitive advantage. Here we present the case for developing imbalance price forecasting methods and provide motivating examples from the Great Britain’s balancing market, demonstrating forecast skill and value.
1. Introduction
Electricity is a special commodity. Supply must meet demand continuously, and delivery is constrained by the physics of complex transmission and distribution networks. Liberalisation of the energy sector has given rise to a range of market places where electricity can be bought and sold ahead of time, and to settle differences between what was contracted and actually delivered. The settlement process involves resolving participants’ so-called imbalance volumes at a price that reflects the cost incurred by the system operator when correcting these imbalances. Imbalance pricing is designed to incentivise participants to minimise their imbalance volumes, i.e., to generate or consume what they have contracted.
Market participants continuously manage their portfolio’s potential imbalance volume (e.g., due to uncertain renewable energy production or customer demand) and therefore exposure to the imbalance price. Traders must take a view on what the imbalance price may be—hence the need for imbalance price forecasts. It is therefore remarkable that the academic literature on this problem is sparse, especially when compared to the extensive literature on forecasting day-ahead market prices, reviewed in [1,2].
Furthermore, what little literature considers imbalance price forecasting does so alongside the development of trading strategies that require a view to be taken on future imbalance prices, but this is treated as secondary to trading: Approaches to modelling future imbalance prices include assuming that participants anticipate the annual and quarterly average imbalance prices [3], applying the average relationship to day-ahead price [4], and prediction using time series models [5]. The need for imbalance price forecasts may even be removed if it is assumed that trading parties balance their portfolio, as in [6], though this results in sub-optimal trading decisions. In general, these studies have focused on producing forecasts ‘good enough’ to demonstrate the efficacy of trading strategies and not on producing high-quality forecasts. Few examples of more sophisticated approaches exist, which include Bottieau et al. [7] who showed the benefit of machine learning methods over standard benchmarks with a feature set including forward prices plus recent and predicted generation and load. However, Bottieau et al. only considered one-step-ahead prediction of imbalance volume and not price.
Indeed, imbalance volume forecasting has received comparatively more attention than price, with early works including [8], which identifies imbalance volume as a particularly challenging but important quantity to forecast, and proposed a Neural Network for this task. Very-short-term imbalance volume forecasting to support power system operators is considered in [9,10], the latter having a particular focus on probabilistic forecasting and interpretability. Both consider lagged imbalance volumes, calendar/temporal features, wholesale prices, as well as forecasts/schedules and lagged observations of renewables, conventional generation, and interconnector flows as explanatory variables. However, potentially valuable information is not included, such as intraday market order books and executed trades, system operator actions, and the generation stack, for example.
Others have exploited regional characteristics, combining imbalance volume forecasts with reserve costs [11]. Studies that focus on day-ahead forecasting and trading strategies have concluded that climatological or simple models perform well and are very difficult to improve on, whereas within-day it is possible to produce more accurate forecasts. However, to the best of our knowledge, there are no example of imbalance price or volume forecasting in the academic literature that leverage even close to the full range of relevant data now readily available to market participants.
The transition to renewables is central to the decarbonisation of society, and as such, integrating them into electricity markets, including balancing markets, is critical [12]. The stochastic nature of wind and solar power in particular continue to motivate research to improve forecasting of power production and associated quantities, including electricity prices. This short communication presents the key features of imbalance price forecasting, and current challenges faced by forecasters in this area, which has received surprisingly little attention in the literature to date. We demonstrate the value of both day-ahead and intraday imbalance price forecasts in a simple trading case study based on a small conventional generator participating in the GB balancing market with a flexible asset.
2. Imbalance Price Forecasting
In this section, imbalance price forecasts are examined on two important time scales. First, a forecast made in advance of gate closure for day-ahead markets, and second in advance of gate closure for intraday markets (i.e., up until just before the start of the delivery period).
2.1. Day-Ahead
At the day-ahead stage, the accuracy of imbalance price/imbalance volume forecasts is generally low, as plant schedules are often only determined once the day-ahead price is known. However, basic probabilistic forecasts of system length can still be used to inform offer strategies on the day-ahead market. For instance, the probability of the system being long or short may be forecast with greater skill than relying on historic frequencies of occurrence, and the eventual difference between the day-ahead price and the imbalance price may be predicted more accurately than the imbalance price alone.
We illustrate this here with a simple model based on kernel density estimation and linear regression for the GB imbalance price. Separate density forecasts for long and short systems are combined according to the forecast probability of the system being long or short. Inputs to these models are based on public data available in real time. For comparison we also consider two benchmarks: (1) taking the day-ahead auction price as the imbalance price forecast and (2) climatology, where the forecast is the day-ahead price plus the average difference between day-ahead and imbalance price.
2.2. Intraday
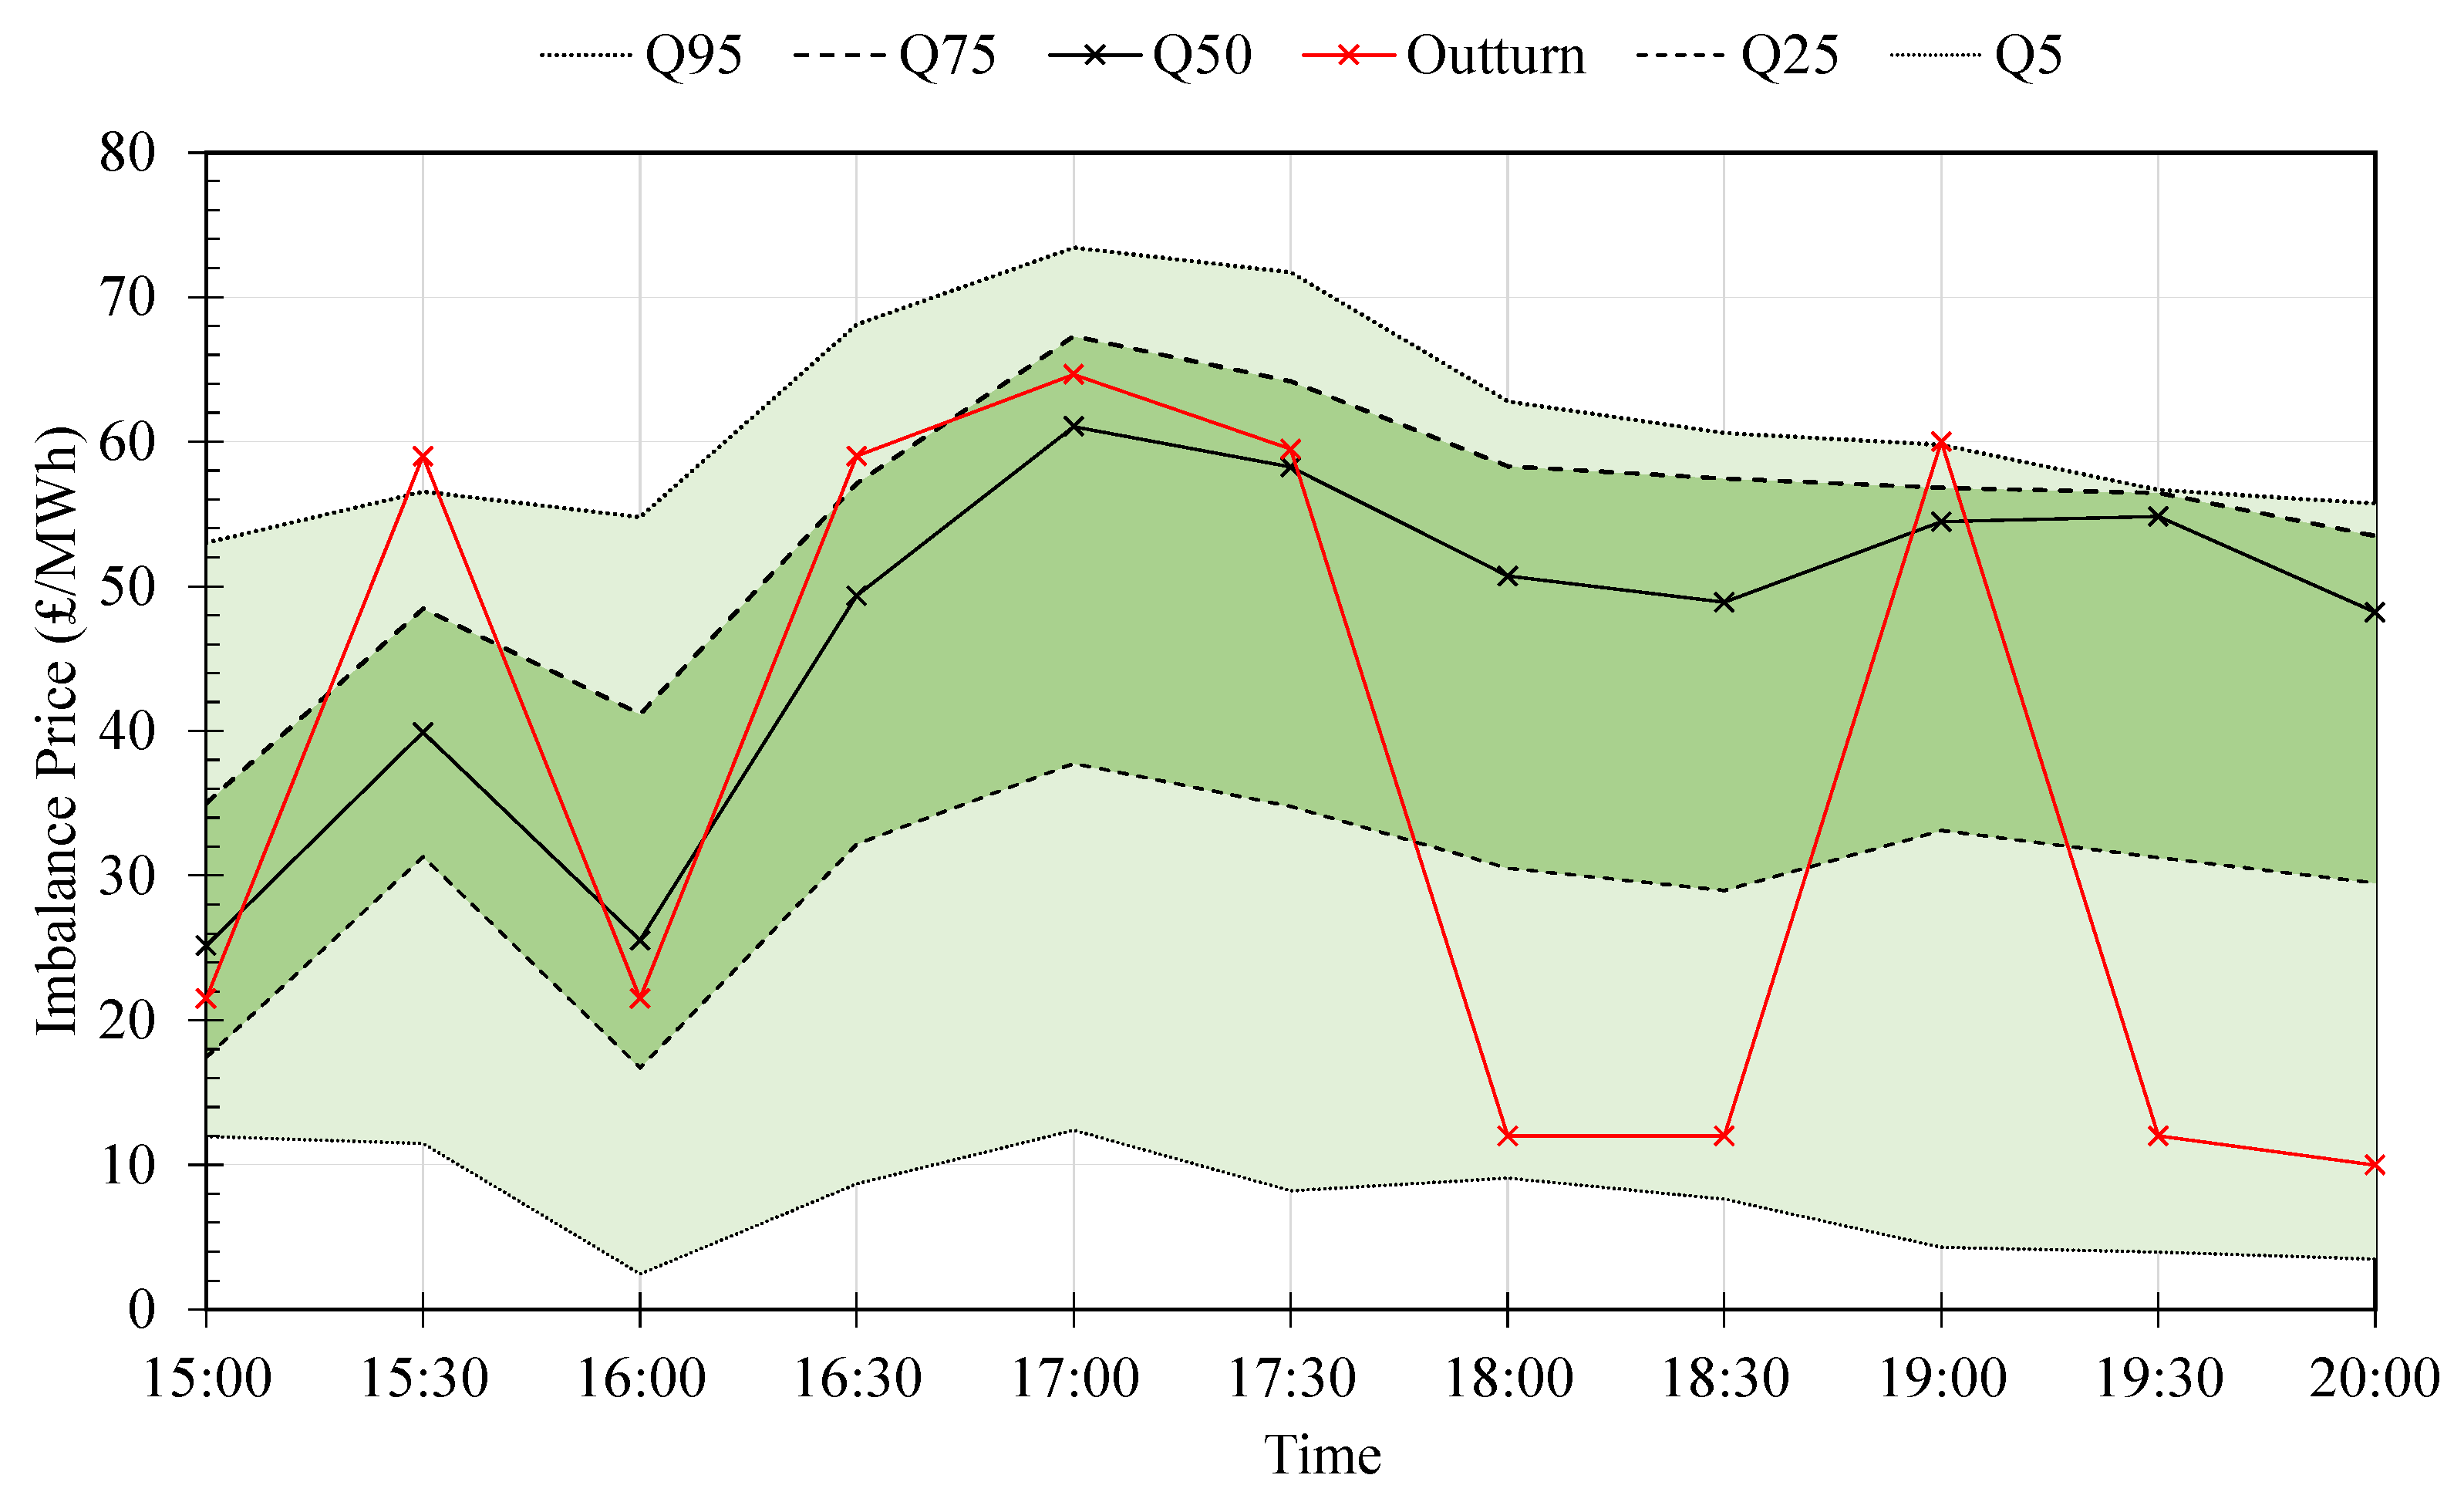
As the point of delivery approaches, an increasing volume of data relevant to the future imbalance price becomes available. This typically includes generator and interconnector schedules; interventions by the system operator; intraday market order books and executed trades; weather forecasts/observations; and recent imbalance volumes and prices. The data may arrive continuously (as actions are taken by system operators and traders), at a fixed point before delivery, or not at all (due to a data outage). Each set of variables has all the potential to improve the imbalance forecast: knowing which generators are online provide an indication of the marginal cost of regulation energy; intraday market data reveals participants’ views on future imbalance prices; and plant or network outages impact the demand for regulation energy. This paper presents the performance of a proprietary forecasting tool developed by the authors in collaboration with market participants for the GB imbalance price from zero to five hours (ten 30-min settlement periods) ahead, leveraging this data. Figure 1 shows an example forecast as a fan plot.
2.3. Summary of Forecast Performance
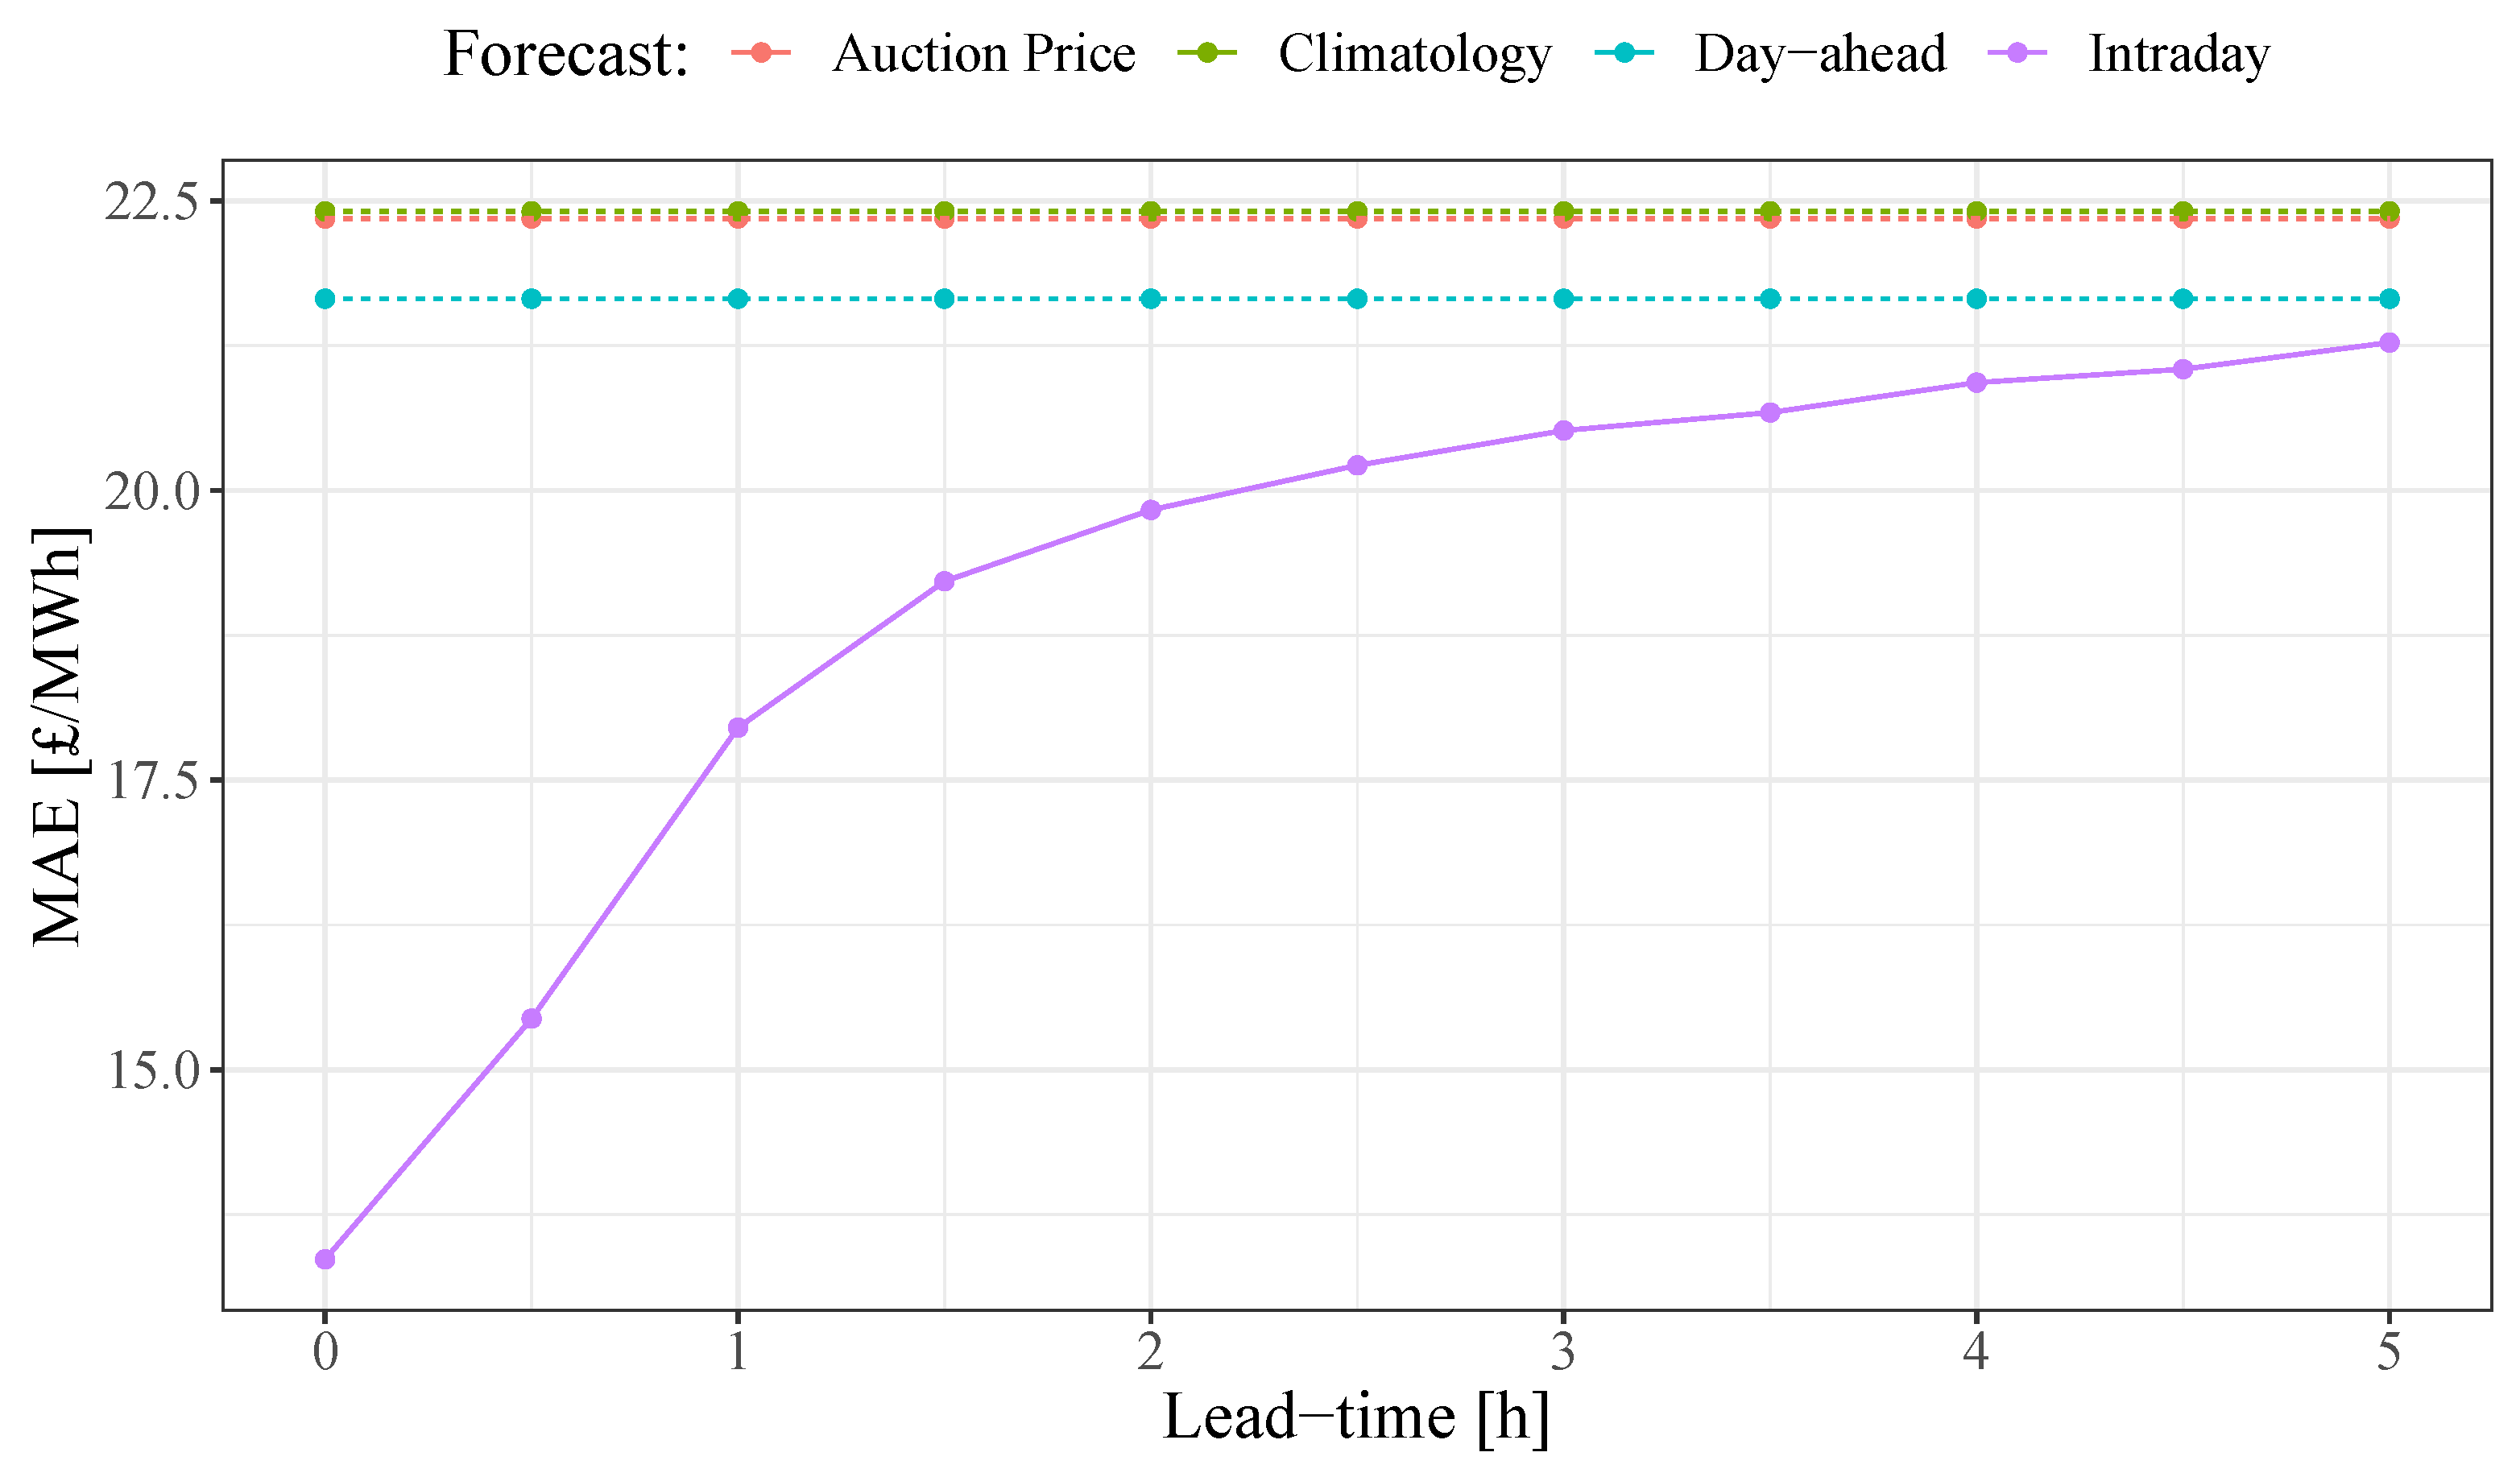
To give an indication skill, the median from each half hourly forecast is evaluated using Mean Absolute Error (MAE). Data from January 2017 to October 2020 is used for training and validation with October 2020 to December 2020 used for out-of-sample testing. Results from the test period are reported here. In Figure 2, the skill of intraday forecasts is shown for lead-times from 0 to 5 h ahead. The intraday forecasts show an improvement of 5–40% over the climatological benchmark, with far superior performance for lead-times less than 3 h ahead. The day-ahead forecasts also shows a smaller by significant improvement of 3% over the benchmark.
3. Forecast Value
In this section we demonstrate the value of imbalance price forecasts in trading strategies for flexible assets exposed to the balancing market that are sufficiently small to be price-takers in this market. The forecasts described above are used to drive three trading strategies, all of which are compared in terms of revenue and risk. Two risk appetites are considered—risk neutral and risk averse—where in the latter revenue is maximised subject to a risk constraint. To simplify the analysis, non-overlapping intraday forecasts from the model described above are used to model a generic flexible asset (which could be the residual flexibility of a larger portfolio) as follows:
- 1.
- The asset can deliver total energy between 0 and 1 MWh in each half hour period;
- 2.
- A predetermined fraction of energy can be delivered to Power-to-X or with no losses. The remainder is delivered to the balancing market and remunerated at the imbalance price ;
- 3.
- Power-to-X is remunerated at a fix price , we consider values in the range 20 to 50 £/MWh;
- 4.
- The asset is always available (implied by 1).
Since there is only one independent random variable, the imbalance price , the uncertain revenue
can be controlled by choosing the volume of energy to divert into Power-to-X. The assumption that the Power-to-X price is fixed is reasonable, as today’s options (heat, gas, self-consumption) have either a fixed or slowly varying price. In principle, this trading strategy could be implemented for any controllable power plant, provided that they are a price-taker in the balancing market.
We evaluate the outcome of each trading strategy in terms of mean revenue and Value-at-Risk (VaR), which is defined as the negative of a quantile of the revenue outcome series where is the cumulative distribution function of revenue. The motivation for this metric is that a low value corresponds to low risk position, and vice versa. For example, a VaR of −£20 means that there is a 1% chance that the revenue will be below £20 in any period.
3.1. Case 1: Point Forecast, Zero/Max
Here deterministic forecasts of the imbalance forecast are used, i.e., the median forecast where is the predictive distribution function of the imbalance price, in a revenue maximization trading strategy. A simple min/max strategy is employed
where all of the available energy is diverted either to the balancing market or to Power-to-X, depending on which is remunerated at the higher price.
3.2. Case 2: Probabilistic, Simple Hedge
In this case energy is hedged according to the probability of the imbalance price being lower than the Power-to-X price. The probability of the imbalance price being lower than the Power-to-X value may be calculated simply as . The Power-to-X volume is then chosen to be . For example, if there is a 50% probability of the imbalance price being lower than the Power-to-X price, half of the available volume is diverted to Power-to-X.
This basic heuristic results in power being diverted to the balancing market and Power-to-X in similar quantities when their respective prices are similar and/or the imbalance price is particularly uncertain, or in favour of the most profitable option when the prices are likely to be different. It therefore offers an effective hedge against large swings in cash flow and reduces risk.
3.3. Case 3: Probabilistic, Risk-Constrained
Finally, probabilistic forecasts are used to explicitly control risk in terms of VaR, by maximising revenue subject to a risk constraint. A probabilistic forecast of revenue is generated, substituting the predictive distribution of the imbalance price into the expression for revenue, Equation (1). Since revenue in this framework is a linearly increasing function of imbalance price, a simple change of variables approach is used to convert the density forecasts of the imbalance price to revenue, for a chosen volume of generation diverted to Power-to-X. From this forecast, the revenue at risk can be constrained by simply selecting such that there is a 1% chance of observing revenue below a user-defined threshold value in any period. In the following example, we constrain the 1% VaR to £/MWh.
3.4. Results
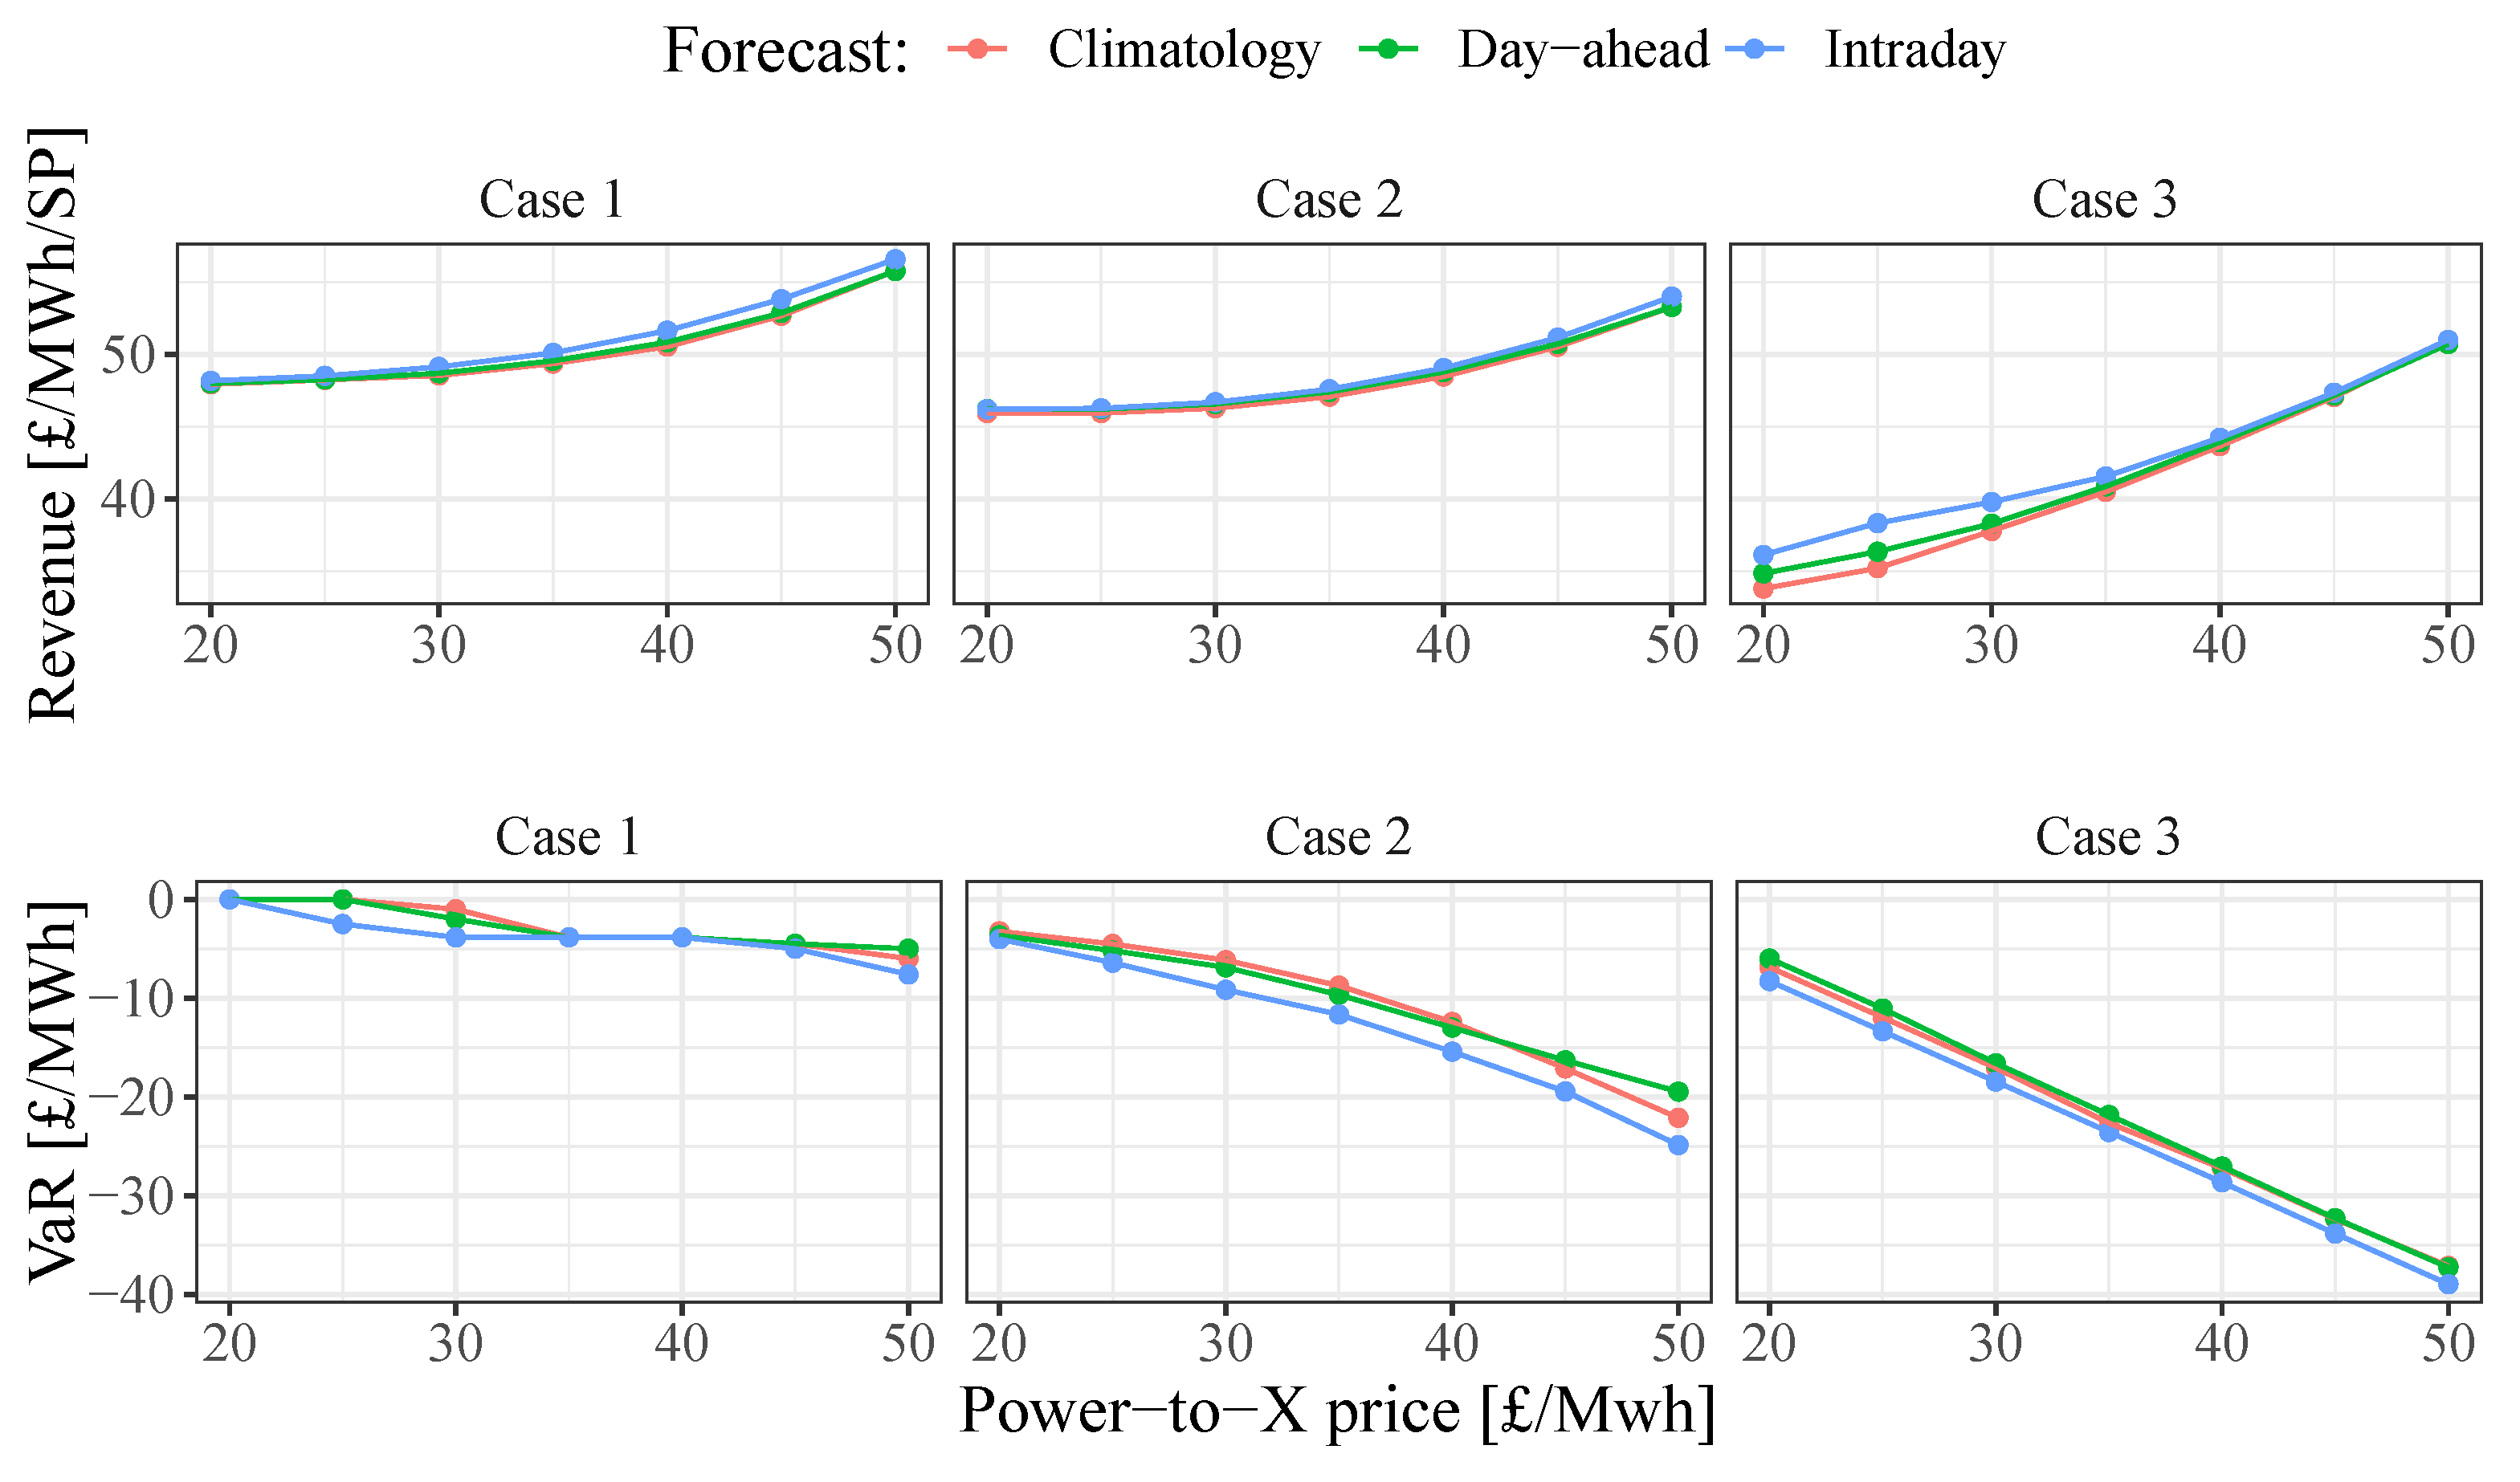
The out-of-sample performance of these strategies has been evaluated in terms of revenue and risk (1% VaR) and are compared for the three cases and three imbalance price forecasts in Figure 3 using the same dataset as in Section 2.3. Across all cases, better qualify forecasts result in higher revenue and lower risk, and probabilistic information improves risk management, particularly in the risk-constrained case. In the first risk-neutral case, Case 1, which utilises deterministic forecasts, switching from the day-ahead to the more accurate intraday forecast increases revenue by up to 2%. Similar revenues are achieved with reduced risk exposure in Case 2 by utilising probabilistic forecasts and a simple hedging strategy. Finally, when trading is constrained by a risk threshold, switching from the day-ahead to intraday probabilistic forecasts improves revenue by up to 5% while maintaining desired risk exposure.
4. Discussion and Conclusions
Previous studies have implied or commented directly that imbalance price forecasting is impractical [3], however more recent works [7,11] and our own analysis have hopefully dispelled this myth: imbalance prices and volumes can be forecast skilfully and lend value to market participants, particularly intraday and through probabilistic forecasting. Here, we have reported the performance of simple day-ahead and advanced intraday imbalance price forecasts, and have shown that these add value to risk-neutral and risk-constrained trading strategies, increasing revenue by up to 2% and 5%, respectively.
Furthermore, the growing complexity of electricity markets, and rise of automatic trading and control of distributed and multi-vector resources, have increased the need for technical solutions to a task previously performed manually by traders [13]. Many organisations are forecasting the imbalance prices and volumes and would likely benefit from academic contributions adapting state-of-the-art statistical and machine learning methods for this task. Similarly, researchers publishing on trading strategies should be using state-of-the-art imbalance forecasts in their analysis to be representative of best practice.
Regional variations in market design and data availability impact imbalance forecasting and have not been explored here. Price formation and the availability of data in real-time can vary significantly between regions and therefore demand specific treatment. Regulation may also explicitly forbid speculation based on imbalance prices, as in Germany, and instil a reluctance to engage in sophisticated analytics in this space. As a result, it is possible that different approaches will favour different markets depending on the speed, volume, complexity, and quality of data available to forecasters, but there are also likely to be commonalities and knowledge worth sharing.
In summary, the volume and availability of data relevant to imbalance forecasting is growing and presents an opportunity for innovative forecasters to discover new sources of predictability, gain a competitive edge, and ultimately improve the efficiency of electricity markets. We hope that this topic will attract the attention and efforts of more researchers, and that future research will leverage the full range of diverse data that are available to inform imbalance price and volume forecasts.
Author Contributions
Conceptualization, J.B.; methodology, J.B. and C.G.; software, C.G.; validation, C.G.; formal analysis, J.B. and C.G.; investigation, J.B. and C.G.; resources, J.B.; data curation, C.G.; writing—original draft preparation, J.B.; writing—review and editing, J.B. and C.G.; visualization, J.B. and C.G.; supervision, J.B.; project administration, J.B.; funding acquisition, J.B. All authors have read and agreed to the published version of the manuscript.
Funding
This work was funded by the EPSRC Supergen Energy Networks Hub (EP/S00078X/1), the EPSRC Innovation Fellowship held by JB (EP/R023484/1 and EP/R023484/2), the Energy Technology Partnership, and Scottish Power, SSE, and University of Strathclyde through the latter’s Technology and Innovation Centre Low Carbon Power and Energy program.
Institutional Review Board Statement
Not applicable.
Informed Consent Statement
Not applicable.
Data Availability Statement
Underlying data are available as follows: Great Britain Balancing Mechanism data are freely available from https://www.bmreports.com/ subject to terms and conditions, accessed 1 September 2021. Day-ahead and intraday market data may be purchased from EEX Group https://webshop.eex-group.com/ subject to terms and conditions, accessed 1 September 2021.
Acknowledgments
In addition to our funders, we would like to thank Thomas Alexander, who developed the software for intraday imbalance price forecasting, and Global Energy Advisory for many informative discussions on energy trading and Great Britain’s Balancing Mechanism.
Conflicts of Interest
The authors declare no conflict of interest.
References
- Nowotarski, J.; Weron, R. Recent advances in electricity price forecasting: A review of probabilistic forecasting. Renew. Sustain. Energy Rev. 2018, 81, 1548–1568. [Google Scholar] [CrossRef]
- Lago, J.; Marcjasz, G.; De Schutter, B.; Weron, R. Forecasting day-ahead electricity prices: A review of state-of-the-art algorithms, best practices and an open-access benchmark. Appl. Energy 2021, 293, 116983. [Google Scholar] [CrossRef]
- Pinson, P.; Chevallier, C.; Kariniotakis, G. Trading wind generation from short-term probabilistic forecasts of wind power. IEEE Trans. Power Syst. 2007, 22, 1148–1156. [Google Scholar] [CrossRef] [Green Version]
- Dent, C.J.; Bialek, J.W.; Hobbs, B.F. Opportunity Cost Bidding by Wind Generators in Forward Markets: Analytical Results. IEEE Trans. Power Syst. 2011, 26, 1600–1608. [Google Scholar] [CrossRef]
- Browell, J. Risk Constrained Trading Strategies for Stochastic Generation with a Single-Price Balancing Market. Energies 2018, 11, 1345. [Google Scholar] [CrossRef] [Green Version]
- Narajewski, M.; Ziel, F. Optimal bidding on hourly and quarter-hourly day-ahead electricity price auctions: Trading large volumes of power with market impact and transaction costs. arXiv 2021, arXiv:2104.14204. [Google Scholar]
- Bottieau, J.; Hubert, L.; Greve, Z.D.; Vallee, F.; Toubeau, J.F. Very-Short-Term Probabilistic Forecasting for a Risk-Aware Participation in the Single Price Imbalance Settlement. IEEE Trans. Power Syst. 2020, 35, 1218–1230. [Google Scholar] [CrossRef]
- Garcia, M.P.; Kirschen, D.S. Forecasting System Imbalance Volumes in Competitive Electricity Markets. IEEE Trans. Power Syst. 2006, 21, 240–248. [Google Scholar] [CrossRef]
- Salem, T.S.; Kathuria, K.; Ramampiaro, H.; Langseth, H. Forecasting Intra-Hour Imbalances in Electric Power Systems. In Proceedings of the Thirty-First AAAI Conference on Innovative Applications of Artificial Intelligence (IAAI-19), Honolulu, HI, USA, 27 January–1 February 2019. [Google Scholar]
- Toubeau, J.F.; Bottieau, J.; Wang, Y.; Vallee, F. Interpretable Probabilistic Forecasting of Imbalances in Renewable-Dominated Electricity Systems. IEEE Trans. Sustain. Energy 2022, 13, 1267–1277. [Google Scholar] [CrossRef]
- Dumas, J.; Boukas, I.; de Villena, M.M.; Mathieu, S.; Cornelusse, B. Probabilistic Forecasting of Imbalance Prices in the Belgian Context. In Proceedings of the 2019 16th International Conference on the European Energy Market (EEM), Ljubljana, Slovenia, 18–20 September 2019. [Google Scholar]
- Morales, J.M.; Conejo, A.J.; Madsen, H.; Pinson, P.; Zugno, M. Integrating Renewable in Electricity Markets; Springer: Berlin/Heidelberg, Germany, 2014. [Google Scholar]
- Théate, T.; Ernst, D. An application of deep reinforcement learning to algorithmic trading. Expert Syst. Appl. 2021, 173, 114632. [Google Scholar] [CrossRef]
Figure 1.
Example intraday probabilistic forecast of the imbalance price as a fan plot with 5%, 25%, 50%, 75%, and 95% quantiles and actual (out-turn) price issued on 11 November 2020 at 15:00.
Figure 1.
Example intraday probabilistic forecast of the imbalance price as a fan plot with 5%, 25%, 50%, 75%, and 95% quantiles and actual (out-turn) price issued on 11 November 2020 at 15:00.

Figure 2.
Point forecast performance in terms of Mean Absolute Error (MAE) by lead-time (solid lines). Day-ahead forecasts (dashed lines) are issued once per day over 12 h in advance and do not change intraday—hence there is no change in MAE by lead-time.
Figure 2.
Point forecast performance in terms of Mean Absolute Error (MAE) by lead-time (solid lines). Day-ahead forecasts (dashed lines) are issued once per day over 12 h in advance and do not change intraday—hence there is no change in MAE by lead-time.

Figure 3.
Results for Cases 1–3 with Climatological, Day-ahead, and Intraday imbalance price forecasts. Forecast skill translates into increased revenue and reduced risk, particularly by the risk-constrained strategy, which successfully controls risk at the 1% VaR .
Figure 3.
Results for Cases 1–3 with Climatological, Day-ahead, and Intraday imbalance price forecasts. Forecast skill translates into increased revenue and reduced risk, particularly by the risk-constrained strategy, which successfully controls risk at the 1% VaR .

Publisher’s Note: MDPI stays neutral with regard to jurisdictional claims in published maps and institutional affiliations. |
© 2022 by the authors. Licensee MDPI, Basel, Switzerland. This article is an open access article distributed under the terms and conditions of the Creative Commons Attribution (CC BY) license (https://creativecommons.org/licenses/by/4.0/).
Share and Cite
MDPI and ACS Style
Browell, J.; Gilbert, C. Predicting Electricity Imbalance Prices and Volumes: Capabilities and Opportunities. Energies 2022, 15, 3645. https://0-doi-org.brum.beds.ac.uk/10.3390/en15103645
AMA Style
Browell J, Gilbert C. Predicting Electricity Imbalance Prices and Volumes: Capabilities and Opportunities. Energies. 2022; 15(10):3645. https://0-doi-org.brum.beds.ac.uk/10.3390/en15103645
Chicago/Turabian StyleBrowell, Jethro, and Ciaran Gilbert. 2022. "Predicting Electricity Imbalance Prices and Volumes: Capabilities and Opportunities" Energies 15, no. 10: 3645. https://0-doi-org.brum.beds.ac.uk/10.3390/en15103645
Note that from the first issue of 2016, this journal uses article numbers instead of page numbers. See further details here.