
Nitrogen Atom-Doped Layered Graphene for High-Performance CO2/N2 Adsorption and Separation
by
 and
and
Weifeng Lyu
1, 
Linghui Sun
1,
Lu Wang
1,
Zemin Ji
1,
Sainan Zhou
2,
Yong Chen
3,* and
Xiaoqing Lu
2,* 1
State Key Laboratory of Enhanced Oil Recovery, Research Institute of Petroleum Exploration & Development, CNPC, Beijing 100083, China
2
School of Materials Science and Engineering, China University of Petroleum, Qingdao 266580, China
3
School of Geosciences, China University of Petroleum, Qingdao 266580, China
*
Authors to whom correspondence should be addressed.
Energies 2022, 15(10), 3713; https://0-doi-org.brum.beds.ac.uk/10.3390/en15103713
Submission received: 16 April 2022
/
Revised: 3 May 2022
/
Accepted: 6 May 2022
/
Published: 18 May 2022
(This article belongs to the Special Issue Key Technologies for Natural Gas Hydrate Development and Carbon Capture and Storage)
Abstract
:The development of high-performance CO2 capture and separation adsorbents is critical to alleviate the deteriorating environmental issues. Herein, N atom-doped layered graphene (N-MGN) was introduced to form triazine and pyridine as potential CO2 capture and separation adsorbents via regulation of interlayer spacings. Structural analyses showed that accessible surface area of the N-MGN is 2521.72 m2 g−1, the porosity increased from 9.43% to 84.86%. At ultra-low pressure, N-MGN_6.8 have exhibited a high CO2 adsorption capacity of 10.59 mmol/g at 298 K and 0.4 bar. At high pressure, the absolute adsorption capacities of CO2 in N-MGN_17.0 (40.16 mmol g−1) at 7.0 MPa and 298 K are much larger than that of N-doping slit pore. At 298 K and 1.0 bar, the highest selectivity of CO2 over N2 reached up to ~133 in N-MGN_6.8. The research shows that N doping can effectively improve the adsorption and separation capacity of CO2 and N2 in layered graphene, and the interlayer spacing has an important influence on the adsorption capacity of CO2/N2. The adsorption heat and relative concentration curves further confirmed that the layered graphene with an interlayer spacing of 6.8 Å has the best adsorption and separation ability of CO2 and N2 under low pressure. Under high pressure, the layered graphene with the interlayer spacing of 17.0 Å has the best adsorption and separation ability of CO2 and N2.
1. Introduction
With the rapid developing of economic and world population [1], global CO2 emissions from flue gases [2] have exceed 32 Gt of CO2 per year. The greenhouse effect, triggered by the fast accumulation of carbon dioxide (CO2) [3] has caused a lot of harm to society, environment and healthy of human-beings [4]. Carbon capture and storage (CCS) technology is an effective method to decrease the concentration of CO2 and alleviate the greenhouse effect [5]. For CCS, the efficiency of capture and separation of CO2 is mainly determined by the performance of adsorbent [6]. Aqueous amine solutions [7] are widely used as practical materials for CCS. However, they suffer from high parasitic energy consumption, adverse environmental impact, solvent losses and corrosion issues [8]. Comparing to amine solutions, solid adsorbents have high working capacity and lower regeneration energy when applied to gas capture. Therefore, they have become promising candidates as a CO2 adsorbent for CCS [9]. Hitherto, various materials have been developed as the solid adsorbent, such as carbonaceous porous materials, porous organic materials, covalent organic frameworks, metal organic frameworks, and molecular sieves. Among them, graphene with split pore, as a typical carbonaceous material, has been considered as an ideal candidate because of its low density, high chemical stability, excellent processability, and eco-friendly behavior [10].
Many factors can affect graphene structures, such as electromagnetic radiation [11], external electric field [12], laser-induction [13], and chemical doping [14], and so on. To further improve the adsorption behavior of CO2, nitrogen (N) doping was widely investigated experimentally and theoretically due to its ability to change the packing pattern of the adsorbate, as well as to enhance the interaction between gas and frameworks [15]. To et al. [16] synthesized N-doped hierarchical porous graphitic carbons with large surface area and pore size, which showed good working capacity and separation performance. This performance is ten times larger than most previously reported mesoporous carbon adsorption materials. Psarras and coworkers [17] evaluated the uptake of CO2 and N2 in N-doped carbon with slit pore, and discovered that N atoms doping have a positive effect on CO2 loading and selectivity of CO2 over N2. Apart from N doping, the slit pore frameworks also play a decisive character on CO2 capture and separation performance. Kumar et al. [18] adopted molecular simulations to investigate the carbon capture behavior in N doped graphitic carbons and uncovered that the structure with slit pores is superior to disordered ones on CO2 adsorption. In spite of these findings, the influence of pore sizes and N doping on the CO2 capture behavior in graphite slit pore remains unelucidated.
In this work, we shed lights on how the layer distance and N doping affect CO2 capture and CO2/N2 separation selectivity in multilayer graphene sheets (N-MGNs) at room temperature. First, by density functional theory (DFT) simulations, unit cell structure optimization and atomic partial charge were calculated by which was the prior preparation for CO2 capture and separation. Then, the physical structure of the N-MGNs were explored. Afterwards, the single-component adsorption of CO2 or N2 is calculated under different pressures. Next, essential mechanism of N-doping was explored by the radial distribution functions, isosteric heats, and gas distribution. In the end, the separation performance of CO2 from mixture gases (CO2:N2 = 1:1) was calculated to investigate the influence of different compositions. Our results highlighted the positive effect of N doping on graphene sheets, and provide the high-performance adsorbent for CCS technology.
2. Model and Computing Methodology
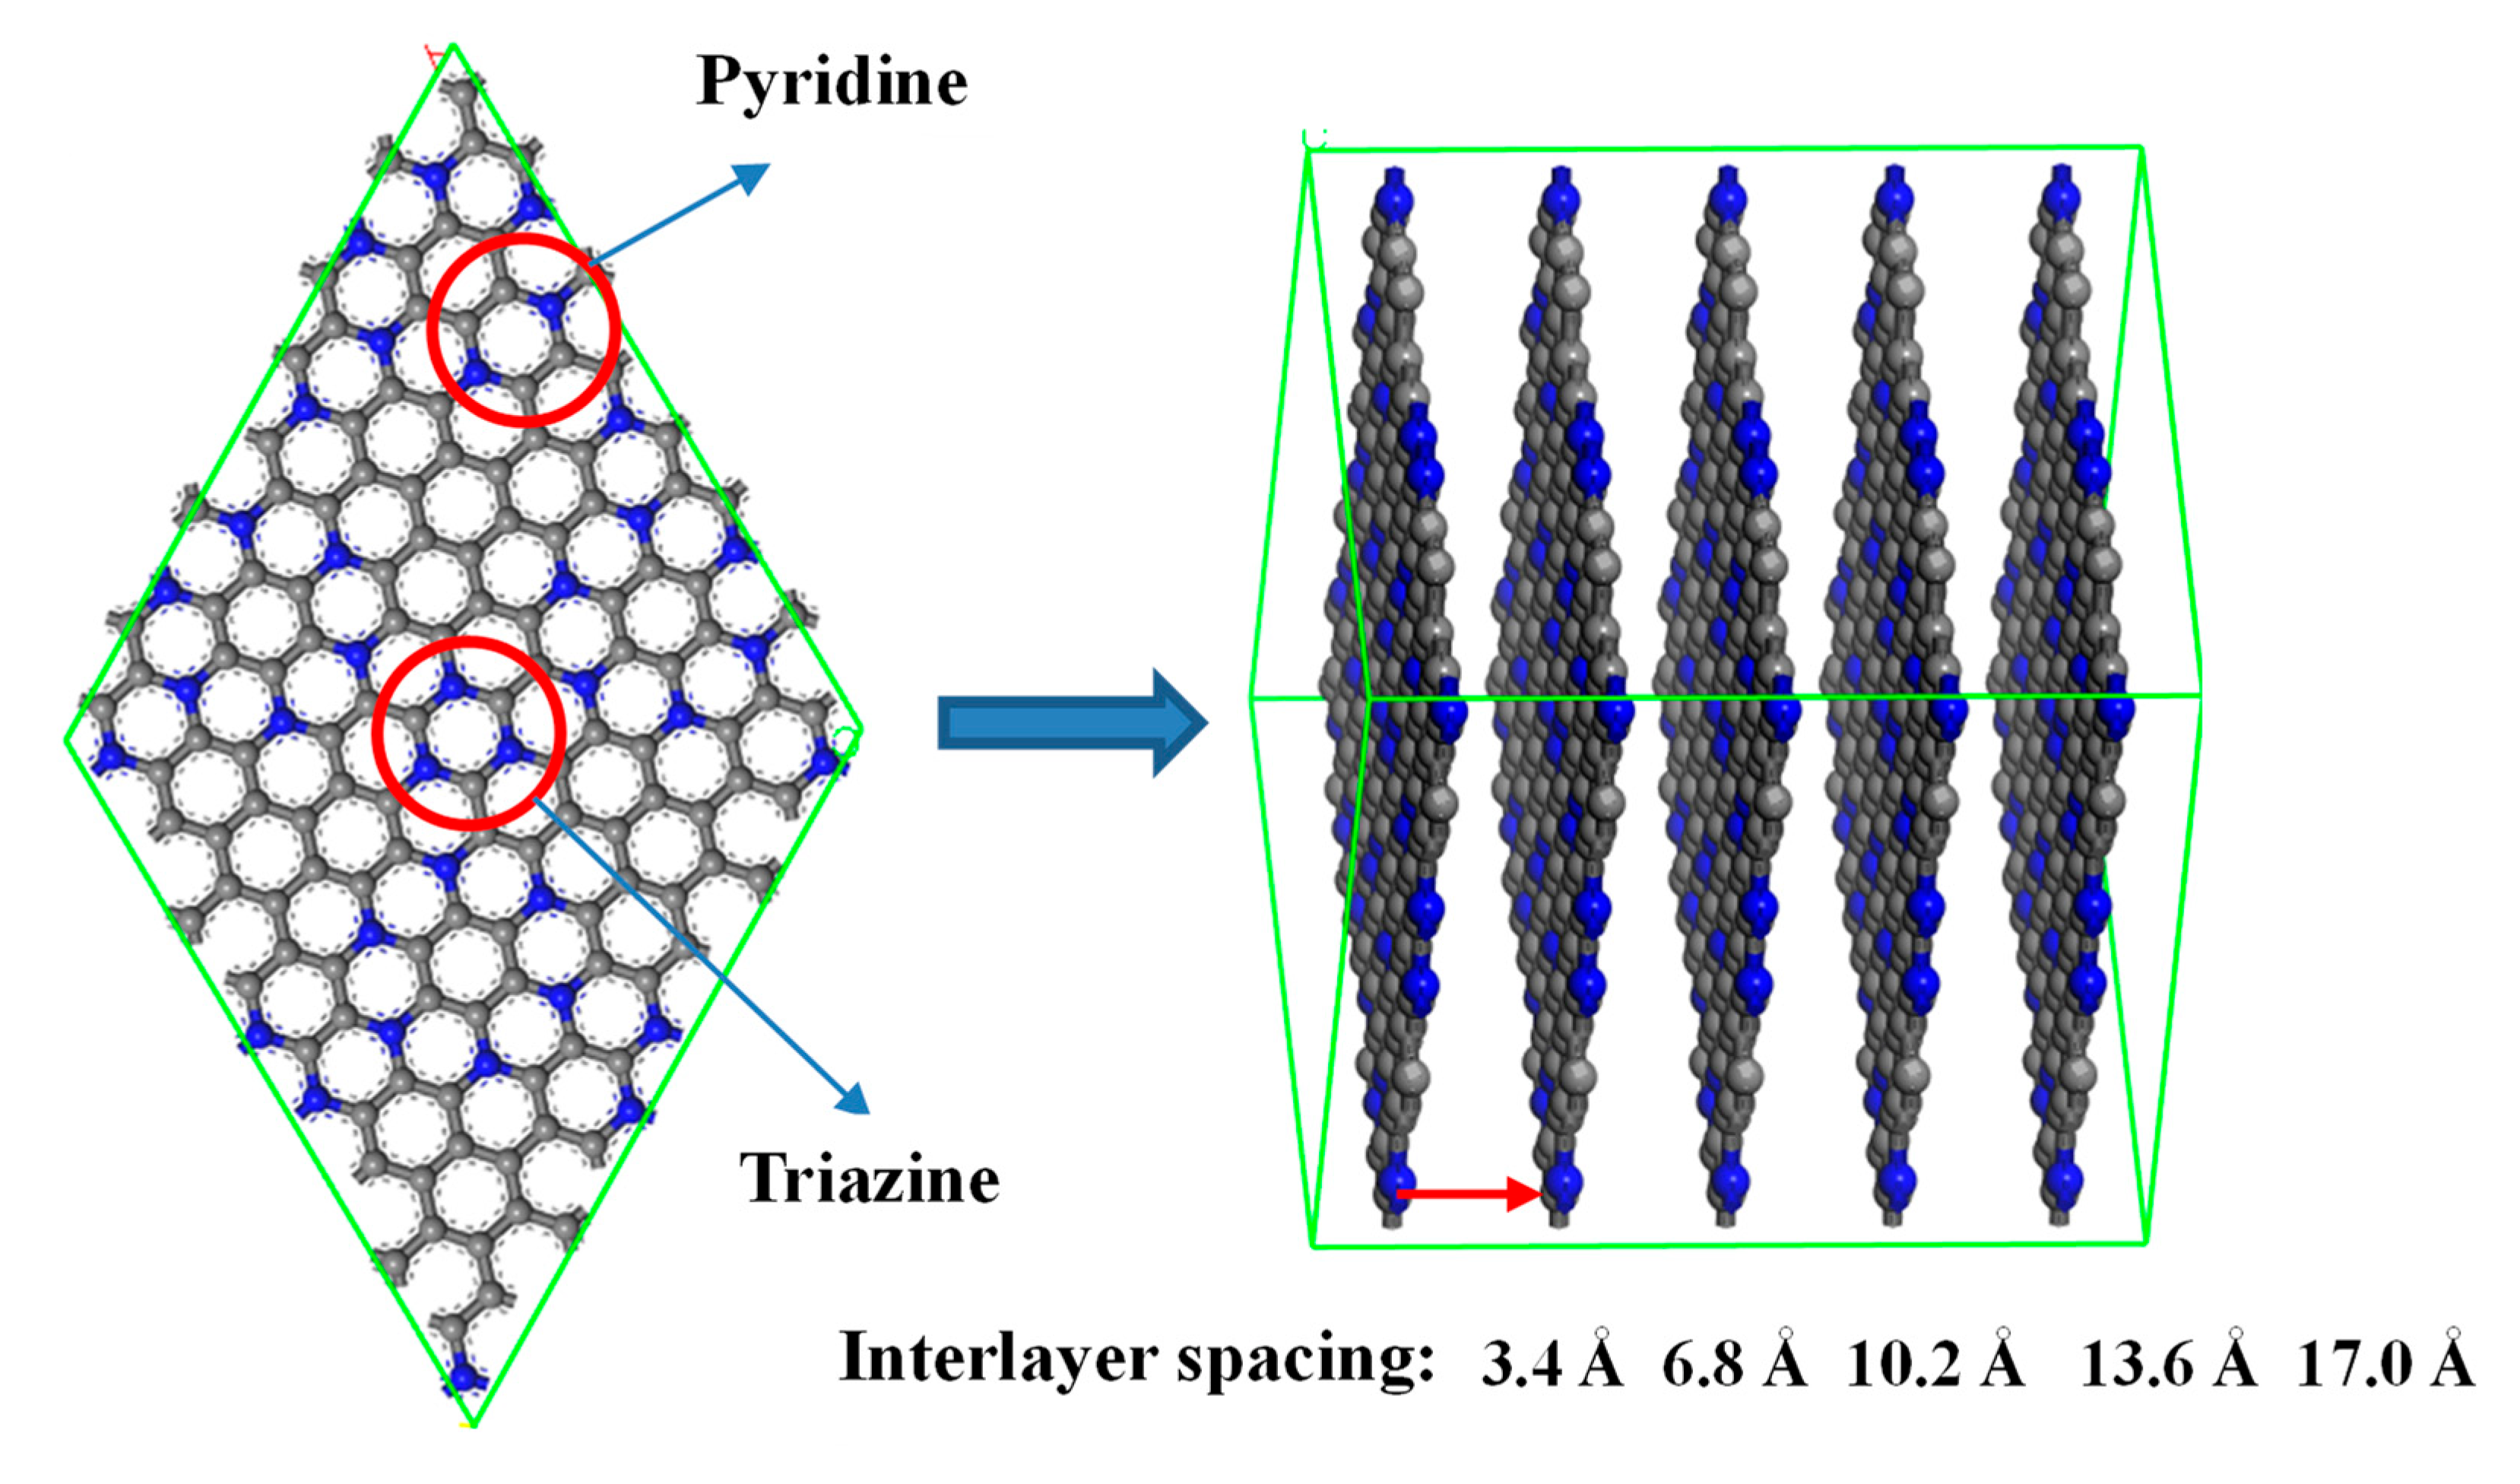
The supercells of different N-doped multilayer graphene nanostructures (N-MGNs) were used in this work. As depicted in Figure 1, N-doped graphene was built with two different N atoms in the form of triazine and pyrazine as doping sites. This structure can be synthesized via a well-developed ionothermal technique. The doping model and synthetic method was chosen referring to the latest work of Zhu et al. [19]. After building the N-doped graphene, we adopted DFT simulations to optimize the single-layer N-MGN structure and calculated the atomic partial charge of N-MGNs. B3LYP/6-31+g(d,p) basis set in Gaussian 09 [20] package was applied, this choice is a combination of efficiency and accuracy of the calculations. The atomic partial charges of N-graphenes were the critical parameters in coulomb law to describe the electrostatic interaction between gas and frameworks. The layer distance (H), described as the length of the center of the upper and lower N-graphene plane was introduced to describe the morphology of the N-MGNs. Finally, five-layered N-MGNs, with the H varying from 3.4 to 17.0 nm in 3.4 Å increments, were designed to study the CO2 adsorption capacity and separation properties. These structures were named as N-MGN_3.4, N-MGN_6.8, MGN_10.2, MGN_13.6 and MGN_17.0 according to H. For the N-MGNs frameworks, the universal force field (UFF) parameters were used to describe the non-coulomb interaction [21], which was successfully applied to carbon materials, zeolites and other similar systems. For CO2 and N2 molecules, three rigid linear models were used. The parameters of the molecules were adopted by TraPPE model [22]. Information of force field parameters and atomic partial charge of N-MGNs frameworks were listed in Table 1.
GCMC calculations were utilized to calculate the adsorptions together with the selectivity of CO2 over N2 [23]. This method is derived from the physical interaction between gases and frameworks. In GCMC simulations, a series of configurations would be generated randomly, including rotation, movement, and deletion [24]. In case of every state point, 1 × 10⁷ steps were completed during GCMC calculation. An object–oriented multipurpose simulation code (MuSiC) was employed to complete CO2 capture and separation [25].
3. Results and Discussions
3.1. Pore Topology and Morphology
Physical structure characteristics of pore are the major factors to influence capture and separation capacity of the adsorbent. To explore the physical properties of five N-MGNs, porosity (Φ) is calculated by VP/VTotal, where VP refers to pore size and VTotal is total volume of the N-MGNs. The parameters of the gas-accessible frameworks in Table 2 were obtained by Sarkisov [26] and Duren [27] methods. In case of slit pore, the limiting diameter and maximum diameter are nearly the same for each N-MGN, and the values are close to the corresponding layer distance. Accessible surface area of the five N-MGNs are exactly the same (2521.72 m2 g−1), because only the upper and lower surface of the five N-graphene sheets are exposed for all five N-MGNs. The accessible surface area is larger than many porous structures, such as zeolitic imidazolate frameworks (620–1730 m2 g−1) [28], some MOFs (282–515 m2 g−1) [29], some coordination polymers (503–609 m2 g−1) [30], and nanoporous organic frameworks (~1535 m2 g−1) [31], [32], which could lead to superior adsorption capacity and selectivity. Different from the surface area, the porosity differs from each other for all N-MGNs. With the increase of layer distance, the porosity increased from 9.43% to 84.86%. N-MGN_3.4 has ultra-small porosity of 9.43%, which lead to no adsorption capacity. N-MGN_6.8 have moderate porosity of 54.72% which could result in better performance at low pressure. And the rest N-MGNs have higher porosity than 70%, which could achieve excellent performance at high pressure. Therefore, the five N-MGNs have great potentials to achieve excel CO2 adsorption capacity.
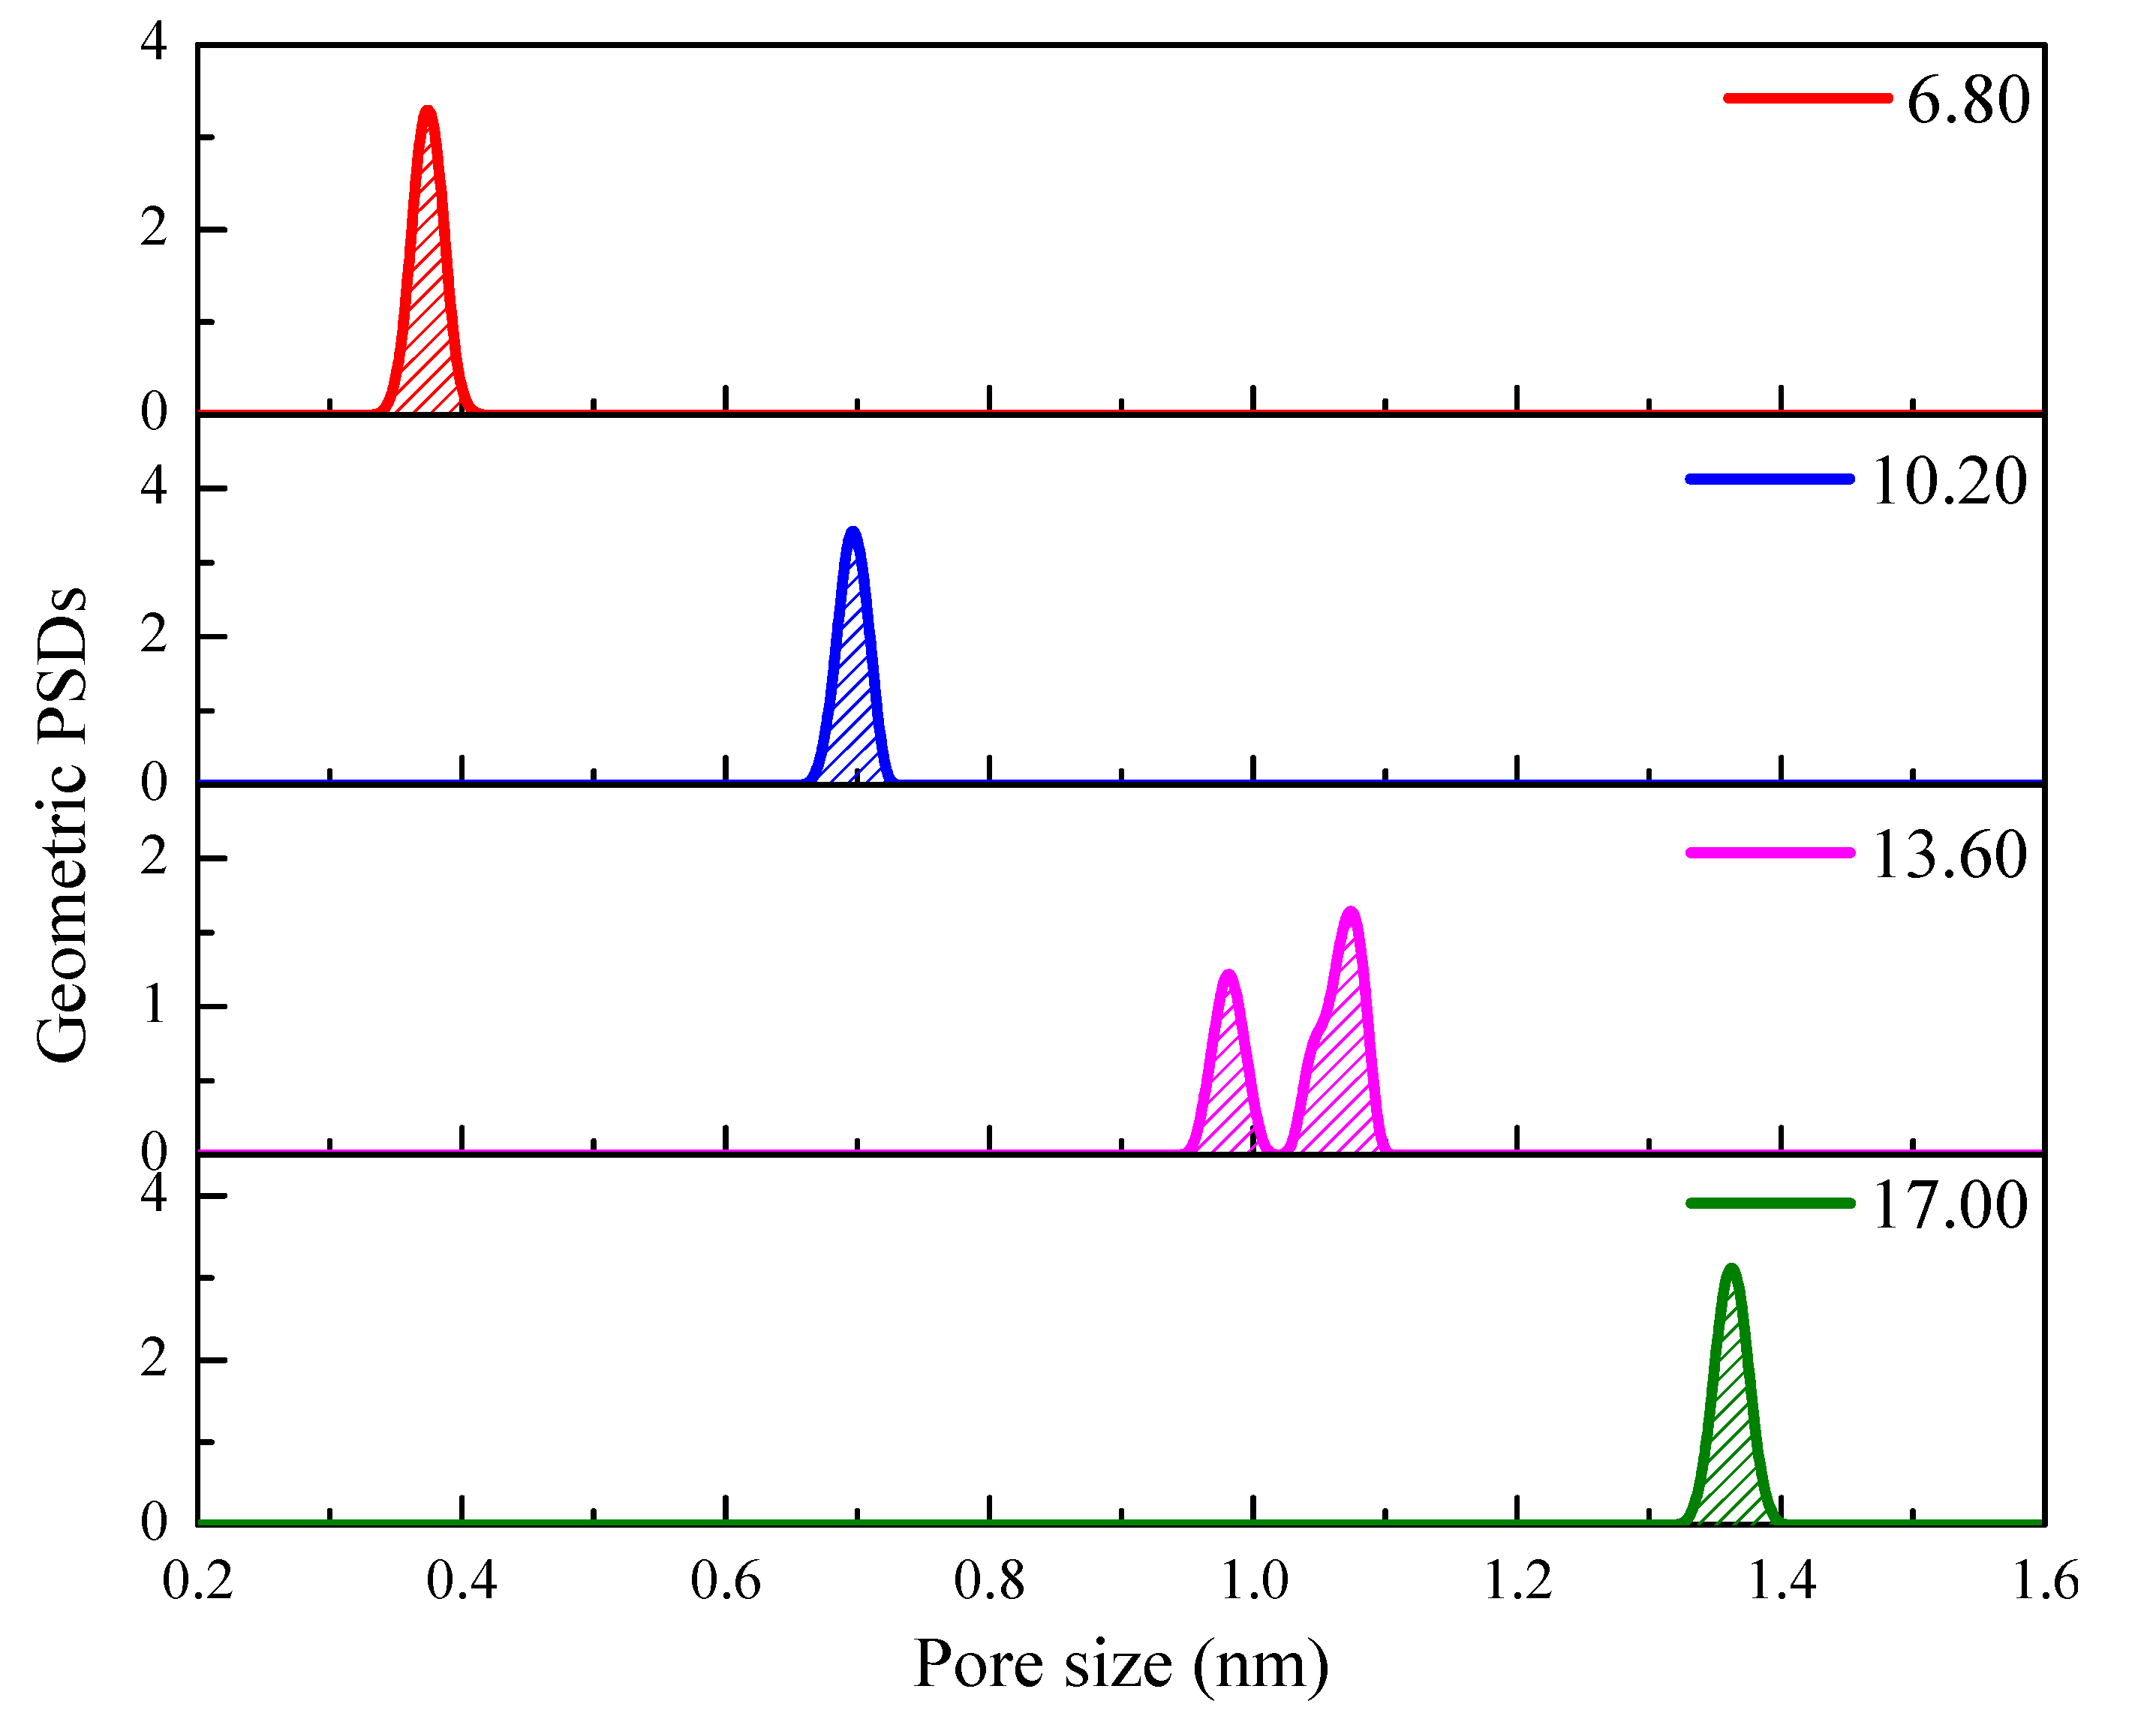
The geometric pore size distributions (PSDs) was shown in Figure 2 to investigate the pore morphology on step ahead. These data were obtained by Poreblazer v3.0 [33]. Helium was chose as the gas probe molecule. The results indicated that the PSDs peaks for the materials are narrow and independent due to the uniformly distributed pore sizes of slit pore. We found that the sum of the value of PSD peak and kinetic diameter of Helium (0.26 nm) is approximately equal to the corresponding layer distance. According to the IUPAC classification, N-NGM_3.6 and N-NGM_6.8 have ultramicropores (<7.00 Å), the other N-NGMs have micropores (7.00~20.00 Å) [34]. In summary, the pore spaces and diameters of N-MGNs were enhanced due to the increase of layer distance, particularly for N-NGMs NGM_3.4 and N-NGM_6.8. This can facilitate the gas adsorption and separation in gas-framework systems.
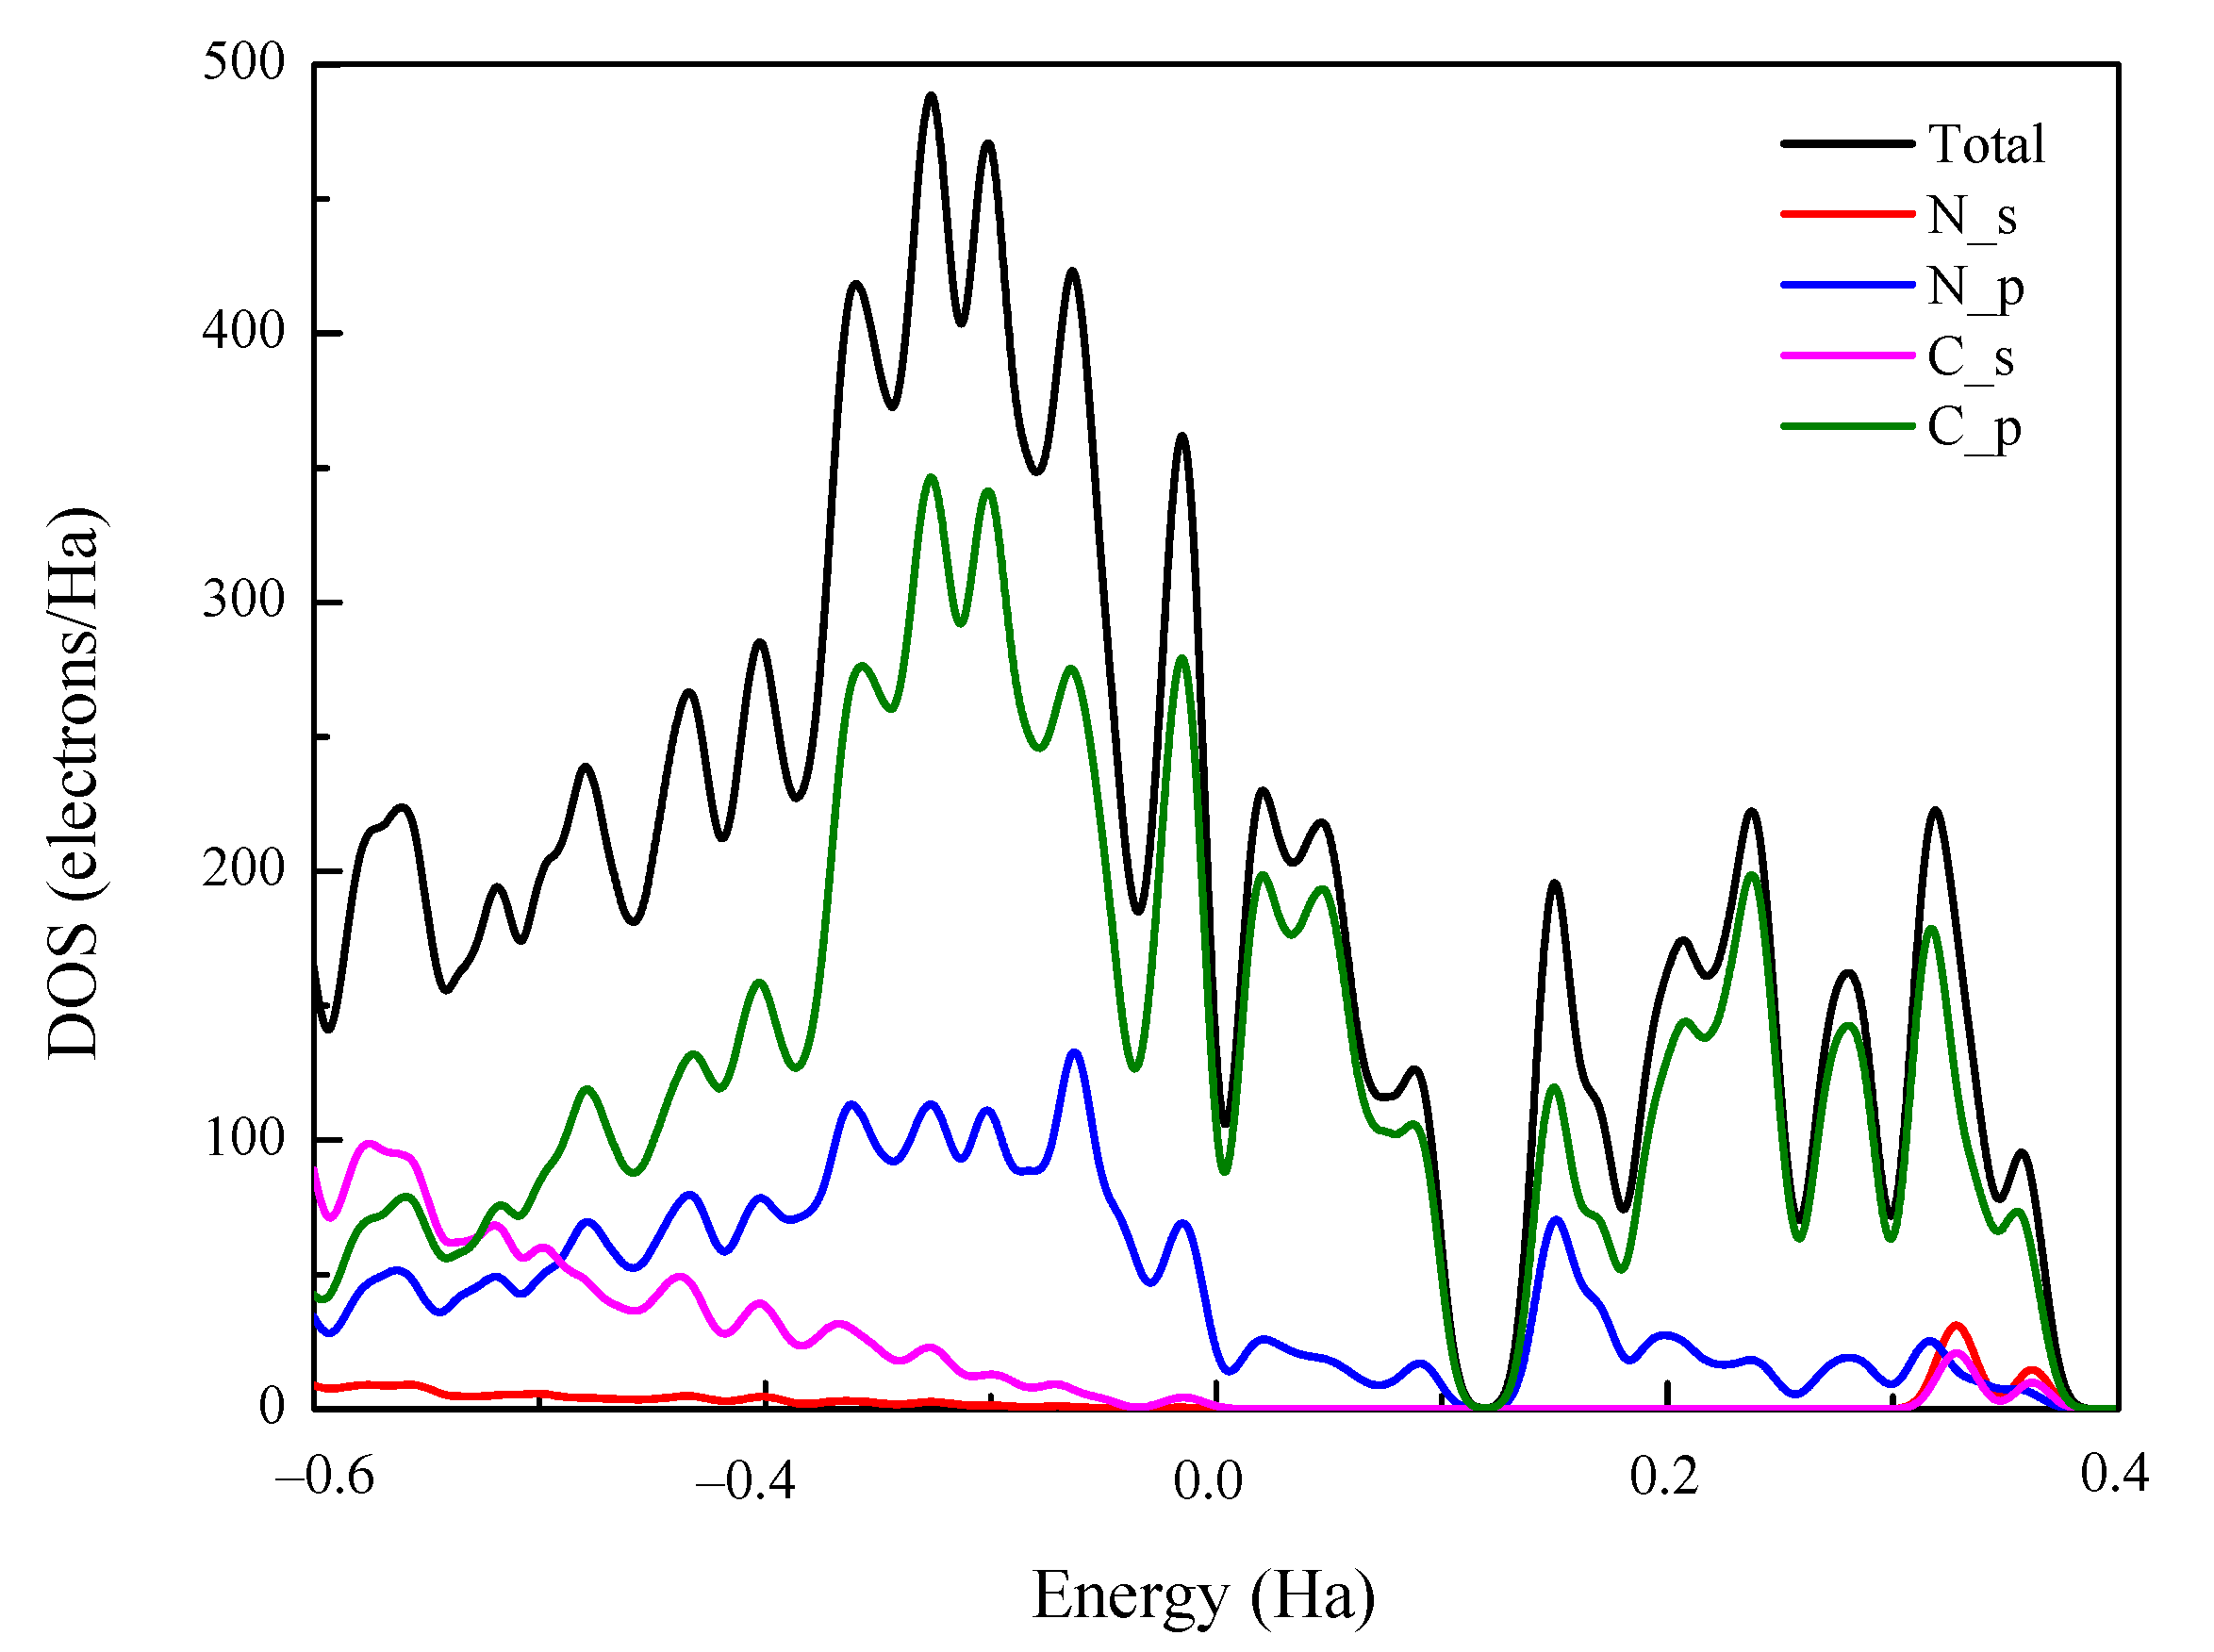
Figure 3 shows the density of state (DOS) for N-NGMs, which analyzes orbital compositions of N-NGM. The result shows that N-NGM presents the typical metallic properties without band gaps. The total DOS of N-NGM consists of the p orbitals of the N and C atoms, and the peaks for these orbitals overlapped evidently, which indicates a strong bonding between the carbon and nitrogen in N-NGM.
3.2. Single Component Adsorption of CO2/N2
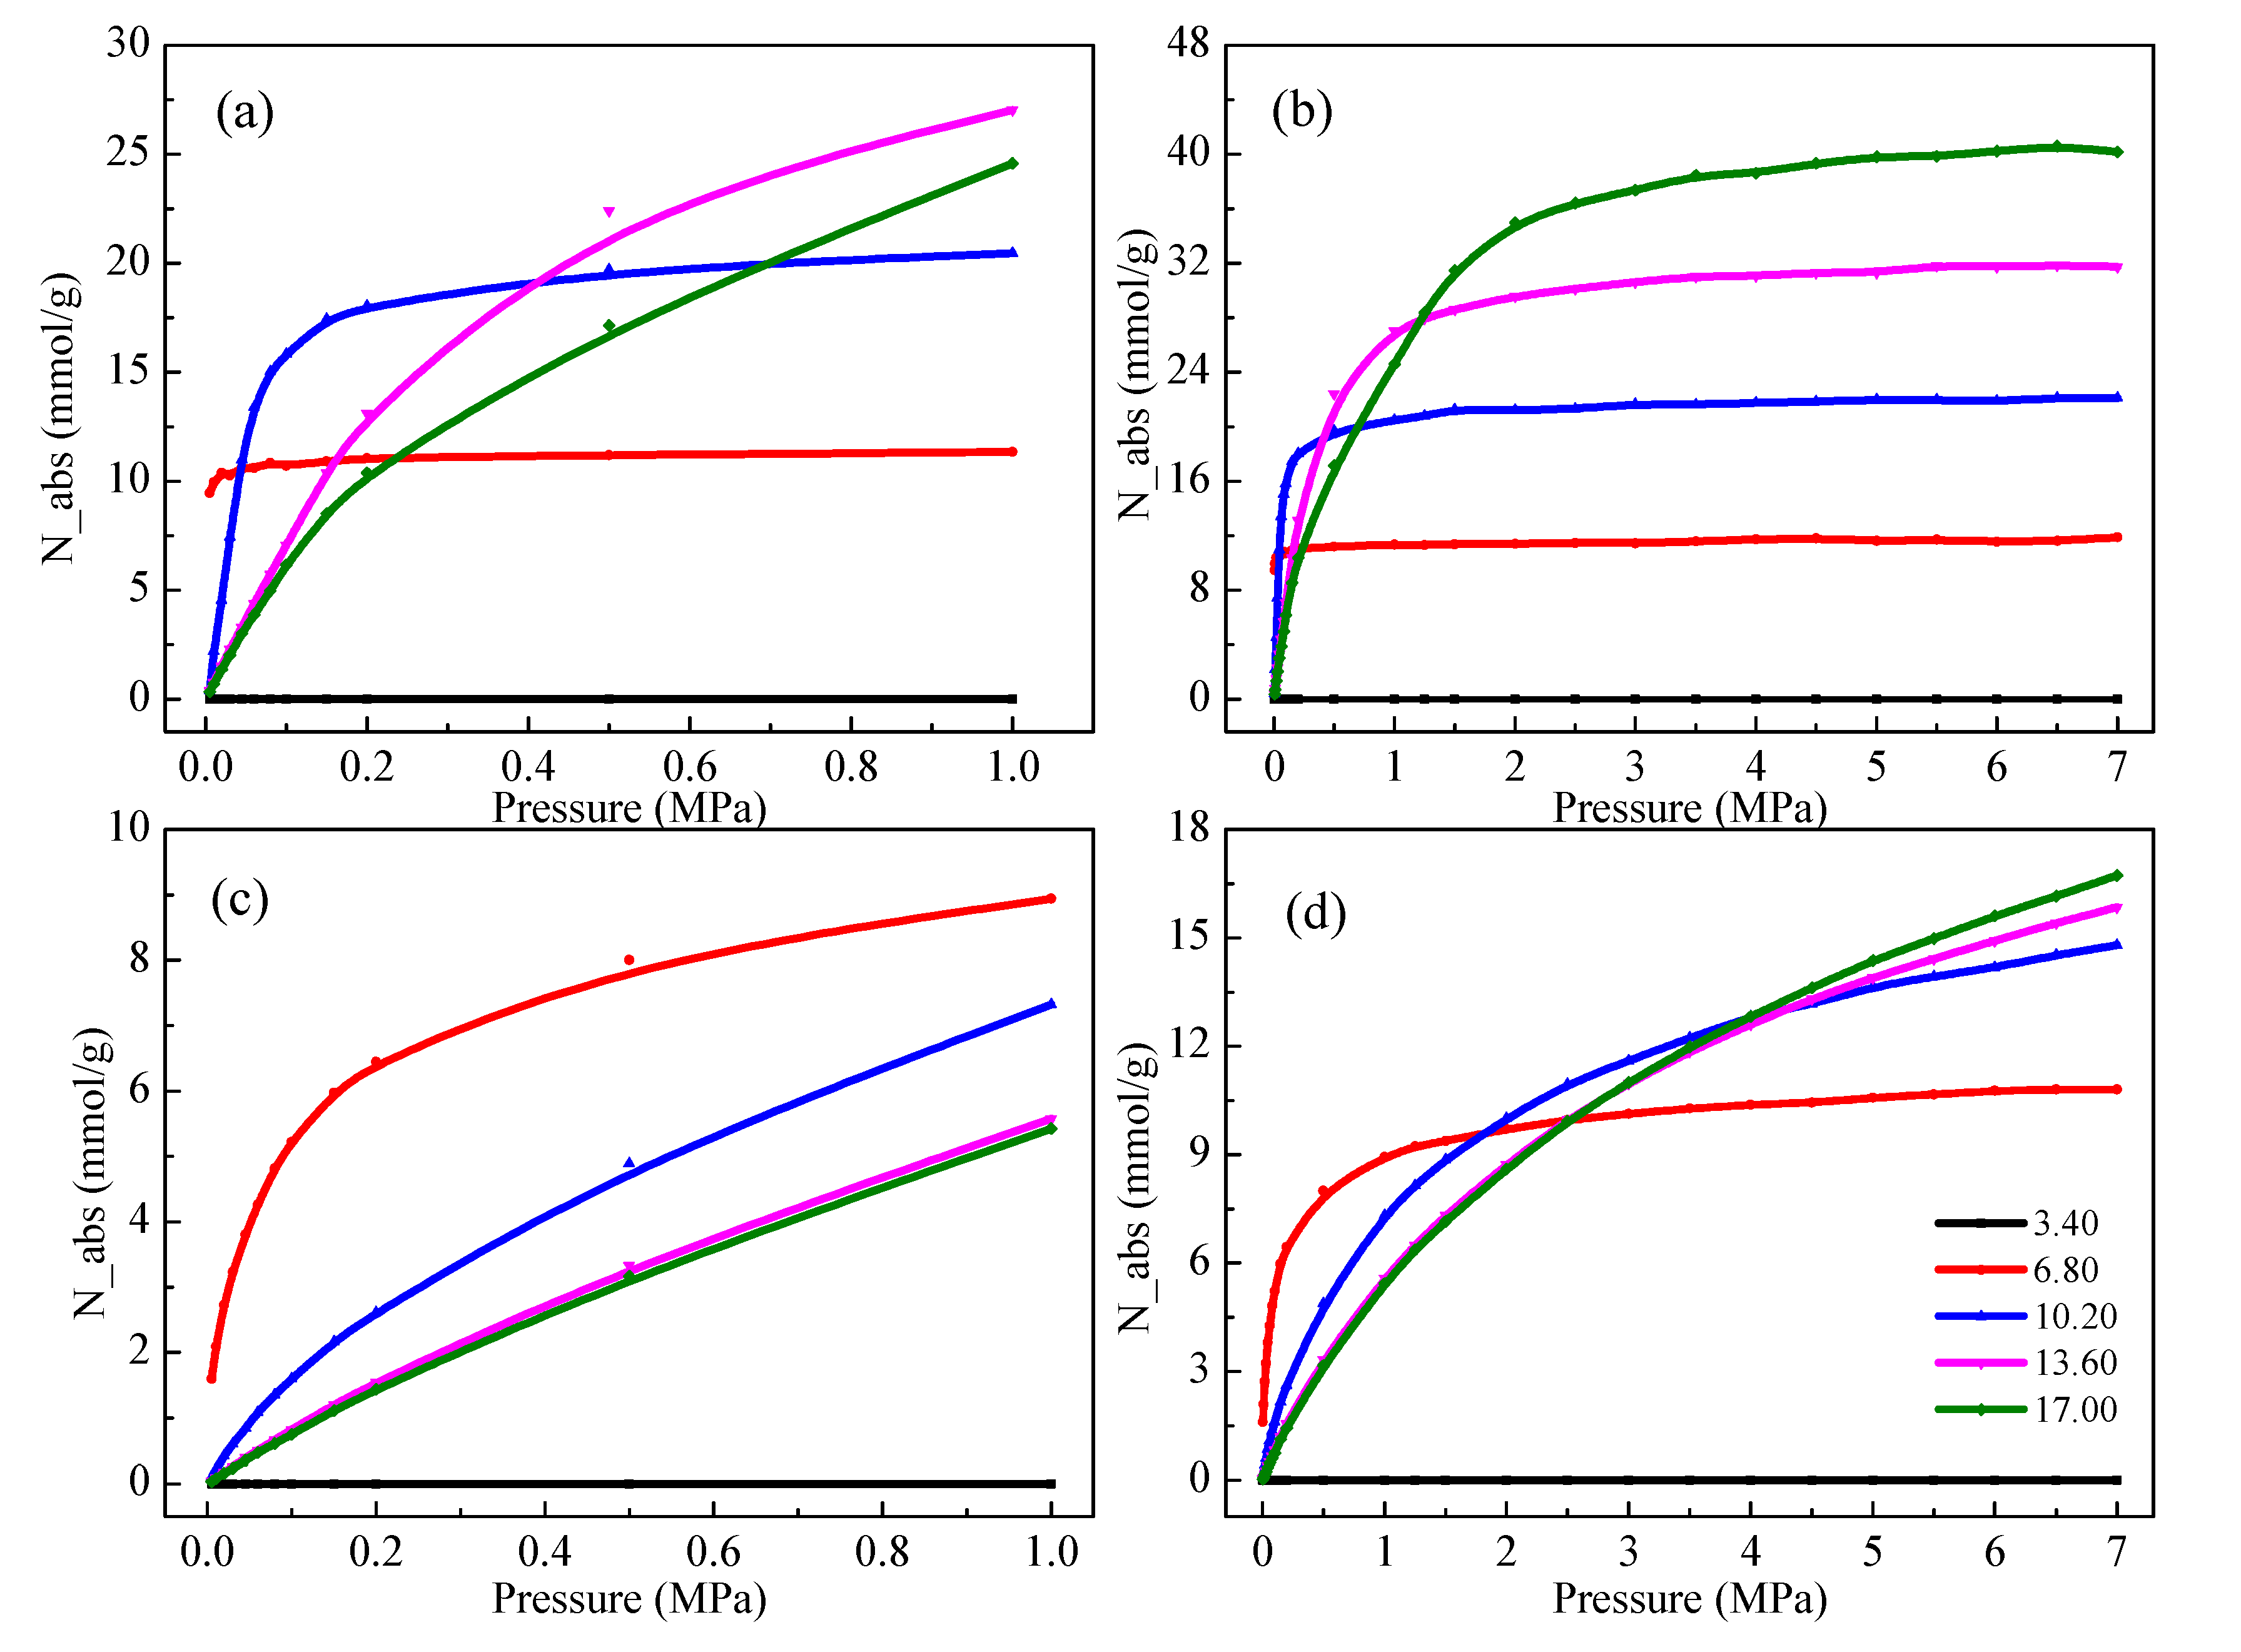
One of the criterion factors to estimate adsorption capacity of the adsorbents is the absolute adsorption of gases, which were calculated by GCMC simulations in this work. Figure 4a,b shows the single component adsorption isotherms of CO2 for N-MGNs in the range of 0–7.0 MPa, at 298 K. For N-MGN_3.4, the absolute adsorption capacity of CO2 is 0, which suggested that no CO2 could be adsorbed, because of the steric effect presented by the narrow interlayer spacing. At ultra-low pressure (p < 0.04 MPa), the adsorption capacity of CO2 in the N-MGNs follows the sequence of 6.8 > 10.2 > 13.6 > 17.0 > 3.4. The phenomenon can be explained that smaller pore sizes could lead to stronger CO2-frameworks interactions. Interestingly, the CO2 uptake of N-MGNs_6.8 can rapidly reach to 10.59 mmol g−1 at 0.04 MPa and 298 K, which is around 91.2% of the saturated capacity. The saturated pressure of N-MGNs_6.8 is smaller than that of SIFSIX-3-Cu [35], and larger than that of nanoporous carbons [36], which reflects a strong interaction between frameworks and gas molecules. At the pressure of 0.04–0.1 MPa, the CO2 adsorption is in an order of 10.2 > 6.8 > 13.6 > 17.0 > 3.4. This phenomenon is mainly because of the different pore sizes that cause the adsorption capacity of N-MGN_10.2 exceeding the saturation adsorption N-MGN_6.8 at low pressure. With continued growth of the pressure, the sequence of adsorption capacity for N-MGNs has changed. Under 0.1 MPa, the single component capacity of CO2 in the N-MGN_6.8 is 10.70 mmol g−1, which is greater than phosphorene slit pores (~1.5–5 mmol g−1) [37], kgm−1–F (1.13 mmol/g) [38], C3N pore (6.27 mmol/g) [39], S-graphite split pore (36.48–51.00 mmol/mol) [40], graphene with different embedded surface functional groups (~1.0–9.0 mmol/g) [41], and carbon slit pores (~5 and 0.8 mmol g−1) [41] at the similar conditions. When the pressure is over 4 MPa, CO2 adsorption of N-MGNs follows the sequence of 17.0 > 13.6 > 10.2 > 6.8 > 3.4 in Figure 4b, which is well match with the order of pore size. The situation clarified the fact that the adsorption capacity correlated with interaction strength at low pressure, while it correlated with free volumes at high pressure [42]. To evaluate the structural advantage, the N-MGNs were compared with N-doping materials with slit pore in Kumar’s work [18]. The result shows that, at 0.1 MPa and 298 K, the absolute adsorption capacities of CO2 in the N-MGNs_6.8 (11.87 mmol g−1) is much larger than that of N-doping slit pore with pore width of 0.8 nm (4.6 mmol g−1). Moreover, at 7.0 MPa, the single component adsorption capacities of CO2 in N-MGN_17.0 (40.16 mmol g−1) is much greater than N-doping slit pore with pore width of 2.0 nm (~16 mmol g−1). This result confirms the adsorption advantage of our frameworks at both low and high pressure.
Figure 4c,d delineate the single component adsorption isotherms of N2 in the N-MGNs with different layer distance at 298 K. Moreover, the N-MGN_3.4 has no adsorption capacity in the pressure range of 0–7.0 MPa, because N2 molecules can’t get into the pore with relatively small pore size which is similar to CO2 adsorption capacity. For other N-MGNs, the single component adsorption of N2 follows the order of 6.8 > 10.2 > 13.6 > 17.0 at low pressure (0–1 MPa). This is because that the smaller pore size leads to the stronger interaction, which plays a critical role at low pressure. However, the adsorption changes upon the increase of pressure and it follow the consequence of 17.0 > 13.6 > 10.2 > 6.8 > 3.4 at 7 MPa. the type-I Langmuir adsorption behavior of CO2/N2 in N-MGNs demonstrate that the pore size of N-MGNs are typical micropores [43]. The result is consistent with the above-mentioned topology and morphology analysis of N-MGNs. Comparing with other materials, the N-MGNs could achieve preferable adsorption capacity of CO2 at declined pressure, indicating the ability of N-MGNs to separate CO2 from N2.
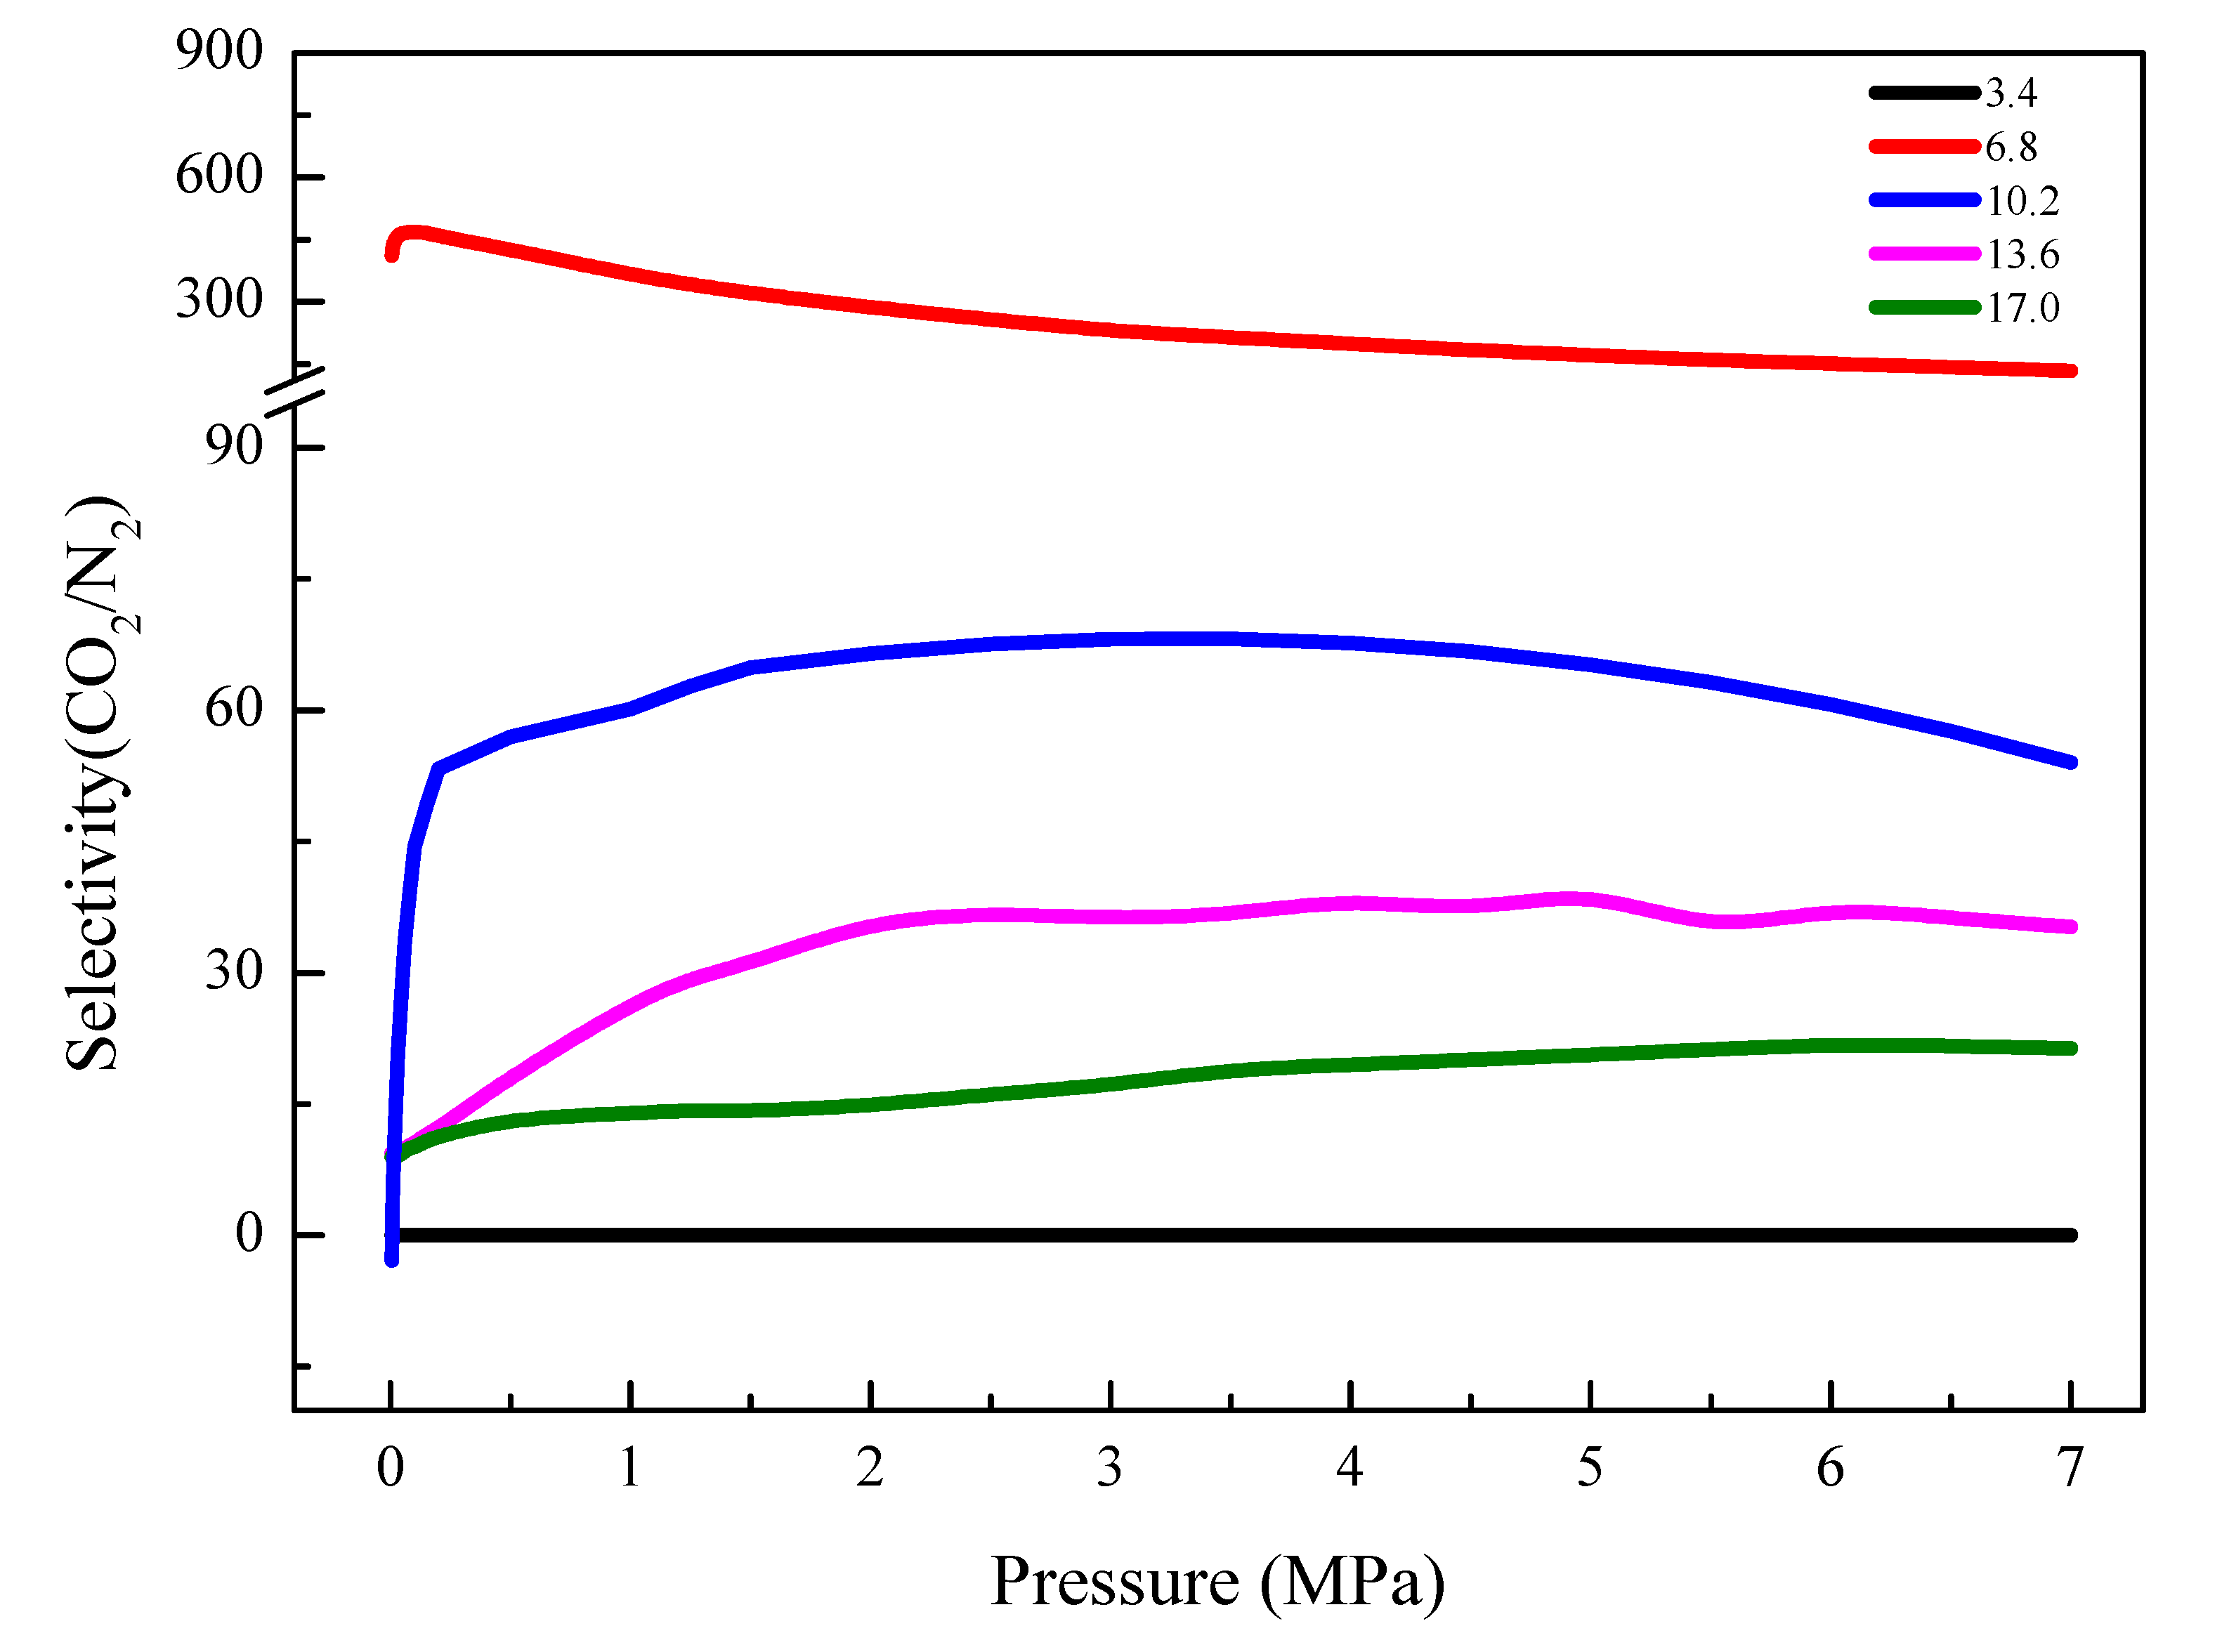
3.3. Selectivity of CO2 over N2 with Equal Molar Fraction
The selectivity of CO2 over impurity gases is of equal significance to evaluate adsorbent materials in CCS technology compared with the ability of CO2 adsorption. Therefore, the selectivities of CO2 over N2 for all the N-NMGs were studied and defined as [36]:
where S is the selectivity of CO2 over N2; and are the molar fractions of CO2 and N2 in their adsorbed phase; and and are the molar fractions. Figure 5 shows the selectivity of CO2 over N2 with 1:1 gas ratio for the N-MGNs at 298 K. Due to the non-adsorptive behavior for both CO2 and N2, N-MGN_3.4 is excluded in the selectivity study. In the above-mentioned range of pressures, the selectivities follow order of 6.8 > 10.2 > 13.6 > 17.0. The fact that increasing layer distance can reduce the , indicates that the layer distance has a significant influence on , especially at low pressure. The higher of N-MGN_6.8 is ascribe that the accessible N atoms and suitable channel are the predominant factors for the remarkable selectivity of CO2 over N2. At equilibrium pressure, N-MGN_6.8 exhibits the highest selectivity (~133), which is superior to many N-doped mesoporous (~32) [44], pristine GY (~50) [45] and hierarchical (~21–67) [17] carbon adsorbents. Unlike isosteric heats of the N-MGNs, the sequence of the selectivity remains the same in case of all pressures. This finding further highlights that the N-MGNs show optimal in the mixture gas, especially for the one with a layer distance of 0.68 nm.
3.4. Mechanism of CO2/N2 Adsorption in N-MGNs
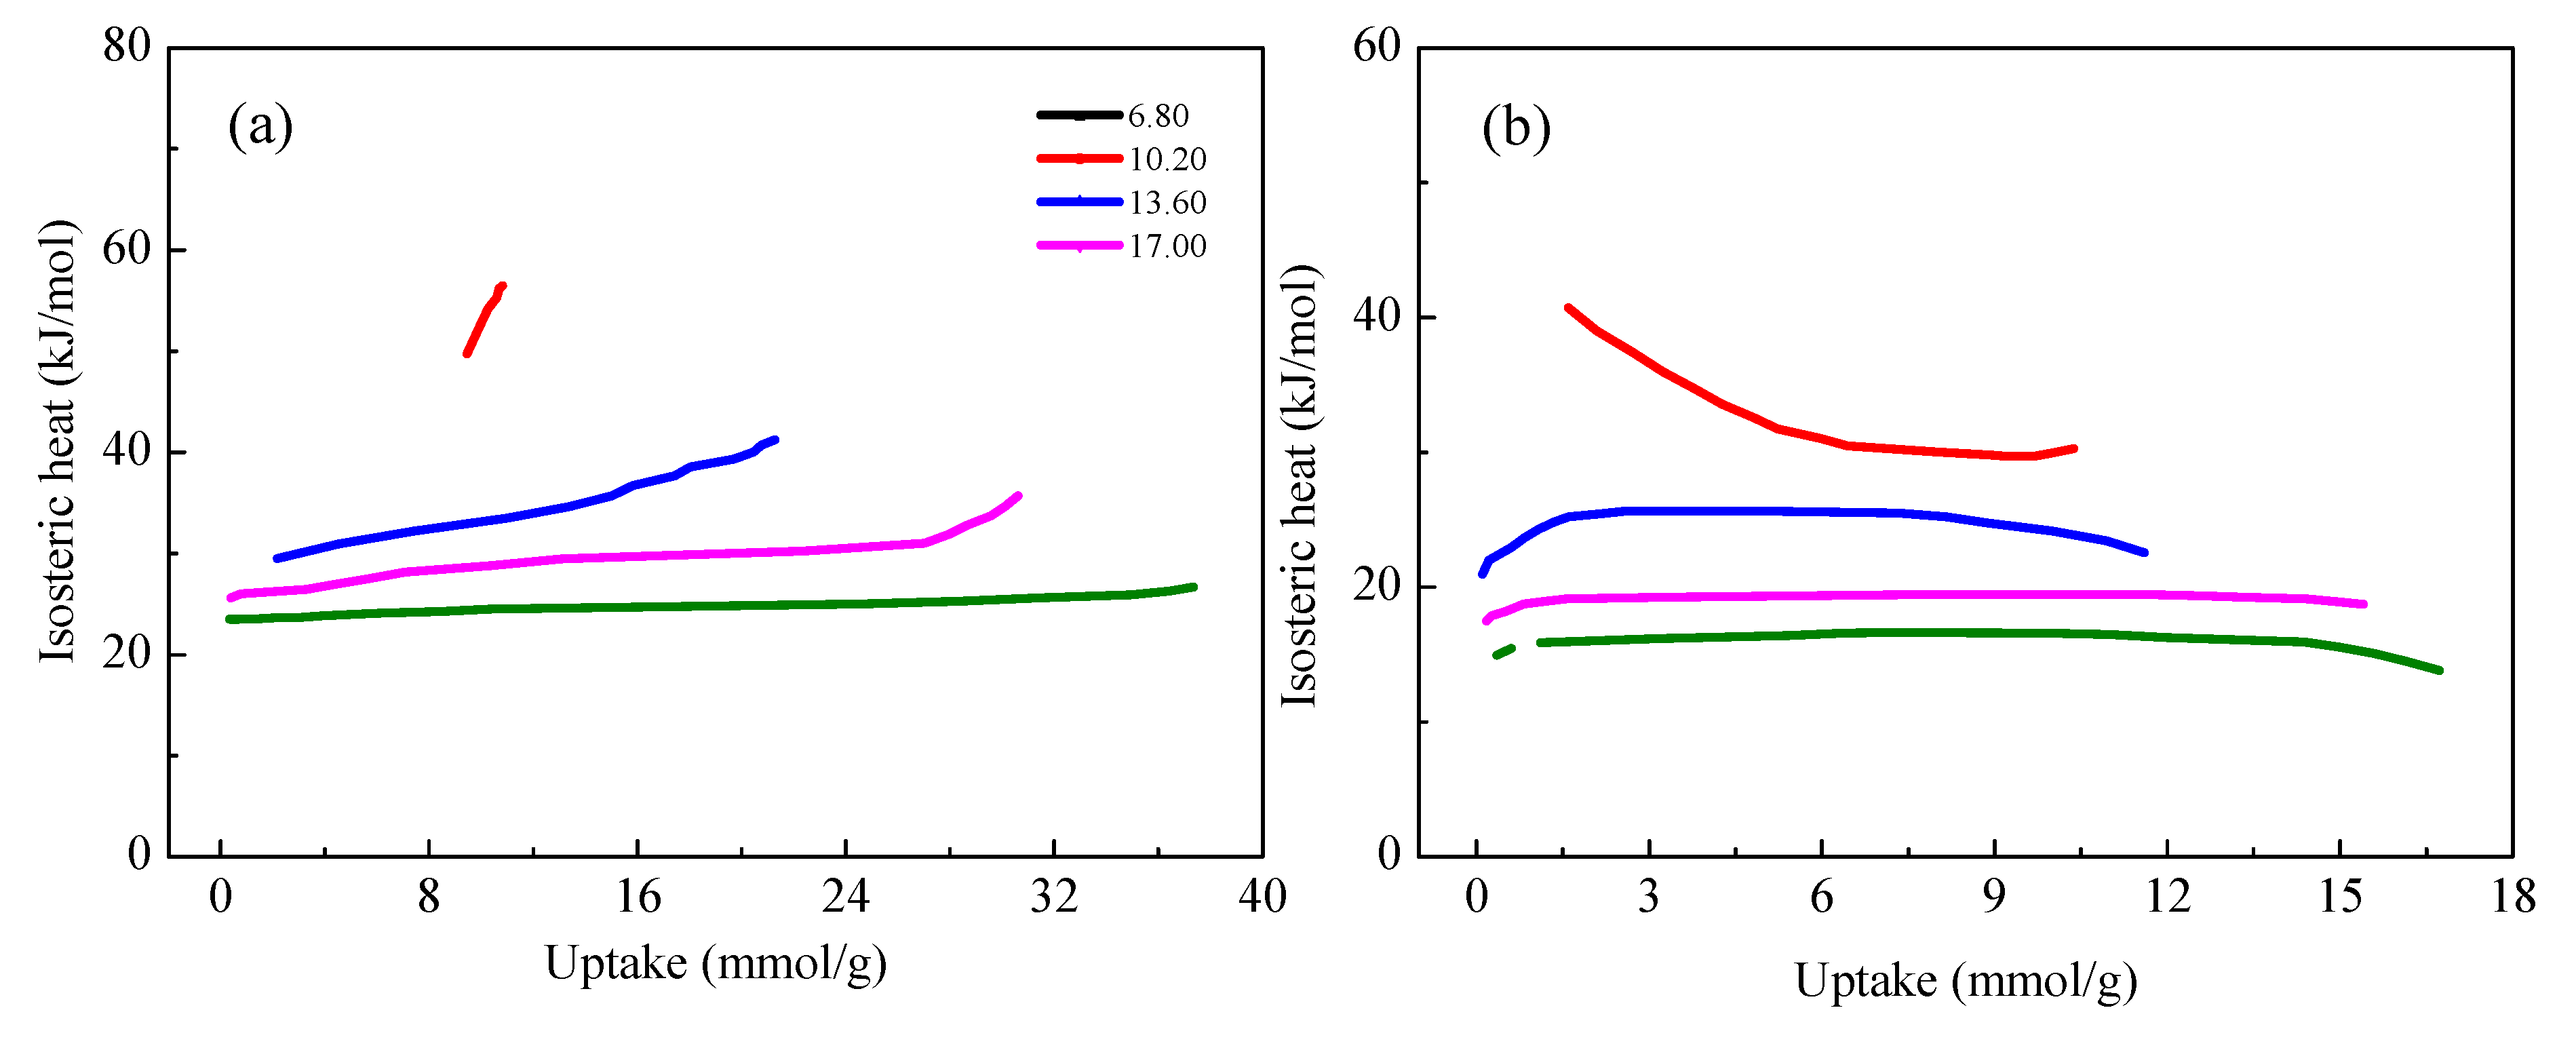
Isosteric heats (Qst). Qst [46] is a benchmark to describe the interaction of adsorbing gas molecules and framework at a certain surface, which represents the affinity between gas molecules and frameworks. Qst can be calculated from the Clausius−Clapeyron equation [47]. The Qst of N-MGN_3.4 was not considered due to no adsorption of the gases. Figure 6a exhibits the relationship between Qst and adsorption capacity of CO2 at 298 K. At low pressure, the Qst of CO2 follows the order of 6.8 > 10.2 > 13.6 > 17.0, which is the same as the sequence of CO2 adsorption. On the other hand, the isosteric heat profiles of N-MGNs_13.6 and N-MGNs_17.0 have three intersection points when the CO2 uptake is lower than 12 mmol/g. This is because large pore sizes of N-MGNs_13.6 and N-MGNs_17.0 lead to weaker interactions at low pressure, thus resulting in little difference in the isosteric heat profiles. Therefore, the absolute adsorption isotherms of CO2 for N-MGNs _1.36 and N-MGNs_1.70 nm almost overlapped at low pressure. The Qst of CO2 in N-MGNs_6.8 nm (~55 kJ mol−1), is larger than edge-functionalized nanoporous carbons (24.63–34.25 kJ mol−1), copper metal organic framework (~20 kJ mol−1) [48], and SIFSIX-3-M series (~45–50 kJ mol−1) [35]. It manifests the stronger interaction between CO2 and N-MGNs, which leads to the larger adsorption capacity at low pressure than other adsorbent materials. For the N2, the order of Qst corresponds to the absolute adsorption capacity N2, namely, 6.8 > 10.2 > 13.6 > 17.0 at low pressure (Figure 6b). The low Qst of N2 in N-MGNs_6.8 (~30 kJ mol−1) indicates a typical weak physisorption of N2. On the whole, the adsorption capacity of both CO2 and N2 are strongly related to the gas-framework interaction. And the stronger quadrupole moment of CO2 indicates that CO2 has the stronger interactions with N-MGNs than N2.
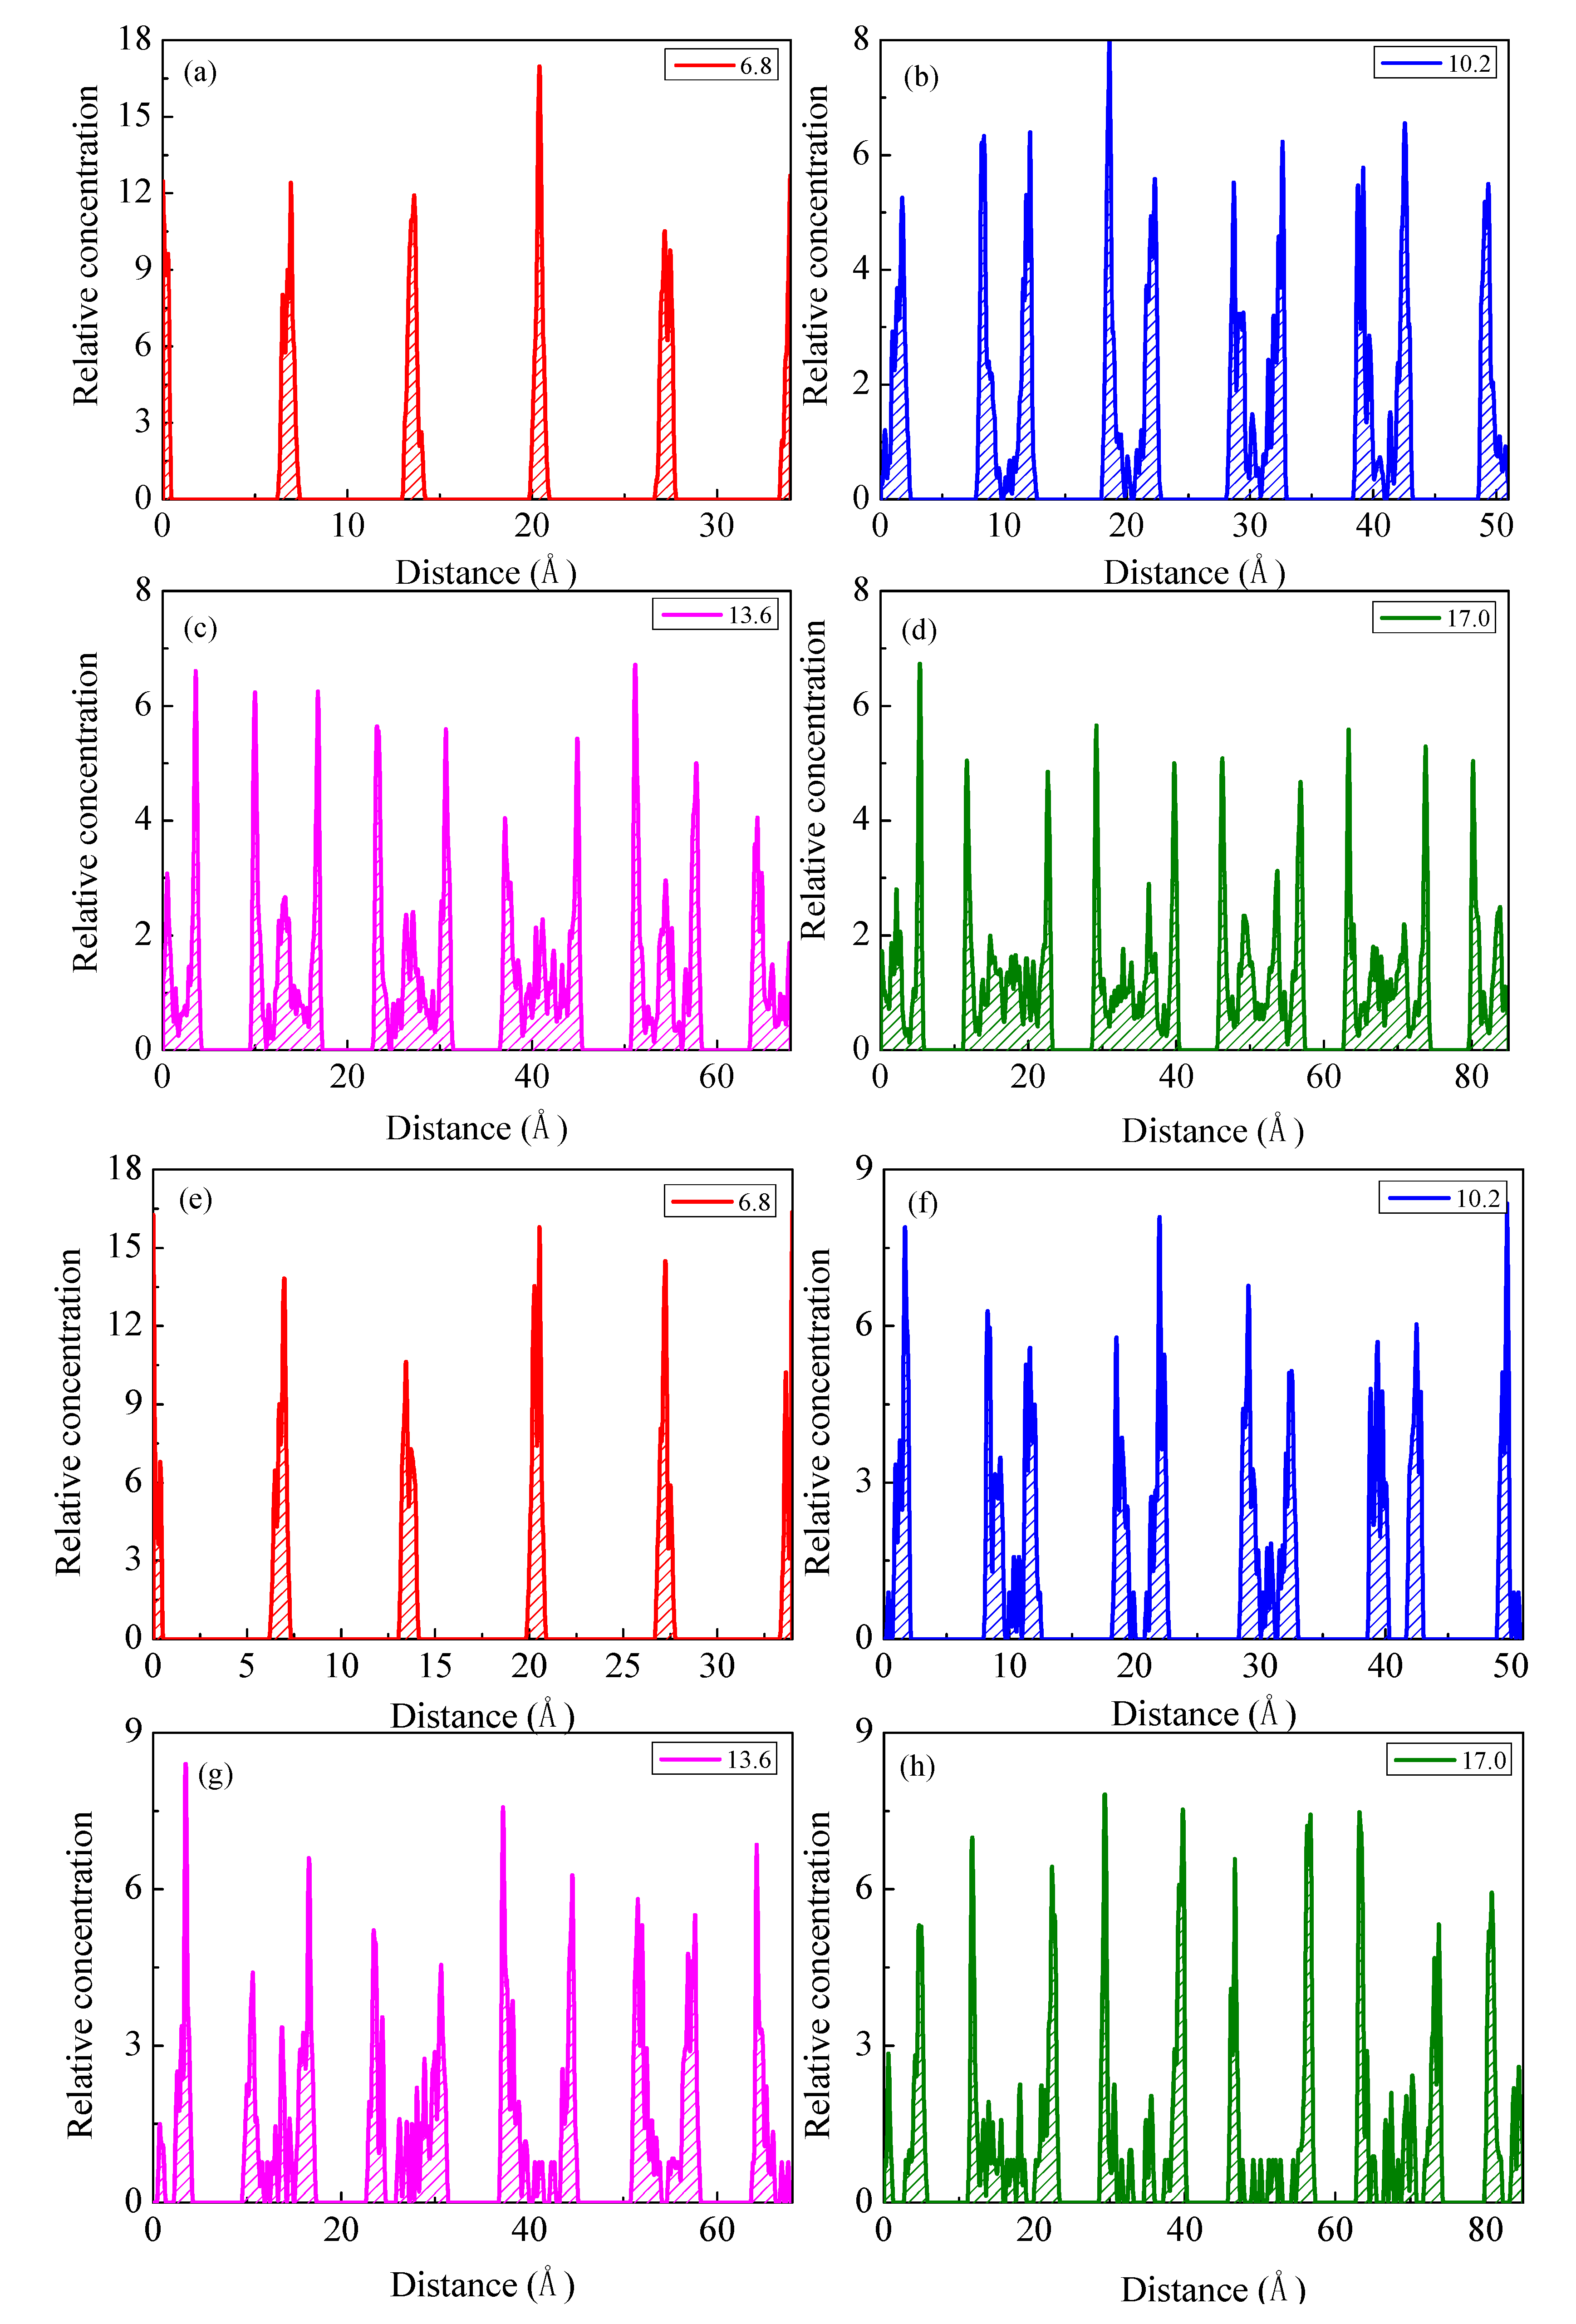
Gas distribution. To explore the gas distribution in equilibrium states for the pore of N-MGNs, the relative concentration profiles were presented as a function of the distance between layers. The relative concentration is defined as a ratio, that is calculated by dividing actual concentration by average concentration of the gas in the pore. The distribution of both CO2 and N2 in each layer of the N-MGNs can be reflected by relative concentration profiles. In most cases, it shows strong primary peaks close, minor secondary peaks, and bulk region [49]. T14he primary peak is resulted from the interaction between the first-layer of gas molecules adsorbed on the pore walls, that is, adsorbed phase. The secondary peak is mainly due to the equilibrating interactions between gas–gas or gas–surfaces, that is, equilibrated phase.
The relative concentration profiles of CO2 in each layer of N-MGNs are shown in Figure 7a,d. For N-MGNs_6.8, an isolated and high primary peak appear in each layer, because the layer with narrow distance can only hold CO2 molecules in the adsorbed phase. Moreover, the narrower layer distance leads to the overlap of two primary peaks for each pore. Differently, the two primary peaks were separated and next to each other for N-MGN_10.2. And in case of N-MGN_13.6, the equilibrated phase can be observed in between the two primary peaks. As for N-MGN_17.0, two primary peaks, two secondary peaks, and bulk region can be clearly visualized due to the large the enough space of each pore. The results explain the phenomenon that the N-MGN with larger layer distance have higher adsorption capacity at high pressure.
Figure 7e–h show that the relative concentration profiles of N2 for the N-MGNs have similar trend as CO2. When layer distance is narrow, only overlapped primary peaks can be seen. With the increase of layer distance, primary peaks separate and overlapped secondary peaks appear. When the layer distance reaches 1.70 nm, the integrated primary peaks, secondary peaks, and bulk region can be observed. However, the primary and secondary peaks of N2 are inferior comparing to CO2 due to the large kinetic diameter [50] and the stronger electric quadrupole moment of CO2 molecule.
Overall, the relative concentration profiles visualized the distributions of gas molecules in each layer of N-MGNs. The results indicate that the layer distance is a significant factor to influence the adsorption capacity of CO2/N2 at high pressure, namely, the larger layer distance causes higher adsorption. This perfectly explains the change of the sequence of absolute adsorption isotherms at high pressure.
4. Conclusions
The adsorption and separation behaviors of CO2 and N2 for N-MGNs with different layer distances were studied by simulations. Results have shown that the N-MGNs structure provides favorable pore space for CO2 adsorption capacity and separation performance. At ultra-low pressure, N-MGN_6.8 have shown an excellent CO2 adsorption behavior (10.59 mmol/g) at low pressure (0.4 bar). In comparison, the absolute adsorption of CO2 for N-MGN_17.0 (40.16 mmol/g) at 7.0 MPa is much larger than that of N-doping slit pore under high pressures. At 1.0 bar, the highest reached up to ~133 in N-MGN_6.8. The adsorption heat and relative concentration curves confirm that the adsorption ability of CO2 for the all the materials are better than that of N2, and the change of the interlayer spacing has an important influence on the adsorption capacity of the gases. The effect has the advantage of adsorption. Under high pressure, the structure with large interlayer spacing has a strong adsorption capacity due to the large porosity. The five structures all showed strong CO2/N2 adsorption capacity at 0–7 MPa. This work highlights the advantages of CO2/N2 adsorption and separation in N-MGNs structure, as well as providing effective methods and strategies for the design and screening of high-quality adsorbate materials for carbon capture and storage technology.
Author Contributions
Formal analysis, L.W.; Funding acquisition, X.L.; Investigation, Y.C.; Resources, Z.J.; Software, L.S.; Writing—original draft, W.L.; Writing—review & editing, S.Z. All authors have read and agreed to the published version of the manuscript.
Funding
This work was supported by Shandong Natural Science Foundation, China (ZR2019MEM005), the Major Scientific and Technological Projects of CNPC (ZD2019−184-001), Teaching Reform Research Project of China University of Petroleum (ZY-202018),State Key Laboratory of Enhanced Oil Recovery of Open Fund Funded Project: (2022-KFKT-28), Major Special Projects of CNPC (2021ZZ01-03 and 2021ZZ01-05), Scientific and Technological Project of CNPC (2021DJ1103).
Institutional Review Board Statement
Not applicable.
Informed Consent Statement
Not applicable.
Data Availability Statement
Not applicable.
Conflicts of Interest
The authors declare no conflict of interest.
References
- Pérez, S.; Del Molino, E.; Barrio, V.L. Modeling and Testing of a Milli-Structured Reactor for Carbon Dioxide Methanation. Int. J. Chem. React. Eng. 2019, 17. [Google Scholar] [CrossRef]
- Yin, C.; Qiu, S.; Zhang, S.; Sher, F.; Zhang, H.; Xu, J.; Wen, L. Strength degradation mechanism of iron coke prepared by mixed coal and Fe2O3. J. Anal. Appl. Pyrolysis 2020, 150, 104897. [Google Scholar] [CrossRef]
- Zhang, Y.; Fang, Y.; Jin, B.; Zhang, Y.; Zhou, C.; Sher, F. Effect of Slot Wall Jet on Combustion Process in a 660 MW Opposed Wall Fired Pulverized Coal Boiler. Int. J. Chem. React. Eng. 2019, 17. [Google Scholar] [CrossRef]
- Cai, S.; Zhang, Y.; Wei, F.; Sher, L.; Wen, J.; Xu, J.; Dang, J.; Hu, L. A novel method for removing organic sulfur from high-sulfur coal: Migration of organic sulfur during microwave treatment with NaOH-H2O2. Fuel 2021, 289, 119800. [Google Scholar] [CrossRef]
- Samanta, A.; Zhao, A.; Shimizu, G.K.H.; Sarkar, P.; Gupta, R. Post-Combustion CO2 Capture Using Solid Sorbents: A Review. Ind. Eng. Chem. Res. 2011, 51, 1438–1463. [Google Scholar] [CrossRef]
- Yu, J.; Xie, L.-H.; Li, J.-R.; Ma, Y.; Seminario, J.M.; Balbuena, P.B. CO2 Capture and Separations Using MOFs: Computational and Experimental Studies. Chem. Rev. 2017, 117, 9674–9754. [Google Scholar] [CrossRef]
- Dutcher, B.; Fan, M.; Russell, A.G. Amine-Based CO2 Capture Technology Development from the Beginning of 2013—A Review. ACS Appl. Mater. Interfaces 2015, 7, 2137–2148. [Google Scholar] [CrossRef]
- Mumford, K.A.; Wu, Y.; Smith, K.; Stevens, G.W. Review of solvent based carbon-dioxide capture technologies. Front. Chem. Sci. Eng. 2015, 9, 125–141. [Google Scholar] [CrossRef]
- Huck, J.M.; Lin, L.-C.; Berger, A.H.; Shahrak, M.N.; Martin, R.L.; Bhown, A.S.; Haranczyk, M.; Reuter, K.; Smit, B. Evaluating different classes of porous materials for carbon capture. Energy Environ. Sci. 2014, 7, 4132–4146. [Google Scholar] [CrossRef]
- Lu, X.; Jin, D.; Wei, S.; Wang, Z.; An, C.; Guo, W. Strategies to enhance CO2 capture and separation based on engineering absorbent materials. J. Mater. Chem. A 2015, 3, 12118–12132. [Google Scholar] [CrossRef]
- Bludov, Y.V.; Peres, N.M.R.; I Vasilevskiy, M. Unusual reflection of electromagnetic radiation from a stack of graphene layers at oblique incidence. J. Opt. 2013, 15, 114004. [Google Scholar] [CrossRef] [Green Version]
- Gong, C.; Lee, G.; Shan, B.; Vogel, E.; Wallace, R.; Cho, K. First-principles study of metal–graphene interfaces. J. Appl. Phys. 2010, 108, 123711. [Google Scholar] [CrossRef]
- Ye, R.; James, D.K.; Tour, J.M. Laser-Induced Graphene: From Discovery to Translation. Adv. Mater. 2018, 31, e1803621. [Google Scholar] [CrossRef] [PubMed]
- Liu, H.; Liu, Y.; Zhu, D. Chemical doping of graphene. J. Mater. Chem. 2011, 21, 3335–3345. [Google Scholar] [CrossRef]
- To, J.W.F.; He, J.; Mei, J.; Haghpanah, R.; Chen, Z.; Kurosawa, T.; Chen, S.; Bae, W.-G.; Pan, L.; Tok, J.B.H.; et al. Hierarchical N-Doped Carbon as CO2 Adsorbent with High CO2 Selectivity from Rationally Designed Polypyrrole Precursor. J. Am. Chem. Soc. 2016, 138, 1001–1009. [Google Scholar] [CrossRef] [PubMed]
- To, J.W.F.; Chen, Z.; Yao, H.; He, J.; Kim, K.; Chou, H.-H.; Pan, L.; Wilcox, J.; Cui, Y.; Bao, Z. Ultrahigh Surface Area Three-Dimensional Porous Graphitic Carbon from Conjugated Polymeric Molecular Framework. ACS Cent. Sci. 2015, 1, 68–76. [Google Scholar] [CrossRef] [Green Version]
- Psarras, P.; He, J.; Wilcox, J. Molecular simulations of nitrogen-doped hierarchical carbon adsorbents for post-combustion CO2 capture. Phys. Chem. Chem. Phys. 2016, 18, 28747–28758. [Google Scholar] [CrossRef]
- Kumar, K.V.; Preuss, K.; Lu, L.; Guo, Z.X.; Titirici, M.M. Effect of Nitrogen Doping on the CO2 Adsorption Behavior in Nanoporous Carbon Structures: A Molecular Simulation Study. J. Phys. Chem. C 2015, 119, 22310–22321. [Google Scholar] [CrossRef]
- Zhu, X.; Tian, C.; Veith, G.M.; Abney, C.W.; Dehaudt, J.; Dai, S. In Situ Doping Strategy for the Preparation of Conjugated Triazine Frameworks Displaying Efficient CO2 Capture Performance. J. Am. Chem. Soc. 2016, 138, 11497–11500. [Google Scholar] [CrossRef]
- Frisch, M.J.; Trucks, G.W.; Schlegel, H.B.; Scuseria, G.E.; Robb, M.A.; Cheeseman, J.R.; Scalmani, G.; Barone, V.; Mennucci, B.; Petersson, G.A.; et al. 01; Gaussian, Inc.: Wallingford, CT, USA, 2009. [Google Scholar]
- Rappe, A.K.; Casewit, C.J.; Colwell, K.S.; Goddard, W.A.; Skiff, W.M. UFF, a full periodic table force field for molecular mechanics and molecular dynamics simulations. J. Am. Chem. Soc. 1992, 114, 10024–10035. [Google Scholar] [CrossRef]
- Potoff, J.J.; Siepmann, J.I. Vapor–liquid equilibria of mixtures containing alkanes, carbon dioxide, and nitrogen. AIChE J. 2001, 47, 1676–1682. [Google Scholar] [CrossRef]
- Zhou, S.; Guo, C.; Wu, Z.; Wang, M.; Wang, Z.; Wei, S.; Li, S.; Lu, X. Edge-functionalized nanoporous carbons for high adsorption capacity and selectivity of CO2 over N2. Appl. Surf. Sci. 2017, 410, 259–266. [Google Scholar] [CrossRef]
- Steele, W. Computer simulations of physical adsorption: A historical review. Appl. Surf. Sci. 2002, 196, 3–12. [Google Scholar] [CrossRef]
- Gupta, A.; Chempath, S.; Sanborn, M.J.; Clark, L.A.; Snurr, R. Object-oriented Programming Paradigms for Molecular Modeling. Mol. Simul. 2003, 29, 29–46. [Google Scholar] [CrossRef] [Green Version]
- Sarkisov, L.; Harrison, A. Computational structure characterisation tools in application to ordered and disordered porous materials. Mol. Simul. 2011, 37, 1248–1257. [Google Scholar] [CrossRef]
- Düren, T.; Millange, F.; Férey, G.; Walton, A.K.S.; Snurr, R.Q. Calculating Geometric Surface Areas as a Characterization Tool for Metal−Organic Frameworks. J. Phys. Chem. C 2007, 111, 15350–15356. [Google Scholar] [CrossRef]
- Phan, A.; Doonan, C.J.; Uribe-Romo, F.J.; Knobler, C.B.; O’Keeffe, M.; Yaghi, O.M. Synthesis, Structure, and Carbon Dioxide Capture Properties of Zeolitic Imidazolate Frameworks. Acc. Chem. Res. 2010, 43, 58–67. [Google Scholar] [CrossRef]
- Li, Y.-W.; Yan, H.; Hu, T.-L.; Ma, H.-Y.; Li, D.-C.; Wang, S.-N.; Yao, Q.-X.; Dou, J.-M.; Xu, J.; Bu, X.-H. Two microporous Fe-based MOFs with multiple active sites for selective gas adsorption. Chem. Commun. 2017, 53, 2394–2397. [Google Scholar] [CrossRef]
- Meza-Morales, P.J.; Gómez-Gualdrón, D.A.; Arrieta-Perez, R.R.; Hernández-Maldonado, A.J.; Snurr, R.Q.; Curet-Arana, M.C. CO2 adsorption-induced structural changes in coordination polymer ligands elucidated via molecular simulations and experiments. Dalton Trans. 2016, 45, 17168–17178. [Google Scholar] [CrossRef]
- Islamoglu, T.; Kim, T.; Kahveci, Z.; El-Kadri, O.M.; El-Kaderi, H.M. Systematic Postsynthetic Modification of Nanoporous Organic Frameworks for Enhanced CO2 Capture from Flue Gas and Landfill Gas. J. Phys. Chem. C 2016, 120, 2592–2599. [Google Scholar] [CrossRef]
- Kuchta, B.; Firlej, L.; Mohammadhosseini, A.; Boulet, P.; Beckner, M.; Romanos, J.; Pfeifer, P. Hypothetical High-Surface-Area Carbons with Exceptional Hydrogen Storage Capacities: Open Carbon Frameworks. J. Am. Chem. Soc. 2012, 134, 15130–15137. [Google Scholar] [CrossRef] [PubMed]
- Di Biase, E.; Sarkisov, L. Systematic development of predictive molecular models of high surface area activated carbons for adsorption applications. Carbon 2013, 64, 262–280. [Google Scholar] [CrossRef]
- Thommes, M.; Kaneko, K.; Neimark, A.V.; Olivier, J.P.; Rodriguez-Reinoso, F.; Rouquerol, J.; Sing, K.S.W. Physisorption of gases, with special reference to the evaluation of surface area and pore size distribution (IUPAC Technical Report). Pure Appl. Chem. 2015, 87, 1051–1069. [Google Scholar] [CrossRef] [Green Version]
- Ziaee, A.; Chovan, D.; Lusi, M.; Perry, J.J.; Zaworotko, M.J.; Tofail, S.A.M. Theoretical Optimization of Pore Size and Chemistry in SIFSIX-3-M Hybrid Ultramicroporous Materials. Cryst. Growth Des. 2016, 16, 3890–3897. [Google Scholar] [CrossRef]
- Lu, X.; Jin, D.; Wei, S.; Zhang, M.; Zhu, Q.; Shi, X.; Deng, Z.; Guo, W.; Shen, W. Competitive adsorption of a binary CO2-CH4 mixture in nanoporous carbons: Effects of edge-functionalization. Nanoscale 2015, 7, 1002–1012. [Google Scholar] [CrossRef]
- Zhang, Y.; Liu, C.; Hao, F.; Xiao, H.; Zhang, S.; Chen, X. CO2 adsorption and separation from natural gason phosphorene surface: Combining DFT and GCMC calculations. Appl. Surf. Sci. 2017, 397, 206–212. [Google Scholar] [CrossRef]
- Leng, X.L.Z. Investigation on CO2 Adsorption and Separation over N2 in Functionalized Metal-organic Framework. J. Liaocheng Univ. 2022, 35, 28–33. [Google Scholar]
- Li, X.; Zhu, L.; Xue, Q.; Chang, X.; Ling, C.; Xing, W. Superior Selective CO2 Adsorption of C3N Pores: GCMC and DFT Simulations. ACS Appl. Mater. Interfaces 2017, 9, 31161–31169. [Google Scholar] [CrossRef]
- Li, X.; Xue, Q.; Chang, X.; Zhu, L.; Ling, C.; Zheng, H. Effects of Sulfur Doping and Humidity on CO2 Capture by Graphite Split Pore: A Theoretical Study. ACS Appl. Mater. Interfaces 2017, 9, 8336–8343. [Google Scholar] [CrossRef]
- Liu, Y.; Wilcox, J. Effects of Surface Heterogeneity on the Adsorption of CO2 in Microporous Carbons. Environ. Sci. Technol. 2012, 46, 1940–1947. [Google Scholar] [CrossRef]
- Yang, Z.; Peng, X.; Cao, D. Carbon Dioxide Capture by PAFs and an Efficient Strategy To Fast Screen Porous Materials for Gas Separation. J. Phys. Chem. C 2013, 117, 8353–8364. [Google Scholar] [CrossRef]
- Balbuena, P.B.; Gubbins, K.E. Theoretical interpretation of adsorption behavior of simple fluids in slit pores. Langmuir 1993, 9, 1801–1814. [Google Scholar] [CrossRef]
- Bao, S.-J.; Krishna, R.; He, Y.-B.; Qin, J.-S.; Su, Z.-M.; Li, S.-L.; Xie, W.; Du, D.-Y.; He, W.-W.; Zhang, S.-R.; et al. A stable metal–organic framework with suitable pore sizes and rich uncoordinated nitrogen atoms on the internal surface of micropores for highly efficient CO2 capture. J. Mater. Chem. A 2015, 3, 7361–7367. [Google Scholar] [CrossRef] [Green Version]
- Zhou, S.; Wang, M.; Wei, S.; Cao, S.; Wang, Z.; Liu, S.; Sun, D.; Lu, X. First-row transition-metal-doped graphyne for ultrahigh-performance CO2 capture and separation over N2/CH4/H2. Mater. Today Phys. 2021, 16, 100301. [Google Scholar] [CrossRef]
- Choma, J.; Stachurska, K.; Marszewski, M.; Jaroniec, M. Equilibrium isotherms and isosteric heat for CO2 adsorption on nanoporous carbons from polymers. Adsorption 2016, 22, 581–588. [Google Scholar] [CrossRef]
- Cimino, R.T.; Kowalczyk, P.; Ravikovitch, P.I.; Neimark, A.V. Determination of Isosteric Heat of Adsorption by Quenched Solid Density Functional Theory. Langmuir 2017, 33, 1769–1779. [Google Scholar] [CrossRef]
- Liu, X.; Xiao, Z.; Xu, J.; Xu, W.; Sang, P.; Zhao, L.; Zhu, H.; Sun, D.; Guo, W. A NbO-type copper metal-organic framework decorated with carboxylate groups exhibiting highly selective CO2 adsorption and separation of organic dyes. J. Mater. Chem. A 2016, 4, 13844–13851. [Google Scholar] [CrossRef]
- Ambrose, R.J.; Hartman, R.C.; Campos, M.D.; Akkutlu, I.Y.; Sondergeld, C.H. Shale Gas-in-Place Calculations Part I: New Pore-Scale Considerations. SPE J. 2012, 17, 219–229. [Google Scholar] [CrossRef]
- Sang, P.; Zhao, L.; Xu, J.; Shi, Z.; Guo, S.; Yu, Y.; Zhu, H.; Yan, Z.; Guo, W. Excellent membranes for hydrogen purification: Dumbbell-shaped porous γ-graphynes. Int. J. Hydrogen Energy 2017, 42, 5168–5176. [Google Scholar] [CrossRef]
Figure 1.
Initial configurations and frameworks of N-MGNs.

Figure 2.
Pore size distributions of N-MGN with different interlayer distance.

Figure 3.
The density of state analyses of the N-MGN structures.

Figure 4.
The absolute adsorption isotherms of CO2 (a,b) and N2 (c,d) at low and high pressure and 298 K.
Figure 4.
The absolute adsorption isotherms of CO2 (a,b) and N2 (c,d) at low and high pressure and 298 K.

Figure 5.
Selectivity of CO2 over N2 in N-MGNs at 298 K with equal ratio mixture ratios of CO2/N2.

Figure 6.
The isosteric heat of CO2 (a) and N2 (b) in the N-MGNs.

Figure 7.
The relative concentration profiles of CO2 (a–d) and N2 (e–f) as a function of the layer distance in their equilibrium states.
Figure 7.
The relative concentration profiles of CO2 (a–d) and N2 (e–f) as a function of the layer distance in their equilibrium states.


Table 1.
Lennard-Jones parameters and atomic partial charges for CO2, N2, and N-MGNs.
| Atom | Gas Molecule Models | MGNs Frameworks | ||||
|---|---|---|---|---|---|---|
| C(CO2) | O(CO2) | N(N2) | COM(N2) | C | N | |
| σ (Å) | 2.08 | 3.05 | 3.31 | 0.00 | 3.43 | 3.26 |
| ε (K) | 27.00 | 79.00 | 36.00 | 0.00 | 52.84 | 34.72 |
| q (e) | 0.748 | −0.374 | −0.482 | 0.964 | - | - |
Table 2.
Pore physical characteristics of N-MGNs, gas probe molecule = He.
| R | H_3.4 | H_6.8 | H_10.2 | H_13.6 | H_17.0 |
|---|---|---|---|---|---|
| VP (cm3/g) | 0.04 | 0.461 | 0.882 | 1.307 | 1.727 |
| Porosity, Φ (%) | 9.43 | 54.72 | 72.71 | 77.49 | 84.86 |
| DL (Å) | 0.95 | 3.90 | 6.94 | 10.71 | 13.68 |
| DM (Å) | 0.97 | 3.96 | 7.11 | 10.80 | 13.76 |
| Density g/cm3 | 2.372 | 1.186 | 0.791 | 0.593 | 0.474 |
| Accessible surface area (m2/g) | 2521.72 | 2521.72 | 2521.72 | 2521.72 | 2521.72 |
Publisher’s Note: MDPI stays neutral with regard to jurisdictional claims in published maps and institutional affiliations. |
© 2022 by the authors. Licensee MDPI, Basel, Switzerland. This article is an open access article distributed under the terms and conditions of the Creative Commons Attribution (CC BY) license (https://creativecommons.org/licenses/by/4.0/).
Share and Cite
MDPI and ACS Style
Lyu, W.; Sun, L.; Wang, L.; Ji, Z.; Zhou, S.; Chen, Y.; Lu, X. Nitrogen Atom-Doped Layered Graphene for High-Performance CO2/N2 Adsorption and Separation. Energies 2022, 15, 3713. https://0-doi-org.brum.beds.ac.uk/10.3390/en15103713
AMA Style
Lyu W, Sun L, Wang L, Ji Z, Zhou S, Chen Y, Lu X. Nitrogen Atom-Doped Layered Graphene for High-Performance CO2/N2 Adsorption and Separation. Energies. 2022; 15(10):3713. https://0-doi-org.brum.beds.ac.uk/10.3390/en15103713
Chicago/Turabian StyleLyu, Weifeng, Linghui Sun, Lu Wang, Zemin Ji, Sainan Zhou, Yong Chen, and Xiaoqing Lu. 2022. "Nitrogen Atom-Doped Layered Graphene for High-Performance CO2/N2 Adsorption and Separation" Energies 15, no. 10: 3713. https://0-doi-org.brum.beds.ac.uk/10.3390/en15103713
Note that from the first issue of 2016, this journal uses article numbers instead of page numbers. See further details here.