Article

Numerical and Experimental Study on Thermal Comfort of Human Body by Split-Fiber Air Conditioner

1
School of Petroleum Engineering, Changzhou University, Changzhou 233016, China
2
China Electronic Systems Engineering Second Construction Co., Ltd., Wuxi 214000, China
*
Authors to whom correspondence should be addressed.
Submission received: 15 April 2022 / Revised: 17 May 2022 / Accepted: 18 May 2022 / Published: 19 May 2022
(This article belongs to the Special Issue Green Buildings for Carbon Neutral)

Abstract

:
The thermal comfort of an enclosed room with air conditioner and air-distribution duct coupling can be studied, and the parameters of a split-fiber air conditioner can be optimized on the basis of studying the thermal comfort of various parts of the human body. In this paper, a room model with a distributed air conditioner was proposed. First, the rationality of the three thermal comfort characterization models of predict mean vote (PMV), predicted percentage of dissatisfied (PPD), and percentage of dissatisfied (PD) were verified through experiments and simulations. Then, the temperature and thermal comfort of various parts of the human body were explored when the air-distribution duct had different openings and different positions of the air outlet. The simulation results showed that compared with other situations, when the split-fiber air conditioner had three rows of holes (5-o’clock, 6-o’clock, 7-o’clock) and the air outlet was located in the middle of the right wall of the human body, the PMV, PPD, and PD of the measuring points around the human body fluctuated less, the indoor temperature field distribution fluctuated less, and there was no wind feeling around the human body, which can better meet the needs of human thermal comfort.

1. Introduction

Low-carbon building is one of the main development goals in the new era, and play a central role in achieving global carbon emission limits [1]. Therefore, it is a trend that conforms with the time to promote the transformation of the traditional building model to a sustainable and low-carbon emission model [2]. Low-carbon building specifically refers to the principle of sustainable development that has always been integrated into the entire process of building design, construction, and use. Countries are also exploring methods to build low-carbon buildings in the above three sub-processes [3,4]. However, the air conditioner inside the building has an important impact on the last sub-process, so it is considered as the key point of low-carbon building research.
For water-cooled air conditioners, the majority of studies have focused on improving the working performance of air conditioners integrated with a number of optimization measures. For example, a set of online remote control systems has innovatively been developed by researchers to monitor and feedback the working status of air conditioners [5]; the optimization of building maintenance structural materials has effectively reduced the operating costs and CO2 emissions of air conditioners [6]. In a building that has a photovoltaic power generation system, the exhaust gas can be used to cool the solar system, and the air-cooling method is used to reduce the impact of temperature rise [7]; when working under changing environmental parameters, a robust model is introduced to optimize the control of air conditioners, and results show that it can save more than 20% of energy compared with ordinary decisions [8]; on the basis of evaporative cooling, a brand new air conditioner cooler was assembled to control the continuously changing and strictly required environmental parameters separately [9]. In the diagnosis of building air conditioning faults, an optimized diagnosis method based on deep learning can achieve a correct diagnosis rate of 97.7%, which is significantly better than the common diagnosis method [10]. In order to cater for energy saving policies, current research has applied different simulation methods integrated with various mathematic models to decrease the energy consumption in specific conditions, and increase the work performance of the air conditioner simultaneously.
For buildings in this new era, more attention should be paid to the comfort of people in the space under the conditions of energy saving and emissions reduction. In addition to wind and health standards, thermal comfort is the most important indicator [11], especially for the predict mean vote (PMV), predicted percentage of dissatisfied (PPD), and percentage of dissatisfied (PD). Some studies have proposed a data-driven model using “transfer learning” for more optimized thermal comfort modeling, which can solve the defect of insufficient sample data [12]; moreover, different mathematical models such as deep learning networks have been introduced to analyze the indoor thermal comfort [13]; for a non-uniform thermal environment, properly increasing the air-flow rate can reduce the thermal discomfort caused by temperature differences [14]. For HVAC (heating, ventilation and air conditioning) systems, a new detection and control system was proposed that could feedback adjust the indoor thermal comfort and reduce the energy consumption [15]; when the room is affected by solar radiation, a HVAC control strategy using a PMV model has been proposed to simultaneously increase the level of thermal comfort and decrease the energy use [16]; optimization of the PMV/PPD model plays a significant role in evaluating heat-producing sources in the countryside and searching for the most optimal ones [17]. Overall, most of the studies with regard to thermal comfort have mainly focused on proposing new models to assess the indoor thermal comfort and making specific adjustments toward these evaluation models to reach the optimal effect.
In addition to the thermal comfort, the environment of the working and living areas is another point that has attracted much attention. Based on the problems of general air conditioners with a large blowing sensation and low-indoor thermal comfort, the introduction of air ducts promotes the development of solutions for many of the current indoor problems. In order to solve the problem of air pollution in some specific workplaces, the optimal installation position of the air duct is determined by Fluent to achieve the best exhaust effect [18]; in HVAC systems, studies have explored the related changes of turbulent dissipation and entropy by installing ducts of different shapes on different kinds of walls [19]; in another, an innovative double-channel air duct was proposed under winter conditions and numerical simulations proved that the air duct could improve the overall environmental status of the poultry house [20]. Similar research methods have also been applied to assess the biological contamination in air ducts, provide control methods [21], compare the impact of perforated and non-perforated air ducts on the indoor air distribution and energy consumption, and determine a more suitable air duct mode according to specific conditions [22]. More studies have focused on independent research on air ducts, especially carrying out experiments and simulations to assess the changing state of fluid in the air duct and trying to apply the air duct to some particular places.
Compared to the current status on the investigated topic, previous studies have mainly focused on the structure and performance of split-fiber air conditioners, and few studies have fully evaluated indoor thermal comfort with the aid of the PMV, PPD, and PD models. In order to solve the above problems, a room model equipped with distributed air conditioners was proposed in this paper. First, the simulation results were compared with the actual experimental calculated values to determine the rationality of the three thermal comfort models of the PMV, PPD, and PD. On this basis, two cases of different opening degrees and different outlet positions of the distributed air conditioners were selected, and simulations were carried out from the two aspects of temperature field and thermal comfort. This study mainly analyzed the temperature conditions of various parts of the indoor human body under specific conditions and whether it met the thermal-comfort level under the recommended indicators, and finally determined the optimal number of openings and the optimal position of the air outlet for the indoor air distribution of air conditioning.

2. Methodology

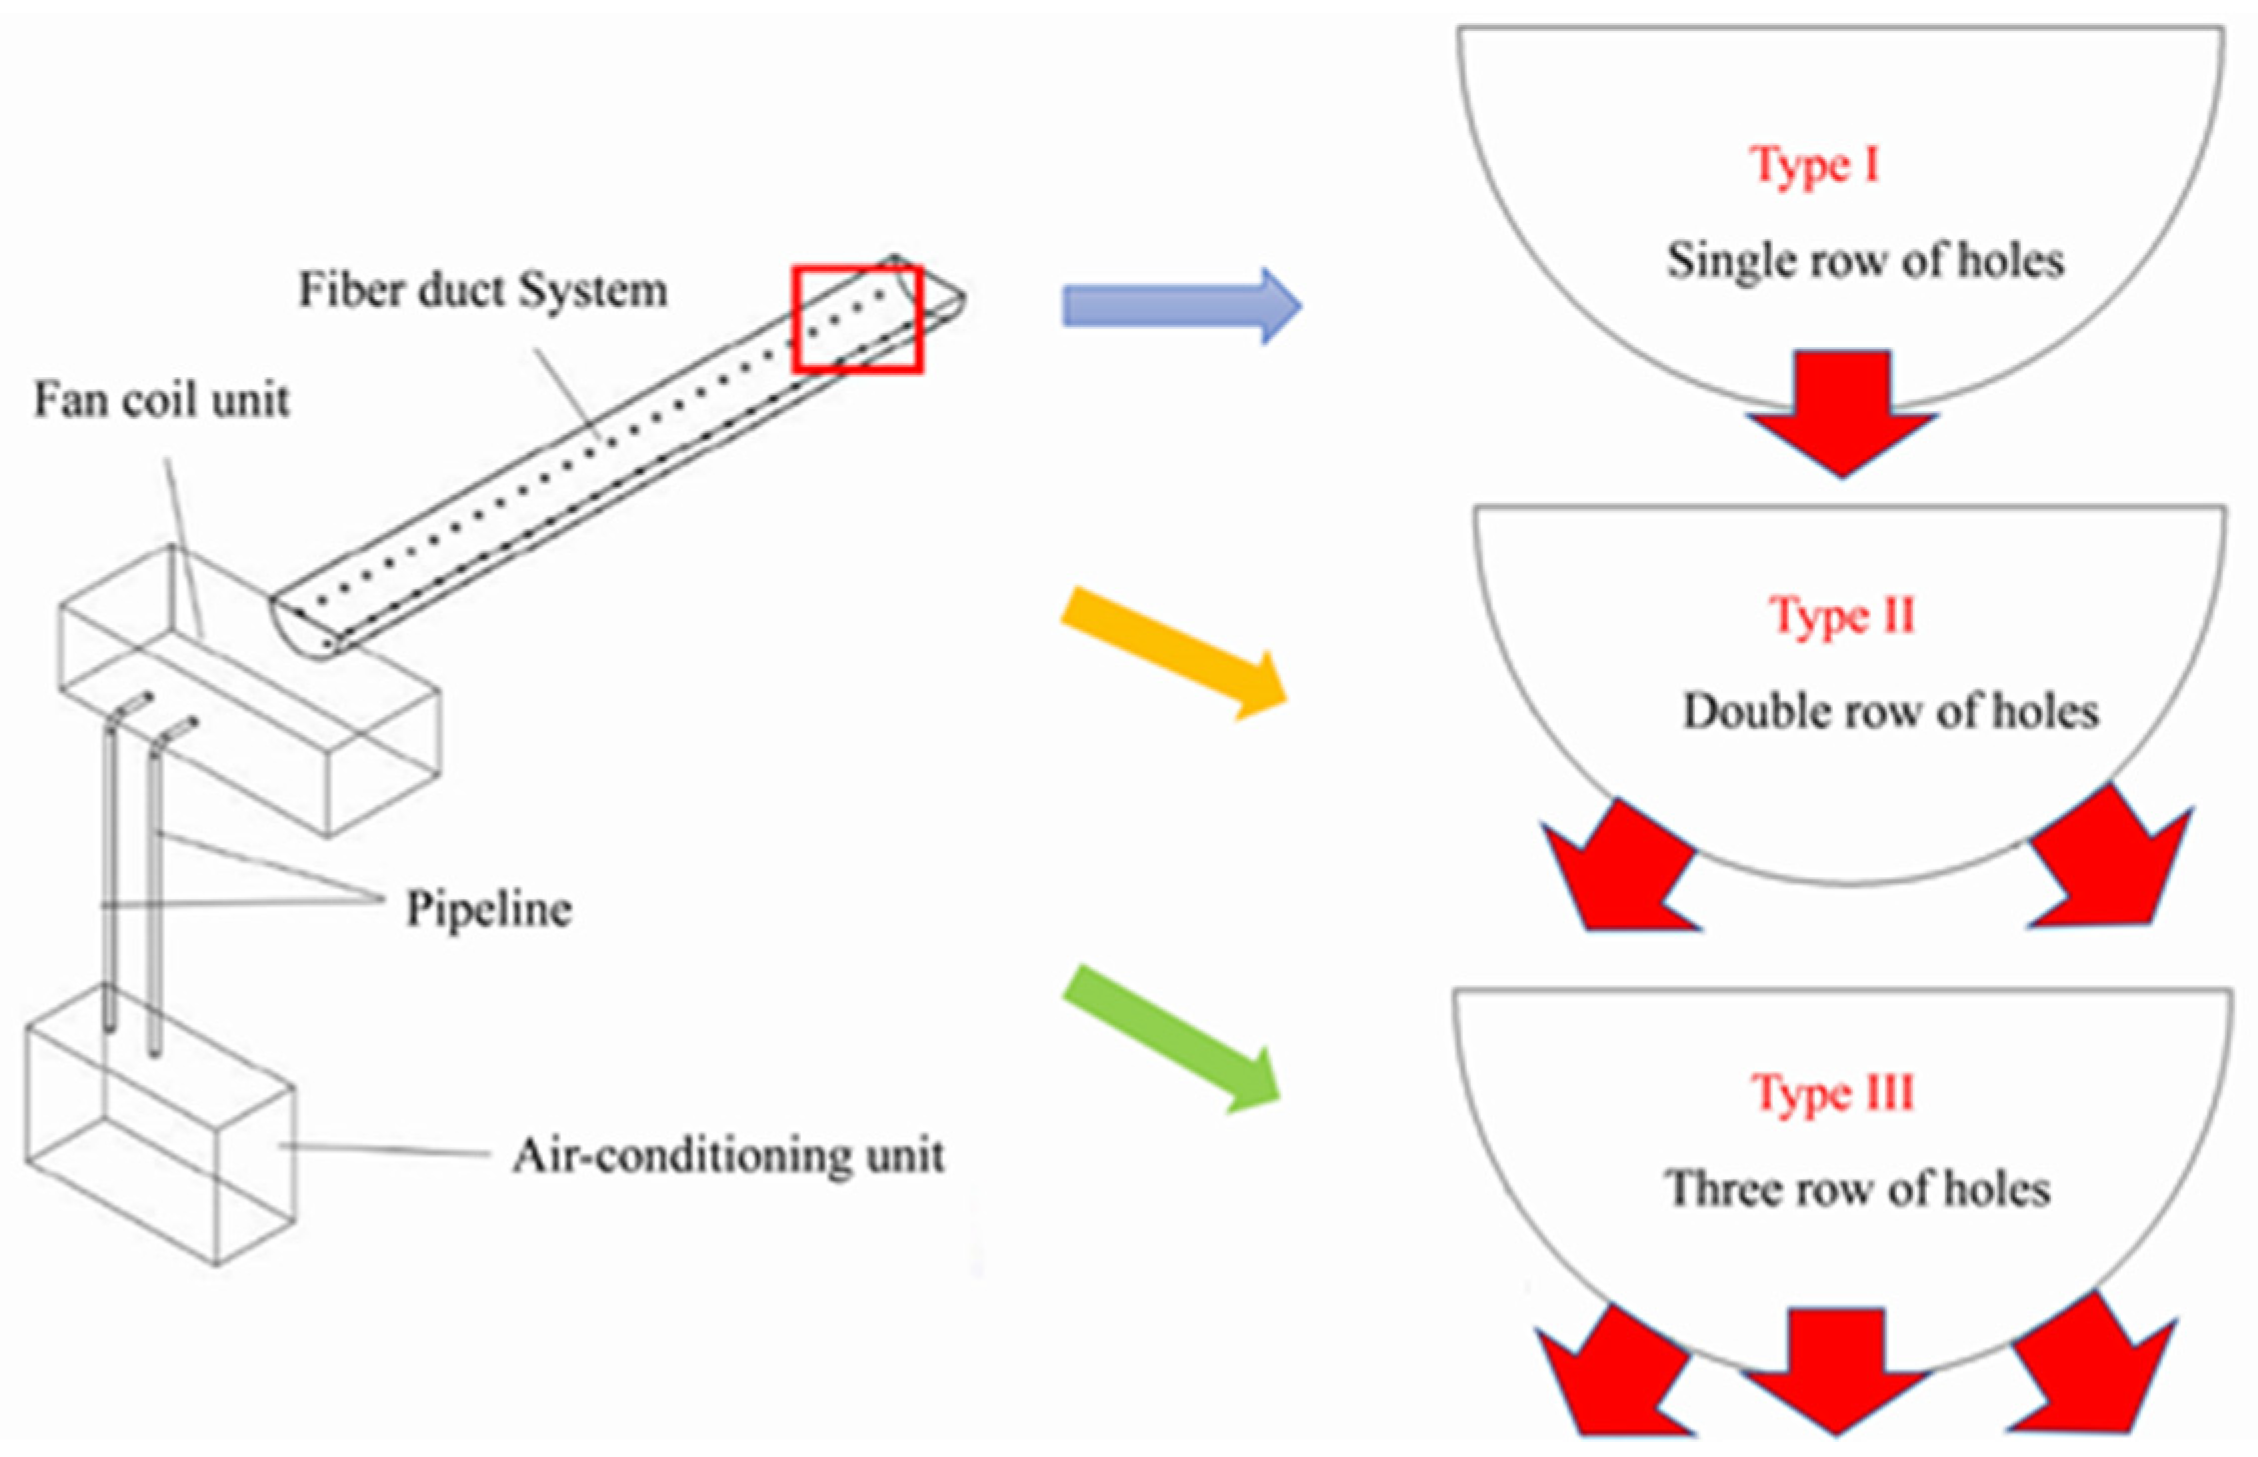
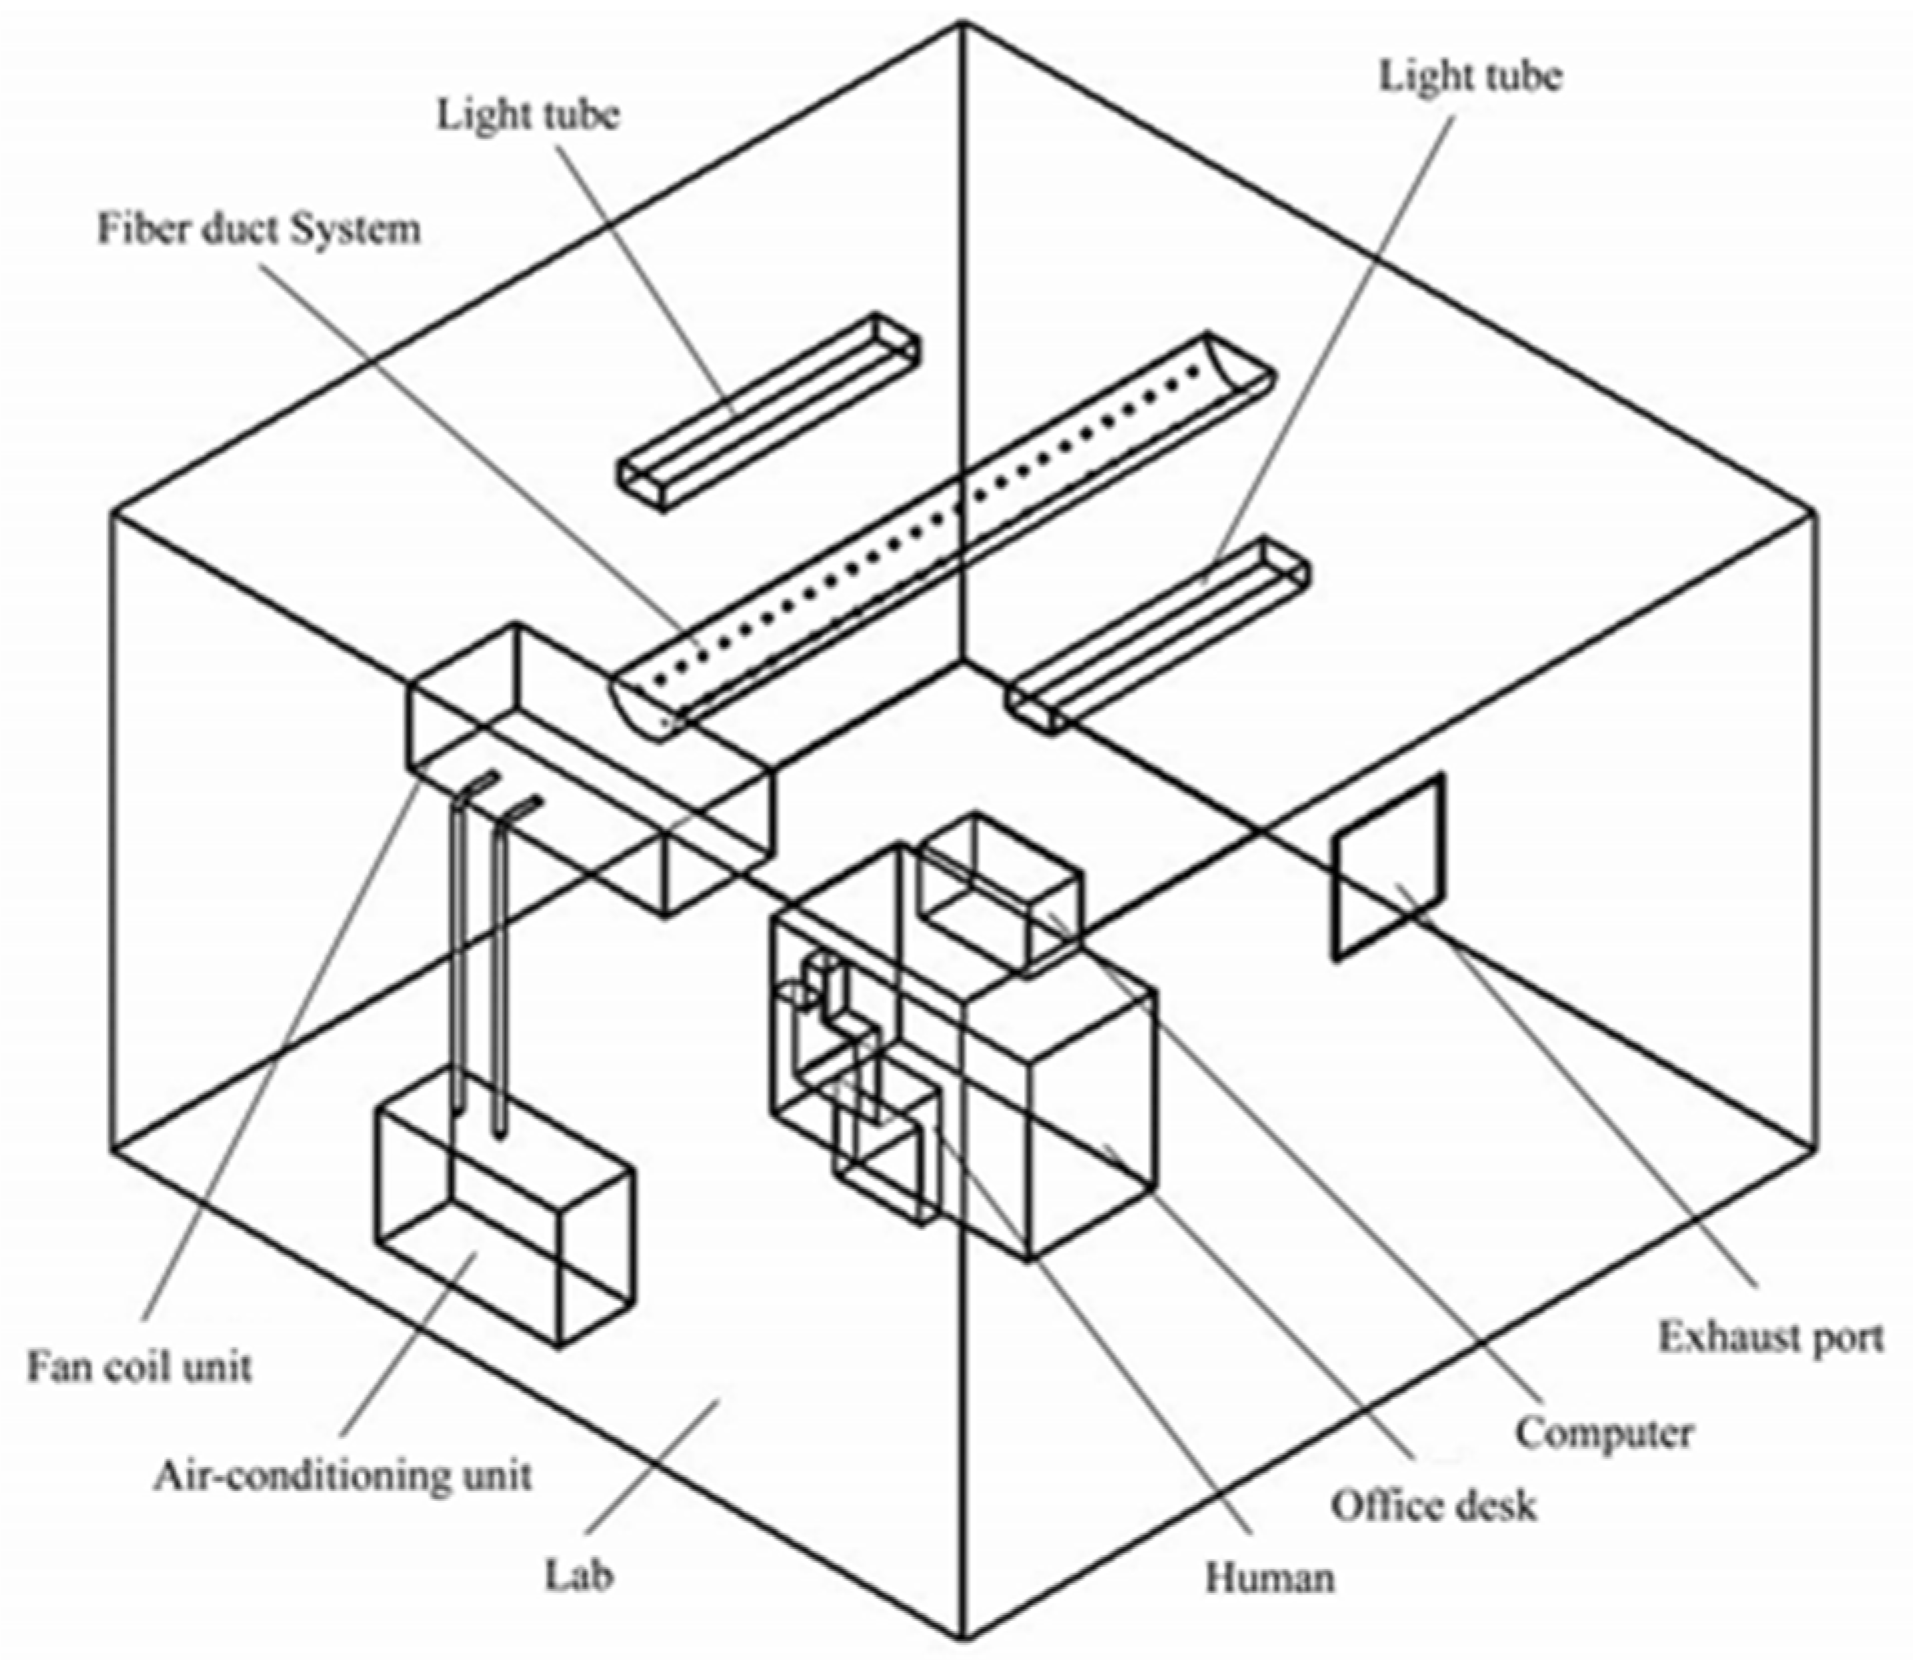
2.1. Physical Model Settings

The split-fiber-distribution air conditioner built in the laboratory was mainly composed of an outdoor unit, an indoor fan coil unit, a refrigerant pipeline, and a fiber distribution system. The room size was 4200 mm × 3600 mm × 2600 mm (length × width × height), with a fiber distribution system installed at the top of the office. The single-row hole fiber air distribution system represents the system with a single row of holes in the direction of 6-o’clock; the double-row hole fiber air distribution system represents the system with a double row of 5-o’clock and 7-o’clock directions; the three-row hole fiber air distribution system represents the system with three rows of holes in the directions of 5-o’clock, 6-o’clock, and 7-o’clock. The indoor part was mainly composed of a fan-coil unit and a fiber air distribution system. The schematic diagram of the mentioned system and the three different types of holes is shown in Figure 1.
The sitting height of the people in the room was 1100 mm, and the total height of the desk and computer was the same as the height of the human body. The height of the air outlet of the split-fiber air conditioner was 1200 mm, the dimensions of length × width = 50 mm × 50 mm, and the heat flux densities of the computer, the human body, and the lamp were 150 W/m2, 47 W/m2, and 61 W/m2, respectively. The overall model of the room is shown in Figure 2.

2.2. Model Parameter Settings

A variety of air blowing analysis models were introduced to evaluate the thermal comfort of the human body in the room, combined with the actual situation, and the advantages and disadvantages of the models were compared. Finally, the PMV, PPD, and PD models proposed by Fanger [15] were used as indicators of comfort research to study the comfort of the split-fiber air conditioner. The specific calculation formulas of the PMV, PPD, and PD models are as follows:
P M V = [ 0.03 e 0.036 M + 0.028 ] { M W 3.05 × 10 3 [ 533 6.99 ( M W ) P a ] 0.42 [ ( M W ) 58.15 ] 1.7 × 10 5 M ( 5867 P a ) 0.0014 M ( 34 t a ) 3.96 × 10 8 f c l × [ ( t c l + 273 ) 4 ( t s ¯ + 273 ) 4 ] f c l h c ( t c l t a ) }
where M represents the energy metabolic rate of human body, W/m2 (1 Met = 58 W/m2), here 1.2 Met; W represents the mechanical work carried out by the human body, W/s, take W = 0 W/s; Pa represents the partial pressure of the water vapor in indoor air, kPa; ta represents the temperature of the area around the body, °C; fcl represents the clothing area coefficient; ts represents the mean radiant temperature, °C; tcl represents the average radiant temperature of the outer surface of the clothed human body, °C; hc represents the convective heat transfer coefficient, W/(m2·°C); t s ¯ represents the average ambient of radiation temperature, °C.
P P D = 100 95 exp ( 0.03353 P M V 4 0.2179 P M V 2 )
Among them, according to the recommendation of ISO (International Standard Organization) standard 7730, the percentage PPD of personnel dissatisfaction should be less than 10%, that is, less than 10% of the people in the group are allowed to be dissatisfied with the current environment; the recommended value of PMV is −0.5–0.5.
P D = ( 307.15 T a ) ( ν ¯ 0.05 ) 0.62 ( 0.37 ν ¯ T u + 3 )
where Ta represents the air temperature around the human body, K; ν ¯ represents the average wind speed, m/s, when <0.05 m/s, taken as 0.05 m/s; Tu represents the turbulence intensity, %. According to ISO7730, the PD in the personnel activity area should not exceed 15%.

2.3. Model Rationality Verification

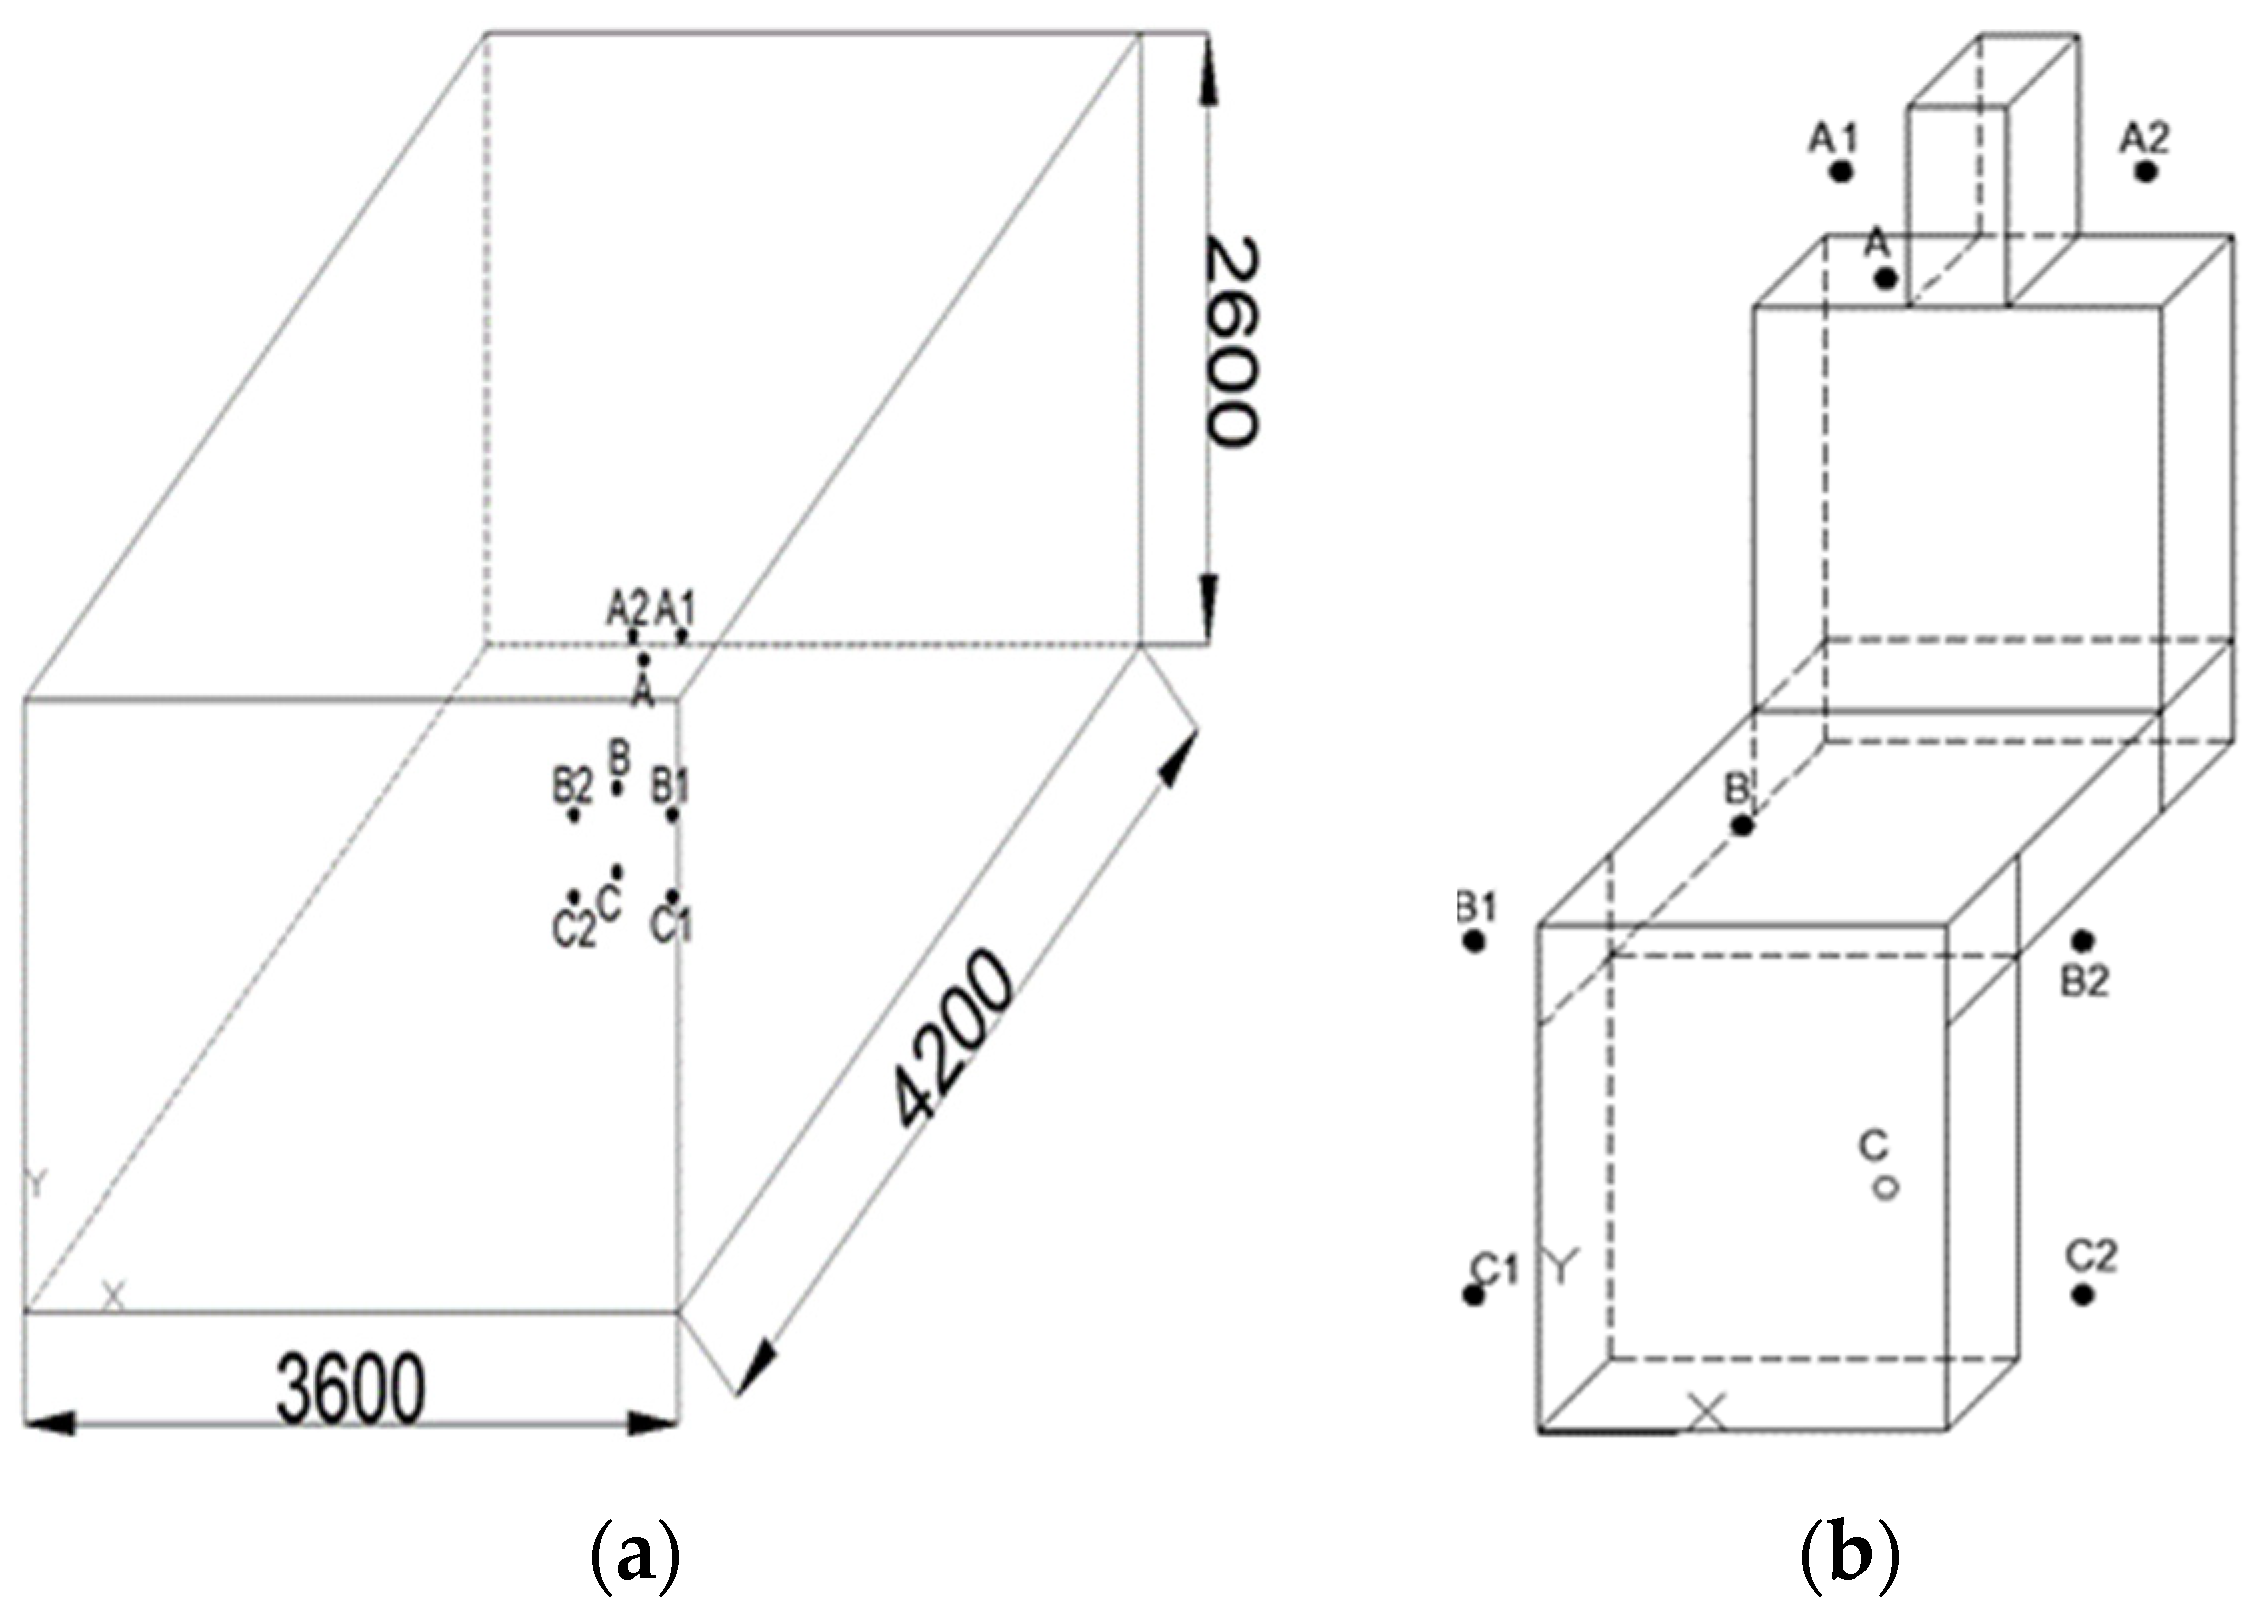
2.3.1. Setting of Human Measuring Point Positioning

During the simulation, the air-inlet boundary of the split-fiber air conditioner in the room was set to velocity-inlet, the temperature was 292.15 K, and the speed was 2.0 m/s. The treated fresh air was sent to the end of the air inlet and then entered the room through the small holes, and porous fiber gaps opened on the surface of the fiber distribution air conditioner. The walls around the room and the upper and lower walls were set as thermal insulation walls; the initial indoor ambient temperature was 303.15 K. The location of the heat source in the room and the location of the measuring point are shown in Figure 3.
The description of the measuring points is as follows: breathing area A (10 cm in front of the mouth and nose); 10 cm to the right of the right ear is A1; 10 cm to the left of the left ear is A2; 10 cm above the middle of the knee is B; 10 cm to the right of the knee is B1l 10 cm to the left of the knee is B2; 10 cm to the back of the ankle is C; 10 cm to the right of the ankle is C1; and 10 cm to the left of the ankle is C2. The actual coordinates are: A1 (2.15, 2.65, 1.0); A2 (1.85, 2.65, 1.0); A (2.0, 2.50, 1.0); B (2.0, 0.6, 2.3); B1 (2.3, 0.45, 2.35); B2 (1.7, 0.45, 2.5); C (2.0, 0.1, 2.35); C1 (2.3, 0.1, 2.35); C2 (1.7, 0.1, 2.35).

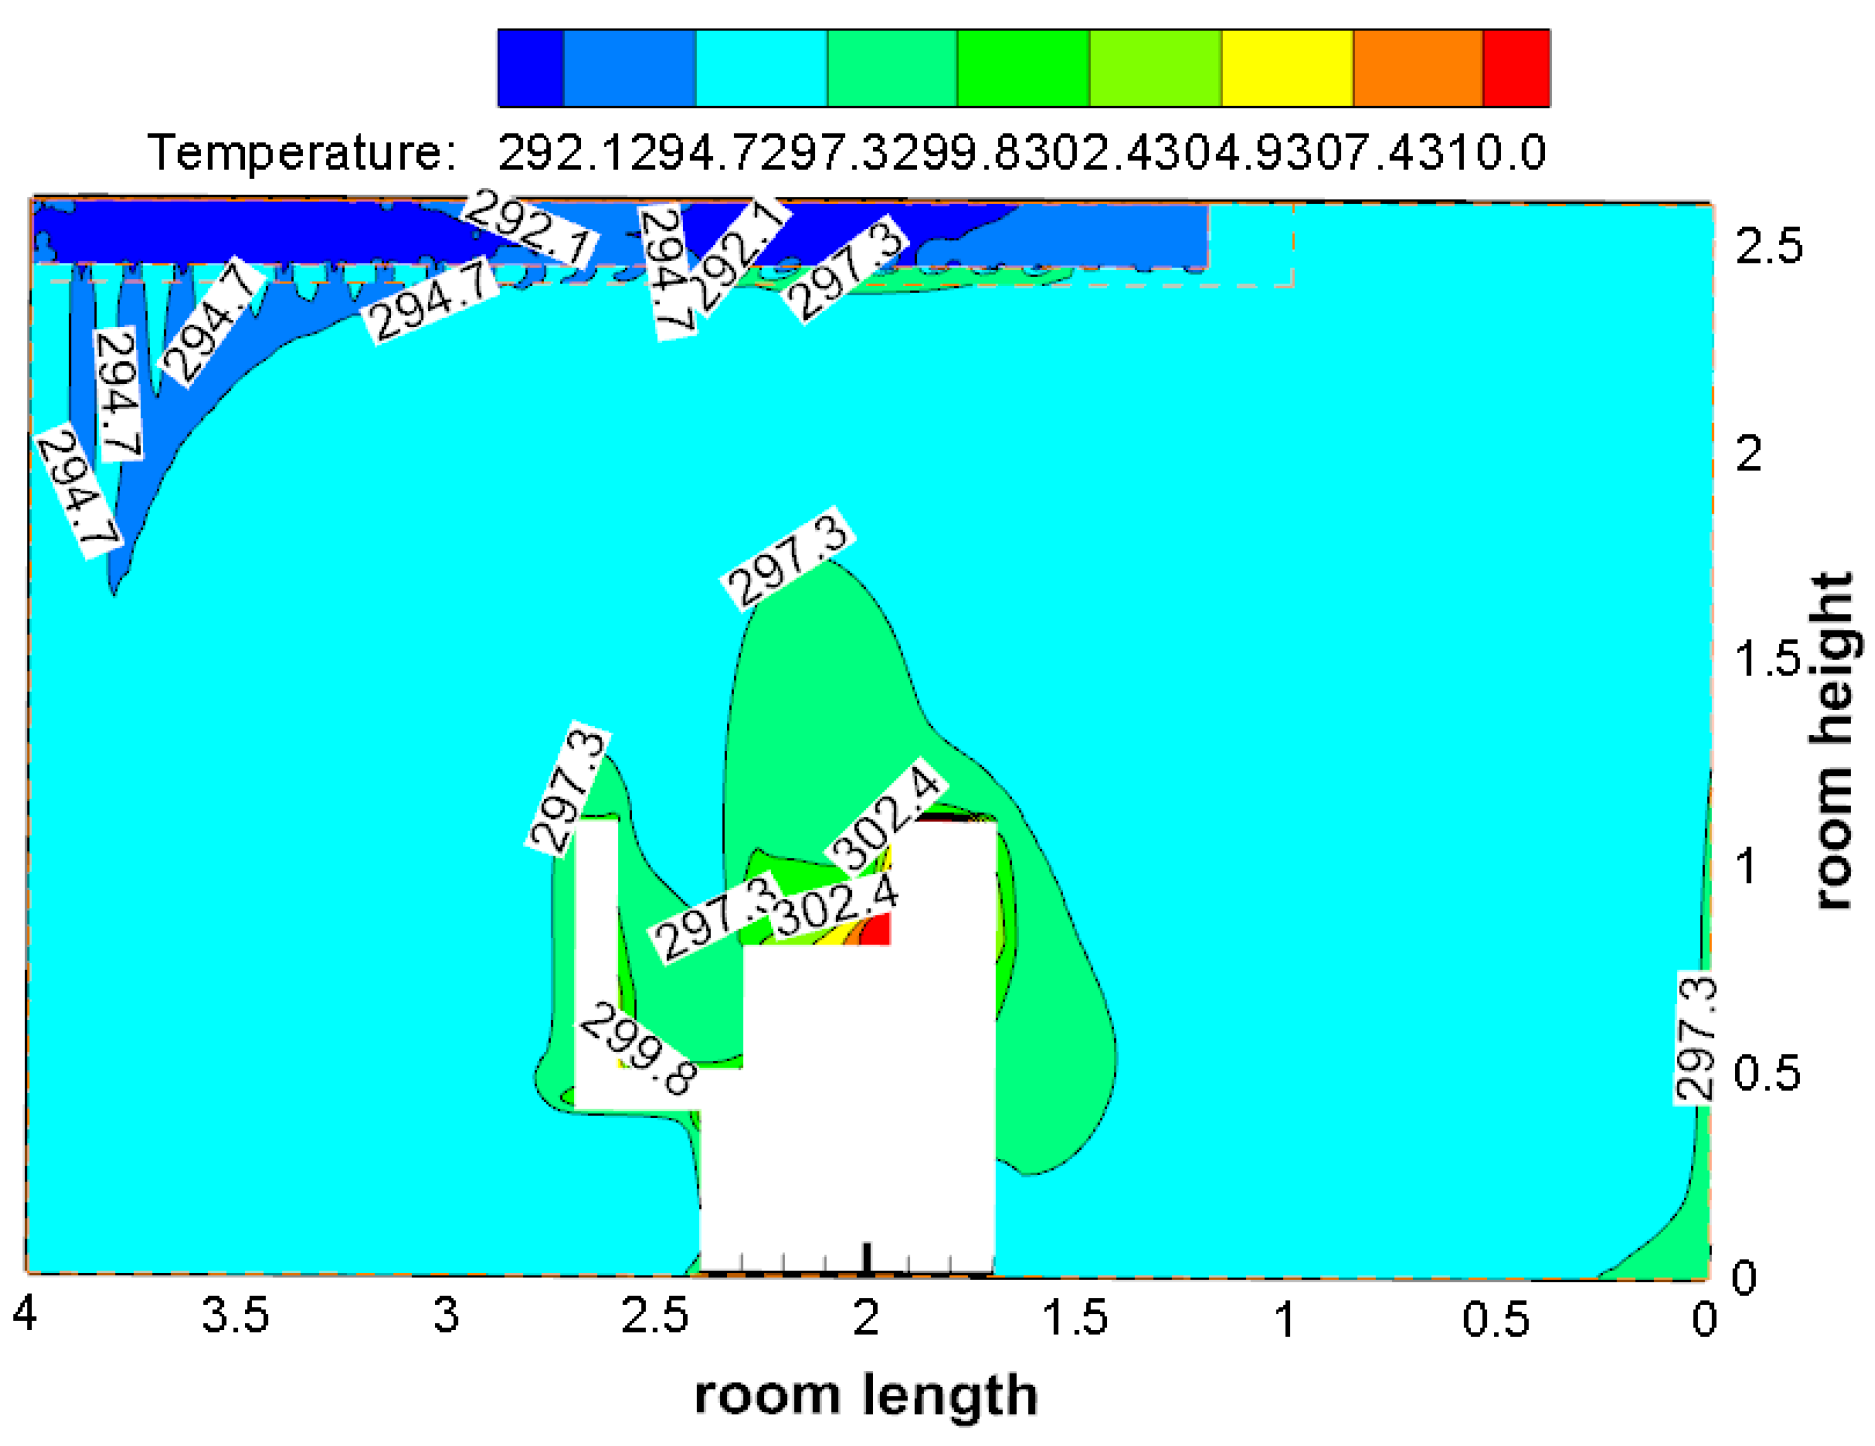
2.3.2. Analysis of the Comparative Results

The experimental cabin and its internal structure are shown in Figure 4. The dimensions of the cabin were: length 4200 mm, width 3600 mm, and height 2600 mm. The enclosure structure adopted high-efficiency thermal insulation rigid polyurethane sandwich panels, which were thermally insulated and disassembled in blocks. The fiber-air distributor used in the experiment was attached and placed at the middle of the top of the experimental cabin. The fiber distribution system had a length of 2800 mm, an inner diameter of 305 mm, an outer diameter of 307 mm, and three rows of small holes with a diameter of 20 mm and a hole spacing of 100 mm. The porosity of the fiber distribution system was 0.64.
Before the experiment, in order to maintain the consistency with the simulated initial conditions, the initial temperature inside the experimental chamber was set at 30 °C, and the relative humidity in the environment was set at 60%. During the experiment, the circulating water pump, the air-cooled water pump, and the air-conditioning unit should be turned on in sequence, and the air supply parameters should be adjusted after the operation is stable. When the internal temperature and speed of the experimental cabin appears to be stable, record the measured temperature and speed values of the corresponding measuring points on the Testo480. Then, the measuring point should be changed and the corresponding data should be recorded in turn. After measuring the temperature and velocity of the corresponding measuring points, remove the thermal-bulb anemometer and replace it with a turbulence probe. Repeat the above experimental steps to test and record the corresponding measuring points. The recorded data such as temperature, speed, and turbulence are calculated by the PMV, PPD, and PD, and the thermal comfort of the corresponding measuring point is obtained, which is used as the index of comfort evaluation. The main experimental equipment and accuracy are shown in Table 1.
Considering that each instrument has measurement errors in the experimental measurement process, the final result calculated according to the measurement value will also be affected by the accuracy of the experimental measurement. Therefore, the final error of the calculated value can be obtained in turn by using the error transfer formula.
d y = [ ( f x 1 ) 2 ( Δ x 1 ) 2 + ( f x 2 ) 2 ( Δ x 2 ) 2 + + ( f x n ) 2 ( Δ x n ) 2 ] 1 2
The formula for calculating the relative error (RE) is as follows:
R E = d y y = [ ( f x 1 ) 2 ( Δ x 1 y ) 2 + ( f x 2 ) 2 ( Δ x 2 y ) 2 + + ( f x n ) 2 ( Δ x n y ) 2 ] 1 2
In the test, the mean error (MRE) of the variable y is defined by:
M R E = 1 n R E n
where n is the number of variables.
According to the calculation results, the error of thermal efficiency did not exceed 3.5%, and the error of electrical efficiency did not exceed 5.1%. According to the calculations, the temperature error did not exceed 2.5%, the wind speed error did not exceed 4.3%, and the turbulence intensity error did not exceed 5.6%.
In the experiment, the temperature, velocity, and turbulence intensity of the air around the measuring points of the human body in the experimental cabin installed with fiber air conditioners were measured. Furthermore, the PMV, PPD, and PD of the different measuring points can be obtained by Equations (1)–(3). As shown in Figure 5, the PMV, PPD, and PD of the different measurement points were compared between the experiment and the simulation.
Due to the simplification of the space model in the simulation process, the actual space model is not completely equal to the simplified space model, for example, the height of the air duct was not completely consistent with the actual height of the room, etc., which may lead to inconsistent data in some parts. As shown in Figure 5a, there was a certain difference in the PD in the area around the knee, but the PD values in the measurement point area were all less than 15%, which meet the recommended range of AHARE 1993 and belong to the range where the human body has no sense of blowing.
As shown in Figure 5b, the distribution of the PMV for each part of the human body could be obtained. Although the distribution of the PMV in the knee and ankle regions was slightly different, all were in the range of [−0.5, 0.5]. Table 2 shows that the PMV of each part was in the comfort zone recommended by ISO7730. Combined with Figure 5b, it can be seen that both the simulation and the actual measurement were within the same thermal comfort zone. The distribution of the PPD of each part of the human body is shown in Figure 5c. It can be seen from the figure that the PPD distribution of the two human head regions A, A1, and A2 were basically consistent, and the distribution interval was from 5% to 6%. The distribution curves of the calculated PPD values of the knee regions B, B1, and B2 were slightly different, but according to the ISO7730 recommendation, when the PPD is ≤10%, the percentage of human thermal discomfort is low, and the distribution of the human thermal discomfort percentage is ideal, so the difference between the experiment and the simulation can be ignored.
In short, although there are errors caused by uncontrollable factors (room airtightness, non-insulated walls, indoor temperature fluctuations, etc.), they have little effect on the overall PMV, PPD, and PD distribution.

3. Results and Discussion

3.1. Influence of the Number of Openings of the Split-Fiber Air Conditioners on Human Thermal Comfort

The opening angle of the single-row hole split-fiber-distribution air conditioner was 6-o’clock down to the next row of holes. The indoor velocity field simulation results are shown in Figure 6. The opening angle of the double-row hole split-fiber air conditioner was 5-o’clock and 7-o’clock downward. The simulation results of the indoor velocity field are shown in Figure 7. It can be seen from Figure 7 that when the double-row hole split-fiber air conditioner supplies air, it is affected by the opening direction (5-o’clock and 7-o’clock), and most of the air flows through the opening to the walls on both sides of the human body, but it flows up downward when encountering the wall. Because of its high speed, a vortex will form on the ground and gather here. Due to the characteristics of the porous medium of the fiber air distribution system, another part will penetrate outward from the fiber air distribution system and slowly flow to the head of the human body.
Figure 8, Figure 9 and Figure 10 show the temperature field distribution of each section in the room when the single-row hole (6-o’clock) split-fiber distribution air conditioner is working. Figure 11, Figure 12 and Figure 13 show the temperature field distribution of each section in the room when the split-fiber distribution air conditioner with double-row holes (5-o’clock and 7-o’clock) is working. Figure 14, Figure 15 and Figure 16 show the temperature field distribution of each section in the room when the split-fiber air conditioner with three rows of holes (5-o’clock, 6-o’clock, 7-o’clock) is working.
The single-row hole (6-o’clock) split-fiber air conditioner faced the head of the human body, which enabled head cooling under this condition. As shown in Figure 11, a concave temperature area formed between the human body and the computer. Overall, the temperature in the middle was low and the surrounding temperature was high. There was a concave temperature lake around the human body, and the body obviously felt cooler when the temperature was around 296.1 K. When the double-row holes (5-o’clock and 7-o’clock) split-fiber air conditioner supplied air, the opening direction of the fiber distribution system faced the area on both sides of the human body, so the temperature around the human body was relatively high, and the overall temperature difference around the human body was about 2 K. The temperature of the upper surface of the human body is about 298.1 K, and the foot part is 296.1 K, resulting in the phenomenon of warm head and cool feet. As shown in Figure 11, the temperature stratification around the human body was obvious, and the overall temperature in the room was not significantly different. Specifically, the temperature behind the human body and the area above the head was lower. In Figure 14, the temperature stratification of the split-fiber air conditioner with three rows of holes was obvious when supplying air. Precisely, the temperature fluctuation range of 0.8 m to 1.5 m around the human body was 2.5 K, the temperature of the human ankle was 297.3 K, the temperature of the back was 297.3 K, and the temperature of the front of the human body was 299.8 K.
As shown in Figure 9, the temperature on both sides of the table was slightly higher, the temperature distribution of the cross-section was symmetrical, and the temperature stratification around the human body was obvious. The temperature on the upper left was lower, and the temperature on the right was higher, which resulted in the heterogeneous effects of the body. The overall distribution was concave, and was distributed in layers from the human body to the outside. In Figure 12, a layered temperature field formed in front of the human body, and there was an obvious thermal plume rising phenomenon. In Figure 15, the indoor temperature stratification was more obvious. The temperature on the left side of the indoor human body was slightly lower, the temperature in the area on the right near the ground was obviously stratified, and the temperature near the air outlet was slightly lower.
It can be seen in Figure 10 that the temperature stratification in the area in front of the human body was very obvious, the temperature around the human body was slightly higher, and the temperature behind the human body was more uniform, but the value was slightly lower. The temperature in the middle- and lower-part of the indoor section was concavely distributed, and the temperature on the left wall was lower. As shown in Figure 13, the indoor cross section temperature distribution showed an obvious temperature stratification on the surface of the human body. The surrounding environment of the human body was also not uniform. It is clear that there was an obvious low temperature area in the left front of the human body as well as a slender funnel area in front of the human body, and the temperature was slightly higher. Although the temperature stratification of the room section in Figure 16 was obvious, the temperature difference between the left and right sides of the human body was obvious.
Combined with the formulas, the PMV, PPD, and PD of the measuring points were calculated as thermal comfort indicators. The analytical results are shown in Figure 17. It is clear that the three-row split-fiber air conditioner had a smaller blowing feeling compared with the other two fiber air conditioners. The PD around the human body fluctuated within 0–10% and the fluctuation range was small, which is in line with the ISO7730 recommended standard. In contrast, the single-row hole split-fiber air conditioner caused a strong blowing sensation in the human head area, and the PD fluctuated between 10% and 90%. For the double-row hole split-fiber air conditioner, there was also a strong sense of wind in the breathing area of the face and around the knees. The PD of the measurement point in the breathing area was about 20%, and the two sides of the knees reached 35–40%. Neither met the ISO7730 recommended standards.
From the distribution of PMV in Figure 17b, it can be seen that the three-row split-fiber air conditioner had better thermal comfort than the other two types. The fluctuation range of its PMV was −0.5–0.3, which is in line with the ISO7730 recommended standard, and the fluctuation of PMV in the knee and foot area of the human body was extremely small, which caters for the standard of homogeneity. For the single-row split-fiber air conditioner, in addition to the PMV of the human knee, which was within the thermal comfort range, the fluctuation range of the PMV of the human head and feet was −1.2 to −0.8, which is in the cool range where the human body is thermally uncomfortable. When the double-row hole split-fiber air conditioner was working, the PMV of the human head and feet fluctuated in the range of −0.5–0.3, but the PMV of the human knee was lower than −1, which was obviously in a cool state, and so does not meet the ISO7730 recommended standard.
It can be seen from Figure 17c that the distribution of the PPD around the human body was stable when the three-row hole split-fiber air conditioner supplied air. The percentage of unsatisfactory thermal comfort around the human body was within the range of the ISO7730 recommended standards. However, when the single-row hole split-fiber air conditioner was working, except for the parts around the knee and the right foot, the PPD of the other parts of the human body was higher than 25%, which did not meet the ISO7730 recommended standard. The PPD of the head and feet of the human body was within the recommended standard range of ISO7730 when the double-row hole split-fiber air conditioner supplied air. However, the PPD of both sides of the human knee was >20%, which did not meet the recommended standard of ISO7730.

3.2. The Influence of the Position of the Air Outlet on Human Comfort

The airflow temperature, velocity, and turbulence data of the measurement points in the simulation results were derived, and the PMV, PPD, and PD were calculated as thermal comfort indicators, and the influence of different air outlet positions on the human thermal comfort was analyzed. When the air outlet was set above the wall on the right side of the human body, the indoor velocity field distribution was as shown in Figure 18.
Figure 19 shows the indoor velocity field distribution when the air outlet was set below the wall on the right side of the human body. It can be seen from the figure that the bottom air outlet will directly discharge part of the air flow to the outside, and the bottom air outlet will not form many eddy currents. The other part will be blown away from the middle area of the room by inertia and form a blank airflow collision area in the middle of the room near the air outlet. The pressure difference between the two sides of the human body will cause the airflow on the left side of the human body to flow faster.
When the position of the air outlet was set in the middle of the wall opposite the human body, the indoor velocity field distribution when the split-fiber air conditioner supplied air was as shown in Figure 20. It can be seen that this position of the air outlet allowed the air to flow symmetrically inside the room. At the air inlet, the air flow was attached to the wall, and the flow rate was large. After the air blown by the split-fiber air conditioner collided with the ground, part of the air flowed along the ground to the human body, and the other part flowed along the -Z direction to the air outlet.
Figure 21, Figure 22 and Figure 23 show the temperature field distribution of each section in the room when the air outlet is located at the upper part of the wall on the right side of the human body. Figure 24, Figure 25 and Figure 26 show the temperature field distribution of each section in the room when the air outlet is located at the bottom of the wall on the right side of the human body. Figure 27, Figure 28 and Figure 29 show the temperature field distribution of each section in the room when the position of the air outlet is located at the middle of the wall opposite the human body. Figure 30, Figure 31 and Figure 32 show the temperature field distribution of each section in the room when the air outlet is located at the middle of the right wall of the human body.
As shown in Figure 21, the temperature around the human body was distributed in layers with a temperature difference of 2.5 K. When the airflow on both sides of the indoor split-fiber air conditioner meets along the floor, they will collide with each other and rise to form a large upward airflow. As shown in Figure 24, the indoor temperature field distribution showed that the temperature around the human body was stratified, and the temperature difference was about 2.5 K. There was a specific low-temperature zone that was around the wall on the side of the air inlet, represented by 294.7 K approximately. As shown in Figure 27, the temperature field distribution was uniform as a whole. The temperature difference between the surfaces of the human body was about 3.0 K. The relative high-temperature zone was around the human body. For example, the temperature of the feet and back was about 295.1 K, and the temperature of the head and chest area was about 298.1 K. In contrast, Figure 30 shows a more uniform temperature distribution. The temperature fluctuation ranged from 0.8 m to 1.5 m around the human body was 2.5 K, illustrating precisely that the temperature on the back of the human body was 297.3 K, and the temperature on the chest was 299.8 K.
In Figure 22, there was an obvious temperature stratification phenomenon near the human body. As shown in Figure 25, the temperature near the ground was low, and the middle and upper parts can be divided into three areas. The temperature in the middle was high, and the temperature distribution on both sides of the human body was similar. As shown in Figure 28, the temperature stratification in the area around the human body was more obvious, and compared to the left side of the human body, the right side reached a higher temperature. Regarding the relative higher layer, a distinct thermal plume appeared above the computer. From Figure 31, the temperature was slightly higher and had obvious stratification, but the distribution was uneven. Especially for the spaces around the human body, there was a phenomenon where the feet of the human body were cooler and the upper body was warmer.
As shown in Figure 23, the indoor cross-sectional temperature field was divided into three parts. The temperature in the area where the human body was located was higher, the temperature in the area in front of the human body was slightly lower, and the temperature in the area from the left side of the human body to the front wall was lower. As shown in Figure 26, the temperature layer near the human body shifted to the left, a high temperature zone appeared in the back and front regions, and the temperature in the right front and left regions of the human body was relatively lower. As shown in Figure 29, almost only the temperature of the smaller area on the back of the human body was higher while the rest of the room was slightly lower. In the temperature distribution shown in Figure 32, the temperature difference between the left and right sides of the indoor human body was obvious.
Combined with the formulas, the PMV, PPD, and PD in the simulation results of the air outlets at different positions were calculated and are shown in Figure 33. As shown in Figure 33a, when the air outlet was set in the middle of the right wall of the human body, the PD fluctuation values were all distributed between 0 and 15%. Each part of the human body had less wind blowing, which was in line with the ISO7730 recommended standard. When the air outlet was set in the middle of the wall opposite the human body, the PD distribution near the human body increased from 0 to 15% to 0 to 40%. Although there was no obvious wind blowing at the middle of the human head and knees, there was obvious wind blowing on both sides of the knees and the ankles. The PD of the measuring points on both sides of the knees were as high as 40%, and the PD of the ankles was distributed between 25% and 35%, which did not meet the ISO7730 recommended standards. When the air outlet was set on the upper part of the right wall of the human body, the head and middle of the knee did not feel any wind blowing because the PD near the right ear of the human body was 0, and the PD of the breathing area and the left ear was also lower than 10%. However, the PD on both sides of the knee and around the ankle was distributed between 20% and 40%, which were too high and did not meet the standard level. When the air outlet was set at the bottom of the right wall of the human body, the PD of the breathing area and the left ear area was close to the ISO7730 standard threshold, but did not meet the ISO7730 recommended standard.
The distribution of the PMV around the human body is shown in Figure 33b. Compared with other cases, the case of the air outlet in the middle of the right wall of the human body had a relatively stable PMV distribution, and the PMV of all parts of the human body fluctuated between −0.5–0.5, which was perfectly in line with the ISO7730 recommended standards. In contrast, the case of the air outlet at the upper part of the right wall of the human body had the largest fluctuation of PMV, and the PMV distribution ranged from −1.1 to 0.7. For some detailed parts, although the PMV of the middle position of the human knee was the largest and still within the recommended standard threshold of ISO7730, it was relatively not appropriate compared with the optimal option. When the PMV on the left side of the knee was <−1, there was a high level of cold feeling on the body, and the PMV limited the feet to a slightly cool state. The PMV in the case of the air outlet at the bottom of the right wall of the human body also fluctuated greatly. The PMVs in the middle of the knee and around the ankle were both low, and the body felt slightly colder. Compared with the other air outlet positions, the PMV of the human head area in the case of the air outlet in the middle of the wall opposite the human body was relatively stable and basically unchanged, which was close to the most comfortable state. As for the rest case, the PPD in the middle of the human knee was also not within the recommended ISO7730 standard, which means that the human body feels thermally uncomfortable.
Figure 33c shows the PPD distribution of the human thermal comfort dissatisfaction percentage. In the case of the air outlet in the middle of the right wall of the human body, the distribution of PPD around the human body was the most stable. The PPD near the human body was within the ISO7730 recommended standard threshold, and the percentage of body thermal comfort dissatisfaction was at a relatively low level. In contrast to the other cases, the PPD around the human body in the air outlet at the upper part of the right wall of the human body fluctuated greatly, ranging from 5% to 35%. The head of the human body was within the recommended standard of ISO7730, the PPD of the rest of the body was >15%, and the percentage of dissatisfaction with the thermal comfort of the human body was relatively high. In the case of the air outlet at the bottom of the wall on the right side of the human body, the PPD around the human body fluctuated the most. For the case of the air outlet in the middle of the wall opposite the human body, the distribution of the PPD around the human body was relatively stable compared to the case of the air outlet at the upper part of the right wall of the human body and the case of the air outlet at the bottom of the right wall of the human body. However, only the head was within the recommended standard of ISO7730, and the PPD of the other parts were higher than the recommended standard of ISO7730. In addition, the percentage of human body thermal comfort dissatisfaction was relatively large, and thermal discomfort was not satisfied.

4. Conclusions and Future Work

In order to further explore the human thermal comfort in an enclosed room with a distributed air conditioner installed, this paper established an enclosed room with an air conditioner coupled with an air distribution duct. Three characterization indicators of thermal comfort were determined through experiments and simulations. On this basis, the number of openings in the air distribution duct and the position of the air outlet were studied, and the state of each part of the human body was investigated in detail from the two aspects of temperature field and thermal comfort. The main conclusions are as follows:
(1)
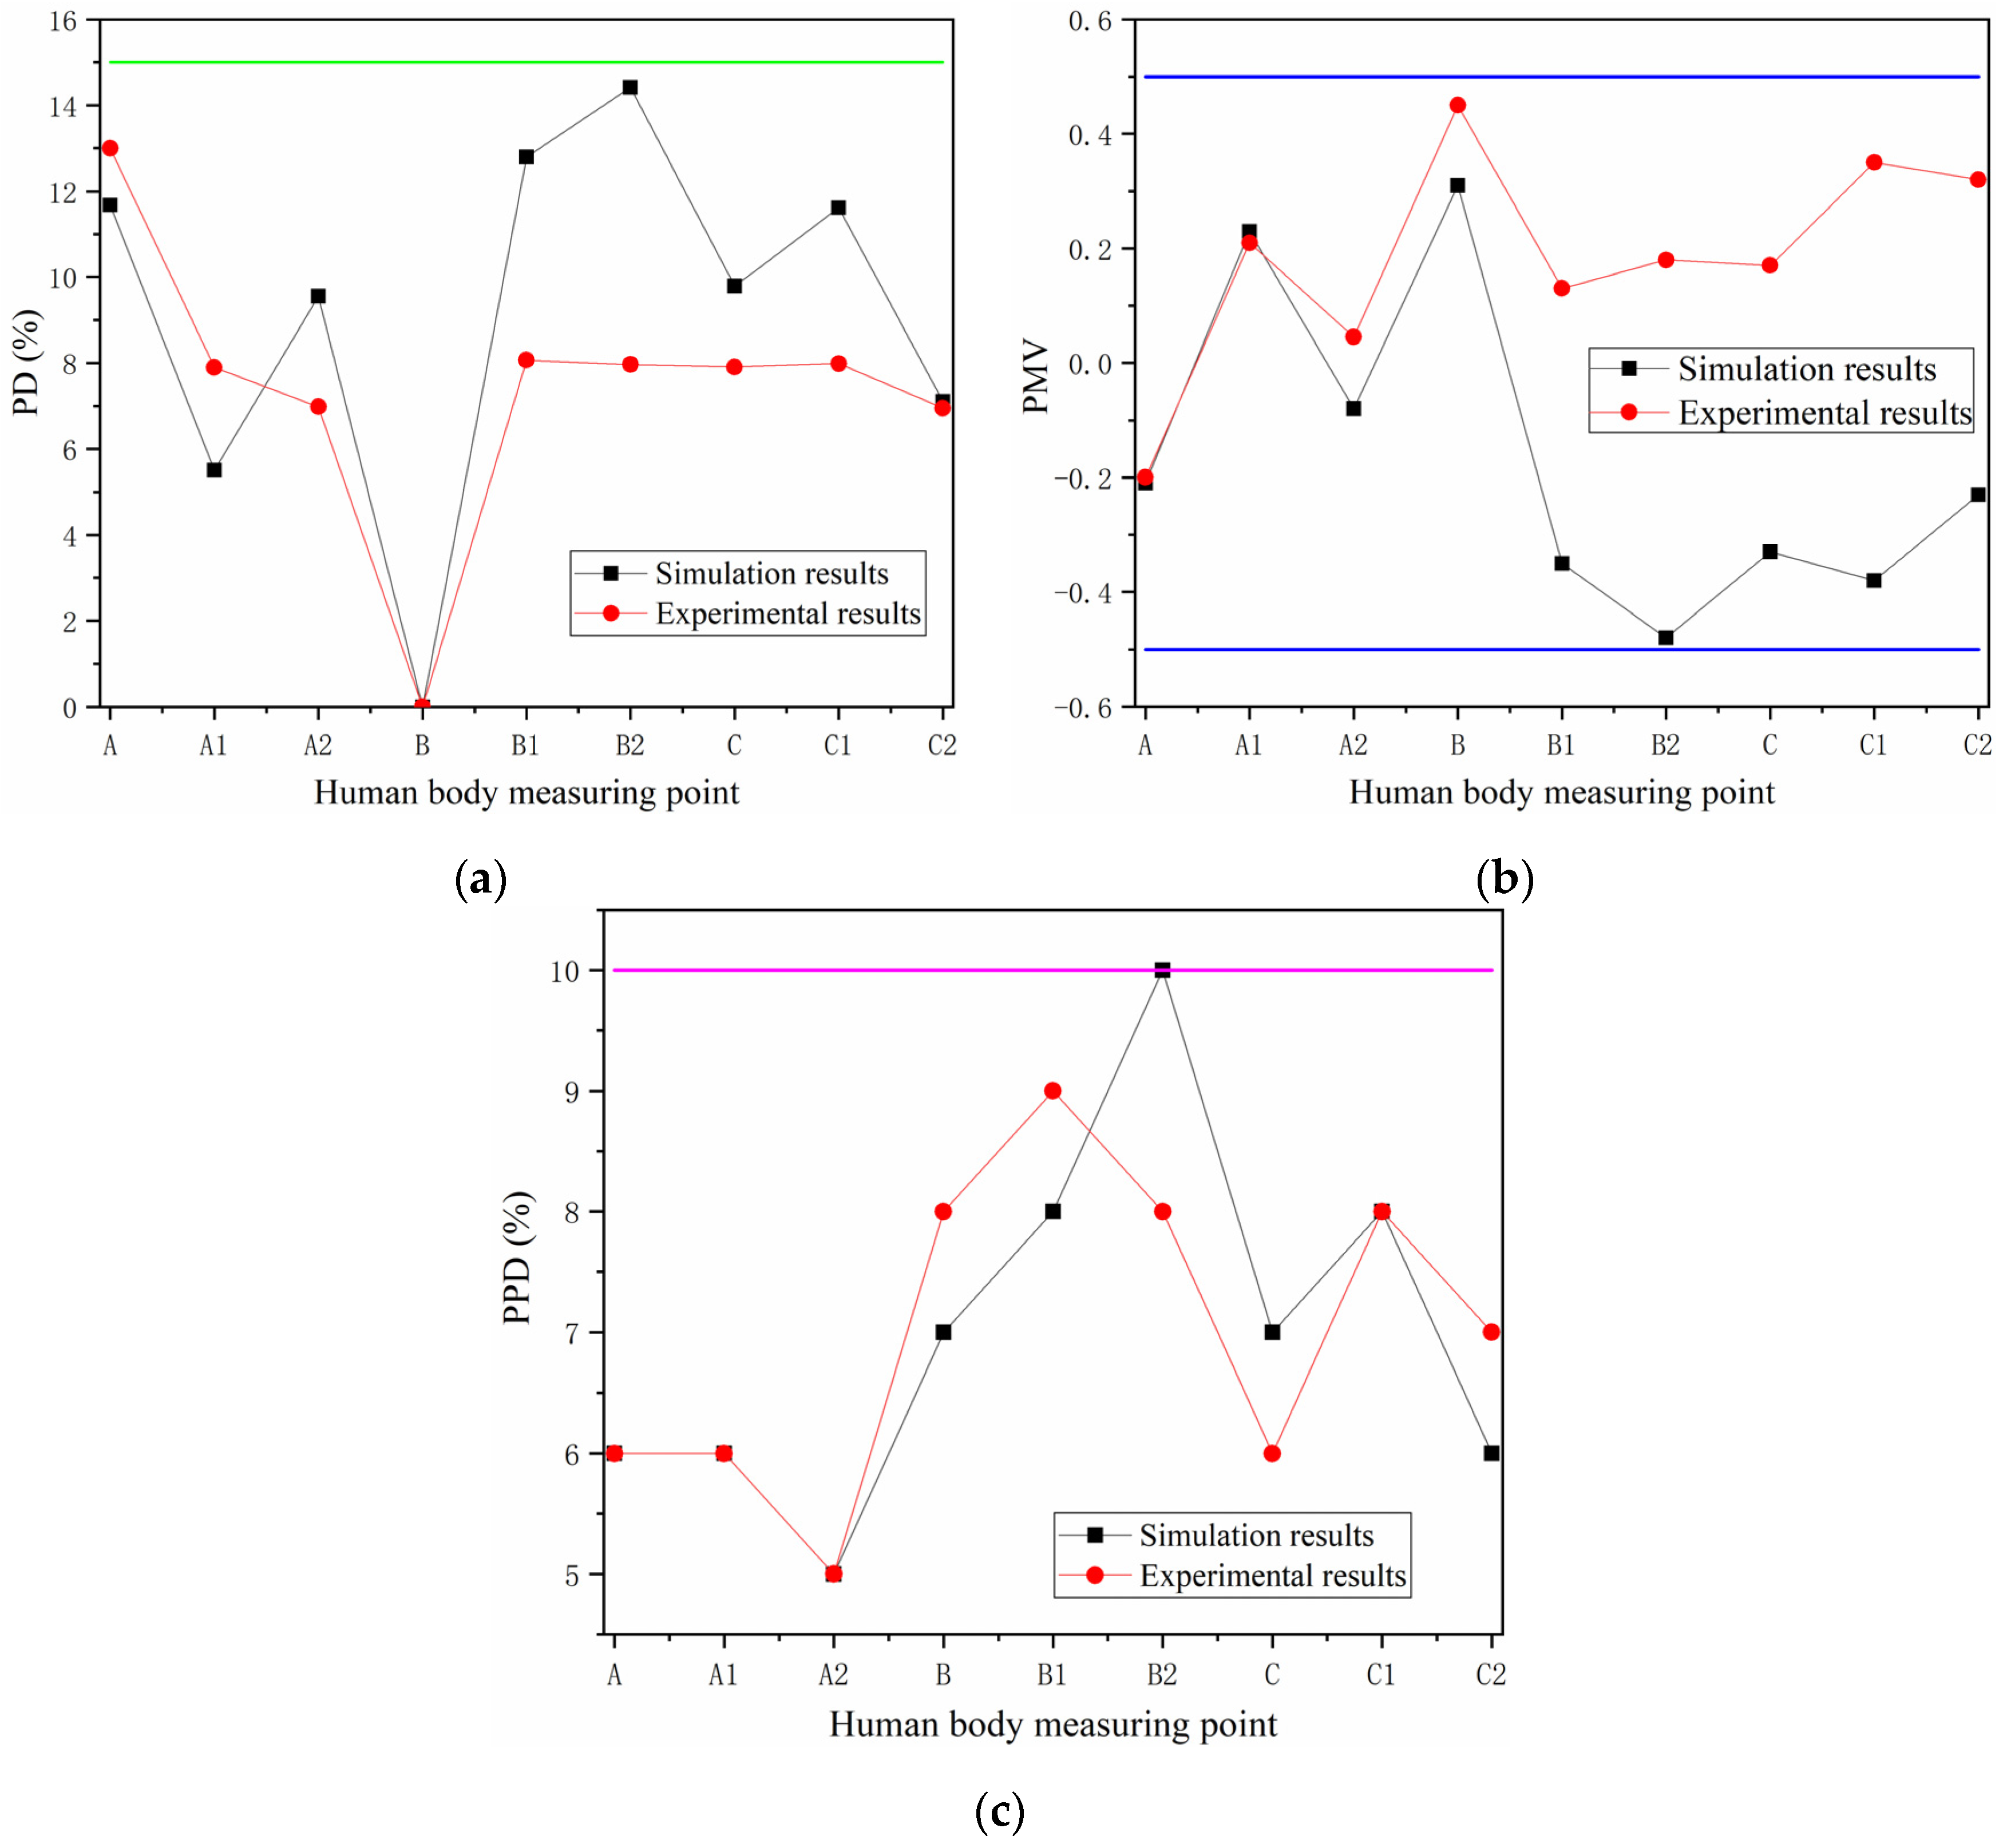
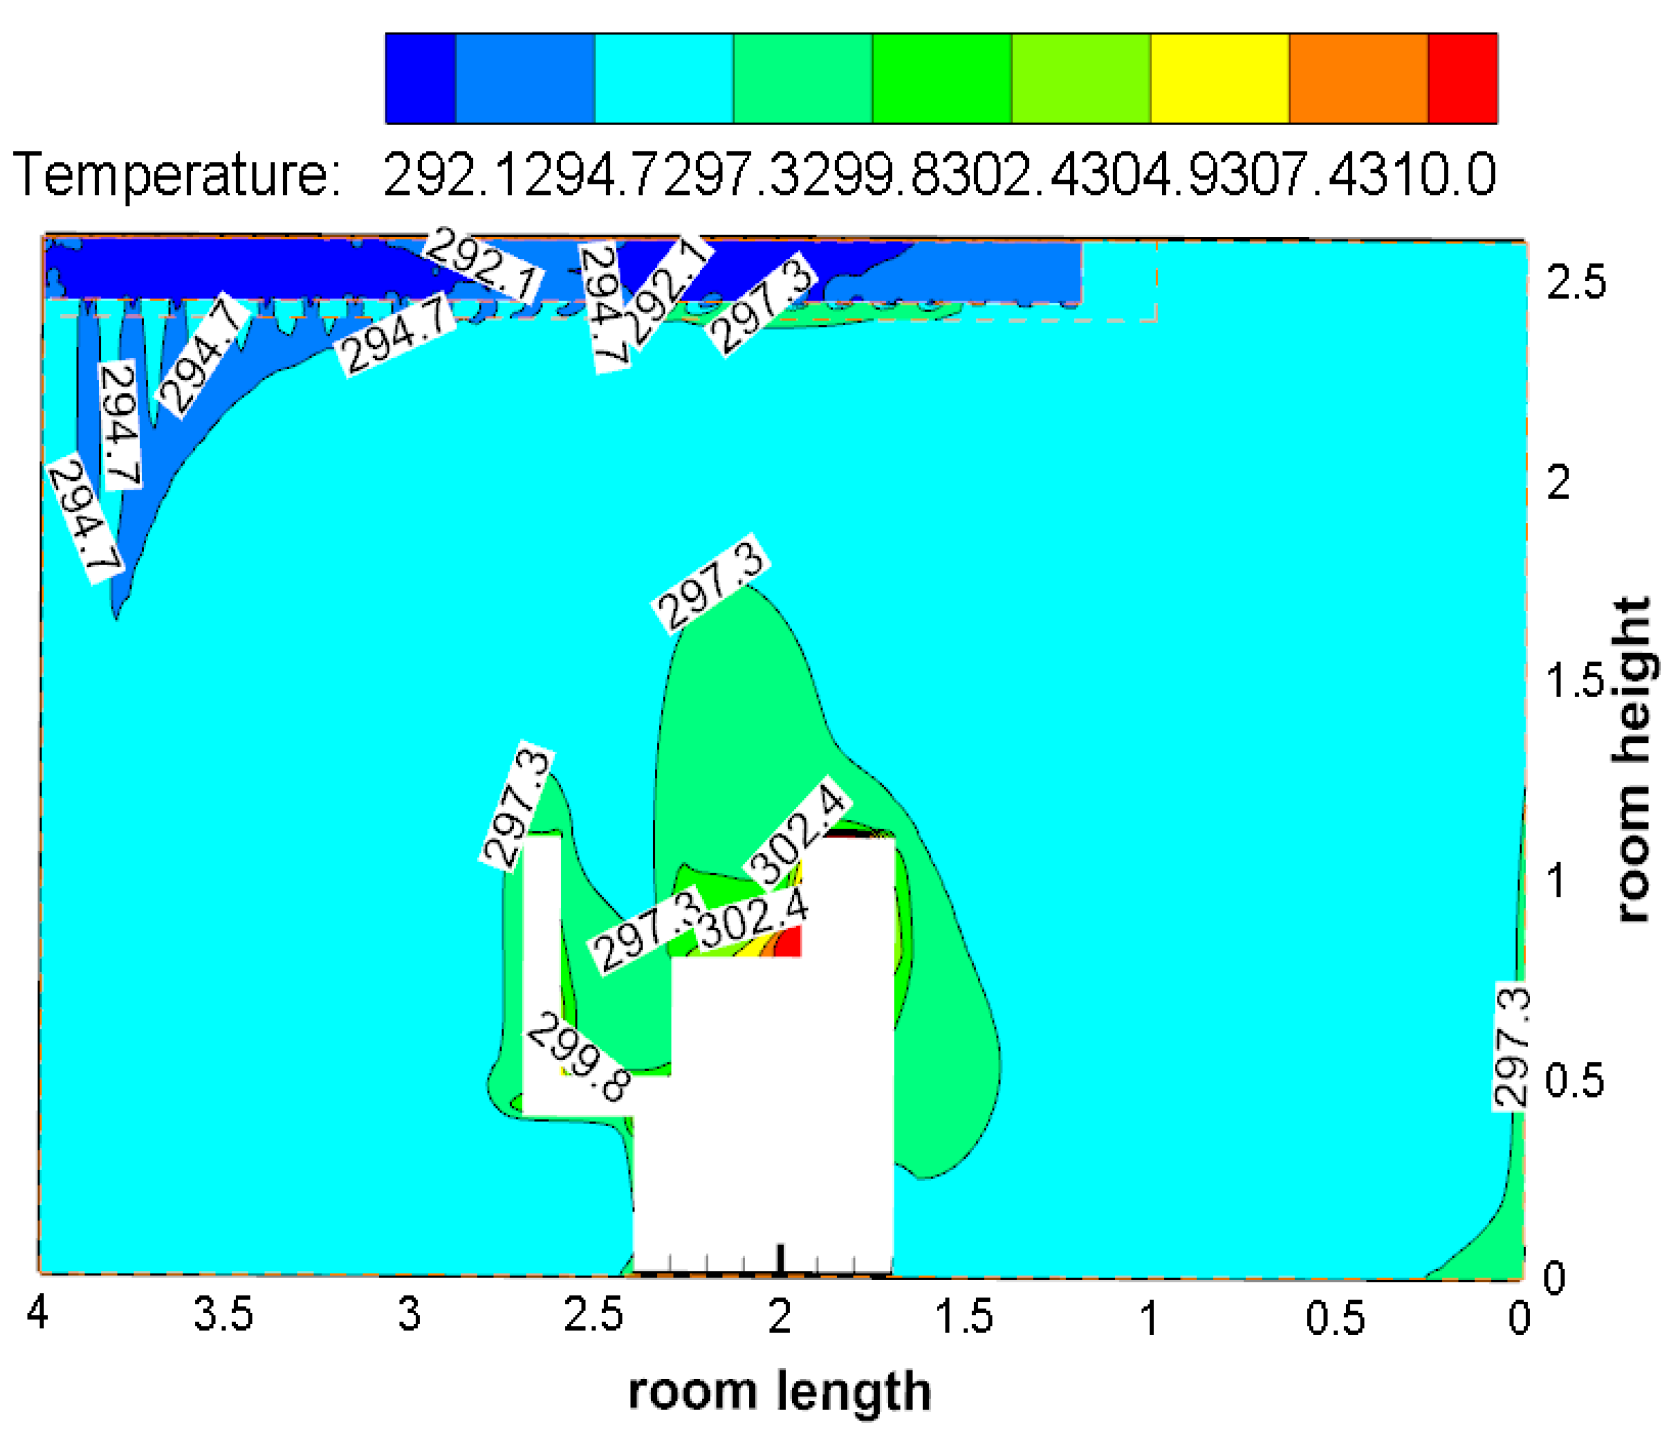
After comparing the experimental results with the thermal comfort value of the simulated data, it was found that the experimental and simulated PD trends were generally similar. The distribution of the PMV around the human body was relatively stable, and the temperature of the measuring points near the human body was more uniform during the experiment. The measured trend of the PPD around the human body was relatively slow, and the distribution range of the PPD was about 5–9%. The PPD under the simulation was large, and the PPD trend near the human knee was steep. Thus, it can be considered reasonable for the three models to characterize the thermal comfort.
(2)
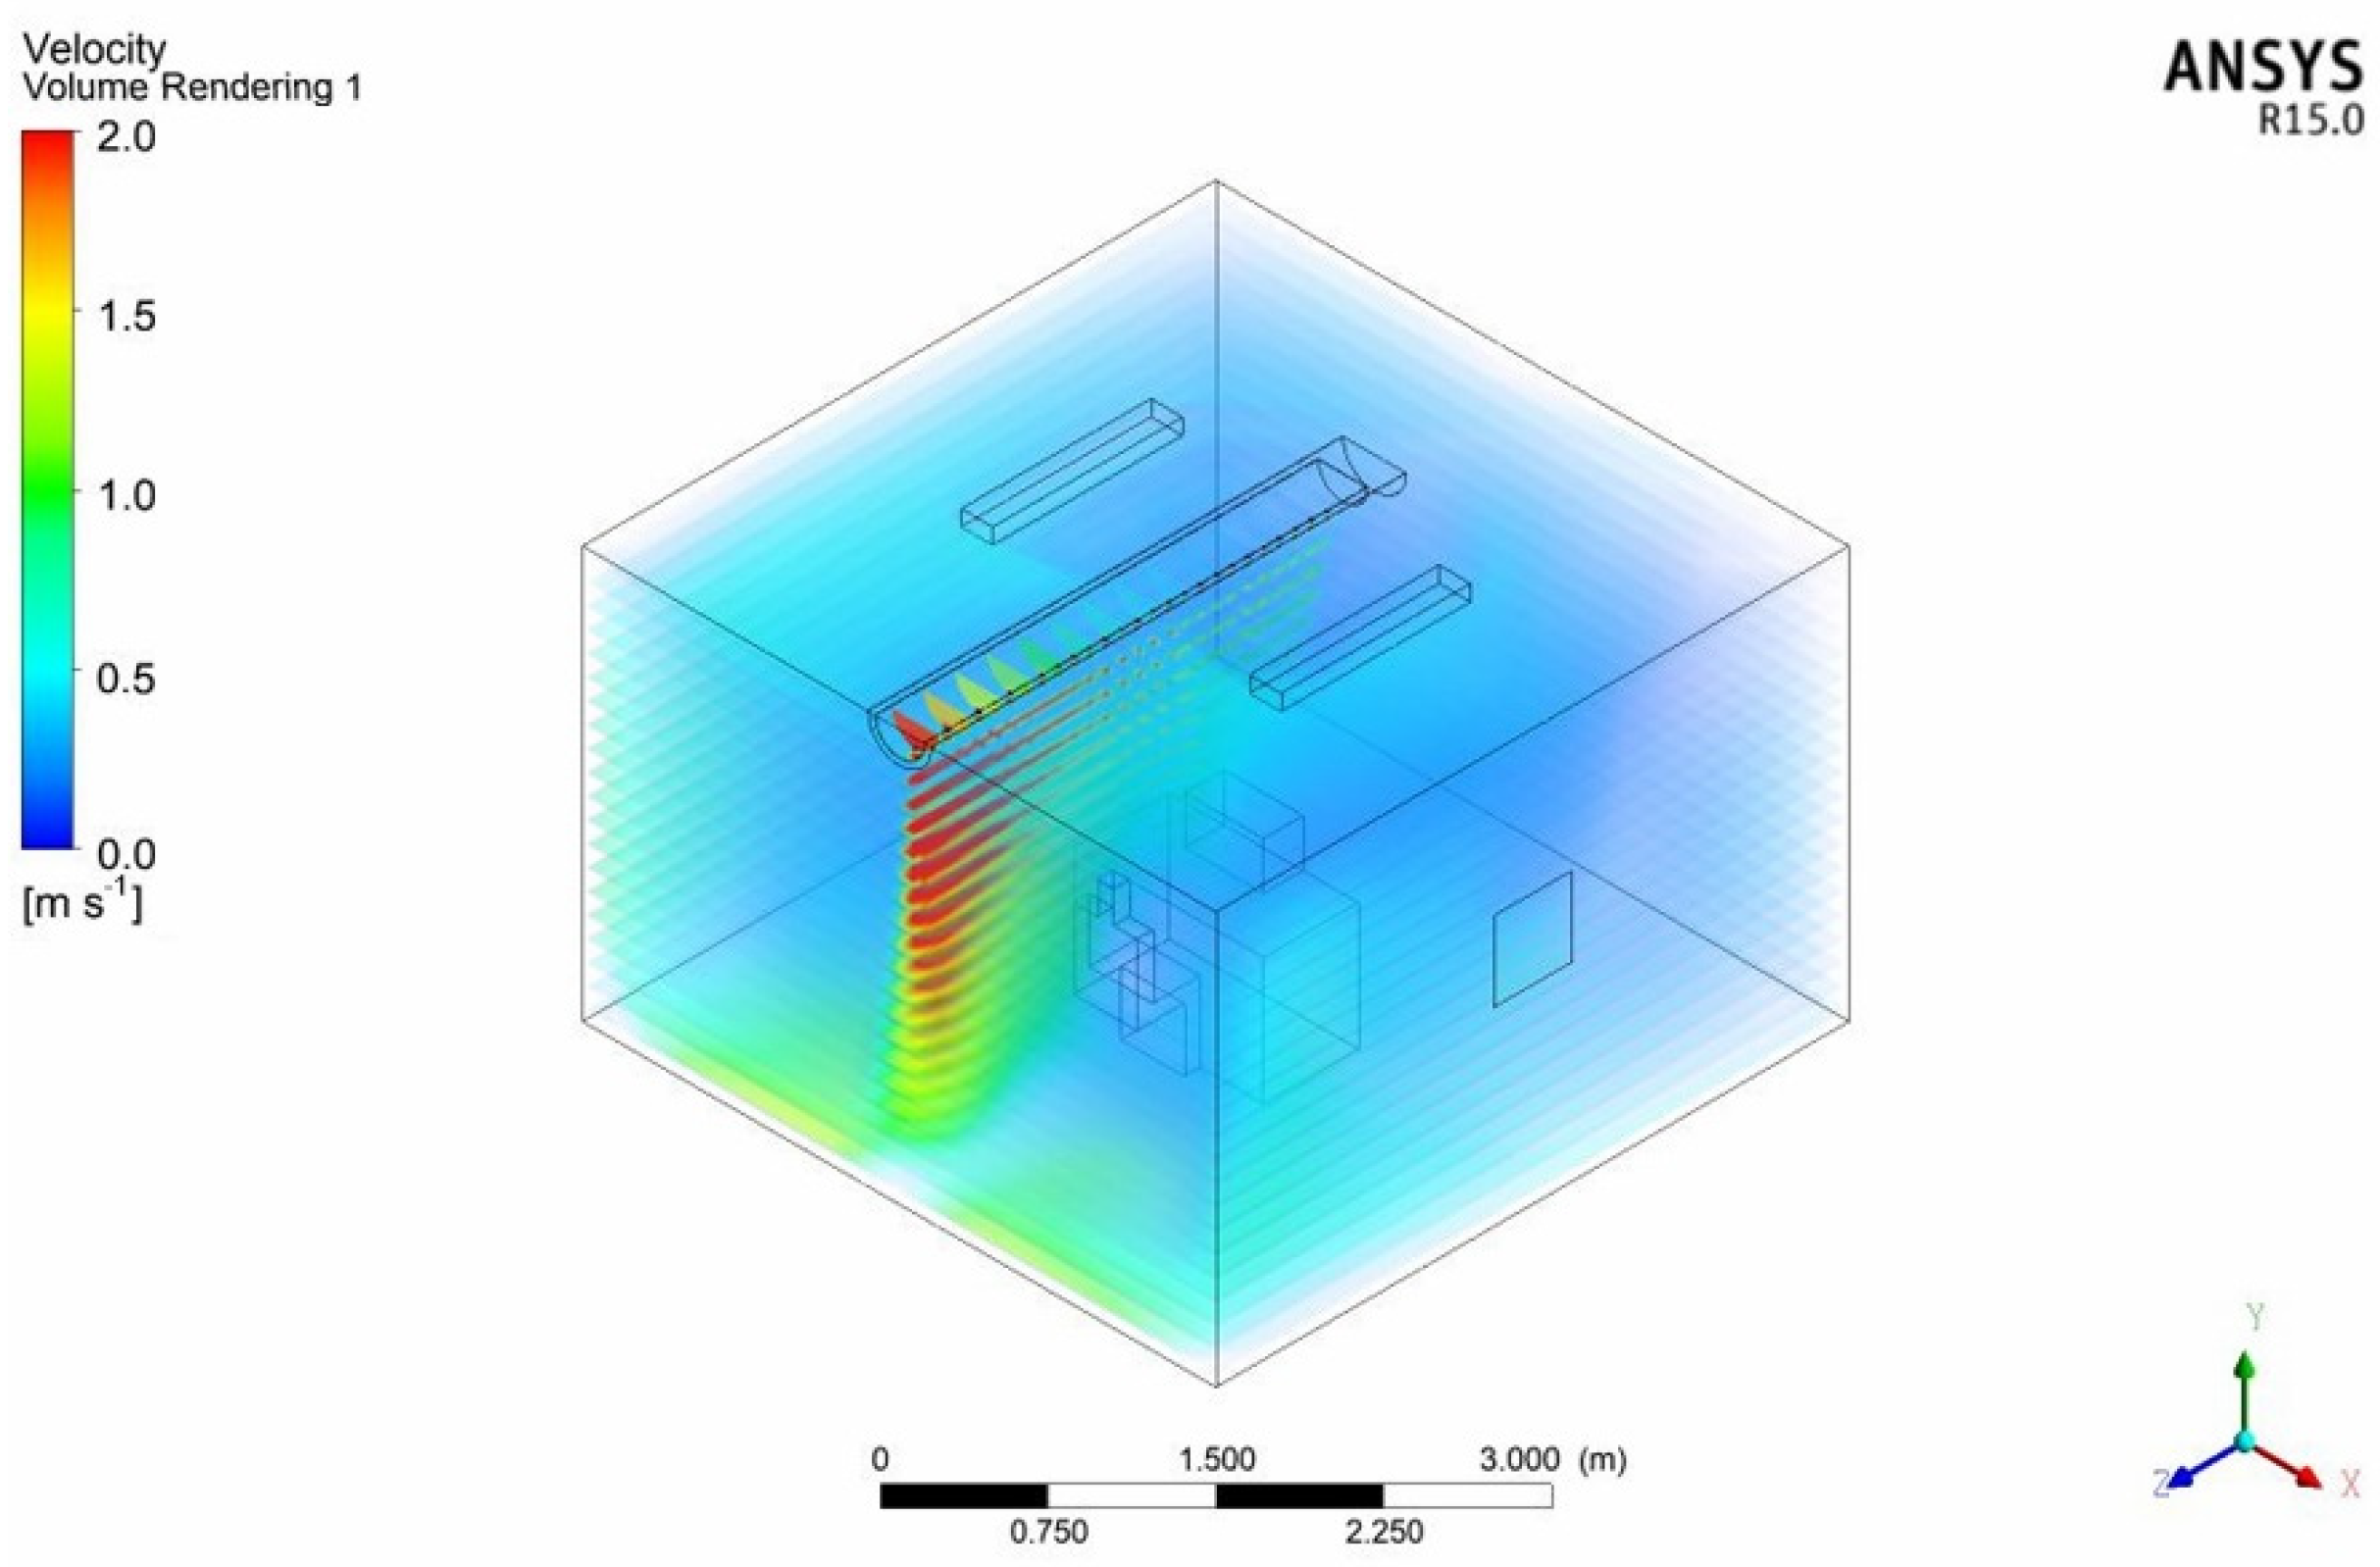
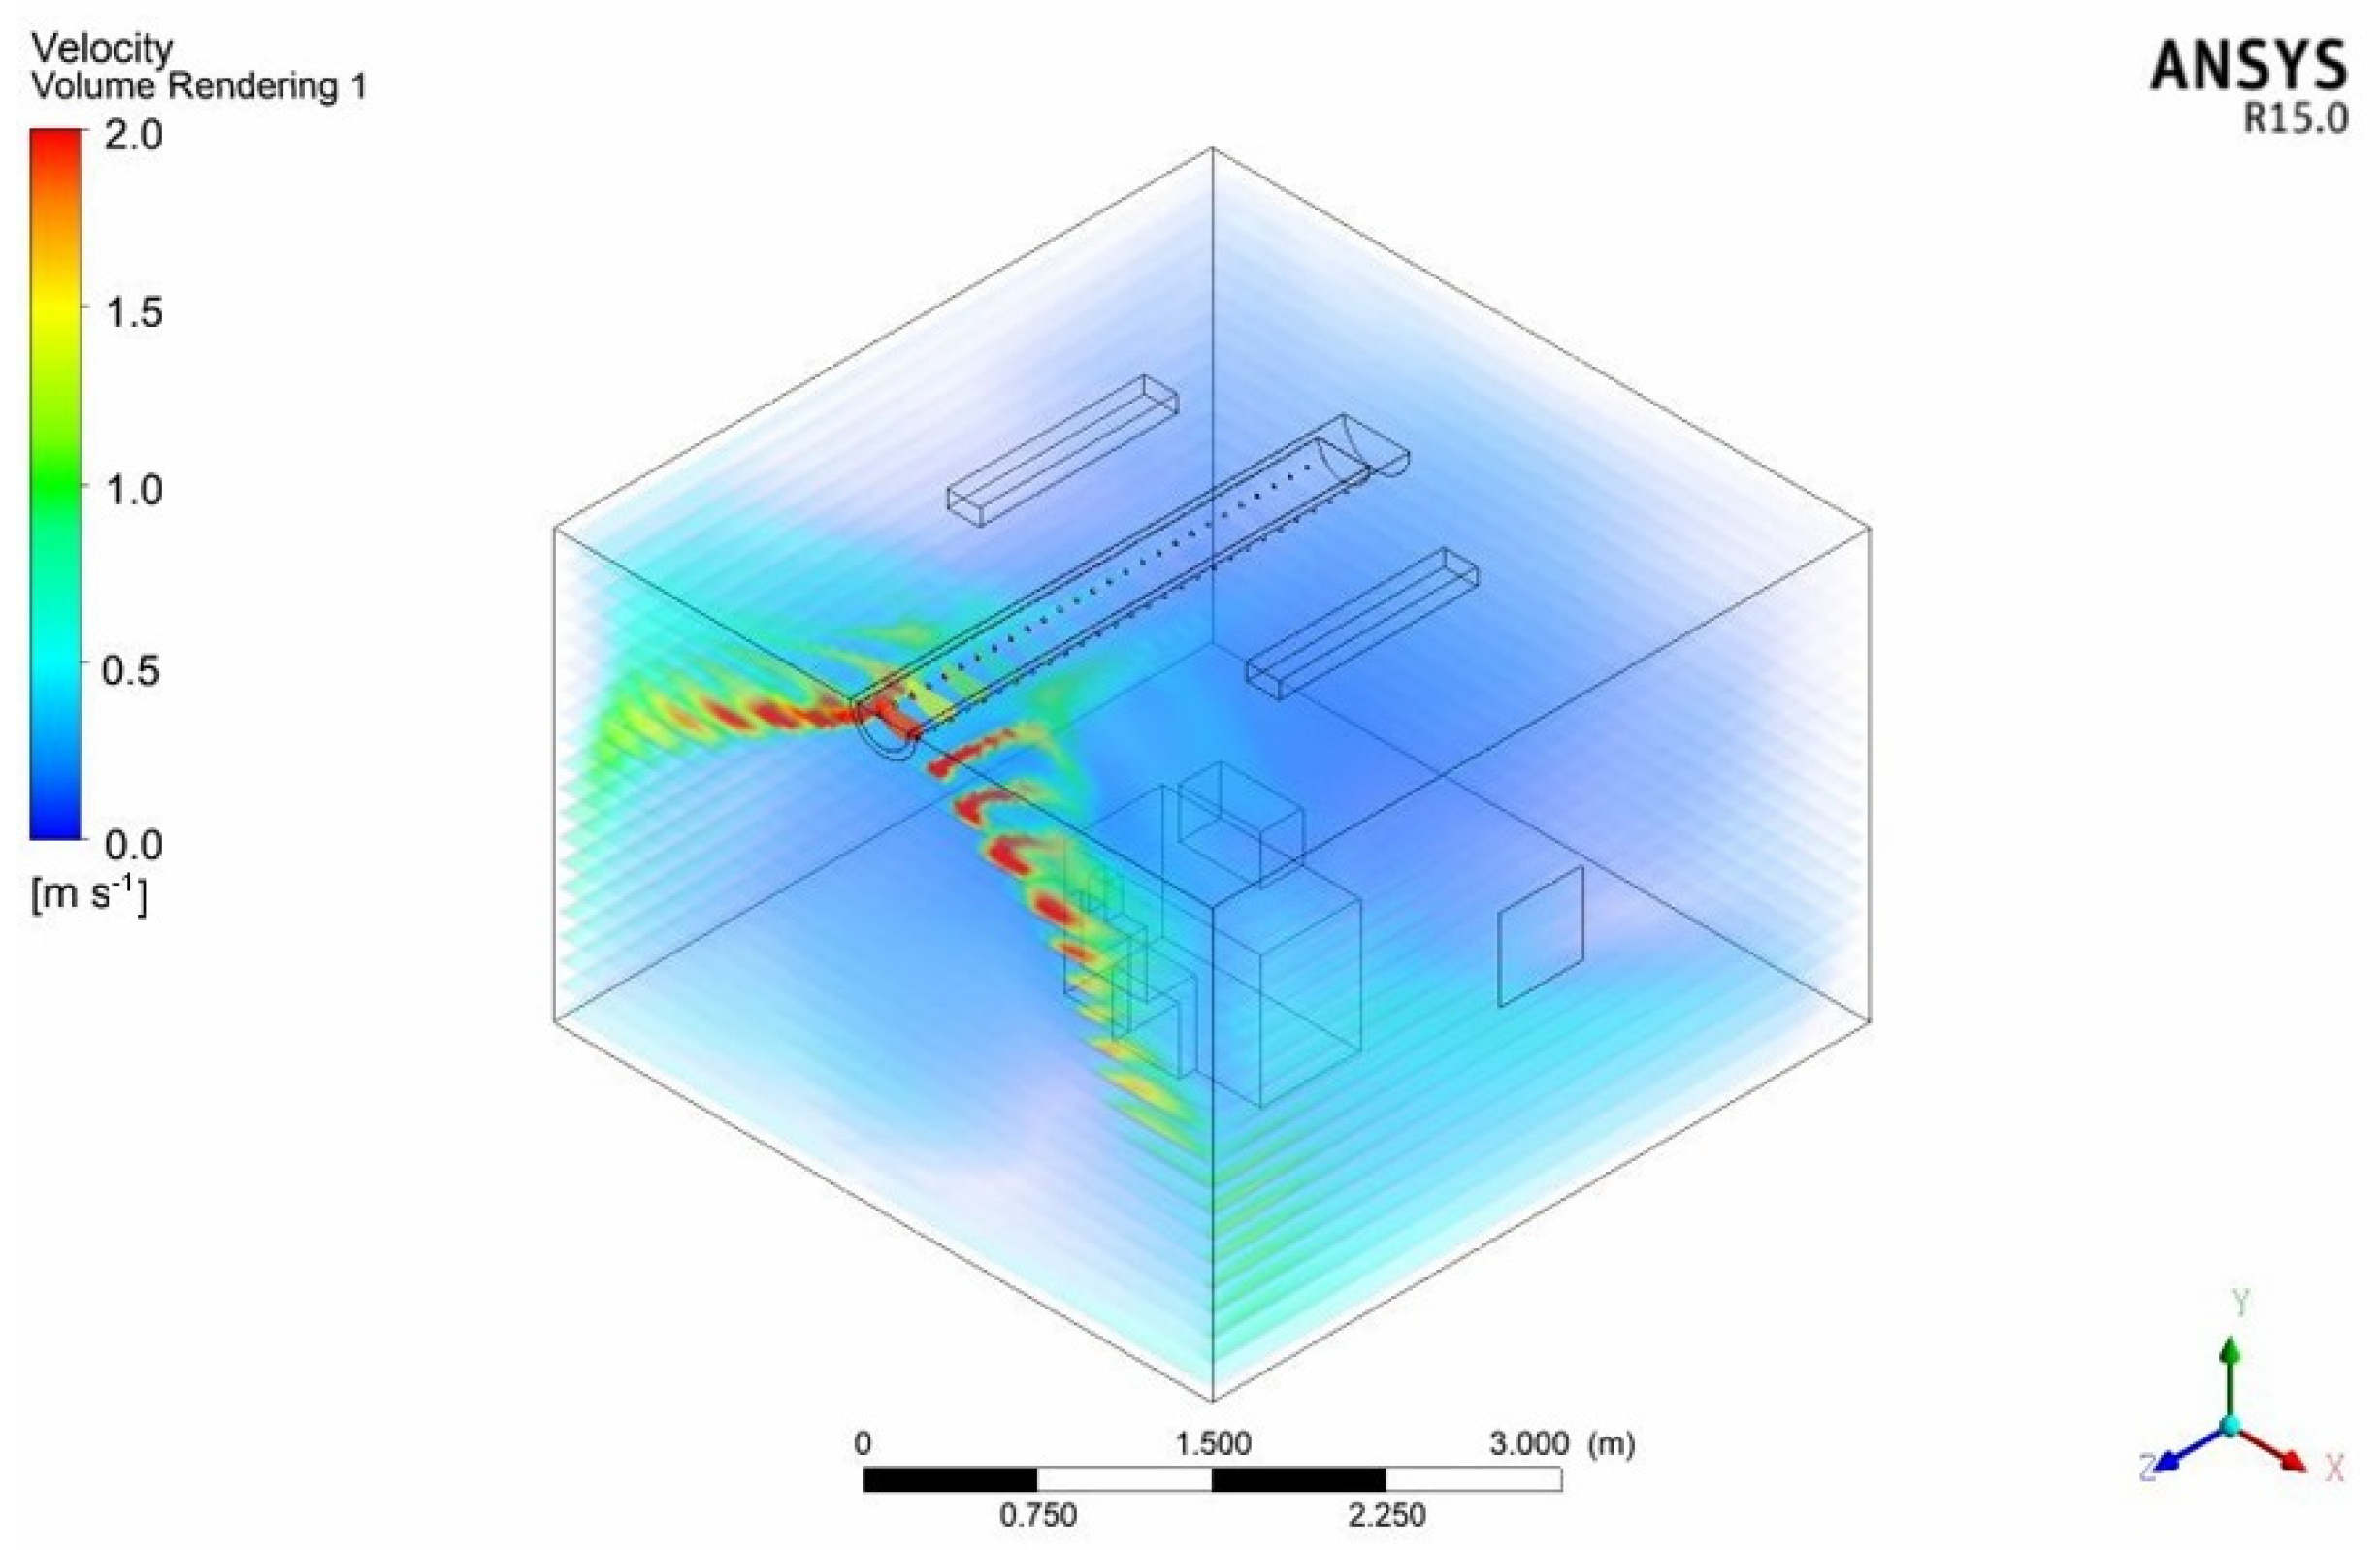
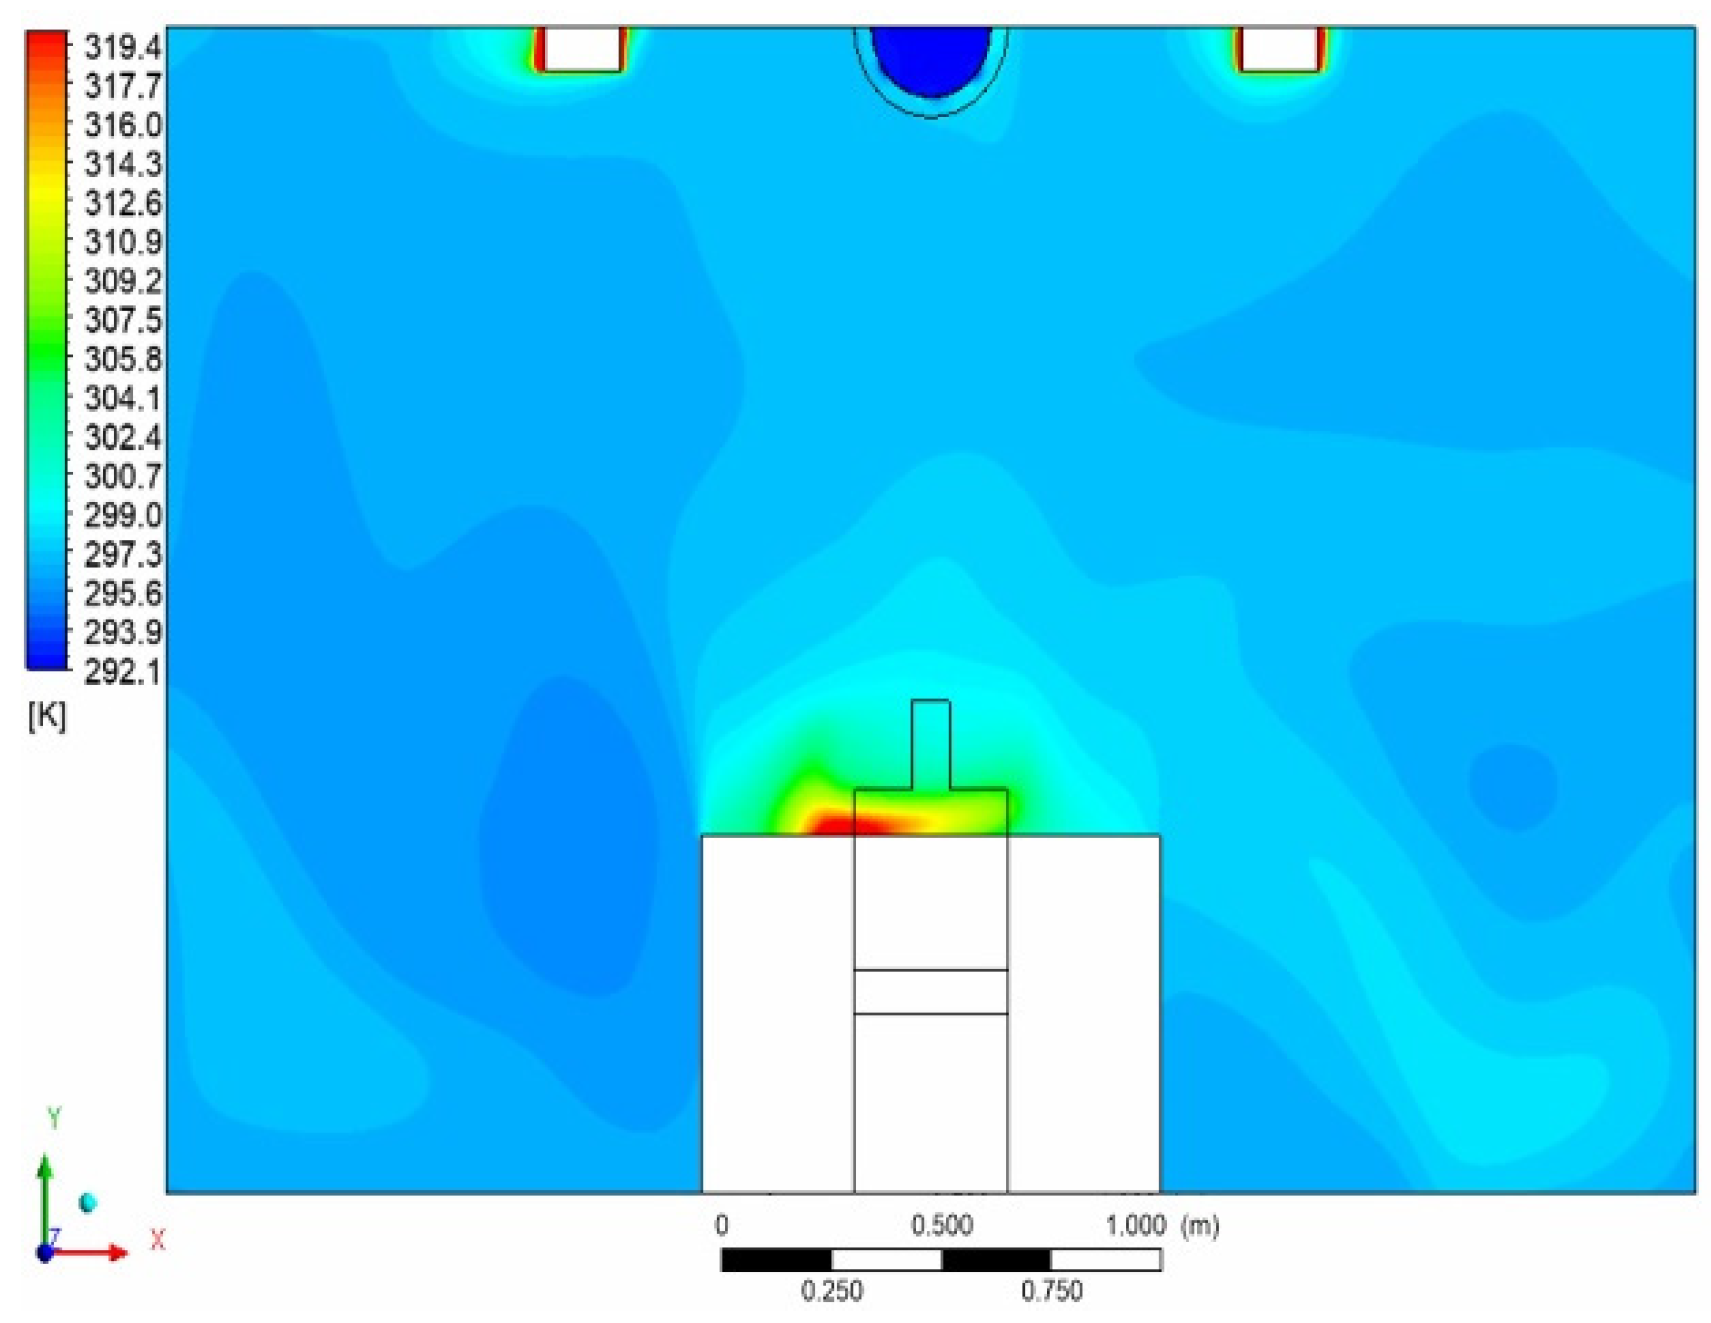
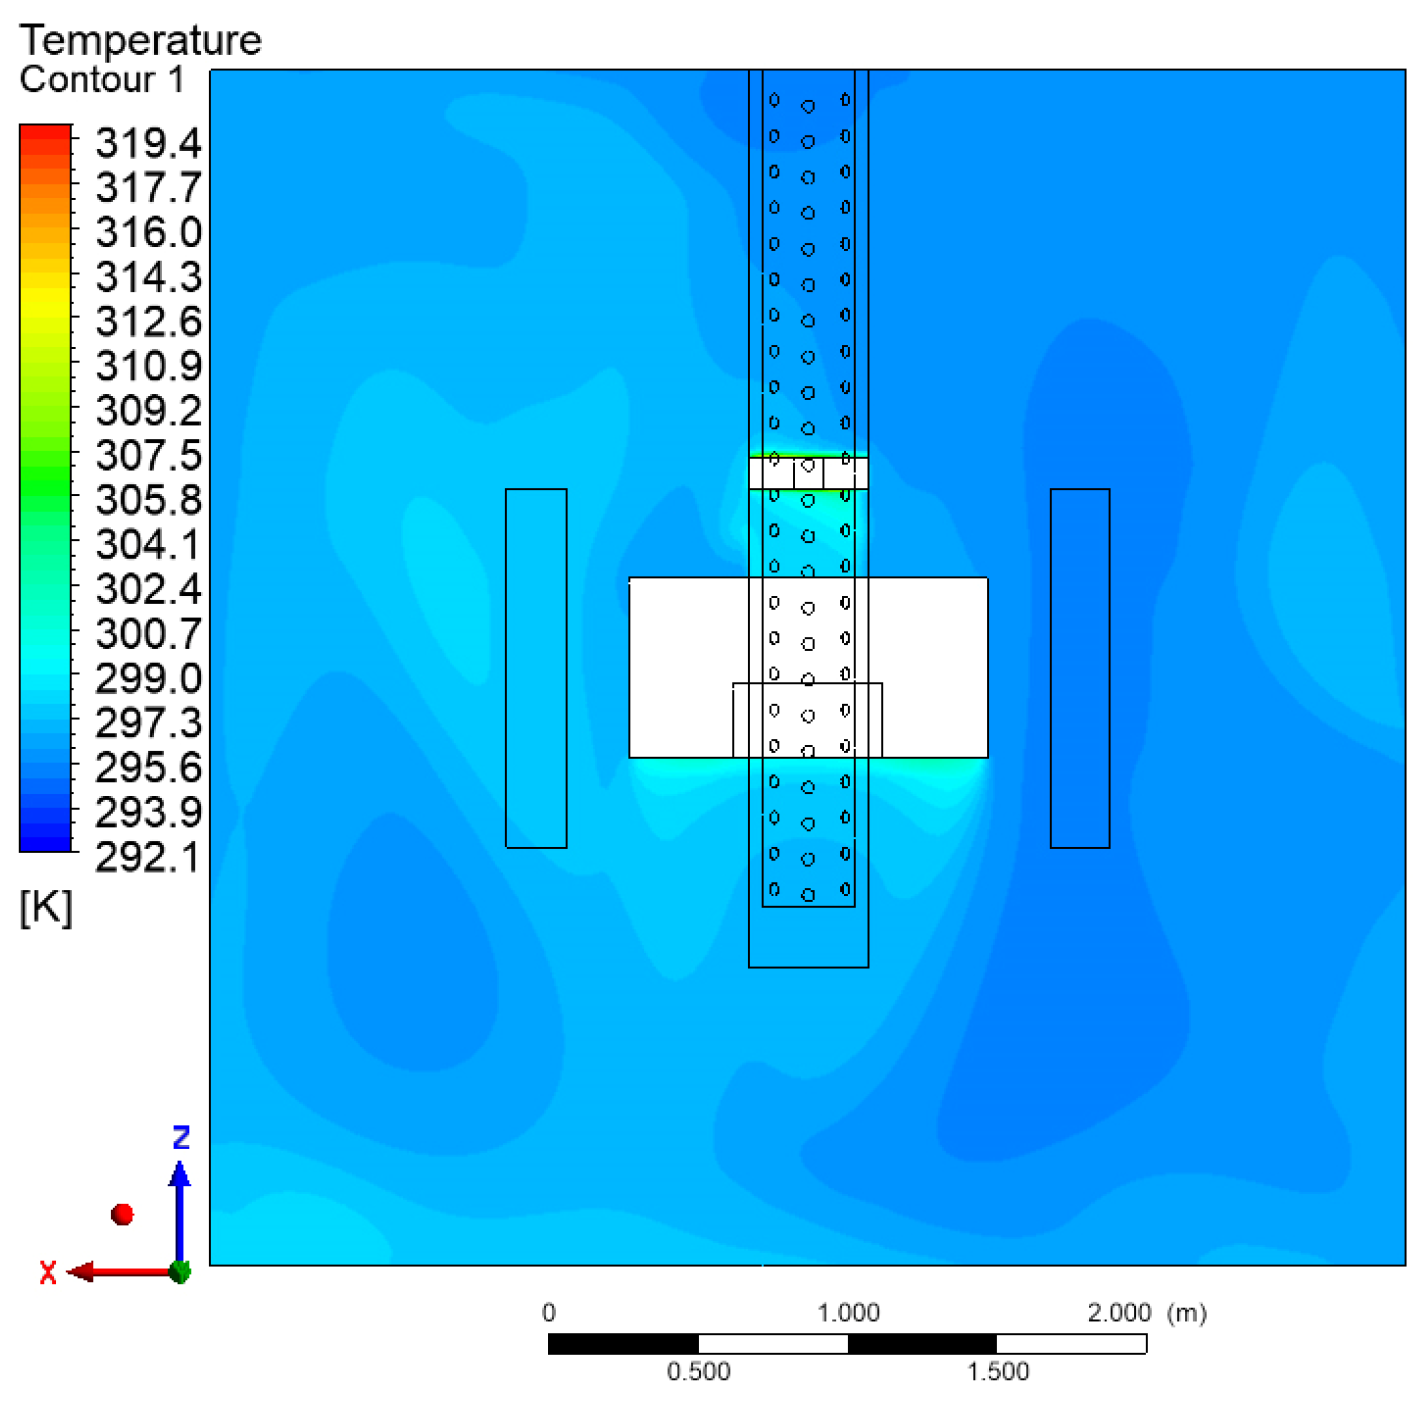
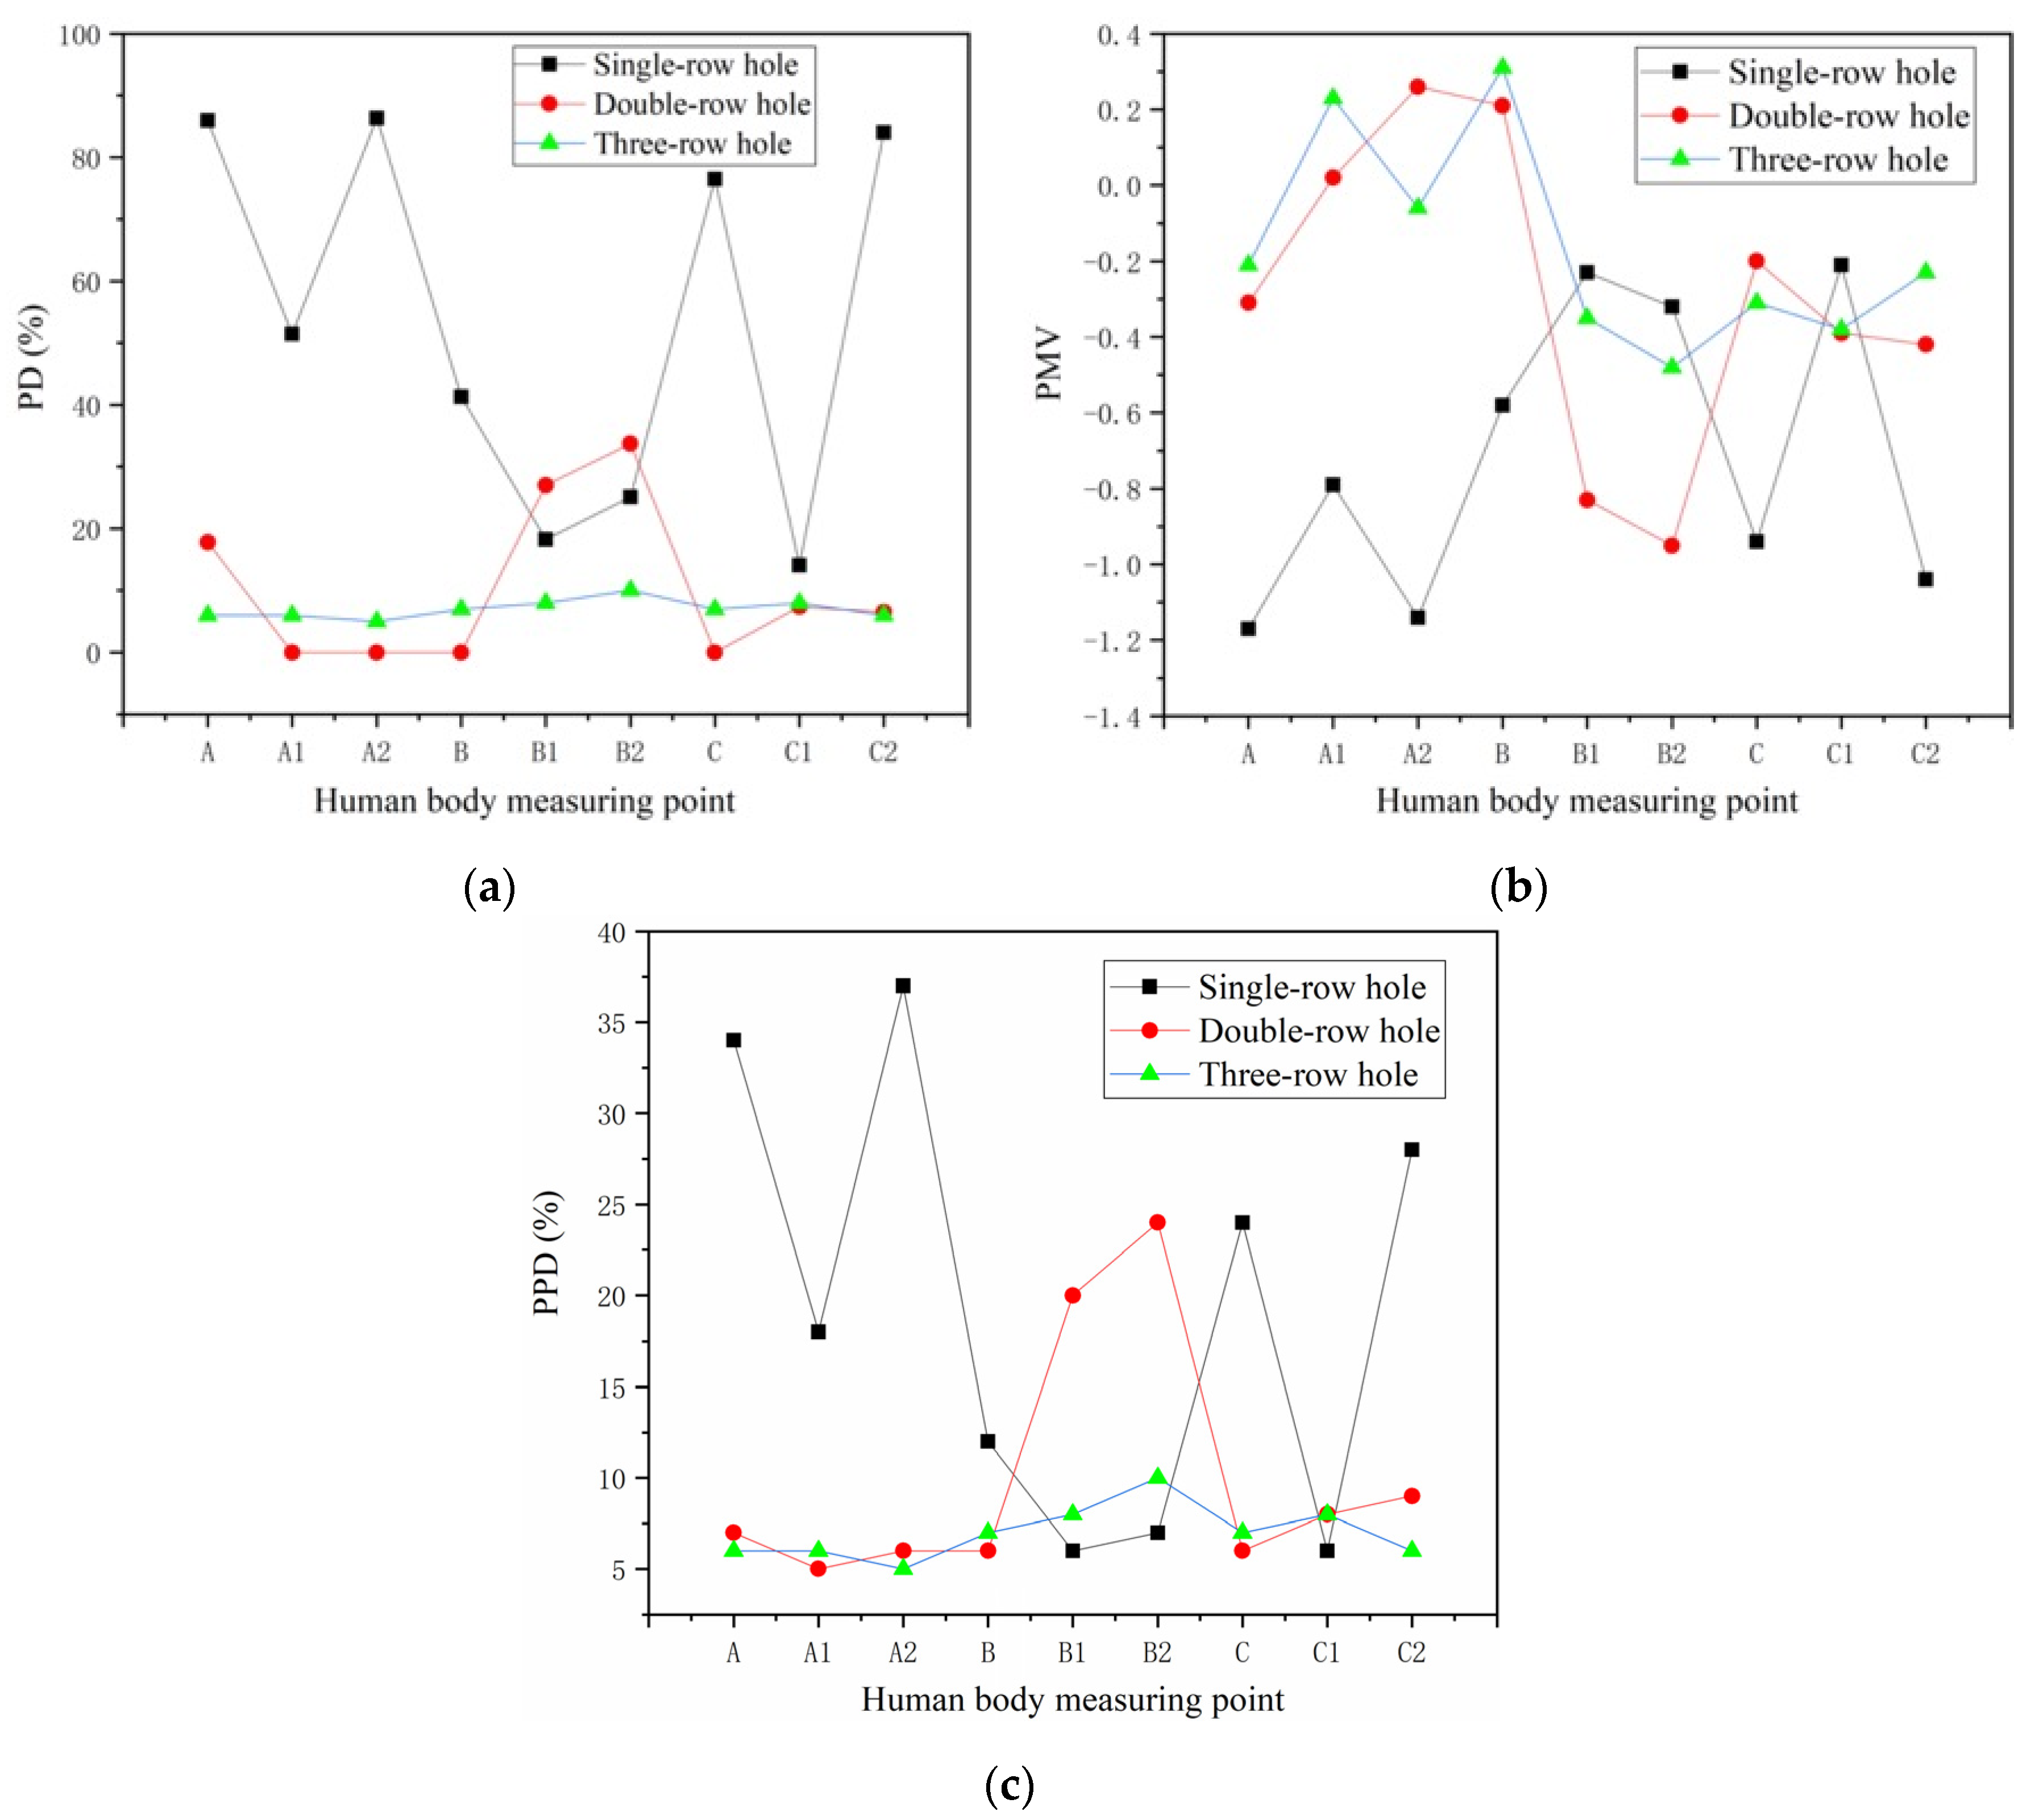
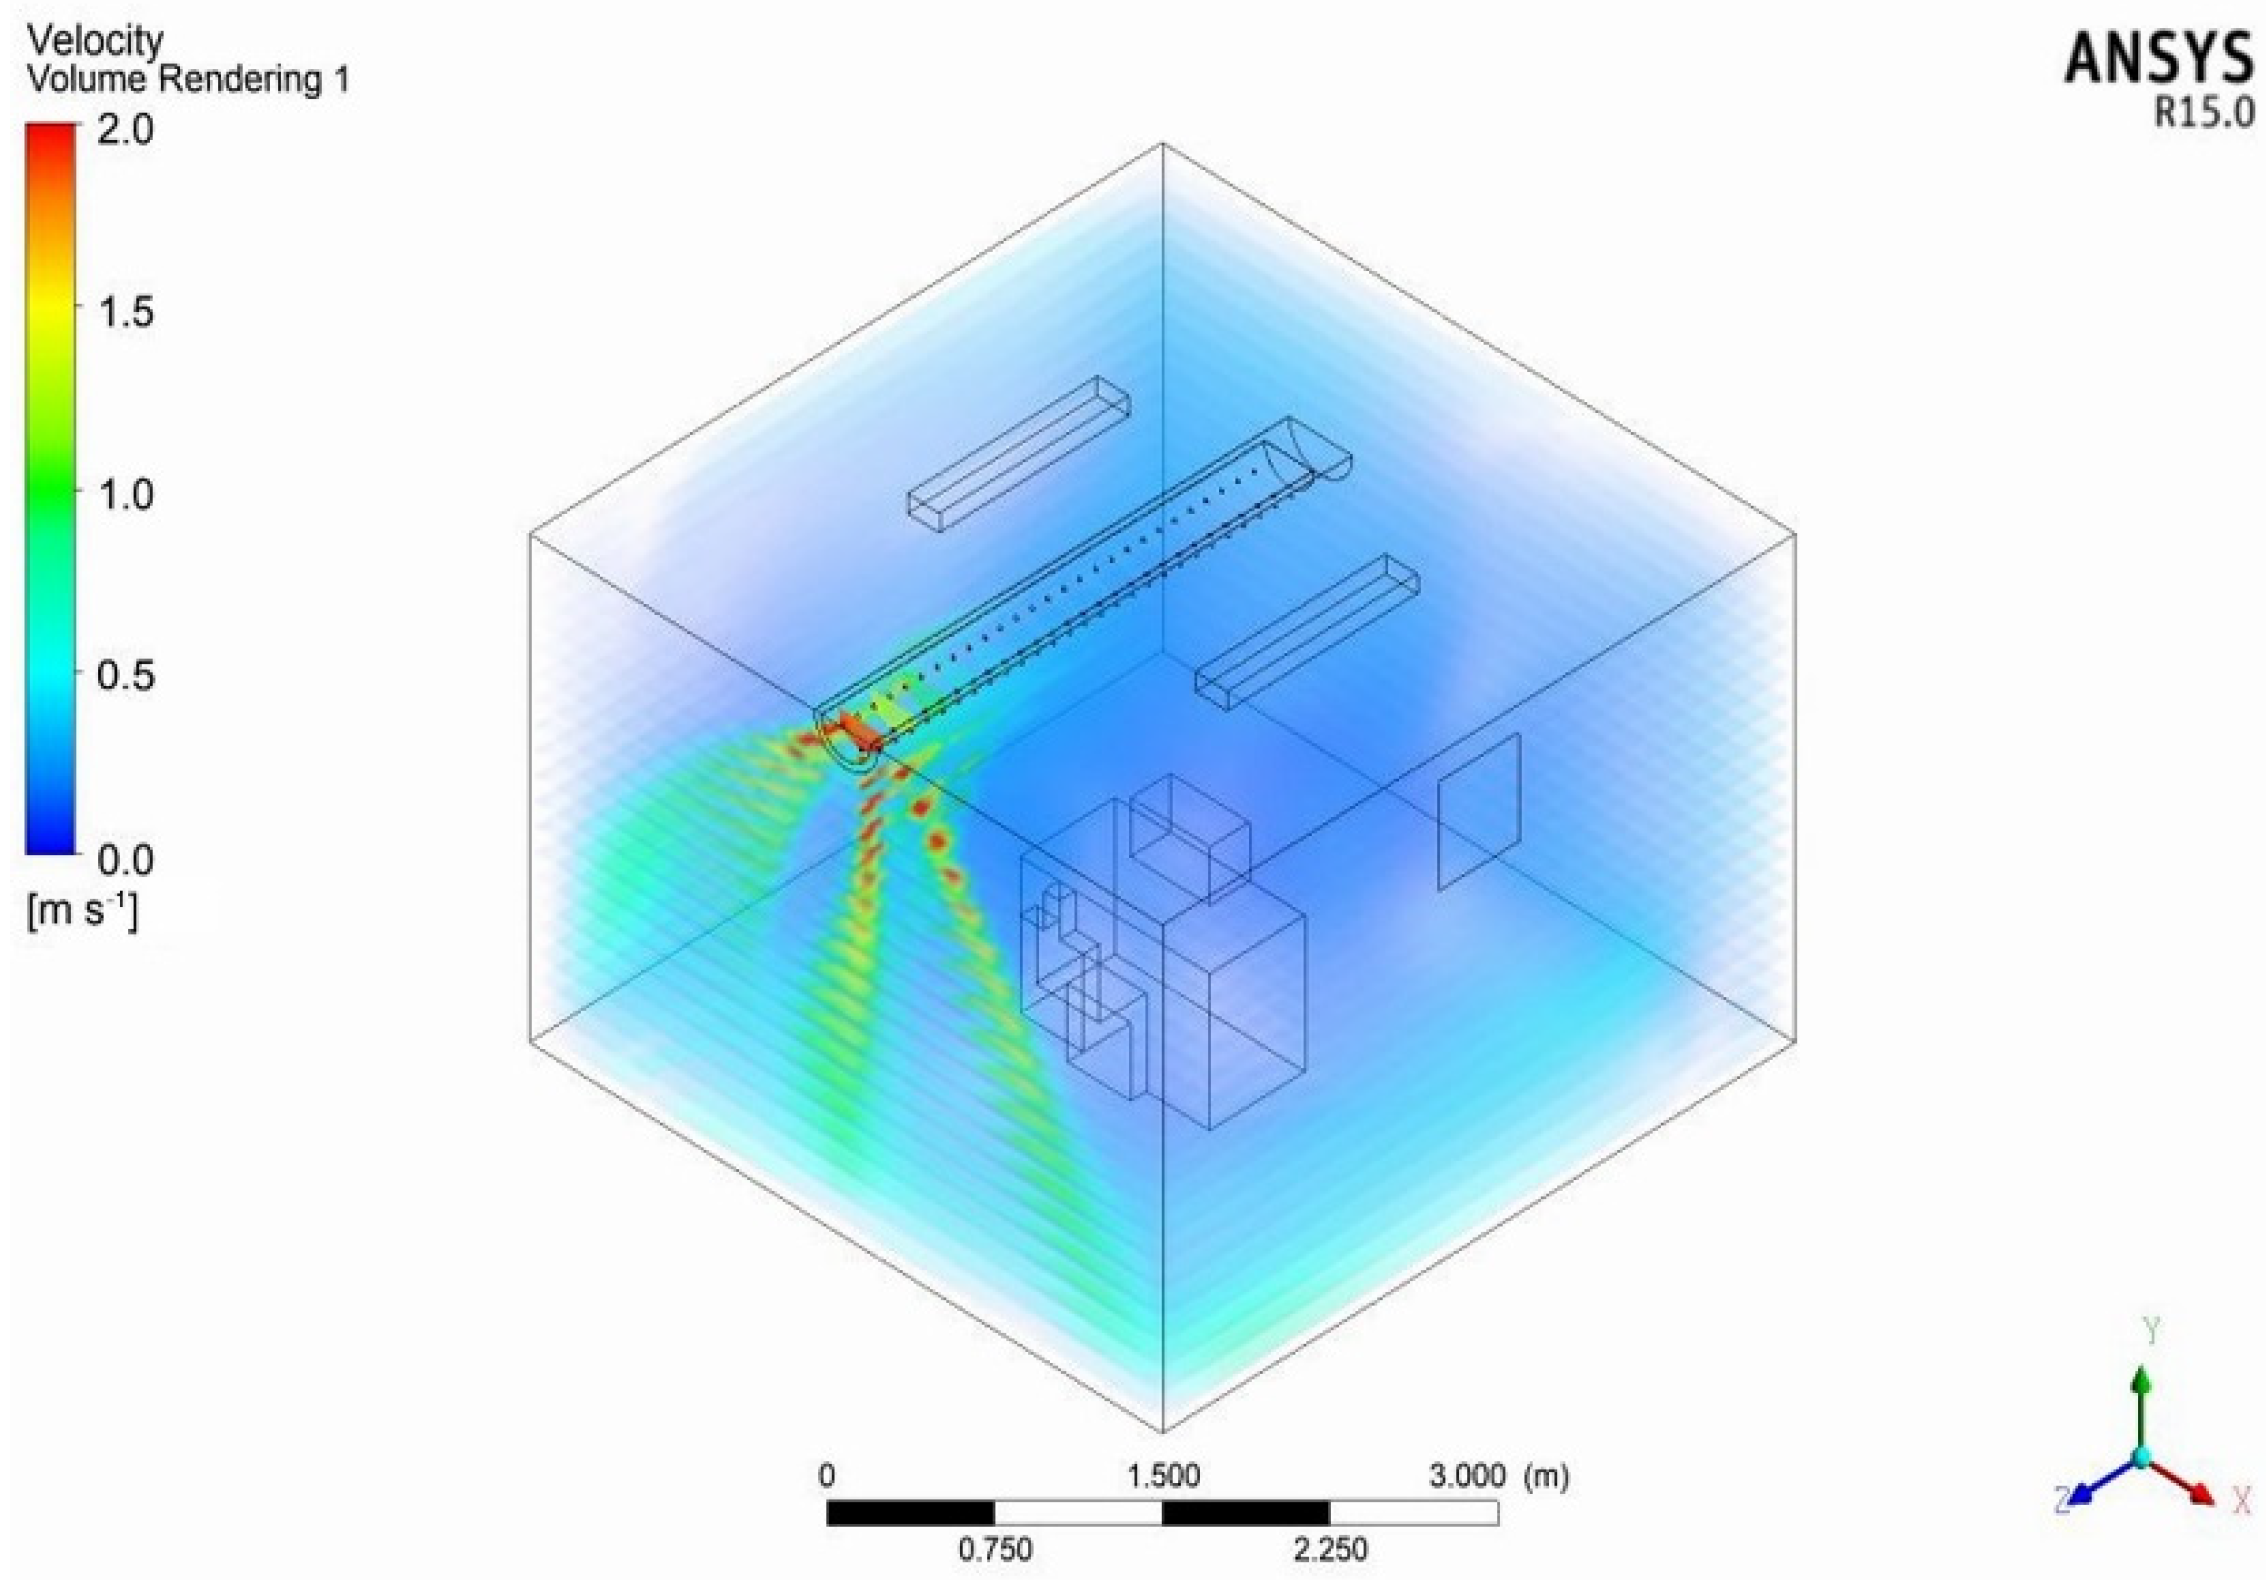
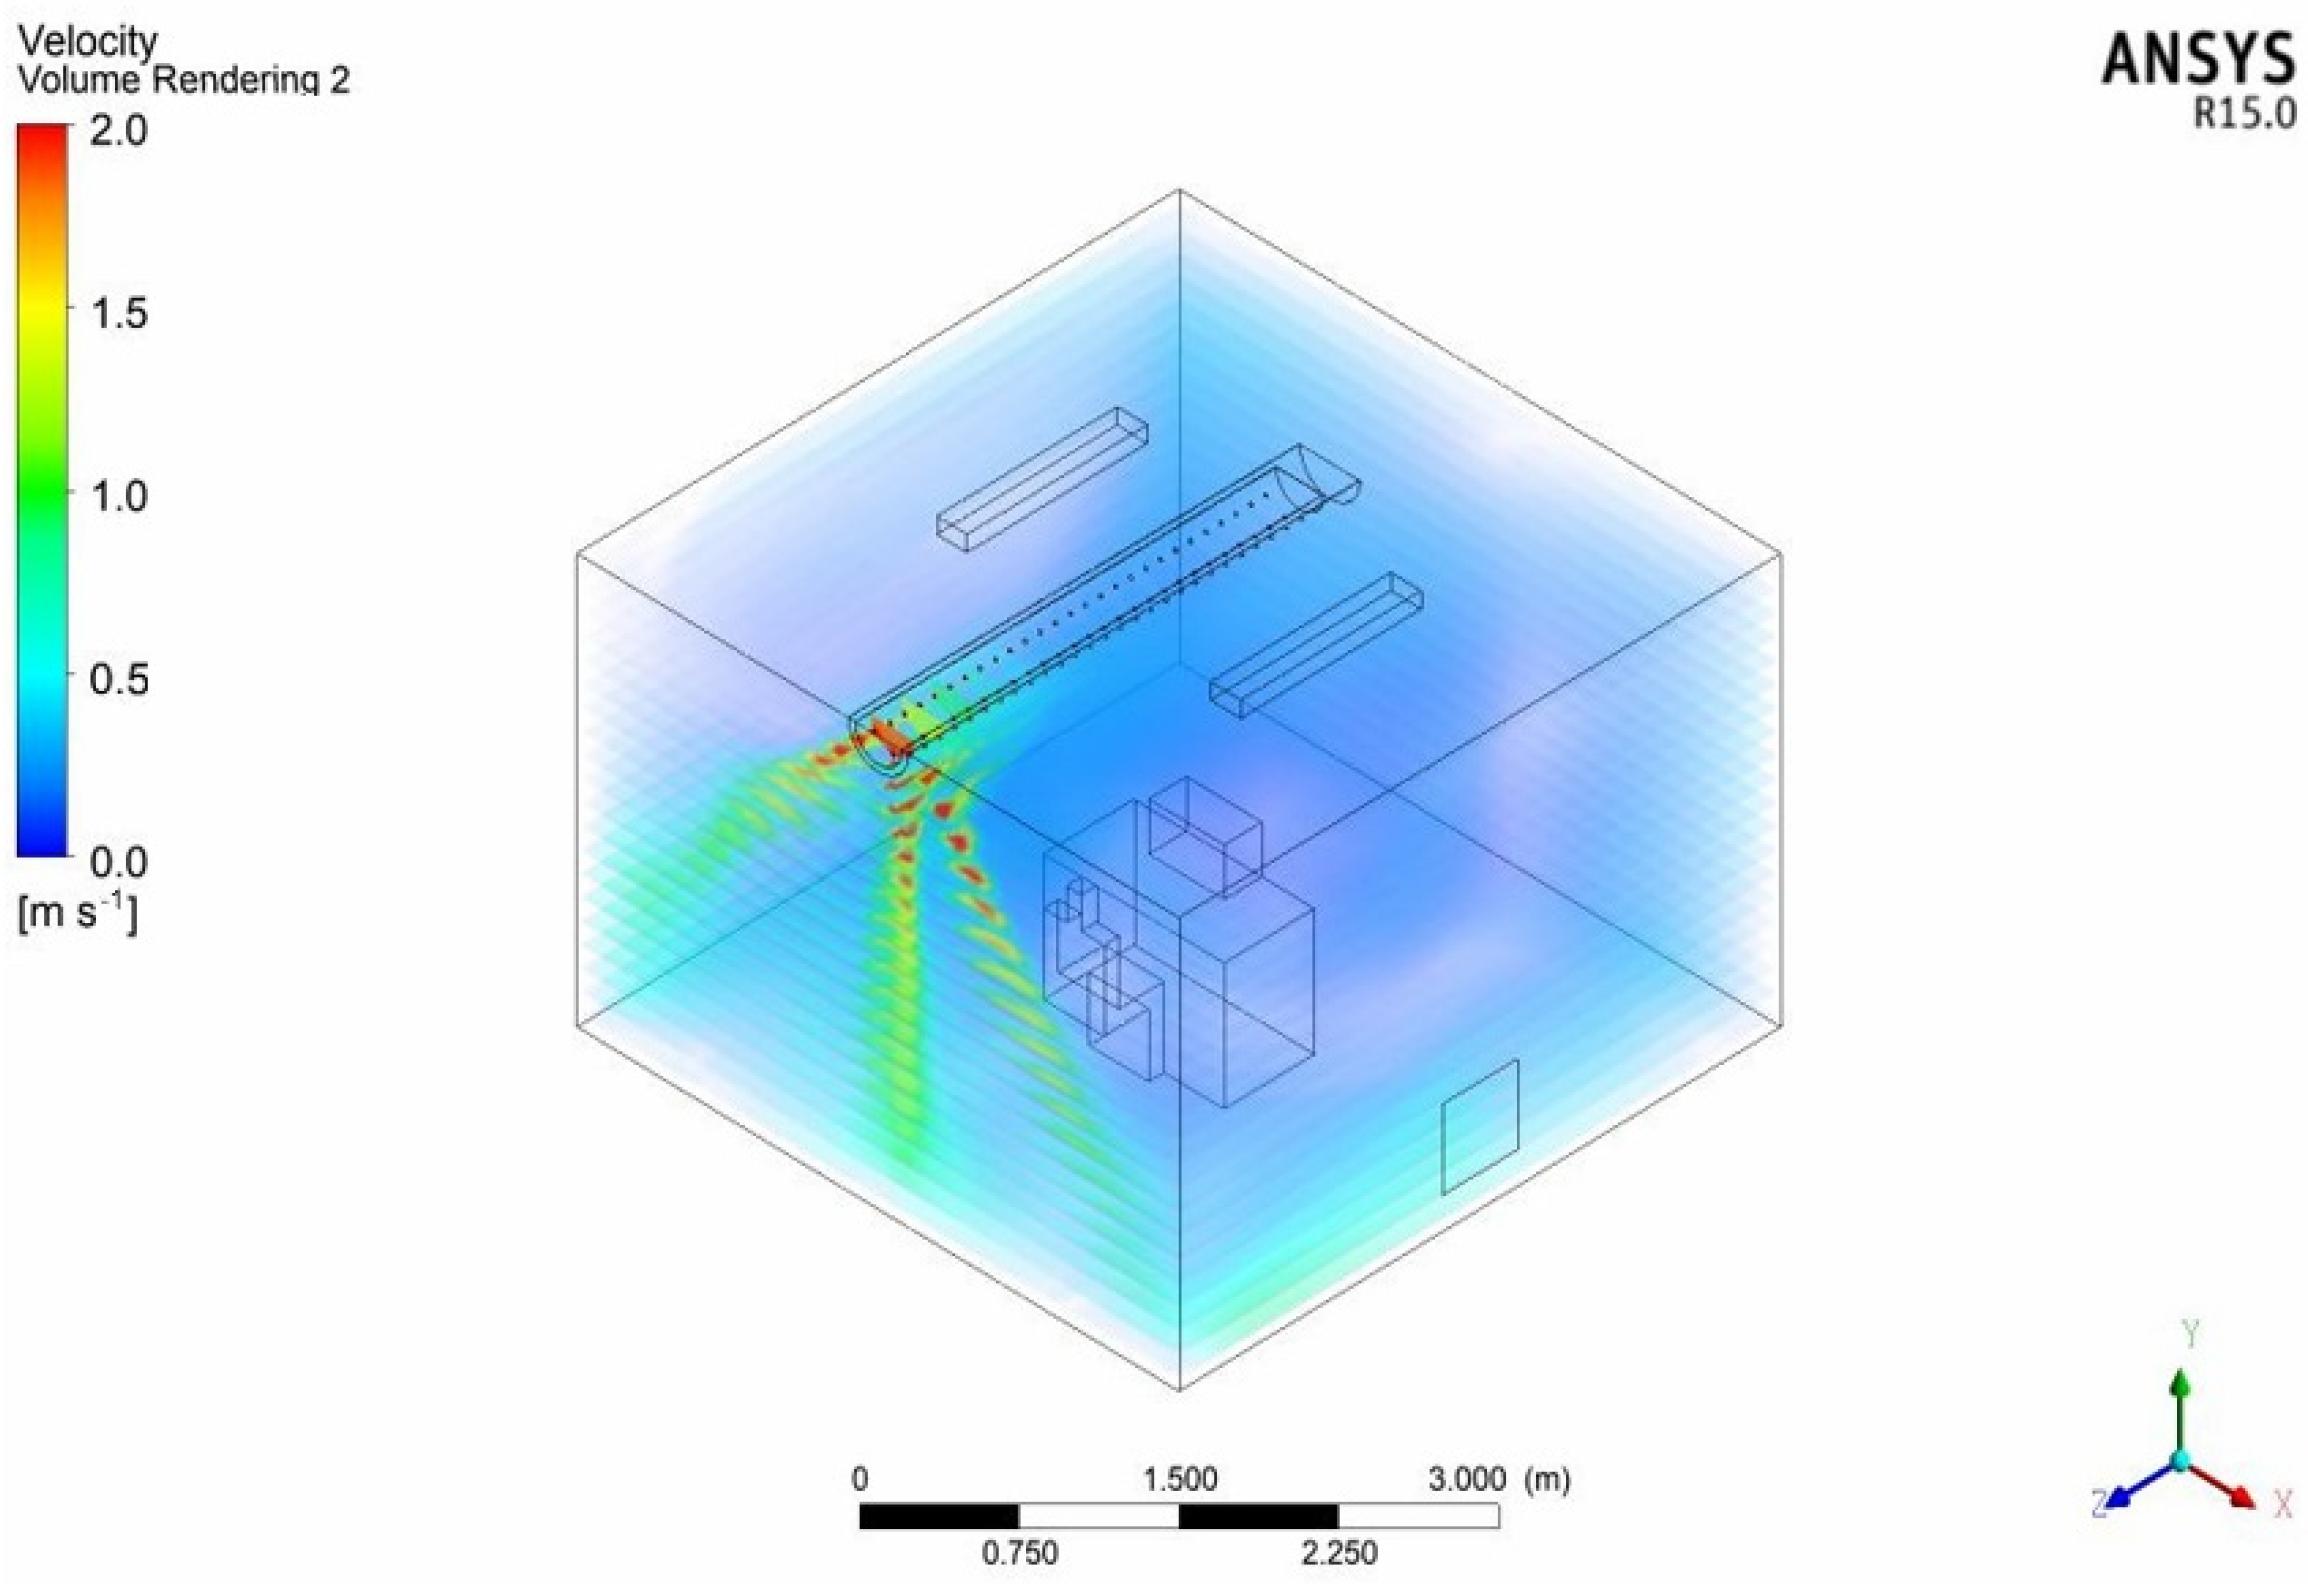
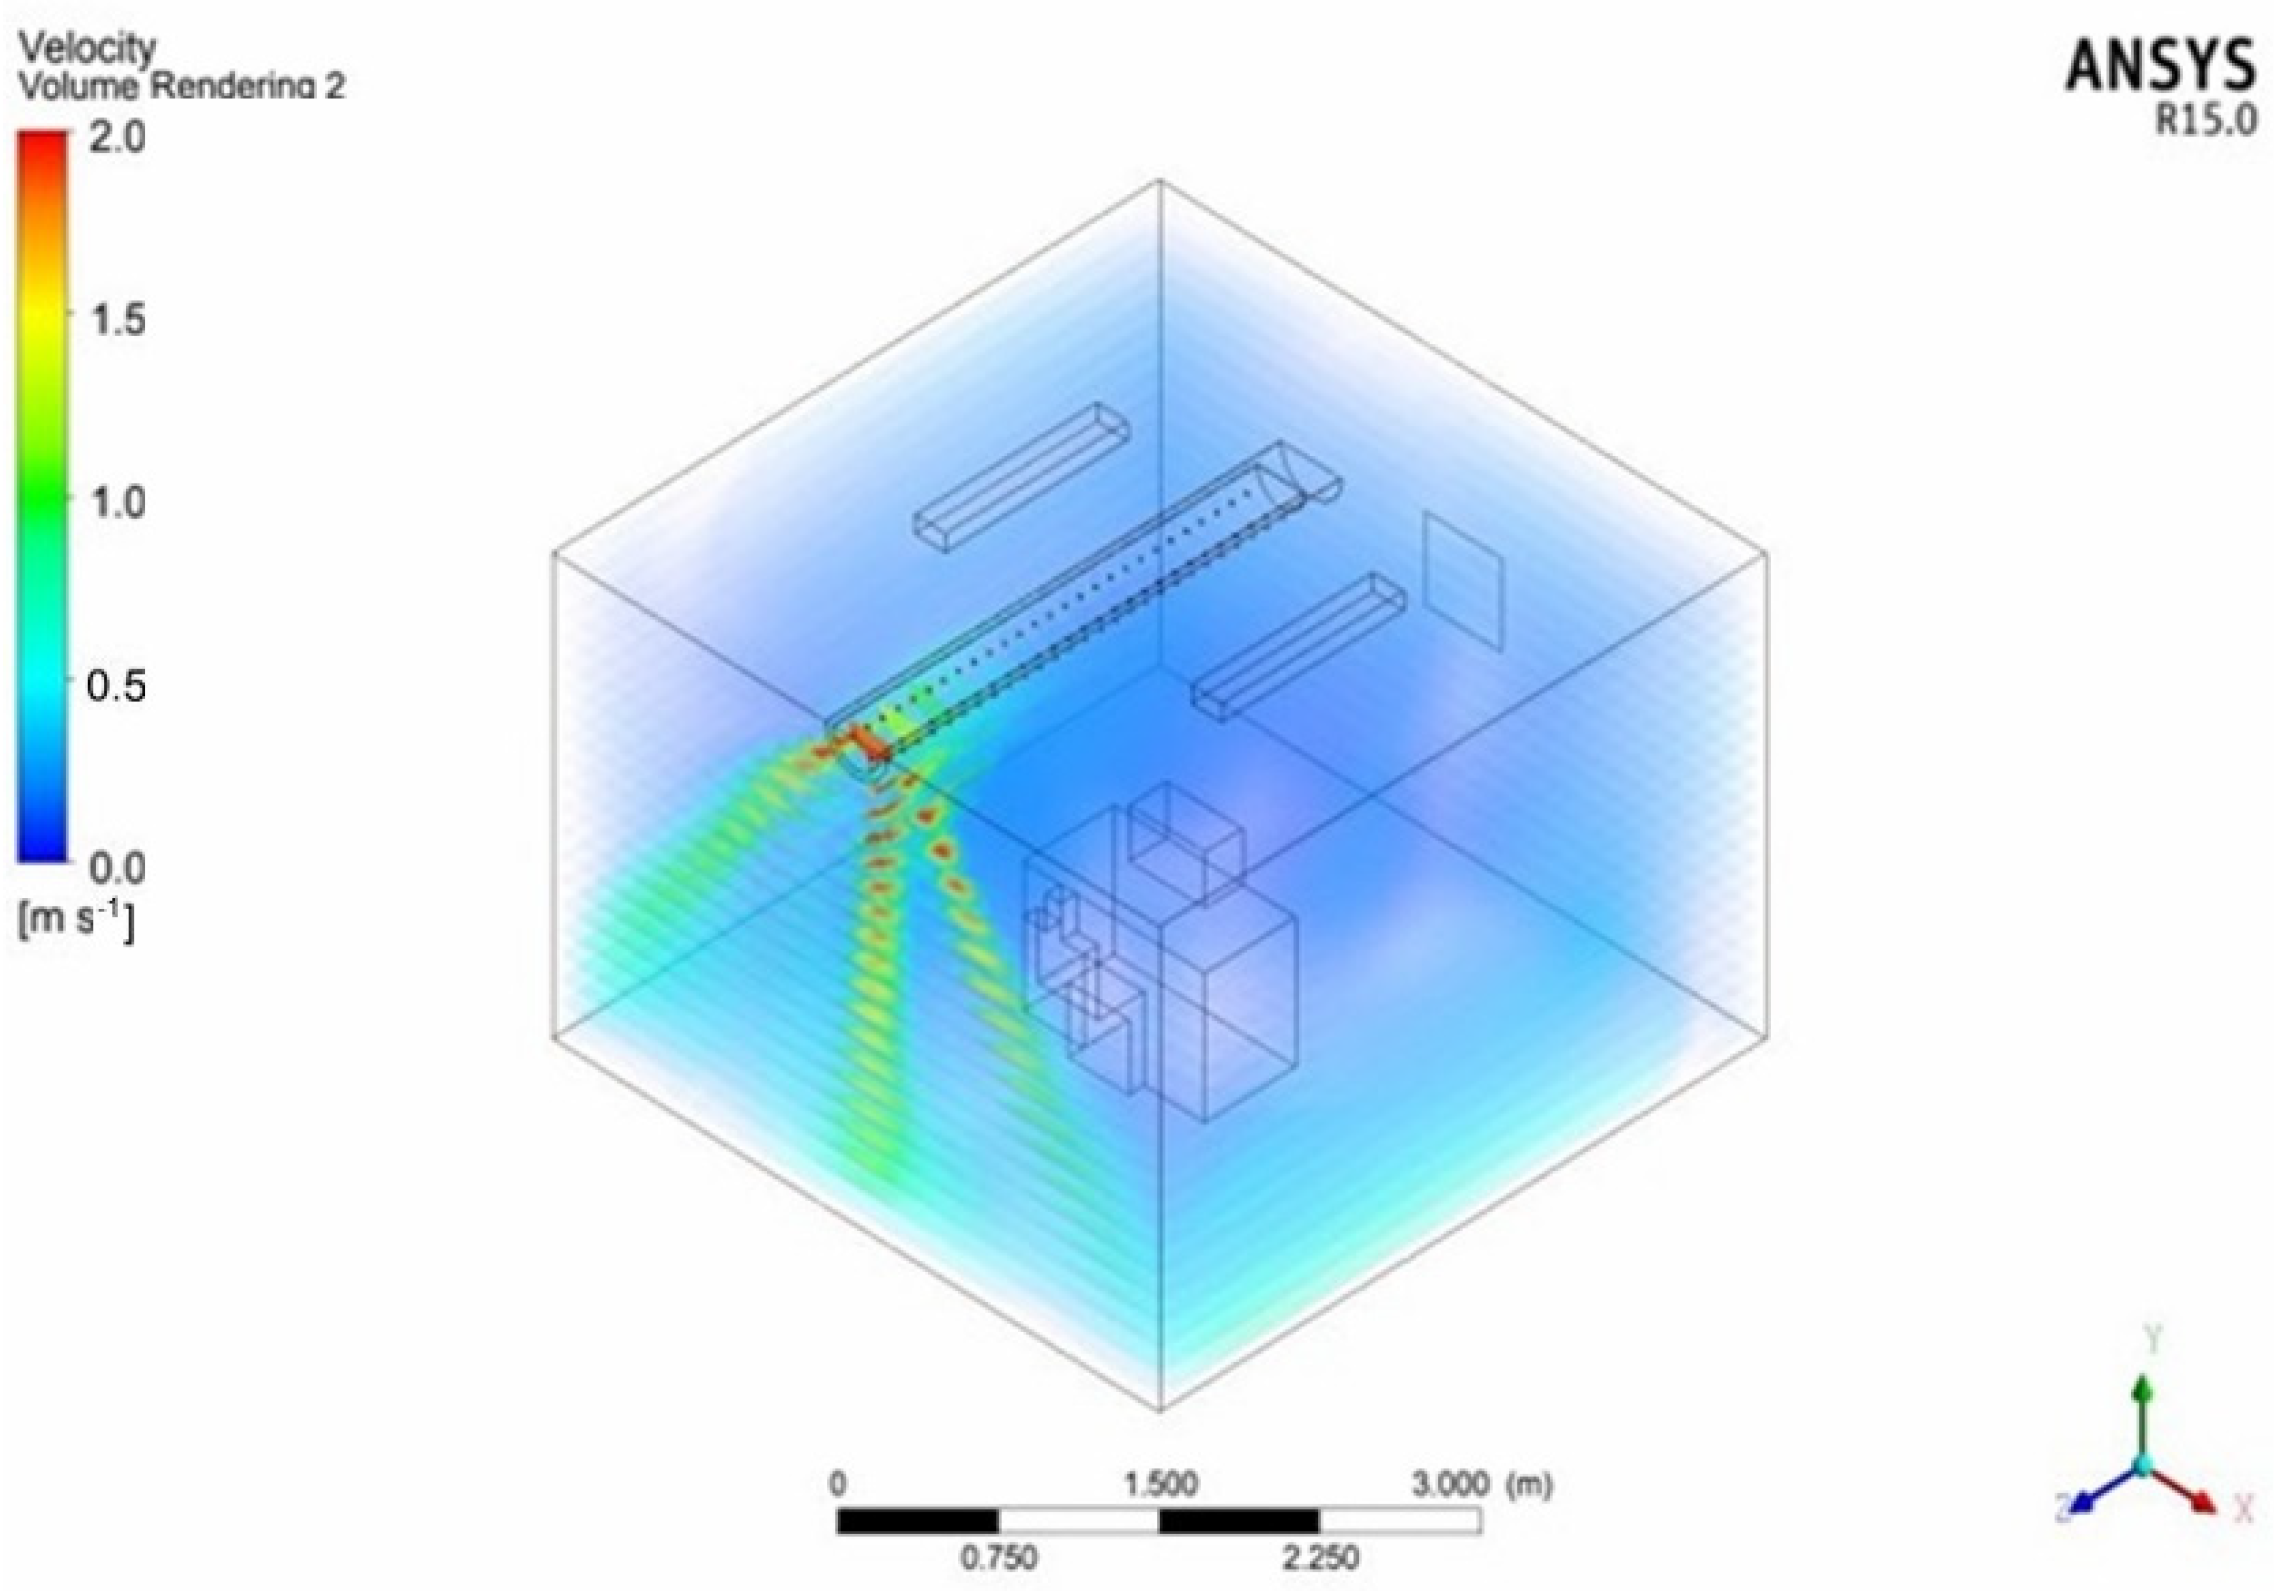
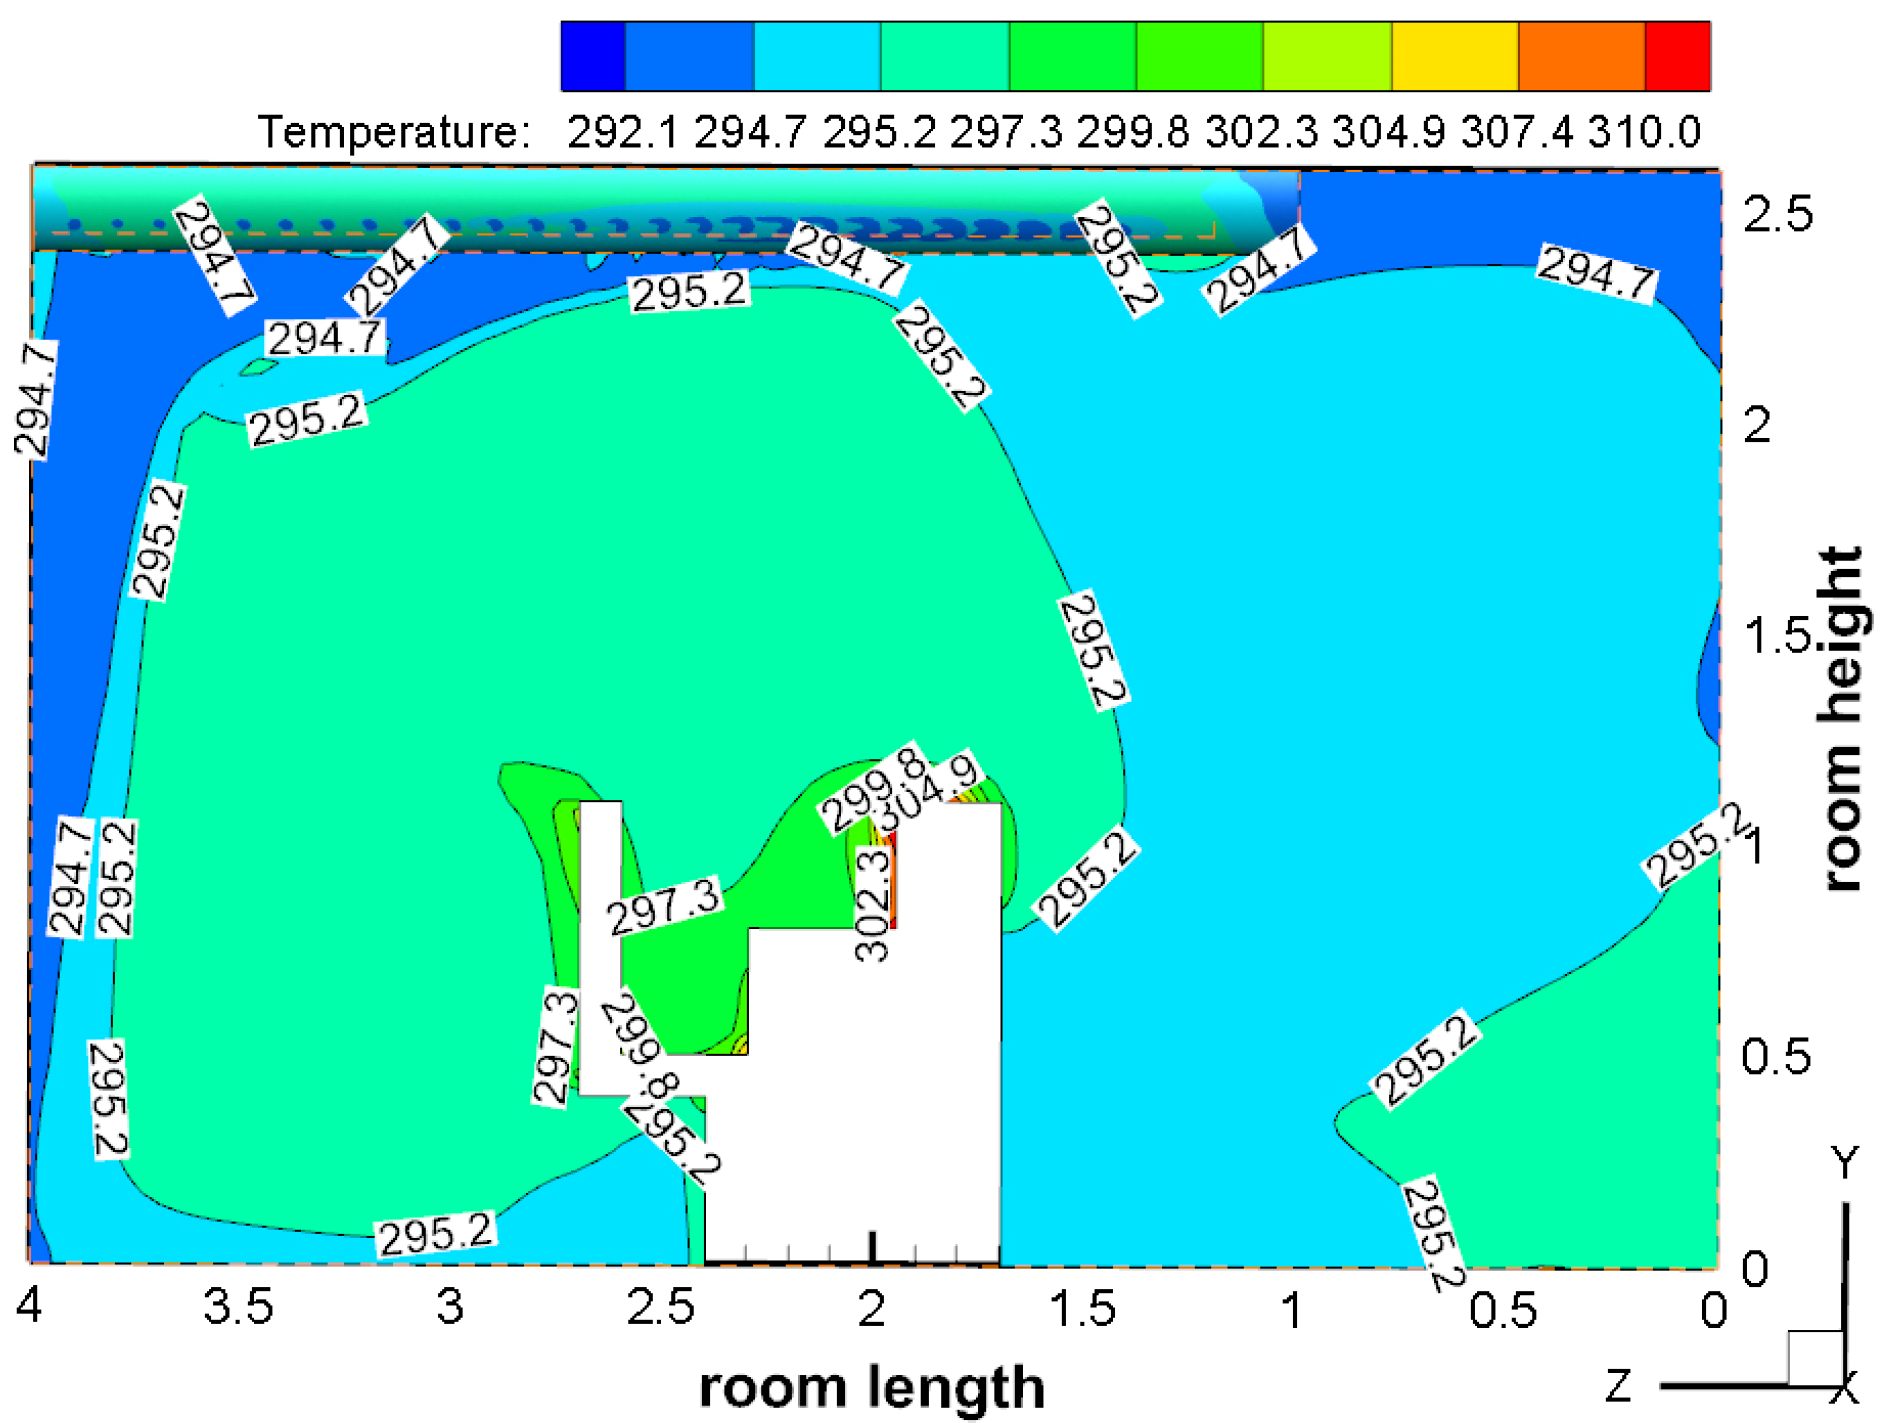
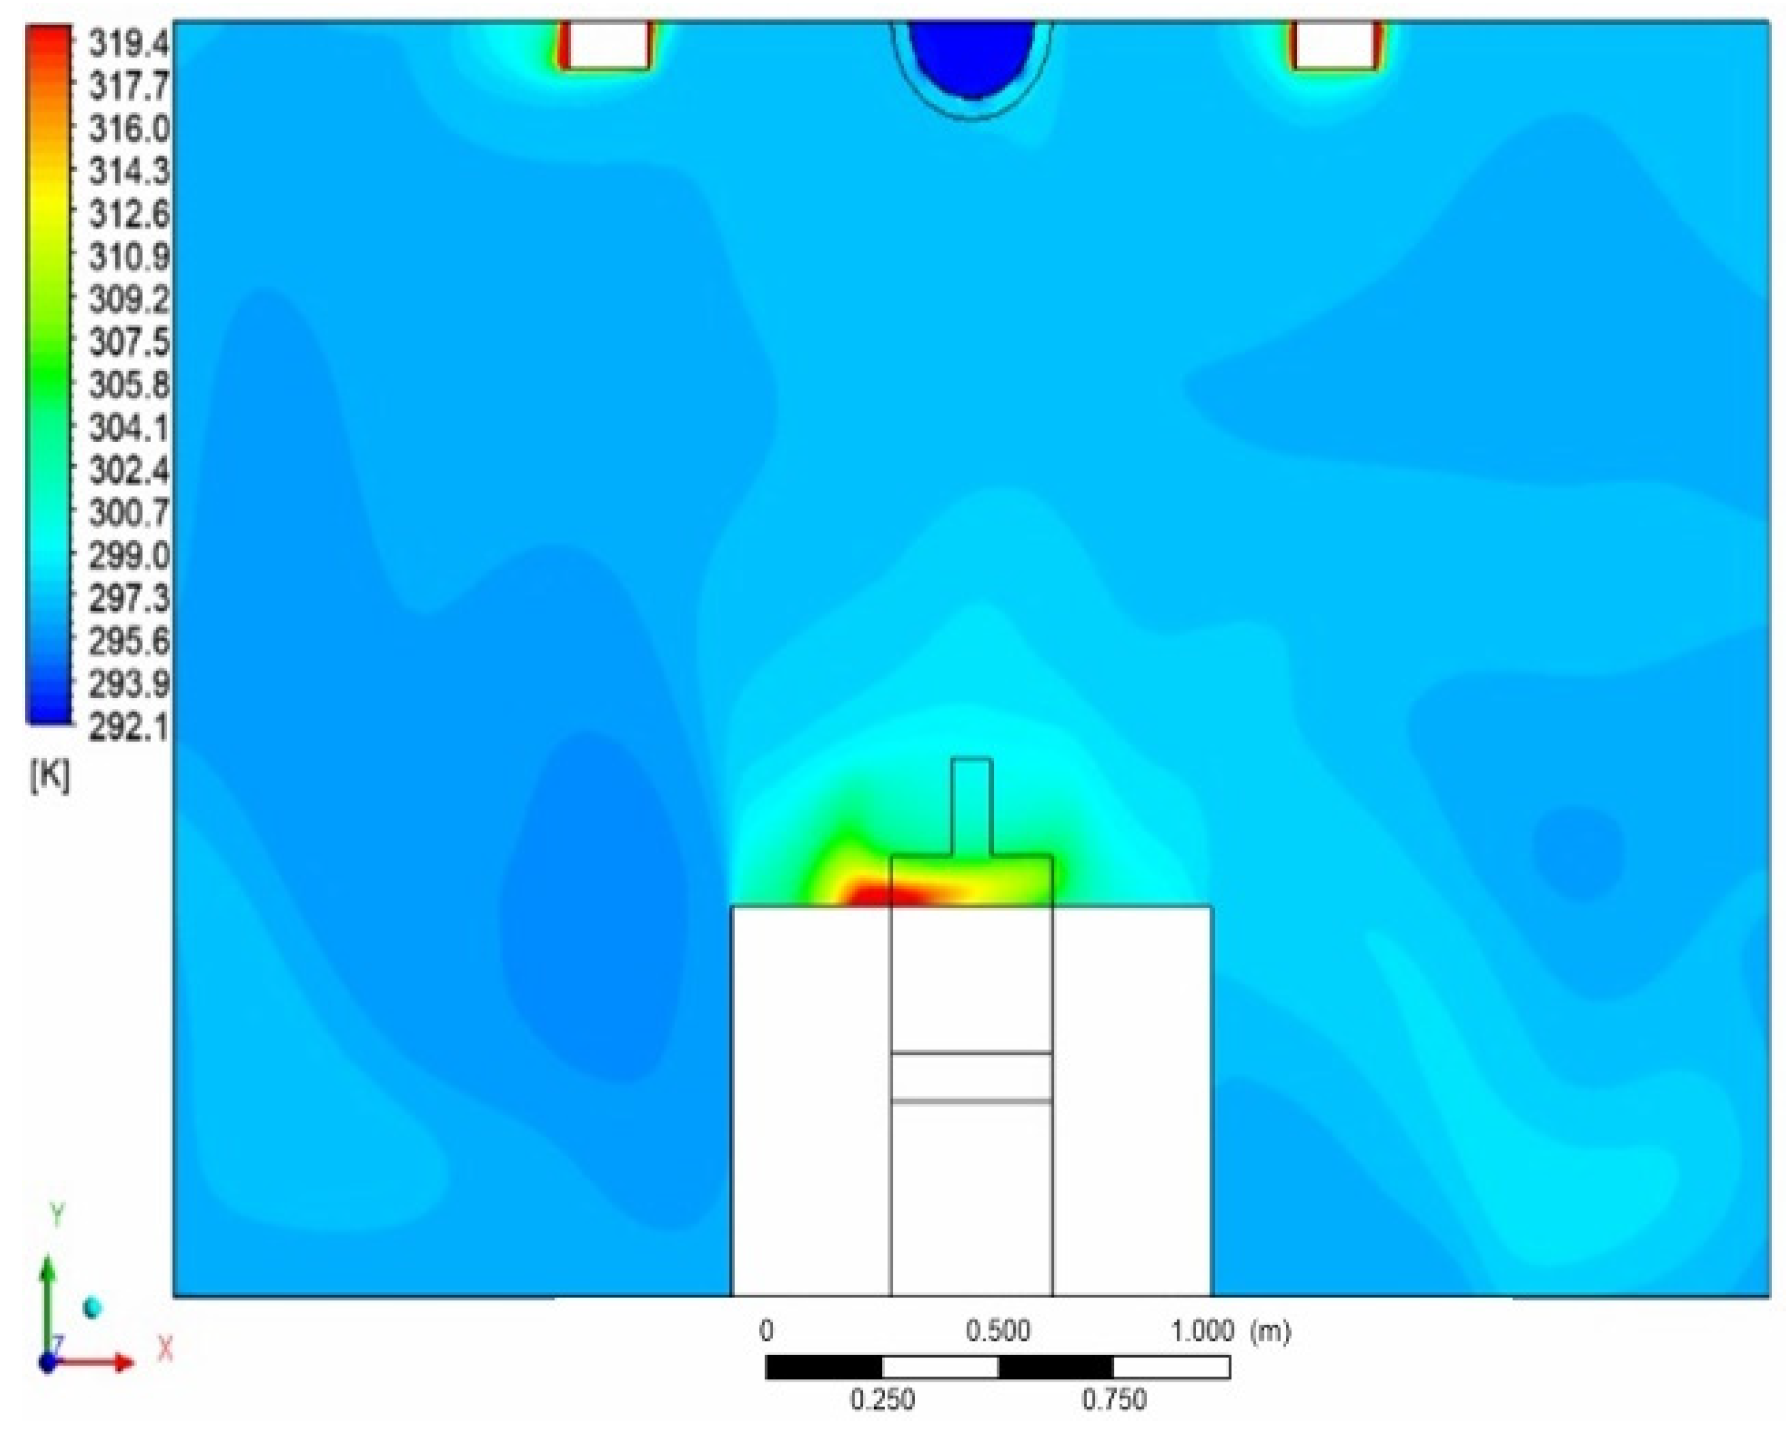
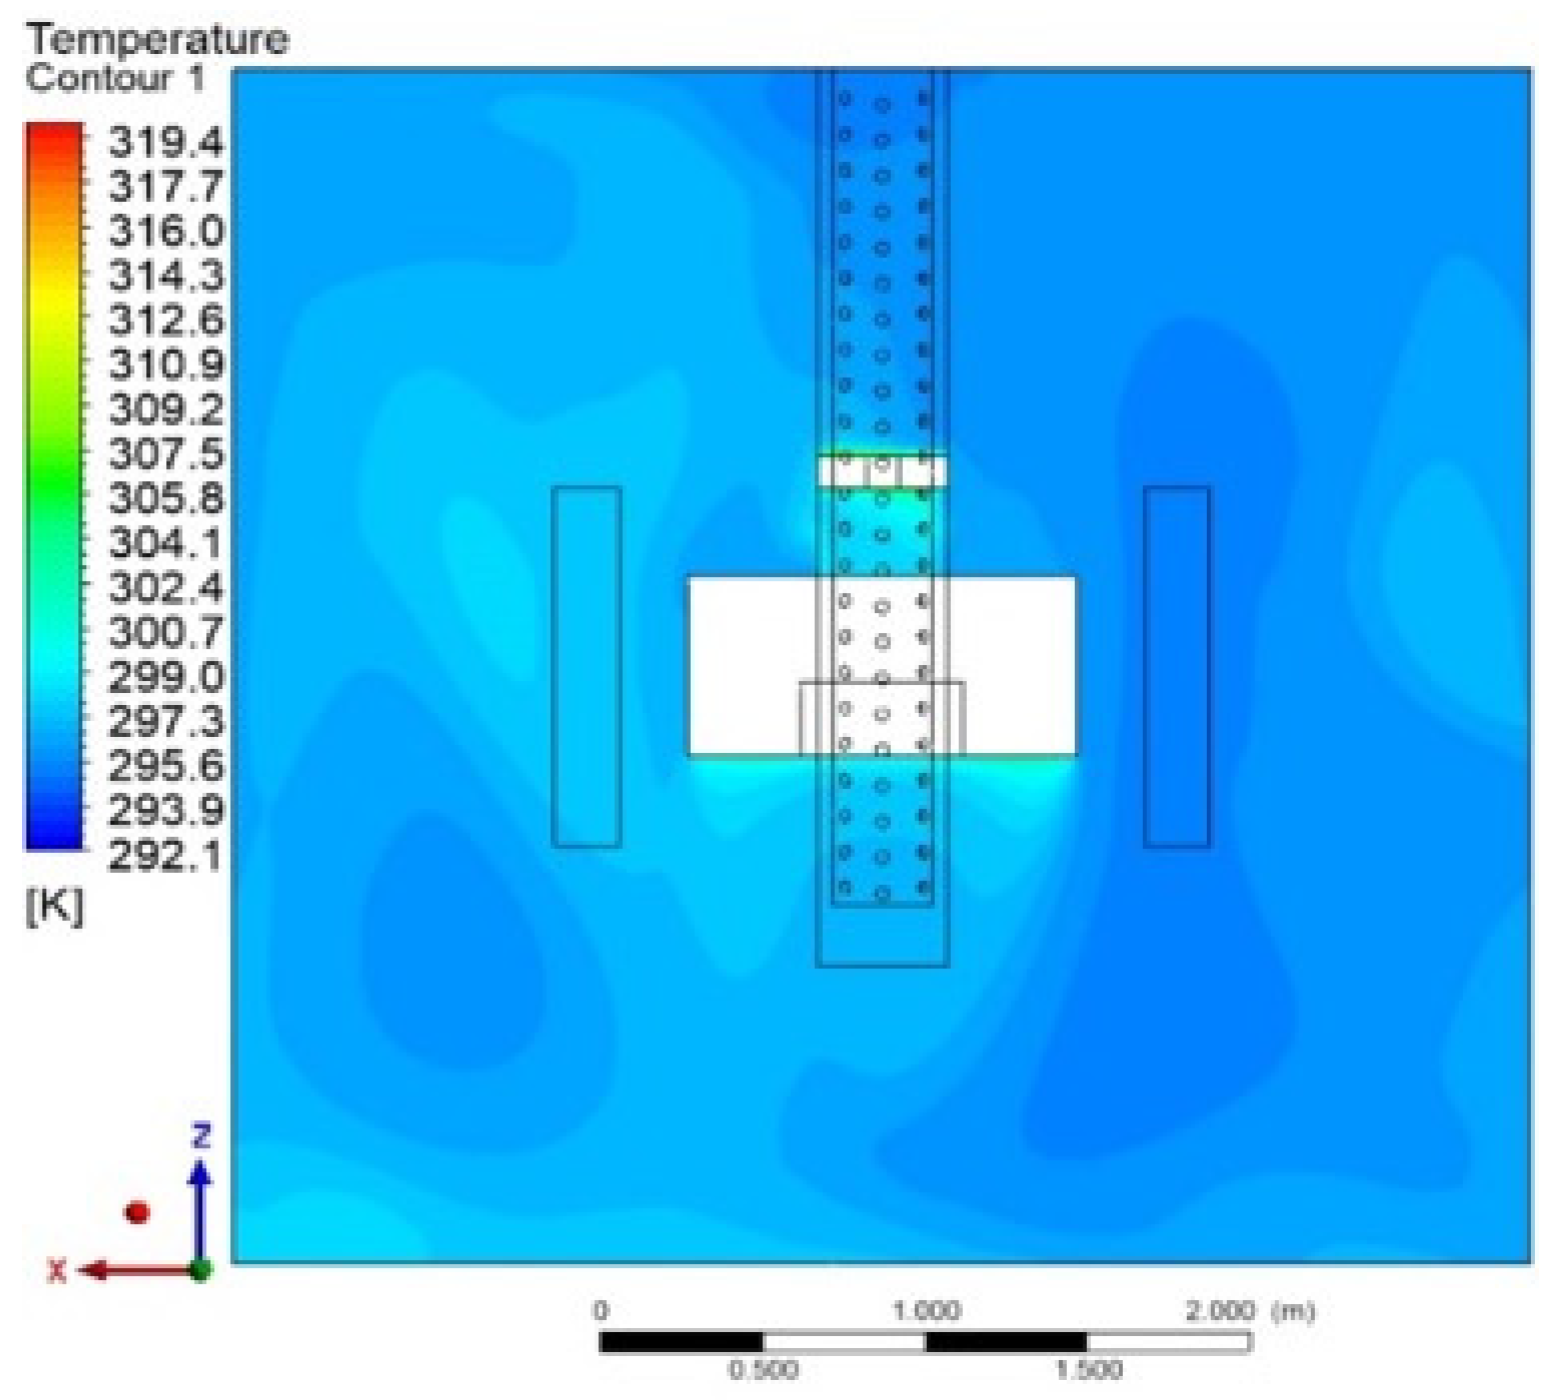
The three-row hole (5-o’clock, 6-o’clock, 7-o’clock) split-fiber air conditioner had less fluctuation in the indoor temperature field distribution during operation, no wind blowing around the human body, and the thermal comfort reached a high level, which is in line with ISO7730 recommendation standard. When the single-row hole (6-o’clock) split-fiber air conditioner supplied air, the upper body of the human body had a high wind speed, the temperature was low at high wind speed, and the head was blown violently, which did not meet the ISO7730 recommended standards, and was extremely hot and uncomfortable. The split-fiber air conditioner with double-row holes (5-o’clock and 7-o’clock) had a low-wind speed in the head area, the temperature was high, the PMV was too large, and the PD was small, so did not meet the recommended standards of ISO7730.
(3)
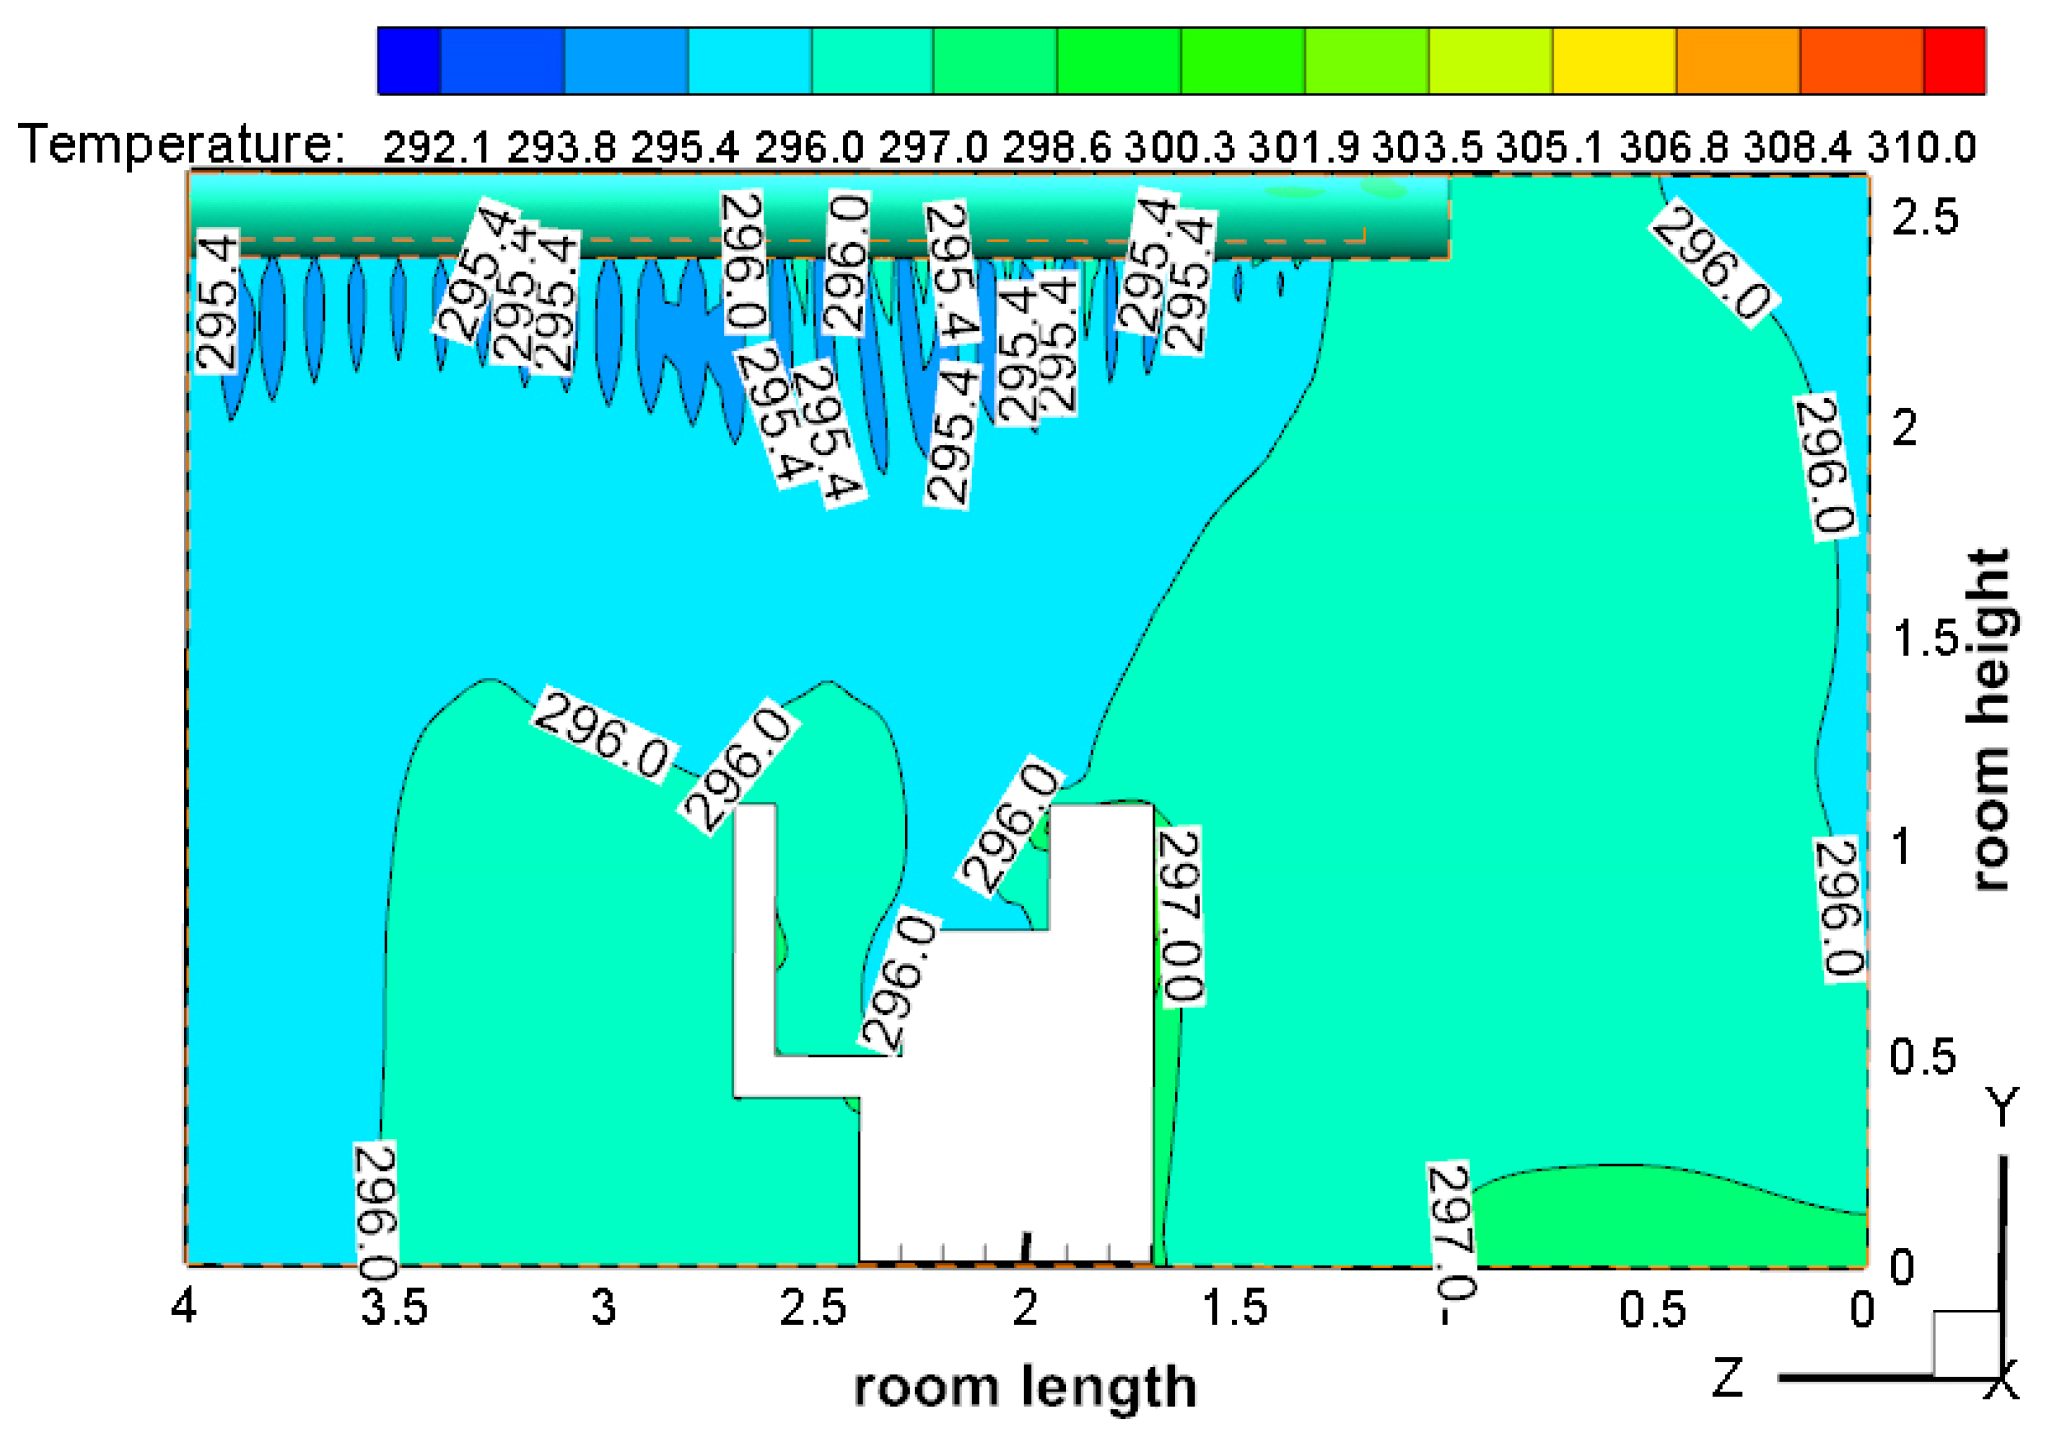
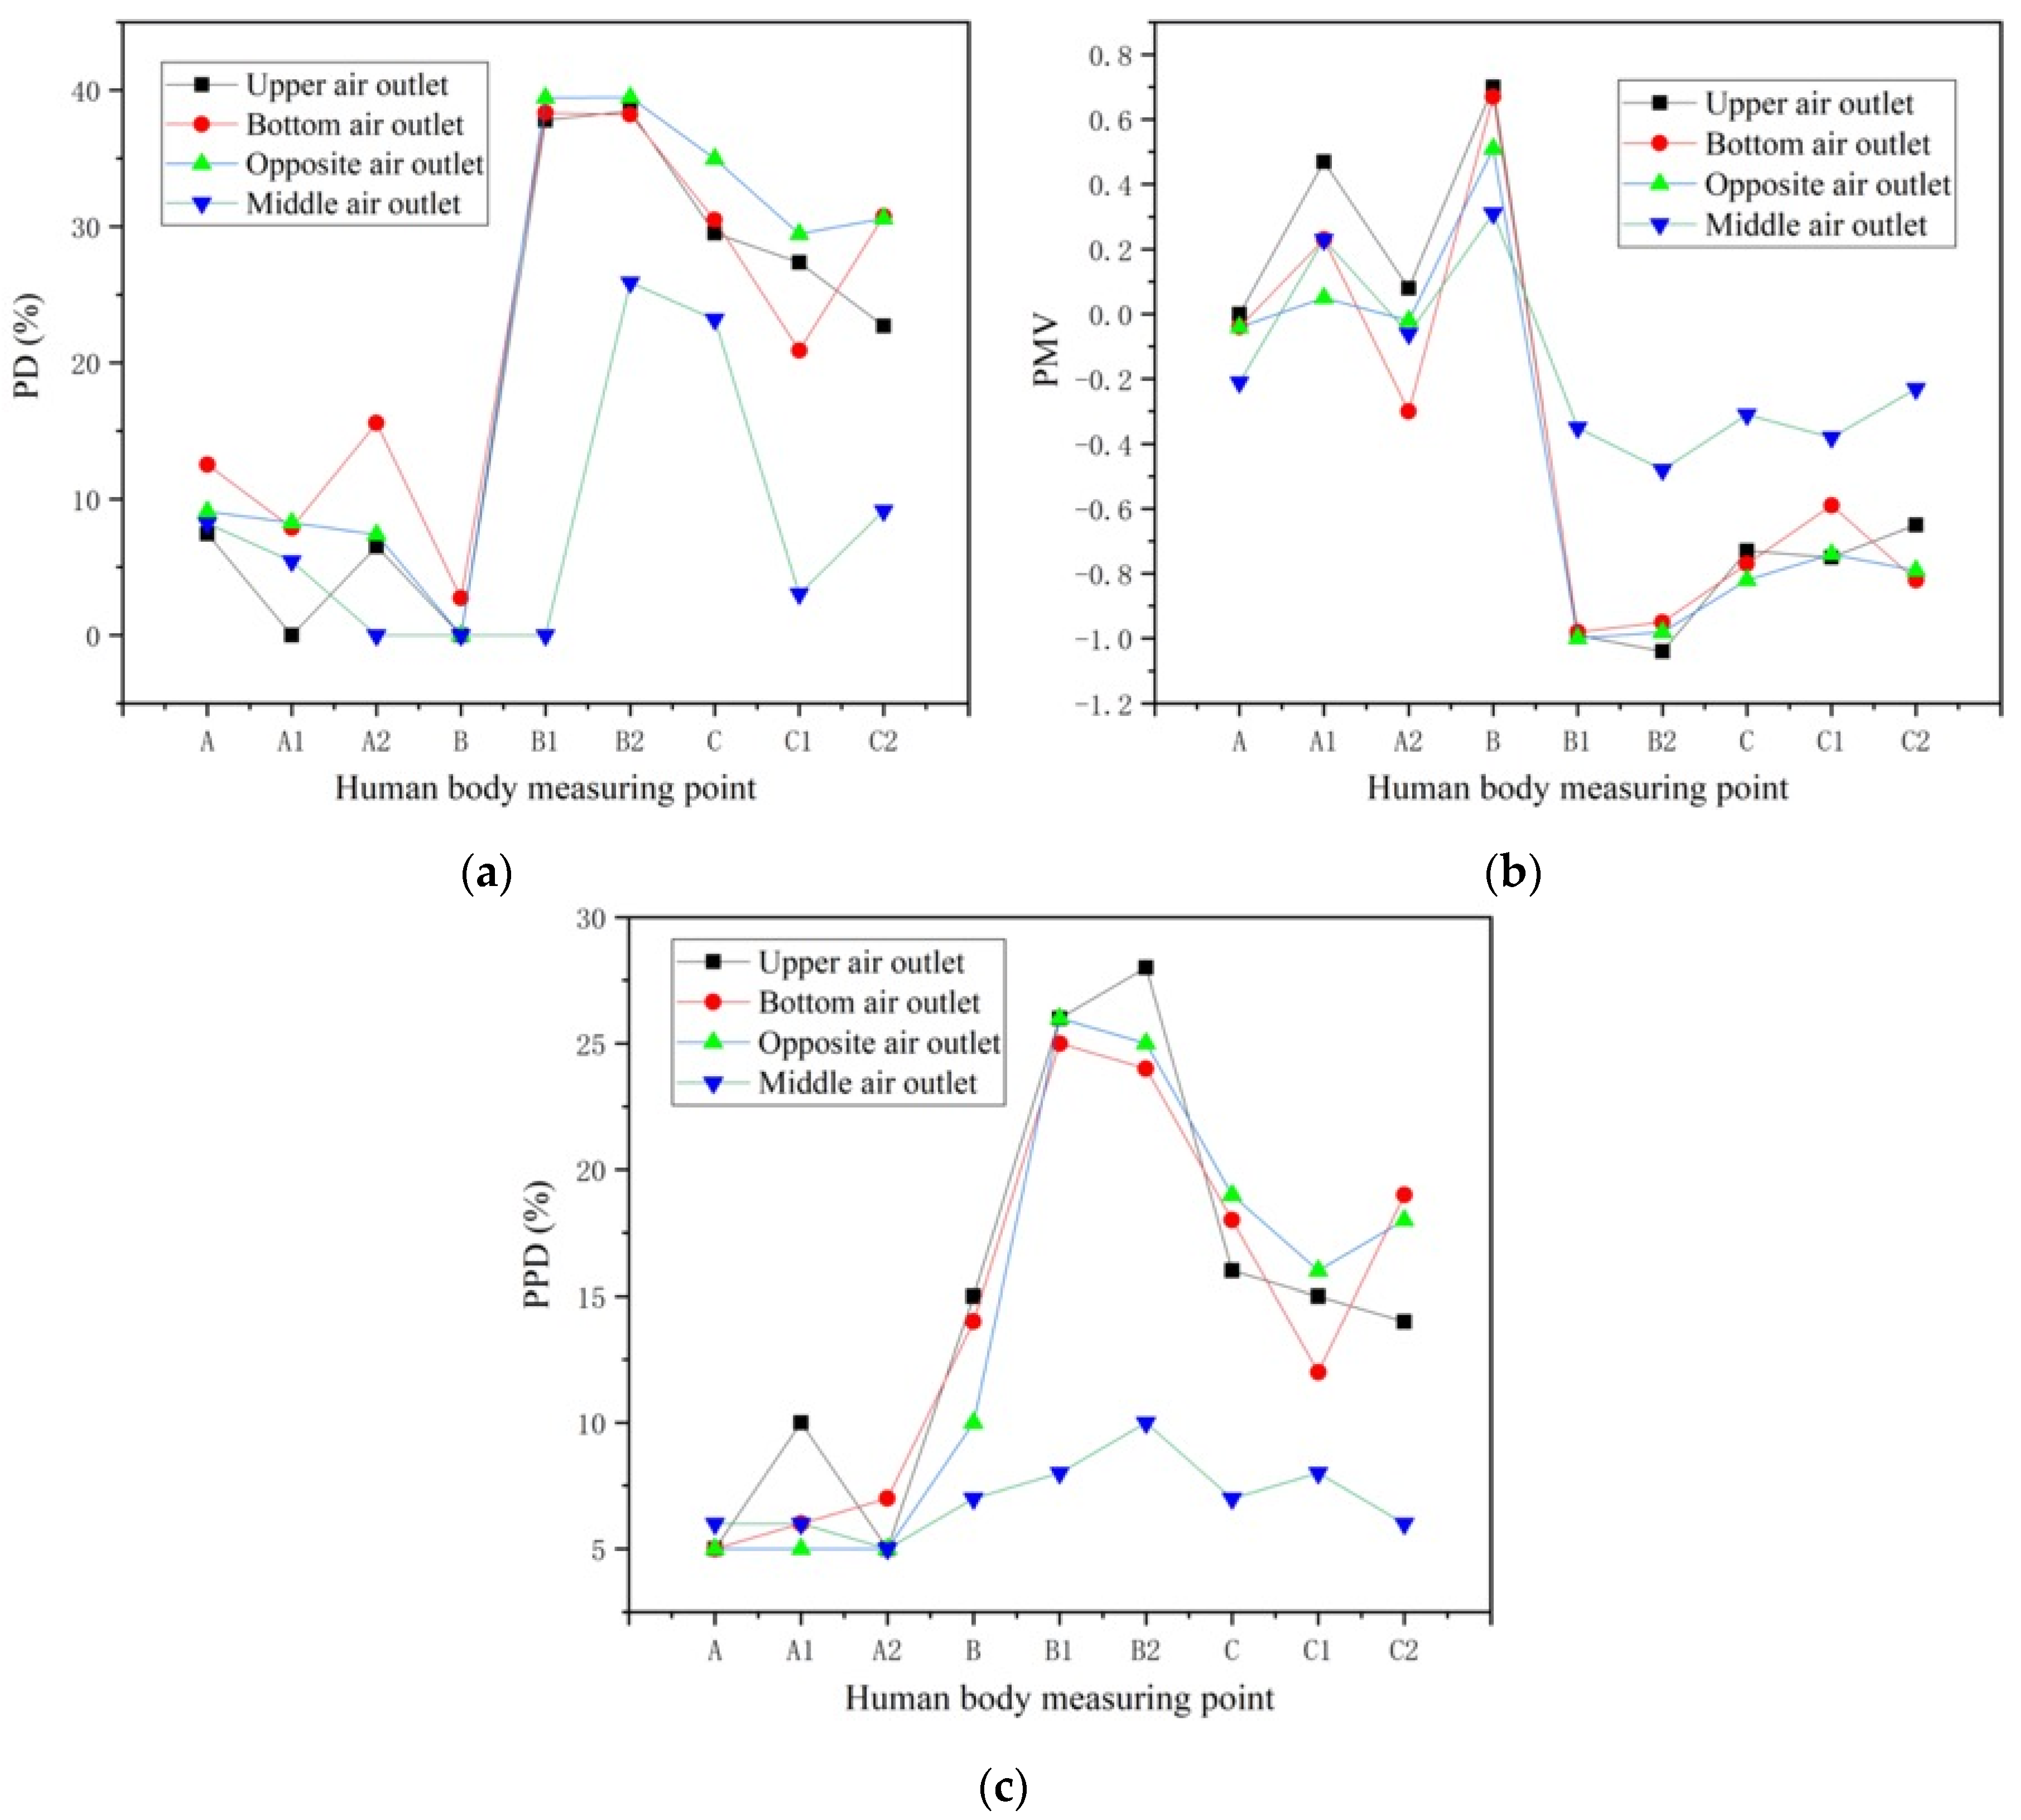
When the air outlet was located in the middle of the wall on the right side of the human body, the temperature field distribution in the room was relatively uniform, and the PMV, PPD, and PD of the measuring points around the human body fluctuated less, which conforms to the recommended standard of ISO7730, and the overall thermal comfort of the human body was considered as the scientifically optimal ones in this mode. When the air outlet was set at the bottom of the right wall of the human body, the PMV, PPD and PD of the measuring points fluctuated greatly, and the local thermal discomfort was high. When the air outlet was set on the upper part of the right wall of the human body, the distribution of the PMV, PPD, and PD of the measurement points around the human body was quite different, and the knees and ankles were obviously thermally uncomfortable, so did not meet the ISO7730 recommended standards. When the air outlet was set in the middle of the wall opposite the person, the PMV, PPD, and PD of the measurement points around the human body were significantly different, and there was an obvious blowing sensation on both sides of the knee, and the dissatisfaction percentage on both sides of the head was slightly higher, so does not meet the ISO7730 recommended standards.
In general, the use of distributed fiber air conditioners in low-carbon buildings can achieve many functions: bacterial filtration, no blowing sensation, etc. In particular, the uniformly distributed indoor velocity field and temperature field can further reduce the energy required for air conditioning and refrigeration, which makes low-carbon buildings have a lower energy consumption and better energy saving. In the future construction of green and low-carbon buildings, the split-fiber air conditioner can better exert its original advantages and provide a more comfortable living environment for human beings. It is hoped that more and more researchers can improve and perfect this, thus contributing to the joint construction of a green, low-carbon, and comfortable-living environment.

Author Contributions

Data curation, Z.D.; formal analysis, Y.L.; methodology, F.C.; Visualization, H.Y. and Y.W.; Writing—original draft, Z.D. and F.C.; Writing—review & editing, J.Y. and H.C. All authors have read and agreed to the published version of the manuscript.

Funding

This work was supported by the Postgraduate Research and Practice Innovation Program of Jiangsu Province (KYCX21_2813) and the National Natural Science Foundation of China (Grant No. 51906020).

Informed Consent Statement

This research does not involve humans.

Data Availability Statement

Data are contained within this study.

Conflicts of Interest

The authors declare no conflict of interest.

Nomenclature

fclClothing area coefficient
hcConvective heat transfer coefficient: W/(m2·°C)
MEnergy metabolic rate of human body, W/m2
PMVPredict mean vote
PPDPredict percentage of dissatisfied
PDPercentage of dissatisfied
PaPartial pressure of water vapor in indoor air, Kpa
TuTurbulence intensity, %
taTemperature of the area around the body, °C
tsRadiant temperature, °C
tclAverage radiant temperature of the outer surface of the clothed human body, °C
t s ¯ Average ambient of radiation temperature, °C
TaAir temperature around the human body, K
v   ¯ Average wind speed, m/s
WMechanical work done by the human body, W/s

References

  1. Mata, É.; Peñaloza, D.; Sandkvist, F.; Nyberg, T. What is stopping low-carbon buildings? A global review of enablers and barriers. Energy Res. Soc. Sci. 2021, 82, 102261. [Google Scholar] [CrossRef]
  2. Hewitt, D.; Coakley, S. Transforming our buildings for a low-carbon era: Five key strategies. Electr. J. 2019, 32, 106624. [Google Scholar] [CrossRef]
  3. Karlsson, I.; Rootzén, J.; Johnsson, F.; Erlandsson, M. Achieving net-zero carbon emissions in construction supply chains—A multidimensional analysis of residential building systems. Dev. Built Environ. 2021, 8, 100059. [Google Scholar] [CrossRef]
  4. Li, L. Integrating climate change impact in new building design process: A review of building life cycle carbon emission assessment methodologies. Clean. Eng. Technol. 2021, 5, 100286. [Google Scholar] [CrossRef]
  5. Peng, W.; Su, D.; Higginson, M. A novel remote control system for air conditioning in low carbon emission buildings using sensor fusion and mobile communication technologies. Build. Environ. 2018, 148, 701–713. [Google Scholar] [CrossRef] [Green Version]
  6. Arumugam, C.; Shaik, S. Air-conditioning cost saving and CO2 emission reduction prospective of buildings designed with PCM integrated blocks and roofs. Sustain. Energy Technol. Assess. 2021, 48, 101657. [Google Scholar] [CrossRef]
  7. Ahmad, F.F.; Ghenai, C.; Hamid, A.K.; Rejeb, O.; Bettayeb, M. Performance enhancement and infra-red (IR) thermography of solar photovoltaic panel using back cooling from the waste air of building centralized air conditioning system. Case Stud. Therm. Eng. 2021, 24, 100840. [Google Scholar] [CrossRef]
  8. Zhuang, C.; Wang, S. Risk-based online robust optimal control of air-conditioning systems for buildings requiring strict humidity control considering measurement uncertainties. Appl. Energy 2020, 261, 114451. [Google Scholar] [CrossRef]
  9. Chun, L.; Gong, G.; Peng, P.; Wan, Y.; Chua, K.J.; Fang, X.; Li, W. Research on thermodynamic performance of a novel building cooling system integrating dew point evaporative cooling, air-carrying energy radiant air conditioning and vacuum membrane-based dehumidification (DAV-cooling system). Energy Convers. Manag. 2021, 245, 114551. [Google Scholar] [CrossRef]
  10. Guo, Y.; Tan, Z.; Chen, H.; Li, G.; Wang, J.; Huang, R.; Liu, J.; Ahmad, T. Deep learning-based fault diagnosis of variable refrigerant flow air-conditioning system for building energy saving. Appl. Energy 2018, 225, 732–745. [Google Scholar] [CrossRef]
  11. Zhao, Q.; Lian, Z.; Lai, D. Thermal comfort models and their developments: A review. Energy Built Environ. 2020, 2, 21–33. [Google Scholar] [CrossRef]
  12. Somu, N.; Sriram, A.; Kowli, A.; Ramamritham, K. A hybrid deep transfer learning strategy for thermal comfort prediction in buildings. Build. Environ. 2021, 204, 108133. [Google Scholar] [CrossRef]
  13. Brik, B.; Esseghir, M.; Merghem-Boulahia, L.; Snoussi, H. An IoT-based deep learning approach to analyse indoor thermal comfort of disabled people. Build. Environ. 2021, 203, 108056. [Google Scholar] [CrossRef]
  14. Song, C.; Duan, G.; Wang, D.; Liu, Y.; Du, H.; Chen, G. Study on the influence of air velocity on human thermal comfort under non-uniform thermal environment. Build. Environ. 2021, 196, 107808. [Google Scholar] [CrossRef]
  15. Turhan, C.; Simani, S.; Akkurt, G.G. Development of a personalized thermal comfort driven controller for HVAC systems. Energy 2021, 237, 121568. [Google Scholar] [CrossRef]
  16. Wu, J.; Li, X.; Lin, Y.; Yan, Y.; Tu, J. A PMV-based HVAC control strategy for office rooms subjected to solar radiation. Build. Environ. 2020, 177, 106863. [Google Scholar] [CrossRef]
  17. Dong, Z.; Boyi, Q.; Pengfei, L.; Zhoujian, A. Comprehensive evaluation and optimization of rural space heating modes in cold areas based on PMV-PPD. Energy Build. 2021, 246, 111120. [Google Scholar] [CrossRef]
  18. Wang, P.; Gao, R.; Liu, R.; Yang, F. CFD-based optimization of the installation location of the wall-mounted air duct in a fully mechanized excavation face. Process Saf. Environ. Prot. 2020, 141, 234–245. [Google Scholar] [CrossRef]
  19. Taheri, A.; Khoshnevis, A.B.; Lakzian, E. The effects of wall curvature and adverse pressure gradient on air ducts in HVAC systems using turbulent entropy generation analysis. Int. J. Refrig. 2020, 113, 21–30. [Google Scholar] [CrossRef]
  20. Yang, Z.; Tu, Y.; Ma, H.; Yang, X.; Liang, C. Numerical simulation of a novel double-duct ventilation system in poultry buildings under the winter condition. Build. Environ. 2021, 207, 108557. [Google Scholar] [CrossRef]
  21. Liu, Z.; Niu, H.; Rong, R.; Cao, G.; He, B.-J.; Deng, Q. An experiment and numerical study of resuspension of fungal spore particles from HVAC ducts. Sci. Total Environ. 2019, 708, 134742. [Google Scholar] [CrossRef] [PubMed]
  22. Raphe, P.; Fellouah, H.; Poncet, S.; Ameur, M. Ventilation effectiveness of uniform and non-uniform perforated duct dif-fusers at office room. Build. Environ. 2021, 204, 108118. [Google Scholar] [CrossRef]
Figure 1. The schematic diagram of the split-fiber distribution air conditioner and openings.
Energies 15 03755 g001
Figure 2. The schematic diagram of the structure of the room.
Energies 15 03755 g002
Figure 3. (a) The distribution of the measurement points in the experimental cabin. (b) The measurement points around the human body.
Energies 15 03755 g003
Figure 4. (a) The experimental platform of the experimental cabin. (b) Internal layout of the experimental cabin.
Energies 15 03755 g004
Figure 5. (a) The PD of various parts of the human body. (b) PMV of various parts of the human body. (c) PPD of various parts of the human body.
Energies 15 03755 g005
Figure 6. The schematic diagram of the air supply of the single-row hole split-fiber air conditioner.
Energies 15 03755 g006
Figure 7. The schematic diagram of the air supply of the double-row hole split-fiber air conditioner.
Energies 15 03755 g007
Figure 8. The temperature distribution of the X = 2 m section.
Energies 15 03755 g008
Figure 9. The temperature distribution of the Z = 2 m section.
Energies 15 03755 g009
Figure 10. The temperature distribution of the Y = 0.6 m section.
Energies 15 03755 g010
Figure 11. The temperature distribution of the X = 2 m section.
Energies 15 03755 g011
Figure 12. The temperature distribution of the Z = 2 m section.
Energies 15 03755 g012
Figure 13. The temperature distribution of the Y = 0.6 m section.
Energies 15 03755 g013
Figure 14. The temperature distribution of the X = 2 m section.
Energies 15 03755 g014
Figure 15. The temperature distribution of the Z = 2 m section.
Energies 15 03755 g015
Figure 16. The temperature distribution of the Y = 0.6 m section.
Energies 15 03755 g016
Figure 17. (a) The PD in various parts of the body. (b) The PMV in various parts of the body. (c) The PPD in various parts of the body.
Energies 15 03755 g017
Figure 18. The schematic diagram of the air supply of the split-fiber distribution air conditioner at the upper air outlet.
Energies 15 03755 g018
Figure 19. The schematic diagram of the air supply of the split-fiber distribution air conditioner at the bottom exhaust port.
Energies 15 03755 g019
Figure 20. The schematic diagram of the air supply of the split-fiber air conditioner with the air outlet opposite the human body.
Energies 15 03755 g020
Figure 21. The temperature distribution of the X = 2 m section.
Energies 15 03755 g021
Figure 22. The temperature distribution of the Z = 2 m section.
Energies 15 03755 g022
Figure 23. The temperature distribution of the Y = 0.6 m section.
Energies 15 03755 g023
Figure 24. The temperature distribution of the X = 2 m section.
Energies 15 03755 g024
Figure 25. The temperature distribution of the Z = 2 m section.
Energies 15 03755 g025
Figure 26. The temperature distribution of the Y = 0.6 m section.
Energies 15 03755 g026
Figure 27. The temperature distribution of the X = 2 m section.
Energies 15 03755 g027
Figure 28. The temperature distribution of the Z = 2 m section.
Energies 15 03755 g028
Figure 29. The temperature distribution of the Y = 0.6 m section.
Energies 15 03755 g029
Figure 30. The temperature distribution of the X = 2 m section.
Energies 15 03755 g030
Figure 31. The temperature distribution of the Z = 2 m section.
Energies 15 03755 g031
Figure 32. The temperature distribution of the Y = 2 m section.
Energies 15 03755 g032
Figure 33. (a) The PD in various parts of the body. (b) The PMV in various parts of the body. (c) The PPD in various parts of the body.
Energies 15 03755 g033
Table 1. The main experimental equipment and accuracy.
Instruments and EquipmentMeasuring Range and Accuracy
Testo 480 Multifunction TesterMeasure temperature: 0–40 °C
Measurement accuracy: ±0.5 °C
Hot-bulb anemometerTest range: 0~20 m/s, −20~70 °C, 0~100 %RH
Turbulence probeTest range: 0~50 °C, 0~5 m/s, 700~1100 hPa
Table 2. The PMV indicator.
Thermal ComfortColdCoolSlightly CoolNeutralSlightly WarmWarmHot
PMV<−3−3~−2−2~−1−1~11~22~3>3
Publisher’s Note: MDPI stays neutral with regard to jurisdictional claims in published maps and institutional affiliations.

