
Meat and Bone Meal and the Energy Balance of Winter Oilseed Rape—A Case Study in North-Eastern Poland


1
Department of Agrotechnology and Agribusiness, University of Warmia and Mazury in Olsztyn, Oczapowskiego 8, 10-719 Olsztyn, Poland
2
Department of Agricultural and Environmental Chemistry, University of Warmia and Mazury in Olsztyn, Oczapowskiego 8, 10-719 Olsztyn, Poland
*
Author to whom correspondence should be addressed.
Energies 2022, 15(11), 3853; https://0-doi-org.brum.beds.ac.uk/10.3390/en15113853
Submission received: 1 May 2022
/
Revised: 18 May 2022
/
Accepted: 20 May 2022
/
Published: 24 May 2022
(This article belongs to the Special Issue Biomass Crops, Agronomic Performance & Emerging Renewable Energy Technologies)
Abstract
:A two-year field experiment was conducted in Poland to determine energy efficiency (EE) in the production of winter oilseed rape (WOR) in different fertilization: (i) zero-fertilization; (ii) 158 kg N ha−1, 45 kg P ha−1 and 145 kg K ha−1 as mineral fertilizer (NPK); (iii) 1.0 Mg ha−1 meat and bone meal (MBM), 79 kg N ha−1 and 145 kg K ha−1 as mineral fertilizer; (iv) 1.5 Mg ha−1 MBM, 40 kg N ha−1 and 145 kg K ha−1 as mineral fertilizer; and (v) 2.0 Mg ha−1 MBM and 145 kg K ha−1 as mineral fertilizer. The replacement of NPK with MBM decreased energy inputs in WOR production by 20−55%. The NPK had a greater (16–21%) effect on seed yield formation than MBM. The replacement of NPK with MBM decreased the energy output of seeds (14–21%) and total biomass (12–20). The replacement of NPK with MBM decreased (6–13%) the energy gain from seed production. The application of MBM improved the EE ratio in the production of seeds (10–81%) and total biomass (11–85%) relative to NPK. The EE ratio of WOR production increased with a rise in MBM doses.
1. Introduction
Renewable energy sources (RES) play an increasingly important role in the global energy sector. Alternative sources of energy are being sought due to the depletion of non-renewable energy sources and the adverse environmental impact of fossil fuel combustion. Renewable energy sources not only contribute to the decarbonization of the power sector, but also promote the implementation of innovative solutions in a knowledge-based economy (the EU owns 30% of the patents for renewable energy technologies). In some EU countries, around 55–72% of electric, cooling and heating energy and around 10–39% of energy in transport is generated from renewables. Biomass is the main source of alternative energy in the EU, and energy generated from biomass accounts for 45% and 73% of primary energy consumption in the EU and Poland, respectively [1]. Forests, farmland, the wood industry and organic wastes are the main sources of biomass [2,3]. Biomass (in particular dedicated energy crops) is expected to play a key role in the achievement of climate goals. For this reason, the significance of agricultural biomass has been emphasized in the EU’s circular bioeconomy strategies [4].
At present, biomass obtained from dedicated energy crop plantations is a valuable substrate for the production of primary and secondary biofuels [5]. Agricultural biomass is the main source of first-generation liquid biofuels [6]. In 2018, the global production of liquid biofuels was estimated at 146.2 billion liters (GL), where bioethanol accounted for 77% and biodiesel for 23% of total production. The world’s leading producers of bioethanol were the United States (61 GL) and Brazil (33 GL). In the USA, bioethanol is produced mainly from corn grain (Zea mays L.), whereas in Brazil, the main source of bioethanol is sugarcane (Saccharum officinarum L.) [7]. The European Union (EU) is the world’s third largest supplier of bioethanol with an annual output of 5.4 GL y−1. The EU countries have an estimated 5% share of the global bioethanol market, which is significantly below the combined bioethanol output of the USA and Brazil (83%). In the EU, bioethanol is produced mainly from cereal grain, including corn, wheat (Triticum aestivum L.), barley (Hordeum vulgare L.), and sorghum (Sorghum spp.) and sugar beets (Beta vulgaris L.) [8]. China is the world’s fourth largest producer of the discussed biofuel, and its bioethanol output reached 4.1 GL in 2018 [7]. In China, bioethanol is produced mainly from corn (70%), cassava (Manihot esculenta Crantz) (25%), sugarcane and sugar beet molasses (5%) [9]. The EU countries are the leading producers of biodiesel. They produced 11.3 GL of biodiesel in 2018, which accounted for 33% of the global output. According to estimates, biodiesel production in the EU will reach 15.5 GL in 2020, and it will account for 42% of the global output. In the EU, biodiesel is manufactured mainly from rapeseed oil (Brassica napus L.) (39%), recycled vegetable oil/cooking oil (22%) and palm oil (Elaeis guineensis L.) (19%) [8]. The USA and Brazil rank second and third among the largest biodiesel producers, supplying 20% (6.9 GL) and 16% (5.4 GL) of this biofuel, respectively [7]. In Brazil, biodiesel is produced mainly from soybean oil [Glycine max (L.) Merr.] (70%) and animal fat (16%) [10]. In the USA, biodiesel refineries use mostly soybean oil (51%), corn oil (12%), recycled oil (11%) and rapeseed oil (9%) [11]. Biofuel markets in the EU are dominated by rapeseed due to its high production volume. In 2015–2019, rapeseed accounted for 42% of oilseed crops produced in the EU (approx. 44 million Mg y−1). In the leading rapeseed-producing EU countries (France, Germany and Poland), rapeseed accounts for 72–97% of total oilseed crops [12]. The use of rapeseed for biodiesel production in the EU promotes the conversion of locally grown biomass to biofuel, which: (i) leads to net zero carbon dioxide emissions, (ii) offers an additional source of income for local agricultural producers, and (iii) provides an additional source of income for enterprises that rely on local bioresources [6,13,14].
In the EU, oilseed rape is converted to bioenergy not only because it is in relatively highly supply, but also because rapeseed production technologies are characterized by higher energy efficiency (ratio of energy output to energy input) than other oilseed crops grown in Europe [15,16,17]. The energy efficiency (EE) ratio of winter oilseed rape (WOR) ranges from 3.5–5.0 [15,18,19] to even 10.1 [20] when yields are stable and energy inputs are rational. The use of total biomass (seeds and straw) for energy generation can improve the EE ratio of WOR production even 2.2- to 2.6-fold [15,18].
An analysis of the structure of energy inputs (EI) in WOR cultivation indicates that mineral fertilization is the most energy-intensive operation [15,18,19,20,21]. A high share of fertilizers in EI is characteristic of modern production technologies of cereals [22,23,24,25,26], root crops [27,28], soybeans [29] and alternative oilseed crops (white mustard—Sinapis alba L., Indian mustard—Brassica juncea L./Czern., camelina—Camelina sativa L./Crantz, crambe—Crambe abyssinica Hochst. ex R.E.Fries.) [15,16,17,30] as well as perennials (woody plants, grasses and other herbaceous plants) [1,31,32,33,34,35,36,37].
Fertilization has a high share of energy inputs mainly because fertilizers contain considerable amounts of chemically bound energy, whereas their application is a less energy-intensive process [15,16,17,31,36]. Therefore, the energy inputs associated with mineral fertilizers can be reduced by improving nitrogen use efficiency (NUE) [30], applying fertilizers whose production requires less energy [35] or, to a smaller extent, by selecting the optimal farming machines and equipment [38]. Machines and tractors should be characterized by high performance and low fuel consumption [39,40], but according to Lewandowska–Czarnecka et al. [38], these factors do not always contribute to an increase in the EE of crop production. Rokicki et al. [41] have argued that the use of RES in farming is the only viable solution to improving agricultural mechanization without a further increase in energy inputs (at present, 60% of the energy consumed in the farming sector is derived from oil and only 10% from RES) [41].
The use of organic waste, such as sewage sludge [35,36,37,42,43], digestate from agricultural biogas plants [37,44] and meat processing waste, including meat and bone meal (MBM) [45], as fertilizers can be a viable alternative to energy-intensive mineral fertilization. The use of animal by-products in agriculture is an economically viable and environmentally justified option [46,47,48,49,50,51]. Meat bone meal can replace organic and mineral fertilizers due to its high content of nitrogen—N (80 g kg−1)—phosphorus—P (50 g kg−1)—calcium—Ca (100 g kg−1)—organic matter (700 g kg−1) and micronutrients [47,52]. Meat bone meal is low in potassium—K (approx. 3 g kg−1)—which should be supplied with other fertilizers [46,47,53,54,55].
During the decomposition of organic compounds from MBM, only some nutrients are released immediately. Other nutrients (in particular N) are temporarily immobilized by soil-dwelling microorganisms, which prevents N loss. Through mineralization, N is gradually released into the soil and becomes available to plants already in the year of MBM application [46,54,56,57,58]. Meat bone meal is a valuable source of P, and it can resolve the problems associated with the limited availability of raw materials for the production of conventional phosphate fertilizers. Phosphate rock is a non-renewable resource that cannot be naturally substituted or recovered. Therefore, the recycling of P from animal waste streams can contribute to sustainable use of P deposits worldwide [56,59,60,61].
The regulation of the inflow and outflow of both biogenic elements (N and P) has an immense environmental impact. Rational management of organic waste reduces the amount of biogenic elements that are cycled in the environment. When used in the production of cereals, grasses, maize and WOR, MBM exerted comparable yield-forming effects to mineral fertilizers, and it improved soil fertility and the quality of agricultural produce [45,46,47,48,49,53,55,56,62,63,64,65,66,67,68].
Alternative fertilizers derived from by-products and various types of biomass are applied to improve nutrient cycling in food systems. The influence of recycled fertilizers on the EE of biomass production remains insufficiently investigated [45]. Therefore, the aim of this study was to determine the optimal fertilization strategy involving NPK and MBM in WOR cultivation based on an analysis of EI, EO, EG and EE values. The results presented in this article were obtained based on direct measurements of energy inputs associated with labor, fuel consumption and the operation of machines and devices in production technologies that are typical of large-area farms.
2. Materials and Methods
2.1. Field Experiment
Winter oilseed rape was grown during a small-area field experiment conducted in 2015–2017 in the Agricultural Experiment Station (AES) in Tomaszkowo (53°35′ N, 20°36′ E; NE Poland), owned by the University of Warmia and Mazury in Olsztyn. The experimental treatments were as follows: (i) zero-fertilization (control); (ii) 158 kg N ha−1, 45 kg P ha−1 and 145 kg K ha−1 as mineral fertilizer (NPK); (iii) 1.0 Mg ha−1 MBM, 79 kg N ha−1 and 145 kg K ha−1 as mineral fertilizer (MBM_1.0); (iv) 1.5 Mg ha−1 MBM, 40 kg N ha−1 and 145 kg K ha−1 as mineral fertilizer (MBM_1.5); and (v) 2.0 Mg ha−1 MBM and 145 kg K ha−1 as mineral fertilizer (MBM_2.0).
In treatment ii, the total N rate was applied in three doses: 30 kg ha−1 (before sowing, as urea, 46% N), 80 kg ha−1 (at the beginning of the spring growing season, as ammonium nitrate, 34% N), and 48 kg ha−1 (at the beginning of inflorescence emergence, as ammonium nitrate, 34% N). Phosphorus was applied as granular triple superphosphate (20.1% P) in a single dose before sowing. Meat bone meal (treatments iii–v) was purchased from SARIA Poland Ltd. (Branch Sarval Plant, Długi Borek, NE Poland), and it had the following composition: 963 g kg−1 dry matter (DM), 710 g kg−1 organic matter, 280 g kg−1 DM crude ash, 137 g kg−1 DM crude fat, 78.7 g N kg−1 DM, 45.3 g P kg−1 DM, 3.32 g K kg−1 DM, 100.1 g Ca kg−1 DM, 6.8 g Na kg−1 DM and 2.0 g Mg kg−1 DM. The applied MBM had a pH of 6.3. To maintain a constant N rate (158 kg ha−1), MBM was supplemented with mineral N at 79 kg ha−1 (treatment iii) or 40 kg ha−1 (treatment iv), applied as ammonium nitrate (34% N) at the beginning of the spring growing season. To compensate for its low K content (approx. 3.3 g kg−1 DM), MBM was supplemented with mineral K that was applied before sowing at a constant rate (145 kg K ha−1) in all treatments (ii–v) as potash salt (49.8% K) and potassium sulfate (41.5% K and 17% S), at rates equivalent to 72 and 73 kg K ha−1, respectively. Potassium sulfate (equivalent to 73 kg K ha−1) supplied 30 kg S ha−1.
Each year, the SY Saveo hybrid variety of WOR was sown on 25 or 26 August at a density of 50 germinating seeds per m2, with 20 cm spacing. Soil in the experimental fields was classified as Dystric Cambisol [69]. Plot size was 20 m2 (5 m by 4 m). Winter wheat (Triticum aestivum L.) was the preceding crop. All cultivation and crop protection measures were applied in accordance with good agricultural practices (Table 1). The experiment had a randomized block design (RBD) with four replications.
2.2. Energy Inputs Analysis
Energy inputs (EI) in WOR production were determined based on: (i) diesel oil consumption, operating time of tractors and machines, labor and the performance of agricultural machines Equation (1) (data were collected in a field with an area of 25 ha at the AES in Tomaszkowo in 2015–2017) (Table 2), and (ii) energy equivalents (Table 3, according to Wójcicki [70] and Fore et al. [71]). Energy inputs were divided into two categories: (i) farming operations and (ii) energy fluxes.
where
EItotal = EIdiesel + EImachines + EImaterials + EIlabor
- EItotal—total energy inputs (GJ ha−1),
- EIdiesel—energy inputs associated with diesel fuel consumption (GJ ha−1),
- EImachines—energy inputs associated with the operation of tractors and machines (GJ ha−1),
- EImaterials—energy inputs associated with materials (GJ ha−1),
- EIlabor—energy inputs associated with labor (GJ ha−1).
2.3. Biomass Processing Experiment
The dry matter yield (DMY) of harvested WOR biomass (seeds and straw) was calculated with the use of Equation (2). The fresh matter yield (FMY) of harvested WOR biomass was determined based on the work of Załuszniewska and Nogalska [67] and Nogalska and Załuszniewska [68]. The DM content of harvested WOR biomass was estimated by drying a subsample of 1 kg at 105 °C in a ventilated oven (FD 53 Binder GmbH, Tuttlingen, Germany) until constant weight.
2.4. Energy Output Analysis
The lower heating value (LHV) of WOR biomass was calculated based on Equation (3). The higher heating value (HHV) of WOR biomass (seeds and straw) was determined by adiabatic combustion in a calorimeter (IKA C 2000, Cincinnati, OH, USA) with the use of a dynamic method. The energy output (EO) of WOR biomass was calculated based on Equation (4).
where
- LHV—lower heating value of fresh biomass (MJ kg−1),
- HHV—higher heating value of dry biomass (MJ kg−1),
- W—biomass moisture content (%),
- 0.0244—correction coefficient for water vaporization enthalpy (MJ kg−1 per 1% moisture content).
Energy output (GJ ha−1) = LHV (GJ Mg−1) × FMY (Mg ha−1)
2.5. Energy Gain and the Energy Efficiency Ratio
The energy analysis of the WOR production technology involved two indicators: (i) energy gain (EG) and (ii) the energy efficiency (EE) ratio, which were calculated using Equations (5) and (6), respectively.
Energy gain (GJ ha−1) = Energy output (GJ ha−1) − Energy inputs (GJ ha−1)
2.6. Statistical Analysis
The values of DMY, LHV, EO, EG and EE ratio were processed by analysis of variance (ANOVA), where the fertilizer type (NPK and MBM) was the fixed factor, and two years of WOR cultivation (2015/2016 and 2016/2017) and replications were the repeated factor. Treatment means were compared in Tukey’s honest significant difference (HSD) test. All analyses were performed in the Statistica 13.3 program [72]. The F-values of ANOVA are presented in Table 4.
3. Results
3.1. Weather Conditions
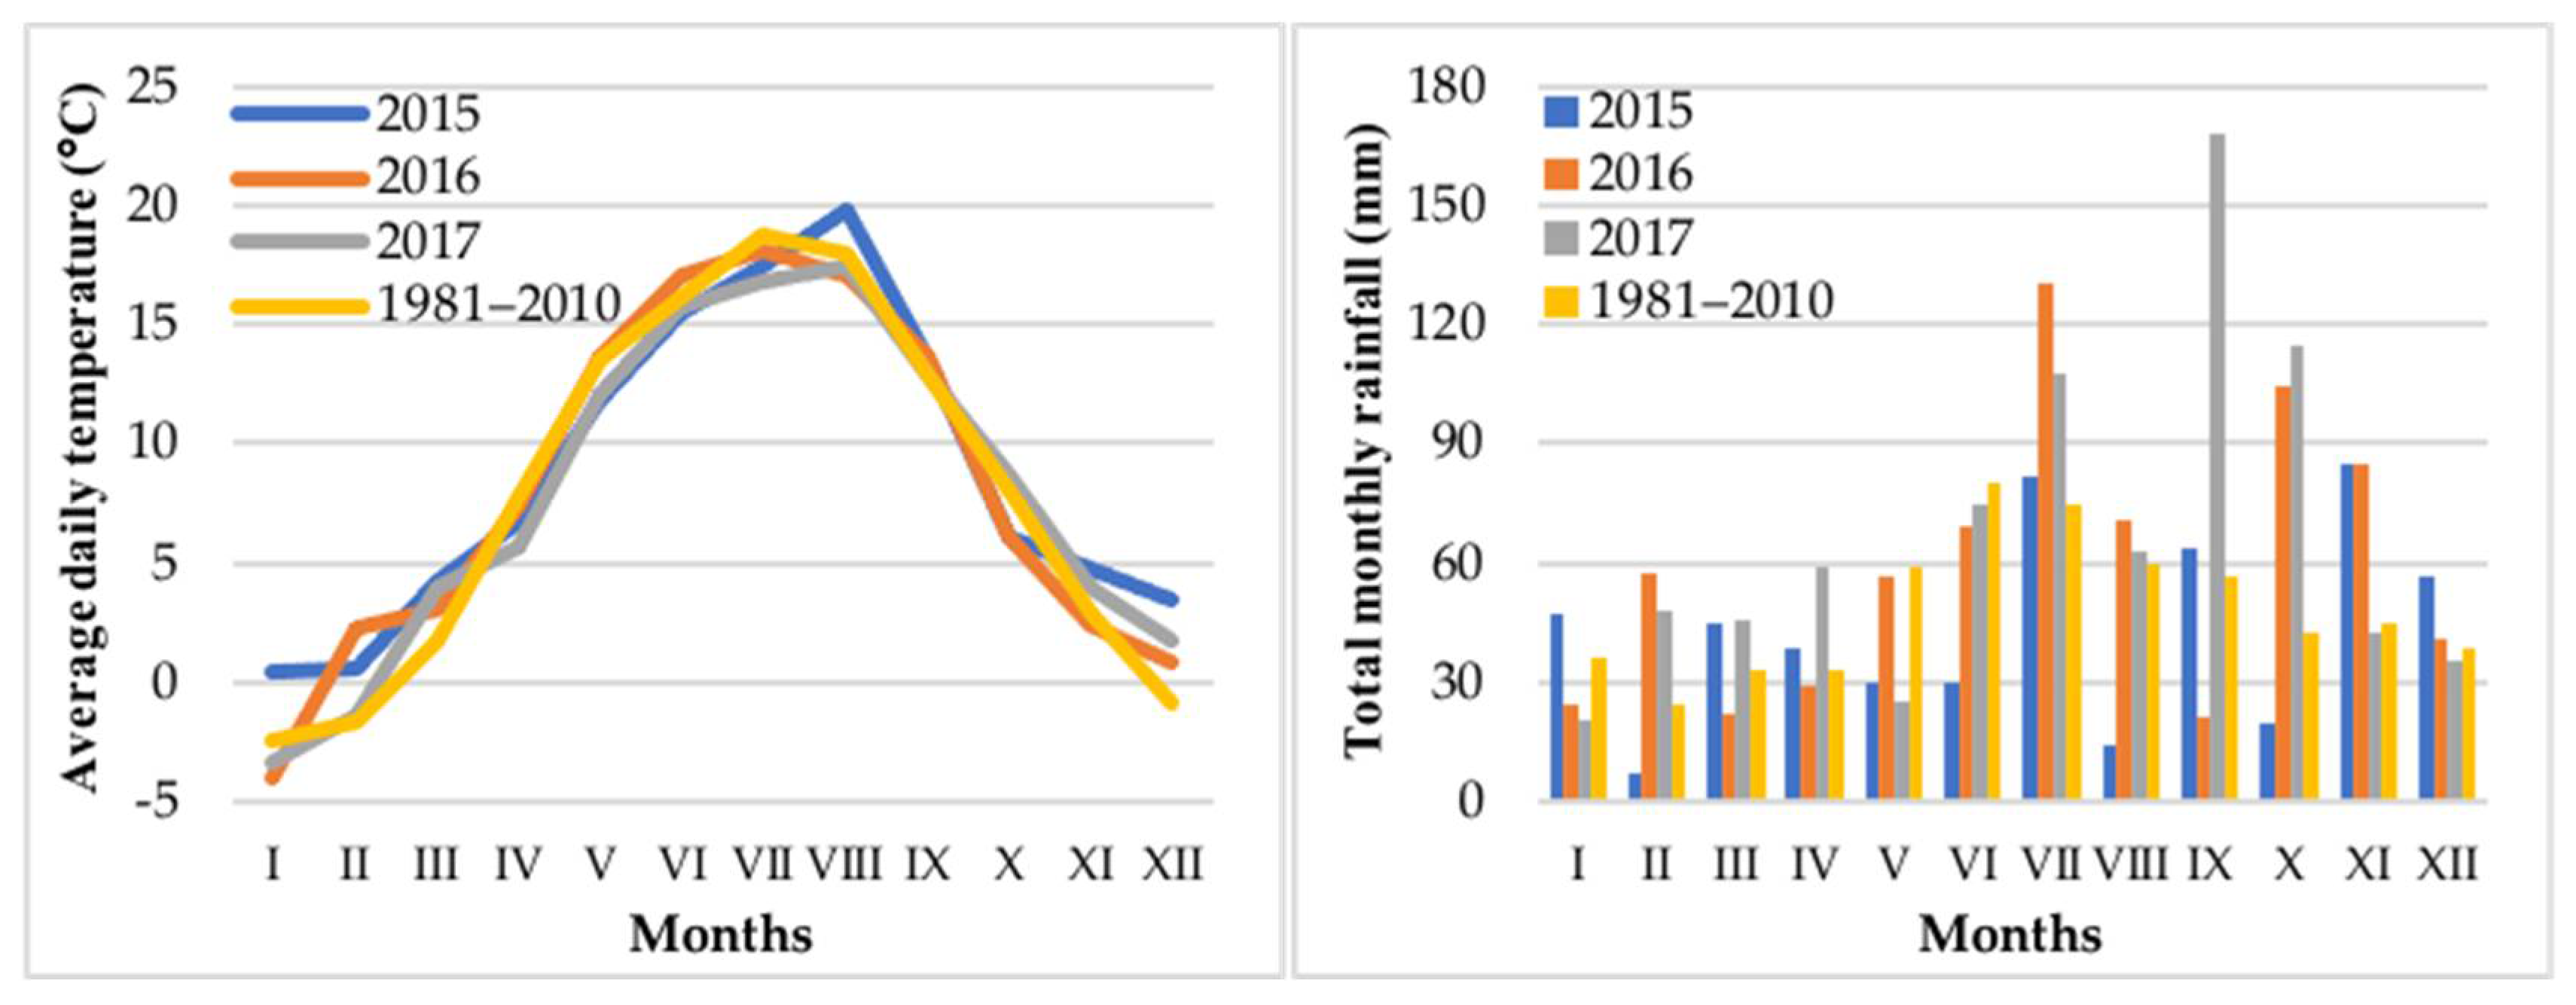
Mean daily air temperature during the fall growing season of WOR (August–November 2015 and 2016) approximated (±0.6 °C) the long-term average (1981–2010) (Figure 1). Total precipitation during the fall growing season of WOR differed from the long-term average in both years of the study. In the first year, precipitation in fall was 11% lower than the long-term average. In the second year, precipitation in August-November was 38% higher than the long-term average for this period. Weather conditions were conducive to winter dormancy. Sub-zero temperatures (−1.4 to −4.0 °C) were noted only in January in the first year of the study and in January and February in the second year. The distribution and amount of precipitation in spring and summer were more favorable in the first year of the experiment. Precipitation reached 285 mm between April and July, and it exceeded the long-term average by 16%. In the second year, precipitation during the spring-summer growing season approximated the long-term average (246 mm), but its distribution was less favorable. Rainfall fell mostly (approx. 40%) in July during WOR ripening. In May, during WOR flowering, precipitation was 57% lower than the long-term average for this month. In both years of the study, mean daily air temperature during the spring–summer growing season was comparable with the long-term average (14.0 °C) (Figure 1).
3.2. Energy Inputs
Conventional mineral fertilization (NPK) of WOR was the most energy-intensive (18.1 GJ ha−1) (Table 5), and fertilizer application accounted for around 75% of total EI in this treatment. The inclusion of MBM in the fertilization system decreased energy consumption in WOR production by 24% (1.0 Mg ha−1), 40% (1.5 Mg ha−1) and 57% (2.0 Mg ha−1) (Table 5).
A flux analysis of EI in the zero-fertilization technology demonstrated that fuel, tractors and machines were the main EI in WOR production (Table 6). These EI accounted for 59% and 23% of total EI in WOR cultivation, respectively (2.7 and 1.0 GJ ha−1, respectively) (Table 6). The application of NPK fertilizers in WOR production increased the share of EI associated with agricultural materials to 14.0 GJ ha−1, i.e., 77% of total EI. The application of MBM with a simultaneous reduction/elimination of mineral N and P fertilizers decreased the EI associated with agricultural materials 1.6 to 4.7-fold (14.0 vs. 8.8–3.0 GJ ha−1) (Table 6).
3.3. Biomass Yield
The yield of WOR biomass (seeds and straw) was determined by both weather conditions and fertilization. In the second year of the study (2017), characterized by low precipitation (43% of long-term average) during WOR flowering (May), the DMY of seeds and straw was 10% and 9% lower, respectively, than in the first year of the study when precipitation was more evenly distributed during the spring–summer growing season (Table 7).
The average DMY of seeds and straw in two growing seasons ranged from 1.55 to 2.86 Mg ha−1 and from 1.81 to 3.38 Mg ha−1, respectively. The DMY of seeds was highest in the NPK treatment. The replacement of NPK with MBM decreased the DMY of seeds by 0.41 to 0.59 Mg ha−1 (by 14–21%) (Table 7). In the zero-fertilization (control) treatment, the DMY of seeds decreased by 1.31 Mg ha−1 (by 46%) relative to the NPK treatment. A decrease in the DMY of straw (by 0.71 Mg ha−1) was noted only in the treatment with the highest MBM dose (2.0 Mg ha−1). Lower MBM doses (1.0 and 1.5 Mg ha−1) and NPK fertilization exerted a similar effect on the DMY of the straw. When the application of NPK fertilizer or MBM was abandoned, the DMY of the straw decreased by 1.57 and 1.17 Mg ha−1, respectively (Table 7).
3.4. Energy Output
The LHV of WOR seeds and straw reached 23.20–23.58 and 12.37–12.12 MJ kg−1, respectively (Table 8). Seeds harvested in the second year of the study and straw harvested in the first year were characterized by higher LHV (by 2% each). Only the LHV of the straw was significantly affected by fertilization, and it peaked (12.59 MJ kg−1) after the application of 2.0 Mg ha−1 MBM. The LHV of straw supplied with lower MBM doses or NPK fertilizer (12.19 MJ kg−1) was comparable with that in the control treatment (12.0–12.23 MJ kg−1) (Table 8).
The EO of total biomass was 1.7-fold higher than the EO of seeds only (94.7 vs. 57.0 GJ ha−1) (Table 9). The highest EO of seeds (59.5 GJ ha−1) and the highest total biomass (99.3 GJ ha−1) were noted in the first year of the study which was characterized by the most favorable distribution and amount of precipitation in the spring–summer growing season. In the second year (characterized by a water deficit during flowering), the EO of seeds and total biomass was 8% and 9% lower, respectively. The EO of seeds and total biomass was highest in the NPK technology (70.5 and 115.6 GJ ha−1, respectively), moderate in the MBM technology (55.8–60.6 and 92.5–101.9 GJ ha−1, respectively) and lowest in the zero-fertilization technology (38.5 and 62.6 GJ ha−1, respectively) (Table 9).
3.5. Energy Gain and Energy Efficiency Ratio
The EG from seed and total biomass production was higher by 12% and 11%, respectively, in the first than in the second year of the study (Table 10). The highest EG from seed production (52.7 GJ ha−1) was achieved in the NPK treatment. The application of MBM decreased the EG from seed production by 6–13%. The EG from seed production was lowest (34.0 GJ ha−1) in the zero-fertilization (control) treatment (Table 10). When straw was included in the energy balance of WOR production, the average EG was 82% higher than in the variant where only seeds were used (79.3–88.4 vs. 43.5–48.6 GJ ha−1). The EG from total biomass production was lowest (58.9 GJ ha−1) in the zero-fertilization treatment. The application of NPK and MBM increased the EG from total biomass production by 53% on average (31.4 GJ ha−1) (Table 10).
The EE ratio of seeds was highest (8.61) in the low-input (zero-fertilization) technology of WOR production (Figure 2). The lowest EE ratio (3.94) was noted in the mineral fertilization (NPK) technology. Meat bone meal increased the EE ratio of WOR seeds. The EE ratio of seeds increased with a rise in MBM dose by 10% (MBM_1.0), 42% (MBM_1.5) and 82% (MBM_2.0) relative to NPK. It is worth noting that even in the treatment with the highest MBM dose (2.0 Mg ha−1), the EE ratio of WOR seeds was 17% lower than in the control (zero-fertilization) treatment. The EE ratio of total biomass (seeds and straw) was 66% higher on average. When MBM was applied at 2.0 Mg ha−1, the EE ratio of total biomass was similar to that noted in the control (zero-fertilization) treatment. A decrease in the MBM dose to 1.5 and 1.0 Mg ha−1 and the replacement of MBM with mineral fertilization (NPK) reduced the EE ratio of WOR production by 33%, 47% and 53%, respectively (Figure 2).
4. Discussion
4.1. Energy Inputs
In the EU, the EI is associated with WOR production in the high-input technology range from 27 to 39 GJ ha−1 [15,18,19,20,73,74]. Such high EI values can be explained by the fact that energy consumption in WOR production is strongly influenced by the applied technology, in particular mineral fertilization that accounts for around 70–86% of total EI ([18,19,20], present study, Table 5). Total EI in the low-input production technology (with reduced mineral fertilization rates) were estimated at 13–19 GJ ha–1 ([20,74,75], present study, Table 5 and Table 6).
The high energy intensity of fertilization results from the fact that mineral fertilizers contain large amounts of chemically bound energy [18,76,77]. Therefore, energy consumption in crop production can be considerably reduced when mineral fertilizers are replaced with recycled fertilizers (sewage sludge, digestate from biogas plants) [35,36,44,45]. In the present study, the inclusion of MBM in the fertilization system decreased EI in WOR production by 20% to 55%. Jankowski et al. [36] found that the use of sewage sludge as a substitute for mineral fertilizers decreased energy consumption in the cultivation of Jerusalem artichoke (Helianthus tuberosus L.) by 27% to 54%, depending on plantation age. The application of sewage sludge decreased the demand for energy in the production of giant miscanthus (Miscanthus × giganteus Greef & Deuter) by 32–34%, compared with conventional mineral fertilizers [35]. Organic wastes decreased EI in the production of Amur silvergrass (Miscanthus sacchariflorus Maxim./Hack.) by 34–40% (sewage sludge) and 41–48% (digestate) [37]. In a study by Gissén et al. [44], the demand for energy in the cultivation of maize, hemp (Cannabis sativa L.), triticale (× Triticosecale Wittm.), grass-clover ley, winter wheat and sugar beet was reduced by 23–41% when digestate was used as a partial substitute for mineral fertilizer.
4.2. Biomass Yield
In recent decades, WOR yields increased due to breeding progress, the application of modern production technologies and higher inputs, mostly those associated with mineral fertilizers. Fertilization remains the key yield-forming factor in the cultivation of WOR, a species with relatively high nutrient requirements [19,20,33,78,79,80,81,82]. The efficiency of WOR fertilization is determined by weather conditions, preceding crop, agronomic factors, as well as fertilizer type, rate and timing [20,78,80,83,84]. As a by-product of the meat industry, MBM is an important pathway for N and P recycling, which is consistent with the European Green Deal promoting lower energy use in production processes (including mineral fertilizers), environmental protection and circular economy. Moreover, MBM is generally managed through incineration and long-term storage, and these costly procedures can be eliminated when MBM is utilized in agriculture. Therefore, the use of animal by-products as substitutes for mineral fertilizers is economically and environmentally justified [54,59,60,61]. In the current study, fertilization had a significant effect on the harvested WOR biomass (seeds and straw). The DMY of seeds (2.86 Mg ha−1) and straw (3.38 Mg ha−1) was highest in the NPK treatment. In the zero-fertilization treatment, the DMY of seeds and straw decreased by 46% on average. The replacement of NPK with MBM decreased the DMY of seeds by 17% on average, but it had no influence on the DMY of straw. When applied at 2.0–2.5 Mg ha−1, MBM fully catered to the N requirements of cereals (maize, winter wheat, winter triticale and spring barley (Hordeum vulgare L.)), and its yield-forming effect was comparable with that of mineral fertilizers [55,63,65]. The yield potential of WOR is largely affected by factors other than fertilizers, such as variety, agronomic treatments, habitat and climatic conditions [79,83]. Weather conditions during the growing season of WOR can determine seed yields up to 40% [84]. It should be stressed that in both growing seasons, weather conditions were not conducive to the growth and development of WOR, therefore, yields were relatively low. The DMY of seeds and straw was significantly lower in the second than in the first year of the study. These differences resulted from uneven rainfall distribution, in particular considerable water deficit in May (WOR flowering) in the second year of the experiment.
4.3. Energy Output
The EO of total WOR biomass (seeds and straw) in the high-input technology ranges from 269 to 314 GJ ha−1 [15,18], where around 17% of that energy can be converted to liquid fuels (energy accumulated in oil) and 83% to solid fuels (energy accumulated in straw and fat-free seed residues) [18]. In simplified (low-input) production technologies, the EO of WOR biomass is reduced by 22% (medium-input technologies) and 30% (low-input technologies) on average [18]. The present findings (Table 9) and the results reported by Groth et al. [20] and Sokólski et al. [19] point to a strong correlation between EI in the production technology and the EO of WOR biomass. In the current study, the highest EO of seeds (70.5 GJ ha−1) and total biomass (115.6 GJ ha−1) was noted in the NPK technology. The EO of seeds and total biomass was reduced by 45% on average when fertilization was abandoned (control treatment). An increase in EI in the production process also improved the EO of other crop species, including giant miscanthus (increase of 4–10%) [35,42], fodder galega (Galega orientalis Lam.) (increase of 5–6%) [34], Amur silvergrass (increase of 14%) [37] and Jerusalem artichoke (increase of 20%) [36].
An analysis of the literature indicates that low-input production technologies induce a much smaller decrease in the EO of perennial energy crops than WOR (4–20% vs. 30–45%). According to Budzyński et al. [18], the agricultural requirements of WOR can be minimized (and, consequently, extensive production technology can be introduced) only through breeding progress (varietal improvement) by: (i) increasing yields and improving yield stability, (ii) increasing resistance to disease and environmental stressors, and (iii) improving the biometric parameters of crops and adapting crops to modern (large area) production technologies (semi-dwarf and dwarf varieties). The above hypothesis was indirectly validated by Groth et al. [20] in whose study the EO of WOR seeds was highest in a hybrid variety with a conventional growth habit (141–173 GJ ha−1), followed by a semi-dwarf hybrid variety (132–161 GJ ha−1) and an open-pollinated variety (113–152 GJ ha−1).
Fertilization is an agronomic factor that exerts the greatest influence on the biomass yields and, consequently, the EO of crops [1,15,16,18,19,20,24,25,30,31,33,34,35,36,37,76]. In the present study, the replacement of NPK with MBM decreased the EO of WOR biomass by 12–21% on average. However, the EO of perennial energy crops increased when recycled fertilizers were applied instead of mineral fertilizers. An increase in the EO of hemp biomass (by 20%) [85] and giant miscanthus (10%) [42] was reported in treatments fertilized with sewage sludge relative to treatments fertilized with conventional mineral fertilizers. Dubis et al. [35,37] found that the relationship between fertilizer type and EO was influenced by the N rate in the production of grasses of the genus Miscanthus. In treatments supplied with a lower N rate (100 kg ha−1), the EO of giant miscanthus and Amur silvergrass biomass increased (by 3–4%) after the application of mineral fertilizers. When the N rate was increased to 160 kg ha−1, recycled fertilizers (sewage sludge, digestate) induced a similar (giant miscanthus) or a greater (Amur silvergrass) increase in the EO of biomass in comparison with mineral fertilizers [35,37]. Jankowski et al. [36] found a relationship between fertilizer type and the age of a Jerusalem artichoke plantation. Sewage sludge induced the greatest increase in EO in the year of plantation establishment; mineral fertilizers were most effective in the second year, whereas the choice of fertilizer did not affect the EO of the Jerusalem artichoke in the third year of the study.
4.4. Energy Gain and the Energy Efficiency Ratio
The EG from biomass production is influenced mainly by the type of agronomic management which determines EI and EO [16]. Under the agroecological conditions of Poland, WOR is characterized by the highest EO (62–112 GJ ha−1) in the group of oilseed crops of the family Brassicaceae [15,86]. The EG from total WOR biomass (seeds and straw) ranges from 145 to even 314 GJ ha−1 [15,18]. In the present study, the EG from WOR cultivation was determined at 34–53 GJ ha−1 (seeds) and 59–98 GJ ha−1 (seeds and straw).
Effective agronomic management increases EG by directly influencing biomass yields. High-input production technologies improved the EG from both annual Brassica oilseed crops [16,18,19,20] and perennial lignocellulosic crops [25,33,34,35,36,37]. Similar observations were made in the current study. The highest EG from seeds (52.7 GJ ha−1) and total biomass (97.8 GJ ha−1) was noted in the high-input technology with NPK fertilization. When NPK were replaced with MBM, the EG from seeds decreased by 6–13%, whereas significant differences in the EG from total biomass were not observed. In the zero-fertilization technology, the EG from seeds decreased by (26–36%), and the EG from total biomass decreased by 30–40%.
The EE of biomass production is the key criterion in the process of selecting the optimal crop species for energy generation [20]. The EE ratio of WOR seeds produced in high-input technology ranges from 3.0–5.6 ([15,18,19], present study, Figure 2) to even 7.2–10.1 ([20], present study, Figure 2). The EE ratio of total WOR biomass (seeds and straw) was determined in the range of 8.6–12.0 ([15,18], present study, Figure 2) to 14 (present study, Figure 2).
High-input production technologies have contributed to food self-sufficiency in many regions of the world. However, these technologies have also increased agricultural systems’ dependence on fossil energy [87]. Intensive farming methods have considerably decreased EE in the production of agricultural biomass and food crops [88], in particular in crop species that require high levels of agricultural inputs and energy to achieve high yields. In studies conducted in NE Poland, agricultural intensification led to a greater increase in EI than EO in WOR production, which decreased EE by 18% [18] and 27–34% [20]. In turn, Sokólski et al. [19] found that modern WOR cultivars were characterized by high EE in both high- and low-input production technologies. However, agronomic treatments that do not involve additional inputs or exert a minor influence on EI (cultivar, sowing date, seeding rate) have to be performed precisely, and mineral fertilizers have to be applied rationally to achieve the above goal. In a study by Sokólski et al. [19] investigating a semi-dwarf variety of WOR, the production technology characterized by the highest seed yield was also characterized by the highest EE ratio (4.7–5.0). In turn, in the cultivation of a long-stem WOR variety, the EE ratio was highest (4.9) in the low-input production process [19]. In WOR production, mineral fertilizers have to be applied rationally because these agricultural inputs are highly energy-intensive (fertilizers account for 73–86% of total EI in WOR production) ([15,18,19,20,21], present study, Table 5). Mineral fertilizers can be replaced with recycled fertilizers such as sewage sludge, digestate and natural fertilizers (liquid and solid manure, slurry) which decrease EI, while increasing the EE of crop production [35,36,37,45]. In the present study, the low-input technology of WOR production (zero-fertilization) was characterized by the highest EE ratio of seeds (8.61). The application of NPK fertilizers or MBM decreased the EE ratio of seeds by 49–54% (NPK, MBM at 1.0 Mg ha−1) or only 17% (MBM at 2.0 Mg ha−1). It should also be noted that the EE ratio of total biomass was similar in the technology involving MBM at 2.0 Mg ha−1 and the zero-fertilization technology. Research involving perennial lignocellulosic crops confirmed the benefits of replacing mineral fertilizers with recycled fertilizers [35,36,37]. In the production of Amur silvergrass biomass, the EE ratio was highest in treatments fertilized with digestate (13.2–14.4), followed by sewage sludge (11.4–13.0), and it was lowest in treatments supplied with mineral fertilizers (6.7–8.8) [37]. Sewage sludge also induced a greater increase in the EE ratio of giant miscanthus (43–52%) and Jerusalem artichoke (78–90%) production than mineral fertilizers [35,36].
5. Conclusions
The replacement of conventional NPK fertilizers with MBM decreased EI in WOR production by 20−55%. Mineral fertilizers had a greater effect (16–21%) on seed yield formation than MBM, whereas mineral fertilizers and MBM exerted similar effects on straw yields. The replacement of NPK with MBM decreased the EO of seeds and total biomass by 14–21% and 12–20%, respectively. Energy efficiency was highest in the zero-fertilization treatment (seeds only) and MBM treatments (total biomass). These production technologies are recommended when the availability of energy (not land) is the main limiting factor in WOR production for energy generation, i.e., in large-scale farms. In small farms, where land (not energy) is the main limiting factor, WOR should be supplied with conventional NPK fertilizers (when only seeds are used for energy generation) or recycled fertilizers (when both seeds and straw are used for energy generation) to achieve the highest EG per unit area. The present findings show that the application of MBM to WOR grown for energy can be an effective method for its agricultural utilization. Meat bone meal is a valuable source of nutrients which can improve the EE of WOR production.
Author Contributions
Conceptualization A.N.; methodology A.N. and K.J.J.; software K.J.J. and A.N.; validation K.J.J. and A.N.; formal analysis K.J.J.; investigation K.J.J. and A.N.; resources K.J.J. and A.N.; data curation K.J.J. and A.N.; writing—original draft preparation K.J.J. and A.N.; writing—review and editing K.J.J. and A.N.; visualization K.J.J. and A.N.; supervision K.J.J. and A.N.; project administration A.N.; funding acquisition K.J.J. All authors have read and agreed to the published version of the manuscript.
Funding
The results presented in this paper were obtained as part of a comprehensive study conducted at the University of Warmia and Mazury in Olsztyn (grant No. 30.610.003–110 and 30.610.013–110). The project was financially supported by the Minister of Education and Science under the program entitled “Regional Initiative of Excellence” for the years 2019–2022, Project No. 010/RID/2018/19, amount of funding: PLN 12 000 000.
Institutional Review Board Statement
Not applicable.
Informed Consent Statement
Not applicable.
Data Availability Statement
Not applicable.
Acknowledgments
We would like to thank the staff of the Agricultural Experiment Station in Tomaszkowo for technical support during the experiment.
Conflicts of Interest
The authors declare no conflict of interest.
References
- Stolarski, M.J.; Krzyżaniak, M.; Warmiński, K.; Olba-Zięty, E.; Penni, D.; Bordiean, A. Energy efficiency indices for lignocellulosic biomass production: Short rotation coppices versus grasses and other herbaceous crops. Ind. Crops Prod. 2019, 135, 10–20. [Google Scholar] [CrossRef]
- Greinert, A.; Mrówczyńska, M.; Szefner, W. The use of waste biomass from the wood industry and municipal sources for energy production. Sustainability 2019, 11, 3083. [Google Scholar] [CrossRef] [Green Version]
- Pantaleo, A.M.; Camporeale, S.M.; Sorrentino, A.; Miliozzi, A.; Shah, N.; Markides, C.N. Hybrid solar-biomass combined Brayton/organic Rankine-cycle plants integrated with thermal storage: Techno-economic feasibility in selected Mediterranean areas. Renew. Energy 2020, 147, 2913–2931. [Google Scholar] [CrossRef]
- Stegmann, P.; Londo, M.; Junginger, M. The circular bioeconomy: Its elements and role in European bioeconomy clusters, Resour. Conserv. Recycl. 2020, 6, 100029. [Google Scholar] [CrossRef]
- Singh, A.; Nanda, S.; Berruti, F. A review of thermochemical and biochemical conversion of miscanthus to biofuels. In Biorefinery of Alternative Resources: Targeting Green Fuels and Platform Chemicals; Nanda, S., Vo, D.V.N., Sarangi, P.K., Eds.; Springer Nature: Singapore, 2020; pp. 195–220. [Google Scholar]
- Bórawski, P.; Bełdycka-Bórawska, A.; Szymańska, E.J.; Jankowski, K.J.; Dubis, B.; Dunn, J.W. Development of renewable energy sources market and biofuels in The European Union. J. Clean. Prod. 2019, 228, 467–484. [Google Scholar] [CrossRef]
- REN21, Renewables 2019 Global Status Report. 2019. Available online: https://www.ren21.net/wp-content/uploads/2019/05/gsr_2019_full_report_en.pdf (accessed on 20 March 2022).
- Flach, B.; Lieberz, S.; Bolla, S. EU-28 Biofuels Annual 2019. USDA Foreign Agricultural Service. Global Agricultural Information Network (GAIN) Report NL9022. 2019. Available online: https://apps.fas.usda.gov/newgainapi/api/report/downloadreportbyfilename?filename=Biofuels%20Annual_The%20Hague_EU-28_7-15-2019.pdf (accessed on 22 March 2022).
- Macke, Y. China—Peoples Republic of Biofuels Annual 2017. Growing Interest for Ethanol Brightens Prospects. USDA Foreign Agricultural Service. Global Agricultural Information Network (GAIN) Report CH17048. 2017. Available online: https://apps.fas.usda.gov/newgainapi/api/report/downloadreportbyfilename?filename=Biofuels%20Annual_Beijing_China%20-%20Peoples%20Republic%20of_10-20-2017.pdf (accessed on 22 March 2022).
- Barros, S. Brazil Biofuels Annual 2019. USDA Foreign Agricultural Service. Global Agricultural Information Network (GAIN) Report BR19029. 2019. Available online: https://apps.fas.usda.gov/newgainapi/api/report/downloadreportbyfilename?filename=Biofuels%20Annual_Sao%20Paulo%20ATO_Brazil_8-10-2018.pdf (accessed on 20 March 2022).
- U.S. EIA (Energy Information Administration). Monthly Biodiesel Production Report. 2020. Available online: https://www.eia.gov/biofuels/biodiesel/production/ (accessed on 19 March 2022).
- FAOSTAT, Food and Agriculture Organization Corporate Statistical Database. 2021. Available online: http://www.fao.org/nr/aquastat (accessed on 22 March 2022).
- Demirbas, A. Biofuels sources, biofuel policy, biofuel economy and global biofuel projections. Energy Convers. Manag. 2008, 49, 1206–1216. [Google Scholar] [CrossRef]
- Igliński, B.; Piechota, G.; Buczkowski, R. Development of biomass in polish energy sector: An overview. Clean Technol. Environ. Policy 2015, 17, 317–329. [Google Scholar] [CrossRef]
- Jankowski, K.J.; Budzyński, W.S.; Kijewski, Ł. An analysis of energy efficiency in the production of oilseed crops of the family Brassicaceae in Poland. Energy 2015, 81, 674–681. [Google Scholar] [CrossRef]
- Jankowski, K.J.; Sokólski, M. Spring camelina: Effect of mineral fertilization on the energy efficiency of biomass production. Energy 2021, 220, 119731. [Google Scholar] [CrossRef]
- Jankowski, K.J.; Sokólski, M.; Szatkowski, A.; Kozak, M. Crambe-Energy efficiency of biomass production and mineral fertilization. A case study in Poland. Ind. Crops Prod. 2022, 182, 114918. [Google Scholar] [CrossRef]
- Budzyński, W.S.; Jankowski, K.J.; Jarocki, M. An analysis of the energy efficiency of winter rapeseed biomass under different farming technologies. A case study of a large-scale farm in Poland. Energy 2015, 90, 1272–1279. [Google Scholar] [CrossRef]
- Sokólski, M.; Jankowski, K.J.; Załuski, D.; Szatkowski, A. Productivity, energy and economic balance in the production of different cultivars of winter oilseed rape. A case study in north-eastern Poland. Agronomy 2020, 10, 508. [Google Scholar] [CrossRef] [Green Version]
- Growth, D.A.; Sokólski, M.; Jankowski, K.J. A multi-criteria evaluation of the effectiveness of nitrogen and sulfur fertilization in different cultivars of winter rapeseed—Productivity, economic and energy balance. Energies 2020, 13, 4654. [Google Scholar] [CrossRef]
- Rabiee, M.; Majidian, M.; Alizadeh, M.R.; Kavoosi, M. Evaluation of energy use efficiency and greenhouse gas emission in rapeseed (Brassica napus L.) production in paddy fields of Guilan province of Iran. Energy 2021, 217, 119411. [Google Scholar] [CrossRef]
- Taghavifar, H.; Mardani, A. Energy consumption analysis of wheat production in West Azarbayjan utilizing life cycle assessment (LCA). Renew. Energy 2015, 74, 208–213. [Google Scholar] [CrossRef]
- Choudhary, R.L.; Behera, U.K. Resource-use efficiency of wheat: Effect of conservation agriculture and nitrogen management practices in maize (Zea mays)—Wheat (Triticum aestivum) cropping system. Int. J. Curr. Microbiol. Appl. Sci. 2020, 9, 611–626. [Google Scholar] [CrossRef]
- Jankowski, K.J.; Dubis, B.; Sokólski, M.M.; Załuski, D.; Bórawski, P.; Szempliński, W. Productivity and energy balance of maize and sorghum grown for biogas in a large-area farm in Poland: An 11-yearfield experiment. Ind. Crops Prod. 2020, 148, 112326. [Google Scholar] [CrossRef]
- Jankowski, K.J.; Sokólski, M.M.; Dubis, B.; Załuski, D.; Szempliński, W. Sweet sorghum—Biomass production and energy balance at different levels of agricultural inputs. A six-year field experiment in north-eastern Poland. Eur. J. Agron. 2020, 119, 126119. [Google Scholar] [CrossRef]
- Szempliński, W.; Dubis, D.; Lachutta, K.; Jankowski, K.J. Energy optimization in different production technologies of winter triticale grain. Energies 2021, 14, 1003. [Google Scholar] [CrossRef]
- Özgöz, E.; Altuntaş, E.; Asiltürk, M. Effects of soil tillage on energy use in potato farming in Central Anatolia of Turkey. Energy 2017, 141, 1517–1523. [Google Scholar] [CrossRef]
- Dimitrijević, A.; Gavrilović, M.; Ivanović, S.; Mileusnić, Z.; Miodragović, R.; Todorović, S. Energy use and economic analysis of fertilizer use in wheat and sugar beet production in Serbia. Energies 2020, 13, 2361. [Google Scholar] [CrossRef]
- Greer, K.; Martins, C.; White, M.; Pittelkow, C.M. Assessment of high-input soybean management in the US Midwest: Balancing crop production with environmental performance. Agric. Ecosyst. Environ. 2020, 292, 106811. [Google Scholar] [CrossRef]
- Keshavarz-Afshar, R.; Mohammed, Y.A.; Chen, C. Energy balance and greenhouse gas emissions of dryland camelina as influenced by tillage and nitrogen. Energy 2015, 91, 1057–1063. [Google Scholar] [CrossRef] [Green Version]
- Jankowski, K.J.; Dubis, B.; Budzyński, W.S.; Bórawski, P.; Bułkowska, K. Energy efficiency of crops grown for biogas production in a large-scale farm in Poland. Energy 2016, 109, 277–286. [Google Scholar] [CrossRef]
- Dubis, B.; Jankowski, K.J.; Załuski, D.; Bórawski, P.; Szempliński, W. Biomass production and energy balance of Miscanthus over a period of 11 years: A case study in a large-scale farm in Poland. GCB Bioenergy 2019, 11, 1187–1201. [Google Scholar] [CrossRef] [Green Version]
- Jankowski, K.J.; Dubis, B.; Sokólski, M.M.; Załuski, D.; Bórawski, P.; Szempliński, W. Biomass yield and energy balance of Virginia fanpetals in different production technologies in north-eastern Poland. Energy 2019, 185, 612–623. [Google Scholar] [CrossRef]
- Dubis, B.; Jankowski, K.J.; Sokólski, M.M.; Załuski, D.; Bórawski, P.; Szempliński, W. Biomass yield and energy balance of fodder galega in different production technologies: An 11–year field experiment in a large-area farm in Poland. Renew. Energy 2020, 154, 813–825. [Google Scholar] [CrossRef]
- Dubis, B.; Jankowski, K.J.; Załuski, D.; Sokólski, M.M. The effect of sewage sludge fertilization on the biomass yield of giant miscanthus and the energy balance of the production process. Energy 2020, 206, 11818910. [Google Scholar] [CrossRef]
- Jankowski, K.J.; Dubis, B.; Kozak, M. Sewage sludge and the energy balance of Jerusalem artichoke production—A case study in north-eastern Poland. Energy 2021, 236, 121545. [Google Scholar] [CrossRef]
- Dubis, B.; Szatkowski, A.; Jankowski, K.J. Sewage sludge, digestate, and mineral fertilizer application affects the yield and energy balance of Amur silvergrass. Ind. Crops Prod. 2022, 175, 114235. [Google Scholar] [CrossRef]
- Lewandowska-Czarnecka, A.; Buller, L.S.; Nienartowicz, A.; Piernik, A. Energy and emergy analysis for assessing changes in Polish agriculture since the accession to the European Union. Ecol. Model. 2019, 412, 108819. [Google Scholar] [CrossRef]
- Yang, F.; Yang, M.; Nie, H. Productivity trends of Chinese regions: A perspective from energy saving and environmental regulations. Appl. Energy 2013, 110, 82–89. [Google Scholar] [CrossRef]
- Gong, B. Agricultural reforms and production in China: Changes in provincial production function and productivity in 1978–2015. J. Dev. Econ. 2018, 132, 18–31. [Google Scholar] [CrossRef]
- Rokicki, T.; Perkowska, A.; Klepacki, B.; Bórawski, P.; Bełdycka-Bórawska, A.; Michalski, K. Changes in Energy Consumption in Agriculture in the EU Countries. Energies 2021, 14, 1570. [Google Scholar] [CrossRef]
- Kołodziej, B.; Antonkiewicz, J.; Sugier, D. Miscanthus × giganteus as a biomass feedstock grown on municipal sewage sludge. Ind. Crops Prod. 2016, 81, 72–82. [Google Scholar] [CrossRef]
- Ozdemir, D.; Dede, O.H.; Inan, M.; Turp, S.M. Effects of sewage sludge on energy content and combustion emissions of energy crops. Int. J. Agric. Biol. 2018, 20, 1575–1580. [Google Scholar]
- Gissén, C.; Prade, T.; Kreuger, E.; Nges, I.A.; Rosenqvist, H.; Svensson, S.E.; Lantz, M.; Mattsson, J.E.; Börjesson, P.; Björnsson, P. Comparing energy crops for biogas production e yields, energy input and costs in cultivation using digestate and mineral fertilization. Biomass Bioenergy 2014, 64, 199–210. [Google Scholar] [CrossRef]
- Kyttä, V.; Helenius, J.; Tuomisto, H.L. Carbon footprint and energy use of recycled fertilizers in arable farming. J. Clean. Prod. 2021, 287, 125063. [Google Scholar] [CrossRef]
- Jeng, A.S.; Haraldsen, T.K.; Vagstad, N.; Grønlund, N. Meat and bone meal as nitrogen fertilizer to cereals in Norway. Agric. Food Sci. 2004, 13, 268–275. [Google Scholar] [CrossRef] [Green Version]
- Jeng, A.S.; Haraldsen, T.K.; Grønlund, A.; Pedersen, P.A. Meat and bone meal as nitrogen and phosphorus fertilizer to cereals and ryegrass. Nutr. Cycl. Agroecosys. 2006, 76, 183–191. [Google Scholar] [CrossRef]
- Chen, L.; Kivela, J.; Helenius, J.; Kangas, A. Meat bone meal as fertilizer for barley and oat. Agric. Food Sci. 2011, 20, 235–244. [Google Scholar] [CrossRef]
- Brod, E.; Haraldsen, T.K.; Breland, T.A. Fertilization effects of organic waste resources and bottom wood ash: Results from a pot experiment. Agric. Food Sci. 2012, 21, 332–347. [Google Scholar] [CrossRef] [Green Version]
- Saeid, A.; Labuda, M.; Chojnacka, K.; Górecki, H. Evaluation of utilitarian properties of a new phosphorus biofertilizer. Przem. Chem. 2013, 92, 1311–1314. (In Polish) [Google Scholar]
- Kivela, J.; Chen, L.; Muurinen, S.; Kivijarvi, P.; Hintikainen, V.; Helenius, J. Effect of meat and bone meal as fertilizer on yield and quality of sugar beet and carrot. Agric. Food Sci. 2015, 24, 68–83. [Google Scholar] [CrossRef]
- Brod, E.; Øgaard, A.F.; Krogstad, T.; Haraldsen, T.K.; Frossard, E.; Oberson, A. Drivers of phosphorus uptake by barley following secondary resource application. Front. Nutr. 2016, 3, 1–13. [Google Scholar] [CrossRef] [PubMed] [Green Version]
- Nogalska, A.; Czapla, J.; Nogalski, Z.; Skwierawska, M.; Kaszuba, M. The effect of increasing doses of meat and bone meal (MBM) on maize (Zea mays L.) grown for grain. Agric. Food Sci. 2012, 21, 325–331. [Google Scholar] [CrossRef] [Green Version]
- Nogalska, A. Changes in the soil nitrogen content caused by direct and residual effect of meat and bone meal. J. Elem. 2013, 18, 659–671. [Google Scholar] [CrossRef]
- Nogalska, A.; Skwierawska, M.; Nogalski, Z.; Kaszuba, M. The effect of increasing doses of meat and bone meal (MBM) applied every second year on maize grown for grain. Chil. J. Agric. Res. 2013, 73, 430–434. [Google Scholar]
- Nogalska, A.; Krzebietke, S.J.; Zalewska, M.; Nogalski, Z. The effect of meat and bone meal (MBM) on the nitrogen and phosphorus content and pH of soil. Agric. Food Sci. 2017, 26, 181–187. [Google Scholar] [CrossRef]
- Jeng, A.S.; Vagstadt, N. Potential nitrogen and phosphorus leaching from soils fertilized with meat and bone meal. Acta Agric. Scand. Sect. B Soil Plant Sci. 2009, 59, 238–245. [Google Scholar] [CrossRef]
- Stępień, A.; Wojtkowiak, K. Variability of mineral nitrogen contents in soil as affected by meat and bone meal used as fertilizer. Chil. J. Agric. Res. 2015, 60, 291–296. [Google Scholar]
- Jastrzębska, M.; Kostrzewska, M.K.; Treder, K.; Jastrzębski, W.P.; Makowski, P. Phosphorus biofertilizers from ash and bone-agronomic evaluation of functional properties. J. Agric. Sci. 2016, 8, 58–70. [Google Scholar] [CrossRef]
- Chojnacka, K.; Gorazda, K.; Witek-Krowiak, A.; Moustakas, K. Recovery of fertilizer nutrient from materials—Contradictions, mistakes and future trends. Renew. Sustain. Energy Rev. 2019, 110, 485–498. [Google Scholar] [CrossRef]
- Mäkelä, P.S.A.; Wasonga, D.O.; Hernandez, A.S.; Santanen, A. Seedling growth and phosphorus uptake in response to different phosphorus sources. Agronomy 2020, 10, 1089. [Google Scholar] [CrossRef]
- Chaves, C.; Canet, R.; Albiach, R.; Marin, J.; Pomares, F. Meat and bone meal: Fertilizing value and rates of nitrogen mineralization. Nutrient and carbon cycling in sustainable plant-soil systems. In Proceedings of the 11th International Conference of the FAO ESCO-RENA Network on Recycling of Agricultural, Municipal and Industrial Residues in Agriculture (RAMIRAN), Murcia, Spain, 6–9 October 2004; Volume 1, pp. 177–180. [Google Scholar]
- Nogalska, A.; Zalewska, M. The effect of meat and bone meal (MBM) on phosphorus concentrations in soil and crop plants. Plant Soil Environ. 2013, 59, 575–580. [Google Scholar] [CrossRef] [Green Version]
- Nogalska, A.; Chen, L.; Sienkiewicz, S.; Nogalski, Z. Meat and bone meal as nitrogen and phosphorus supplier to cereals and oilseed rape. Agric. Food Sci. 2014, 23, 19–27. [Google Scholar] [CrossRef]
- Nogalska, A. Meat and bone meal as fertilizer for spring barley. Plant Soil Environ. 2016, 62, 373–378. [Google Scholar] [CrossRef] [Green Version]
- Nogalska, A.; Załuszniewska, A. The effect of meat and bone meal applied without or with mineral nitrogen on macronutrient content and uptake by winter oilseed rape. J. Elem. 2020, 25, 905–915. [Google Scholar] [CrossRef]
- Załuszniewska, A.; Nogalska, A. The effect of meat and bone meal (MBM) on the seed yield and quality of winter oilseed rape. Agronomy 2020, 10, 1952. [Google Scholar] [CrossRef]
- Nogalska, A.; Załuszniewska, A. The effect of meat and bone meal (MBM) on crop yields, nitrogen content and uptake, and soil mineral nitrogen balance. Agronomy 2021, 11, 2307. [Google Scholar] [CrossRef]
- IUSS Working Group WRB. World Reference Base for Soil Resources 2014. International Soil Classification System for Naming Soils and Creating Legends for Soil Maps; World Soil Resources Reports No. 106; FAO: Rome, Italy, 2015; p. 203. [Google Scholar]
- Wójcicki, Z. Equipment, Materials and Energy Inputs in Growth-Oriented Farms; IBMER: Warszawa, Poland, 2000; p. 139. (In Polish) [Google Scholar]
- Fore, S.R.; Porter, P.; Lazarus, W. Net energy balance of small-scale on-farm biodiesel production from canola and soybean. Biomass Bioenergy 2011, 35, 2234–2244. [Google Scholar] [CrossRef]
- TIBCO Statistica, version 13.3.0; Data Analysis Software System; TIBCO Software Inc.: Palo Alto, CA, USA, 2017.
- Cardone, M.; Mazzoncini, M.; Menini, S.; Rocco, V.; Senatore, A.; Seggiani, M.; Vitolo, S. Brassica carinata as an alternative oil crop for the production of biodiesel in Italy: Agronomic evaluation, fuel production by transesterification and characterization. Biomass Bioenergy 2003, 25, 623–636. [Google Scholar] [CrossRef]
- Venturi, P.; Venturi, G. Analysis of energy comparison for crops in European agricultural systems. Biomass Bioenergy 2003, 25, 235–255. [Google Scholar] [CrossRef]
- De Mastro, G.; Grassano, N.; Verdini, L.; Manolio, G.A. A comparison of different systems of rapeseed (Brassica napus L. var. oleifera) cultivation for energy generation. In Proceedings of the Congress Mediterranean Plants, Bari, Italy, 27–28 October 2006; pp. 27–28. (In Italian). [Google Scholar]
- Rathke, G.W.; Diepenbrock, W. Energy balance of winter oilseed rape (Brassica napus L.) cropping as related to nitrogen supply and preceding crop. Eur. J. Agron. 2006, 24, 35–44. [Google Scholar] [CrossRef]
- Firrisa, M.T.; Duren, I.; Voinov, A. Energy efficiency for rapeseed biodiesel production in different farming systems. Energy Effic. 2014, 7, 79–95. [Google Scholar] [CrossRef]
- Schuster, C.; Rathke, G.W. Nitrogen fertilisation of transgenic winter oilseed rape. In Plant Nutrition. Developments in Plant and Soil Sciences; Horst, W.J., Schenk, M.K., Bürkert, A., Claassen, N., Flessa, H., Frommer, W.B., Goldbach, H., Olfs, H.-W., Römheld, V., Sattelmacher, B., et al., Eds.; Spinger: Dordrecht, The Netherlands, 2001; pp. 336–337. [Google Scholar]
- Rathke, G.W.; Behrens, T.; Diepenbrock, W. Integrated nitrogen management strategies to improve seed yield, oil content and nitrogen efficiency of winter oilseed rape (Brassica napus L.): A review. Agric. Ecosyst. Environ. 2006, 117, 80–108. [Google Scholar] [CrossRef]
- Jankowski, K.J.; Hulanicki, P.S.; Krzebietke, S.; Żarczyński, P.; Hulanicki, P.; Sokólski, M.M. Yield and quality of winter oilseed rape in response to different systems of foliar fertilization. J. Elem. 2016, 21, 1017–1027. [Google Scholar] [CrossRef]
- Jankowski, K.J.; Budzyński, W.S.; Załuski, D.; Hulanicki, P.S.; Dubis, B. Using a fractional factorial desing to evaluate the effect of the intensity of agronomic practices on the yield of different winter oilseed rape morphotypes. Field Crops Res. 2016, 188, 50–61. [Google Scholar] [CrossRef]
- Jankowski, K.J.; Sokólski, M.M.; Dubis, B.; Krzebietke, S.; Żarczyński, P.; Hulanicki, P.; Hulanicki, P.S. Yield and quality of winter oilseed rape (Brassica napus L.) seeds in response to foliar application of boron. Agric. Food Sci. 2016, 25, 164–176. [Google Scholar] [CrossRef]
- Nogala-Kałucka, M.; Gogolewski, M.; Jaworek, S.; Siger, A.; Szulczewska, A. Determination of some components as indicators of the quality of rapeseed produced in different regions in Poland. Rośliny Oleiste Oilseed Crops 2002, 23, 447–459. (In Polish) [Google Scholar]
- Weymann, W.; Bottcher, U.; Sieling, K.; Kage, H. Effects of weather conditions during different growth phases on yield formation of winter oilseed rape. Field Crops Res. 2015, 173, 41–48. [Google Scholar] [CrossRef]
- Seleiman, M.; Santanen, A.; Jaakkola, S.; Ekholm, P.; Hartikainen, H.; Stoddard, F.; Mäkelä, P. Biomass yield and quality of bioenergy crops grown with synthetic and organic fertilizers. Biomass Bioenergy 2013, 59, 477–485. [Google Scholar] [CrossRef]
- Jankowski, K.J.; Budzyński, W.S. Energy potential oilseed crops. EJPAU, Agronomy, 6. 2003. Available online: http://www.ejpau.media.pl/volume6/issue2/agronomy/art-03.html (accessed on 12 December 2021).
- Kusek, G.; Ozturk, H.H.; Akdemir, S. An assessment of energy use of different cultivation methods for sustainable rapeseed production. J. Clean. Prod. 2016, 112, 2772–2783. [Google Scholar] [CrossRef]
- Weizsäcker, E.V.; Lovins, A.B.; Lovins, H.L. Doubling welfare, halving resource use. In The New Report to the Club of Roma; Wydawnictwo Rolewski: Toruń, Poland, 1999; p. 292. (In Polish) [Google Scholar]
Figure 1.
Weather conditions during the experiment (2015–2017) and the long-term average (1981–2010) in the Agricultural Experiment Station in Tomaszkowo—data from an automated weather station (PM Ecology Ltd., Gdynia, Poland).
Figure 1.
Weather conditions during the experiment (2015–2017) and the long-term average (1981–2010) in the Agricultural Experiment Station in Tomaszkowo—data from an automated weather station (PM Ecology Ltd., Gdynia, Poland).

Figure 2.
Energy efficiency ratio in the production of winter oilseed rape (across years). Means with the same letter do not differ significantly at p ≤ 0.05 in Tukey’s HSD test. The absence of letters denotes the non-significance of main effects.
Figure 2.
Energy efficiency ratio in the production of winter oilseed rape (across years). Means with the same letter do not differ significantly at p ≤ 0.05 in Tukey’s HSD test. The absence of letters denotes the non-significance of main effects.


Table 1.
Production technology of winter oilseed rape.
| Farming Operation | Specification |
|---|---|
| Tillage | skimming (8–10 cm); pre-sow plowing (18–22 cm) |
| Seed sowing | cv. SY Saveo (hybrid); seeding date: 25 or 26 August; seeding rate: 50 germinating seeds per m2; row spacing: 20 cm |
| Mineral fertilization and meat and bone meal application | according to the experimental design |
| Weed control | Butisan Star Max 500 SE at 2.0 dm3 ha−1 (400 g ha−1 metazachlor, 400 g ha−1 dimethenamid-P, 200 g ha−1 quinmerac) |
| Pest control | Mospilan 20 SP at 0.12 kg ha−1 (24 g ha−1 acetamiprid); Karate Zeon 050 CS at 0.12 dm3 ha−1 (6 g ha−1 lambda-cyhalothrin); Proteus 110 OD at 0.6 dm3 ha−1 (60 g ha−1 thiachloprid, 6 g ha−1 deltamethrin) |
| Pre-harvest herbicide treatment | Reglone 200 SL at 2.5 dm3 ha−1 (500 g ha−1 diquat) |
| Harvest of seeds and straw | direct harvest in the fully ripe stage (mid-July) |
Table 2.
Technical parameters, performance and fuel consumption of agricultural machines in the production of winter oilseed rape (across years).
Table 2.
Technical parameters, performance and fuel consumption of agricultural machines in the production of winter oilseed rape (across years).
| Farming Operations | Parameters of Self-Propelled Machine | Parameters of Accompanying Machine | Service Life (h) | Weight (kg) | Performance of Self-Propelled Machine and Accompanying Machine (ha h−1) a | Fuel Consumption (dm3 h−1) a | ||
|---|---|---|---|---|---|---|---|---|
| Self-Propelled Machine | Accompanying Machine | Self-Propelled Machine | Accompanying Machine | |||||
| Disking (5–8 cm) | 294 | 12 m (working width) | 10,000 | 2100 | 15,000 | 12,250 | 10.1 | 50.0 |
| Pre-sow plowing (15–18 cm) | 205 | 7 furrow slices | 10,000 | 1400 | 10,550 | 3150 | 1.4 | 30.4 |
| Seed sowing | 272 | 9 m (working width) | 10,000 | 1400 | 14,270 | 9625 | 6.2 | 49.5 |
| Mineral fertilization | 191 | 36 m (working width) | 10,000 | 2100 | 10,550 | 3500 | 43.5 | 19.1 |
| Meat and bone meal application | 272 | 18 m−3 (load capacity) | 10,000 | 700 | 14,270 | 11,000 | 4.2 | 25.0 |
| Chemical weed and insect control | 230 | 36 m (working width) | 10,000 | - | 11,000 | - | 20.0 | 19.6 |
| Harvest | 220 | 6.6 m (working width) | 10,000 | - | 15,400 | - | 2.5–3.0 b | 40.0 |
| Straw baling | 97 | 2.0 m (working width) | 10,000 | 1050 | 4600 | 2950 | 2.7 | 8.5 |
| Seed transport | 59 | 10 Mg (carrying capacity) | 10,000 | 1400 | 10,550 | 2600 | 9.4 | 20.4 |
| Straw transport | 59 | 10 Mg (carrying capacity) | 10,000 | 700 | 10,550 | 2100 | 3.0 | 20.4 |
a average for 2 years; b differences resulting from variations in biomass yield.
Table 3.
Energy equivalents of inputs associated with the production of winter oilseed rape.
| Source | Unit | Input | References |
|---|---|---|---|
| Labor | MJ hour−1 | 80 | [70] |
| Tractors | MJ kg−1 | 125 | [70] |
| Machines | MJ kg−1 | 110 | [70] |
| Diesel oil | MJ kg−1 | 48 | [70] |
| Seeds | MJ kg−1 | 12 | [70] |
| N | MJ kg−1 | 77 | [70] |
| P2O5 | MJ kg−1 | 15 | [70] |
| K2O | MJ kg−1 | 10 | [70] |
| S | MJ kg−1 | 8.9 | [71] |
| Meat and bone meal a | MJ kg−1 | 0.2 | [70] |
| Pesticides | MJ kg−1 active ingredient | 300 | [70] |
a Energy equivalents of inputs correspond to organic fertilizers (manure and slurry).
Table 4.
F-test statistics in ANOVA.
| Parameter | Year | Fertilization | Year × Fertilization | |
|---|---|---|---|---|
| Dry matter yield (Mg ha−1) | seeds | 9.221 ** | 29.470 ** | 2.113 ns |
| straw | 7.912 * | 8.958 ** | 0.648 ns | |
| Lower heating value (MJ kg−1) | seeds | 1.405 ns | 0.065 ns | 0.129 ns |
| straw | 11.535 ** | 7.065 ** | 1.669 ns | |
| Energy output (GJ ha−1) | seeds | 6.453 ** | 27.913 ** | 1.709 ns |
| seeds and straw | 7.244 ** | 27.789 ** | 1.611 ns | |
| Energy gain (GJ ha−1) | seeds | 4.956 ** | 18.031 ** | 1.306 ns |
| seeds and straw | 5.874 * | 13.192 ** | 1.300 ns | |
| Energy efficiency ratio | seeds | 1.937 ns | 60.836 ** | 1.725 ns |
| seeds and straw | 2.046 ns | 39.098 ** | 0.722 ns | |
* significant p < 0.05; ** significant p < 0.01; ns—not significant.
Table 5.
Energy inputs associated with the production of winter oilseed rape per agricultural operation (across years).
Table 5.
Energy inputs associated with the production of winter oilseed rape per agricultural operation (across years).
| Agricultural Operation | Fertilization Regime | ||||
|---|---|---|---|---|---|
| Control | NPK | MBM_1.0 | MBM_1.5 | MBM_2.0 | |
| MJ ha−1 | |||||
| Tillage | 1891 | 1891 | 1891 | 1891 | 1891 |
| Seed sowing | 279 | 279 | 279 | 279 | 279 |
| Fertilization | 0 | 13,498 | 9118 | 6215 | 3208 |
| Weed control | 356 | 356 | 356 | 356 | 356 |
| Pest control | 197 | 197 | 197 | 197 | 197 |
| Preparation for harvest, harvest and transport of seeds and straw | 1739 | 1859 | 1859 | 1859 | 1859 |
| Total | 4462 | 18,081 | 13,700 | 10,797 | 7790 |
| % | |||||
| Tillage | 42.4 | 10.5 | 13.8 | 17.5 | 24.3 |
| Seed sowing | 6.2 | 1.5 | 2.0 | 2.6 | 3.6 |
| Fertilization | 0.0 | 74.7 | 66.6 | 57.6 | 41.2 |
| Weed control | 8.0 | 2.0 | 2.6 | 3.3 | 4.6 |
| Pest control | 4.4 | 1.1 | 1.4 | 1.8 | 2.5 |
| Preparation for harvest, harvest and transport of seeds and straw | 39.0 | 10.3 | 13.6 | 17.2 | 23.9 |
| Total | 100.0 | 100.0 | 100.0 | 100.0 | 100.0 |
Table 6.
Energy inputs associated with the production of winter oilseed rape per energy flux (across years).
Table 6.
Energy inputs associated with the production of winter oilseed rape per energy flux (across years).
| Agricultural Operation | Fertilization Regime | ||||
|---|---|---|---|---|---|
| Control | NPK | MBM_1.0 | MBM_1.5 | MBM_2.0 | |
| MJ ha−1 | |||||
| Labor | 226 | 239 | 256 | 256 | 254 |
| Tractors and machines | 1033 | 1089 | 1591 | 1591 | 1583 |
| Fuel | 2652 | 2786 | 3005 | 3005 | 2988 |
| Materials: | 551 | 13,967 | 8848 | 5945 | 2965 |
| seeds | 72 | 72 | 72 | 72 | 72 |
| mineral fertilizers | 0 | 13,417 | 8097 | 5094 | 2014 |
| MBM | 0 | 0 | 200 | 300 | 400 |
| pesticides | 479 | 479 | 479 | 479 | 479 |
| Total | 4462 | 18,081 | 13,700 | 10,797 | 7790 |
| % | |||||
| Labor | 5.1 | 1.3 | 1.9 | 2.4 | 3.3 |
| Tractors and machines | 23.2 | 6.0 | 11.6 | 14.7 | 20.3 |
| Fuel | 59.4 | 15.4 | 21.9 | 27.8 | 38.4 |
| Materials: | 12.3 | 77.3 | 64.6 | 55.1 | 38.1 |
| seeds | 1.6 | 0.4 | 0.5 | 0.7 | 0.9 |
| mineral fertilizers | 0.0 | 74.2 | 59.1 | 47.2 | 25.9 |
| MBM | 0.0 | 0.0 | 1.5 | 2.8 | 5.1 |
| pesticides | 10.7 | 2.6 | 3.5 | 4.4 | 6.1 |
| Total | 100.0 | 100.0 | 100.0 | 100.0 | 100.0 |
Table 7.
Yield of winter oilseed rape biomass (based on Załuszniewska and Nogalska [67] and Nogalska and Załuszniewska [68]).
| Growing Season | Fertilization Regime | |||||
|---|---|---|---|---|---|---|
| Control | NPK | MBM_1.0 | MBM_1.5 | MBM_2.0 | ||
| Seeds (Mg ha−1 DM) | ||||||
| 2015/2016 | 1.48 | 2.99 | 2.68 | 2.64 | 2.35 | 2.43 a |
| 2016/2017 | 1.63 | 2.72 | 2.15 | 2.26 | 2.20 | 2.19 b |
| 1.55 c | 2.86 a | 2.41 b | 2.45 b | 2.27 b | − | |
| Straw (Mg ha−1 DM) | ||||||
| 2015/2016 | 1.83 | 3.48 | 3.53 | 3.33 | 2.61 | 2.96 a |
| 2016/2017 | 1.79 | 3.28 | 2.82 | 2.87 | 2.73 | 2.70 b |
| 1.81 b | 3.38 a | 3.17 a | 3.10 a | 2.67 ab | − | |
Means with the same letter do not differ significantly at p ≤ 0.05 in Tukey’s HSD test. The absence of letters denotes the non-significance of main effects.
Table 8.
Lower heating value of winter oilseed rape biomass (MJ kg−1).
| Growing Season | Fertilization Regime | |||||
|---|---|---|---|---|---|---|
| Control | NPK | MBM_1.0 | MBM_1.5 | MBM_2.0 | ||
| Seeds | ||||||
| 2015/2016 | 23.51 | 23.15 | 23.21 | 23.13 | 23.00 | 23.20 b |
| 2016/2017 | 23.43 | 23.68 | 23.69 | 23.66 | 23.46 | 23.58 a |
| 23.47 | 23.41 | 23.45 | 23.40 | 23.23 | − | |
| Straw | ||||||
| 2015/2016 | 12.29 | 12.35 | 11.97 | 12.36 | 12.85 | 12.37 a |
| 2016/2017 | 12.09 | 12.12 | 12.03 | 12.01 | 12.34 | 12.12 b |
| 12.19 b | 12.23 b | 12.00 b | 12.18 b | 12.59 a | − | |
Means with the same letter do not differ significantly at p ≤ 0.05 in Tukey’s HSD test. The absence of letters denotes the non-significance of main effects.
Table 9.
Energy output of winter oilseed rape biomass (GJ ha−1).
| Growing Season | Fertilization Regime | |||||
|---|---|---|---|---|---|---|
| Control | NPK | MBM_1.0 | MBM_1.5 | MBM_2.0 | ||
| Seeds | ||||||
| 2015/2016 | 36.74 | 73.09 | 65.61 | 64.74 | 57.29 | 59.50 a |
| 2016/2017 | 40.16 | 67.81 | 53.70 | 56.40 | 54.27 | 54.47 b |
| 38.45 c | 70.45 a | 59.66 b | 60.57 b | 55.78 b | − | |
| Total biomass (seeds and straw) | ||||||
| 2015/2016 | 61.27 | 119.92 | 111.72 | 109.66 | 93.73 | 99.26 a |
| 2016/2017 | 63.87 | 111.20 | 90.71 | 94.13 | 91.20 | 90.22 b |
| 62.57 c | 115.56 a | 101.21 ab | 101.89 ab | 92.47 b | − | |
Means with the same letter do not differ significantly at p ≤ 0.05 in Tukey’s HSD test. The absence of letters denotes the non-significance of main effects.
Table 10.
Energy gain in the production of winter oilseed rape (GJ ha−1).
| Growing Season | Fertilization Regime | |||||
|---|---|---|---|---|---|---|
| Control | NPK | MBM_1.0 | MBM_1.5 | MBM_2.0 | ||
| Seeds | ||||||
| 2015/2016 | 32.20 | 55.46 | 51.91 | 53.95 | 49.50 | 48.61 a |
| 2016/2017 | 35.70 | 49.90 | 40.00 | 45.61 | 46.48 | 43.54 b |
| 33.95 c | 52.68 a | 45.96 b | 49.78 b | 47.99 b | − | |
| Total biomass (seeds and straw) | ||||||
| 2015/2016 | 56.73 | 102.29 | 98.02 | 98.86 | 85.94 | 88.37 a |
| 2016/2017 | 59.41 | 93.30 | 77.01 | 83.33 | 83.41 | 79.29 b |
| 58.87 b | 97.78 a | 87.51 a | 91.10 a | 84.68 a | − | |
Means with the same letter do not differ significantly at p ≤ 0.05 in Tukey’s HSD test. The absence of letters denotes the non-significance of main effects.
Publisher’s Note: MDPI stays neutral with regard to jurisdictional claims in published maps and institutional affiliations. |
© 2022 by the authors. Licensee MDPI, Basel, Switzerland. This article is an open access article distributed under the terms and conditions of the Creative Commons Attribution (CC BY) license (https://creativecommons.org/licenses/by/4.0/).
Share and Cite
MDPI and ACS Style
Jankowski, K.J.; Nogalska, A. Meat and Bone Meal and the Energy Balance of Winter Oilseed Rape—A Case Study in North-Eastern Poland. Energies 2022, 15, 3853. https://0-doi-org.brum.beds.ac.uk/10.3390/en15113853
AMA Style
Jankowski KJ, Nogalska A. Meat and Bone Meal and the Energy Balance of Winter Oilseed Rape—A Case Study in North-Eastern Poland. Energies. 2022; 15(11):3853. https://0-doi-org.brum.beds.ac.uk/10.3390/en15113853
Chicago/Turabian StyleJankowski, Krzysztof Józef, and Anna Nogalska. 2022. "Meat and Bone Meal and the Energy Balance of Winter Oilseed Rape—A Case Study in North-Eastern Poland" Energies 15, no. 11: 3853. https://0-doi-org.brum.beds.ac.uk/10.3390/en15113853
Note that from the first issue of 2016, this journal uses article numbers instead of page numbers. See further details here.