
Application of Field Olfactometry to Monitor the Odour Impact of a Municipal Sewage System


Faculty of Building Services, Hydro and Environmental Engineering, Warsaw University of Technology, 20 Nowowiejska Street, 00-653 Warsaw, Poland
*
Author to whom correspondence should be addressed.
Energies 2022, 15(11), 4015; https://0-doi-org.brum.beds.ac.uk/10.3390/en15114015
Submission received: 20 April 2022
/
Revised: 22 May 2022
/
Accepted: 28 May 2022
/
Published: 30 May 2022
(This article belongs to the Special Issue Wastewater, Water and Energy)
Abstract
:Odorant emissions are associated with, among other things, wastewater transport in sewer networks; they contribute to air pollution and result in complaints from residents living close to emission sources. The critical location in terms of the formation of unpleasant odour compounds is the pressure line that connects the pumping station and the expansion well; this is where they are released into the atmosphere. This paper presents comprehensive results of olfactometric and chromatographic tests in the Polish city of Białystok using portable devices that allow for multiple determinations and instant results. The study attempts to investigate the relationship between odour and odorant concentrations and check the suitability of field olfactometry as a tool for the ongoing monitoring of the emission of noxious odours and for verifying complaints submitted by residents. Statistical analysis shows a very high correlation coefficient between cod and the concentrations of individual odorants, ranging from 0.82 to 0.91. This olfactometric research, mainly conducted in situ, can be an appropriate method for the ad hoc monitoring of processes in sewage networks. This method allows the detection of unwanted emissions of odours at individual points in the network in concentrations that are not detected by standard sensors but that nevertheless cause odour nuisances, complaints, and social conflict. The research results provide evidence in favour of the energetic usage of wastewater, which is in line with circular economy conception, since odour nuisance is one of its indicators.
1. Introduction
1.1. Municipal Sewage Systems as Sources of Odorant Emissions
In recent years, odour problems caused by sewage, waste, and human and animal activities have become increasingly important [1,2,3,4,5,6,7]. Emissions of odorants—the chemical compounds that cause odours—accompany, among other things, the transport of sewage. This contributes to atmospheric pollution as well as a deterioration in air quality and often results in complaints from residents living near the sources of the emissions. The most frequently emitted odorants from installations intended for wastewater transport are hydrogen sulphide (H2S), methanethiol (CH3SH), and other organic sulphides (e.g., dimethyl sulphide (DMS) (CH3)2S and diphenyl sulphide (C6H5)2S). For example, the concentration of H2S in sewers can be up to 314,000 µg/m3, while the concentration of CH3SH can reach 18,300 µg/m3, and the concentration of DMS can reach 98 µg/m3. In addition, there is an important compound that is odourless but has explosive properties: methane (CH4) [8,9].
Both H2S and CH4 may have negative effects on the environment and also on human health. H2S has a sharp, irritating odour, and its olfactory detection threshold is very low (only 0.0035 ppm [10]); it is, therefore, the most frequent cause of complaints from sewer system users [11,12]. Due to its high toxicity, it is also one of the main causes of death in the wastewater sector. In addition, H2S may be responsible for corrosive processes in the sewage infrastructure, causing the degradation of pipes and wells [13]. The production of sulphides in wastewater collection and treatment facilities is particularly well-known in countries with warm climates, such as Kuwait [14]. In recent years, studies on the process of microbiologically induced corrosion resulting from the reaction of H2S oxidation to sulphuric acid have been conducted by Grengg et al. [15], Nielsen et al. [16], and Jiang et al. [17]. In these studies, under anaerobic conditions, methanogenesis also took place during the reduction of sulphates (a chemical process that produces odourless CH4 with a lower explosion limit equal to approx. 5% by volume and that contributes to global warming [18]).
The problem of capturing emissions (especially sulphur compounds) concerns both new and old sewage systems. The most frequent sources of emissions of odorous compounds include sewers, sumps and expansion sewers, pressure pipelines, and sewage pumping stations [19]. In addition, the odours of household sewage cause a nuisance to well-being and quality of life, as well as dangerous problems for human health [20]. As a result of oxygen deficiency, wastewater is corrosive, and the anaerobic decomposition of organic compounds contained in wastewater and sludge deposits occurs. The main source of sulphur is, in this context, sulphate, with concentrations between 40 mg/dm3 and 200 mg/dm3. This process involves sulphate-reducing bacteria and methanogenic archaea that contribute to the degradation of CH3SH [21,22].
The critical location in terms of the formation of unpleasant odour compounds is the pressure line that connects the pumping station and the expansion well; this is where they are released into the atmosphere. Additionally, expansion wells located in the close vicinity of households increase the problems of odour nuisance. H2S continuous monitoring devices are readily available and in widespread use, but however useful they may be for H2S, they do not necessarily apply to the rest of the reduced sulphur compounds [23].
The choice of the method used to assess the intensity of odour nuisance often results from such factors as the variability of sampling conditions and their composition over time. These factors may influence the results obtained to a greater or lesser degree [24]. Importantly, there is no single generally accepted technique to effectively assess the environmental impact of odorous nuisance compounds due to variabilities in hedonic tone and the chemical character of odorous emissions [25,26].
1.2. Field Olfactometry
One of the methods for quantifying odour emissions is olfactometry. Olfactometry methods may be categorised according to where the sample is analysed: indirect olfactometry (the gas sample is captured in a dedicated bag and then transported to the laboratory for analysis) and direct olfactometry (the gas sample is analysed at the source of the odour). In the case of indirect tests, there is a risk that chemical reactions occur during transport inside the bag and affect the result obtained in the laboratory [27,28].
Field olfactometers were developed to overcome the drawbacks of sample storage and evaluate low cod in ambient air [29]. Hayes et al., wrote that field testing eliminates the potential dangers of sample degradation in laboratory-based testing and offers a better opportunity to analyse different areas at different times but at the same site. In addition, it greatly reduces the capacity for an odour to degrade, due to testing taking place almost immediately after sample collection [30]. Recent research has shown that dynamic olfactometry is an alternative technique to monitoring bioprocesses, reducing the number of analyses and their time and cost [31,32,33,34,35,36]. Field olfactometry can be used for proactive monitoring or as an enforcement tool for confident odour measurement at property lines and at locations throughout a community near emission sources [37]. Olfactometers, which are simplified portable dilution devices, help to determine odour levels and give a reading of the D/T (Dilution-to-Threshold) ratio [38,39,40]—the dilution of an odour sample that cannot be distinguished from odourless air by 50% of the members of an odour panel. In addition, olfactometers are a useful tool for downwind odour intensity (iod) measurement [41]. The use of this technique, followed by the application of dispersion models, permits the quantification of the odour impact of a process [42].
Currently, two main instruments called Nasal Ranger (St. Croix Sensors, Inc.) and SM-100 (IDES Canada Inc.) are used. Szyłak-Szydłowski found no evidence to reject the null hypothesis of equal average values of D/T obtained during THT and H2S research using the above olfactometers—the achieved results were not significantly different [43]. Other researchers found that the Nasal Ranger performed well in generating dilutions for all examined compounds and that only at the highest dilution was a discrepancy found between the set and observed dilution ratios. The Scentroid SM-100 showed a linear relationship between the set and observed dilution ratios. However, higher observed dilution ratios (up to a factor of 2) were observed when compared to the dilution ratio set points [44]. Examples of the use of field olfactometers in various research areas are summarised in Table 1.
Neither cod nor odorant concentration measurements conducted alone allow for obtaining the full range of information necessary to characterise the odour nuisance of a studied object [28,57]. One of the methods used to assess the level of odour stimulation and contributions of individual odorants to the odour is the Odour Activity Value (OAV), also referred to as the Odour Activity Concentration (OAC) [23,35,58]. The parameter is defined as the concentration of a substance (Ci) to its odour detection threshold (ODT). However, studies carried out by Gonzales et al. [49], among others, indicate a very weak correlation between OAV and cod, which is mainly due to the adoption of the ODT value, which is different in different literature sources; it is also due to the masking of the individual compounds included in the odour mixture.
Evaluations of environmental quality are challenging to implement in urban and integrated planning, strategic environmental assessments, and other environmental procedures, given the often non-spatial character of the obtained results [52]. Therefore, it is important to extend the standard analytical methodologies for monitoring extensive areas, such as sewage networks, with olfactometric analyses. This paper presents comprehensive results of olfactometric and chromatographic tests (H2S, CH3SH, and (CH3)2S—DMS) in the Polish city of Białystok. The research is essential from the point of view of finding the cause of numerous complaints about odour nuisance reported by the city’s inhabitants. The study attempts to find the relationship between the cod and the concentration of the tested odorants and check the usefulness of field olfactometry as a tool for the ongoing monitoring of the emission of odours and for verifying the complaints reported by residents.
The main objective of this work is to implement procedures for the determination of cod in the assessment of the quality of the urban environment. These procedures can significantly complement determinations of the concentrations of selected odorants, influencing the scent concentration value and, as a result, the smell nuisance. A secondary objective is to investigate the primary relationships between cod and the essential odorous compounds detected in sewage systems. It may be helpful to introduce the energetic usage of wastewater in future.
2. Materials and Methods
2.1. Research Schedule
Potential sources of odour emissions were identified, inventoried, and classified in the north-western part of the city of Białystok, where, in the years 2015–2017, residents registered complaints about the presence of odour nuisances. The research work included:
- collecting and compiling data on residents’ complaints and potential sources of odour emissions in the analysed area;
- field tests for odorants;
- the analysis and elaboration of the research results and the formulation of conclusions.
The data on residents’ complaints and potential sources of emissions were supplemented and verified during the local inspection in the analysed area and during the field research. The direct field research on the concentrations of selected odorants and odour was aimed at ascertaining the air quality conditions inside the sewers, in facilities in the network, and in atmospheric air. Control of meteorological conditions accompanied the field tests. Table 2 contains the schedule of tests performed and the number of receptor points determined for chemical and olfactometric tests.
2.2. Location of the Research Areas
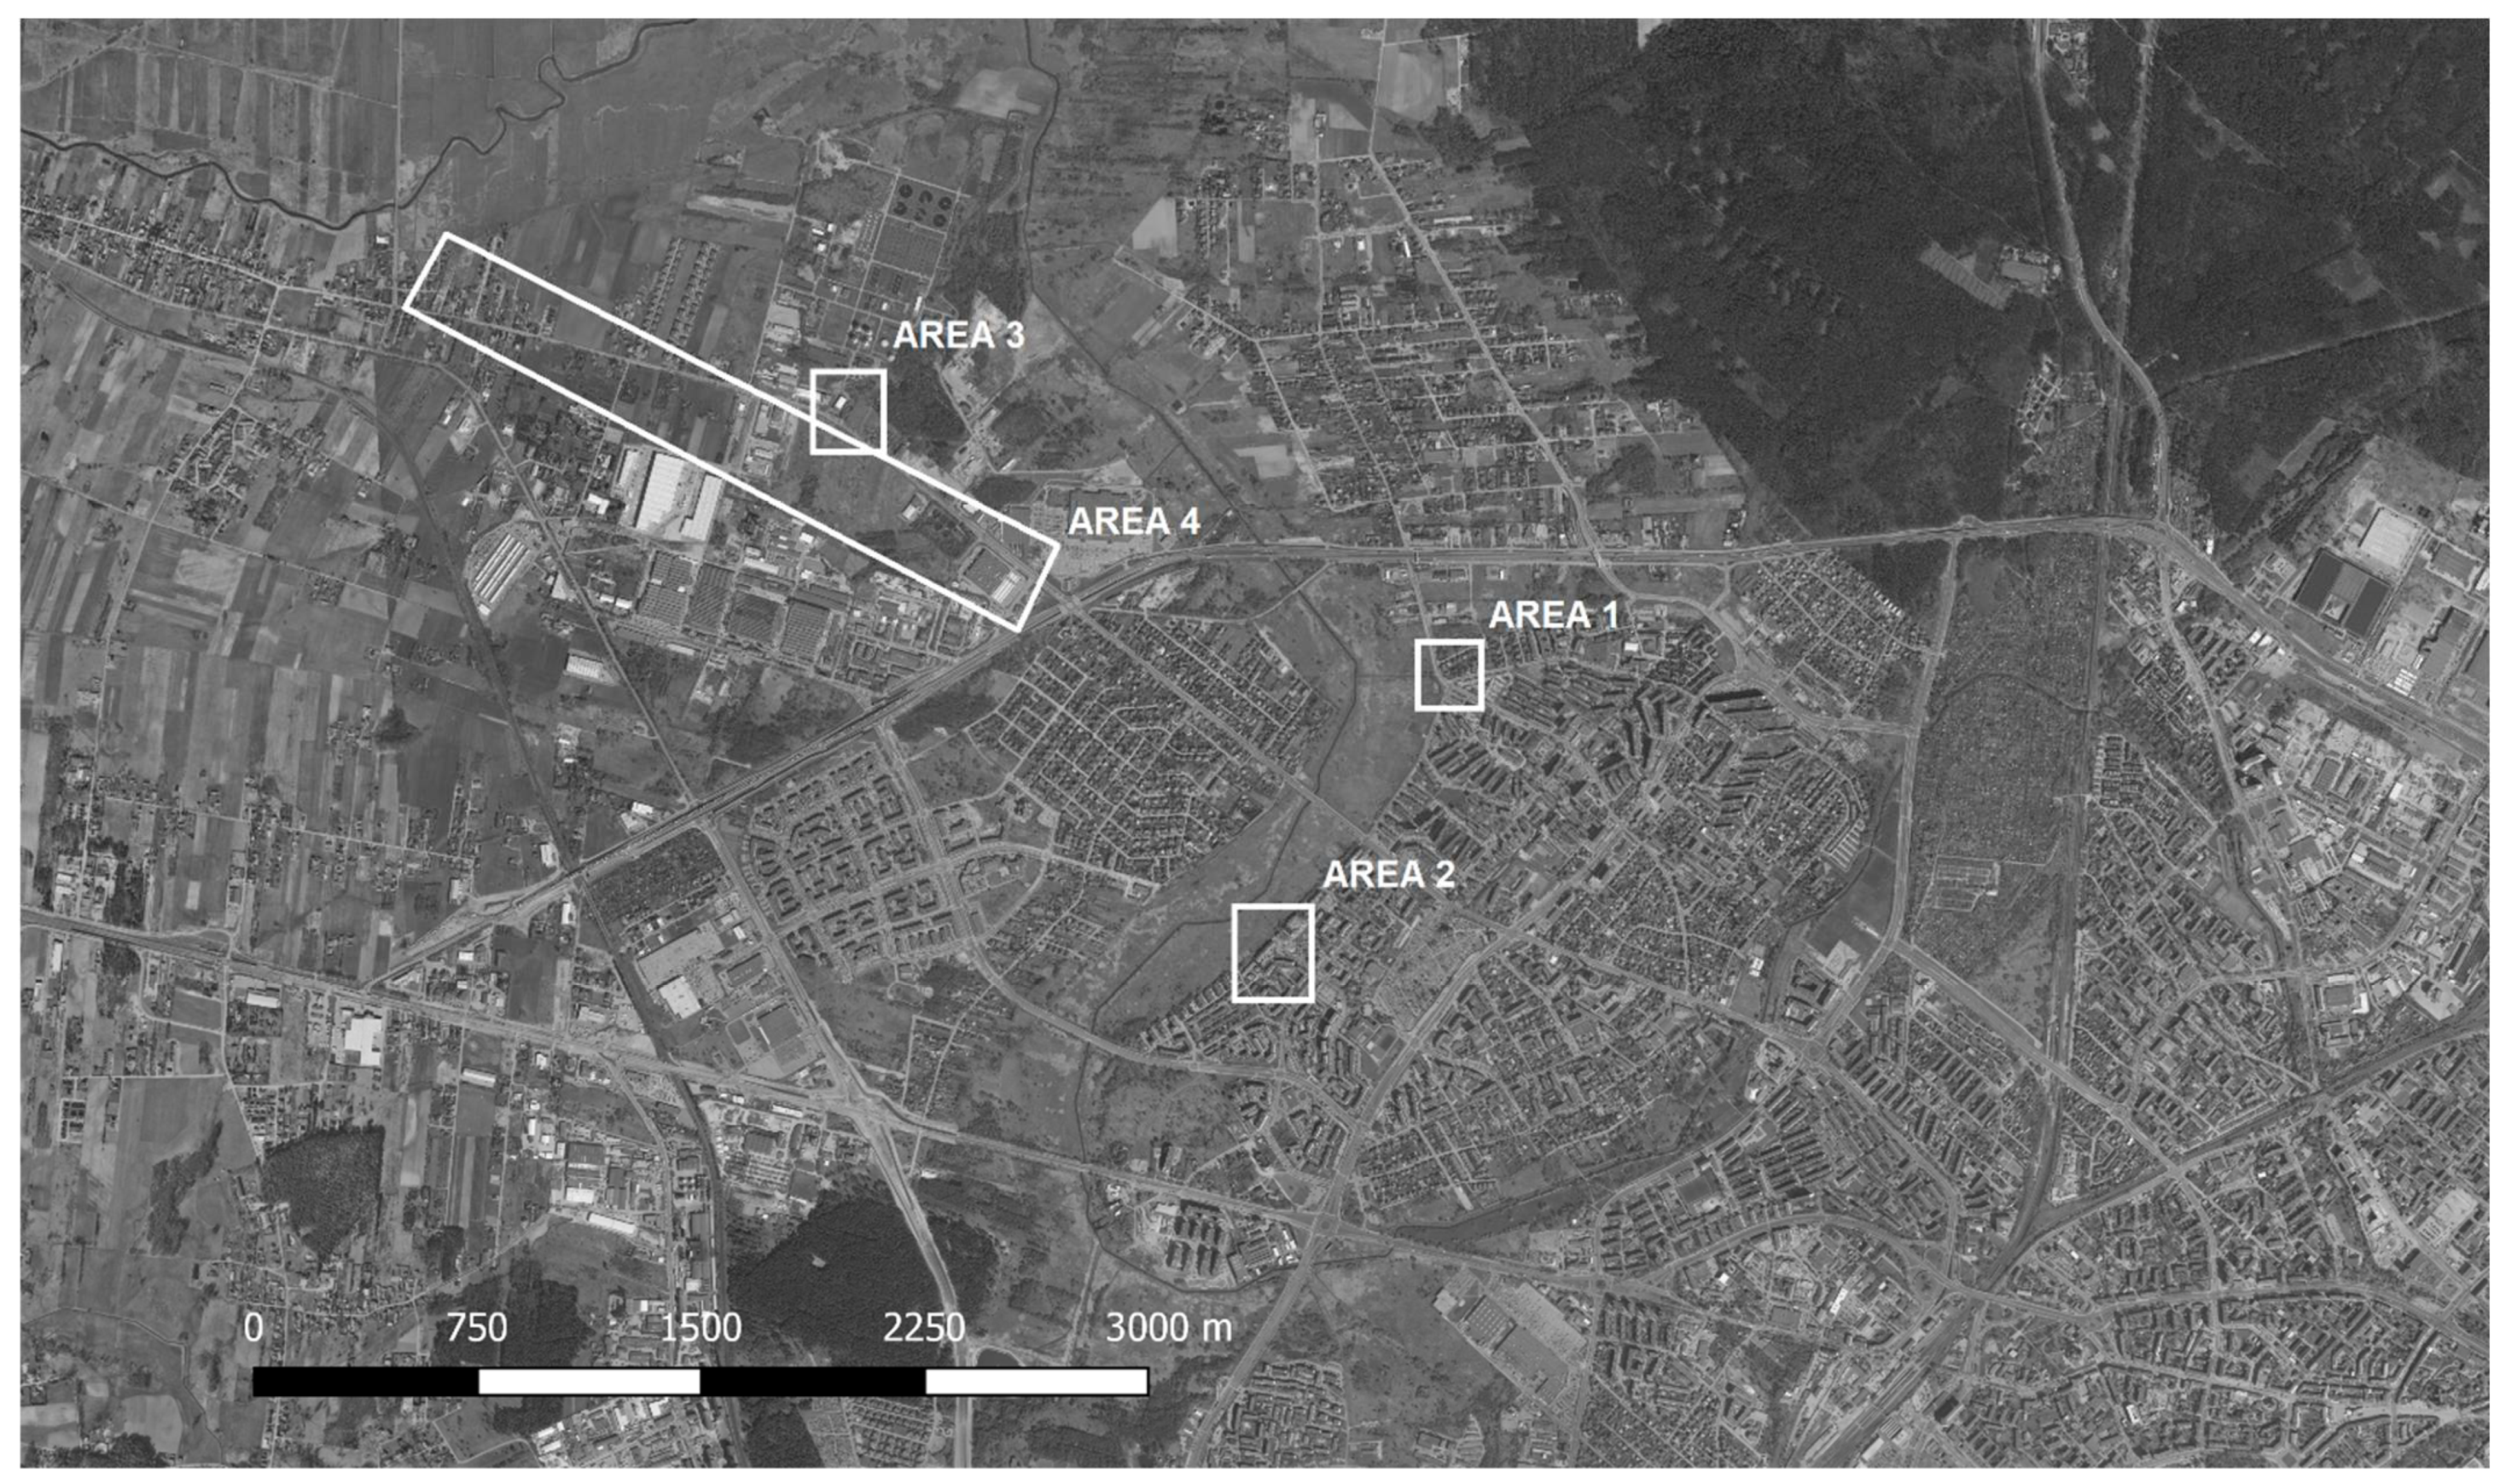
Measurements and observations were carried out in the north-western part of Białystok (Figure 1). Based on survey research, analysis of potential odour sources, and local complaints, the following areas were identified:
- Area 1: the area containing nodal sewage chambers;
- Area 2: the area containing nuisance sewage manholes in the immediate vicinity of an apartment block;
- Area 3: the vicinity of the “Fasty” industrial wastewater;
- Area 4: the area along the street with the last section of the main sewer connecting to the municipal WWTP;
- Other: surroundings of single manholes for sewage collectors in different parts of the city.

2.3. Characteristics of the Municipal Sewage System
The analysed sewage system discharges municipal sewage to the sewage treatment plant; it is a mixture of domestic and industrial sewage. In the sewage system of the city of Białystok, there are two other types of networks, namely the general sewage system and the stormwater drainage system, whose integration with the sanitary network was taken into account to the extent necessary to determine odour nuisances.
The municipal sewage system operates using a gravity-pressure system. It is a mixed system featuring a gravitational network cooperating with intermediate pumping stations that pump sewage from places with lower to higher elevations, usually very far away. The pumped wastewater is directed mainly to expansion wells installed in the network, from which it continues to flow by gravity.
2.4. Olfactometric Examinations of cod
The receptor points were located both on the windward side (for the determination of air pollution background caused by odorants) and on the leeward side of the studied objects. Their detailed locations considered the current wind direction (WD), among other factors. The iod was evaluated in sensory studies according to six stages (i = 0–5).
The olfactometers used were portable field olfactometers such as Nasal Ranger® and Scentroid SM-100. They allowed the creation of a calibrated series of dilutions by mixing air contaminated with odorants with filtered air free from odours. Field olfactory nuisance testing using field olfactometers is a method of quantifying the cod in the “Dilution-to-Threshold Ratios” (D/T) system. The D/T value is the number of dilutions needed to make the odour undetectable in the ambient air. Thanks to the application of the olfactometers mentioned above, it is possible to calculate the D/T value, which, in turn, leads to the cod value determined in units of odour (ou—odour unit, analogous to the European standard PN-EN 13725:2007) per unit of volume [ou/m3] [51].
2.5. Chemical Examinations of Odorant Concentrations
The studies on the selected odorants, namelyH2S, CH3SH, and DMS ((CH3)2S), were carried out using the Photovac Voyager portable gas chromatograph (GC). This is a portable, automatic gas analyser for identifying airborne chemicals and measuring their concentrations. The Voyager uses a GC to collect and analyse the air samples. It uses a 10.6 eV photoionization detector (PID), a pre-column, and three columns for heavy (C7–C12), middle (C3–C7), and light (C1–C3) compounds): 4 m × 0.53 mm × 2.0 um SPB-35 (pre-column), 8 m × 0.25 mm BLANK Fused Silica (column A), 20 m × 0.32 mm × 1.0 um Supelcowax10 (PEG) (column B), and 15 m × 0.32 mm × 12 um Quadrex 007–1 (column C). The carrier gas used for determinations was high-purity nitrogen. The column oven in the Photovac Voyager is isothermal, 55 to 80 °C. The Voyager can be effectively used to monitor many of the volatile organic compounds (VOCs) listed in EPA Method 8240A, including chlorinated and aromatic hydrocarbons. Method detection limits for VOCs range from parts per trillion (ppt) in water (ng/dm3) to about 500 parts per million (ppm) in the ambient air, depending upon the type of compound and the detector used [59]. The limit of detection for the selected odorants was 0.001 ppm, while the limit of quantitation was 0.005 ppm [60]. In addition, analyses of CH3SH and DMS were performed, but concentrations of those compounds were lower than the limit of detection.
2.6. Meteorological Examinations
The air tests were accompanied by an assessment of the current meteorological conditions (WD, wind speed (WS), air temperature (AT), relative humidity (RH), and degree of cloudiness (DC)). The information on meteorological conditions was used directly during the tests and recorded for every measurement as data necessary for the analysis of cod. The meteorological parameters were determined at each of the receptor points. WD was determined by the streak method every time before the beginning of observations and measurements. WS was measured with a hand anemometer, the Kestrel 4500 NV, with a wing rotor. The WD and WS were measured at a height of 2 m. AT and RH were measured at a height of 1.5 m. The Rotronic HygroPalm psychrometer with a HygroClip2 HC2-S3 sensor was used for the measurements. The DC was determined as the degree of cloud cover in the sky. To determine the DC, an octant scale from 0 to 8 was used (8 means full cloud cover, while 0 indicates none).
2.7. Statistical Analysis
One-way analysis of variance was used to compare means across populations. The total variance (variation in outcomes) was divided into a portion derived from the differences between populations (treatments) and a portion derived from the differences between outcomes within populations (random error). The analysis of variance only gives information about whether there are statistically significant differences between populations.
In addition, the value of the Pearson correlation coefficient was calculated. It was located in the closed interval [−1, 1]. The greater its absolute value, the stronger the linear relationship between the variables. The linear correlation coefficient can be thought of as a normalised covariance.
Basic regression parameters, a method based on linear combinations of variables and parameters that fit the model to the data, were also calculated. The fitted regression line or curve represents the estimated expected value of variable Y at specific values of another variable or variables X.
3. Results and Discussion
3.1. Sampling Air from under and above the Manhole to the Sewer
At selected test points, samples were taken from the canal manholes at various depths and at the level of the canal manholes. Table 3 presents the values of minimum, average, median, and maximum cod results.
H2S was between 0 and 8.7 mg/m3, depending on sample depth, and Sivret et al., reported a median value between 1.9 and 16.0 mg/m3, depending on the sewer localisation [61], so the achieved results fit the “standard” values of H2S concentrations in sewer networks. Austigard et al., found high values of H2S in a sewer network: 56.0 mg/m3 downstream and 354 mg/m3 upstream [62]. Mantos et al., measured values between 145 mg/m3 and 482 mg/m3 [63], whereas Zhang et al., reported H2S concentrations up to 300 mg/m3 [64]. However, these values were observed in closed pipes, whereas the present study was conducted by sampling through manhole covers from which H2S was emitted into the outside air. CH3SH and DMS values were comparable to those reported by Sivret: the medians, respectively, were 0.3–4.3 mg/m3 and 0.06–0.45 mg/m3 [65]. Hwang et al., measured an average CH3SH concentration in the influent of a WWTP of about 3–200 times higher than other VOCs, such as DMS, CH₃S2CH₃, and CS2 [66]. Wang et al., as part of a monitoring program for sewers located at 18 different sites in Sydney and Melbourne, concluded that, in both cities, the CH3SH concentration (0.675–1.421 mg/m3) was substantially higher than the concentrations of DMS, CH₃S2CH₃, CH₃S3CH₃, and CS2 (0.008 mg/m3–0.094 mg/m3) [67]. Devai and DeLaune measured 8.0–8.7 mg/m3 of CH3SH and 3.8–26.4 mg/m3 DMS in WWTPs in the United States [68], while Chan and Hanaeus measured 13.7 mg/m3 and 114.1 mg/m3, respectively, in Swedish WTTPs [69]. Lasardi et al., detected H2S concentrations in Greek WWTP sewers between 0.001 and 111.5 mg/m3, while the CH3SH concentration was less than 0.466 mg/m3 [70]. Sun et al., measured H2S concentrations in sewers between 5.575 mg/m3 and 250.9 mg/m3 [21].
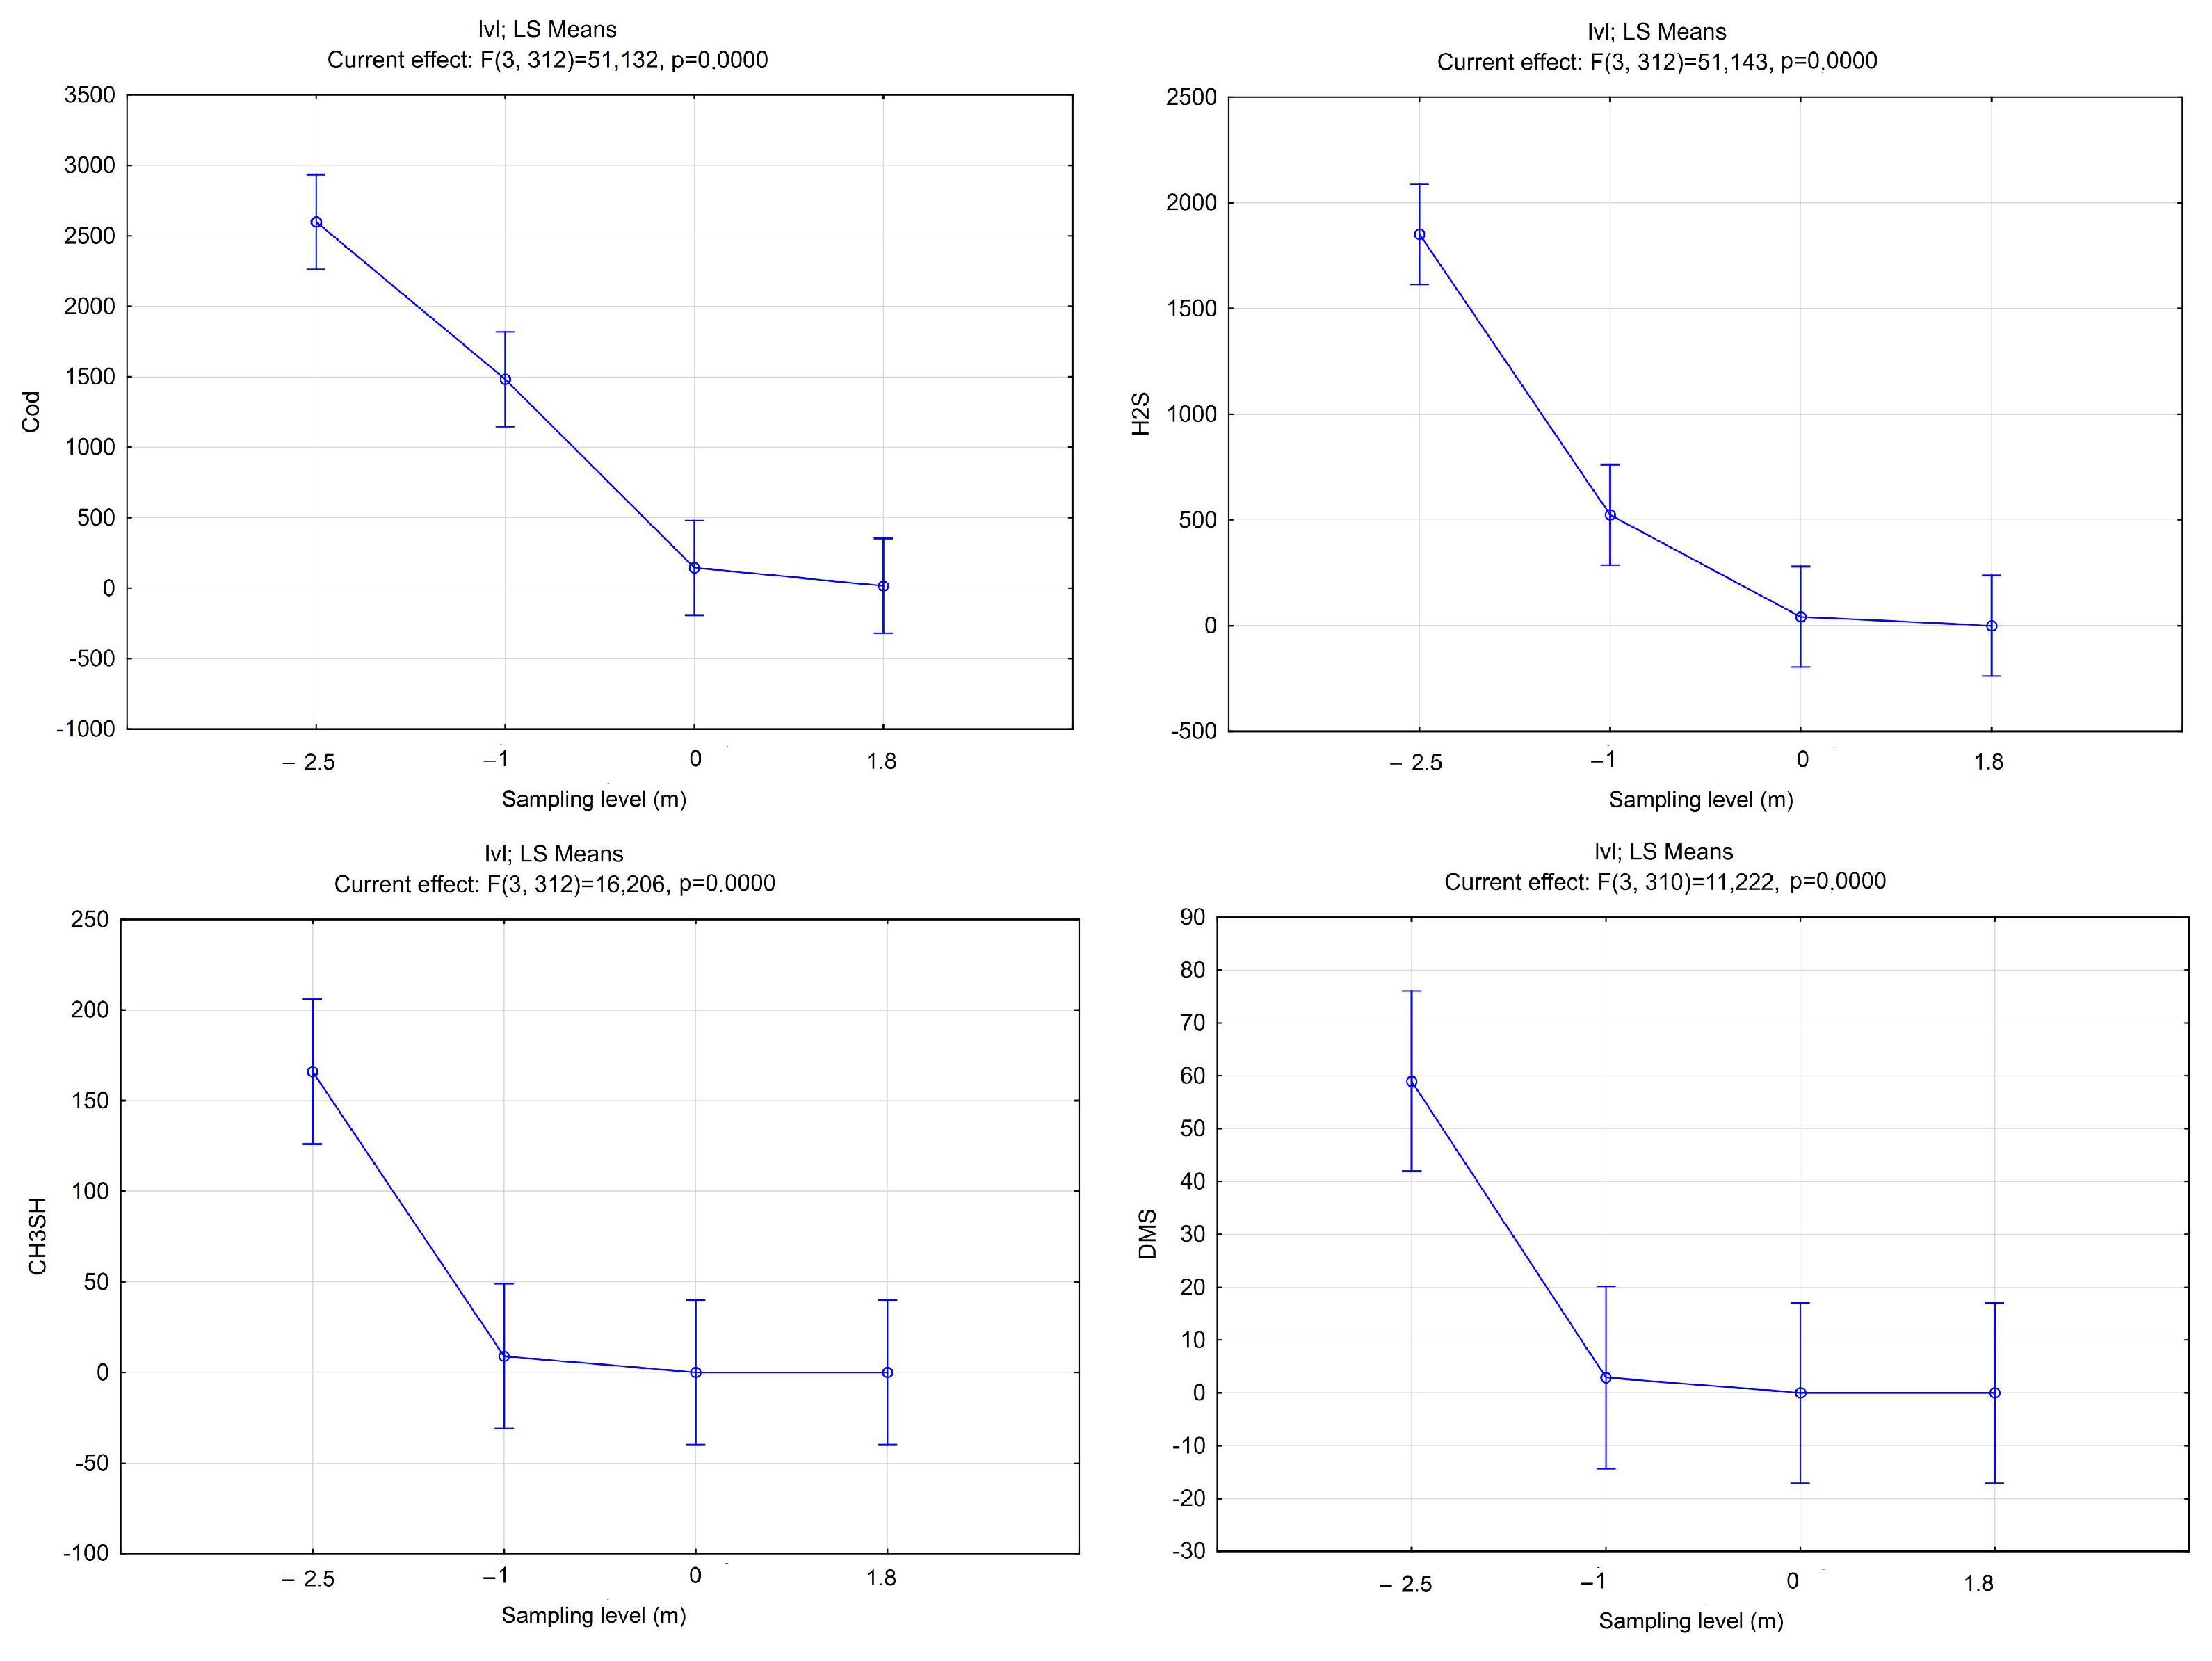
Additionally, a one-factor analysis of variance was performed, examining the significance of the influence of the grouping factor, i.e., the sampling level, on the values of cod and the concentrations of individual odorants. A graphical interpretation of the results of the analysis of variance is shown in Figure 2. Both the graphical interpretation and the value of the F value (the ratio of two mean square values), at p < 0.05, allow the rejection of the zero hypothesis regarding the lack of significant differences between the obtained results of dependent variables.
Then, for each of the variables, a second factor was determined, revealing the extent to which knowledge of the grouping factor explains the variability of the dependent variable. It is a proportion of the total variance explained by the experimental effect (level). For the variables cod, H2S, CH3SH, and (CH3)2S (DMS), the values of this coefficient—and, at the same time, the percentage of variance of the results of individual variables, which can be explained by the level—were 33%, 33%, 13%, and 10%, respectively. This measure describes the percentage of variance explained by a given effect only for a given sample. Additionally, the Pearson correlation coefficients between the examined variables were calculated. Table 4 presents the values of these coefficients and basic regression parameters.
In most cases, the correlation coefficient value is very high, ranging from 0.82 to 0.91. Smaller values were observed for variable pairs: cod—DMS and H2S—DMS for levels of −2.5 m and −1 m and CH3SH—DMS for a level of −1 m. This correlation is significant—the coefficient p was lower than 0.05 in each case. By analysing the parameters of the regression function, it was proved that the measure of adjustment of the regression line to the values observed is also high in most cases. The highest values of the determination factor were obtained for the cod—H2S, cod—CH3SH, and H2S—CH3SH variable pairs, both at the −2.5 m and −1 m levels. Similar results were achieved by Perez et al., and Gostelow et al.; for the different types of points in the sewer network, the regression coefficients between odour and H2S concentration were 0.91–0.99 [71,72]. A study by Thistlethwayte and Goleb [73] showed close relationships between the concentrations of sulphides, amines, aldehydes, and H2S. The authors argue that although the H2S test is not sufficient to determine the level of odour nuisance, it can be taken as an indicator of this nuisance. Research conducted by authors in dry weather conditions in sewers showed H2S levels in the range of 0.2–14 mg/m3. Investigations by Van Gemert [74] showed H2S values in the sewage system between 0.003 and 0.59 mg/m3.
The results presented vary widely, confirming the need to monitor sewage network emissions. The highest value (10,000 ou/m3) of the cod at depths of 2.5 m and 1 m were recorded at points located in Area 3 (2 m to the north-east of the “Fasty” industrial wastewater). Values of cod equal to 7500 ou/m3 were found at one of the Other measurement points (at a depth of 2.5 m). A concentration of 7500 ou/m3 was also found at a point located in an uncovered pipe above the chamber in Area 1 (at a depth of 1 m). As for other extremes, the following values of cod at a depth of 1 m were recorded at the following points:
- 6000 ou/m3—in Area 1 and at one of the Other sites;
- 4300 ou/m3—in Area 2;
- 3750 ou/m3—in Area 3 and at one of the Other sites;
- 3330 ou/m3—in Area 1;
- 2700 ou/m3—in Area 1 and Area 4 (near the municipal WWTP).
Perez et al., using a stationary olfactometer (samples were transported to the laboratory), also measured maximum values of cod lower than 10,000 ou/m3 in manholes in summer, except at one point where the cod was 35,000 ou/m3. That value was related to the fact that the points selected for the site were ‘critical’ points: the chimney and the manhole were both located close to the exit of a forced main [72].
3.2. Atmospheric Examinations—Sampling at a Height of 1.80 m
cod values in the atmosphere are presented in Figure 3, while Figure 4 shows the iod values in the north-western part of Białystok.
As a result of the direct field studies in particular areas of the city, it can be concluded that:
- No other sources of odorant emissions were identified except for those from the municipal sewage system.
- Sewerage wells are a significant source of emissions of catch compounds (including H2S, even in concentrations greater than 100 μg/m3), regardless of the season and weather conditions. The odour nuisance occurred in Area 4 and in other places in Białystok, such as in Area 1 and Area 2.
- Area 1 is also an essential source of odour impacts. Odour emitters include both manholes above the sewer and above the canal, which was used not only for rainwater but also for sewage.
- Significant odour nuisances were found during the rehabilitation of the sewer chambers (series no. V). Uncontrolled floodplains of raw sewage affecting the surrounding areas were formed.
H2S, even in small concentrations, is not only a nuisance but also poses a danger to human life and health, especially for those involved in the internal operation of sewage systems. Therefore, water and sewage companies have an obligation to implement the necessary safety measures before workers enter the sewage system. There is a role in these measures for portable measuring devices that make it possible to check the concentration values of toxic and explosive gases present in the sewer system, such as H2S and CH4. Therefore, the current H2S in situ field monitoring technologies are inadequate because of lower detection limits and/or complexity [20,75]. The human nose is more sensitive to H2S than most of the analytical methods: the odour threshold of that compound is about 0.47 ppbv in air [76] and between 0.025 and 0.25 μg/dm3 in clean water [77]. This is the concentration at which 50% of humans can detect the odour [20]. A synthetic, multidisciplinary approach, combining field olfactometry with in situ chemical analysis, is therefore appropriate.
4. Conclusions
Based on olfactometric and chemical determinations, the following corrective actions were proposed in order to minimise the odour nuisance of the sources identified in the sewage network operating in the analysed area of the city:
- The improvement of the operation works in the sewage network through the purchase and possible replacement of specialised equipment designed for and dedicated exclusively to operation works in sewage networks.
- Maintaining proper functioning of the sewer network in terms of hydraulics, while minimising the negative effects on the environment, requires the implementation of on-line monitoring of filling and flow rates in the sewers. This enables the identification of irregularities in network operations, e.g., very low levels of filling and filling speeds (which do take place in the examined sewer network), which favour the development of anaerobic processes in sewers. On the other hand, high filling levels and overfilling of the network are also recorded. These may result from, among other things, uncontrolled and even illegal discharges of wastewater into the city’s network. Monitoring should also cover the rainwater network, which makes it possible to record events involving the illegal discharge of sanitary sewage into the rainwater network.
- The modernisation of connection-and-branch chambers located in large sewers, where unpleasant odours are found to be a nuisance to the environment, in order to stabilise the flow without reversing it and while ensuring the proper ventilation of the sewers.
- A full inventorying and securing of the non-drainage tanks in the city area with the systematic control of their proper use and operation.
- The elimination of rainwater discharge into the sanitary sewage system.
Therefore, olfactometric research combined with the determination of odorants resulted not only in making a “map” of the olfactory impact of the sanitary sewage system over a wide area but also in the detection of irregularities in the operation of the network and an analysis of the basic dependence of the odour-odorant relationship at several depths under the sewer wells. Additionally, these studies have allowed the identification of the above-mentioned corrective actions.
Increasing urban growth and lifestyle expectations have led to increased public complaints regarding odours from sewer infrastructure, mainly from those in close proximity to a discharge source such as a manhole, sewer vent, or sewer pumping station. Closing sewer vents to prevent odour complaints can lead to an increase in humidity and H2S accumulation within the sewer, leading to increased biogenic corrosion [78]. Studies about odours/odorants in sewer networks are mainly focused on sulphuric compounds inside the pipes of closed sewer networks. This paper provided an improved methodology for odour/odorant monitoring in sewers, mainly in the vicinity of sewage manholes that are often the source of odour complaints. A significant added value of the work is the analysis of the concentration of odours and selected odorants at several depths under the sewage manhole, at the level of the manhole, and at the height of 1.8, which showed the stratification of the above-mentioned pollutants and the potential impact on reported odour nuisances. Olfactometric research, especially when conducted in situ, may be an appropriate method for the ad hoc monitoring of the processes taking place in sewage networks, both as a standalone method and in combination with the methods currently used. It is particularly important in this context to know the relationship between commonly tested odorants and odour emissions. Olfactometric examination allows the detection of unwanted emissions of odours at individual points in the network in concentrations that are not detected by standard sensors but which nevertheless cause odour nuisances, complaints, and social conflict.
Author Contributions
Conceptualisation, M.S.-S. and M.W.; methodology, A.K., M.W. and M.S.-S.; investigation, A.K., M.S.-S. and M.W.; data curation, M.S.-S. and M.W.; writing—original draft preparation, M.S.-S. and M.W.; writing—review and editing, A.K.; visualisation, M.S.-S.; supervision, A.K.; project administration, A.K.; funding acquisition, A.K. All authors have read and agreed to the published version of the manuscript.
Funding
This research was funded by the Warsaw University of Technology. IDUB Open Science Programme.
Institutional Review Board Statement
Not applicable.
Informed Consent Statement
Not applicable.
Data Availability Statement
Data available on request.
Conflicts of Interest
The authors declare no conflict of interest.
Abbreviations
| AT | air temperature |
| cod | odour concentration |
| DC | degree of cloudiness |
| DMS | (CH3)2S—dimethyl sulphide |
| D/T | Dilution-to-Threshold Ratio |
| EPA | The United States Environmental Protection Agency |
| GC | gas chromatograph |
| iod | odour intensity |
| PID | photoionization detector |
| RH | relative humidity |
| VOCs | volatile organic compounds |
| WD | wind direction |
| WS | wind speed |
| WWTP | wastewater treatment plant |
References
- Koe, L.C.C. Characterization and removal of odors from refuse material. Environ. Monit. Assess. 1988, 10, 75–84. [Google Scholar] [CrossRef] [PubMed]
- Filipy, J.; Rumburg, B.; Mount, G.; Westberg, H.; Lamb, B. Identification and quantification of volatile organic compounds from a dairy. Atmos. Environ. 2006, 40, 1480–1494. [Google Scholar] [CrossRef]
- Le Leuch, L.M.; Subrenat, A.; Le Cloirec, P. Removal of target odorous molecules on to activated carbon cloths. Water Sci. Technol. 2004, 50, 193–198. [Google Scholar] [CrossRef] [PubMed]
- Lillo-Ródenas, M.A.; Ros, A.; Fuente, E.; Montes-Morán, M.A.; Martin, M.J.; Linares-Solano, A. Further insights into the activation process of sewage sludge-based precursors by alkaline hydroxides. Chem. Eng. J. 2008, 142, 168–174. [Google Scholar] [CrossRef]
- Muezzinoglu, A. A study of volatile organic sulfur emissions causing urban odors. Chemosphere 2003, 51, 245–252. [Google Scholar] [CrossRef]
- Vega, E.; Sánchez-Reyna, G.; Mora-Perdomo, V.; Iglesias, G.S.; Arriaga, J.L.; Limón-Sánchez, T.; Escalona-Segura, S.; Gonzalez-Avalos, E. Air quality assessment in a highly industrialized area of Mexico: Concentrations and sources of volatile organic compounds. Fuel 2011, 90, 3509–3520. [Google Scholar] [CrossRef]
- Wiśniewska, M.; Kulig, A.; Lelicińska-Serafin, K. Odour Emissions of Municipal Waste Biogas Plants—Impact of Technological Factors, Air Temperature and Humidity. Appl. Sci. 2020, 10, 1093. [Google Scholar] [CrossRef] [Green Version]
- Matos, R.V.; Matias, N.; Ferreira, F.; Matos, J.S. Dynamic Modeling of Hydrogen Sulfide within Enclosed Environments in Biosolids Recovery Facilities. Water Environ. Res. 2017, 88, 2209–2218. [Google Scholar] [CrossRef]
- Pochwat, K.; Kida, M.; Ziembowicz, S.; Koszelnik, P. Odours in Sewerage—A Description of Emissions and of Technical Abatement Measures. Environments 2019, 6, 89. [Google Scholar] [CrossRef] [Green Version]
- Mathews, E.R.; Barnett, D.; Petrovski, S.; Franks, A.E. Reviewing microbial electrical systems and bacteriophage biocontrol as targeted novel treatments for reducing hydrogen sulfide emissions in urban sewer systems. Rev. Environ. Sci. Bio/Technol. 2018, 17, 749–764. [Google Scholar] [CrossRef]
- Grengg, C.; Mittermayr, F.; Baldermann, A.; Böttcher, M.E.; Leis, A.; Koraimann, G.; Grunert, P.; Dietzel, M. Microbiologically induced concrete corrosion: A case study from a combined sewer network. Cem. Concr. Res. 2015, 77, 16–25. [Google Scholar] [CrossRef] [Green Version]
- Yongsiri, C.; Vollertsen, J.; Hvitved-Jacobsen, T. Hydrogen sulfide emission in sewer networks: A two-phase modeling approach to the sulfur cycle. Water Sci. Technol. 2004, 50, 161–168. [Google Scholar] [CrossRef] [PubMed]
- Vollertsen, J.; Nielsen, A.H.; Jensen, H.S.; Wium-Andersen, T.; Hvitved-Jacobsen, T. Corrosion of concrete sewers—The kinetics of hydrogen sulfide oxidation. Sci. Total Environ. 2008, 394, 162–170. [Google Scholar] [CrossRef] [PubMed]
- Tomar, M.; Abdullah, T.H.A.; Abdullah, J.H.A. Effect of aeration on generation and emission of hydrogen sulfide in wet wells of lifting stations. Water Air Soil Pollut. 1995, 81, 385–399. [Google Scholar] [CrossRef]
- Grengg, C.; Müller, B.; Staudinger, C.; Mittermayr, F.; Breininger, J.; Ungerböck, B.; Borisov, S.M.; Mayr, T.; Dietzel, M. High-resolution optical pH imaging of concrete exposed to chemically corrosive environments. Cem. Concr. Res. 2019, 116, 231–237. [Google Scholar] [CrossRef]
- Nielsen, K.A.; Tattersall, D.B.; Jones, P.R.; Møller, B.L. Metabolon formation in dhurrin biosynthesis. Phytochemistry 2008, 69, 88–98. [Google Scholar] [CrossRef]
- Jiang, L.; Liu, H.; Chu, H.; Zhu, C.; Xiong, C.; You, L.; Xu, J.; Zhang, Y.; Qin, Y. Influence of compression fatigue on chloride threshold value for the corrosion of steels in simulated concrete pore. Constr. Build. Mater. 2014, 73, 699–704. [Google Scholar] [CrossRef]
- Ren, Y.G.; Wang, J.H.; Li, H.F.; Zhang, J.; Qi, P.Y.; Hu, Z. Nitrous oxide and methane emissions from different treatment processes in full-scale municipal wastewater treatment plants. Environ. Technol. 2013, 34, 2917–2927. [Google Scholar] [CrossRef]
- Turkmen, M.; Dentel, S.K.; Chiu, P.C.; Hepner, S. Analysis of sulfur and nitrogen odorants using solid-phase microextraction and GC-MS. Water Sci. Technol. 2004, 50, 115–120. [Google Scholar] [CrossRef]
- Chen, D.; Szostak, P. Factor analysis of H2S emission at a wastewater lift station: A case study. Environ. Monit. Assess. 2013, 185, 3551–3560. [Google Scholar] [CrossRef]
- Sun, J.; Hu, S.; Sharma, K.R.; Ni, B.-J.; Yuan, Z. Degradation of methanethiol in anaerobic sewers and its correlation with methanogenic activities. Water Res. 2015, 69, 80–89. [Google Scholar] [CrossRef] [PubMed]
- Sun, J.; Hu, S.; Sharma, K.R.; Ni, B.-J.; Yuan, Z. Stratified Microbial Structure and Activity in Sulfide- and Methane-Producing Anaerobic Sewer Biofilms. Appl. Environ. Microbiol. 2014, 80, 7042–7052. [Google Scholar] [CrossRef] [PubMed] [Green Version]
- Vitko, T.G.; Suffet, I.H. Corrective factors applied to reduced sulfur compounds in wastewater foul air. Water Environ. Res. 2021, 93, 1487–1495. [Google Scholar] [CrossRef] [PubMed]
- Gebicki, J.; Byliński, H.; Namieśnik, J. Measurement techniques for assessing the olfactory impact of municipal sewage treatment plants. Environ. Monit. Assess. 2016, 188, 32. [Google Scholar] [CrossRef] [PubMed]
- Naddeo, V.; Belgiorno, V.; Zarra, T. Odour Impact Assessment Handbook; John Wiley & Sons: Hoboken, NJ, USA, 2012; ISBN 111996928X. [Google Scholar]
- Muñoz, R.; Sivret, E.C.; Parcsi, G.; Lebrero, R.; Wang, X.; Suffet, I.H.; Stuetz, R.M. Monitoring techniques for odour abatement assessment. Water Res. 2010, 44, 5129–5149. [Google Scholar] [CrossRef]
- Maurer, D.L.; Bragdon, A.M.; Short, B.C.; Heekwon, A.; Koziel, J.A. Improving environmental odor measurements:comparison of lab-based standard method and portable odor measurement technology. Arch. Environ. Prot. 2018, 44, 100–107. [Google Scholar] [CrossRef]
- Maurer, D.L.; Bragdon, A.M.; Short, B.C.; Heekwon, A.; Koziel, J.A.; Wiśniewska, M. Methods of Assessing Odour Emissions from Biogas Plants Processing Municipal Waste. J. Ecol. Eng. 2020, 21, 140–147. [Google Scholar] [CrossRef]
- Giungato, P.; Di Gilio, A.; Palmisani, J.; Marzocca, A.; Mazzone, A.; Brattoli, M.; Giua, R.; De Gennaro, G. Synergistic approaches for odor active compounds monitoring and identification: State of the art, integration, limits and potentialities of analytical and sensorial techniques. TrAC Trends Anal. Chem. 2018, 107, 116–129. [Google Scholar] [CrossRef]
- Hayes, J.E.; Stevenson, R.J.; Stuetz, R.M. The impact of malodour on communities: A review of assessment techniques. Sci. Total Environ. 2014, 500, 395–407. [Google Scholar] [CrossRef]
- González, I.; Robledo-Mahón, T.; Silva-Castro, G.A.; Rodríguez-Calvo, A.; Gutiérrez, M.C.; Martín, M.Á.; Chica, A.F.; Calvo, C. Evolution of the composting process with semi-permeable film technology at industrial scale. J. Clean. Prod. 2016, 115, 245–254. [Google Scholar] [CrossRef]
- Gutiérrez, M.C.; Martín, M.A.; Chica, A.F. Usual variables and odour concentration to evaluate composting process and odour impact. Environ. Technol. 2014, 35, 709–718. [Google Scholar] [CrossRef] [PubMed]
- Kulig, A.; Szylak-Szydlowski, M. Assessment of range of olfactory impact of plant to mechanical-biological treatment of municipal waste. Chem. Eng. Trans. 2016, 54, 247–252. [Google Scholar]
- Sironi, S.; Capelli, L.; Céntola, P.; Del Rosso, R.; Pierucci, S. Odour impact assessment by means of dynamic olfactometry, dispersion modelling and social participation. Atmos. Environ. 2010, 44, 354–360. [Google Scholar] [CrossRef]
- Bax, C.; Sironi, S.; Capelli, L. How Can Odors Be Measured? An Overview of Methods and Their Applications. Atmosphere 2020, 11, 92. [Google Scholar] [CrossRef] [Green Version]
- Szyłak-Szydłowski, M. Validation of odor concentration from mechanical-biological treatment piles using static chamber and wind tunnel with different wind speed values. J. Air Waste Manag. Assoc. 2017, 67, 1046–1054. [Google Scholar] [CrossRef] [Green Version]
- Nicell, J.A. Assessment and regulation of odour impacts. Atmos. Environ. 2009, 43, 196–206. [Google Scholar] [CrossRef]
- Brandt, R.C.; Adviento-Borbe, M.A.A.; Elliott, H.A.; Wheeler, E.F. Protocols for Reliable Field Olfactometry Odor Evaluations. Appl. Eng. Agric. 2011, 27, 457–466. [Google Scholar] [CrossRef]
- Benzo, M.; Mantovani, A.; Pittarello, A. Measurement of Odour Concentration of Immissions using a New Field Olfactometer and Markers’ Chemical Analysis. Chem. Eng. Trans. 2012, 30, 103–108. [Google Scholar] [CrossRef]
- Capelli, L.; Sironi, S.; Del Rosso, R.; Guillot, J.-M. Measuring odours in the environment vs. dispersion modelling: A review. Atmos. Environ. 2013, 79, 731–743. [Google Scholar] [CrossRef]
- Pan, L.; Yang, S.X.; DeBruyn, J. Factor Analysis of Downwind Odours from Livestock Farms. Biosyst. Eng. 2007, 96, 387–397. [Google Scholar] [CrossRef]
- Toledo, M.; Siles, J.A.; Gutiérrez, M.C.; Martín, M.A. Monitoring of the composting process of different agroindustrial waste: Influence of the operational variables on the odorous impact. Waste Manag. 2018, 76, 266–274. [Google Scholar] [CrossRef] [PubMed]
- Szyłak-Szydłowski, M. Comparison of two types of field olfactometers for assessing odours in laboratory and field tests. Chem. Eng. Trans. 2014, 40, 67–72. [Google Scholar]
- Walgraeve, C.; Van Huffel, K.; Bruneel, J.; Van Langenhove, H. Evaluation of the performance of field olfactometers by selected ion flow tube mass spectrometry. Biosyst. Eng. 2015, 137, 84–94. [Google Scholar] [CrossRef]
- Szylak-Szydlowski, M. Odour nuisance of railway sleepers saturated with creosote oil. Chem. Eng. Trans. 2016, 54, 163–168. [Google Scholar]
- Lewkowska, P.; Cieślik, B.; Dymerski, T.; Konieczka, P.; Namieśnik, J. Characteristics of odors emitted from municipal wastewater treatment plant and methods for their identification and deodorization techniques. Environ. Res. 2016, 151, 573–586. [Google Scholar] [CrossRef]
- Wang, T.; Sattayatewa, C.; Venkatesan, D.; Noll, K.E.; Pagilla, K.R.; Moschandreas, D.J. Modeling indoor odor–odorant concentrations and the relative humidity effect on odor perception at a water reclamation plant. Atmos. Environ. 2011, 45, 7235–7239. [Google Scholar] [CrossRef]
- Pearson, C.; Littlewood, E.; Douglas, P.; Robertson, S.; Gant, T.W.; Hansell, A.L. Exposures and health outcomes in relation to bioaerosol emissions from composting facilities: A systematic review of occupational and community studies. J. Toxicol. Environ. Health. B Crit. Rev. 2015, 18, 43–69. [Google Scholar] [CrossRef]
- González, D.; Colón, J.; Sánchez, A.; Gabriel, D. A systematic study on the VOCs characterization and odour emissions in a full-scale sewage sludge composting plant. J. Hazard. Mater. 2019, 373, 733–740. [Google Scholar] [CrossRef]
- González, D.; Guerra, N.; Colón, J.; Gabriel, D.; Ponsá, S.; Sánchez, A. Filling in sewage sludge biodrying gaps: Greenhouse gases, volatile organic compounds and odour emissions. Bioresour. Technol. 2019, 291, 121857. [Google Scholar] [CrossRef]
- Kulig, A.; Szyłak-Szydłowski, M. Assessment of the Effects of Wastewater Treatment Plant Modernization by Means of the Field Olfactometry Method. Water 2019, 11, 2367. [Google Scholar] [CrossRef] [Green Version]
- Man, Z.; Dai, X.; Rong, L.; Kong, X.; Ying, S.; Xin, Y.; Liu, D. Evaluation of storage bags for odour sampling from intensive pig production measured by proton-transfer-reaction mass-spectrometry. Biosyst. Eng. 2019, 189, 48–59. [Google Scholar] [CrossRef]
- Badach, J.; Kolasińska, P.; Paciorek, M.; Wojnowski, W.; Dymerski, T.; Gębicki, G.; Dymnicka, M.; Namieśnik, J. A case study of odour nuisance evaluation in the context of integrated urban planning. J. Environ. Manag. 2018, 213, 417–424. [Google Scholar] [CrossRef] [PubMed]
- Invernizzi, M.; Capelli, L.; Sironi, S. Proposal of Odor Nuisance Index as Urban Planning Tool. Chem. Senses 2017, 42, 105–110. [Google Scholar] [CrossRef] [PubMed] [Green Version]
- Brandt, R.C.; Elliott, H.A.; Adviento-Borbe, M.A.A.; Wheeler, E.F.; Kleinman, P.J.A.; Beegle, D.B. Field Olfactometry Assessment of Dairy Manure Land Application Methods. J. Environ. Qual. 2011, 40, 431–437. [Google Scholar] [CrossRef] [PubMed] [Green Version]
- Damuchali, A.M.; Guo, H. Evaluation of a field olfactometer in odour concentration measurement. Biosyst. Eng. 2019, 187, 239–246. [Google Scholar] [CrossRef]
- Grzelka, A.; Sówka, I.; Miller, U. Metody oceny emisji odorów z obiektów gospodarki hodowlanej. Inżynieria Ekol. 2018, 19, 56–64. [Google Scholar] [CrossRef] [Green Version]
- Fisher, R.M.; Barczak, R.J.; Suffet, I.H.M.; Hayes, J.E.; Stuetz, R.M. Framework for the use of odour wheels to manage odours throughout wastewater biosolids processing. Sci. Total Environ. 2018, 634, 214–223. [Google Scholar] [CrossRef]
- Szyłak-Szydłowski, M. Odour Samples Degradation During Detention in Tedlar® Bags. Water Air Soil Pollut. 2015, 226, 227. [Google Scholar] [CrossRef] [Green Version]
- Wiśniewska, M.; Kulig, A.; Lelicińska-Serafin, K. Olfactometric testing as a method for assessing odour nuisance of biogas plants processing municipal waste. Arch. Environ. Prot. 2020, 46, 60–68. [Google Scholar] [CrossRef]
- Sivret, E.C.; Le-Minh, N.; Wang, B.; Wang, X.; Stuetz, R.M. Dynamics of Volatile Sulfur Compounds and Volatile Organic Compounds in Sewer Headspace Air. J. Environ. Eng. 2017, 143, 04016080. [Google Scholar] [CrossRef]
- Austigard, A.D.; Svendsen, K.; Heldal, K.K. Hydrogen sulphide exposure in waste water treatment. J. Occup. Med. Toxicol. 2018, 13, 10. [Google Scholar] [CrossRef] [PubMed] [Green Version]
- Matos, R.V.; Ferreira, F.; Gil, C.; Matos, J.S. Understanding the effect of ventilation, intermittent pumping and seasonality in hydrogen sulfide and methane concentrations in a coastal sewerage system. Environ. Sci. Pollut. Res. 2019, 26, 3404–3414. [Google Scholar] [CrossRef] [PubMed]
- Zhang, L.; De Schryver, P.; De Gusseme, B.; De Muynck, W.; Boon, N.; Verstraete, W. Chemical and biological technologies for hydrogen sulfide emission control in sewer systems: A review. Water Res. 2008, 42, 1–12. [Google Scholar] [CrossRef] [PubMed]
- Sivret, E.C.; Wang, B.; Parcsi, G.; Stuetz, R.M.; Sivret, E.C.; Wang, B.; Parcsi, G.; Stuetz, R.M. Prioritisation of odorants emitted from sewers using odour activity values. Water Res. 2016, 88, 308–321. [Google Scholar] [CrossRef]
- Hwang, Y.; Matsuo, T.; Hanaki, K.; Suzuki, N. Identification and quantification of sulfur and nitrogen containing odorous compounds in wastewater. Water Res. 1995, 29, 711–718. [Google Scholar] [CrossRef]
- Wang, B.; Sivret, E.C.; Parcsi, G.; Le, N.M.; Kenny, S.; Bustamante, H.; Stuetz, R.M. Reduced sulfur compounds in the atmosphere of sewer networks in Australia: Geographic (and seasonal) variations. Water Sci. Technol. 2013, 69, 1167–1173. [Google Scholar] [CrossRef] [Green Version]
- Devai, I.; DeLaune, R.D. Emission of Reduced Malodorous Sulfur Gases from Wastewater Treatment Plants. Water Environ. Res. 1999, 71, 203–208. [Google Scholar] [CrossRef]
- Chan, A.A.; Han, J. Odorous wastewater emissions. Vatten 2006, 62, 227–236. Available online: https://www.semanticscholar.org/paper/Odorous-wastewater-emissions-Andersson-Chan-Hanaeus/56e586d26ed89a467638a6ee7f969cbcf983b79a (accessed on 24 April 2022).
- Lasaridi, K.; Katsabanis, G.; Kyriacou, A.; Maggos, T.; Manios, T.; Fountoulakis, M.; Stentiford, E.I. Assessing odour nuisance from wastewater treatment and composting facilities in Greece. Waste Manag. Res. 2010, 28, 977–984. [Google Scholar] [CrossRef]
- Pérez, A.; Manjón, C.; Martínez, J.V.; Juárez-Galan, J.M.; Barillon, B.; Bouchy, L. Odours in sewer networks: Nuisance assessment. Water Sci. Technol. 2013, 67, 543–548. [Google Scholar] [CrossRef]
- Gostelow, P.; Parsons, S.A.; Stuetz, R.M. Odour measurements for sewage treatment works. Water Res. 2001, 35, 579–597. [Google Scholar] [CrossRef]
- Thistlethwayte, D.K.B.; Goleb, E.E. The composition of sewer air. In Proceedings of the 6th International Conference on Water Pollution Research, Jerusalem, Israel, 18–23 June 1972; pp. 281–289. [Google Scholar]
- Van Gemert, L.J. Odour Thresholds: Compilations of Odour Threshold Values in Air, Water and Other Media; Oliemans Punter & Partners BV: Zeist, The Netherlands, 2003. [Google Scholar]
- Sutherland-Stacey, L.; Corrie, S.; Neethling, A.; Johnson, I.; Gutierrez, O.; Dexter, R.; Yuan, Z.; Keller, J.; Hamilton, G. Continuous measurement of dissolved sulfide in sewer systems. Water Sci. Technol. 2008, 57, 375–381. [Google Scholar] [CrossRef] [PubMed]
- Tchobanoglous, G.; Franklin, L.M.; Burton, E.C.; Stensel, H.D. Wastewater Engineering Treatment and Reuse, 4th ed.; McGraw-Hill: New York, NY, USA, 2011. [Google Scholar]
- Eaton, A.D.; Franson, M.A.H.; Clesceri, L.S.; Rice, E.W.; Greenberg, A.E.; American Public Health Association; American Water Works Association; Water Environment Federation. Standard Methods for the Examination of Water & Wastewater; American Public Health Association: Washington, DC, USA, 2005; ISBN 0875530478. [Google Scholar]
- Shammay, A.; Evason, I.E.J.; Stuetz, R.M. Prioritisation of odorants emitted from sewers using odour activity values. J. Environ. Manag. 2019, 249, 308–321. [Google Scholar] [CrossRef]
Figure 2.
Graphical interpretation of the results of the variable variance analysis: cod (ou/m3), concentrations of selected odorants (mg/m3) against the grouping factor, i.e., sampling level. Effective hypothesis decomposition; vertical bars denote 0.95 confidence intervals.
Figure 2.
Graphical interpretation of the results of the variable variance analysis: cod (ou/m3), concentrations of selected odorants (mg/m3) against the grouping factor, i.e., sampling level. Effective hypothesis decomposition; vertical bars denote 0.95 confidence intervals.

Figure 3.
cod in the atmosphere of the north-western part of Białystok (at a height of 1.8 m).

Figure 4.
iod in the atmosphere of the north-western part of Białystok (at a height of 1.8 m).


Table 1.
Examples of the use of field olfactometers in various research areas.
| Field of Study | Reference |
|---|---|
| Impacts of mechanical-biological waste treatment plants and validating the cod from piles | [33,36] |
| Assessment of the odour nuisance of railway sleepers saturated with creosote oil | [45] |
| Estimation of iod in the atmospheric air near municipal wastewater treatment plants (WWTP) | [46] |
| Determination of cod around a water reclamation plant | [47] |
| Determination of cod around a sewage sludge composting plant | [48,49] |
| Assessing the range of olfactory impacts of municipal landfills | [49] |
| Determination of cod near a sewage sludge biodrying installation | [50] |
| Measurement of the effects of WWTP modernisation | [51] |
| Monitoring livestock farm odours | [41,52] |
| Evaluation of odour nuisance coupled with odour dispersion modelling can be applied to the development of local urban planning strategies | [53,54] |
| Monitoring odours of dairy manure slurry | [55] |
| Determination of cod around poultry barns | [56] |
Table 2.
Schedule of chemical and olfactometric tests with the number of receptor points.
| Series No. | Research Date | Number of Points | |
|---|---|---|---|
| Chemical Measurements | Olfactometry Measurements | ||
| I | 14–15 November 2017 | 19 | 48 |
| II | 16–17 January 2018 | 32 | 32 |
| III | 13–14 April 2018 | 20 | 36 |
| IV | 25–26 May 2018 | 20 | 55 |
| V | 14–15 July 2018 | 20 | 86 |
| VI | 12 September 2018 | 20 | 76 |
| Sum: | - | 131 | 333 |
Table 3.
Values of minimum, average, median, and maximum results of odour and selected odorant concentrations at test points at different depths from under the manholes to the sewers. Depths: 2.5 m, 1 m, at the level of the manhole, and at the height of 1.8 m.
Table 3.
Values of minimum, average, median, and maximum results of odour and selected odorant concentrations at test points at different depths from under the manholes to the sewers. Depths: 2.5 m, 1 m, at the level of the manhole, and at the height of 1.8 m.
| Parameter | Value | Sampling Level | |||
|---|---|---|---|---|---|
| −2.5 m | −1 m | 0 m | 1.8 m | ||
| cod (ou/m3) | min | 515 | 94 | 0 | 0 |
| mean | 2487 | 1245 | 160 | 17 | |
| median | 1500 | 750 | 44 | 6 | |
| max | 10,000 | 10,000 | 750 | 106 | |
| H2S concentration (mg/m3) | min | 0.020 | 0 | 0 | 0 |
| mean | 1.852 | 0.524 | 0.042 | 0 | |
| median | 1.144 | 0 | 0 | 0 | |
| max | 8.715 | 5.584 | 0.274 | 0 | |
| CH3SH concentration (mg/m3) | min | 0 | 0 | 0 | 0 |
| mean | 0.166 | 0.009 | 0 | 0 | |
| median | 0.015 | 0 | 0 | 0 | |
| max | 1.720 | 0.093 | 0 | 0 | |
| (CH3)2S (DMS) concentration (mg/m3) | min | 0 | 0 | 0 | 0 |
| mean | 0.059 | 0.003 | 0 | 0 | |
| median | 0 | 0 | 0 | 0 | |
| max | 0.942 | 0.065 | 0 | 0 | |
Table 4.
Correlation coefficients and basic regression parameters of variables: cod and concentrations of individual odorants.
Table 4.
Correlation coefficients and basic regression parameters of variables: cod and concentrations of individual odorants.
| Factor | R | R2 | t | Constant Y | Slope Y | Constant X | Slope X | |||||||
|---|---|---|---|---|---|---|---|---|---|---|---|---|---|---|
| Level | −2.5 | −1.0 | −2.5 | −1.0 | −2.5 | −1.0 | −2.5 | −1.0 | −2.5 | −1.0 | −2.5 | −1.0 | −2.5 | −1.0 |
| Cod H2S | 0.91 | 0.97 | 0.83 | 0.94 | 19.74 | 34.72 | −23.98 | −349.5 | 0.72 | 0.58 | 456.7 | 649.4 | 1.16 | 1.61 |
| Cod CH3SH | 0.82 | 0.83 | 0.67 | 0.69 | 12.54 | 12.88 | −178.3 | −6.29 | 0.13 | 0.01 | 1758 | 909.1 | 5.07 | 72.53 |
| Cod DMS | 0.54 | 0.73 | 0.29 | 0.53 | 5.60 | 9.26 | −37.29 | −2.95 | 0.04 | 0.00 | 2138 | 1068 | 7.82 | 132.1 |
| H2S CH3SH | 0.84 | 0.80 | 0.71 | 0.65 | 13.59 | 11.71 | −152.4 | −0.12 | 0.17 | 0.02 | 1171 | 181.1 | 4.10 | 42.23 |
| H2S DMS | 0.63 | 0.76 | 0.40 | 0.57 | 7.21 | 9.99 | −43.43 | −0.54 | 0.06 | 0.01 | 1422 | 258.5 | 7.29 | 82.16 |
| CH3SH DMS | 0.88 | 0.63 | 0.77 | 0.40 | 16.04 | 7.00 | −3.02 | 0.64 | 0.37 | 0.30 | 44.47 | 3.71 | 2.06 | 1.30 |
Abbreviations: Level—sampling level (m), R—Pearson correlation coefficient, R2—coefficient of determination, t—value of statistics t examining the significance of the correlation coefficient, Constant—free linear regression of Y to X and X to Y, Slope—linear regression coefficient of Y to X and X to Y, respectively.
Publisher’s Note: MDPI stays neutral with regard to jurisdictional claims in published maps and institutional affiliations. |
© 2022 by the authors. Licensee MDPI, Basel, Switzerland. This article is an open access article distributed under the terms and conditions of the Creative Commons Attribution (CC BY) license (https://creativecommons.org/licenses/by/4.0/).
Share and Cite
MDPI and ACS Style
Kulig, A.; Szyłak-Szydłowski, M.; Wiśniewska, M. Application of Field Olfactometry to Monitor the Odour Impact of a Municipal Sewage System. Energies 2022, 15, 4015. https://0-doi-org.brum.beds.ac.uk/10.3390/en15114015
AMA Style
Kulig A, Szyłak-Szydłowski M, Wiśniewska M. Application of Field Olfactometry to Monitor the Odour Impact of a Municipal Sewage System. Energies. 2022; 15(11):4015. https://0-doi-org.brum.beds.ac.uk/10.3390/en15114015
Chicago/Turabian StyleKulig, Andrzej, Mirosław Szyłak-Szydłowski, and Marta Wiśniewska. 2022. "Application of Field Olfactometry to Monitor the Odour Impact of a Municipal Sewage System" Energies 15, no. 11: 4015. https://0-doi-org.brum.beds.ac.uk/10.3390/en15114015
Note that from the first issue of 2016, this journal uses article numbers instead of page numbers. See further details here.