Article

Impact of Separator Thickness on Temperature Distribution in Single Cell of Polymer Electrolyte Fuel Cell Operated at Higher Temperature of 90 °C and 100 °C

1
Division of Mechanical Engineering, Graduate School of Engineering, Mie University, 1577 Kurimamachiya-cho, Tsu 514-8507, Japan
2
Faculty of Engineering and Science, University of Agder, P.O. Box 422, NO 4604 Kristiansand, Norway
*
Author to whom correspondence should be addressed.
Submission received: 13 May 2022 / Revised: 3 June 2022 / Accepted: 6 June 2022 / Published: 7 June 2022

Abstract

:
The New Energy and Industry Technology Development Organization (NEDO) road map (Japan, 2017) has proposed that a polymer electrolyte fuel cell (PEFC) system, which operates at a temperature of 90 °C and 100 °C, be applied for stationary and mobility usage, respectively. This study suggests using a thin polymer electrolyte membrane (PEM) and a thin gas diffusion layer (GDL), at the same time, to achieve better power-generation performance, at a higher temperature than usual. The focus of this paper is to clarify the effect of separator thickness on the distribution of temperature at the reaction surface (Treact), with the relative humidity (RH) of the supply gasses and initial operation temperature (Tini), quantitatively. In this study, separator thickness is investigated in a system using a thin PEM and a thin GDL. Moreover, this study investigates the difference between the maximum temperature and the minimum temperature obtained from the distribution of Treact as well as the relation between the standard deviation of TreactTini and total voltage, to clarify the effect of separator thickness. The impact of the flow rates of the supply gases on the distribution of Treact is not large, among the investigated conditions. It is noticed that the temperature distribution is wider when a separator thickness of 2.0 mm is selected. On the other hand, it is observed that the temperature increases along with the gas flow through the gas channel, by approximately 2 °C, when using a separator thickness between 1.5 mm and 1.0 mm. The impact of the RH on the distributions of TreactTini is larger at Tini = 100 °C, when a separator thickness of 1.0 mm is selected. It is revealed that the wider temperature distribution provides a reduction in power-generation performance. This study proposes that the thin separators, i.e., with a thickness of 1.5 mm and 1.0 mm, are not suitable for higher temperature operation than usual.

1. Introduction

It is thought that renewable H2 can be considered to be one procedure to solve global warming. Polymer electrolyte fuel cell (PEFC) is a popular application, to use H2 as a fuel, which can generate power and heat. In Japan, the New Energy and Industrial Technology Development Organization (NEDO)’s road map (Japan, 2017) [1] has declared that a polymer electrolyte fuel cell (PEFC) should be operated at 90 °C and 100 °C for stationary and mobility application, respectively, which is the target from 2020 to 2025. However, the normal PEFC, using a polymer electrolyte membrane (PEM), such as Nafion, is usually operated within the temperature range between 60 °C and 80 °C [2,3,4]. If we operate the PEFC at a relatively higher temperature than usual (i.e., 90 °C and 100 °C, as mentioned above), we can obtain the following merits: (i) promotion of the electro-chemical kinetics of both electrodes; (ii) reduction in the cooling system because of the larger temperature difference between the PEFC stack and coolant; and (iii) improvement of the endurance to CO, which is available for reformed H2, including CO [5]. However, we have to consider the following problems, if we operate PEFC at a higher temperature than usual: (i) degradation of the PEM; (ii) erosion of the catalyst; and (iii) uneven distributions of gas flows, pressure, temperature, voltage, and current in the PEFC. We have to solve these problems, in order to commercialize a PEFC system that is operated at a relatively high temperature [6]. In addition, we think temperature distribution at high temperature, also, influences the phase change of water, the performance of PEM, the fuel and oxidant flow characteristics in the gas diffusion layer (GDL), and the catalyst layer. Consequently, it is necessary to analyze the temperature distribution in a single PEFC, to improve the power-generation performance, for achieving a longer operational life span for the PEFC.
Recently, several studies have investigated the characteristics of a higher operating temperature PEFC (HTPEFC), over 100 °C [7,8,9,10,11,12,13,14,15,16]. However, the targets for most of them are the R&D of new materials, which can work at a higher temperature, e.g., the membrane and catalyst [7,8,9,10,11,12,13,14,15,16]. Several numerical studies have investigated the temperature-driven water transport in a cathode GDL [17]; the optimization of catalyst-layer thickness, to obtain high performance without high cost [18]; assessment of mass transport impact on the performance by 3D multi-physics modeling [19]; optimization of GDL, focusing the thickness of porosity by a non-isothermal 3D model [20]; and dynamic simulation for the start-up process by a non-isothermal 3D model [4]. In addition, several numerical studies [21,22,23] have investigated the analysis of aseparator, to optimize the gas channel, considering the widths of the top and bottom, e.g., the cross-sectional area with a trapezium shape [21],the clarification of power-generation performance, reactant and water-saturation distribution, using oriented-type flow channels with porous-blocked baffles [22], and the impact of the channel width/rib width ratio on the performance of and mass distribution in the cell [23]. A few research studies [4,24,25] have reported the numerical simulation on temperature distribution in a single PEFC, which is operated at a relatively higher temperature than usual. However, only a few papers [4,24] have investigated the temperature distribution near the interface between the PEM and catalyst layer at the cathode, which is defined as a reaction surface in this study, excluding other studies by the authors [26,27,28,29]. The authors’ studies [26,27,28,29] have investigated the effect of PEM’s thickness and GDL’s thickness on the distribution of the temperature at the reaction surface (Treact), in a cell of the PEFC at higher temperature, i.e., 90 °C or 100 °C, by a model using the experimental temperature-distribution data obtained by means of a thermograph. However, the effect of separator thickness, including the saddle thickness and channel height, on the distribution of Treact has not been investigated yet. The separator thickness influences the weight, volume, and cost of the PEFC stack, since the commercial PEFC stack is composed of several hundreds of cells. Therefore, it is necessary to understand the effect of separator thickness on the distribution of Treact, in order to commercialize the PEFC stack operated at a higher temperature than usual.
The aim of this study is to analyze the effect of separator thickness on the distribution of Treact in a single PEFC, with the changing flow rates and relative humidity (RH) of the supply gases as well as the initial operation temperature (Tini), from the general operation temperature of 80 °C to a higher temperature, i.e., 90 °C and 100 °C. The combination of thin PEM and thin GDL is adopted for analysis, since previous studies by the authors [26,27,28,29] have clarified that using thin PEM and thin GDL at the same time is effective to attain higher power-generation performance of a PEFC operated at a higher temperature than usual. The temperature distributions on the separator’s back, of a cell of the PEFC, have been measured by means of a thermograph and used as the boundary-condition data for the heat-transfer model developed by the authors [30,31]. Since this procedure can measure the temperature distribution, with no disturbance of the heat and mass transfer phenomena as well as the power-generation performance, due to sensor installation, it can be said that the temperature distribution under a power-generation condition, with loaded current, is measured accurately. Using the measured data, the previous studies [29,32,33] have developed to build an empirical model, in order to predict the distribution of Treact. As the authors have reviewed the literature, it has been confirmed that there is no previous study estimating the distribution of Treact from the measured temperature data at the separator’s back. The heat-transfer model can predict the distribution of Treact, using the measured separator’s back temperature, and it is preferred to be analyzed by the proposed model. The distribution of Treact can be easily estimated, without difficult and complex temperature measurement, due to the presented heat-transfer model.
According to the previous studies carried out by the authors [26,27,28,29], a 1D multi-plate heat-transfer model, which uses the temperature data of the separator’s back, measured by the thermograph under a power-generation condition, has been presented. A single PEFC is composed of the PEM, catalyst layer, MPL, GDL, and separator. The heat-transfer model developed by the authors [26,27,28,29] has assumed that the heat flows through multi-plates of these cell components. The temperature at the interface between the PEM and the catalyst layer on the cathode, i.e., Treact, is calculated by the heat-transfer model [26,27,28,29]. This is a new procedure to clarify the heat-transfer mechanism in single PEFC, using measured data by the thermograph for the developed model.

2. Heat-Transfer-Analysis Procedure of Single Cell of PEFC

2.1. 1D Multi-Plate Heat-Transfer Model Developed by This Study

Figure 1 shows the multi-plate single PEFC. The separator’s back indicates the opposite side of the surface is contacting with the GDL. The separator’s back surface temperatures, Tsurf, c and Tsurf, a, are measured by means of a thermograph. This model assumes that the heat transfer across the module can be thought to be in a 1D direction only. In this module, the cell is divided into a gas channel and a rib part. In addition, the upper and lower part indicate the rib part and channel part, respectively. This study assumes that the heat transfers toward the through-plane direction, for both parts.
The heat generated on the reaction surface is thought to be transferred to the cathode and the anode sides, separately. As the gas flowing through with the gas channel, from the inlet to the outlet of the cell, carries away the heat, the amount of heat taken by the gas flow is less than 1% of the calculated reaction heat, approximately 20 W [34]. Consequently, this study assumes that the heat carried away by the gas flow can be neglected in this model. In addition, the mass flow rate of gas flowing through the gas channel is very small, which ranges from 10−8 to 10−6 kg/s, resulting in this study being able to assume the thermal conduction of gas is occurring only in the gas channel.

2.2. Heat-Generation Rate by Electrochemical Reaction in the Model Proposed by This Study

The heat generation rate Hreact, according to electrochemical reaction, is calculated as follows:
Hreact= EiWE
where Ei is the ideal energy-generation rate from the water formation by H2 and O2, based on the higher heating value (HHV), excluding Tini = 100 °C. This study adopts the lower heating value (LHV) in case of Tini = 100 °C. WE is the electric power generated by a single PEFC. Ei and WE are expressed as follows:
Ei = mH2 × qHHV or qLHV
WE = I × V
where I is the load current obtained by the power-generation experiment. I is kept at 20 A (=0.80 A/cm2). V is the voltage obtained by the power-generation experiment. mH2 is the molar flow rate of supplied H2, which equals the ideal reaction consumption rate of H2, needed for the generation of 20 A, i.e., at the stoichiometric ratio (s.r.) of 1.0. Here, s.r. is the ratio of the feed amount of H2 and O2 needed to generate the current of 20 A. The consumption rate of supplied H2 at s.r. of 1.0 can be defined as follows:
mH2 = I/nF
where mH2 is the molar consumption rate of supplied H2 with s.r. of 1.0 [mol/s], n is the valence ion (=2 for H2), F is the Faraday constant (=96,500 C/mol), and mO2 is the molar consumption rate of supplied O2 with s.r. of 1.0 [mol/s], which is calculated as follows:
H2 + 1/2 O2 = H2O
where mH2 and mO2 at 20 A are 1.04 × 10⁻⁴ mol/s and 0.52 × 10⁻⁴ mol/s, respectively.
The actual s.r. for the consumption gas is confirmed, by means of the mass flow controller, which is installed at the inlet of single PEFC, and the mass flow meter, which is installed at the outlet of the cell, in the power-generation experiment [30,31]. The consumption rates of supplied H2 and O2 are both s.r. of 1.0, which is confirmed by the experiment.

2.3. Heat-Balance Formulas to Calculate the Reaction Surface Temperature

The reaction heats at the rib and channel are expressed as follows:
Hrib, c = Krib, cA(Treact, ribTsurf, c)/2
Hchan, c = Kchan, cA(Treact, chanTsurf, c)/2
Hrib, a = Krib, aA(Treact, ribTsurf, a)/2
Hchan, a = Kchan, aA(Treact, chanTsurf, a)/2
Hreact = Hrib, c + Hchan, c + Hrib, a + Hchan, a
where H means the heat flux [K]; K means the overall heat-transfer coefficient [W/(m2·K)]; A means the heat-transfer area, which is the active area of MEA, i.e., the power-generation area (=0.0025 m2); and T means the temperature [K or °C]. As for the subscripts, rib, chan, react, surf, c, and a mean under rib, under chan, reaction surface, separator’s back surface, cathode side, and anode side, respectively. Krib, c, Kchan, c, Krib, a, and Kchan, a are defined as follows:
1/Krib, c = δcat/kcat + δMPL/kMPL + δGDL/kGDL + δrib/krib + δsep/ksep
1/Kchan, c = δcat/kcat + δMPL/kMPL + δGDL/kGDL + δchan/kchan, c + δsep/ksep
1/Krib, a = δPEM/kPEM + δcat/kcat + δMPL/kMPL + δGDL/kGDL + δrib/krib + δsep/ksep
1/Kchan, a = δPEM/kPEM + δcat/kcat + δMPL/kMPL + δGDL/kGDL + δchan/kchan, a + δsep/ksep
where δcat means the thickness of the catalyst layer [m], kcat means the thermal conductivity of the catalyst layer [W/(m·K)], δMPL means the thickness of MPL [m], kMPL means the thermal conductivity of MPL [W/(m·K)], δGDL means the thickness of GDL [m], kGDL means the thermal conductivity of GDL [W/(m·K)], δrib means the thickness of the separator rib [m], krib means the thermal conductivity of the separator rib [W/(m·K)], δsep means the thickness of the separator except for the separator rib [m], ksep means the thermal conductivity of the separator except for the separator rib [W/(m·K)], δchan means the thickness of the separator channel [m], kchan means the thermal conductivity of the mixture gas in the separator channel [W/(m·K)], δPEM means the thickness of PEM [m], and kPEM means the thermal conductivity of PEM [W/(m·K)].
Table 1 lists the specifications of the cell components applied in the heat-transfer model. Nafion NRE-212 (manufactured by Du Pont Corp.), with a thickness of 25 μm, is investigated in this study. In addition, TGP-H-030 (manufactured by Toray Corp.), with a thickness is 110 μm, is investigated. The proposed model is composed of the PEM, catalyst layer, MPL, GDL, and separator. The values shown in Table 1 are the same as those of the components applied in the previous studies [26,27,28,29].
Table 1 lists the effective thermal conductivities of porous media k too. They are inferred from the values of the cell components applied in the power-generation experiment carried out by the authors [31]. In this table, the effective thermal conductivities are listed, considering that the cell-components’ pores are filled with air at room temperature. This study has calculated the corrected effective thermal conductivities, assuming that the cell components’ pores are filled with H2 or O2 at 80 °C, 90 °C, and 100 °C. As for the power-generation experiment, with data that were applied in the numerical analysis in this study [31], the single PEFC was pre-heated by an electric heater at Tini, for temperature measurement by a thermograph. Additionally, the temperature of the supply gas at the inlet can be controlled by an electric heater at Tini. Thermal conductivities of each of the supply gases are referred to by the “The Japan Society of Mechanical Engineers” [35], in this calculation. The temperatures are measured by means of a thermograph and substituted into the formulas as Tsurf, c and Tsurf, a, to solve Equations (6)–(9). Table 2 lists the power-generation operation conditions for the single PEFC, to measure the temperature by means of the thermograph. For 1D multi-plate heat-transfer analysis, the data obtained under these experimental conditions are used. This study keeps the current density at 0.80 A/cm2 in the PEFC power-generation experiment, to obtain the temperature data by means of the thermograph. We can obtain the temperature-distribution data at the separator back caused by the reaction heat. The authors’ previous studies [30,31] have explained the experimental procedure to measure the temperature during power generation. It is seen from Figure 2 that this study divides the in-plane temperature distribution into segments of 10 mm × 10 mm each, in order to use the temperature data measured by means of the thermograph for the 1D multi-plate heat-transfer model. Although the power-generation area is 50 mm × 50 mm, this study sets the observation area at 40 mm × 50 mm, in order to prevent a gas leak, via an observation window in the experiments. Figure 3 illustrates the procedure to measure the temperature distribution by the thermograph, experimentally [30,31], for the readers’ understanding. In addition, Figure 4, also, illustrates the schematic drawing of the experimental setup for the power-generation experiment, to measure the temperature distribution by the thermograph [30,31], also for the readers’ understanding. The gas channel width and rib width of the separator are 1.0 mm. The number of gas channels is 5. Each segment is composed of five parts of the rib and gas channels. The average temperature in each segment at the anode and cathode is applied to the separator’s back temperature, in the 1D multi-plate heat-transfer model. Figure 2 shows the segments, named from A to T, along with the gas-flow direction.
As can be seen in Figure 2, the insulators that cover the gas pipes interfere with the temperature measurement by the thermograph in some areas of the segments, e.g., segments A and T. The effective temperatures of segments A and T, by removing the temperature data, which interfered with the insulator for the total temperature data in the segment, are estimated in this study. For the heat-transfer analysis, we assume that Tsurf, c on the rib side equals to Tsurf, c on the channel side as well as Tsurf, a, since the difference between them could not be confirmed by the data measured by the thermograph [30,31]. According to the above assumptions and Equations (6)–(14), the reaction surface temperature Treact can be expressed as follows:
Treact = Treact, rib = Treact, chan = {2Hreact/A + (Krib, c + Kchan, c)Tsurf, c + (Krib, a + Kchan, a)Tsurf, a}/(Krib, c + Kchanc, c + Krib, a + Kchan, a)
where Treact is calculated by Hreact, without estimation of the local heat flux for each segment. Here, Hreact is assumed as a constant, irrespective of the segment. Additionally, i indicates the segment.

2.4. Validation

Compared with the other previous heat-transfer models [36,37,38], considering the heat-transfer conditions, the model developed by the authors [26,27,28,29,39] has some differences. However, it can be observed that the temperature gradients, for the targeted regions under similar operation conditions, show the same tendency [39]. In addition, the authors [40] have already studied the numerical simulation using a 3D model, by means of commercial CFD software, in order to predict the distributions of Treact. This numerical simulation, with a 3D model, considers the governing equations that consist of conservation equations of mass, momentum, and energy in the porous region as well as the electrochemical reaction. Comparing the results of the numerical simulation using the 3D model with that of the 1D model proposed by the authors under the various operation conditions, the differences in Treact between the two models were from approximately 0.1 °C to 1.5 °C. Therefore, the 1D model proposed by the authors, which is, also, used in this study, has been validated by the 3D model. Consequently, we think that the heat-transfer model proposed by this study is reasonable.

3. Results and Discussion

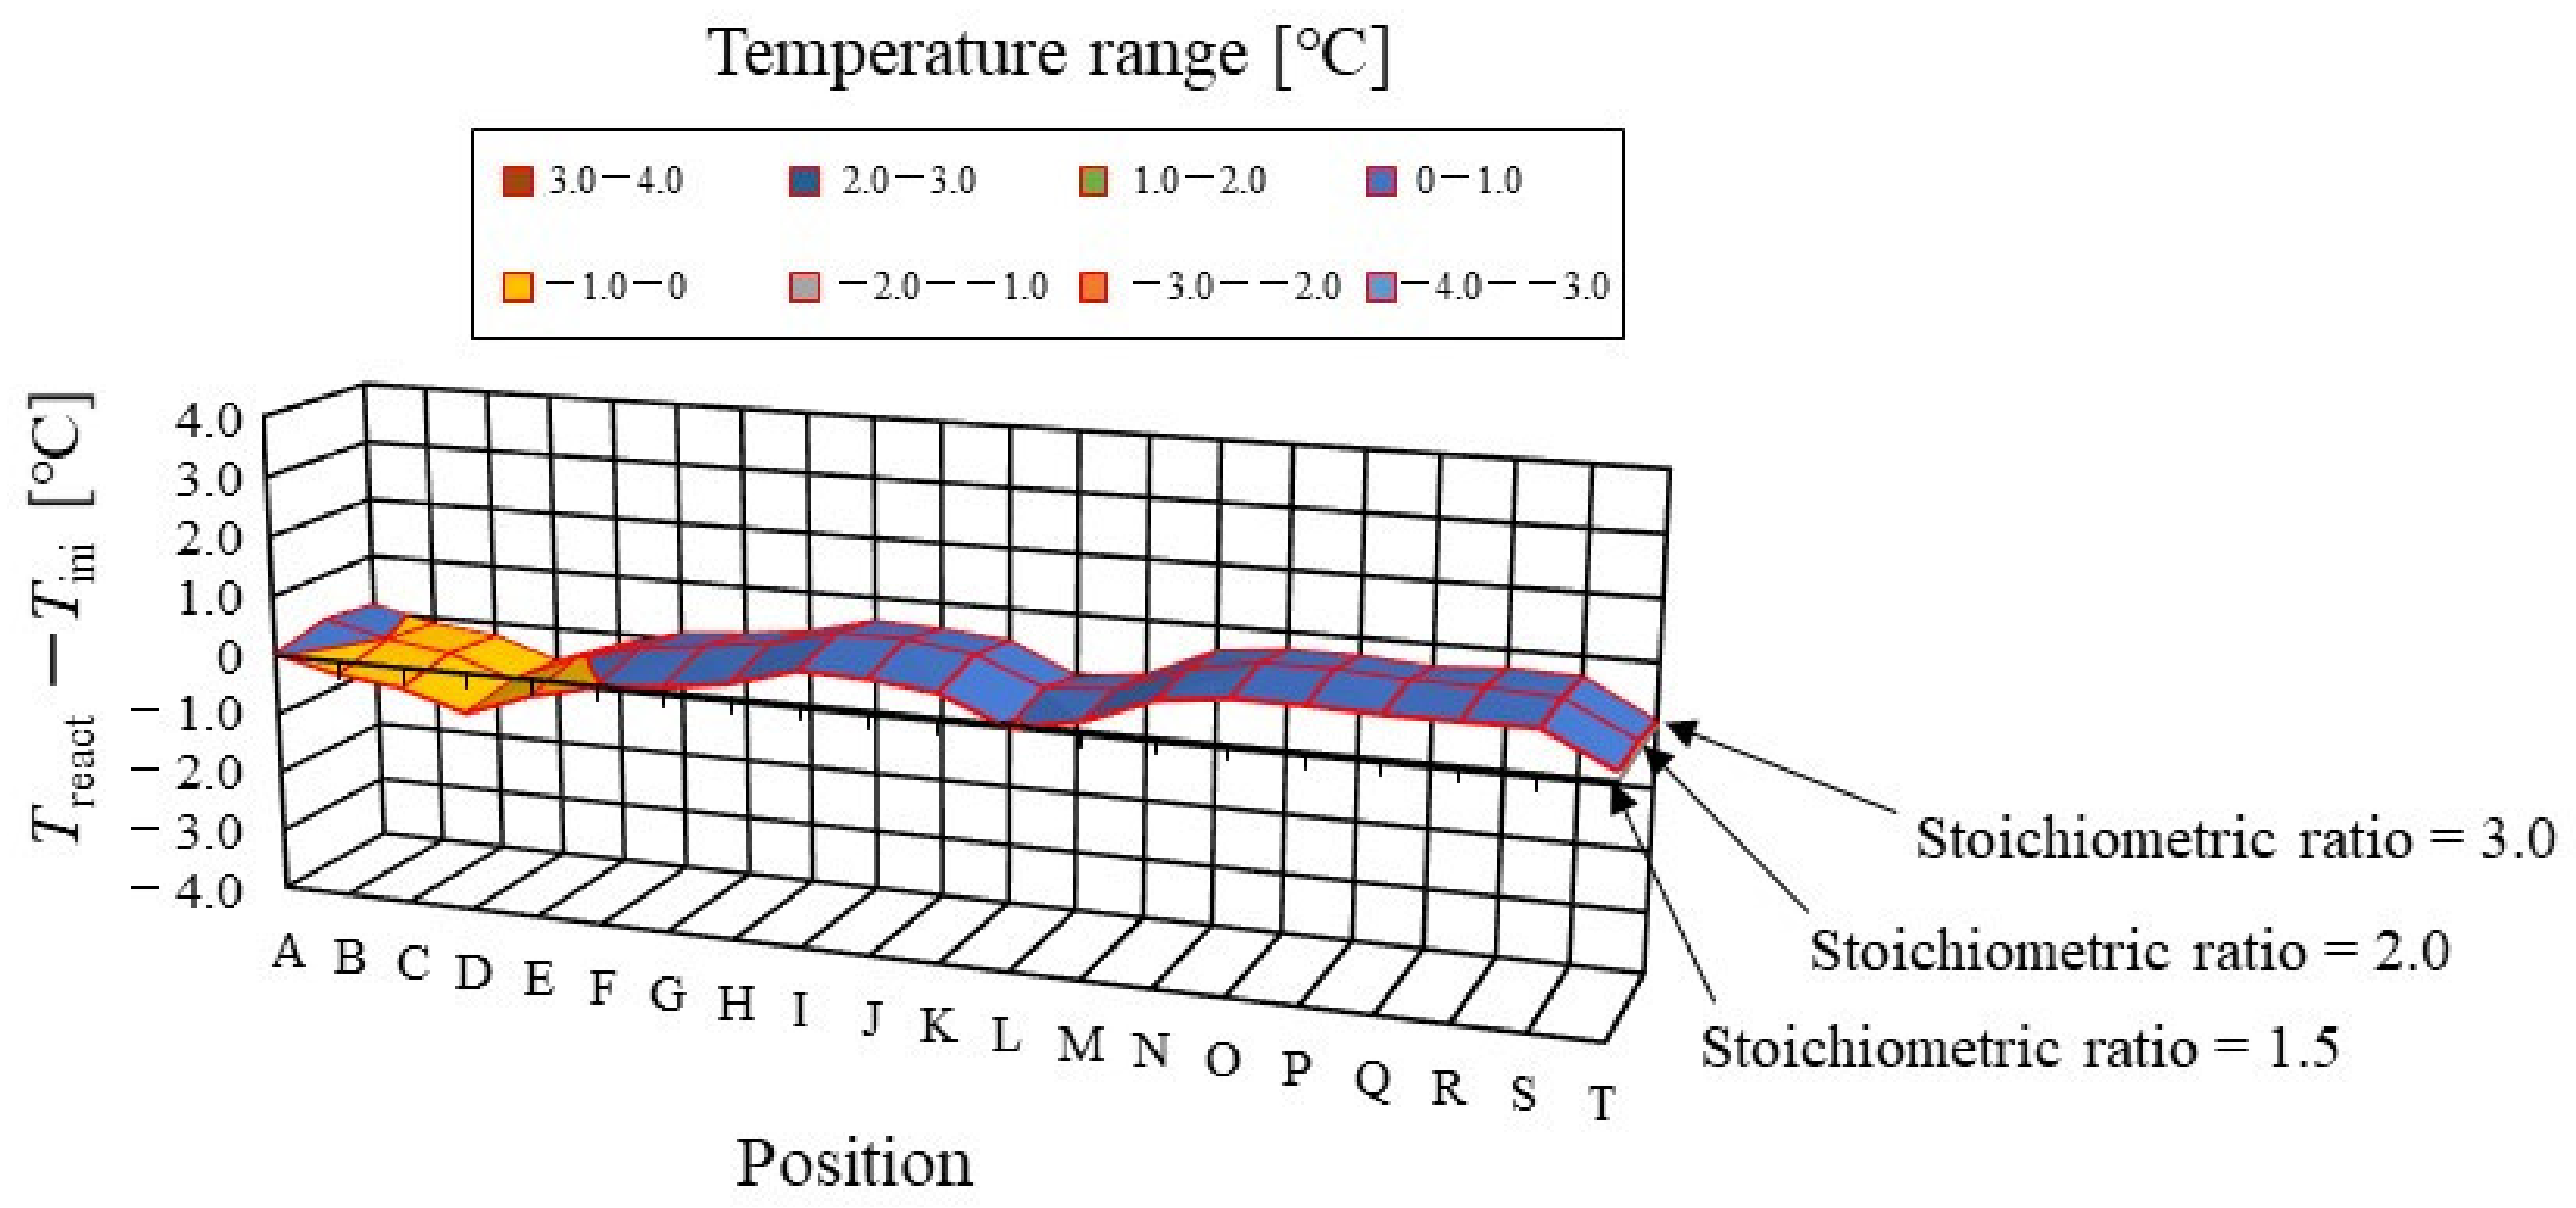
3.1. Effect of Flow Rate of Supply Gas on Distribution of Treact − Tini

It is important to clarify the effect of the flow rates of the supply gases at the inlet on not only heat and mass transfer characteristics but also power-generation performance, to manage the operation conditions for the PEFC. Figure 5 shows the effect of the s.r. of the supply gases at the inlet on the distribution of TreactTini, which is simulated by the heat-transfer model proposed by this study. The RH of the supply gases is 80% RH at the anode and 80% RH at the cathode, i.e., A 80% RH and C 80% RH. The s.r. of the supply gas is 1.5, 2.0, and 3.0, while the molar flow rate of the supplied H2 at the s.r. of 1.5, 2.0, and 3.0 is 1.56 × 10⁻⁴ mol/s, 2.08 × 10⁻⁴ mol/s, and 3.12 × 10⁻⁴ mol/s, respectively. In addition, the molar flow rate of the supplied O2 at the s.r. of 1.5, 2.0, and 3.0 is 0.78 × 10⁻⁴ mol/s, 1.04 × 10⁻⁴ mol/s, and 1.56 × 10⁻⁴ mol/s, respectively. T ini is set at 80 °C. The separator thickness is 2.0 mm. Figure 6, also, illustrates the color counter, to clarify the effect of the s.r. of the supply gases at the inlet on the distribution of TreactTini, visually, which is shown in Figure 5.
It is found from Figure 5 that the effect of the flow rate of the supply gases on the distribution of TreactTini is not significant. The gas supply for the power generation at an s.r. = 1.5 is sufficient for power generation [26,28]. In addition, it is revealed that the effect of the flow rate of the supply gases on the distribution of TreactTini is not significant, regardless of the RH condition, Tini, and separator thickness investigated in this study. It indicates, from the power-generation experiments in this study [30,31], that the power output exhibits almost the same amount for each different s.r. In the following section, the results with an s.r. = 1.5 are analyzed as the typical case.
In addition, it is seen from Figure 5 that TreactTini declines at positions D, L, and T. Regarding position L, the water droplets are thought to remain there easily; resulting from that, it is positioned at the corner of the serpentine separator. As a result, the electro-chemical reaction is not conducted well [26,41]. Therefore, TreactTini drops in this position at L. As for position D, it is the inlet of the anode side; resulting from that, the cell is cooled by the supply gas, which is cooler than the single cell that is heated, due to the reaction heat [26,41]. Regarding position T, it is thought that water droplets are easily accumulated, since the water with gas flow concentrates at the outlet at the cell [26,27]. Consequently, the gas diffusion toward the catalyst layer is not conducted well; resulting from that, the electro-chemical reaction is not conducted well. Finally, TreactTini drops in this position at T.

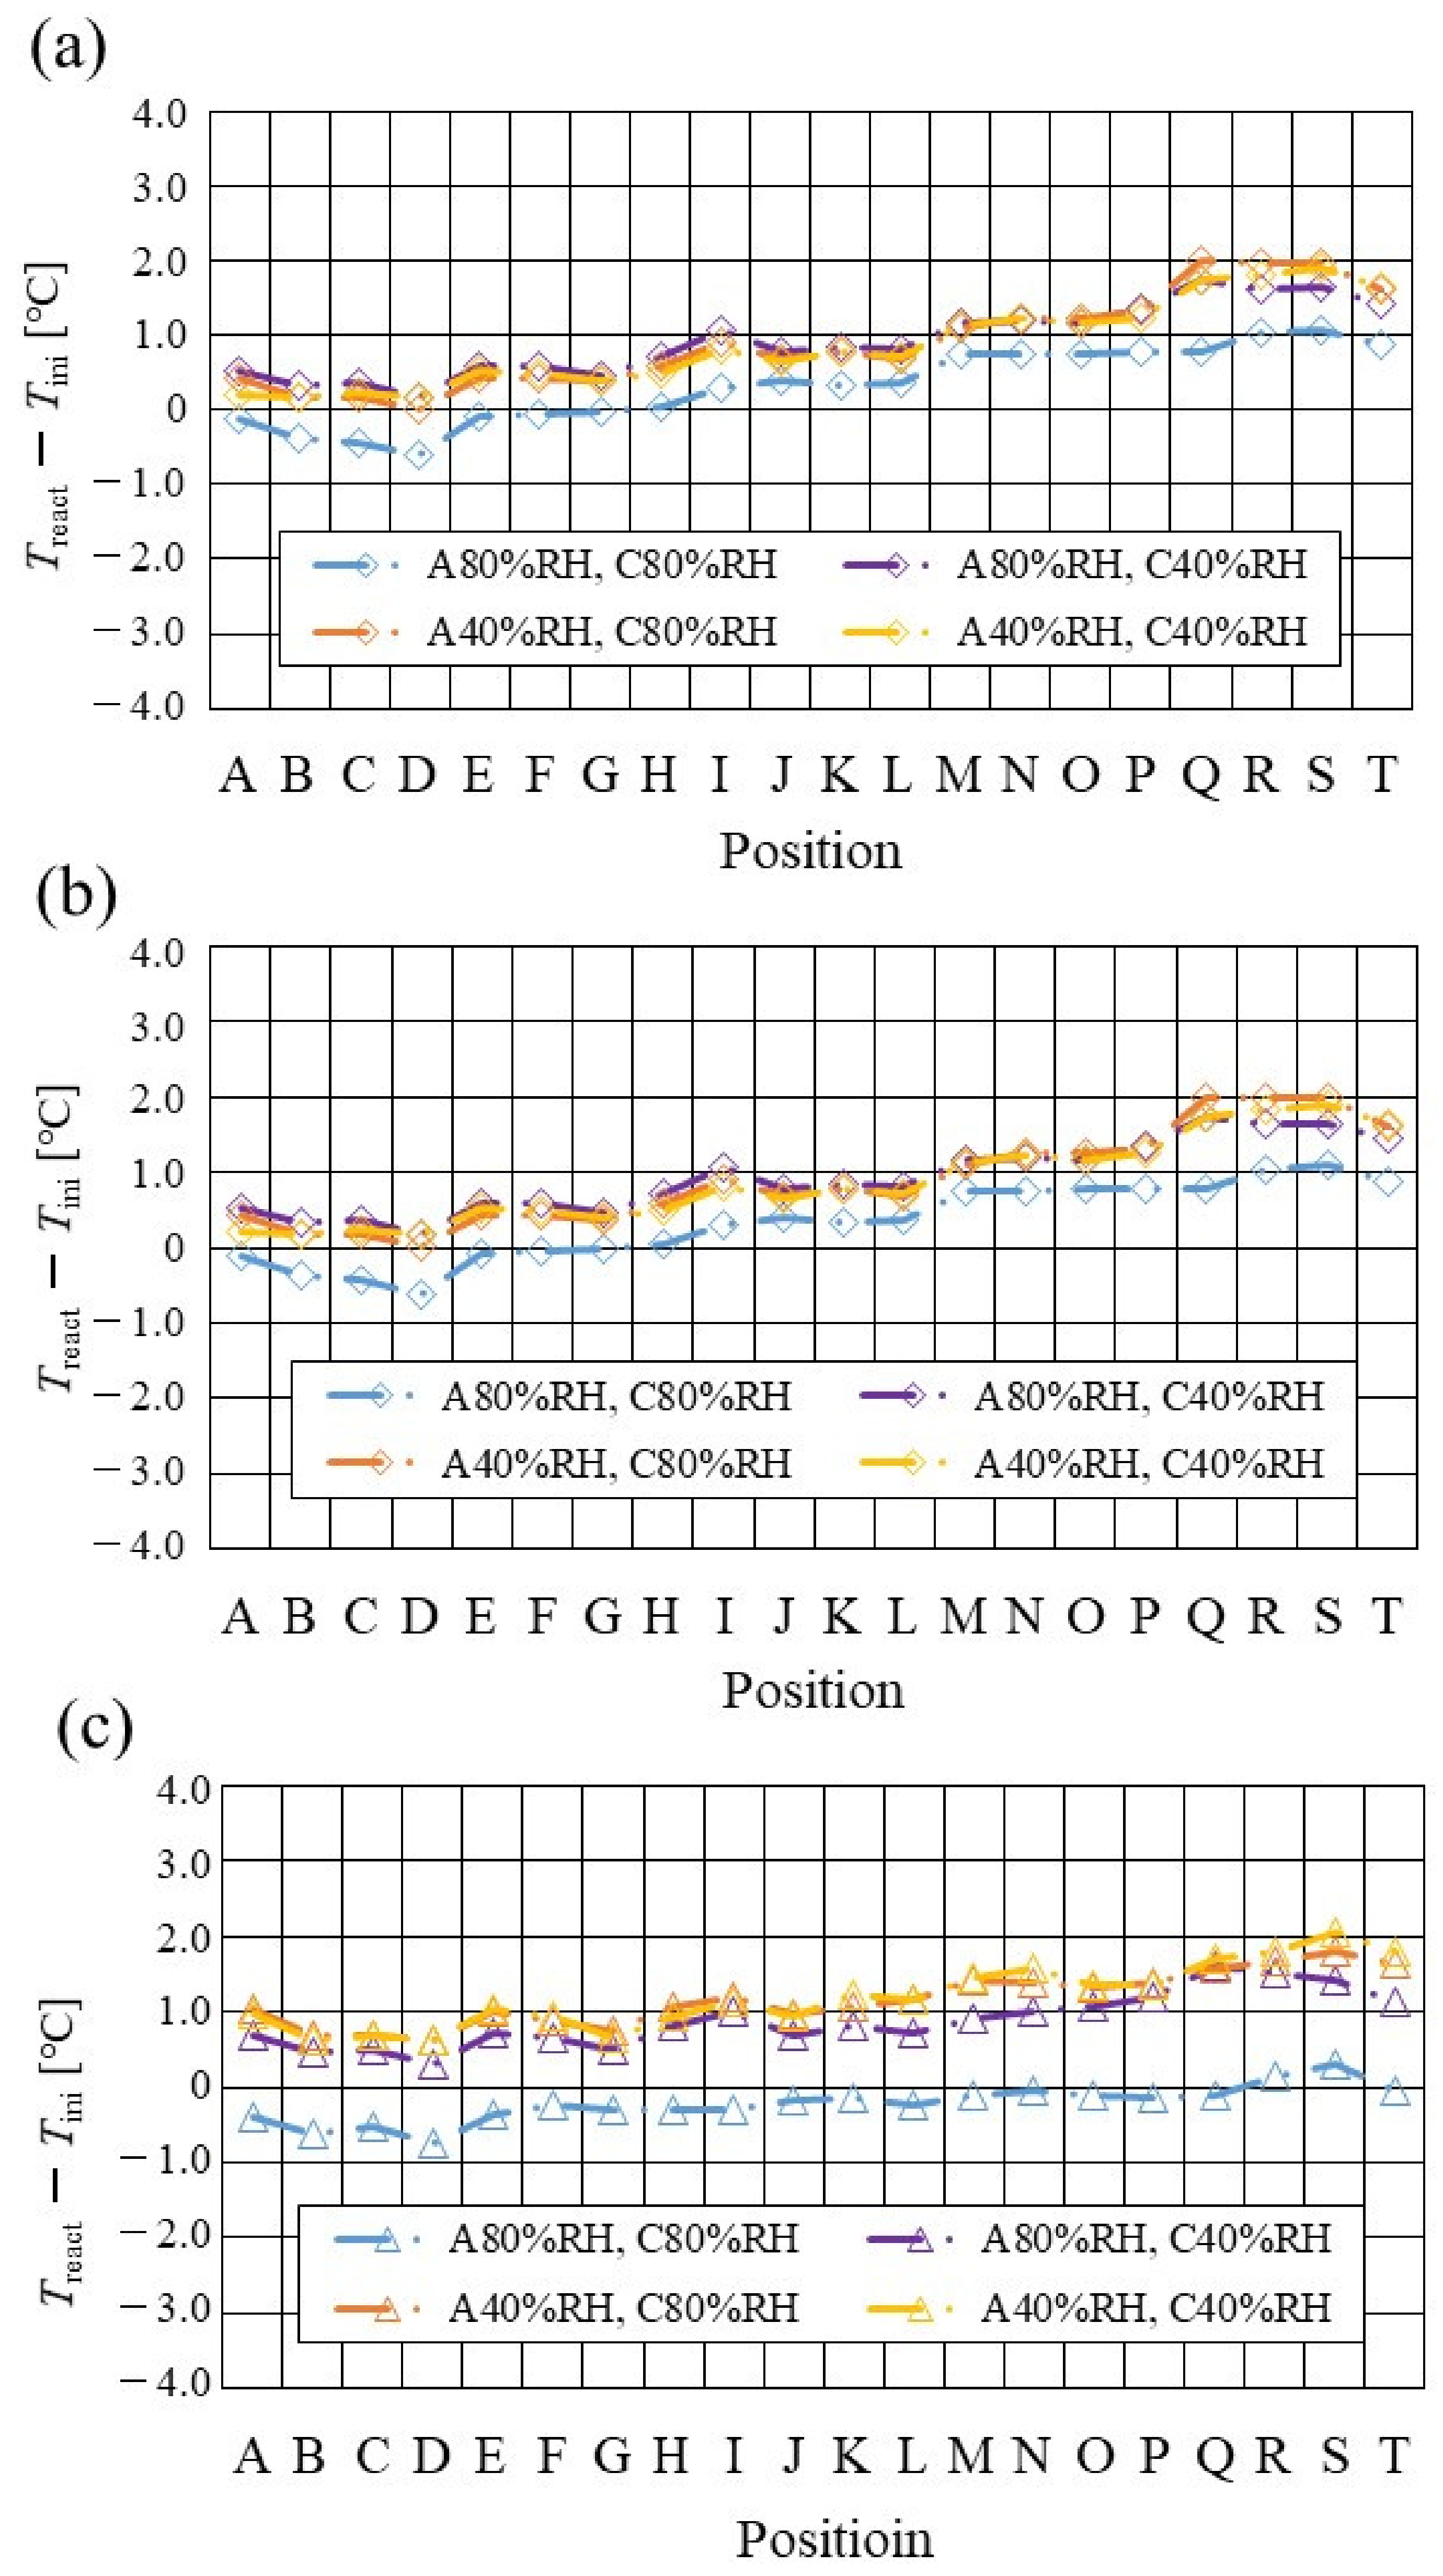
3.2. Impact of Separator Size with RH and Tini on Distribution of Treact − Tini

Figure 7, Figure 8 and Figure 9 show a comparison of the distribution of TreactTini among different RH conditions and Tini, respectively. In this analysis, the separator size is changed by 2.0 mm (saddle thickness = 1.0 mm, channel height = 1.0 mm), 1.5 mm (saddle thickness = 0.5 mm, channel height = 1.0 mm), and 1.0 mm (saddle thickness = 0.5 mm, channel height = 0.5 mm). Figure 10, Figure 11 and Figure 12 show a comparison of the polarization curves, which are obtained by the power-generation experiment among different RHs and Tini, with changes of the separator thickness of 2.0 mm, 1.5 mm, and 1.0 mm, respectively.
From the reported results in Figure 7, Figure 8 and Figure 9, it is seen that the temperature declines at positions D, L, and T in case of a separator thickness of 2.0 mm, which are larger than those of the other considered separator thicknesses. In experiment, to obtain the temperature at separator’s back by means of the thermograph, the temperature is measured after confirming a steady state time of 30 min [31]. Since the heat capacity of a separator thickness of 2.0 mm is larger, and it is believed that the whole cell temperature after balancing with the atmospheric air, is lower compared to the other considered separator thicknesses [42]. If the whole cell temperature decreases, it is easy for the vapor water to be liquid. As a result, the water droplets are thought to remain easily at position L, as described above. As for position T, the water droplets are thought to accumulate easily, resulting from the fact that the water with the gas flow concentrates at the outlet of the cell [26,27] as well as due to hydration. Therefore, the temperature drops at positions L and T are remarkable, in the case of a separator thickness of 2.0 mm, compared to the other separator cases. As for position D, it is the inlet of the anode side, causing the cell to be cooled by the gas, which is cooler than the cell heated, due to reaction heat [26,41], and is discussed earlier.
According to Figure 8 and Figure 9, it is seen that the temperature increases, along with the gas flow through the gas channel, by approximately 2 °C. In addition, it is noticed that the impact of the RH on the distributions of TreactTini is larger, with the increase in Tini. Especially, this impact is larger at Tini = 100 °C, using a separator thickness of 1.0 mm. It is concluded that the heat capacity decreases with the decrease in separator thickness. Therefore, it is thought that the whole cell temperature increases [42], resulting in it being easy to dehydrate the PEM and catalyst. It is found from Figure 10, Figure 11 and Figure 12 that the effect of the RH on the power-generation performance is more significant when the separator thickness decreases. Especially, the power-generation performance with A40% RH and C40% RH declines rapidly, with the reduction in separator thickness. Since the heat capacity of the separator decreases with the reduction in separator thickness, the temperature of a cell using the thinner separator becomes higher, after attaining the steady state via heat balance, with the surrounding temperature of 293 K being controlled by the air conditioner [42]. A40% RH and C40% RH is the dry condition, resulting in the PEM and catalyst layer being dehydrated easily [42]. When the power generation is conducted at a higher temperature, the accumulation of liquid water decreases, due to the exponential increase in the saturation of the water vapor, with the increase in temperature [43]. Therefore, the impact of the RH on distributions of TreactTini is larger, with the increase in Tini as well as the decrease in separator thickness.

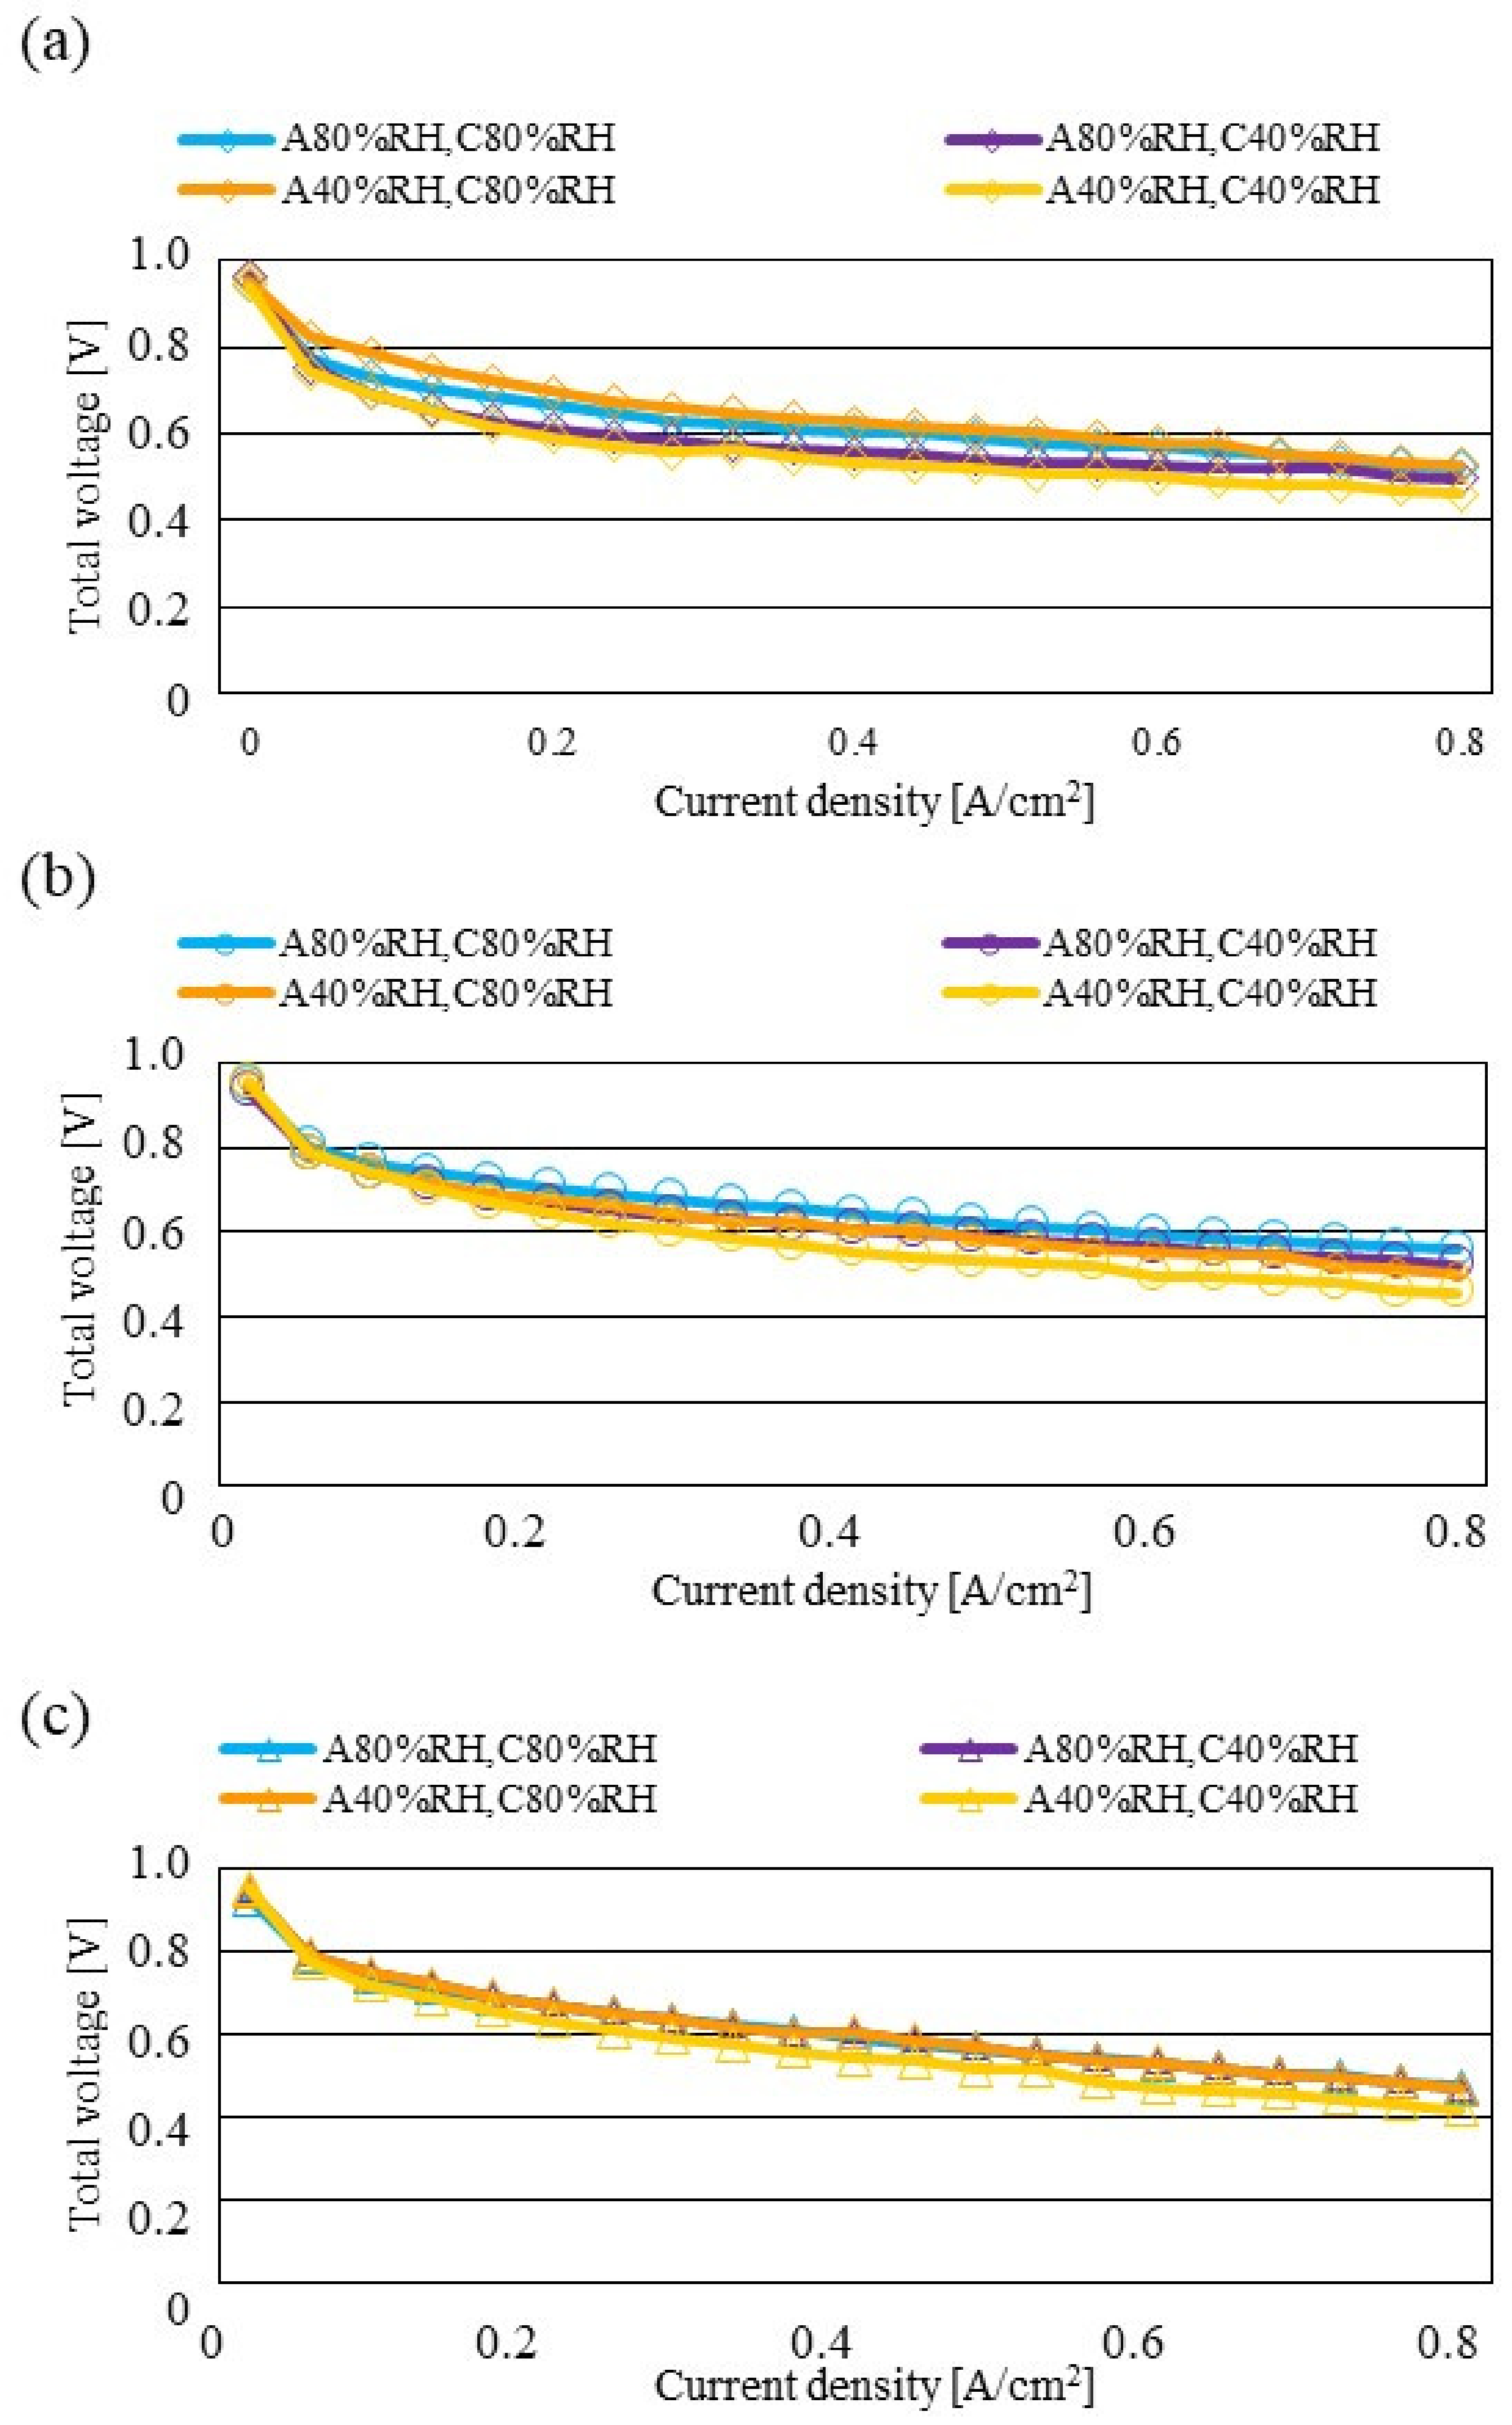
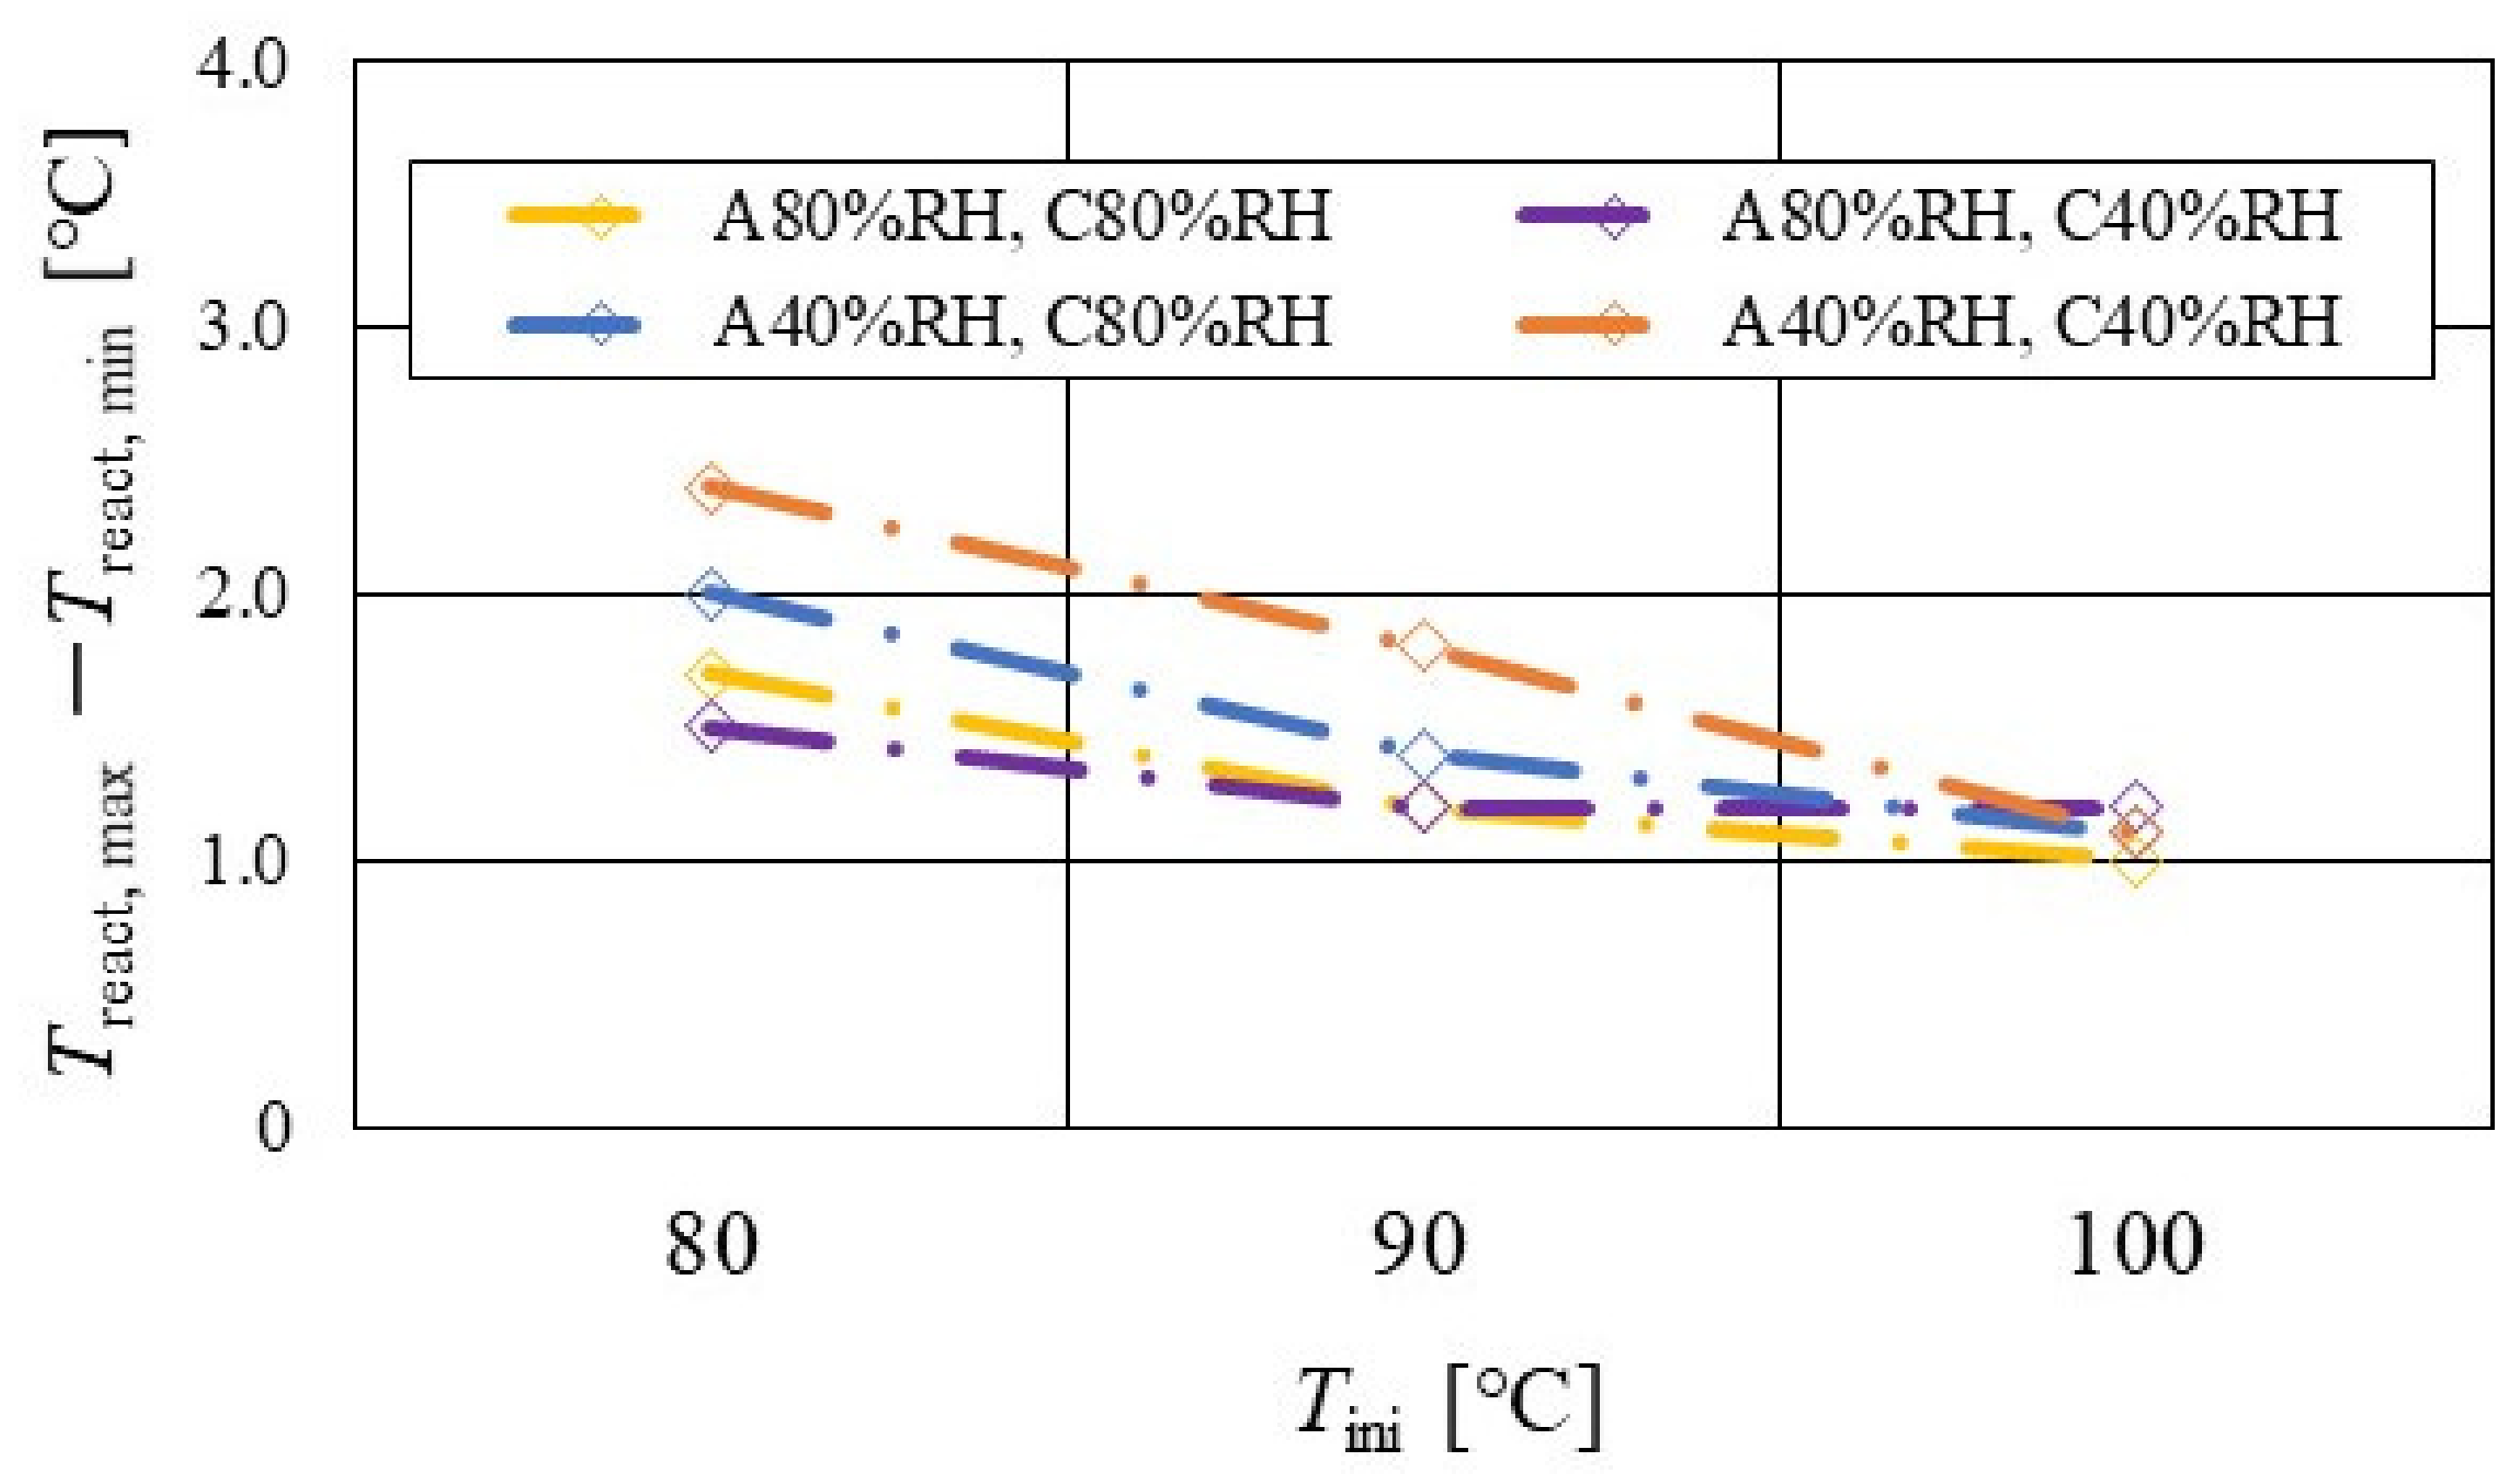
3.3. Evaluation on Temperature Difference and Standard Deviation of Distribution of Treact − Tini

Figure 13, Figure 14 and Figure 15 show the effect of the RH and Tini on Treact, maxTreact, min changing the separator thickness. Treact, max and Treact, min mean the temperature difference between the maximum and the minimum temperature in the distribution of Treact, respectively.
According to Figure 13, Figure 14 and Figure 15, it is seen that Treact, maxTreact, min decreases with increase in Tini, irrespective of the RH and separator thickness. However, in the case of A 80% RH and C 80% RH, using a separator thickness of 2.0 mm shows a different tendency. When Tini increases, the accumulation of liquid water decreases, due to the exponential increase in the saturation of the water vapor with the increase in temperature [43]. Therefore, the power-generation performance declines, since the ohmic losses caused by the reduced proton conductivity of the PEM, due to dehydration, increase [44].
Table 3 lists the experimental power-generation performance data, which has been conducted to measure the temperature at the separator’s back by a thermograph. The voltages, at a current of 20 A, are shown in Table 3. According to Table 3, we can see that the power-generation performance declines with the increase in Tini, irrespective of the RH and separator thickness. For instance, since Tini = 100 °C is a higher operation temperature, the PEM is easy to be dehydrated. Additionally, it is thought that the effect of not only the phase change of water but also the remaining liquid water on the gas diffusion in the cell is small, at Tini = 100 °C, regardless of the RH condition [45], providing a uniform temperature distribution [26]. Regarding the case of A 80% RH and C 80% RH, using the separator thickness of 2.0 mm, it is a relatively humidified condition, since the well humidified gases are supplied at the anode and cathode and the thickest separator is used, even at Tini = 90 °C. Therefore, the temperature decreases at positions D, L, and T are larger, and the temperature increases from the inlet to the outlet, since power generation is improved by the increase in the proton conductivity of the PEM.
Figure 16, Figure 17 and Figure 18 show the relation between the standard deviation of the distribution of TreactTini and the total voltage obtained in the experiment, when changing the Tini and separator thickness. The data under the different s.r. and RH conditions are shown in each figure. The approximate line is, also, shown in each figure.
It is seen from Figure 16, Figure 17 and Figure 18 that the slope of the approximate line, for the relation between the standard deviation of the distribution of TreactTini and total voltage, becomes negative and larger with the increase in Tini, irrespective of separator thickness. From this result, the wider temperature distribution provides a reduction in power-generation performance, when the approximate line has a large negative slope. In addition, it can be seen from Figure 16, Figure 17 and Figure 18 that the distribution range, regarding the standard deviation of the distribution of TreactTini at Tini = 100 °C, is narrower than the other Tini. As discussed earlier, the effect of not only the phase change of water but also the remaining liquid water on the gas diffusion in the cell is small, at Tini = 100 °C, regardless of the RH condition [45], which provides uniform temperature distribution [26]. It is difficult to manage the humidification of the PEM and catalyst under a high temperature operation condition. As a result, the power-generation performance drops, even for a narrow temperature distribution.
Summarizing the results and discussion, this study suggests that thin separators (such as a thickness of 1.5 mm and 1.0 mm) are not suitable for a higher temperature operation than usual. Since control of the humidification as well as the in-plane temperature distribution of Treact at a higher temperature is stricter than the usual operation temperature, the hydration of the supply gas and the thermal properties of the cell components of the PEFC should be considered, for controlling the electro-chemical reaction. According to the state-of-art review on the research and development of the separator [46,47,48], the material type, composite, and surface-coating process have been investigated to improve the conductivity and water behavior. However, the thermal properties of the separator have not been investigated yet. Therefore, this study suggests that the thermal properties of the separator, such as heat capacity and thermal conductivity, should be improved to attain better power-generation performance. Additionally, this study adopts a thin PEM (Nafion membrane), which is usually used at a temperature lower than 70 °C. The degradation in a Nafion membrane, when operated at a higher temperature, should be considered. This study conducted its experimental investigation using a thin Nafion membrane at a higher temperature, such as 90 °C and 100 °C [31]. In the experimental analysis, the thin Nafion membrane was operated for 200 h, to evaluate the performance. However, it can be recommended to study the characteristics of the thin Nafion membrane for a longer operation time, e.g., 90,000 h (≒ 10 years), which is the target operation time referred to by the NEDO road map (2017, Japan) [1], for the practical application of the PEFC system.

4. Conclusions

The effect of the separator thickness on the distribution of TreactTini in a single PEFC has been investigated, changing the flow rates and RH of the supply gases as well as Tini. Especially, this study has focused on the analysis at a high temperature, of 90 °C and 100 °C. The distribution of TreactTini has been calculated by the presented methodology, using the separator’s back temperature measured by a thermograph, experimentally. The following conclusions are obtained:
(i)
The effect of the flow rate of the supply gases on the distribution of TreactTini is not significant, among the investigated conditions.
(ii)
The temperature declines at positions D, L, and T, in the case of a separator thickness of 2.0 mm, which is the thickest separator, though the temperature increases along with the gas flows through the gas channel, by approximately 2 °C, in the case of a thinner separator, compared to 2.0 mm.
(iii)
In the case of a separator thickness of 1.5 mm and 1.0 mm, the impact of the RH on the distributions of TreactTini is larger with the increase in Tini. Especially, this impact is larger at Tini = 100 °C, at a separator thickness of 1.0 mm. The heat capacity decreases with the decrease in separator thickness. Therefore, the whole cell temperature increases, resulting in it being easy to dehydrate the PEM and catalyst.
(iv)
Treact, maxTreact, min decreases with the increase in Tini, irrespective of the RH and separator thickness. However, in the case of A 80% RH and C 80% RH at a separator thickness of 2.0 mm, it has a different tendency.
(v)
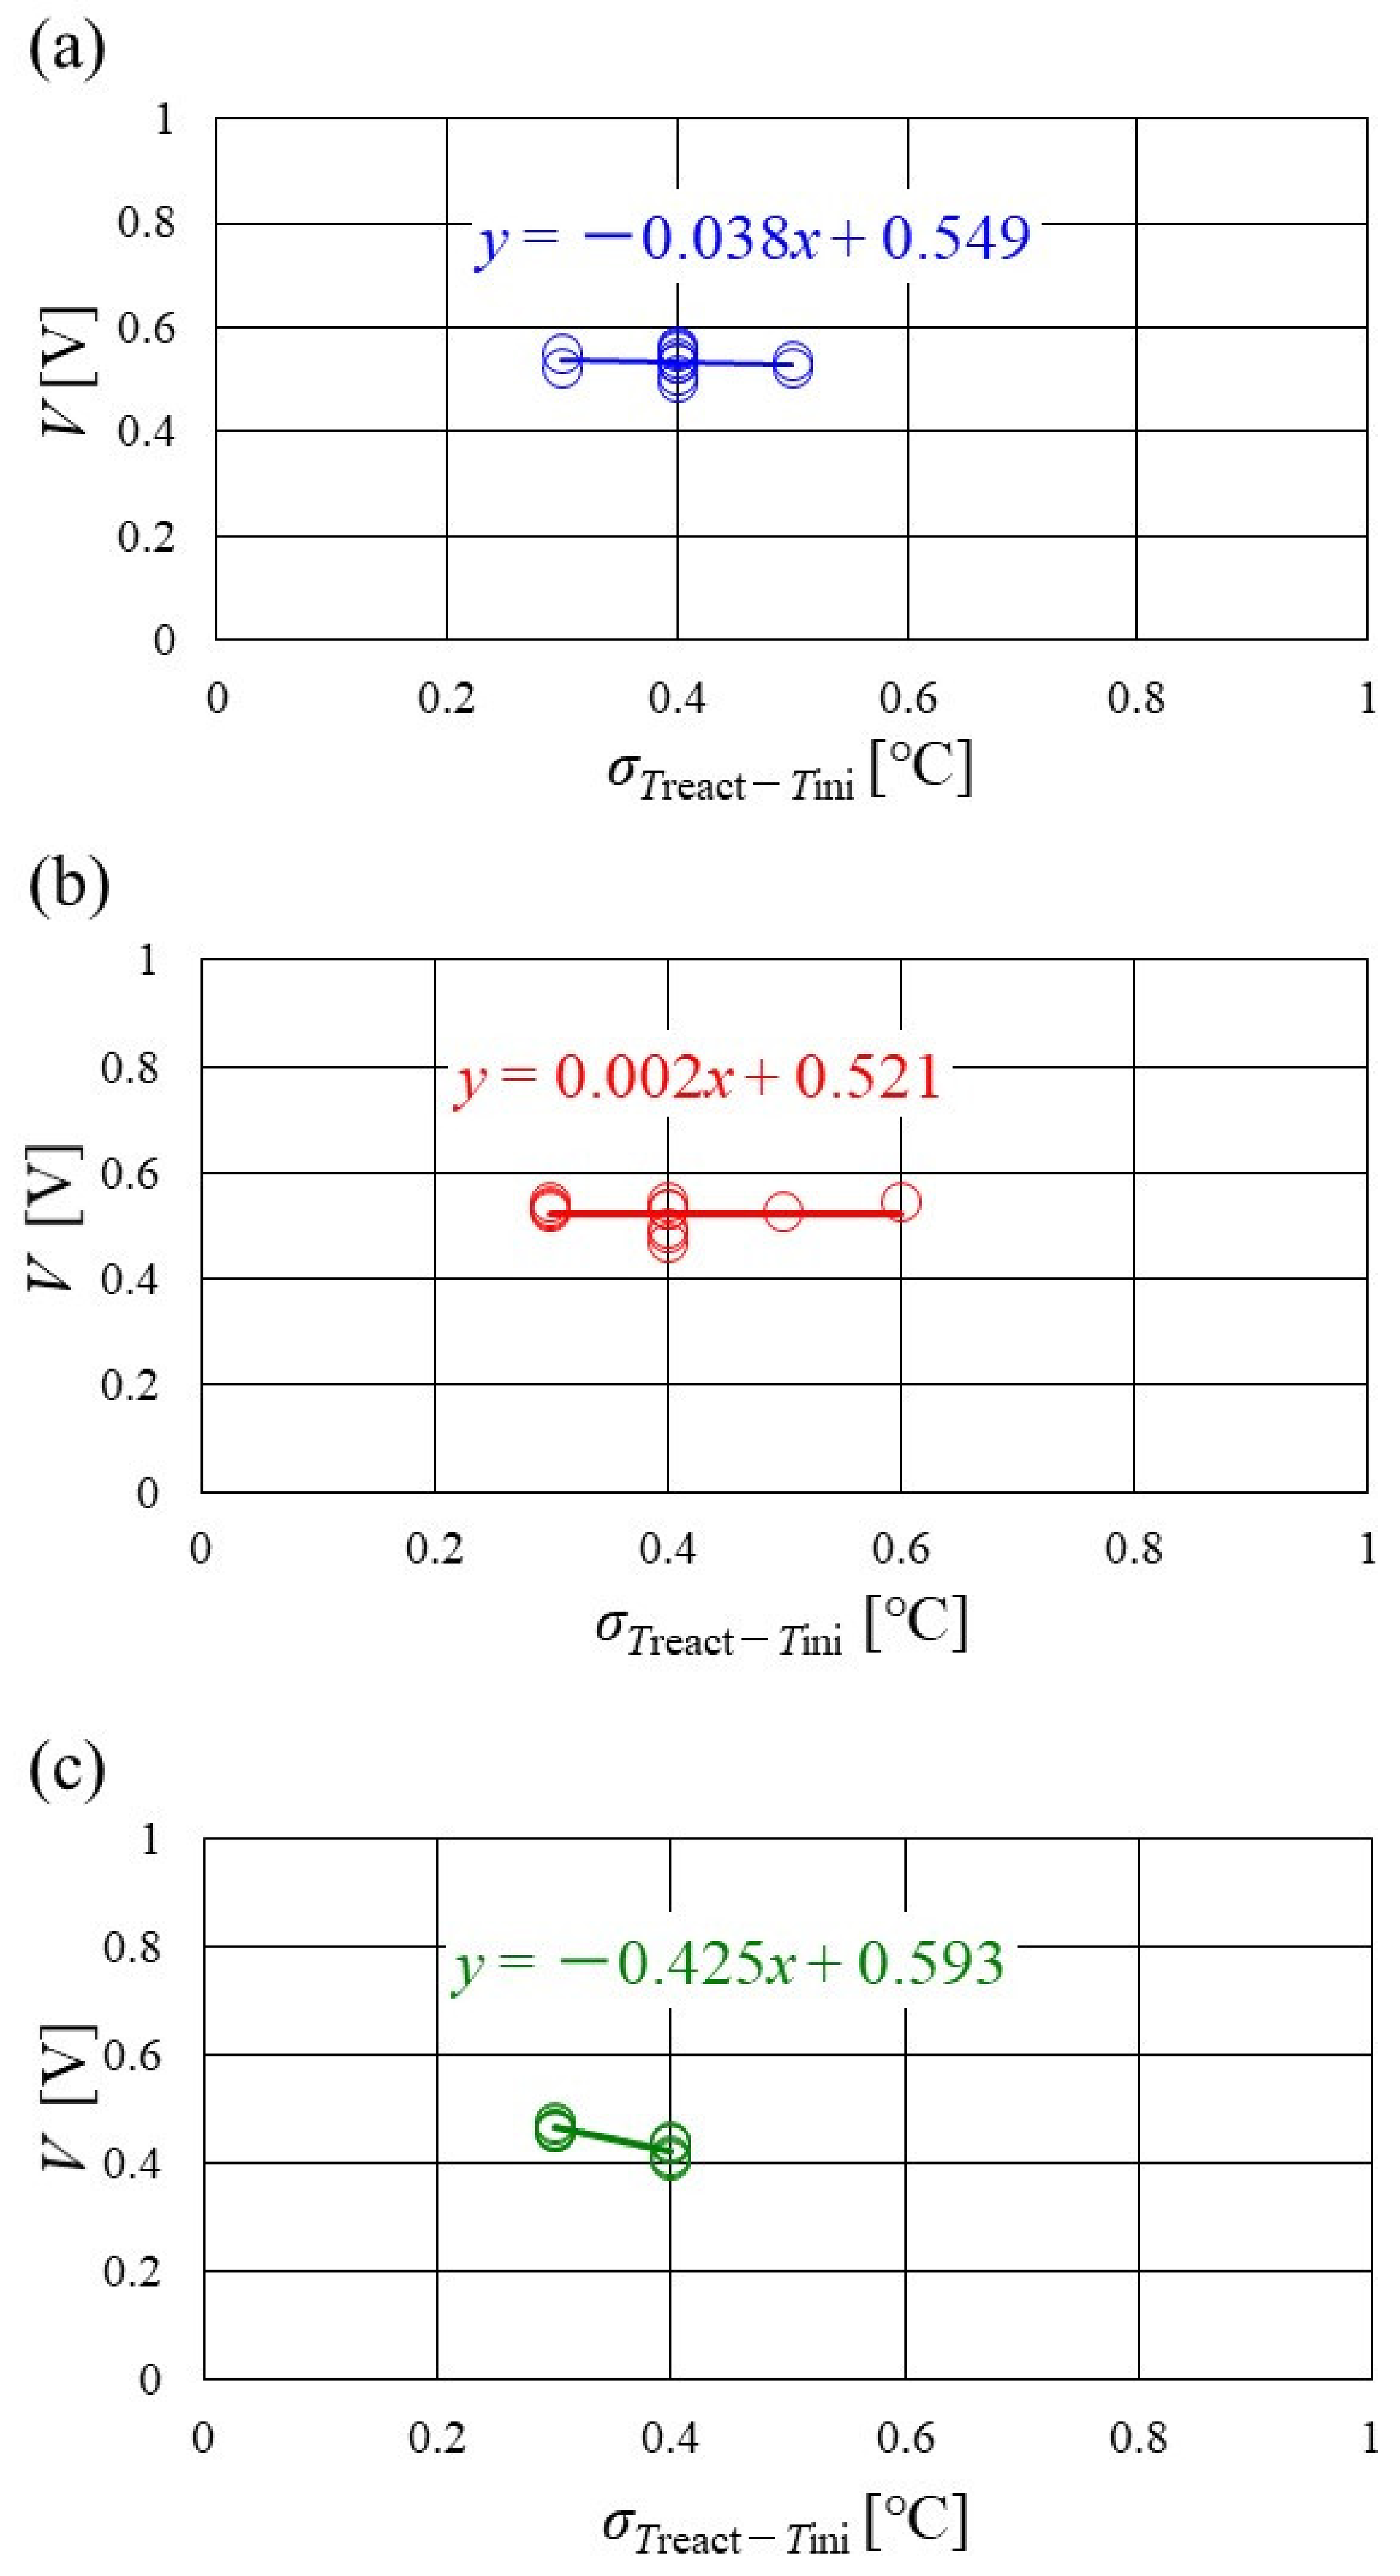
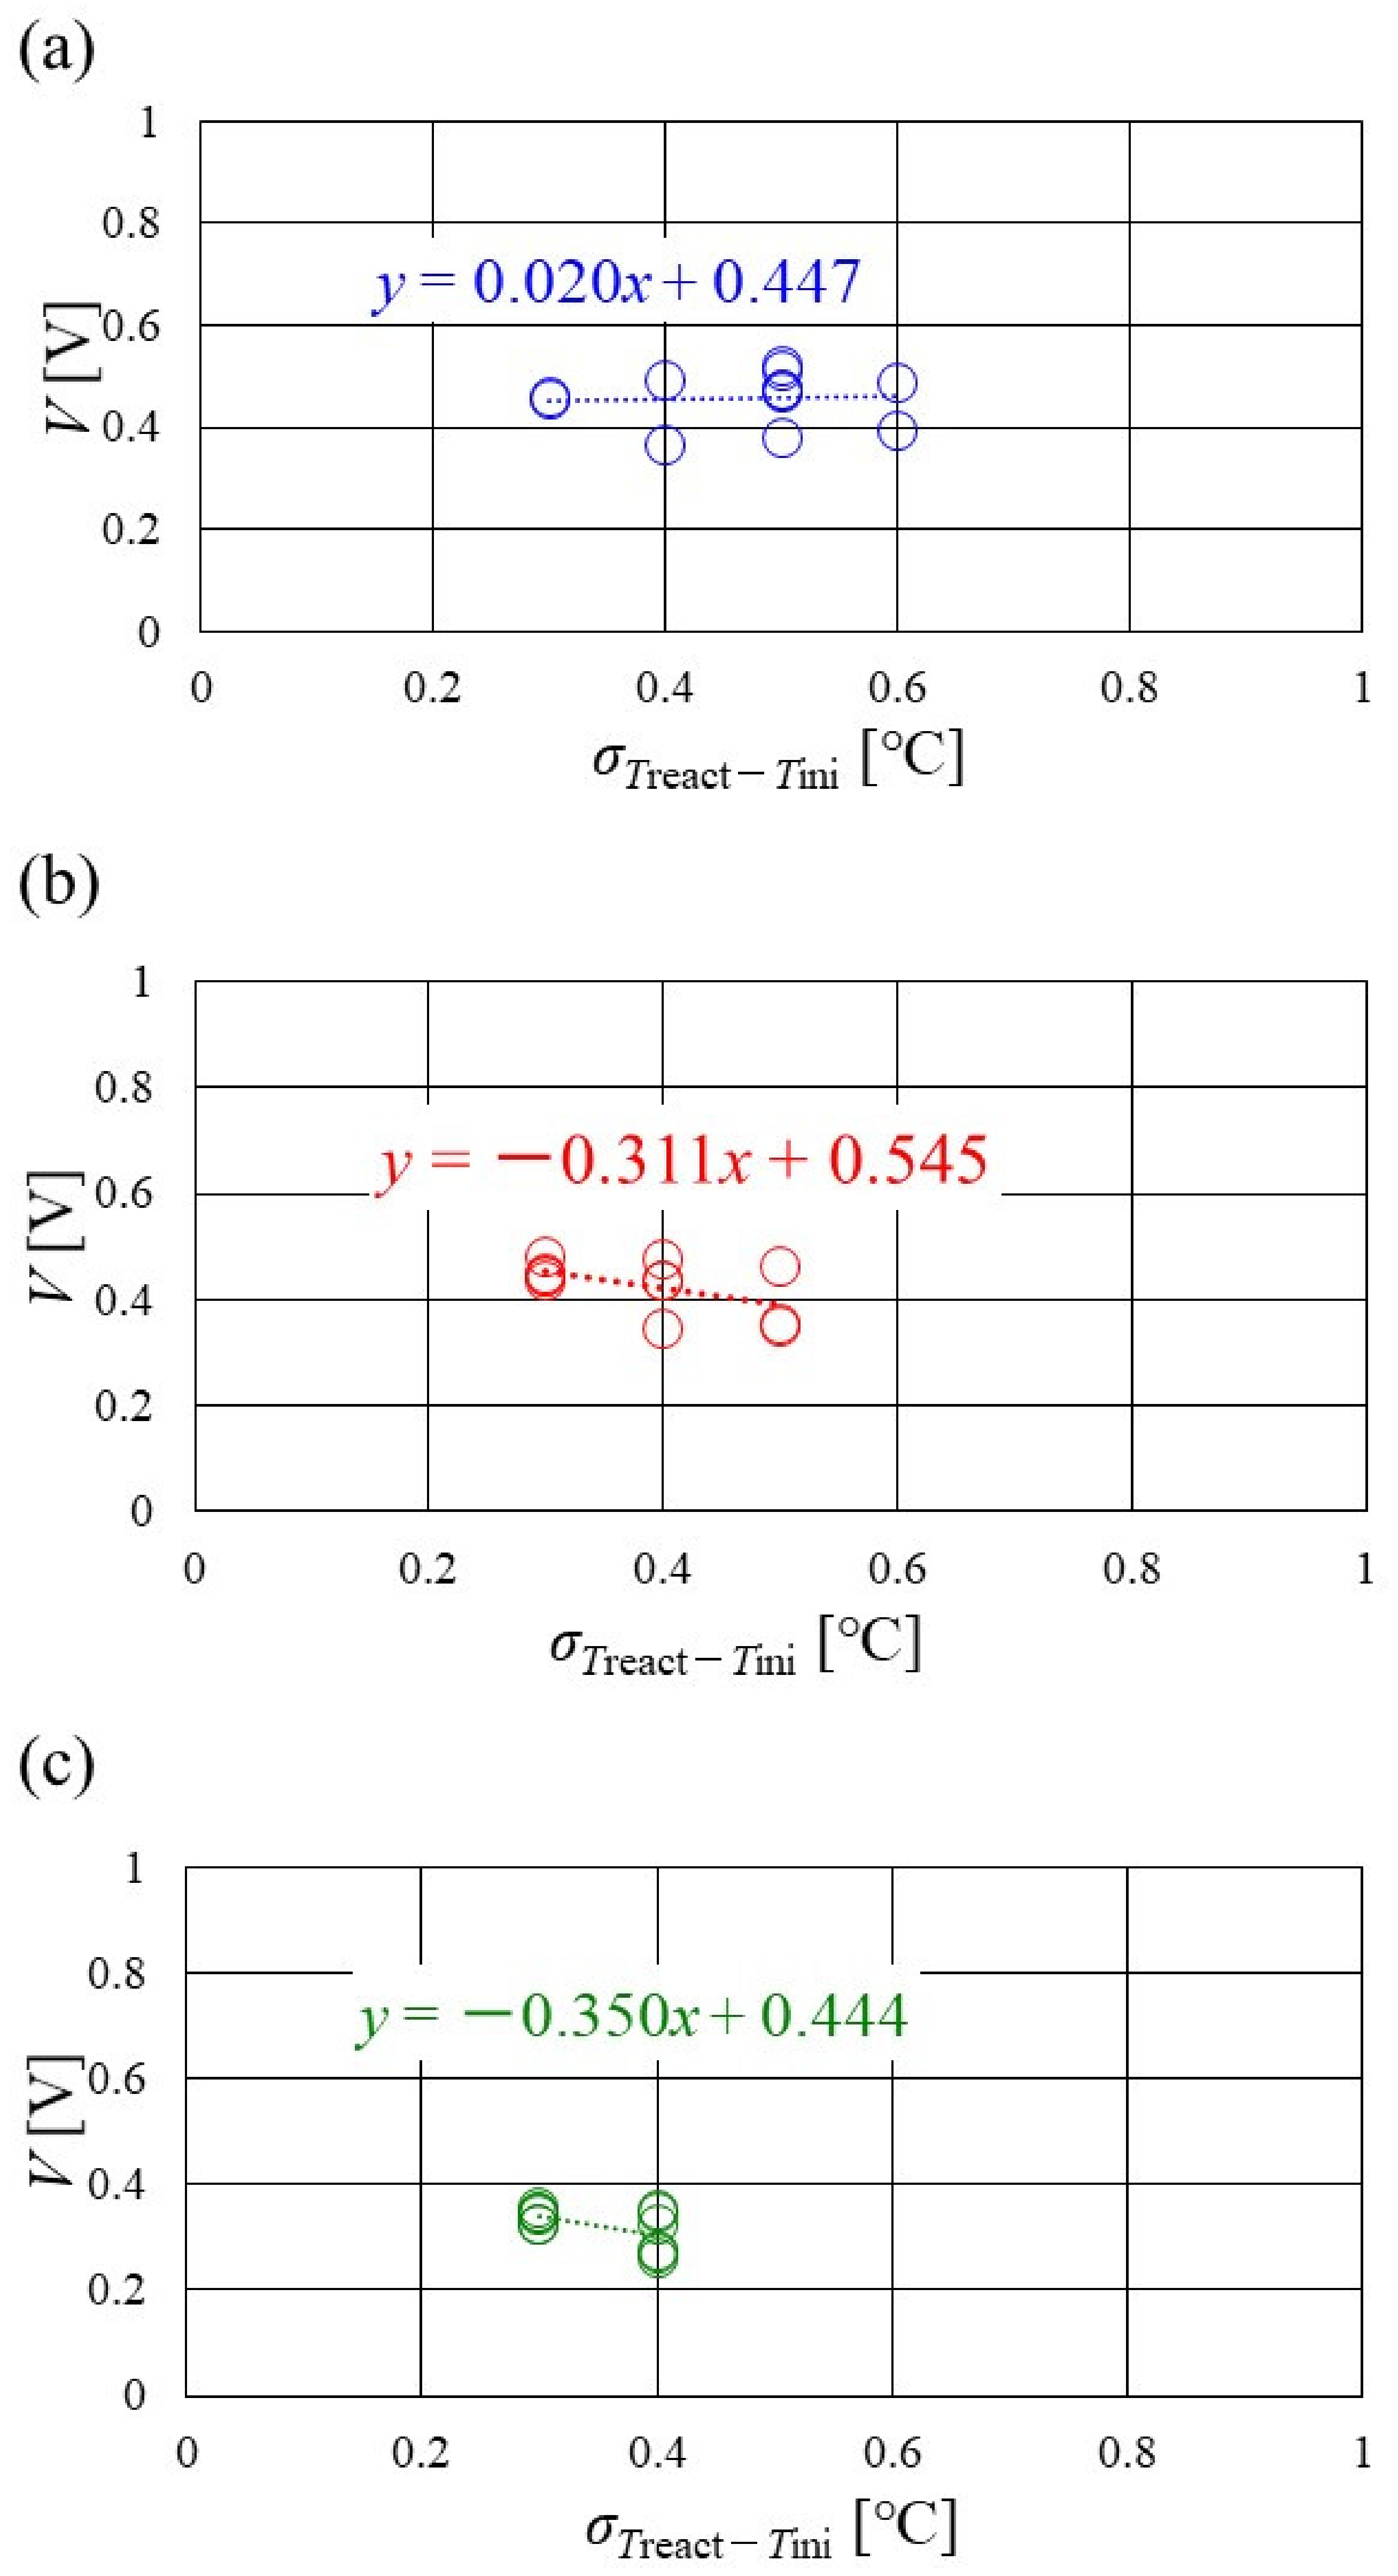
It is revealed that the slope of the approximate line for the relation between the standard deviation of the distribution of TreactTini and the total voltage becomes negative and larger with the increase in Tini, irrespective of the separator’s thickness, indicating that a wider temperature distribution provides a reduction in power-generation performance. The distribution range regarding the standard deviation of the distribution of TreactTini, at Tini = 100 °C, is narrower than the other Tini. Since Tini = 100 °C is a higher temperature, it is difficult to manage the humidification of the PEM and catalyst, and the power-generation performance declines, even for a narrow temperature distribution. This study proposes that thin separators, such as a thickness of 1.5 mm and 1.0 mm, are not suitable for higher temperature operation than usual.

Author Contributions

Conceptualization and writing–original draft preparation, A.N.; data curation, N.K.; methodology, K.T. and D.M.; writing–review and editing, M.L.K. All authors have read and agreed to the published version of the manuscript.

Funding

This research has received funding from Mie University.

Data Availability Statement

Not applicable.

Conflicts of Interest

The authors declare no conflict of interest.

Abbreviations

AHeat-transfer area, which is the active area of MEA equal to the power-generation area[m2]
EiIdeal energy generation rate from the water formation by H2 and O2, based on higher heating value[W]
FFaraday constant (= 96,500)[C/mol]
Hchan, aHeat flux through separator channel at anode [W]
Hchan, cHeat flux through separator channel at cathode[W]
HreactHeat generation rate[W]
Hrib, aHeat flux through rib at anode[W]
Hrib, cHeat flux through rib at cathode[W]
ILoad current[A]
iSegment[-]
Kchan, aOverall heat-transfer coefficient through separator channel at anode [W/(m·K)]
Kchan, cOverall heat-transfer coefficient through separator channel at cathode [W/(m·K)]
Krib, aOverall heat-transfer coefficient through rib at anode [W/(m·K)]
Krib, cOverall heat-transfer coefficient through rib at cathode [W/(m·K)]
kcatThermal conductivity of catalyst layer [W/(m·K)]
kchan, aThermal conductivity of mixture gas in separator channel at anode[W/(m·K)]
kchan, cThermal conductivity of mixture gas in separator channel at cathode[W/(m·K)]
kGDLThermal conductivity of GDL[W/(m·K)]
kMPLThermal conductivity of MPL[W/(m·K)]
kPEMThermal conductivity of PEM[W/(m·K)]
krib, aThermal conductivity of separator rib at anode[W/(m·K)]
krib, cThermal conductivity of separator rib at cathode[W/(m·K)]
ksepThermal conductivity of separator except for rib[W/(m·K)]
mH2Molar consumption rate of supplied H2[mol/s]
mO2Molar consumption rate of supplied O2[mol/s]
nValence ion (=2)[-]
qHHVIdeal energy generation rate on higher heating value [kJ/mol]
qLHVIdeal energy generation rate on lower heating value [kJ/mol]
s.r.Stoichiometric ratio[-]
TiniInitial operation temperature[°C or K]
TreactReaction surface temperature[°C or K]
Treact, chanTemperature on reaction surface under separator channel[°C or K]
Treact, ribTemperature on reaction surface under separator rib[°C or K]
Tsurf, aSeparator’s back surface temperature at anode[°C or K]
Tsurf, cSeparator’s back surface temperature at cathode[°C or K]
VVoltage obtained by the experiment[V]
WEElectric power generated by PEFC[W]
δcatThickness of catalyst layer[m]
δchanThickness of separator channel[m]
δGDLThickness of GDL[m]
δMPLThickness of MPL[m]
δPEMThickness of PEM[m]
δsepThickness of separator except for rib[m]

References

  1. NEDO (New Energy and Industry Technology Development Organization). Available online: http://www.nedo.go.jp/cotent/100871973 (accessed on 18 April 2022). (In Japanese).
  2. Zhang, G.; Kandlikar, S.G.A. Critical Review of Cooling Technique in Proton Exchange Membrane Fuel Cell Stacks. Int. J. Hydrog. Energy 2012, 37, 2412–2429. [Google Scholar] [CrossRef]
  3. Agbossou, K.; Kolhe, M.; Hamelin, J.; Bose, T.K. Performance of a Stand-Alone Renewable Energy System Based on Energy Storage as Hydrogen. IEEE Trans. Energy Convers. 2004, 19, 633–640. [Google Scholar] [CrossRef]
  4. Zhang, J.; Zhang, C.; Hao, D.; Ni, M.; Huang, S.; Liu, D.; Zheng, Y. 3D Non-isothermal Dynamic Simulation of High Temperature Proton Exchange Membrane Fuel Cell in Start-up Process. Int. J. Hydrog. Energy 2021, 46, 2577–2593. [Google Scholar] [CrossRef]
  5. Li, Q.; He, R.; Jensen, J.O.; Bjerrum, N.J. Approaches and Recent Development Polymer Electrolyte Membrane for Fuel Cells Operating above 100 ℃. Chem. Mater. 2003, 15, 4896–4915. [Google Scholar] [CrossRef] [Green Version]
  6. Lee, C.Y.; Weng, F.; Kuo, Y.W.; Tsai, C.H.; Cheng, Y.T.; Cheng, C.K.; Lin, J.T. In-situ Measurement of High-temperature Proton Exchange Membrane Fuel Cell Stack Using Flexible Five-in-one Micro Sensor. Sensors 2016, 16, 1731. [Google Scholar] [CrossRef] [PubMed] [Green Version]
  7. Jin, Y.; Wang, T.; Che, X.; Dong, J.; Liu, R.; Yang, J. New High-performance Bulky N-heterocyclic Group Functionalized Poly (Terphenyl Piperidinium) Membrane for HT-PEMFC Applications. J. Mem. Sci. 2022, 641, 119884. [Google Scholar] [CrossRef]
  8. Budak, Y.; Devrim, Y. Micro-cogeneration Application of a High-temperature PEM Fuel Cell Stack Operated with Polybenzimidazole Based Membranes. Int. J. Hydrog. Energy 2020, 45, 35198–35207. [Google Scholar] [CrossRef]
  9. Kim, D.H.; Min, C.M.; Lee, E.; Lee, J.S.; Pak, C. Effect of Vinylphosphonic Acid and Polymer Binders with Phosphate Groups on Performance of High-temperature Polymer Electrolyte Membrane Fuel Cell. Catal. Today 2020, 358, 333–337. [Google Scholar] [CrossRef]
  10. Jia, T.; Shen, S.; Zhao, J.; Jin, J.; Pan, B.; Duan, X.; Meng, C.; Che, Q. Ultrathin Membranes Formation via the Layer Self-assembly of Carbon Nanotubes-based Inorganics as High Temperature Proton Exchange Membranes. Int. J. Hydrog. Energy 2020, 45, 14517–14527. [Google Scholar] [CrossRef]
  11. Wang, D.; Wang, S.; Tian, X.; Li, J.; Liu, F.; Wang, X.; Chen, H.; Mao, T.; Liu, G. Ethly Phosphoric Acid Grafted Amino-modified Polybenzimidazole with Improved Long-term Stability for High-temperature Proton Exchange Membrane Applications. Int. J. Hydrog. Energy 2020, 45, 3176–3185. [Google Scholar] [CrossRef]
  12. Zhang, J.; Wang, H.; Li, W.; Zhang, J.; Lu, D.; Yan, W.; Xiang, Y.; Lu, S. Effect of Catalyst Layer Microstructures on Performance and Stability for High Temperature Polymer Electrolyte Membrane Fuel Cells. J. Power Sources 2021, 505, 230059. [Google Scholar] [CrossRef]
  13. Lee, W.J.; Lee, J.S.; Park, H.Y.; Park, H.S.; Lee, S.Y.; Song, K.H.; Kim, H.J. Improvement of Fuel Cell Performances through the Enhanced Dispersion of the PTFE Binder in Electrodes for Use in High Temperature Polymer Electrolyte Membrane Fuel Cells. Int. J. Hydrog. Energy 2020, 45, 32825–32833. [Google Scholar] [CrossRef]
  14. Zhang, S.; Zhang, J.; Zhu, Z.; Liu, P.; Cao, F.; Chen, J.; He, Q.; Dou, M.; Nan, S.; Lu, S. Usual Influence of Binder Composition and Phosphoric Acid Leaching on Oxygen Mass Transport in Catalyst Layers of High-temperature Proton Exchange Membrane Fuel Cells. J. Power Sources 2020, 473, 228616. [Google Scholar] [CrossRef]
  15. Kim, D.K.; Kim, H.; Park, H.; Oh, S.; Ahn, S.H.; Kim, H.J.; Kim, S.K. Performance Enhancement of High-temperature Electrolyte Membrane Fuel Cells Using Pt Pulse Electrodeposition. J. Power Sources 2019, 438, 227022. [Google Scholar] [CrossRef]
  16. Sasiwinmonrit, K.; Chang, W.C. To Improve the High Temperature Polymer Electrolyte Membrane Fuel Cells Performance by Alternating the Properties of Catalyst Layer. Int. J. Hydrog. Energy 2020, 45, 14491–14499. [Google Scholar] [CrossRef]
  17. Xu, Y.; Fan, R.; Chang, G.; Xu, S.; Cai, T. Investigating Temperature-driven Water Transport in Cathode Gas Diffusion Media of PEMFC with a Non-isothermal Two-phase Model. Energy Convers. Manag. 2021, 248, 114791. [Google Scholar] [CrossRef]
  18. Xia, L.; Ni, M.; Xu, Q.; Xu, H.; Zheng, K. Optimization of Catalyst Layer Thickness for Achieving High Performance and Low Cost of High Temperature Proton Exchange Membrane Fuel Cell. Appl. Energy 2021, 300, 117357. [Google Scholar] [CrossRef]
  19. Das, S.K.; Gibson, H.A. Three Dimensional Multi-physics Modeling and Simulation for Assessment of Mass Transport Impact on the Performance of a High Temperature Polymer Electrolyte Membrane Fuel Cell. J. Power Sources 2021, 499, 229844. [Google Scholar] [CrossRef]
  20. Xia, L.; Ni, M.; He, Q.; Cheng, C. Optimization of Gas Diffusion Layer in High Temperature PEMFC with the Focuses on Thickness and Porosity. Appl. Energy 2021, 300, 117357. [Google Scholar] [CrossRef]
  21. Huang, T.; Wang, W.; Yuan, Y.; Huang, J.; Chen, W.; Zhang, J.; Kong, X.; Zhang, Y.; Wan, Z. Optimization of High-temperature Proton Exchange Membrane Fuel Cell Flow Channel Based on Genertic Slgorithm. Energy Rep. 2021, 7, 1374–1384. [Google Scholar] [CrossRef]
  22. Chen, H.; Guo, H.; Ye, F.; Ma, C.F. A Numerical Study of Oriented-type Flow Channels with Porous-blocked Baffles of Proton Exchange Membrane Fuel Cells. Int. J. Hydrog. Energy 2021, 46, 29443–29458. [Google Scholar] [CrossRef]
  23. Zhang, T.; Li, J.; Li, Q.; Yu, M.; Sun, H. Combination Effects of Flow Filed Structure and Assembly Force on Performance of High Temperature Proton Exchange Membrane Fuel Cells. Int. J. Energy Res. 2021, 45, 7903–7917. [Google Scholar] [CrossRef]
  24. Xia, L.; Xu, Q.; He, Q.; Ni, M.; Seng, M. Numerical Study of High Temperature Proton Exchange Membrane Fuel Cell (HT-PEMFC) with a Focus on Rib Design. Int. J. Hydrog. Energy 2021, 46, 21098–21111. [Google Scholar] [CrossRef]
  25. Nanadegani, F.S.; Lay, E.N.; Sunden, B. Computational Analysis of the Impact of a Micro Porous Layer (MPL) on the Characteristics of a High Temperature PEMFC. Electrochim. Acta 2020, 333, 135552. [Google Scholar] [CrossRef]
  26. Nishimura, A.; Kono, N.; Toyod, K.; Kojima, Y.; Kolhe, M.L. Impact Analysis of MPL on a PEFC Cell’s Temperature Distribution with Thin PEM and GDL for Operating at Higher Temperature than Usual. J. Energy Power Eng. 2021, 15, 39–51. [Google Scholar] [CrossRef]
  27. Nishimura, A.; Yamamoto, K.; Okado, T.; Kojima, Y.; Hirota, M.; Kolhe, M. Impact of Analysis of MPL and PEM Thickness on Temperature Distribution within PEFC Operating at Relatively Higher Temperature. Energy 2020, 205, 117875. [Google Scholar] [CrossRef]
  28. Nishimura, A.; Sato, Y.; Kamiya, S.; Okado, T.; Yamamoto, K.; Hirota, M.; Hu, E. Impact of Thickness of Polymer Electrolyte Membrane and Gas Diffusion Layer on Temperature Distribution in Polymer Electrolyte Fuel Cell Operated at Temperature around 90 ℃. J. Power Eng. 2019, 13, 97–115. [Google Scholar] [CrossRef]
  29. Nishimura, A.; Sato, Y.; Yoshimura, M.; Kamiya, S.; Hirota, M. Impact of Thickness of Polymer Electrolyte Membrane on Temperature Distribution in Single Cell of Polymer Electrolyte Fuel Cell Operated at High Temperature. J. Energy Power Eng. 2018, 12, 80–92. [Google Scholar] [CrossRef] [Green Version]
  30. Nishimura, A.; Shibuya, K.; Morimoto, A.; Tanaka, S.; Hirota, M.; Nakamura, M.; Kojima, Y.; Narita, M.; Hu, E. Dominant Factor and Mechanism of Coupling Phenomena in Single Cell of Polymer Electrolyte Fuel Cell. Appl. Energy 2012, 1, 73–79. [Google Scholar] [CrossRef]
  31. Nishimura, A.; Okado, T.; Kojima, Y.; Hirota, M.; Hu, E. Impact of MPL on Temperature Distribution in Single Polymer Electrolyte Fuel Cell with Various Thickness of Polymer Electrolyte Membrane. Energies 2020, 13, 2499. [Google Scholar] [CrossRef]
  32. Zamel, N.; Becker, J.; Wiegmann, A. Estimating the Thermal Conductivity and Diffusion Coefficient of the Microporous Layer of Polymer Electrolyte Membrane Fuel Cells. J. Power Sources 2012, 207, 70–80. [Google Scholar] [CrossRef]
  33. Chen, G.; Zhang, G.; Guo, L.; Liu, H. Systematic Study on the Functions and Mechanisms of Micro Porous Layer on Water Transport in Proton Exchange Membrane Fuel Cells. Int. J. Hydrog. Energy 2016, 41, 5063–5073. [Google Scholar] [CrossRef]
  34. Nishimura, A.; Fukuoka, T.; Baba, M.; Hirota, M.; Hu, E. Clarification on Temperature Distribution in Single Cell of Polymer Electrolyte Fuel Cell under Different Operation Conditions by Means of 1D Multi-plate Heat-transfer Model. J. Chem. Eng. Jpn. 2015, 48, 862–871. [Google Scholar] [CrossRef]
  35. The Japan Society of Mechanical Engineers. JSME Heat Transfer Handbook, 1st ed.; The Japan Society of Mechanical Engineers; Maruzen: Tokyo, Japan, 1993; p. 387. [Google Scholar]
  36. Khandelwal, M.; Mench, M.M. Direct Measurement of Through-plane Thermal Conductivity and Contact Resistance in Fuel Cell Materials. J. Power Sources 2006, 161, 1106–1115. [Google Scholar] [CrossRef]
  37. Kawase, M.; Inagaki, T.; Kawashima, S.; Miura, K. Effective Thermal Conductivity of Gas Diffusion Layer in Through-plane Direction. ECS Trans. 2009, 25, 1529–1537. [Google Scholar] [CrossRef]
  38. Jung, C.Y.; Shim, H.S.; Koo, S.M.; Lee, S.H.; Yi, S.C. Investigation of the Temperature Distribution in Proton Exchange Membrane Fuel Cell. Appl. Energy 2012, 93, 733–741. [Google Scholar] [CrossRef]
  39. Nishimura, A.; Iio, K.; Baba, M.; Yamauchi, T.; Hirota, M.; Hu, E. Modeling of Heat Transfer in Single Cell of Polymer Electrolyte Fuel Cell by Means of Temperature Data Measured by Thermograph. J. Chem. Eng. Jpn. 2014, 47, 521–529. [Google Scholar] [CrossRef]
  40. Nishimura, A.; Zamami, K.P.; Yoshimoto, M.; Hirota, M.; Kolhe, M.L. Numerical Analysis of Temperature Distributions in Single Cell of Polymer Electrolyte Fuel Cell when Operated in Elevated Temperature Range. J. Energy Power Eng. 2017, 11, 193–408. [Google Scholar] [CrossRef] [Green Version]
  41. Nishimura, A.; Osada, K.; Tsunoda, T.; Yoshimura, M.; Hirota, M.; Hu, E. Analysis on Temperature Distributions in Single Cell of Polymer Electrolyte Fuel Cell when Operated in High Temperature Range. J. Energy Power Eng. 2016, 10, 453–464. [Google Scholar] [CrossRef] [Green Version]
  42. Nishimura, A.; Kojima, Y.; Ito, S.; Hu, E. Impacts of Separator Thickness on Temperature Distributions and Power Generation Characteristics of a Single PEMFC Operated at Higher Temperature of 363 and 373 K. Energies 2022, 15, 1558. [Google Scholar] [CrossRef]
  43. Akitomo, F.; Sasabe, T.; Yoshida, T.; Naito, H.; Kawamura, K.; Hirai, S. Investigation of Effects of High Temperature and Pressure on a Polymer Electrolyte Fuel Cell with Polarization Analysis and X-ray Imaging of Liquid Water. J. Power Sources 2019, 431, 205–209. [Google Scholar] [CrossRef]
  44. Mariani, M.; Latorrata, S.; Patrigani, S.; Stampino, P.G.; Dotelli, G. Characterization of Novel Graphene-based Microporous Layers for Polymer Electrolyte Membrane Fuel Cells Operating under Low Humidity and High Temperature. Int. J. Hydrog. Energy 2020, 45, 7046–7058. [Google Scholar] [CrossRef]
  45. Nishimura, A.; Mahadi, A.H.; Oasada, K.; Baba, M.; Hirota, M. Heat and Mass Transfer Characteristics on Single-cell of Polymer Electrolyte Fuel Cell Operated at Higher Temperature than Usual. Kagaku Kogaku Ronbunshu 2015, 41, 397–405. [Google Scholar] [CrossRef]
  46. Xu, Z.; Qiu, D.; Yi, P.; Peng, L.; Lai, X. Towards Mass Application: A Review on the Challenges and Developments in Metallic Bipolar Plates for PEMFC. Prog. Nat. Sci. Mater. Int. 2020, 46, 8672–8701. [Google Scholar] [CrossRef]
  47. Wu, S.; Yang, W.; Yan, H.; Zuo, X.; Cao, Z.; Li, H.; Shi, M.; Chen, H. A Review of Modified Metal Bipolar Plates for Proton Exchange Membrane Fuel Cells. Int. J. Hydrog. Energy 2021, 46, 8672–8701. [Google Scholar] [CrossRef]
  48. Saadat, N.; Dhakal, H.N.; Tjong, J.; Jaffer, S.; Yang, W.; Sain, M. Recent Advances and Future Perspectives of Carbon Materials for Fuel Cell. Renew. Sustain. Energy Rev. 2021, 138, 110535. [Google Scholar] [CrossRef]
Figure 1. 1D multi-plate heat-transfer module proposed by this study.
Energies 15 04203 g001
Figure 2. Segment of in-plane temperature distribution in a polymer electrolyte fuel cell, measured by means of a thermograph.
Energies 15 04203 g002
Figure 3. Structure of a single polymer electrolyte fuel cell, to measure the temperature distribution by a thermograph.
Energies 15 04203 g003
Figure 4. Schematic drawing of the experimental setup for the power-generation experiment, to measure the temperature distribution by a thermograph.
Energies 15 04203 g004
Figure 5. Effect of stoichiometric ratio of supply gas on distribution of temperature, difference between temperature at reaction surface and initial operation temperature, at the initial operation temperature = 80 °C and A 80% RH and C 80% RH.
Energies 15 04203 g005
Figure 6. Color counter to clarify the effect of stoichiometric ratio of supply gas on distribution of temperature difference, between temperature at reaction surface and initial operation temperature, at the initial operation temperature = 80 °C and A 80% RH and C 80% RH, visually.
Energies 15 04203 g006
Figure 7. Comparison of distribution of temperature difference, between temperature at reaction surface and initial operation temperature, among different relative humidity conditions and initial operation temperature, for the separator thickness of 2.0 mm: (a) the initial operation temperature = 80 °C, (b) the initial operation temperature = 90 °C, (c) the initial operation temperature = 100 °C.
Energies 15 04203 g007
Figure 8. Comparison of distribution of temperature difference, between temperature at reaction surface and initial operation temperature, among different relative humidity conditions and initial operation temperature for the separator thickness of 1.5 mm: (a) the initial operation temperature = 80 °C, (b) the initial operation temperature = 90 °C, (c) the initial operation temperature = 100 °C.
Energies 15 04203 g008
Figure 9. Comparison of distribution of temperature difference, between temperature at reaction surface and initial operation temperature, among different relative humidity conditions and initial operation temperature for the separator thickness of 1.0 mm: (a) the initial operation temperature = 80 °C, (b) the initial operation temperature = 90 °C, (c) the initial operation temperature = 100 °C.
Energies 15 04203 g009
Figure 10. Comparison of polarization curves, among different RHs using the separator thickness of 2.0 mm: (a) the initial operation temperature = 80 °C, (b) the initial operation temperature = 90 °C, (c) the initial operation temperature = 100 °C.
Energies 15 04203 g010
Figure 11. Comparison of polarization curves, among different RHs using the separator thickness of 1.5 mm: (a) the initial operation temperature = 80 °C, (b) the initial operation temperature = 90 °C, (c) the initial operation temperature = 100 °C.
Energies 15 04203 g011
Figure 12. Comparison of polarization curves, among different RHs using the separator thickness of 1.0 mm: (a) the initial operation temperature = 80 °C, (b) the initial operation temperature = 90 °C, (c) the initial operation temperature = 100 °C.
Energies 15 04203 g012
Figure 13. Effect of relative humidity and initial operation temperature and temperature difference, between the maximum and the minimum temperature in the distribution of temperature at reaction surface, for the separator thickness of 2.0 mm.
Energies 15 04203 g013
Figure 14. Effect of relative humidity and initial operation temperature and temperature difference, between the maximum and the minimum temperature in the distribution of temperature at reaction surface, for the separator thickness of 1.5 mm.
Energies 15 04203 g014
Figure 15. Effect of relative humidity and initial operation temperature and temperature difference, between the maximum and the minimum temperature in distribution of temperature at reaction surface, for the separator thickness of 1.0 mm.
Energies 15 04203 g015
Figure 16. Relation between standard deviation of distribution of temperature difference, between temperature at reaction surface and initial operation temperature and total voltage, in the case of a separator thickness of 2.0 mm: (a) the initial operation temperature = 80 °C, (b) the initial operation temperature = 90 °C, (c) the initial operation temperature = 100 °C.
Energies 15 04203 g016
Figure 17. Relation between standard deviation of distribution of temperature difference, between temperature at reaction surface and initial operation temperature and total voltage, in the case of a separator thickness of 1.5 mm: (a) the initial operation temperature = 80 °C, (b) the initial operation temperature = 90 °C, (c) the initial operation temperature = 100 °C.
Energies 15 04203 g017
Figure 18. Relation between standard deviation of distribution of temperature difference, between temperature at reaction surface and initial operation temperature and total voltage, in the case of a separator thickness of 1.0 mm: (a) the initial operation temperature = 80 °C, (b) the initial operation temperature = 90 °C, (c) the initial operation temperature = 100 °C.
Energies 15 04203 g018
Table 1. Specification list of polymer electrolyte fuel cell components, according to the manufacturer’s catalog and previous studies [26,27,28,29,30,31].
ComponentsDimensionCharacteristicsPorosity [-]Effective Thermal Conductivity [W/(m·K)]
Polymer electrolyte membrane (PEM)50.0 mm × 50.0 mm × 0.025 mmNRE-211 (produced by Du Pont Corp.)0.280.195
Catalyst layer50.0 mm × 50.0 mm × 0.01 mmPt/C (20 wt% Pt loading)0.780.27
Micro-porous layer (MPL)50.0 mm × 50.0 mm × 0.003 mm (attached with PEM)Carbon black + PTFE0.601.0
Gas-diffusion layer (GDL)50.0 mm × 50.0 mm × 0.11 mmCarbon paper (TGP-H-030 produced by Toray Corp.)0.781.7
Separator75.4 mm × 75.4 mm × 2.0 mm or 1.5 mm or 1.0 mm (2.0 mm = saddle thickness of 1.0 mm and channel height of 1.0 mm; 1.5 mm = saddle thickness of 0.5 mm and channel height of 1.0 mm; 1.0 mm = saddle thickness of 0.5 mm and channel height of 0.5 mm) (gas supply area: 50.0 mm × 50.0 mm)Carbon graphite, serpentine0.1525
Table 2. Power-generation-operation conditions of polymer electrolyte fuel cell to measure temperature, by means of a thermograph.
Initial temperature of cell (Tini) [°C]80, 90, 100
Load current [A] (current density [A/cm2])20 (0.80)
Condition of supply gas
AnodeCathode
Gas type H2O2
Temperature of supply gas at inelt [°C]80, 90, 10080, 90, 100
Relative humidity of supply gas [% RH]40, 8040, 80
Pressure of supply gas at inlet (absolute) [MPa]0.40.4
Flow rate of supply gas at inlet [NL/min] (Stoichiometric ratio [-])0.210 (1.5), 0.280 (2.0), 0.420 (3.0)0.105 (1.5), 0.140 (2.0), 0.210 (3.0)
Table 3. Experimental data on power-generation performance, at load current of 20 A.
Separator thickness: 2.0 mm
Tini = 80 °C
A 80% RH, C 80% RHA 80% RH, C 40% RHA 40% RH, C 80% RHA 40% RH, C 40% RH
0.565 V0.535 V0.540 V0.520 V
Tini = 90 °C
A 80% RH, C 80% RHA 80% RH, C 40% RHA 40% RH, C 80% RHA 40% RH, C 40% RH
0.545 V0.525 V0.530 V0.495 V
Tini = 100 °C
A 80% RH, C 80% RHA 80% RH, C 40% RHA 40% RH, C 80% RHA 40% RH, C 40% RH
0.465 V0.460 V0.435 V0.415 V
Separator thickness: 1.5 mm
Tini = 80 °C
A 80% RH, C 80% RHA 80% RH, C 40% RHA 40% RH, C 80% RHA 40% RH, C 40% RH
0.520 V0.475 V0.485 V0.395 V
Tini = 90 °C
A 80% RH, C 80% RHA 80% RH, C 40% RHA 40% RH, C 80% RHA 40% RH, C 40% RH
0.460 V0.450 V0.435 V0.355 V
Tini = 100 °C
A 80% RH, C 80% RHA 80% RH, C 40% RHA 40% RH, C 80% RHA 40% RH, C 40% RH
0.345 V0.340 V0.325 V0.275 V
Separator thickness: 1.0 mm
Tini = 80 °C
A 80% RH, C 80% RHA 80% RH, C 40% RHA 40% RH, C 80% RHA 40% RH, C 40% RH
0.535 V0.500 V0.490 V0.365 V
Tini = 90 °C
A 80% RH, C 80% RHA 80% RH, C 40% RHA 40% RH, C 80% RHA 40% RH, C 40% RH
0.475 V0.455 V0.425 V0.315 V
Tini = 100 °C
A 80% RH, C 80% RHA 80% RH, C 40% RHA 40% RH, C 80% RHA 40% RH, C 40% RH
0.365 V0.330 V0.275 V0.215 V
Publisher’s Note: MDPI stays neutral with regard to jurisdictional claims in published maps and institutional affiliations.

