
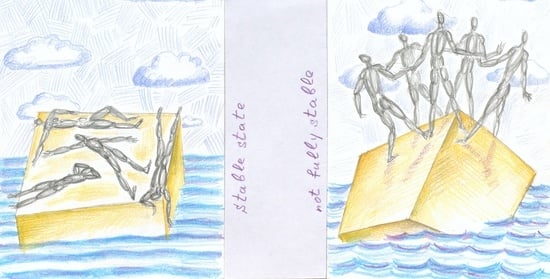
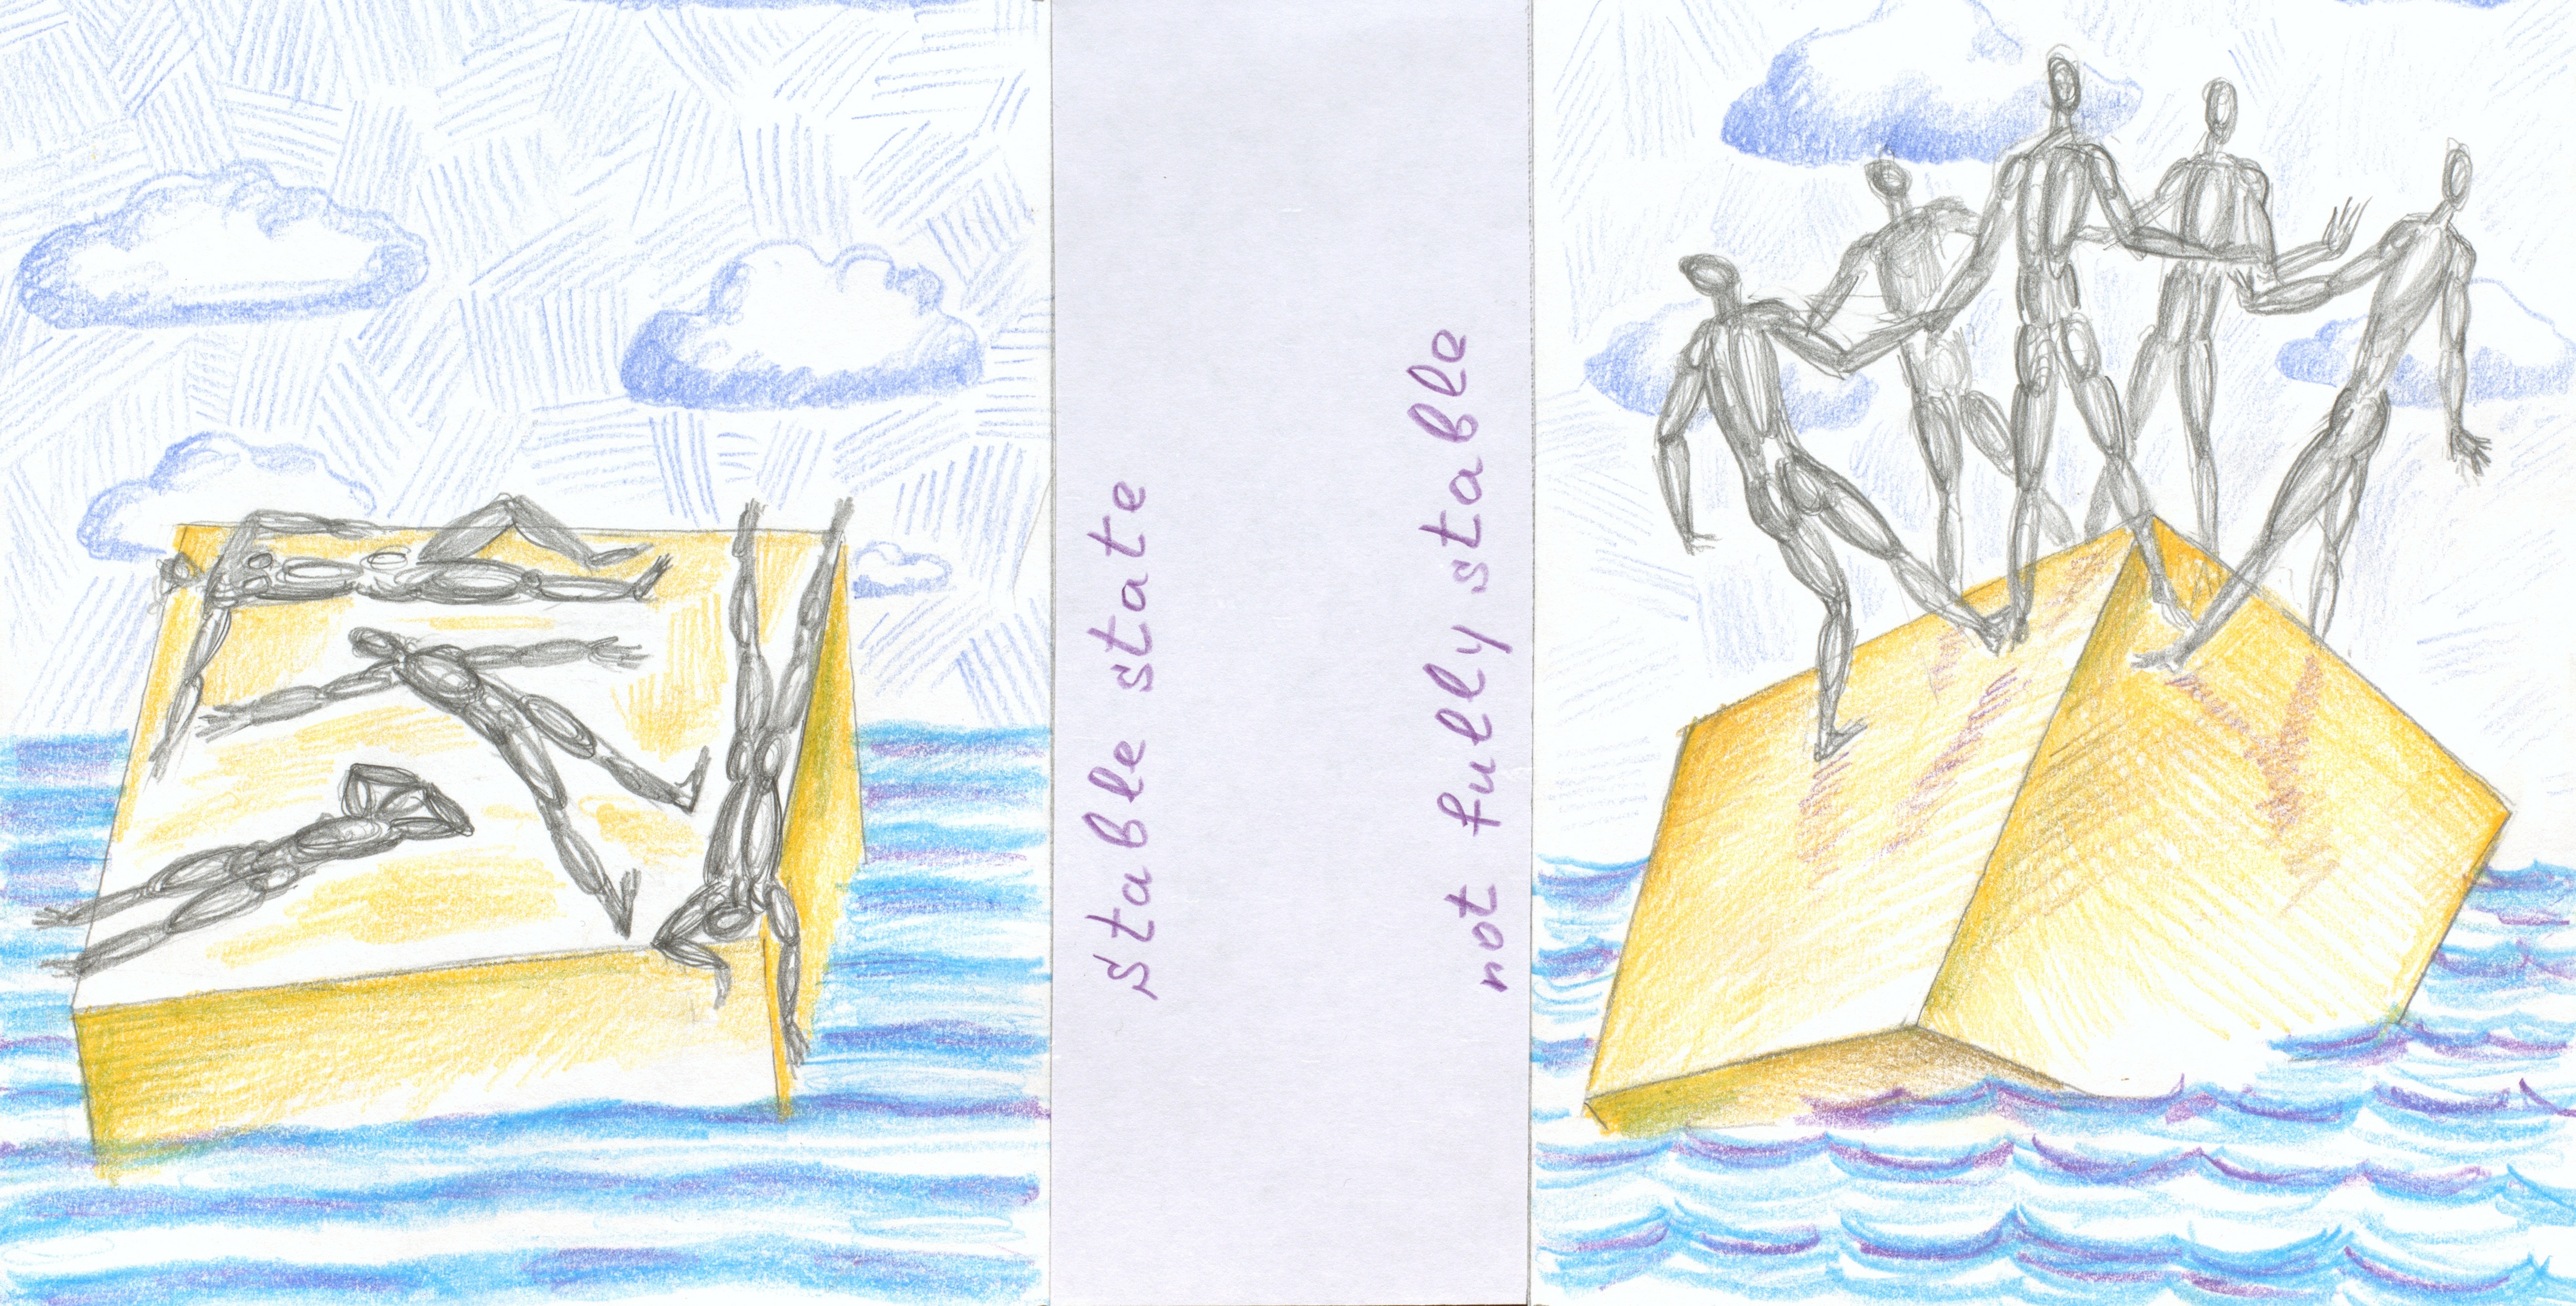
Thermophysical Properties of Liquids in Not Fully Stable States—From the First Steps to the Current Trends

Institute of Thermal Physics Ural Branch of RAS, 620016 Ekaterinburg, Russia
Energies 2022, 15(12), 4440; https://0-doi-org.brum.beds.ac.uk/10.3390/en15124440
Submission received: 27 May 2022
/
Revised: 15 June 2022
/
Accepted: 16 June 2022
/
Published: 18 June 2022
(This article belongs to the Special Issue Heat and Mass Transfer)
Abstract
:The present article marks the 95th anniversary of the birth of Vladimir P. Skripov, author of the classic study of superheated and supercooled liquids. It presents a discussion based on the early work carried out by Skripov and his research team in Ekaterinburg during the 1950s and 1960s. Due to their pioneering nature, these works laid the foundation for the study of metastable liquid states. For various reasons, although they remain relevant to this day, these groundbreaking works remain unknown to most non-Russian-speaking readers. As well as elucidating the behavior of the heat capacity of a solution in the liquid–liquid critical region, the presented research also concerns the characteristic features of light scattering and free-convective heat transfer in the liquid–vapor critical region of a one-component system, discussing two options for the position of the superheated liquid spinodal on the phase diagram of water, including the area of supercooled states and negative pressures. The issues involved in the discussion are united by the fluctuating nature of such phenomena. Indeed, the very possibility of their experimental study is due to a significant increase in the scale of fluctuations of the corresponding quantities when approaching the critical point or spinodal. The ongoing development of the approaches proposed in these papers for solving contemporary problems in the thermophysics of superheated liquids is discussed.
1. Introduction
Research aimed at identifying reliable techniques for the removal of high-density heat fluxes becomes relevant due to the constant increase in the requirements involving intensive heat and power processes. Considering the characteristic sizes of heat transfer devices and release parameters, both active and passive methods are used. An important direction here consists in the search for new classes of liquid heat carriers, as well as the expansion of the range of variables for already known samples [1,2,3,4,5].
In this regard, the scope of interests includes the properties of substances in the area of not fully stable states: superheated with respect to the liquid–vapor equilibrium line and nearly supercritical. In the phase diagram, these regions meet at the liquid–vapor critical point. In view of the peculiarity of properties in the vicinity of the critical point, which is due to the structural rearrangement of the particular substance, its state in this vicinity can be characterized as “a very delicate state of matter” [6]. From an experimental point of view, this circumstance means an increase in the requirements both for the method of measuring primary quantities and for matching the experimental conditions with the requirements of an ideal model used to convert primary quantities into the substance’s thermal property values [5,7,8]. Unlike critical and supercritical phenomena, while a description of the superheating phenomenon is not included in known textbooks, it has attracted the attention of researchers for many years [9]. Indeed, such states can-and do-arise when the heat transfer process is intensified, and the size of the device is reduced.
The essential approach of the Ural thermophysical school (to the 95th anniversary of whose founder this article is dedicated) is based on a consideration of spontaneous boiling-up as a random, fluctuation-driven event. In this regard, the primary experimental data (in the general case, the lifetime of the superheated state) should be averaged over a series of measurements under given external conditions. The very concept of attainable superheating (as well as the widespread term “superheat limit”) is conditional in the sense that each mean lifetime corresponds to its own temperature value.
Considering the contents of the books, reviews, and major articles published during this time [10,11,12,13,14,15,16,17], the present discussion is focused on the pioneering early works [18,19,20] which, despite having laid the foundation for the study of liquids’ metastable states, remain obscure to non-Russian-speaking readers. The continuing relevance of these works also applies to the somewhat later research [21]. Therefore, the aim of this work is to address this gap by elucidating the behavior of the solution heat capacity in the liquid–liquid critical region, presenting the characteristic features of light scattering and free-convective heat transfer in the liquid–vapor critical region of a one-component system, as well as discussing options for the position of the superheated liquid spinodal, (∂p/∂V)T = 0, on the phase diagram of water, which includes the region of supercooled states and negative pressures. Here, p—pressure, V—volume, and T—temperature. The issues involved in the discussion are brought together under the common fluctuating nature of these phenomena. The very possibility of their experimental study is due to the significant increase in the scale of fluctuations of the corresponding quantities when approaching the critical point or spinodal.
Interest in the study of not fully stable liquids—namely, fluids in superheated and nearly supercritical states—is associated with the significant region occupied by such states in the phase diagram of a substance [9,10,11,12,13]. The elegant solutions obtained in the pioneering early works [18,19,20] served as a practical basis for the gradual advance deeper into this area. New knowledge obtained for the properties of not fully stable liquids and the revealed fact of the confinement of their relaxation to an equilibrium state with respect to time have found application in novel engineering solutions. These solutions are generally connected with developing technologies for supercritical heat transfer in power generation (especially for 4th generation nuclear reactors in which supercritical water is used as a heat carrier [22,23]) and converting phase transition energy into transport fluids at the microscale [24,25]. In this connection, inkjet printers [26], bubble pumps [27], and fuel transmission and fire-extinguisher technologies [28,29] may be mentioned, as well as various bio-medical applications [30,31]. The prospect for using not fully stable liquids in modern technologies is associated with a steady trend towards the miniaturization of heat-generating devices, the intensification of heat transfer processes, and the increasing involvement of computer science approaches in research [32,33].
2. Background
As a special case of supersaturation, the phenomenon of superheating (stretching) of a liquid is observed when crossing the liquid–vapor equilibrium line, Ts(p), without boiling-up (cavitation) [10]. The study of the characteristic features of this phenomenon has gained a “second wind” in connection with the development of technologies carried out on a scale of small times and sizes [4,32,33,34,35]. The search for the properties of superheated liquids is complicated by a number of special requirements for the measurement method and procedure [10,15,16]. First, the reduction in the lifetime of a substance with an increase in the degree of superheating should be noted, namely, T − Ts(p) or p − ps(T). Examples of liquid superheating and its relaxation through spontaneous boiling-up for various processes are shown in Figure 1. In the case of supercritical pressure, the heating of a compressed fluid (p > pc, T < Tc) is accompanied by its transition to a supercritical fluid (p > pc, T > Tc) through a series of not quite stable states, but without phase separation [10,19,36].
Another special case of supersaturation relevant to the present discussion is the superheating of a solution having a lower critical solution temperature (LCST) relative to the liquid–liquid equilibrium line, Tll(c) (and, further, the diffusion spinodal (∂μ/∂c)T, p = 0, i.e., the stability limit of a homogeneous solution with respect to concentration fluctuations [9,37,38]), without phase separation of a solution with concentration c. Due to kinetic limitations, the lifetime of solutions superheated relative to Tll(c) is generally longer than in the case of superheating relative to the liquid–vapor equilibrium line. Relaxation of the solution to a stable state is carried out through nucleation or spinodal decomposition [9,39]. A visualization of the spinodal decomposition process can be found elsewhere [25]. As in the case of the liquid–vapor critical state (see Section 3.2 and Section 3.3), the properties of solutions in the vicinity of the liquid–liquid critical point undergo anomalous changes (see Section 3.1). In both cases, the presence of anomalous changes in thermal conductivity remains the subject of scientific discussion (see, for example, the discussions presented in [6,40]).
3. Results
3.1. Heat Capacity of Binary Liquid Mixtures in the Liquid–Liquid Critical Region
The task of the study was to elucidate the behavior of the partially soluble binary liquid heat capacity in the critical region of the liquid–liquid phase separation. At that time (1950–1951), there were no data on this issue available in the literature. The work was motivated by the experimental verification of some provisions of the generalized critical phenomena theory by Professor V.K. Semenchenko, who was Skripov’s scientific adviser at Moscow State University (1948–1953), on the example of partially soluble binary liquids. Semenchenko predicted the generality of critical phenomena and second-order phase transitions [36].
The object of study was triethylamine/water solution in the vicinity of a lower critical solution temperature (LCST). Critical point parameters at atmospheric pressure were determined to be 19.32 ± 0.02 °C and 34 ± 1 wt.%, respectively. An adiabatic setting of the calorimeter’s periodic heating mode was chosen. The key requirements for the design of the setup and the procedure for conducting the experiment were dictated by the specifics of measurements in the vicinity of the phase transition, which is accompanied by a sharp change in the properties of the system. Briefly, the temperature rise was reduced to 0.1 K (on the steep part of the experimental curve—to 0.045 K), while the capacity of the calorimeter was reduced to 20 cm3 (see Figure 2). However, due to the rejection of mixing in the vicinity of the phase transition, the heat transfer surface from the heater was increased. As a result, the temperature sensitivity of the setup turned out to be 3∙10−4 °C, the calorimetric sensitivity for an empty calorimeter turned out to be 9∙10−4 cal, and for that filled with water—5∙10−3 cal. Over the course of the experiment, the substance was transferred step-by-step from a single-phase state to a two-phase state. The heat capacity in the experiments was calculated by the formula:
C = (Q/ΔT) − C0 = (0.239·I·U·t/ΔT) − C0.
The variables in (1), which are common for calorimetric measurements, evidently do not require additional explanations. The error in determining the heat capacity at a temperature rise of 0.1 K did not exceed ±2%. The design of the calorimeter and the results of its testing on known samples are presented in detail elsewhere [41].
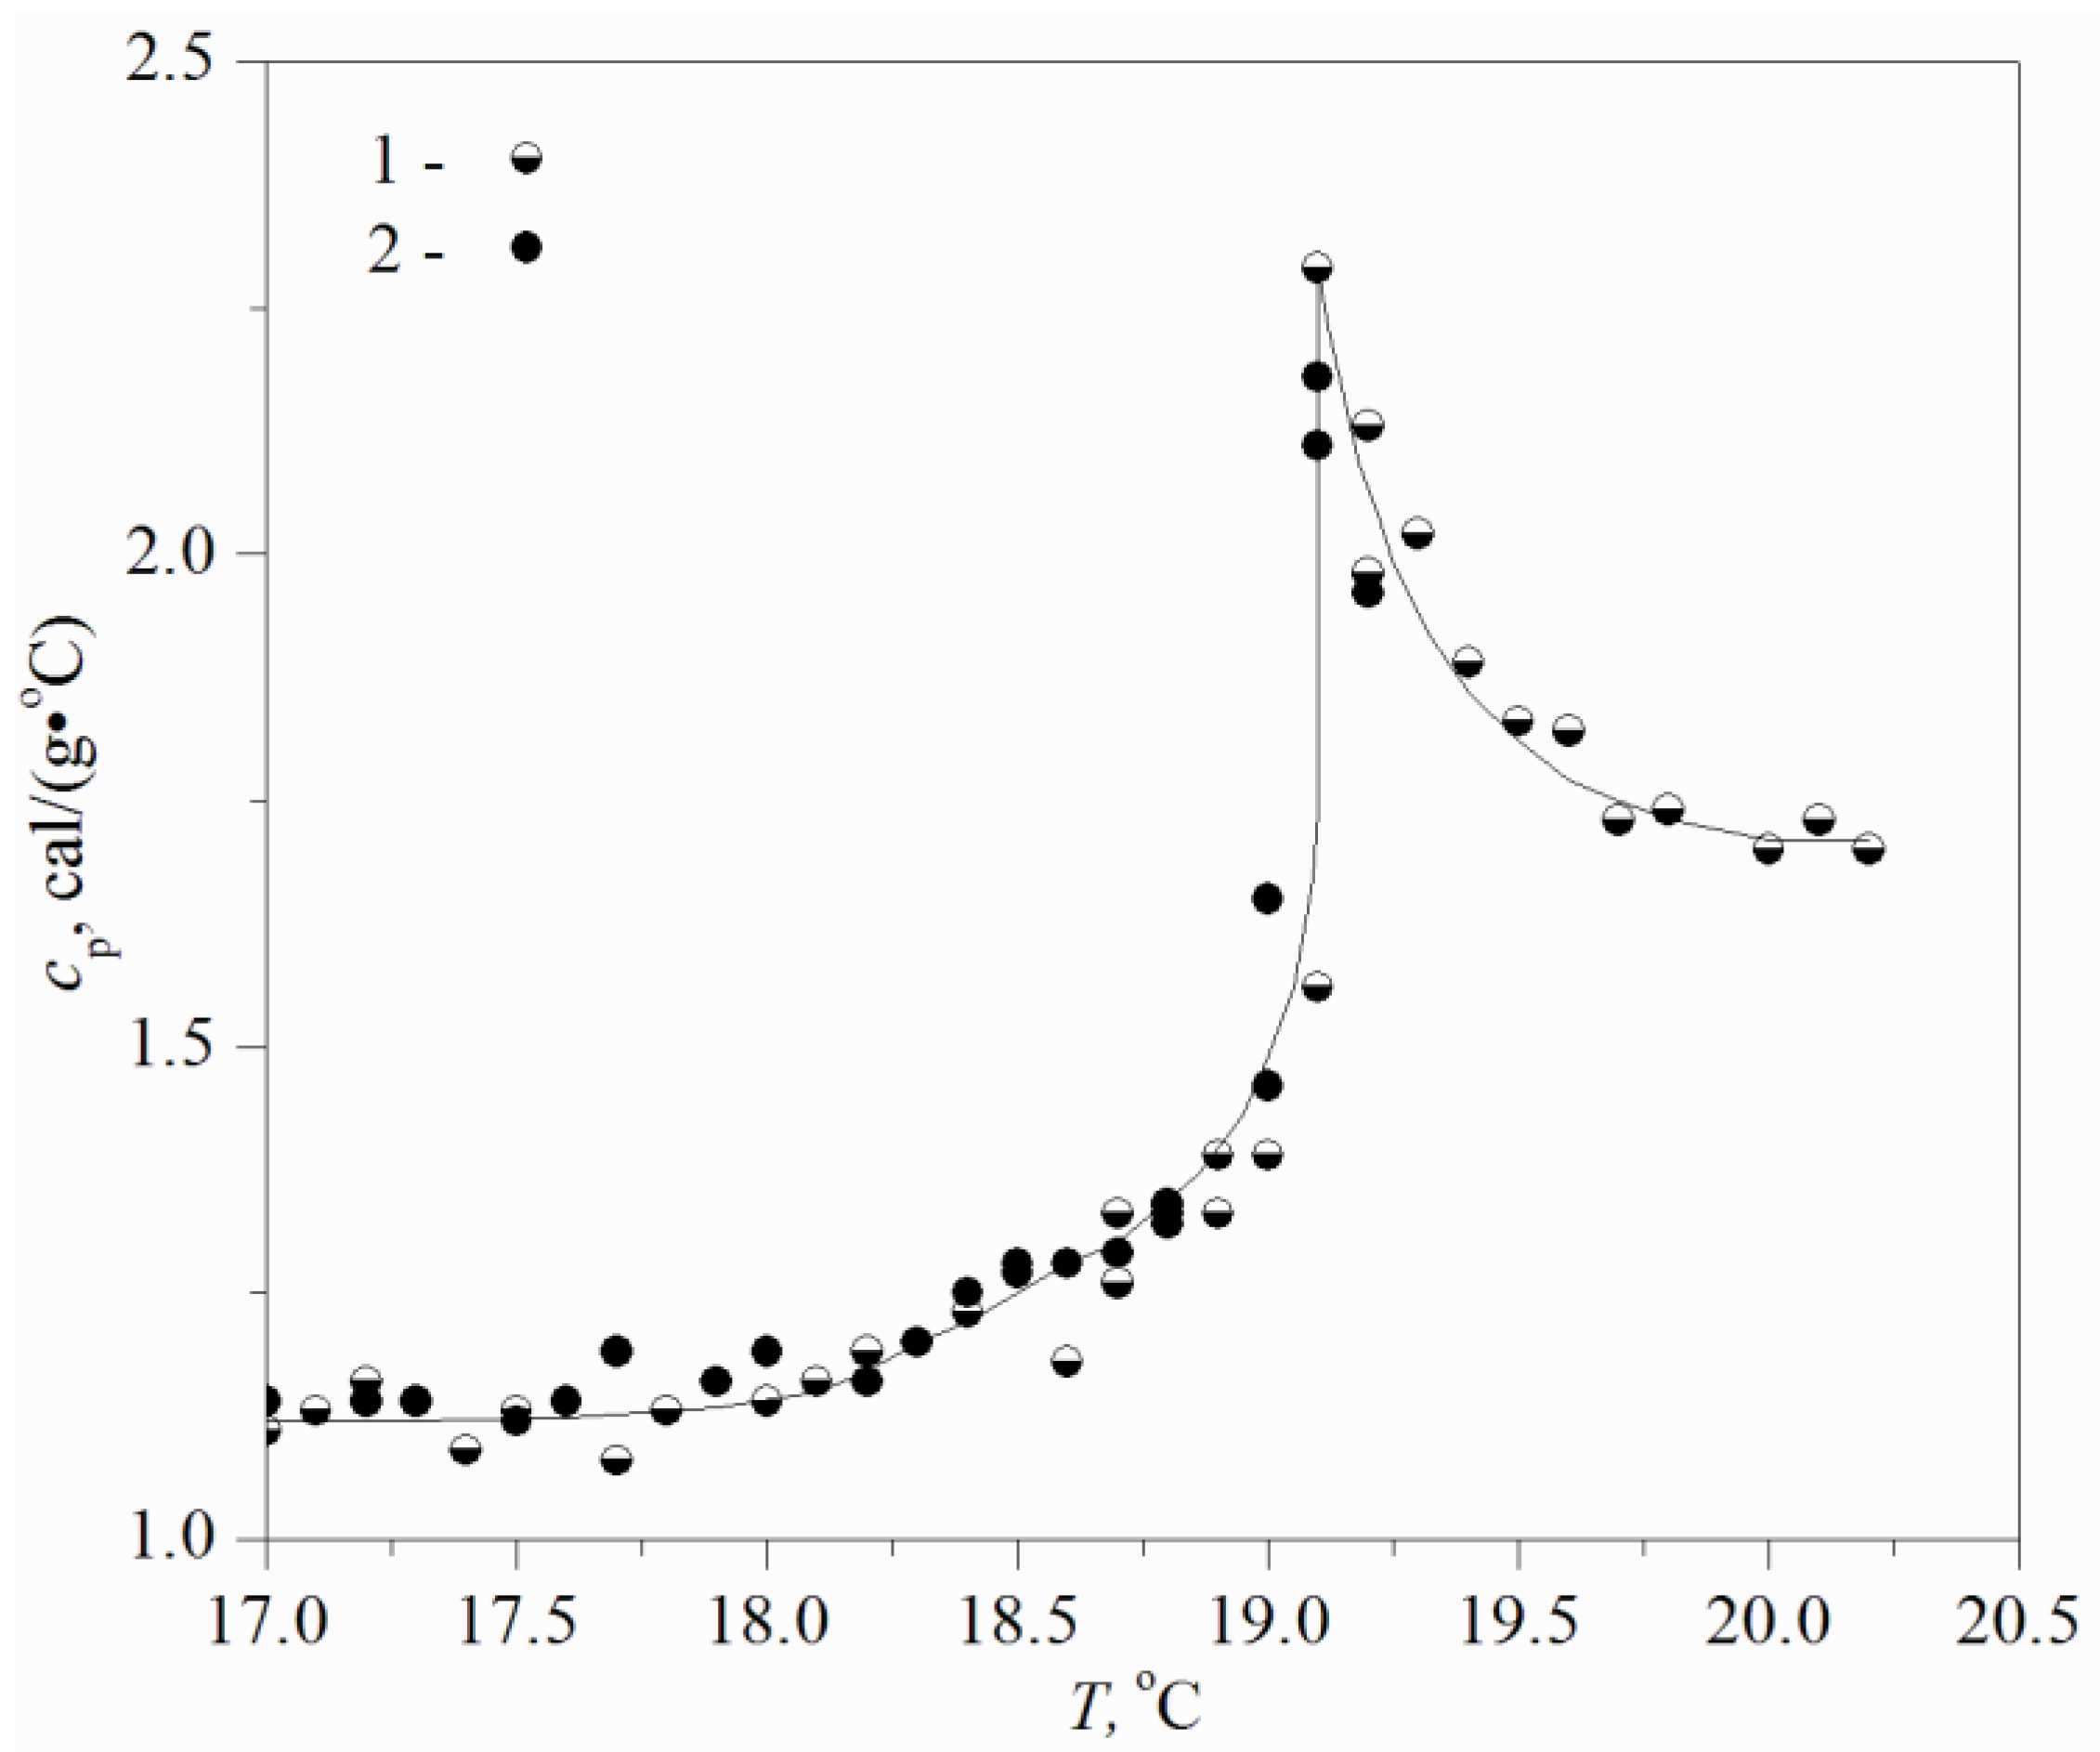
The results of two series of measurements carried out on different days according to [18] are combined in Figure 3. The TEA content was 34.11 wt.%, while the mass of the studied mixture was 12 g. The main result of the work is the discovery of the maximum heat capacity of a partially soluble binary liquid in the critical region of phase separation. The heat capacity maximum has a λ-shaped form, which is characteristic of second-order phase transitions. These results have been repeatedly confirmed [41,42]. Similar results obtained for systems with an upper critical solution temperature (UCST) formed the basis of Skripov’s dissertation [30]. On 1 November 1953, he moved to Sverdlovsk (now Yekaterinburg), where the work described below was carried out.
In general, these results confirmed Semenchenko’s point of view on the generality of critical phenomena and second-order phase transitions. An increase in the heat capacity near the critical point is associated with an intensification in the energy fluctuations of the system, which, according to the theory under discussion, is a fundamental feature of any of the generalized critical phenomena. Nevertheless, it was not until the mid-1960s that the results were generally recognized [43]. Skripov noted that postulates of the theory met “...obvious or covert resistance from physico-chemists. Seeds fell on unprepared soil”. This is not the only case in the history of critical phenomena. A similar fate met the results obtained by the experimental work carried out by Jules-Émile Verschaffelt in the Netherlands at around the end of the 19th century [44].
3.2. Characteristic Features of Light Scattering in the Critical Liquid–Vapor Region of a Single-Component System
To verify Semenchenko’s hypothesis on supercritical transitions as continuous transitions, a systematic study of the light scattering along sub- and super-critical isotherms was carried out. Simultaneously with the intensity of the scattered light, the intensity of the light passing through the cell containing the substance was measured. The design of the installation developed practically from scratch due to the lack of reliable schemes for solving such problems set a certain standard for subsequent studies in the pre-laser era. A photograph of the working chamber, and a detailed description of the installation, temperature control, and pressure control techniques are provided in [19,45,46,47]. Briefly, the light source was a mercury lamp. The measurements were carried out for three lines of the mercury spectrum at wavelengths (λi) of 5461, 4358, and 4046 Å. Scattered light was recorded by a photomultiplier, whose load circuit included a null galvanometer.
Painstaking methodological work was carried out over a long period of time. To minimize the error associated with the density gradient, the optical cell was positioned vertically. The excitatory light, which traveled parallel to the density gradient, did not change its direction. The curvature of the scattered light traveling perpendicular to the density gradient was considered. As the critical point is approached, the absorption and multiple scattering of light begin to play an important role. For example, for a short wavelength of 4046 Å, the obtained correction for multiple scattering reached 28% at T − Tc = 0.05 K. As a result, the main factors in the study of critical opalescence in the liquid–vapor system were revealed: attenuation of the excitatory and scattered light, multiple scattering, as well as the influence of the gravitational effect. The role of these factors grows as the critical point is approached. The demonstrated expediency of using small optical cells is relevant to contemporary methods using a fiber optic light guide.
In view of the convenient position of their critical points on the temperature–pressure state diagram, the objects of study were carbon dioxide (Tc = 304.2 K, pc = 7.38 MPa) and sulfur hexafluoride (Tc = 318.7 K, pc = 3.76 MPa).
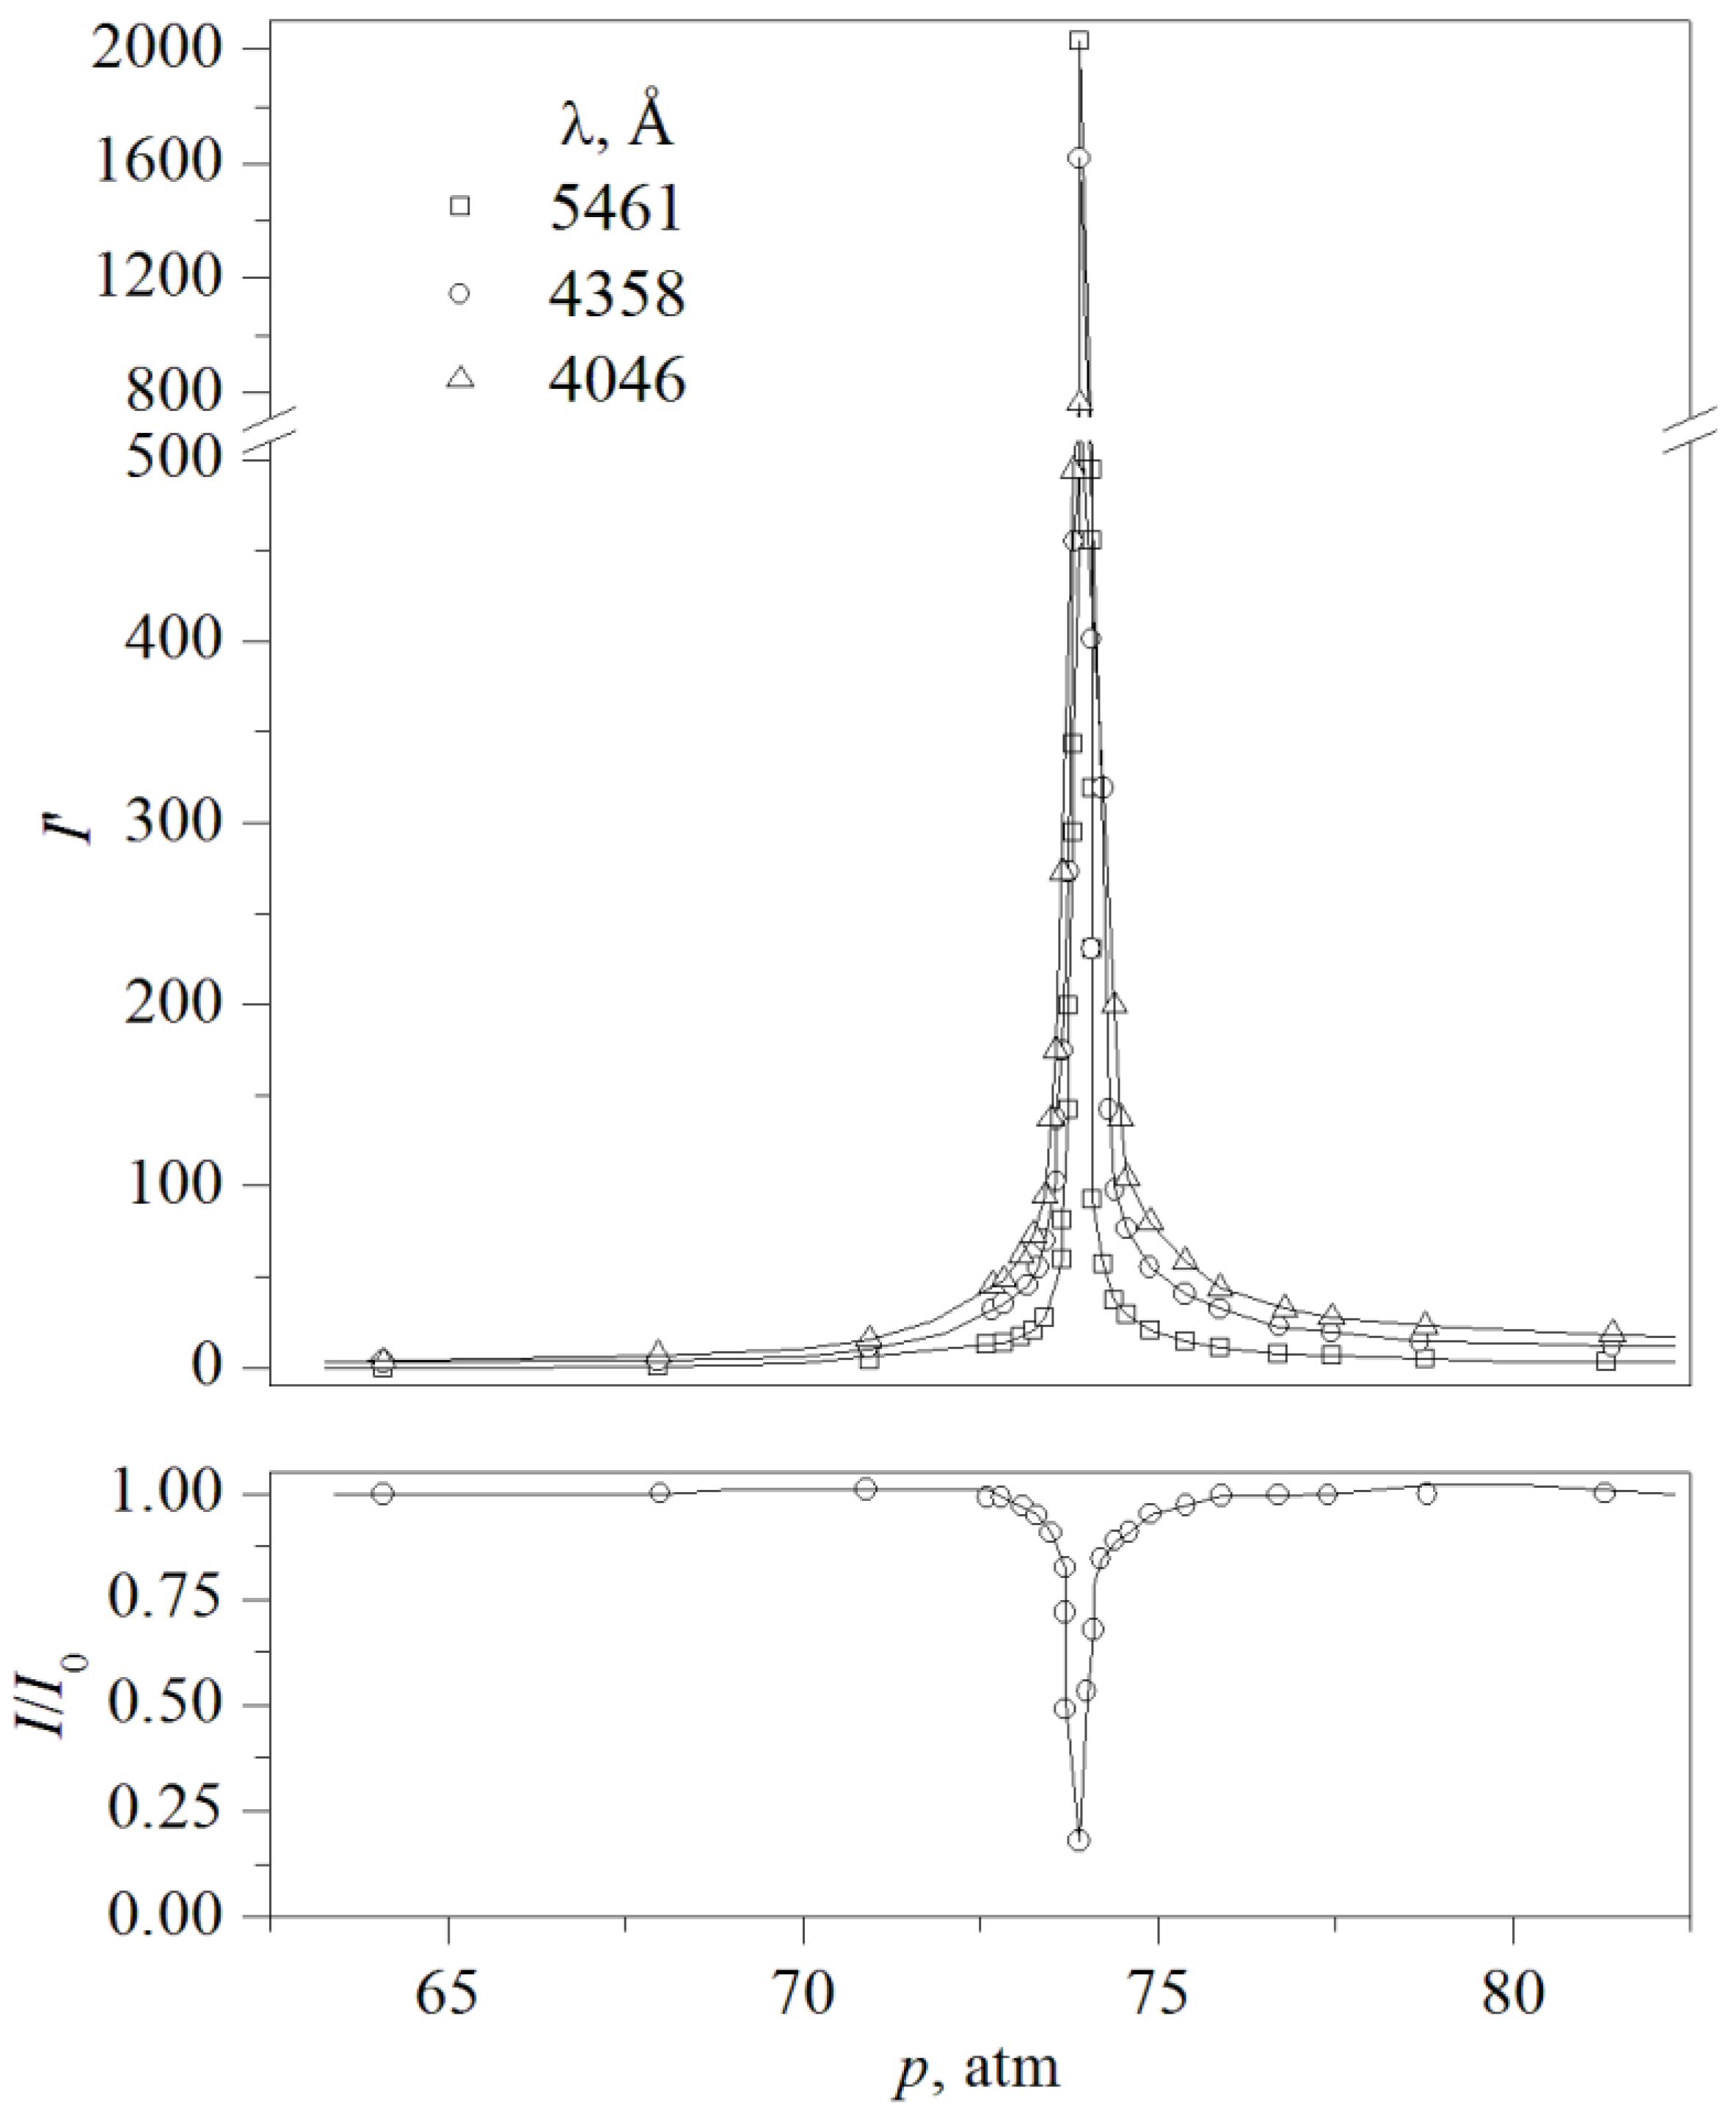
The first results were presented in January 1960 at a meeting on critical phenomena and fluctuations in solutions in Moscow [19]. Data were obtained on the scattering of light by carbon dioxide along ten isotherms, i.e., along the “wings” of the critical region. The pressure was varied from 63 to 83 bar. The most striking results were obtained for the nearest supercritical isotherm (see Figure 4). The enhancement of light scattering directly indicates the development of fluctuation micro-inhomogeneities in density. In the supercritical region, these phenomena are more pronounced. Indeed, there is a field of unstable states at T < Tc through which the system jumps during a first-order phase transition. During supercritical transitions, the entire sequence of states with continuously varying density occurs. In the latter case, the region of maximum microscopic inhomogeneity is associated with the passage through the minimum of the phase’s thermodynamic stability, which is determined by the value of the coefficient γ = −(∂p/∂V)T, where the coefficient is positive for T > Tc everywhere else. In particular, in the discussion of the results, their correspondence to the Rayleigh scattering law is shown
Ii = (λi4)−1.
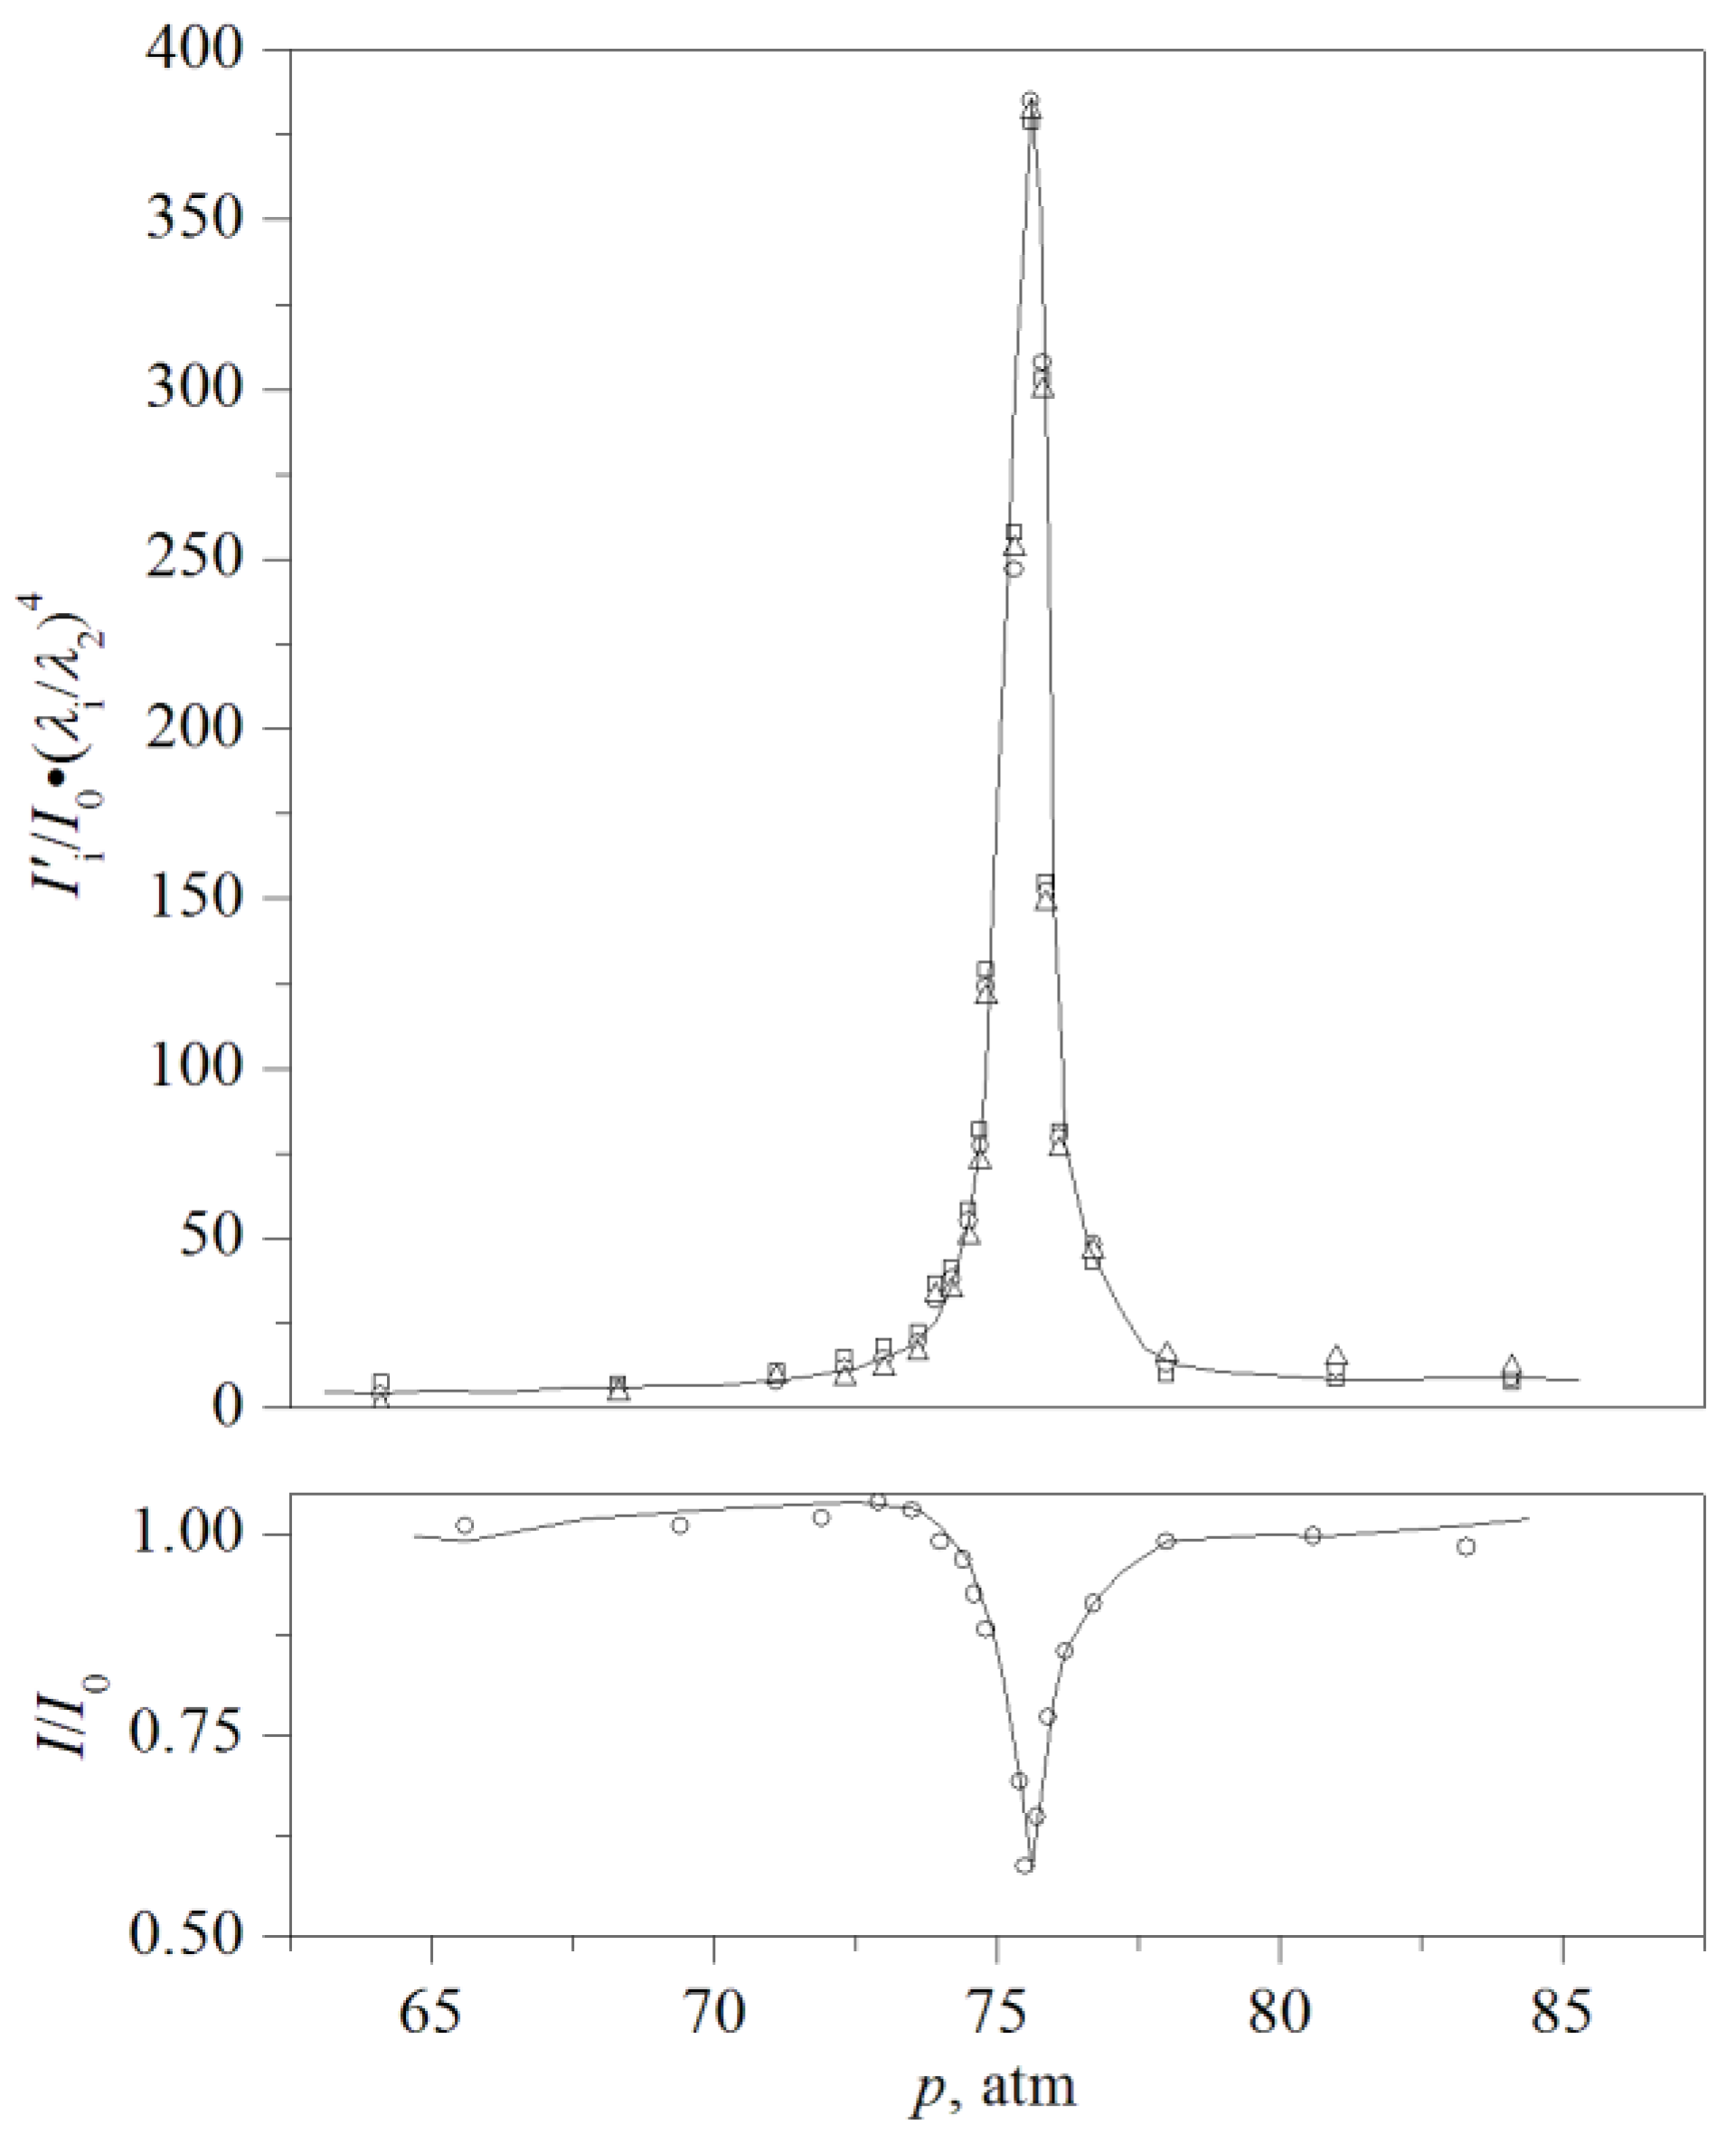
As shown in Figure 5, using the example of the 31.91 °C isotherm, the data for (λ1) and (λ3) were reduced to the blue line (λ2) by multiplying I’1 and I’3 by (λ1/λ2)4 and (λ3/λ2)4, respectively. A change in the nature of scattering was found only for the nearest supercritical isotherm, at 31.20 °C, for which the value of the exponent in (2) turned out to be close to 3.2. Similar data were also obtained later for sulfur hexafluoride [47].
Generally, in the first work [19], the extremal course of light scattering had been already confirmed for a fairly wide vicinity of the critical temperature. This type of behavior was consistent with the known data for the heat capacity, viscosity, thermal conductivity, velocity, and absorption coefficient of ultrasound [5,6,7,48,49]. At the same meeting (1960), a report was presented, including a discussion of the solution with LCST (TEA/water) in the spirit of the ideas of V.K. Semenchenko. Nevertheless, in the Decision of the Meeting, it was noted that “... there are neither experimental nor theoretical grounds for rejecting the classical thermodynamic theory of critical phenomena” [50]. As a result, the transition from the classical era in the history of critical phenomena to the period of the fluctuation approach to their description took place, following [43], at the Washington Conference in 1965 [51]. Later, in a short-term experiment, conditions were identified under which anomalies in thermophysical properties do not manifest themselves [52].
3.3. Characteristic Features of Free-Convective Heat Transfer in the Critical Region of Liquid–Vapor of a One-Component System
Liquids at supercritical pressures have attracted and continue to attract the attention of researchers as potential coolants in processes requiring reliable heat removal [1,5,22,23]. The research is aimed at elucidating the possibility of practical application of the abovementioned anomalies in thermophysical properties. Significant work on the study of heat transfer along isotherms and isobars in the region of a continuous supercritical transition was carried out under Skripov’s direction in the early 1960s [20] (see also [53,54]). As a first step, free-convective heat transfer was chosen as a more physically defined case. The main attention was paid to explaining the nature of changes in the heat transfer coefficient in the near supercritical region and the influence of the temperature difference on this character. A variant of the thin-filament method heated by direct current was applied. Compared with the method used in the apparently historically first paper [55], the method turned out to be quite convenient and pertinently informative.
Experiments [20] were carried out under the following conditions. The wire probe, which was 72.5 mm-long and 29 µm in diameter (in subsequent works [53,54], probes of five diameters were used, ranging from 20 to 200 µm), was stretched along the axis of a cylindrical channel 18 mm in diameter ranged in a vertical position. The setup scheme included an electrical power supply circuit for the probe as a heat source and a potentiometric circuit for the probe as a resistance thermometer. The heating power was selected in such a way that the probe temperature increase upon the onset of the stationary regime was ΔT ≈ 0.5 °C. In this case, it is convenient to refer the results to the temperature of the chamber walls and the adjacent liquid. The primary data (including voltage drop on the probe and on the standard resistors) were used to calculate the values of the temperature of the probe, the heat flux density, and the height-averaged heat transfer coefficient κ = q/ΔT. The parameter was the value of pressure in a thermostated chamber with a temperature T > Tc. The samples were carbon dioxide and sulfur hexafluoride.
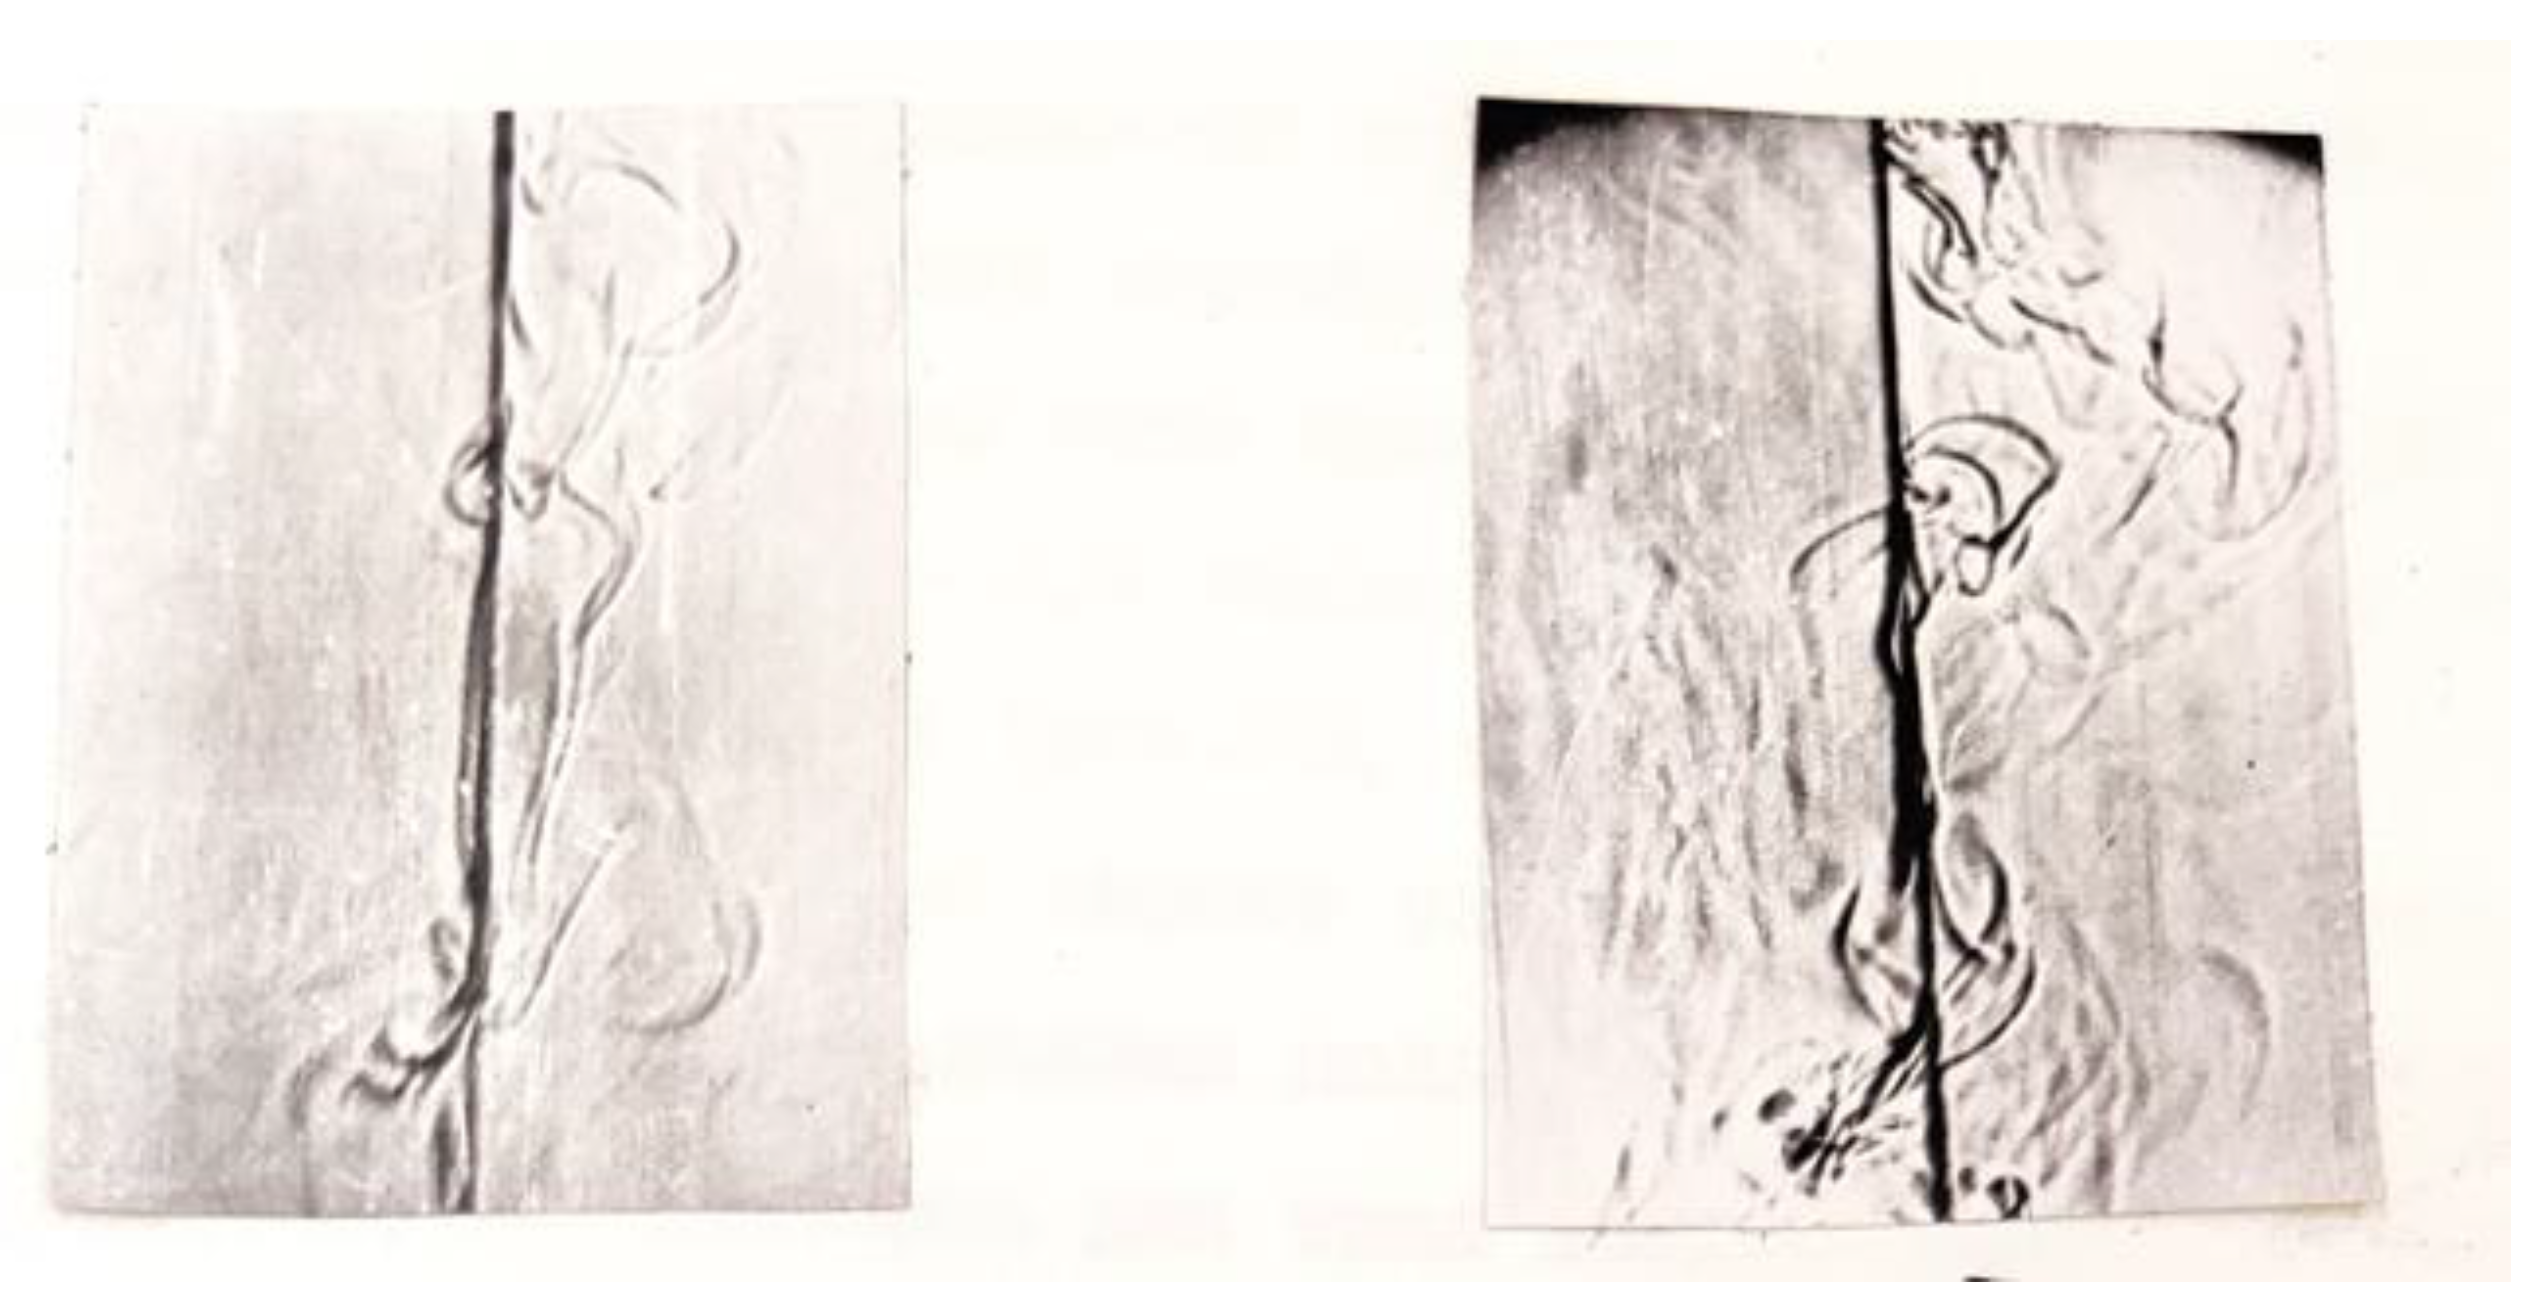
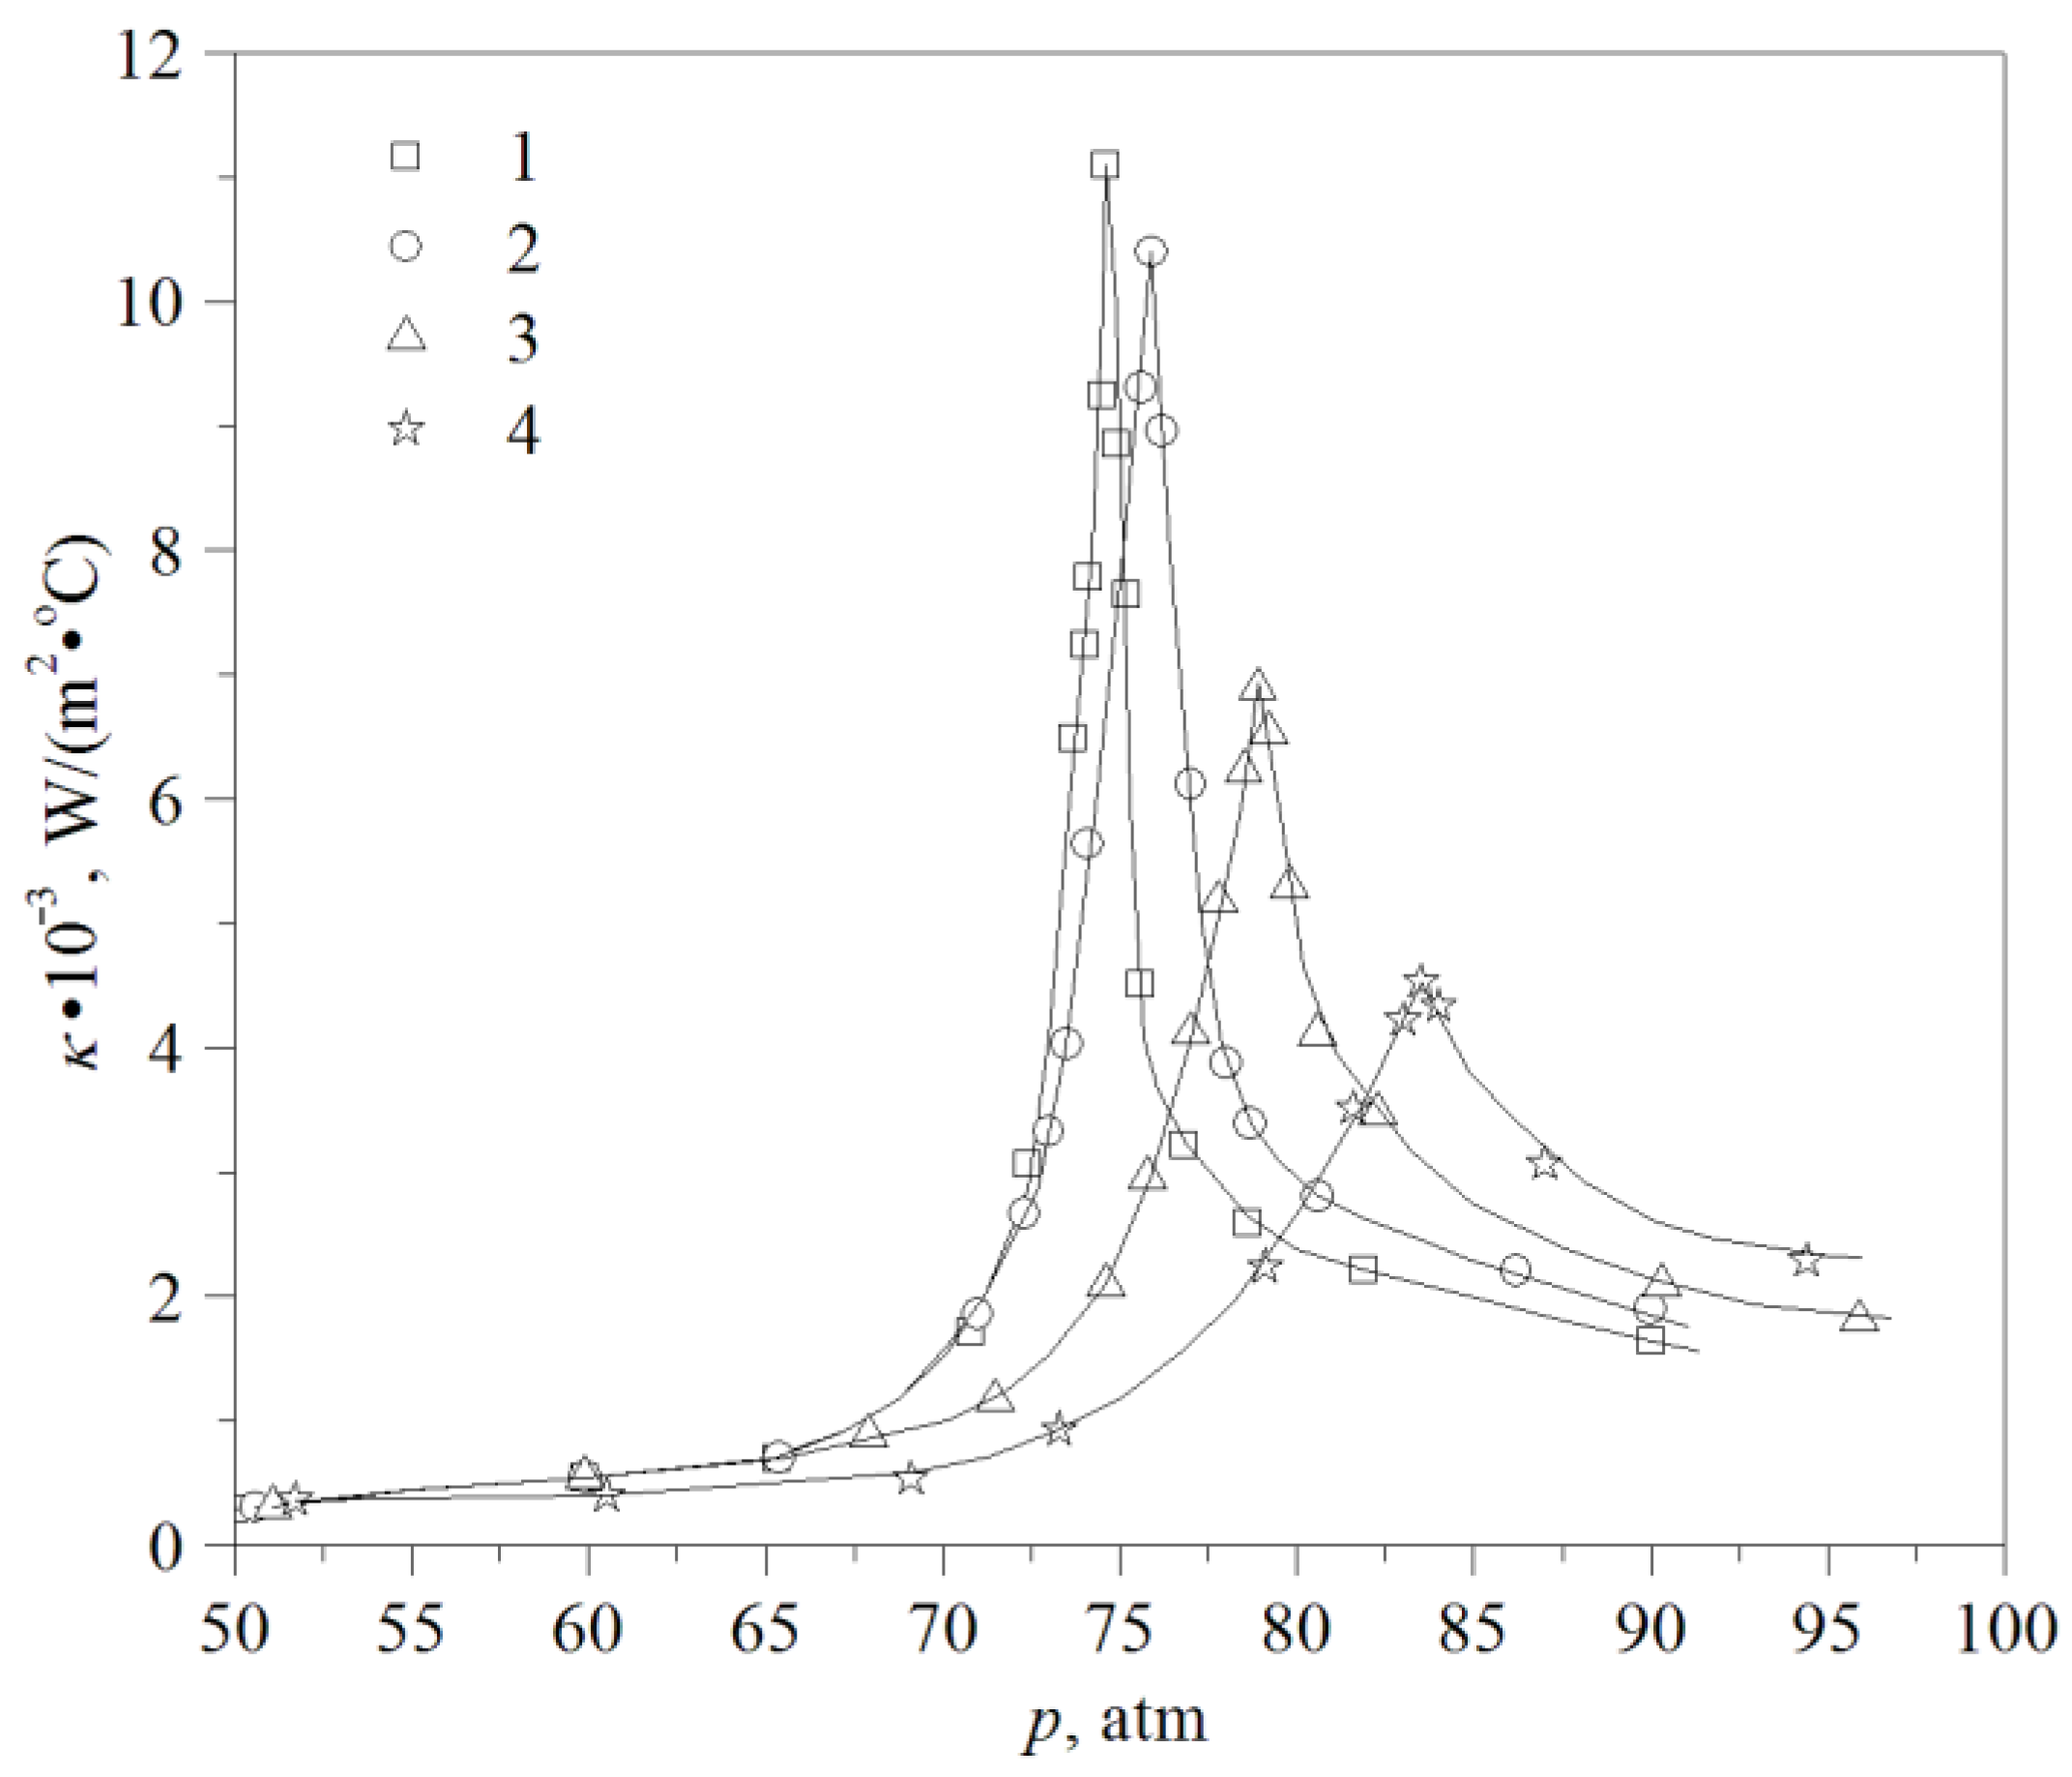
It was found that the values of κ(p) pass through a maximum. This is due to the extreme nature of the change in thermophysical properties—primarily heat capacity and volume expansion coefficient, β—in the supercritical region. The developed fine-structured convection in the entire examined volume corresponded to the maximum values (see Figure 6). As in the case of heat capacity, the maximum value decreased with the distance from the critical temperature, while its peak shifted to the region of higher pressures (see Figure 7).
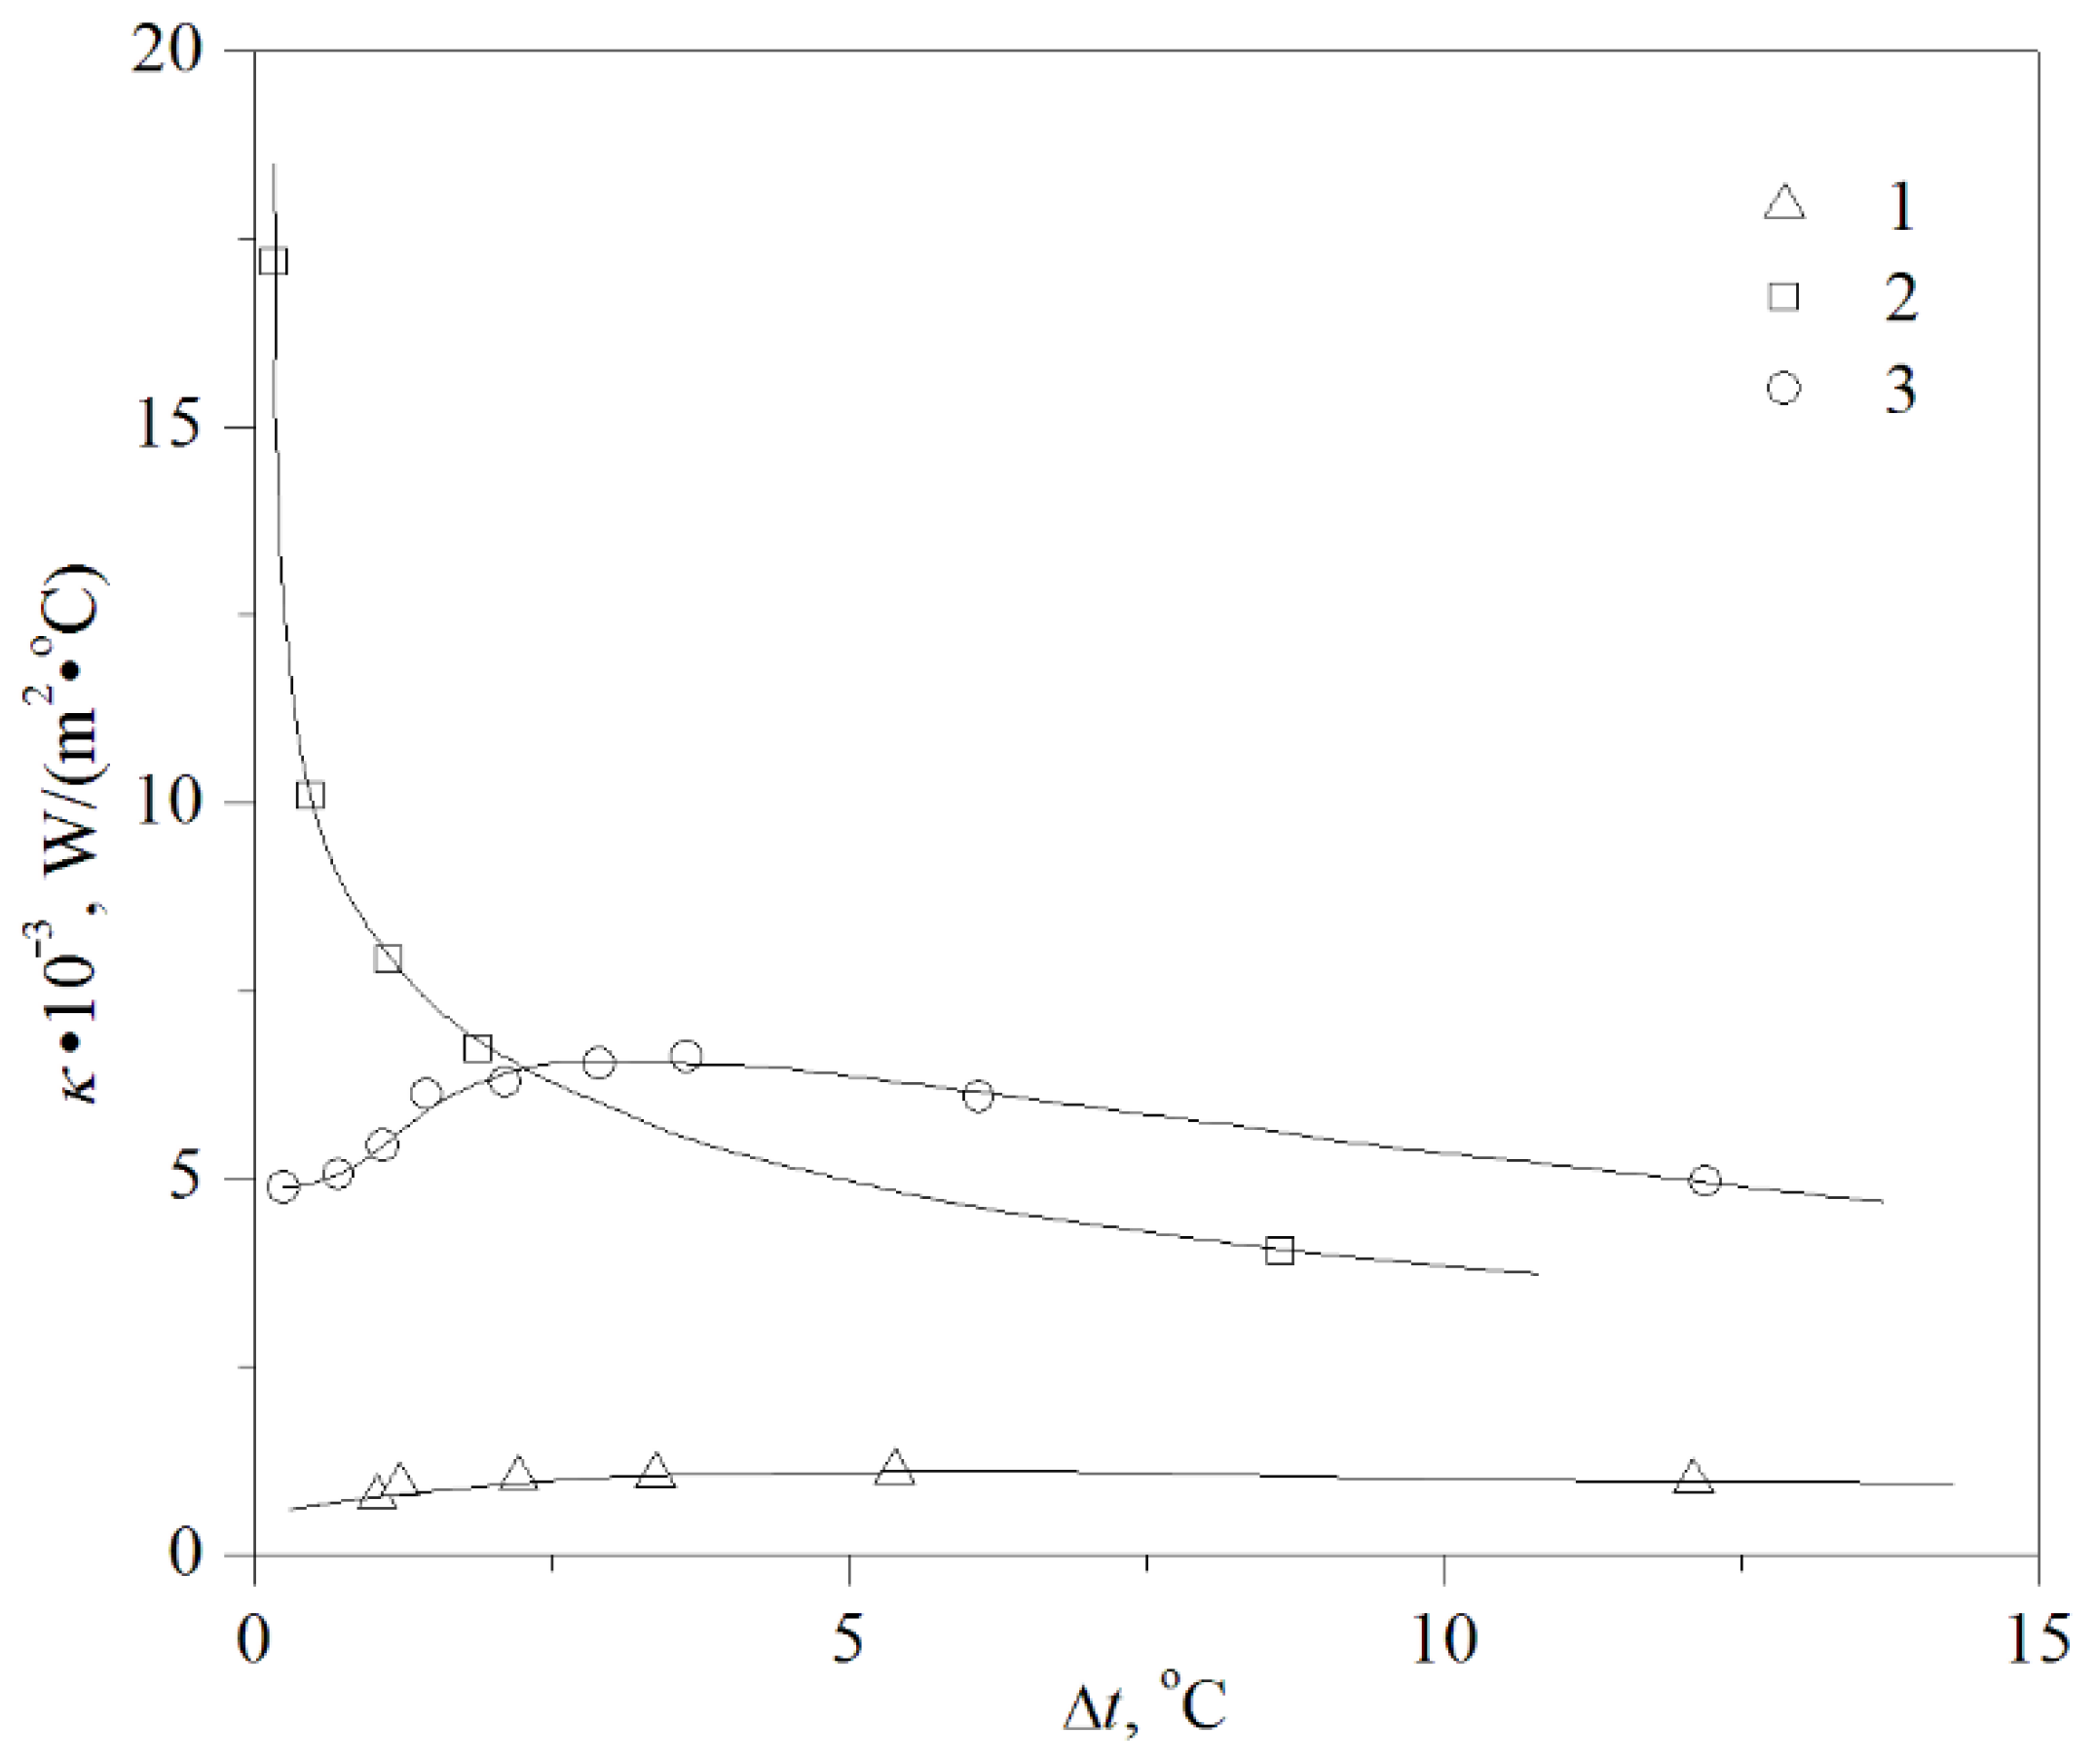
It would appear that the discovery of characteristic peaks of thermophysical properties will serve as a practical guide to the development of new areas for applying supercritical phenomena. At the same time, the specificity of supercritical heat transfer had already been revealed in the first work [20]. This manifested itself in the fact that an increase in the temperature increase, ΔT, at a constant temperature in the chamber was accompanied by a decrease in the heat transfer peak (see Figure 8) up to its complete “disappearance” [56].
This effect was observed for all values of the diameter and orientations of the probe in space. Within the framework of the phenomenological approach, this result was explained based on the structure of the criterion equation for free-convective heat transfer:
Nu = c(Pr·Gr)n, 0 < n < 1/3.
It turned out that the dependence, κ(p), is determined, first of all, by the factor (β∙cp∙ΔT)n. Obviously, with an increase in ΔT, the basic temperature to which the values of β and cp must be reduced also increases. However, the condition T’ > T0 (where T’—basic temperature, T0—temperature of the chamber) corresponds to the descending branch of the product β∙cp. Therefore, the value (β∙cp∙ΔT) will decrease with an increase in ΔT. As a result, the following contradiction was formed. While it is relatively easy to remove small heat fluxes, at which the heat transfer peak is relevant, the real problem lies in guaranteeing the removal of high-density heat fluxes.
3.4. Discussion of Variants of a Superheated Liquid Spinodal Position on the Phase Diagram of Water
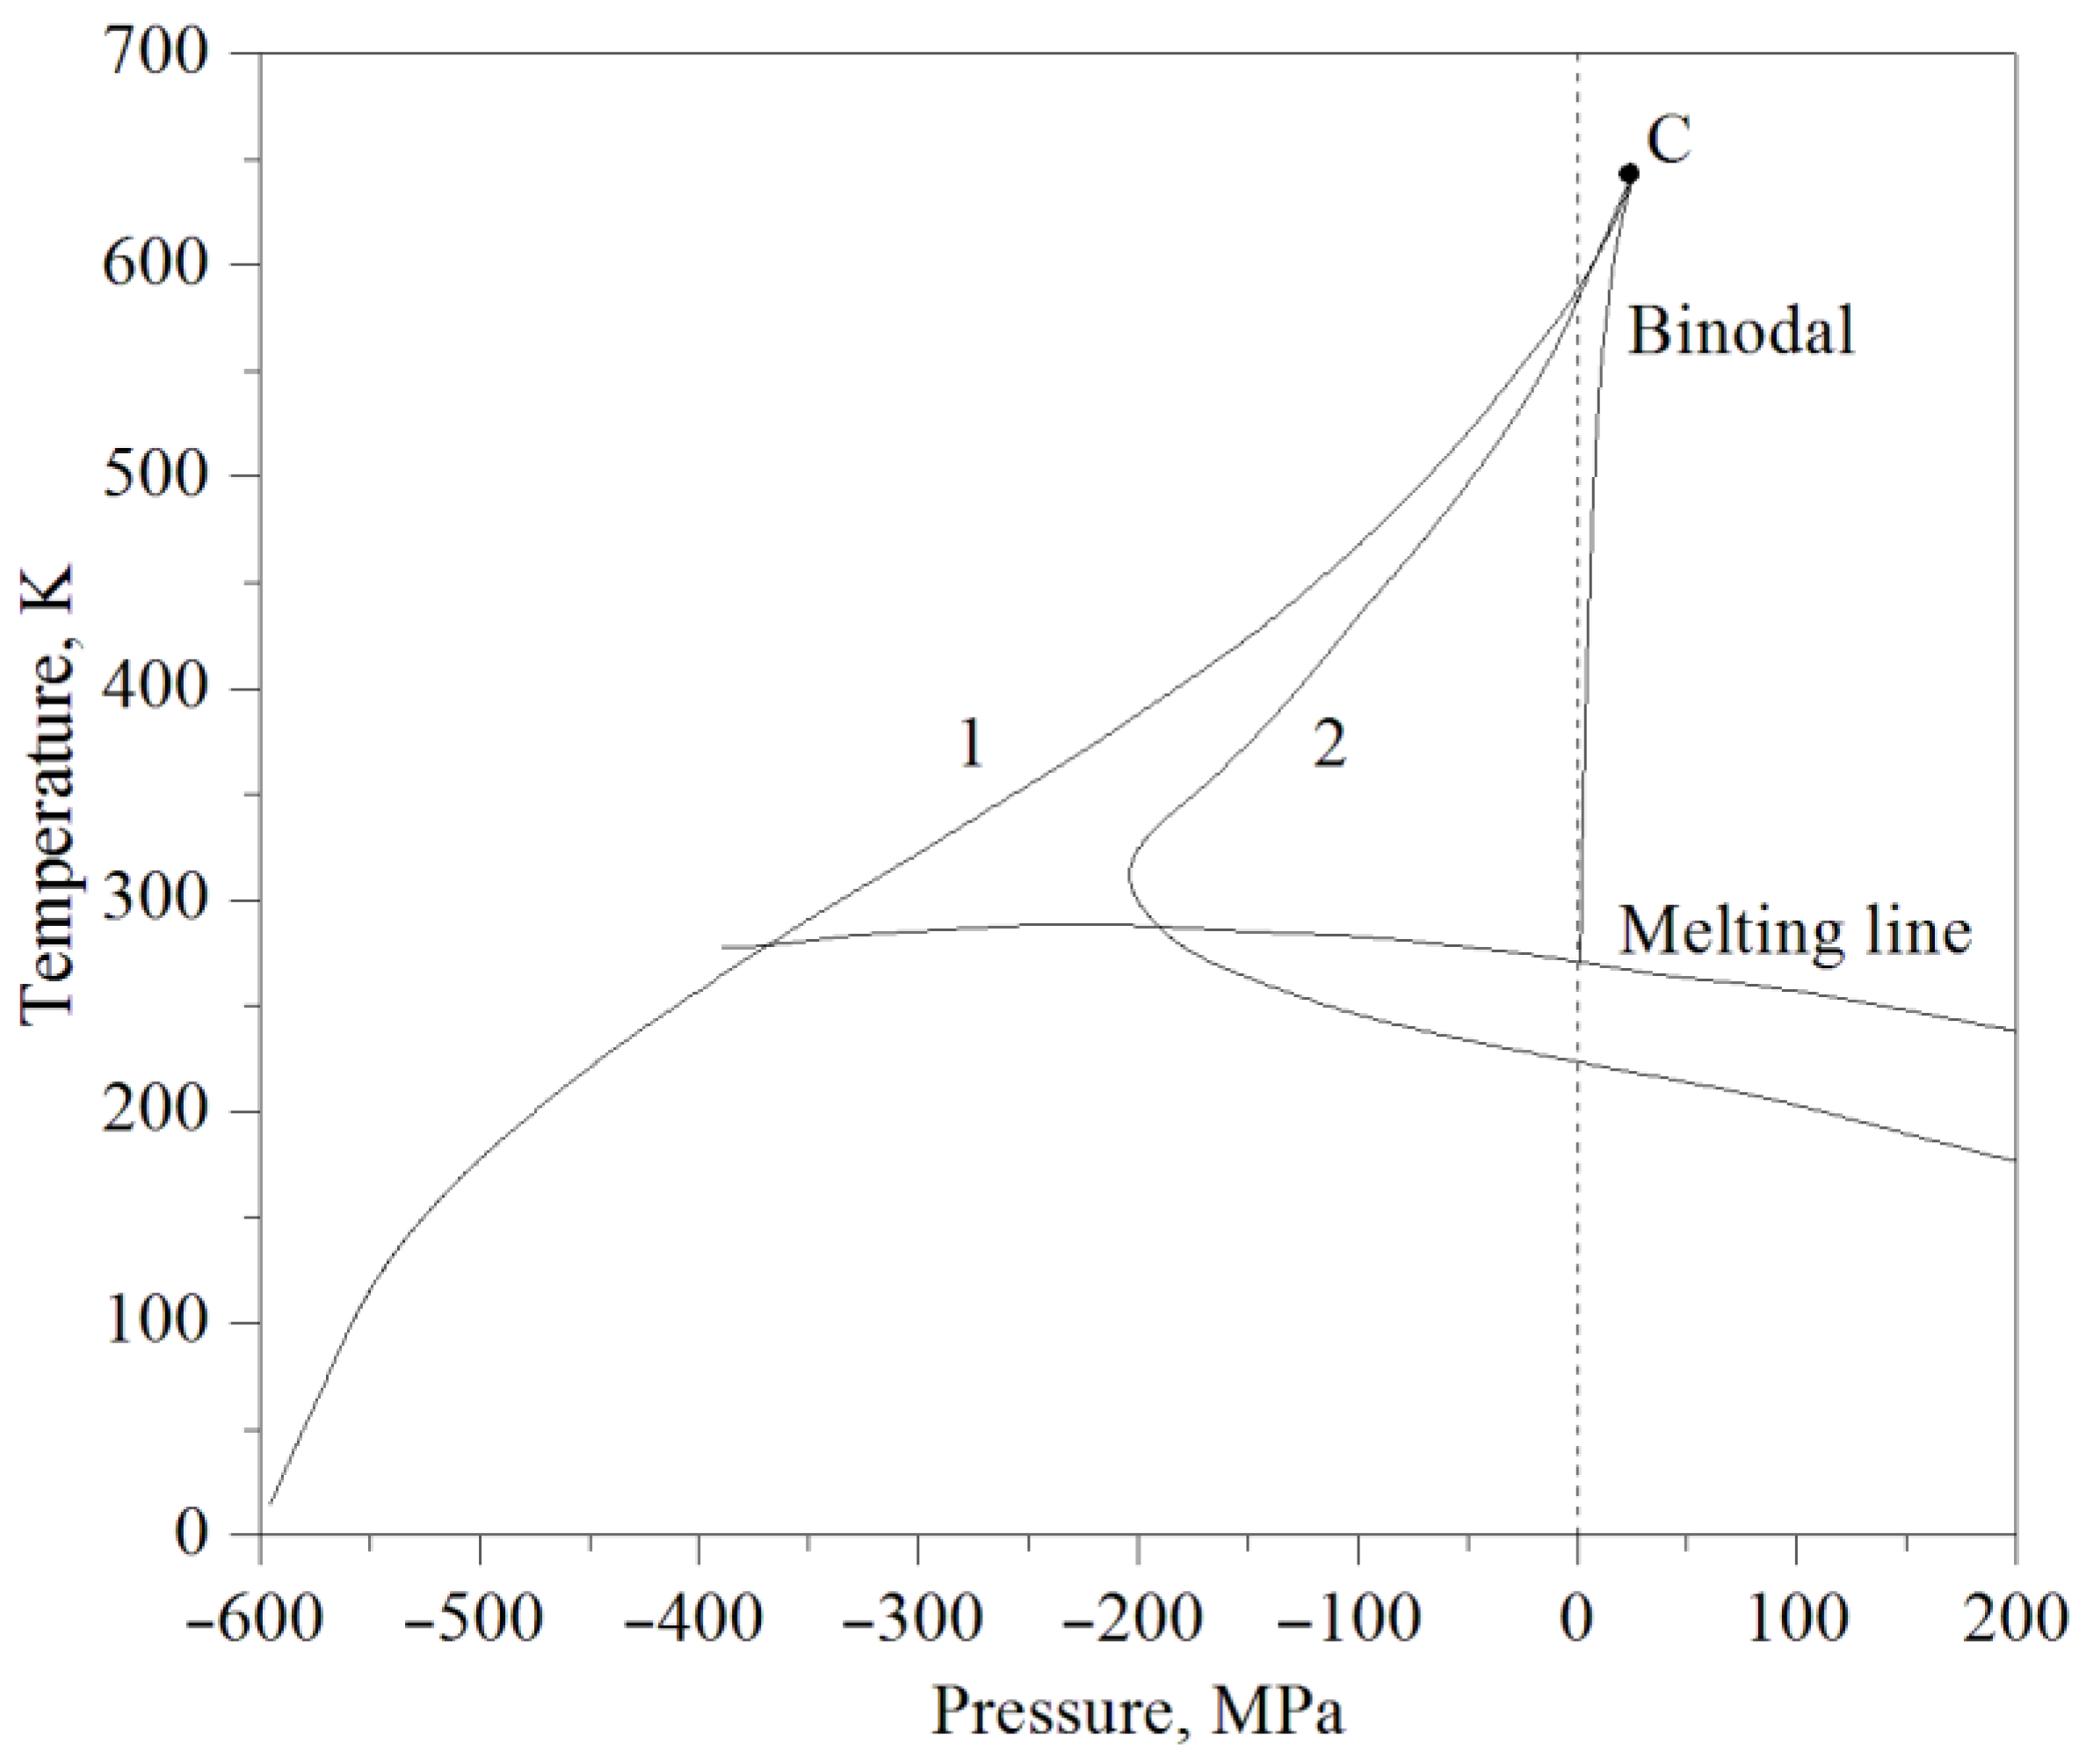
The article [21] considers two variants of the water spinodal behavior on the p, T phase diagram with decreasing temperature. While the traditional version involves the spinodal comprising a monotonic curve with a positive value (dp/dT)sp in the entire region of existence, the new version assumes the presence of a minimum in pressure at p < 0 and a return to the region p > 0, with a further decrease in temperature (see Figure 9). By now, this latter view has become generally accepted.
In [21], an analysis was carried out of the input experimental data (1–3), which served as the basis for a new version [57,58]. Here, in comparison with theoretical estimates, smaller attainable values of tensile stress are observed (consideration 1), the rotation of the spinodal as an envelope of isochores in the case of its meeting with the line of water density maxima on the isobars αp = (1/v)(∂v/∂T)p = 0, extended into the region p < 0, see Figure 9 (2), and the increase in the heat capacity of water with p as the temperature decreases from 290 to 266 K, which is considered as a trace of the spinodal singularity (3).
The analysis concludes with the idea that the rational selection of an option implies an additional discussion of the problem. The discussion began by using thermodynamic relations to elucidate the properties of characteristic curves—in particular, the derivative (∂v/∂T)p—when approaching the spinodal, Equations (4) and (5). Some ratios are reproduced below:
(∂v/∂T)p = (∂p/∂T)v/[−(∂p/∂v)T]
(∂v/∂T)p → ∞
dp/dTsp = (∂p/∂T)v
The line αp = 0, due to the condition (7),
serves as the envelope of the families of isotherms on the p, v plane. With the exception of the critical point, the entire spinodal belongs to the limiting metastable states. The thermodynamic description of such states acquires a conditionally asymptotic character. As discussed above, the main emphasis is on the analysis of assumption (2).
(∂v/∂T)p = 0
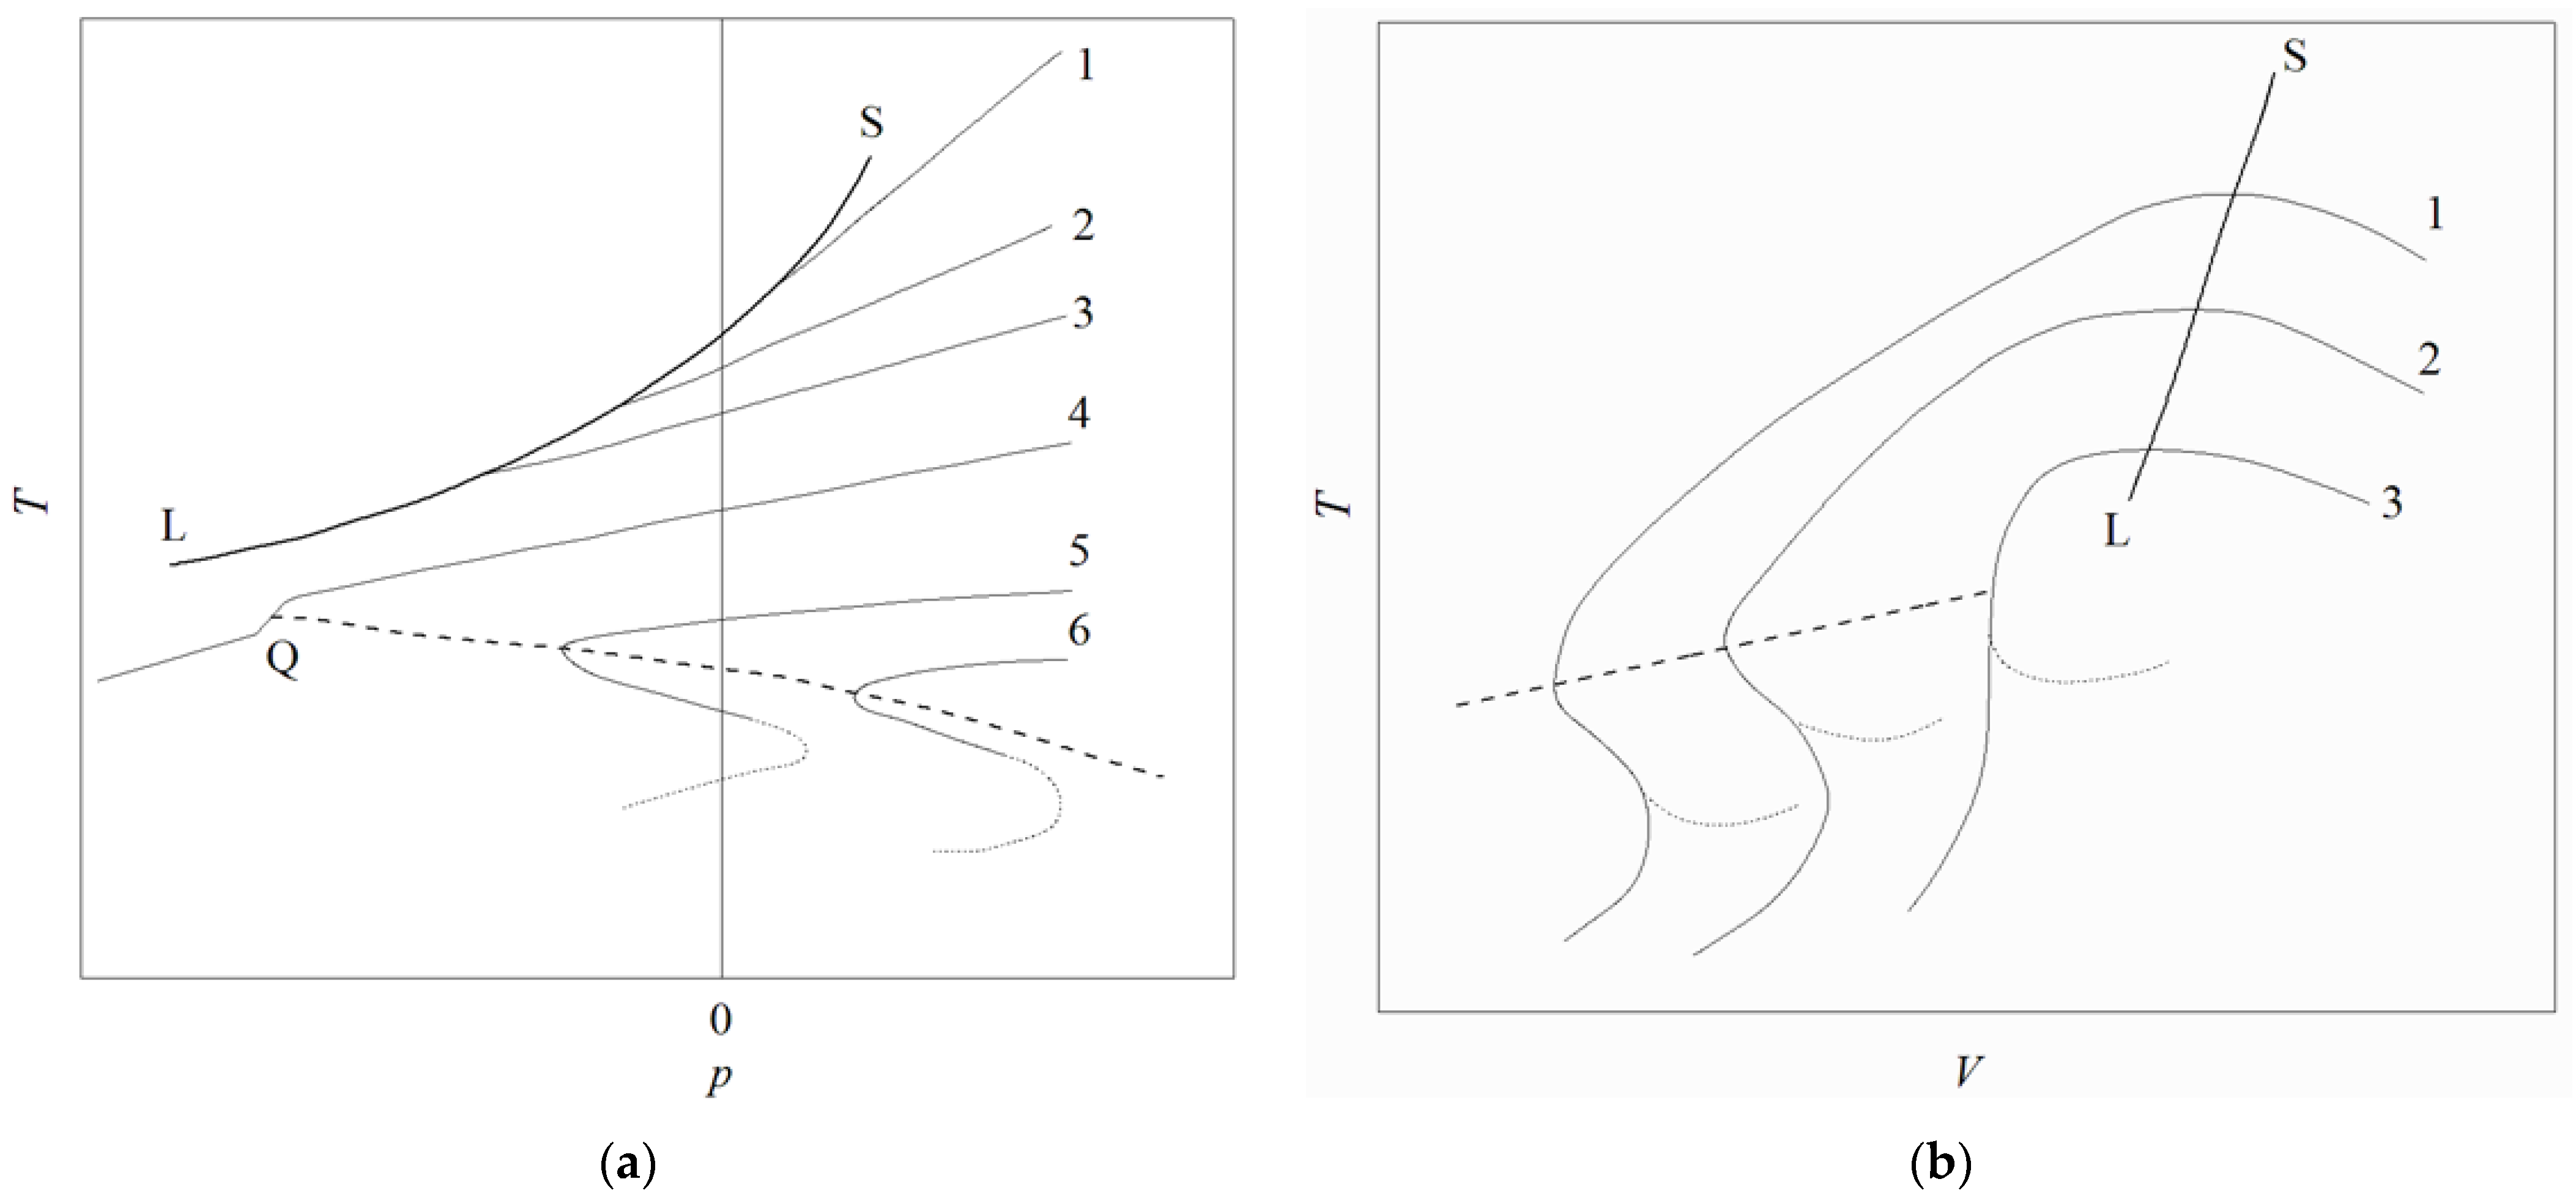
Based on ratios (4–7), the type of isobar near the line αp = 0 for the usual (v1 > v2 > v3) behavior is qualitatively depicted in Figure 10a. As shown in Figure 9, if the convergence of the line αp = 0 and the spinodal leads to the appearance of a common point, then the spinodal must change direction after their supposed intersection to fulfill condition (6). However, a contradictory requirement then arises when explaining the behavior of the derivative (∂v/∂T)p when approaching a common point. Indeed, on the line αp = 0, we have (∂v/∂T)p = 0, while on the spinodal we have (∂v/∂T)p → ∞. It is concluded that a normal conjugation of the line αp = 0 and the spinodal is impossible. Here, it is assumed that the reaction of the system to the approach to the spinodal, which can be considered as the strongest, suppresses the structural changes in water, leading to the appearance of a minimum of the specific volume on the isobars. For example, an inflection point appearing instead of a minimum on an isobar serves as a termination point for the line αp = 0, even before it meets the spinodal. Such a case is presented schematically in Figure 10b. On the p3 isobar, the line αp = 0 has a termination point. The branching of isobars in Figure 10b corresponds to two scenarios of spinodal behavior. Spinodal rotation (see Figure 9) corresponds to the isobar branches marked with dots. The continuation of the isobars by a solid line is consistent with the monotonic continuation of the spinodal into the region of low temperatures and negative pressures. From the analysis of the possibility of a temperature maximum on the line αp = 0, it was concluded that this line cannot avoid meeting the spinodal if it does not have a termination point. A similar discussion carried out for other considerations (1, 3) inclines in favor of the non-Van der Waals behavior of the water spinodal. As a result of the discussion, it is emphasized that current knowledge about supercooled (stretched) water properties does not allow us to confidently choose one of the scenarios for the behavior of the spinodal. Nevertheless, the author of [21] prefers the monotonic version presented in Figure 9, which was built according to previously published data (range from Tc to 280 °C), using the Furth equation [59] (range from 280 to 0 °C) and arbitrary extrapolation to lower temperatures. For T → 0, a Van der Waals limit of psp = −27 pc was adopted.
4. Conclusions
Based on the primary experimental data, a review of the early works of Vladimir P. Skripov was presented. Due to lying outside the “metastable field”, comprising the main object of Skripov’s research, these works remained obscure to the scientific community. Due to the significant reserve of capabilities of the devices and methods proposed in these works, they were lately developed at the Ural Thermophysical School. In particular, a variant of the light scattering method was applied to the systematic study of liquid–liquid phase diagrams. The objects were solutions with both UCST and LCST in a wide range of pressure changes [13]. The quasi-static study of solutions with LCST was supplemented by experiments carried out under conditions of powerful local heat release. As a result, the phenomenon of superheating of solutions with respect to the liquid–liquid equilibrium line and the liquid–liquid spinodal was involved in the study [60]. A significant heat transfer enhancement accompanying the spinodal decomposition of an unstable solution was demonstrated [61]. This effect can be used in problems of removal of high-density heat fluxes. The elaborate choice of the heating power variation as a function of time has enabled us to develop the technique for searching for the upper branch of the diffusion spinodal of solutions with LCST and to test this technique for the above-mentioned TEA-water system.
Miniaturization of the optical cell and radiation source (optical fiber with a core diameter of 9 μm, introduced into the capillary of the bubble chamber with a diameter of 1 mm) allowed the initial stage of the liquid–vapor phase transition to be studied. The revealed propagating jump in the density of a superheated liquid that accompanies the onset of boiling-up [62] manifested itself in both spontaneous and activated phase transitions [63]. Presumably, for the first time in the practice of thermophysical experiments, the growth rate of a vapor bubble at the end face of a quartz fiber was traced through the very first microseconds of vapor phase nucleation in a uniformly superheated liquid (Figure 1d).
Pulsed modifications of the developed method for heating a thin wire probe have found application in problems of attainable superheating and stretching of liquids [64,65], as well as in determining the critical parameters of thermally unstable liquids [66,67]. The most advanced version [68] performs the function of electronic control of the heat release power in the wire probe directly during the pulse. This has been applied to study supercritical heat transfer [69] and heat transfer to superheated binary fluids [70] on the scale of small characteristic times and sizes.
Funding
This study was supported by the Russian Science Foundation (project No. 19-19-00115-P).
Institutional Review Board Statement
Not applicable.
Informed Consent Statement
Not applicable.
Data Availability Statement
The study did not report any data.
Acknowledgments
The author is grateful to S.B. Rutin, D.V. Antonov, A.A. Starostin, and A.V. Reshetnikov, who provided photographs (Figure 1b–e) from personal archives. Graphical abstract was created by Andrey Chernyshev.
Conflicts of Interest
The author declares no conflict of interest.
Notations
| C | heat capacity |
| cp | specific isobaric heat capacity |
| c | concentration |
| Gr | Grashof number |
| I | current |
| I΄ | intensity of the scattered light |
| Nu | Nusselt number |
| p | pressure |
| Pr | Prandtl number |
| t | time |
| T | temperature |
| ΔT | temperature rise |
| U | voltage drop |
| V | volume |
| v | specific volume |
| β | volume expansion coefficient |
| κ | heat transfer coefficient |
| λ | wavelength |
| μ | chemical potential |
| Symbols | |
| c | critical point |
| ll | liquid–liquid equilibrium |
| s | liquid–vapor equilibrium |
| sp | spinodal |
| Abbreviations | |
| LCST | lower critical solution temperature |
| TEA | triethylamine |
| UCST | upper critical solution temperature |
References
- Chen, L. Handbook of Research on Advancements in Supercritical Fluids Applications for Sustainable Energy Systems; IGI Global: Hershey, PA, USA, 2020. [Google Scholar]
- Smakulski, P.; Pietrowicz, S. A review of the capabilities of high heat flux removal by porous materials, microchannels and spray cooling techniques. Appl. Therm. Eng. 2016, 104, 636–646. [Google Scholar] [CrossRef]
- Rashidi, S.; Karimi, N.; Sunden, B.; Mahian, O.; Harmand, S. Passive techniques to enhance heat transfer in various thermal systems. J. Therm. Anal. Calorim. 2020, 140, 875–878. [Google Scholar] [CrossRef]
- Pavlenko, A.N.; Kuznetsov, D.V. Development of Methods for Heat Transfer Enhancement During Nitrogen Boiling to Ensure Stabilization of HTS Devices. J. Eng. Thermophys. 2021, 30, 526–562. [Google Scholar] [CrossRef]
- Abdulagatov, I.M.; Skripov, P.V. Thermodynamic and Transport Properties of Supercritical Fluids. Part 2: Review of Transport Properties. Russ. J. Phys. Chem. B 2021, 15, 1171–1188. [Google Scholar] [CrossRef]
- Anisimov, M.A. Letter to the Editor: Fifty Years of Breakthrough Discoveries in Fluid Criticality. Int. J. Thermophys. 2011, 32, 2001–2009. [Google Scholar] [CrossRef] [Green Version]
- Michels, A.; Sengers, J.V. The Thermal Conductivity of Carbon Dioxide in the Critical Region: III. Verification of the Absence of Convection. Physica 1962, 28, 1238–1264. [Google Scholar] [CrossRef]
- Nieto de Castro, C.A.; Lourenço, M.J.V. Towards the Correct Measurement of Thermal Conductivity of Ionic Melts and Nanofluids. Energies 2020, 13, 99. [Google Scholar] [CrossRef] [Green Version]
- Debenedetti, P.G. Metastable Liquids: Concepts and Principles; Princeton University Press: Princeton, NJ, USA, 1996. [Google Scholar]
- Skripov, V.P. Metastable Liquids; Halsted Press: Sydney, Australia; John Wiley & Sons: New York, NY, USA, 1974. [Google Scholar]
- Skripov, V.P.; Koverda, V.P. Spontaneous Crystallization of Undercooled Liquids; Nauka: Moscow, Russia, 1984. (In Russian) [Google Scholar]
- Skripov, V.P.; Sinitsyn, E.N.; Pavlov, P.A.; Ermakov, G.V.; Muratov, G.N.; Bulanov, N.V.; Baidakov, V.G. Thermophysical Properties of Liquids in the Metastable (Superheated) State; Gordon and Breach Science Publishers: London, UK, 1988. [Google Scholar]
- Skripov, V.P.; Faizullin, M.Z. Crystal–Liquid–Gas Phase Transitions and Thermodynamic Similarity; Wiley–VCH Verlag GmbH & Co. KGaA: Weinheim, Germany, 2006. [Google Scholar]
- Skripov, V.P. High-Power Homogeneous nucleation in melts and amorphous films, Current topics in material science. In Crystal Growth and Materials; Chapter 10; Kalidas, E., Scheel, H., Eds.; North-Holland Publ. Co.: Amsterdam, The Netherlands, 1977; pp. 327–378. [Google Scholar]
- Skripov, V.P. Metastable States. J. Non-Equilib. Thermodyn. 1992, 17, 193–236. [Google Scholar]
- Skripov, P.V.; Skripov, A.P. The Phenomenon of Superheat of Liquids: In Memory of Vladimir P. Skripov. Int. J. Thermophys. 2010, 31, 816–830. [Google Scholar] [CrossRef]
- Schmelzer, J.W.P. In remembrance of Vladimir P. Skripov: Some personal reflections. Interfac. Phenom. Heat Transf. 2017, 5, IX–XVII. [Google Scholar] [CrossRef]
- Semenchenko, V.K.; Skripov, V.P. Second-Order Phase Transitions and Critical Phenomena. III. Heat capacity of liquid binary mixtures in the critical region of separation. Zhurnal Fiz. Khimii 1951, 25, 362–368. (In Russian) [Google Scholar]
- Skripov, V.P.; Kolpakov, Y.D. Light Scattering in carbon dioxide along subcritical and supercritical isotherms. In Critical Phenomena and Fluctuations in Solutions; Shakhparonov, M.I., Ed.; AS USSR: Moscow, Russia, 1960; pp. 126–136. (In Russian) [Google Scholar]
- Skripov, V.P.; Potashev, P.P. Convection and Heat Exchange near the Critical Point of Carbon Dioxide. Zhurnal Prikl. Mekhaniki Tekhnicheskoi Fiz. 1962, 5, 30–34. (In Russian) [Google Scholar]
- Skripov, V.P. A phase diagram of water under negative pressures. High Temp. 1993, 31, 333–337. [Google Scholar]
- Kirillov, P.L.; Bogoslovskaya, G.P. Generation IV supercritical water-cooled nuclear reactors: Realistic prospects and research program. Nucl. Energy Technol. 2019, 5, 67–74. [Google Scholar] [CrossRef] [Green Version]
- Pioro, I.L. Supercritical-Fluids Thermophysical Properties and Heat Transfer in Power-Engineering Applications. In Advanced Supercritical Fluids Technologies; Chapter 1; Pioro, I.L., Ed.; IntechOpen: London, UK, 2020; pp. 1–41. [Google Scholar] [CrossRef] [Green Version]
- Ching, E.J.; Avedisian, C.T.; Carrier, M.J.; Cavicchi, R.E.; Young, J.R.; Land, B.R. Measurement of the bubble nucleation temperature of water on a pulse-heated thin platinum film supported by a membrane using a low-noise bridge circuit. Int. J. Heat Mass Transf. 2014, 79, 82–93. [Google Scholar] [CrossRef]
- Xing, W.; Vutha, A.K.; Yu, X.; Ullmann, A.; Brauner, N.; Peles, Y. Liquid/liquid phase separation heat transfer at the microscale. Int. J. Heat Mass Transf. 2017, 107, 53–65. [Google Scholar] [CrossRef]
- Kraemer, T. Printing enters the jet age. Invent. Technol. 2001, 16, 18–27. [Google Scholar]
- Suh, J.; Cytrynowicz, D.; Gerner, F.M.; Henderson, H.T. A MEMS bubble pump for an electronic cooling device. J. Micromech. Microeng. 2010, 20, 125025. [Google Scholar] [CrossRef]
- Antonov, D.V.; Kuznetsov, G.V.; Strizhak, P.A.; Rybdylova, O.; Sazhin, S.S. Micro-explosion and autoignition of composite fuel/water droplets. Combust. Flame 2019, 210, 479–489. [Google Scholar] [CrossRef]
- Antonov, D.V.; Strizhak, P.A. Intensification of Vaporization and Secondary Atomization of Droplets of Fire-Extinguishing Liquid Composition. Tech. Phys. Lett. 2020, 46, 122–125. [Google Scholar] [CrossRef]
- George, S.D.; Chidangil, S.; Mathur, D. Minireview: Laser-Induced Formation of Microbubbles—Biomedical Implications. Langmuir 2019, 35, 10139–10150. [Google Scholar] [CrossRef] [PubMed]
- Chudnovskii, V.; Mayor, A.; Kiselev, A.; Yusupov, V. Foaming of blood in endovenous laser treatment. Lasers Med. Sci. 2018, 33, 1821–1826. [Google Scholar] [CrossRef] [PubMed]
- Xing, W.; Ullmann, A.; Brauner, N.; Plawsky, J.; Peles, Y. Advancing micro-scale cooling by utilizing liquid-liquid phase separation. Sci. Rep. 2018, 8, 12093. [Google Scholar] [CrossRef] [PubMed]
- Kuznetsov, V.V.; Shamirzaev, A.S.; Mordovskoy, A.S. Prospects for using two-phase micro-size systems for high heat flux removal. J. Phys. Conf. Ser. 2021, 2057, 012058. [Google Scholar] [CrossRef]
- Antonov, D.V.; Kuznetsov, G.V.; Fedorenko, R.M.; Strizhak, P.A. Ratio of water/fuel concentration in a group of composite droplets on high-temperature heating. Appl. Therm. Eng. 2022, 206, 118107. [Google Scholar] [CrossRef]
- Lexin, M.A.; Yagov, V.V.; Zabirov, A.R.; Kanin, P.K.; Vinogradov, M.M.; Molotova, I.A. Investigation of Intensive Cooling of High-Temperature Bodies in BinaryWater-Isopropanol Mixture. High Temp. 2020, 58, 369–376. [Google Scholar] [CrossRef]
- Semenchenko, V.K. Second-Order Phase Transitions and Critical Phenomena. Zhurnal Fiz. Khimii 1947, 21, 1461–1469. (In Russian) [Google Scholar]
- Imre, A.R.; Kraska, T. Stability limits in binary fluids mixtures. J. Chem. Phys. 2005, 122, 064507. [Google Scholar] [CrossRef]
- Igolnikov, A.A.; Rutin, S.B.; Skripov, P.V. Short-term measurements in thermally-induced unstable states of mixtures with LCST. Thermochim. Acta 2021, 695, 178815. [Google Scholar] [CrossRef]
- Skripov, V.P.; Skripov, A.V. Spinodal decomposition (phase transitions via unstable states). Sov. Phys. Usp. 1979, 22, 389–410. [Google Scholar] [CrossRef]
- Pittois, S.; Van Roie, B.; Glorieux, C.; Thoen, J. Thermal conductivity, thermal effusivity, and specific heat capacity near the lower critical point of the binary liquid mixture n-butoxyethanol–water. J. Chem. Phys. 2004, 121, 1866–1872. [Google Scholar] [CrossRef] [PubMed]
- Skripov, V.P. Heat Capacity of Liquid Binary Mixtures in the Critical Region of Demixing. Ph.D. Thesis, Moscow State University, Moscow, Russia, 1953. Available online: https://disk.yandex.ru/i/-GmlJ1l5OErrjQ (accessed on 15 June 2022). (In Russian).
- Skripov, V.P.; Semenchenko, V.K. Second-Order Phase Transitions and Critical Phenomena. V. On the maximum of heat capacity in the critical region of separation of binary liquid systems. Zhurnal Fiz. Khimii 1955, 29, 174–184. (In Russian) [Google Scholar]
- Ivanov, D.Y. Critical Behavior of Nonideal Systems; WILEY-VCH Verlag GmbH & Co: Weinheim, Germany, 2008. [Google Scholar]
- Levelt Sengers, J.M.H. Critical Exponents at the Turn of the Century. Physica A 1976, 82, 319–351. [Google Scholar] [CrossRef]
- Skripov, V.P.; Kolpakov, Y.D. Light Scattering in the Vicinity of the Critical Point Liquid-Vapor. I. Experimental Equipment. Opt. Spectrosc. 1965, 19, 392–402. (In Russian) [Google Scholar]
- Skripov, V.P.; Kolpakov, Y.D. Light Scattering in the Vicinity of the Critical Point Liquid-Vapor. II. Breakdown of the Rayleigh Scattering Law. Opt. Spectrosc. 1965, 19, 616–622. (In Russian) [Google Scholar]
- Kolpakov, Y.D. Scattering of Light by Carbon Dioxide and Sulfur Hexafluoride in the Vicinity of the Critical Point. Ph.D. Thesis, Ural Polytechnic Institute, Sverdlovsk, Russia, 1965. (In Russian). [Google Scholar]
- Michels, A.; Sengers, J.V.; van der Gulik, P.S. The Thermal Conductivity of Carbon Dioxide in the Critical Region: II. Measurements and Conclusions. Physica 1962, 28, 1216–1237. [Google Scholar] [CrossRef]
- Abdulagatov, I.M.; Skripov, P.V. Thermodynamic and Transport Properties of Supercritical Fluids. Part 1: Review of Thermodynamic Properties. Russ. J. Phys. Chem. B 2020, 14, 1178–1216. [Google Scholar] [CrossRef]
- Krichevskiy, I.R. Decision of the meeting on Critical Phenomena and Fluctuations in Solutions. In Critical Phenomena and Fluctuations in Solutions; Shakhparonov, M.I., Ed.; AS USSR: Moscow, Russia, 1960; pp. 189–191. (In Russian) [Google Scholar]
- Green, M.S. Introduction. In Proceedings of “Phenomena in the Neighbourhood of Critical Points”; Green, M.S., Sengers, J.V., Eds.; NBS Miscellaneous Publications: Washington, DC, USA, 1966; p. IX. [Google Scholar]
- Skripov, P.V.; Rutin, S.B. Features of supercritical heat transfer at short times and small sizes. Int. J. Thermophys. 2021, 42, 110. [Google Scholar] [CrossRef]
- Dubrovina, E.N.; Skripov, V.P. Convection and Heat Exchange near the Critical Point of Carbon Dioxide. Zhurnal Prikl. Mekhaniki Tekhnicheskoi Fiz. 1965, 1, 115–119. (In Russian) [Google Scholar]
- Dubrovina, E.N.; Skripov, V.P. Free-convective heat exchange with sulfur hexafluoride in the supercritical region. Zhurnal Prikl. Mekhaniki Tekhnicheskoi Fiz. 1969, 5, 152–155. (In Russian) [Google Scholar] [CrossRef]
- Schmidt, E. Warmetransport Durch Naturliche Konvektion in Stoffen bei Kritischem Zustand. Int. J. Heat Mass Transf. 1960, 1, 92–101. [Google Scholar] [CrossRef]
- Rutin, S.B.; Igolnikov, A.A.; Skripov, P.V. High-Power Heat Release in Supercritical Water: Insight into the Heat Transfer Deterioration Problem. J. Eng. Thermophys. 2020, 29, 67–74. [Google Scholar] [CrossRef]
- Speedy, R.J. Stability-limit conjecture. An interpretation of the properties of water. J. Phys. Chem. 1982, 86, 982–991. [Google Scholar] [CrossRef]
- Angell, C.A. Supercooled water. Ann. Rev. Phys. Chem. 1983, 34, 593. [Google Scholar] [CrossRef]
- Furth, R. On the theory of the liquid state: I. The statistical treatment of the thermodynamics of liquids by the theory of holes. Proc. Cambr. Philos. Soc. 1941, 37, 252–275. [Google Scholar] [CrossRef]
- Skripov, P.V.; Igolnikov, A.A.; Rutin, S.B.; Melkikh, A.V. Heat transfer by unstable solution having the lower critical solution temperature. Int. J. Heat Mass Transf. 2022, 184, 122290. [Google Scholar] [CrossRef]
- Gurashkin, A.L.; Starostin, A.A.; Ermakov, G.V.; Skripov, P.V. Communication: High speed optical investigations of a character of boiling-up onset. J. Chem. Phys. 2012, 136, 021102. [Google Scholar] [CrossRef]
- Gurashkin, A.L.; Starostin, A.A.; Skripov, P.V. Spontaneous Boiling-Up Onset: Activation Effect of Laser Pulses. J. Eng. Thermophys. 2021, 30, 51–57. [Google Scholar] [CrossRef]
- Skripov, P.V.; Smotritskii, A.A.; Starostin, A.A.; Shishkin, A.V. A method of controlled pulse heating: Applications. J. Eng. Thermophys. 2007, 16, 155. [Google Scholar] [CrossRef]
- Rutin, S.B.; Galkin, D.A.; Skripov, P.V. Investigation of not fully stable fluids by the method of controlled pulse heating. 3. Attainable superheat of solutions with different types of critical curve. Thermochim. Acta 2017, 651, 47–52. [Google Scholar] [CrossRef]
- Skripov, V.P.; Vinogradov, V.E. Kinetic Aspect of the Life of Tensile Specimens: A Comparison of Two Approaches. J. Appl. Mech. Tech. Phys. 2005, 46, 100–105. [Google Scholar] [CrossRef]
- Nikitin, E.D.; Popov, A.P.; Bogatishcheva, N.S.; Faizullin, M.Z. Critical Temperatures, Pressures, Heat Capacities, and Thermal Diffusivities of C3 to C6 Dinitriles. J. Chem. Eng. Data 2022, 67, 836–845. [Google Scholar] [CrossRef]
- Igolnikov, A.A.; Rutin, S.B.; Skripov, P.V. Short-term comparison of heat conduction and critical parameters for thermally unstable mixtures. AIP Conf. Proc. 2019, 2174, 020104. [Google Scholar]
- Rutin, S.B. Voltage-controlled precision electronic power regulator. Rev. Sci. Instrum. 2021, 92, 124708. [Google Scholar] [CrossRef] [PubMed]
- Rutin, S.B.; Igolnikov, A.A.; Skripov, P.V. Study of heat transfer to supercritical pressure water across a wide range of parameters in pulse heating experiments. Appl. Therm. Eng. 2022, 201, 117740. [Google Scholar] [CrossRef]
- Volosnikov, D.V.; Povolotskiy, I.I.; Skripov, P.V. Heat conduction of superheated mixtures: Relationship with excess volume. J. Eng. Thermophys. 2022, 31, 19–31. [Google Scholar]
Figure 1.
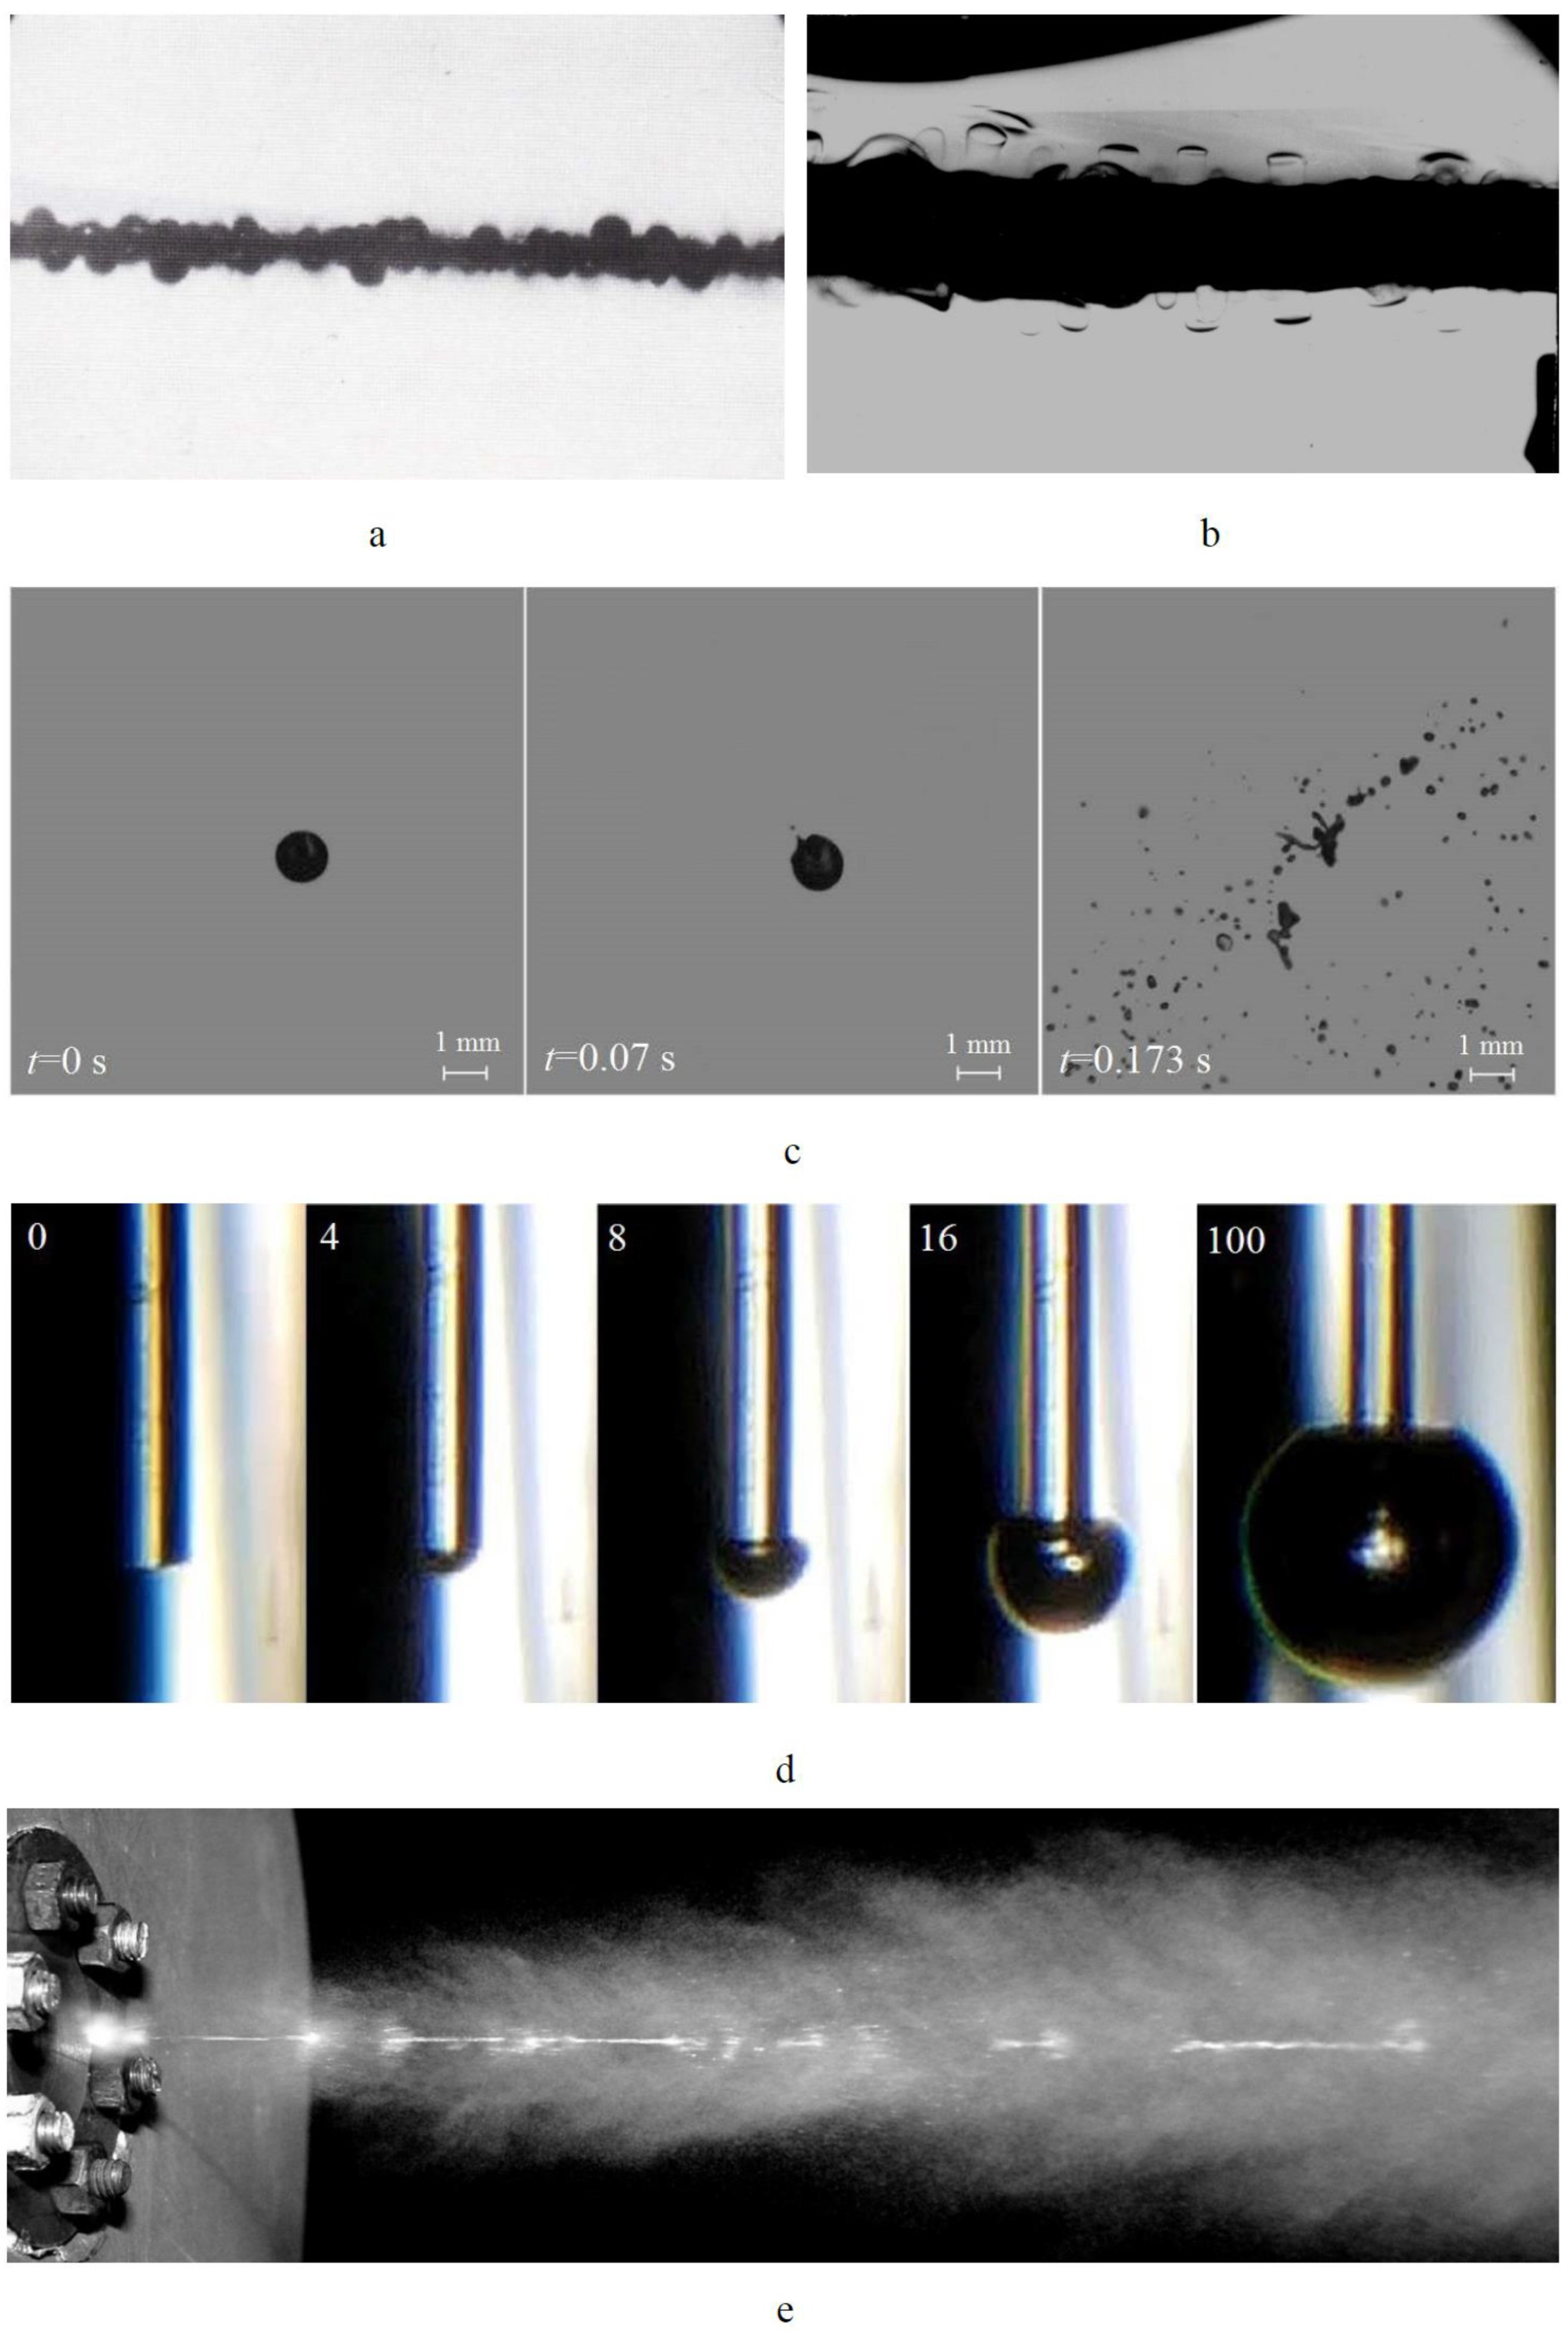
Examples of liquid superheating and its relaxation through spontaneous boiling-up for various processes: boiling-up of methyl methacrylate (a) and an aqueous solution of polypropylene glycol (b) on the pulsed heated wire probe (20 µm in diameter) at a characteristic time of 200 μs (a) and 1 ms (b). Boiling-up of a two-liquid (water/rapeseed oil) drop in an ethanol flame (c). Activation of a bubble at the end of the light guide (9 µm in diameter) in superheated, by 65 degrees (due to pressure drop), n-pentane (d). Here, the numbers show the duration of the delay in µs relative to the activation pulse with a length of 0.1 µs. Boiling-up of a jet of superheated water leaving a pressure vessel with a temperature of 160 °C through a short cylindrical channel (e).
Figure 1.
Examples of liquid superheating and its relaxation through spontaneous boiling-up for various processes: boiling-up of methyl methacrylate (a) and an aqueous solution of polypropylene glycol (b) on the pulsed heated wire probe (20 µm in diameter) at a characteristic time of 200 μs (a) and 1 ms (b). Boiling-up of a two-liquid (water/rapeseed oil) drop in an ethanol flame (c). Activation of a bubble at the end of the light guide (9 µm in diameter) in superheated, by 65 degrees (due to pressure drop), n-pentane (d). Here, the numbers show the duration of the delay in µs relative to the activation pulse with a length of 0.1 µs. Boiling-up of a jet of superheated water leaving a pressure vessel with a temperature of 160 °C through a short cylindrical channel (e).

Figure 2.
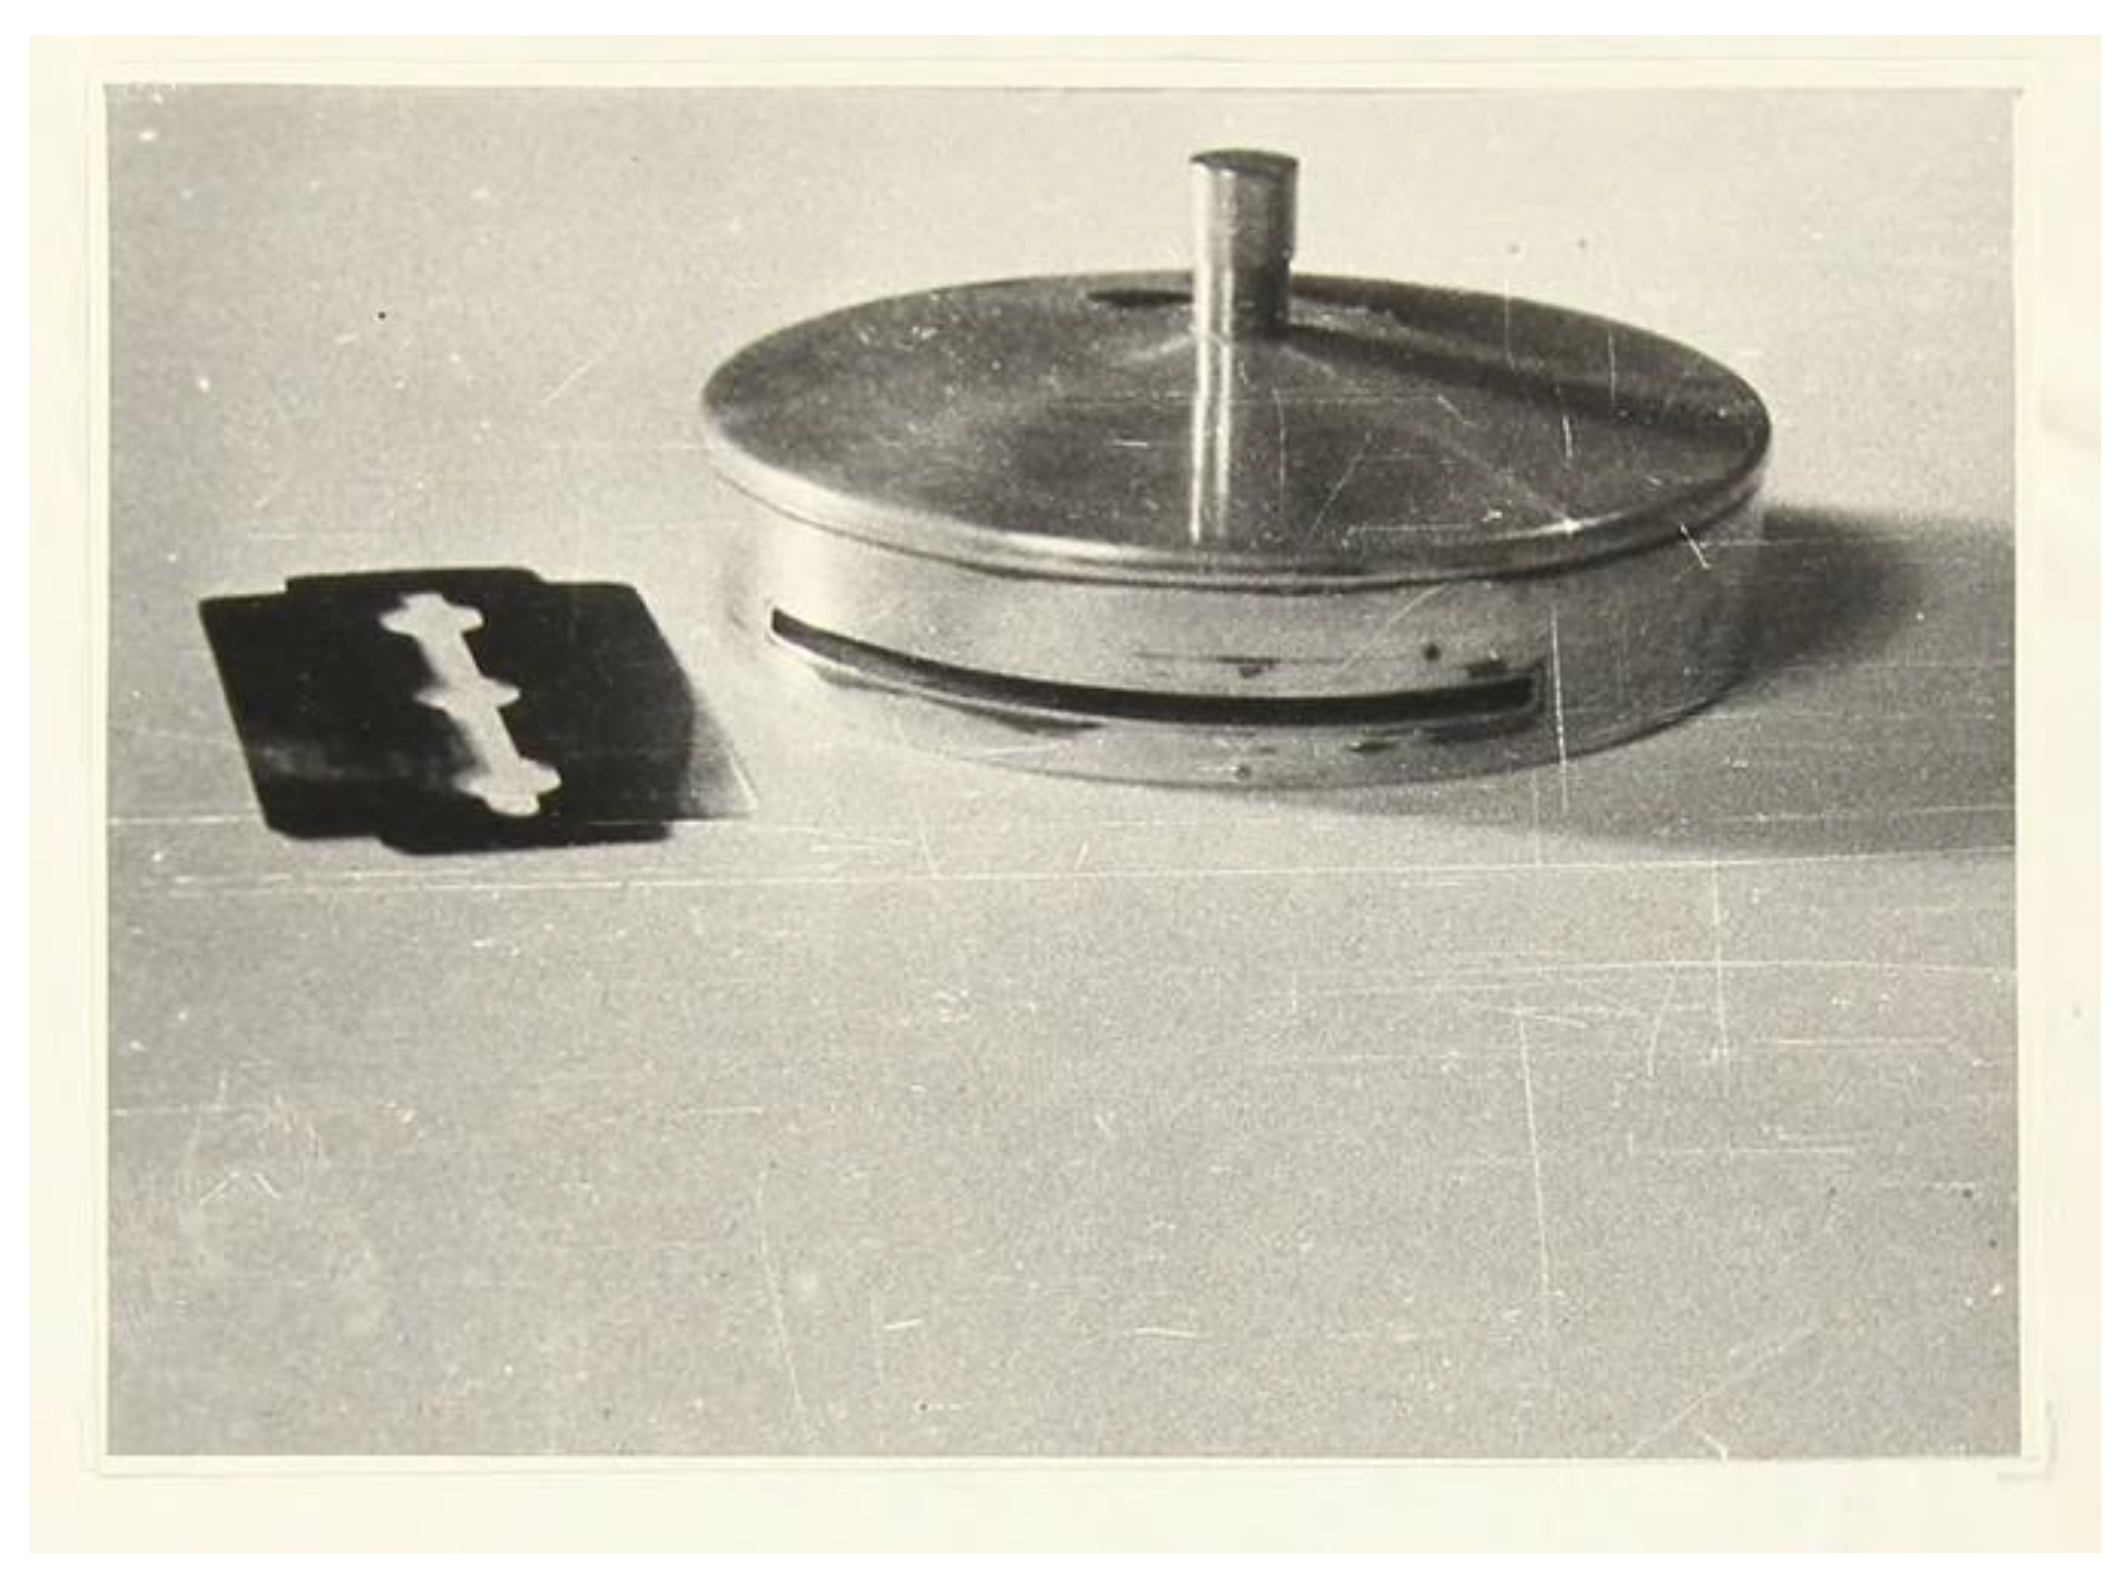
Photo of the body of the calorimeter designed for the measurements in the vicinity of a phase transition.
Figure 2.
Photo of the body of the calorimeter designed for the measurements in the vicinity of a phase transition.

Figure 3.
Heat capacity of triethylamine-water system. Experiments on 3 April (point 1) and 4 April (point 2) 1950 are presented.
Figure 3.
Heat capacity of triethylamine-water system. Experiments on 3 April (point 1) and 4 April (point 2) 1950 are presented.

Figure 4.
Scattering of light by carbon dioxide along the supercritical isotherm, expressed in mm of the galvanometer scale, at three wavelengths in Ǻ: 5461, 4358, and 4046. The bottom graph shows the intensity of the light passing through the cell I, reduced to that of the excitatory light I0. Here, T = 31.2 °C, T − Tc ≈ 0.2 °C.

Figure 5.
Correspondence of experimental data with Rayleigh’s law (2) on the example of the supercritical isotherm of carbon dioxide. Here, T = 31.91 °C, T − Tc ≈ 0.9 °C.
Figure 5.
Correspondence of experimental data with Rayleigh’s law (2) on the example of the supercritical isotherm of carbon dioxide. Here, T = 31.91 °C, T − Tc ≈ 0.9 °C.

Figure 6.
Photo of free convection of supercritical carbon dioxide on a wire probe at two values of the probe temperature increase: ΔT ≈ 1.2 °C (left) and 2.7 °C (right). Here, T = 34 °C, p = 8.17 MPa.
Figure 6.
Photo of free convection of supercritical carbon dioxide on a wire probe at two values of the probe temperature increase: ΔT ≈ 1.2 °C (left) and 2.7 °C (right). Here, T = 34 °C, p = 8.17 MPa.

Figure 7.
Dependence of the heat transfer coefficient to carbon dioxide on pressure along supercritical isotherms: 1—31.5 °C, 2—32.0 °C, 3—34.0 °C, 4—37.0 °C.
Figure 7.
Dependence of the heat transfer coefficient to carbon dioxide on pressure along supercritical isotherms: 1—31.5 °C, 2—32.0 °C, 3—34.0 °C, 4—37.0 °C.

Figure 8.
Dependence of the heat transfer coefficient on temperature difference along subcritical isobar (1) and supercritical isobars (2, 3) for carbon dioxide: 1—60 bar, 2—80 bar, and 3—93 bar. Here, T = 34.0 °C, orientation of the probe in space was horizontal.
Figure 8.
Dependence of the heat transfer coefficient on temperature difference along subcritical isobar (1) and supercritical isobars (2, 3) for carbon dioxide: 1—60 bar, 2—80 bar, and 3—93 bar. Here, T = 34.0 °C, orientation of the probe in space was horizontal.

Figure 9.
Phase diagram of water. Two suggested shapes of liquid–vapor spinodal (1 and 2) are shown. Here, C is the critical point.
Figure 9.
Phase diagram of water. Two suggested shapes of liquid–vapor spinodal (1 and 2) are shown. Here, C is the critical point.

Figure 10.
Fragment of the phase diagram of water. Isochores (1–6) near the spinodal SL, the line αp = 0 (dashed line), and the termination point of this line (Q) before it meets the spinodal are shown (a). Isobars (1–3), spinodal SL, and line αp = 0 (dashed line) with a termination point on isobar 3 are also shown (b).

Publisher’s Note: MDPI stays neutral with regard to jurisdictional claims in published maps and institutional affiliations. |
© 2022 by the author. Licensee MDPI, Basel, Switzerland. This article is an open access article distributed under the terms and conditions of the Creative Commons Attribution (CC BY) license (https://creativecommons.org/licenses/by/4.0/).
Share and Cite
MDPI and ACS Style
Skripov, P. Thermophysical Properties of Liquids in Not Fully Stable States—From the First Steps to the Current Trends. Energies 2022, 15, 4440. https://0-doi-org.brum.beds.ac.uk/10.3390/en15124440
AMA Style
Skripov P. Thermophysical Properties of Liquids in Not Fully Stable States—From the First Steps to the Current Trends. Energies. 2022; 15(12):4440. https://0-doi-org.brum.beds.ac.uk/10.3390/en15124440
Chicago/Turabian StyleSkripov, Pavel. 2022. "Thermophysical Properties of Liquids in Not Fully Stable States—From the First Steps to the Current Trends" Energies 15, no. 12: 4440. https://0-doi-org.brum.beds.ac.uk/10.3390/en15124440
Note that from the first issue of 2016, this journal uses article numbers instead of page numbers. See further details here.