
BelBuk System—Smart Logistics for Sustainable City Development in Terms of the Deficit of a Chemical Fertilizers


Abstract
:1. Introduction
2. Literature Review
2.1. Smart City Manufacturing
2.2. Smart Logistics
2.3. Sustainable City Manufacturing
2.4. Smart Agriculture
3. Materials and Methods
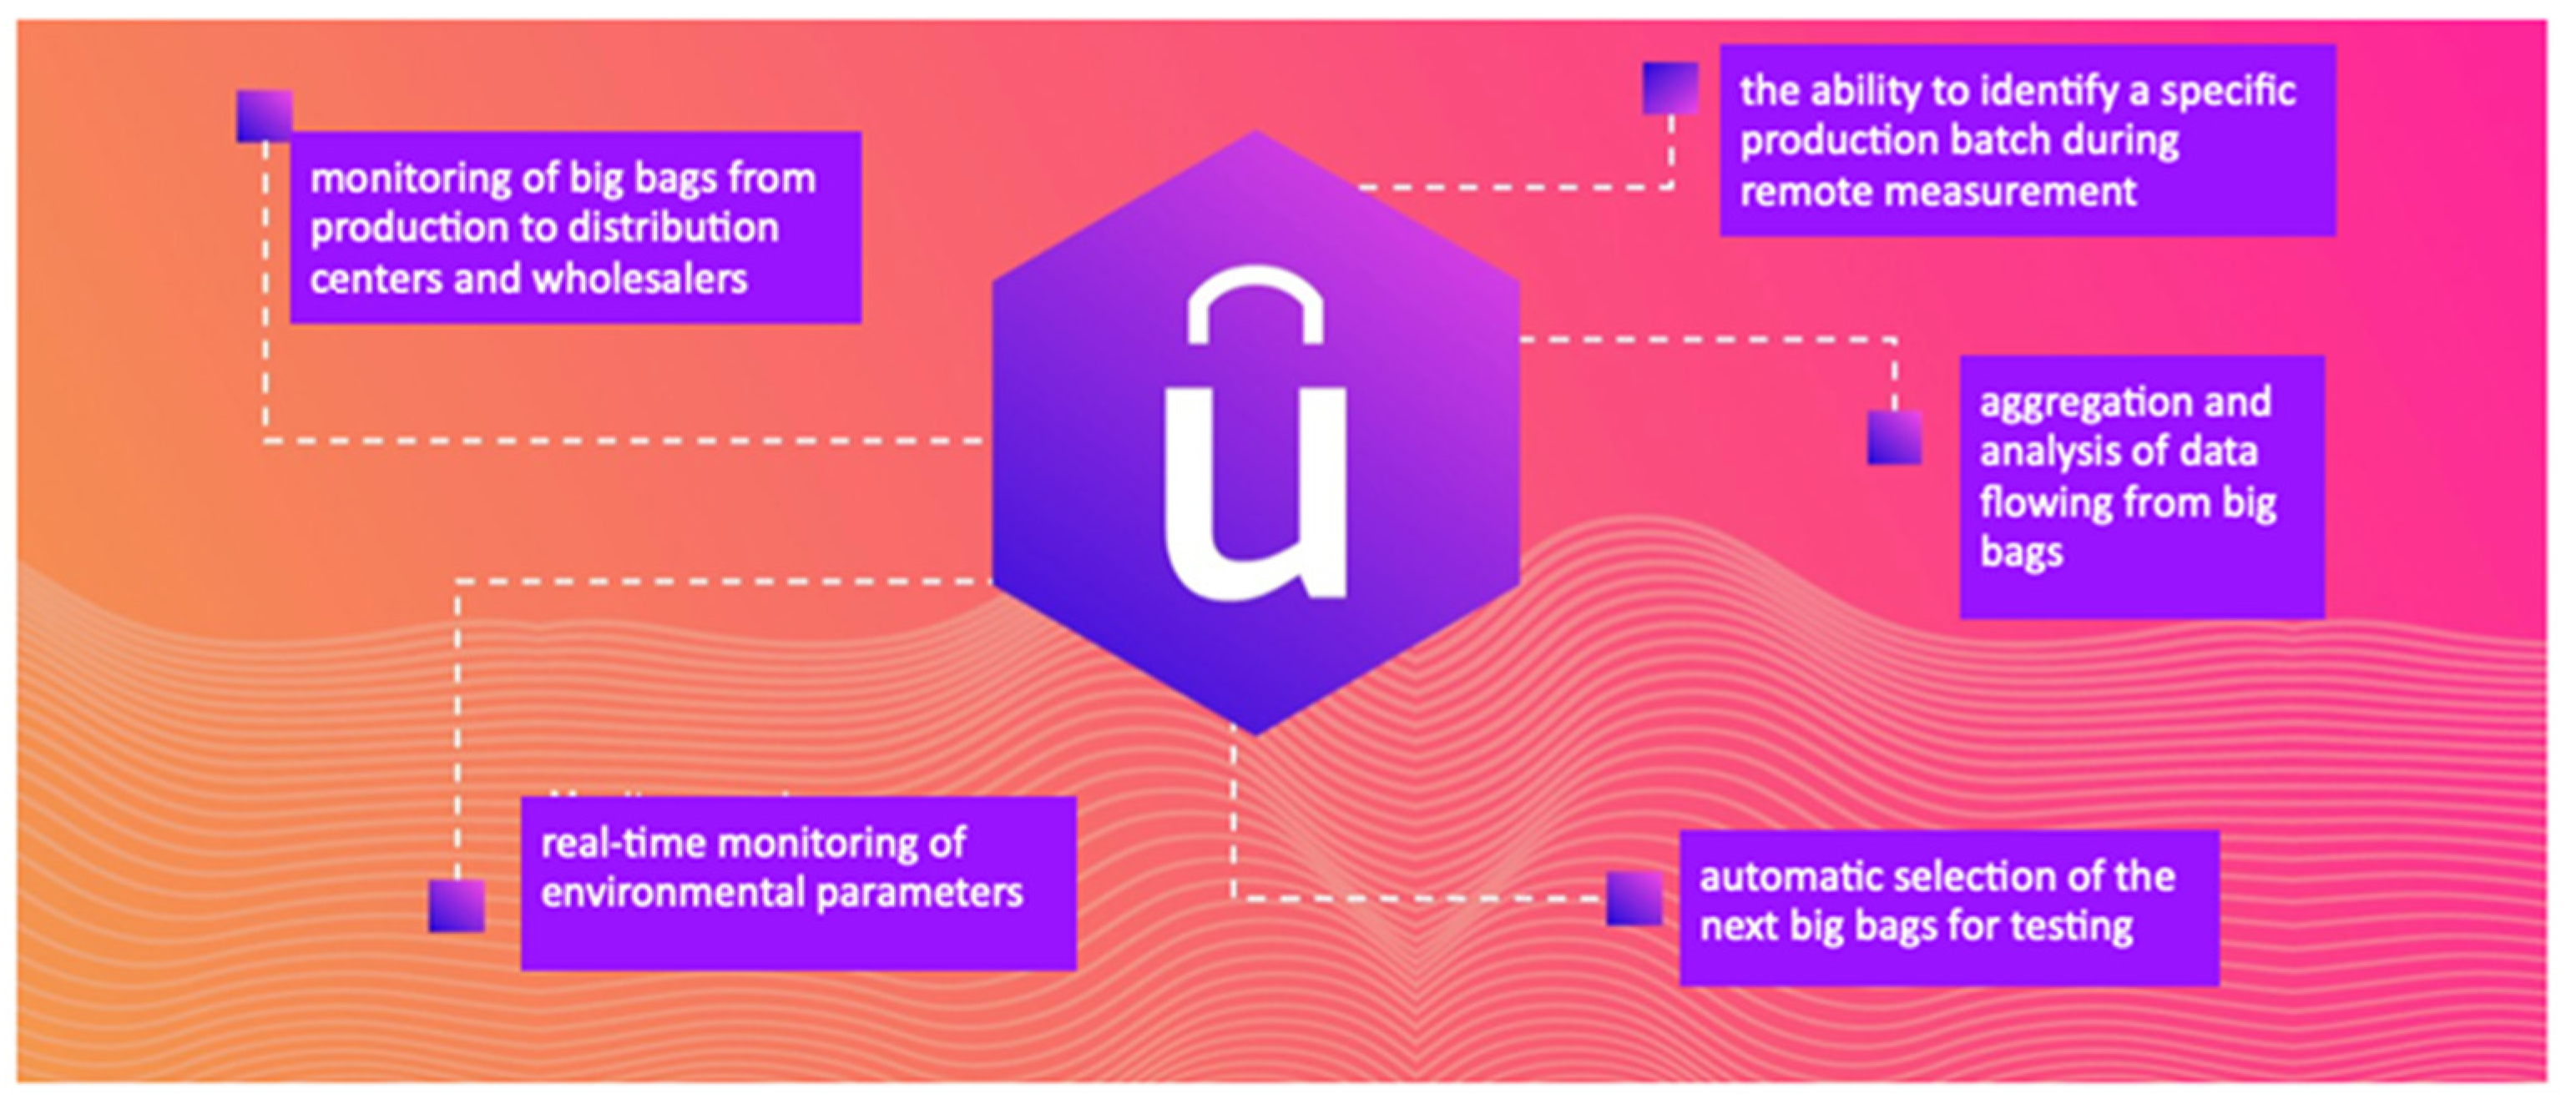
- Monitoring the movement of big bags from production to distribution centers and wholesalers;
- The ability to identify a specific production run during remote measurement;
- Real-time monitoring of environmental parameters;
- Aggregating and analyzing data coming from the big bags;
- Automatic targeting of consecutive big bags for testing.
4. The proposed System
4.1. Functional Structure of the System
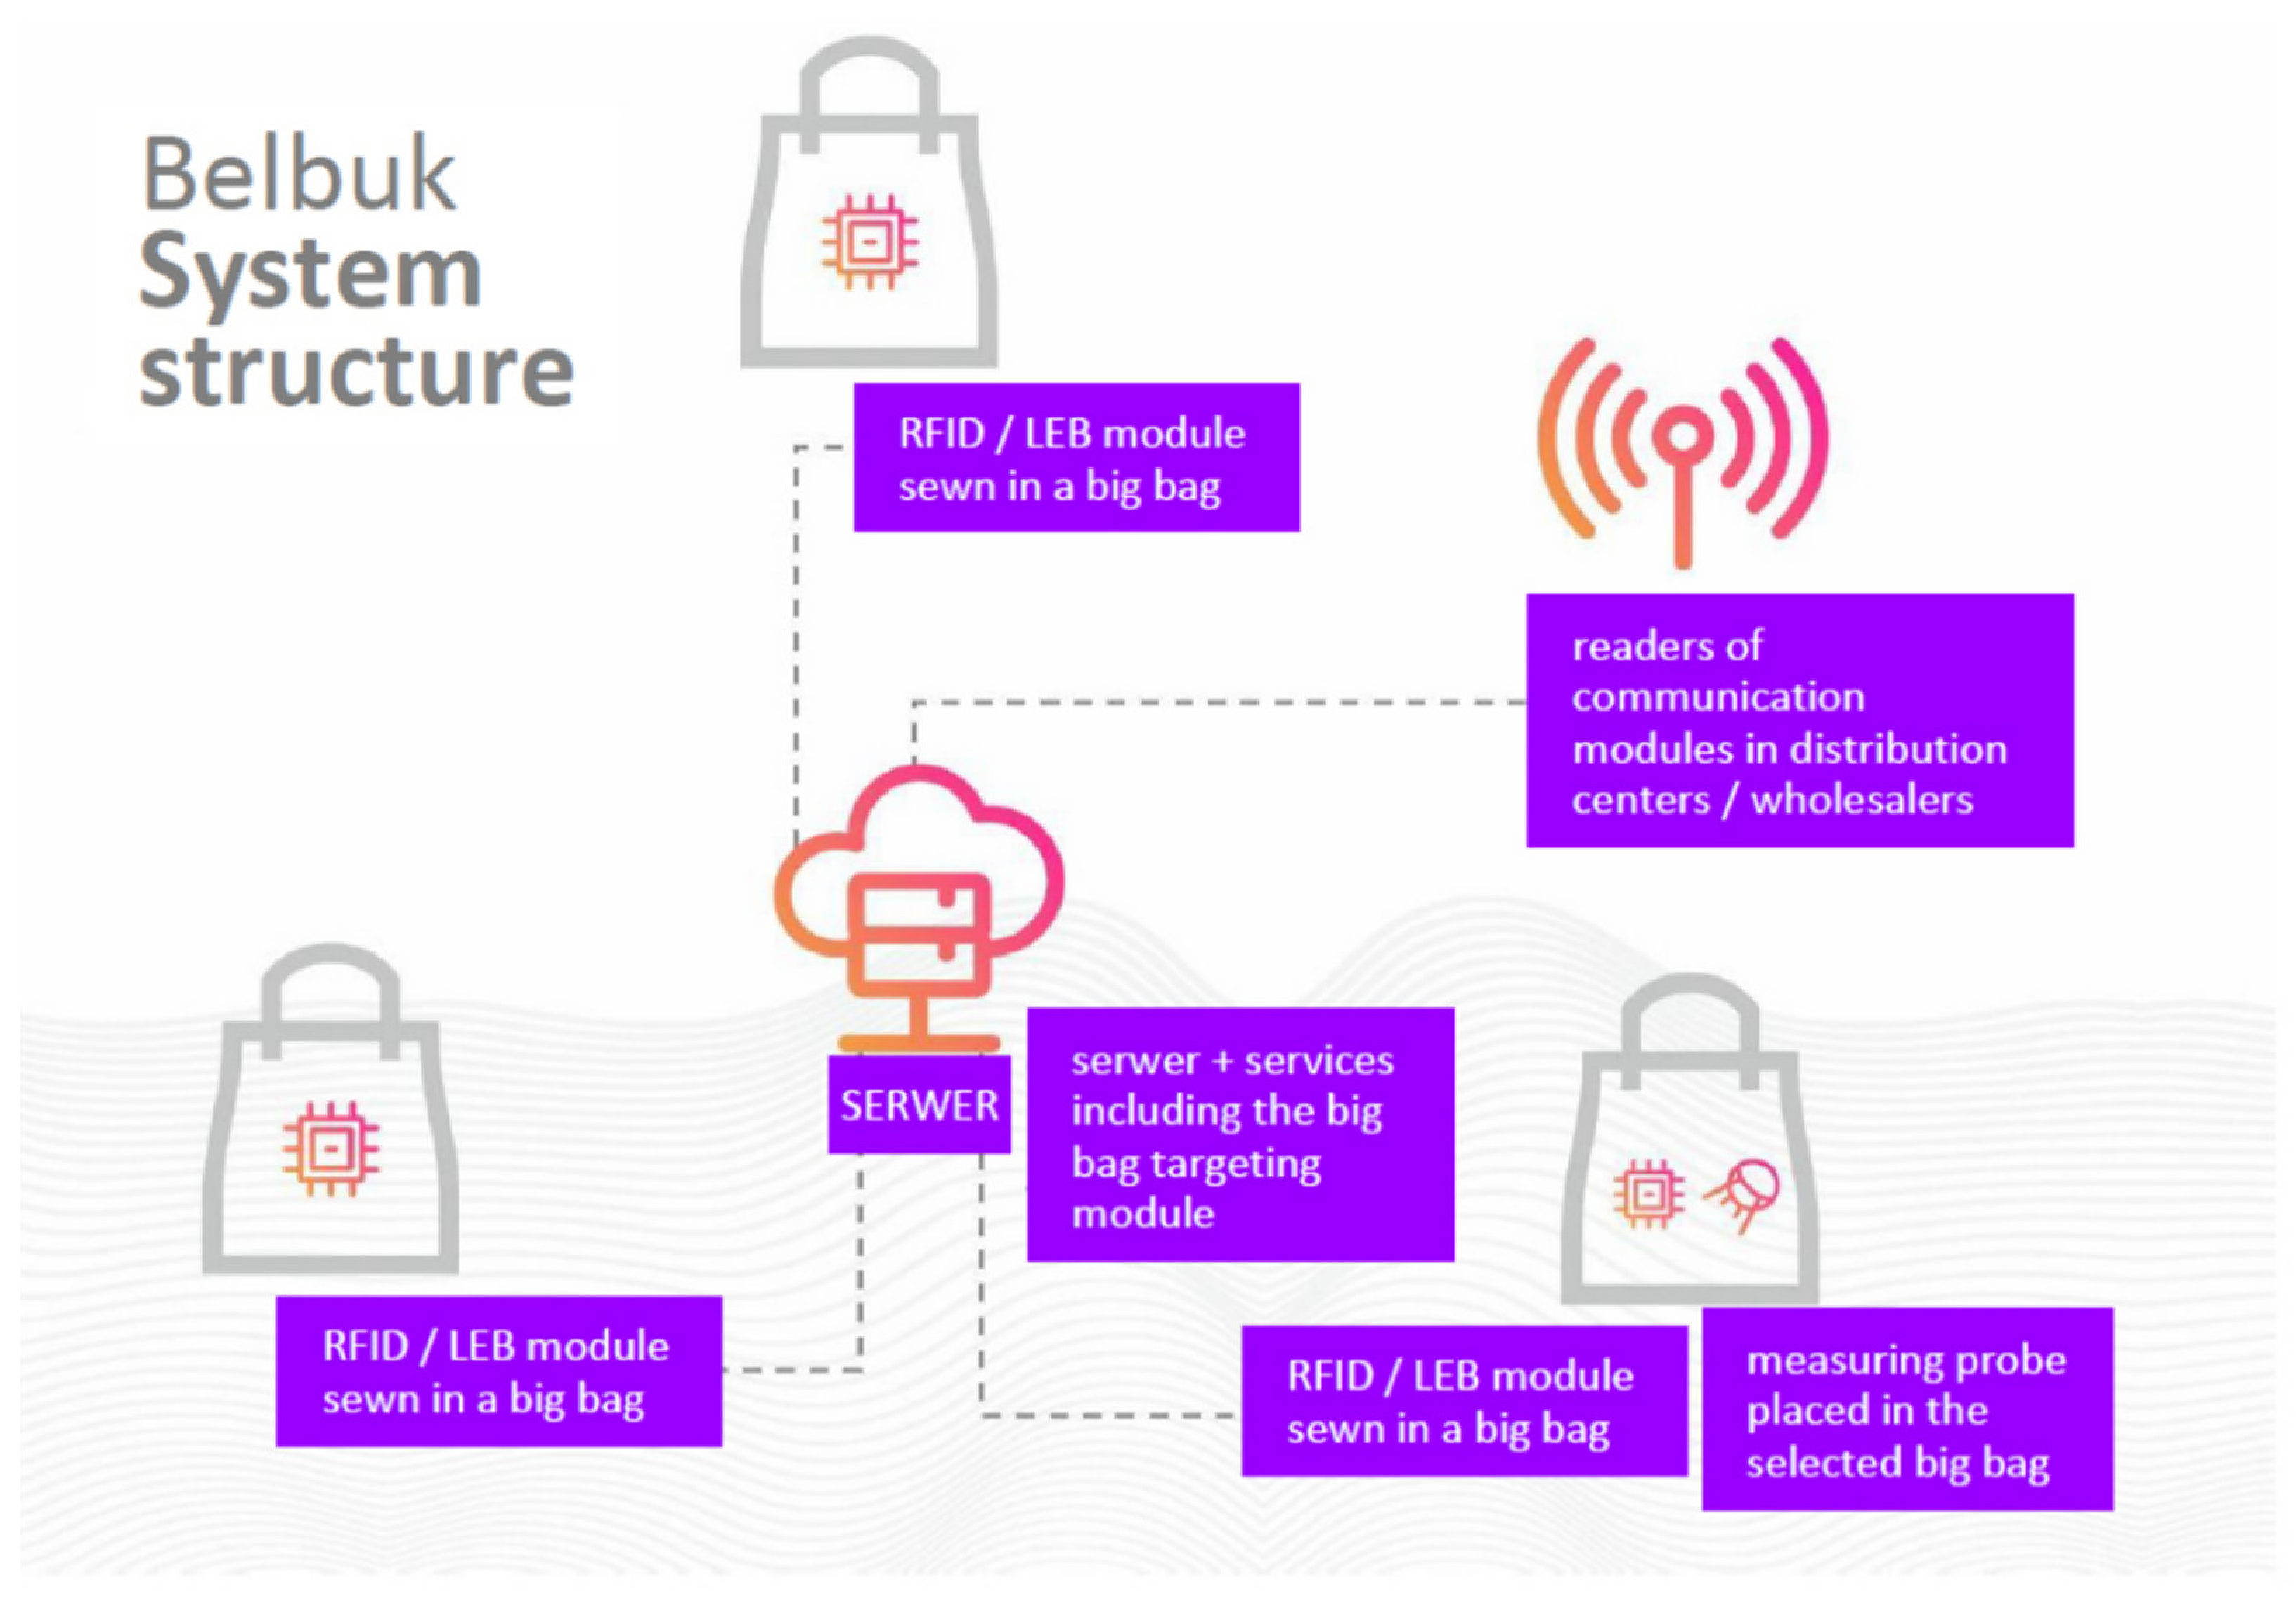
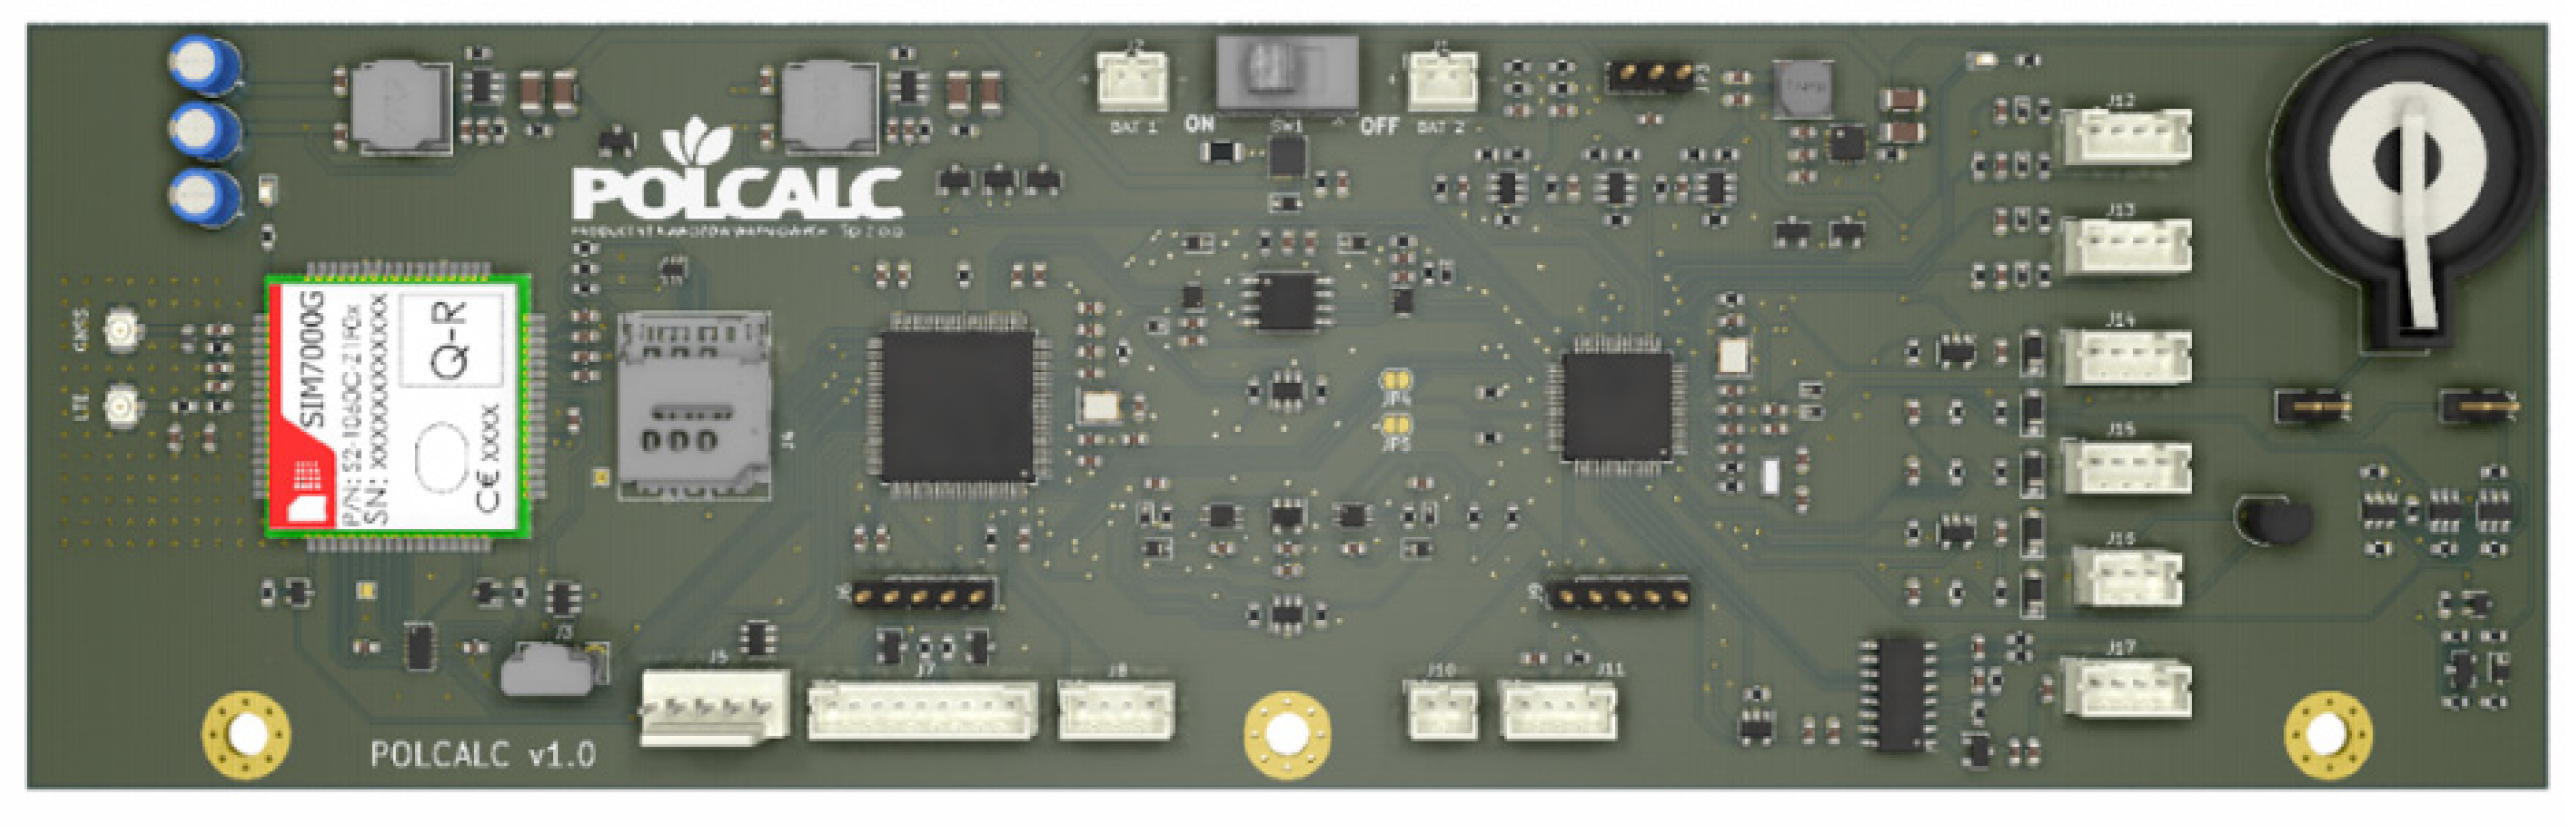
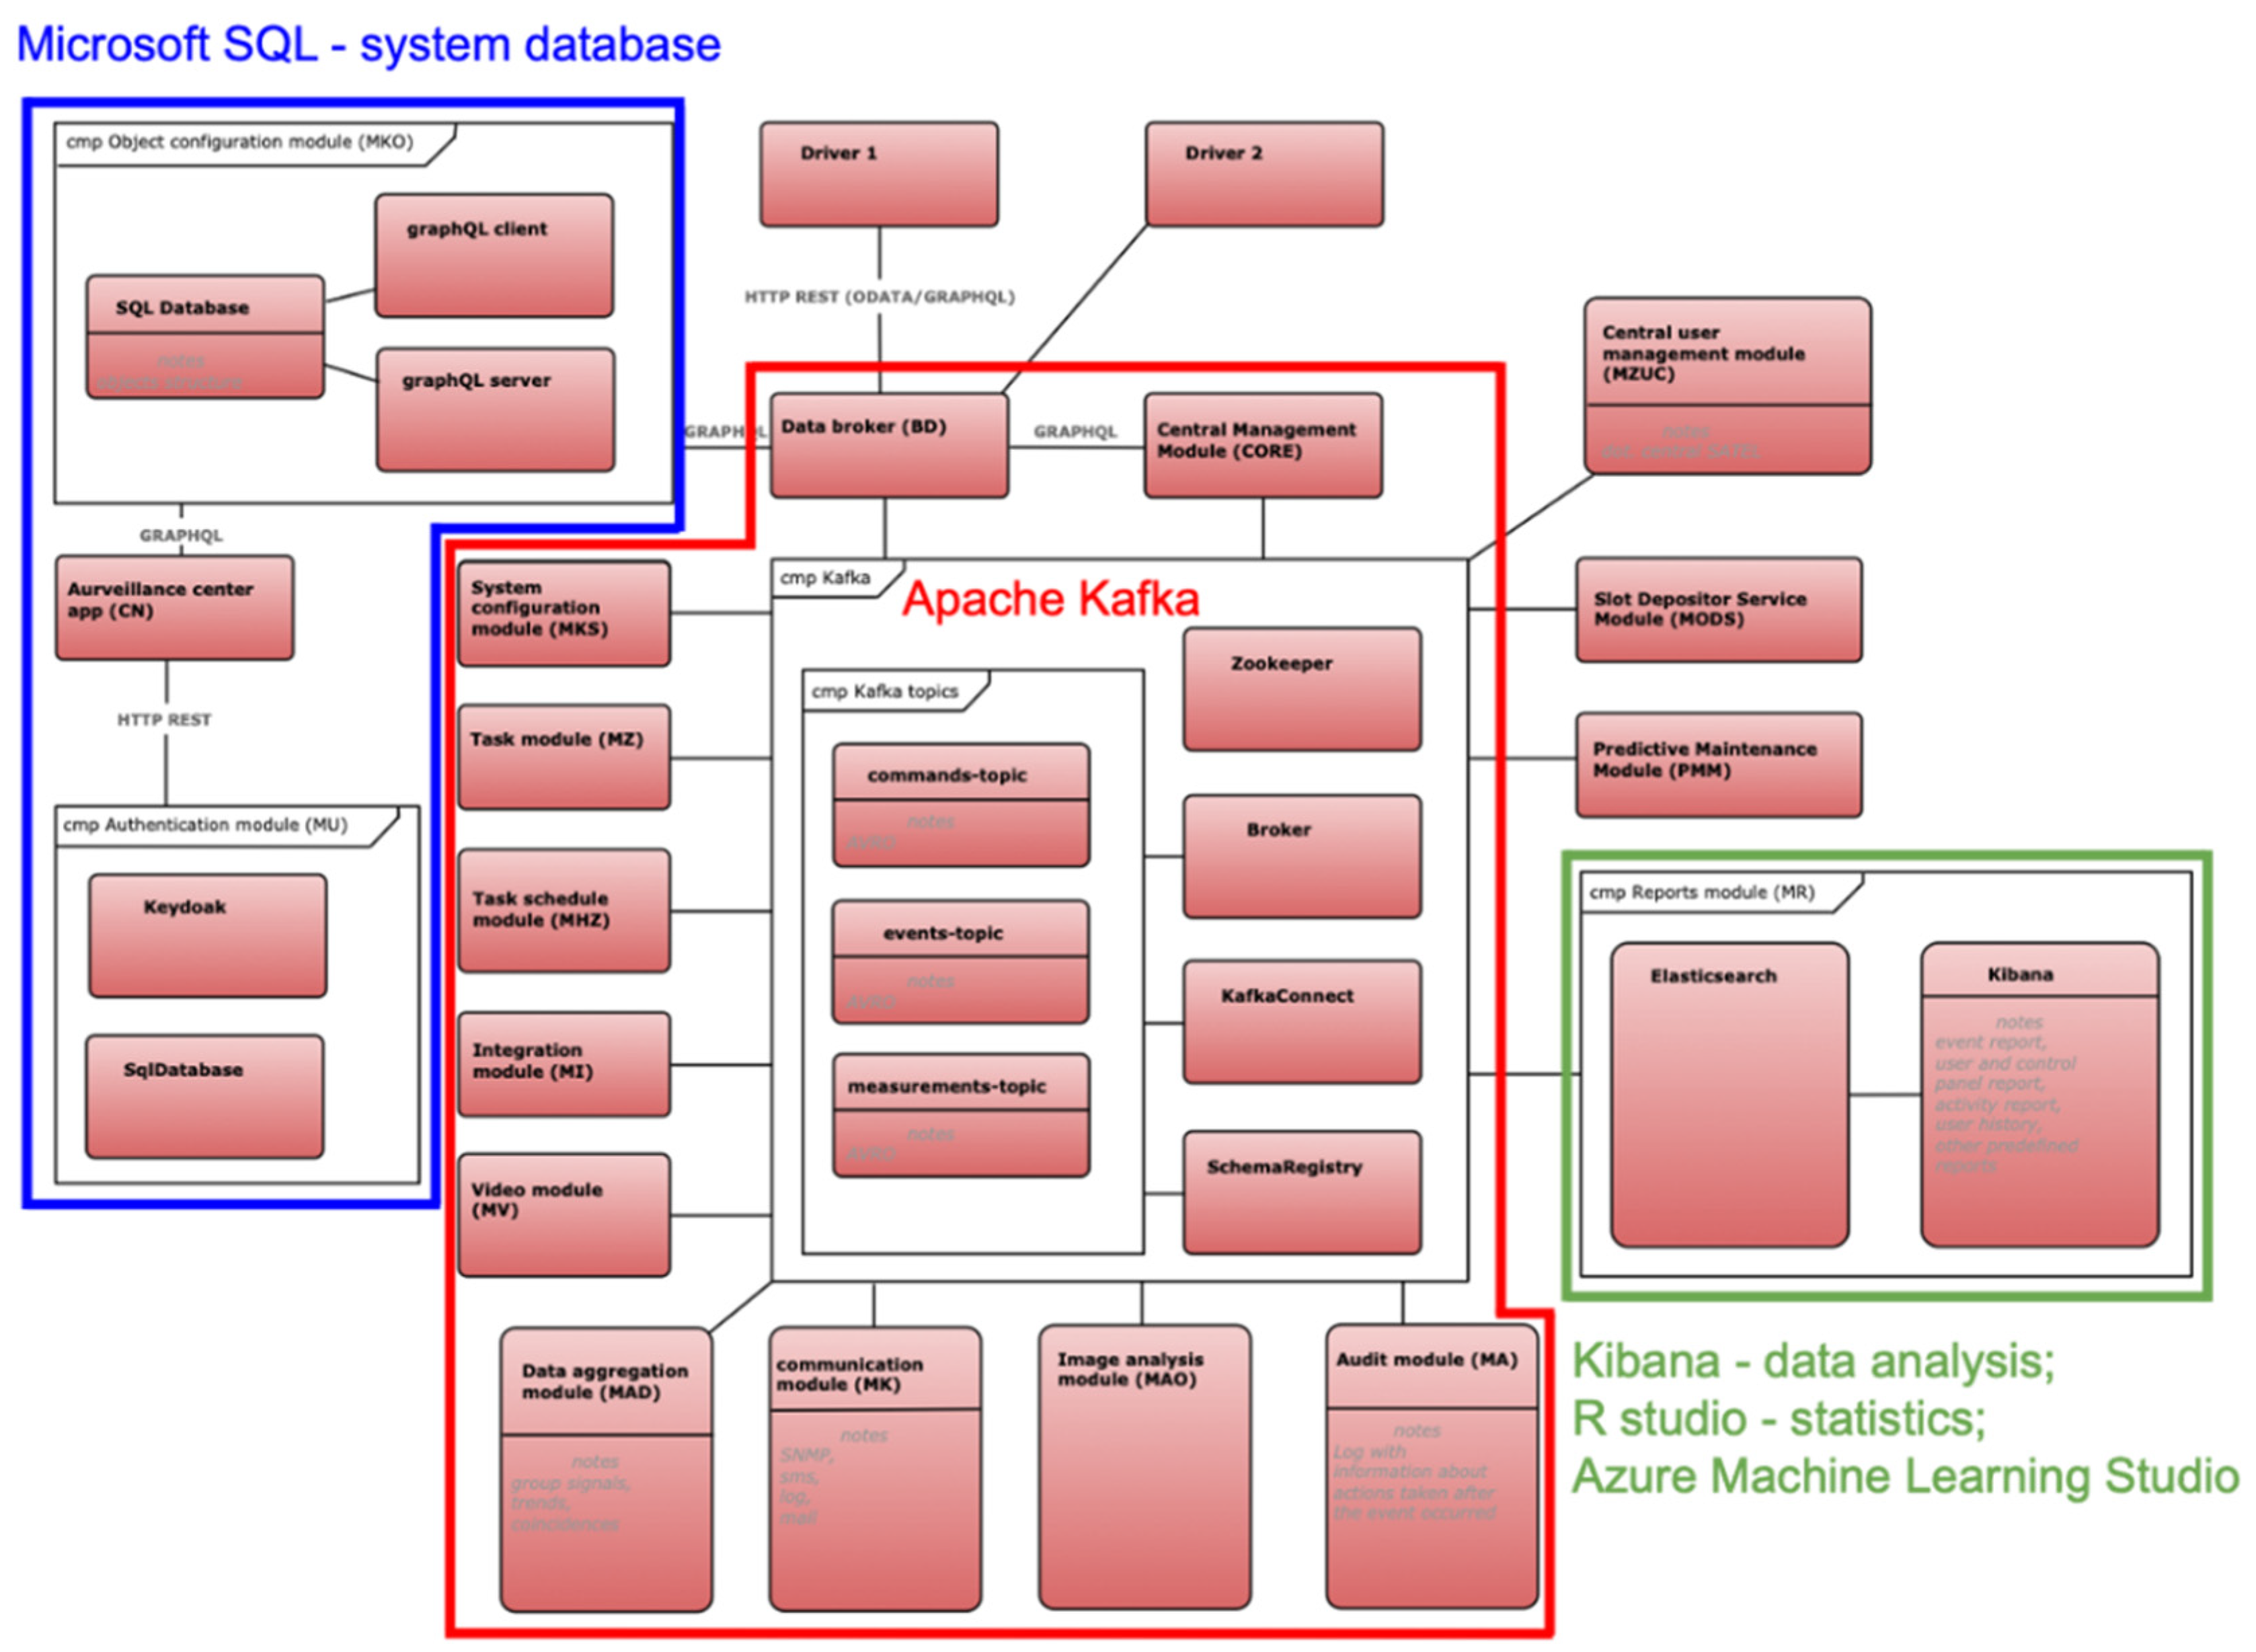
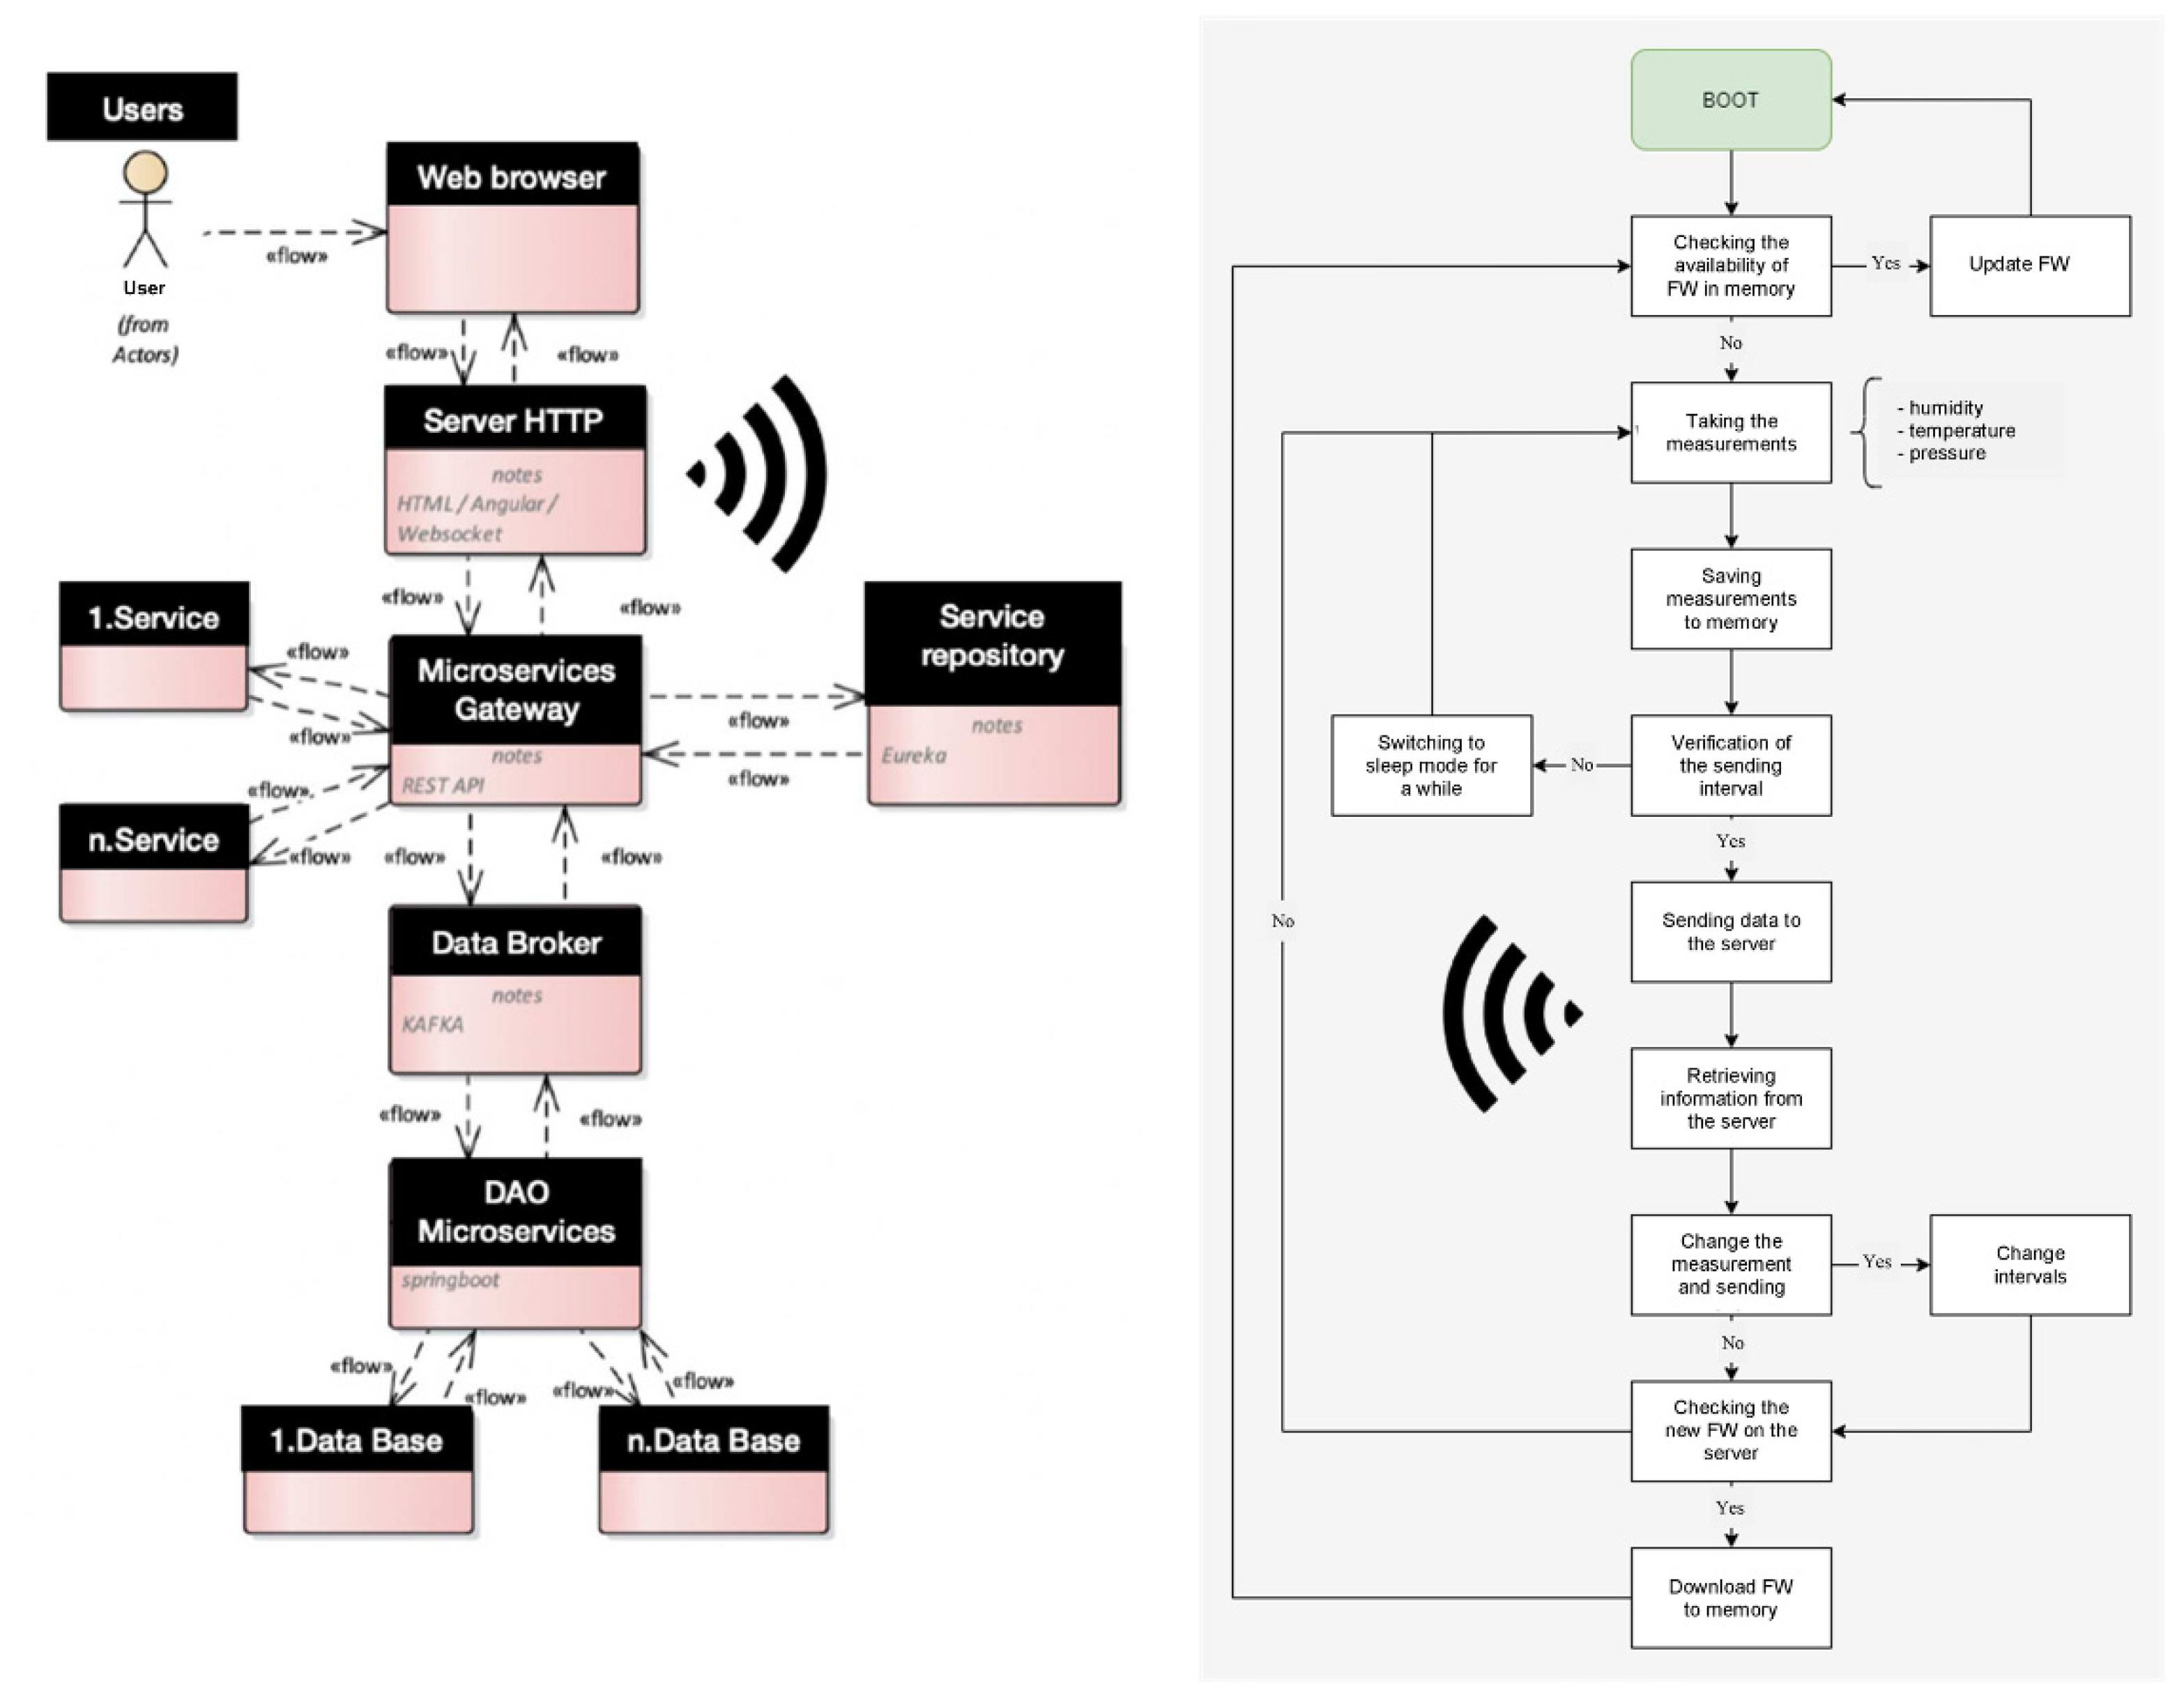
4.2. A Proposed System Architecture
- The humidity content of the calcium fertilizer (a method with minimal risk of electrical discharge or potential for ignition of calcium compounds);
- Temperatures;
- The pressure scaled for quantitative evaluation of the vertically stored big-bag type bags of fertilizer;
- The relative humidity and air pressure (around the device).
4.3. Software
- Docker—used to build an application environment;
- Apache Kafka—system architecture;
- Kibana—data analysis;
- R studio—statistics;
- Azure Machine Learning Studio—statistics;
- Microsoft SQL—system database implementation;
- GRAPHQL—description of the data in API;
- HTML 5—used for several applets of the central application;
- Adobe illustrator—for preparing the wireframe of the central application;
- Eclipse Studio—server services, measurement probe software.
4.4. System Algorithms
5. Results
6. Discussion
7. Conclusions
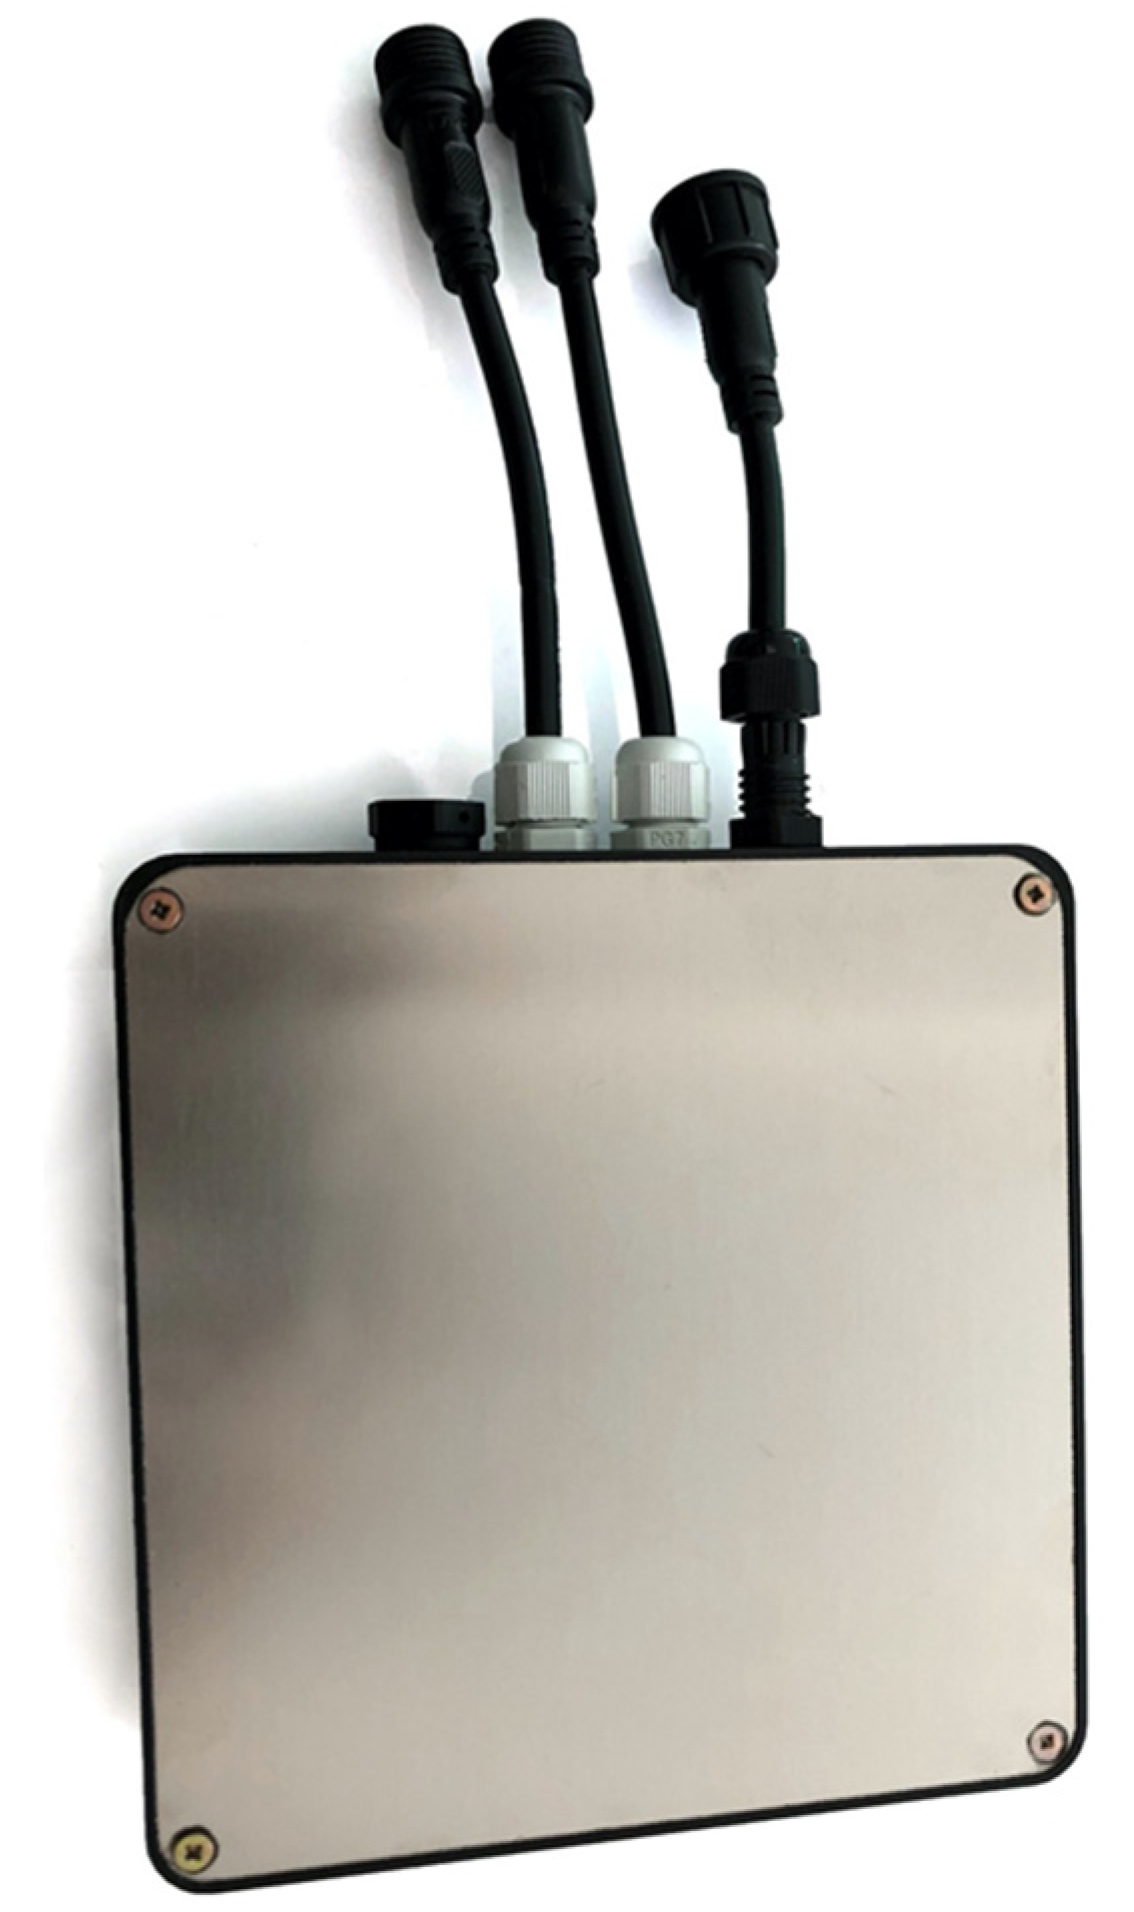
- Autonomy—fully autonomous operation without external power sources or wired communication;
- Modularity—the ultra-compact design; the rich, versatile equipment, and interface configuration; and the autonomous operation allow the creation of flexible measurement systems while maintaining all the key features of professional measurement stations;
- IoT (Internet of Things)—compliance with all leading IoT standards allows to select the optimal wireless communication depending on customer needs and local conditions of the system;
- Data security—data encryption in radio communication is based on the AES-256 standard, which means a 256-bit encryption key, virtually unbreakable by today’s computers.
Author Contributions
Funding
Institutional Review Board Statement
Informed Consent Statement
Data Availability Statement
Conflicts of Interest
References
- Clerici Maestosi, P. Smart Cities and Positive Energy Districts: Urban Perspectives in 2020. Energies 2022, 15, 2168. [Google Scholar] [CrossRef]
- Ahvenniemi, H.; Huovila, A.; Pinto-Seppä, I.; Airaksinen, M. What are the differences between sustainable and smart cities? Cities 2017, 60, 234–245. [Google Scholar] [CrossRef]
- Hancke, G.P.; Ce Silva, B.D.; Hancke, G.P., Jr. The Role of Advanced Sensing in Smart Cities. Sensors 2013, 13, 393–425. [Google Scholar] [CrossRef] [PubMed] [Green Version]
- Perić, K.; Šimić, Z.; Jurić, Ž. Characterization of Uncertainties in Smart City Planning: A Case Study of the Smart Metering Deployment. Energies 2022, 15, 2040. [Google Scholar] [CrossRef]
- Patrão, C.; Moura, P.; de Almeida, A.T. Review of Smart City Assessment Tools. Smart Cities 2020, 3, 1117–1132. [Google Scholar] [CrossRef]
- Sharifi, A. A critical review of selected smart city assessment tools and indicator sets. J. Clean. Prod. 2019, 233, 1269–1283. [Google Scholar] [CrossRef]
- Dudek, T.; Dzhuguryan, T.; Wiśnicki, B.; Pędziwiatr, K. Smart Sustainable Production and Distribution Network Model for City Multi-Floor Manufacturing Clusters. Energies 2022, 15, 488. [Google Scholar] [CrossRef]
- Productive 4.0. Available online: https://productive40.eu/about/ (accessed on 1 July 2020).
- Strulak-Wójcikiewicz, R.; Bohdan, A. The concept of an e-platform cooperation model in the field of 3D printing during the COVID-19 pandemic. Procedia Comput. Sci. 2021, 192, 4083–4092. [Google Scholar] [CrossRef]
- Halme, J.; Jantunen, E.; Hästbacka, D.; Hegedu, C.; Varga, P.; Björkbom, M.; Mesiä, H.; More, R.; Jaatinen, A.; Barna, L.; et al. Monitoring of production processes and the condition of the production equipment through the internet. In Proceedings of the 6th International Conference on Control, Decision and Information Technologies (CoDIT), Paris, France, 23–26 April 2019; pp. 1295–1300. [Google Scholar]
- Kozma, D.; Varga, P.; Hegedu, C. Supply Chain Management and Logistics 4.0—A Study on Arrowhead Framework Integration. In Proceedings of the 8th International Conference on Industrial Technology and Management (ICITM), Cambridge, UK, 2–4 March 2019; pp. 12–16. [Google Scholar]
- Soós, G.; Kozma, D.; Janky, F.N.; Varga, P. IoT device lifecycle—A generic model and a use case for cellular mobile networks. In Proceedings of the 2018 IEEE 6th International Conference on Future Internet of Things and Cloud (FiCloud), Barcelona, Spain, 6–8 August 2018; pp. 176–183. [Google Scholar]
- Lom, M.; Pribyl, O.; Svitek, M. Industry 4.0 as a part of smart cities. In Proceedings of the 2016 Smart Cities Symposium Prague (SCSP), Prague, Czech Republic, 26–27 May 2016. [Google Scholar]
- Kusiak, A. Smart manufacturing. Int. J. Prod. Res. 2018, 56, 508–517. [Google Scholar] [CrossRef]
- Ivanov, D.; Tang, C.S.; Dolgui, A.; Battini, D.; Das, A. Researchers’ perspectives on Industry 4.0: Multi-disciplinary analysis and opportunities for operations management. Int. J. Prod. Res. 2020, 59, 2055–2078. [Google Scholar] [CrossRef]
- Frazzon, E.M.; Agostino, I.R.S.; Broda, E.; Freitag, M. Manufacturing networks in the era of digital production and operations: A socio-cyber-physical perspective. Annu. Rev. Control. 2020, 49, 288–294. [Google Scholar] [CrossRef]
- Dzhuguryan, T.; Deja, A.; Wiśnicki, B.; Jóźwiak, Z. The Design of sustainable city multi-floor manufacturing processes under uncertainty in supply chains. Sustainability 2020, 12, 9439. [Google Scholar] [CrossRef]
- Lorenzen, M.; Frederiksen, L.; Cooke, P.; Lazzeretti, L. Why do cultural industries cluster? Localization, urbanization, products and projects. In Creative Cities, Cultural Clusters and Local Economic Development; Edward Elgar Publishing: Cheltenham, UK, 2013; pp. 155–179. [Google Scholar]
- Deja, A.; Dzhuguryan, T.; Dzhuguryan, L.; Konradi, O.; Ulewicz, R. Smart sustainable city manufacturing and logistics: A framework for city logistics node 4.0 operations. Energies 2021, 14, 8380. [Google Scholar] [CrossRef]
- Sarkis, J.; Zhu, Q. Environmental sustainability and production: Taking the road less travelled. Int. J. Prod. Res. 2018, 56, 743–759. [Google Scholar] [CrossRef]
- Zulkifli, C.Z.; Abdulla, R.M.; Ismail, W.; Rahman, M.G. Wireless mesh network in integrated web base monitoring systems for production line automation. In Proceedings of the First International Joint Conference, SPIT 2011 and IPC 2011, Amsterdam, The Netherlands, 1–2 December 2011; Springer: Berlin/Heidelberg, Germany, 2011; pp. 7–15. [Google Scholar]
- Martín, M.P.; Asensio, C.M.; Nepote, V.; Grosso, N.R. Improving Quality Preservation of Raw Peanuts Stored under Different Conditions During a Long-Term Storage. Eur. J. Lipid Sci. Technol. 2018, 120, 1800150. [Google Scholar] [CrossRef]
- Zhelobkova, M.O.M.; Stankevych, G.N. Practical questions for silo bags grain storage technology. Grain Prod. Mix. Fodd. 2019, 19, 10–16. [Google Scholar] [CrossRef]
- Matičević, G.; Lovrić, T.; Čičak, M. Using ERP System to Improve Internal Supply Chain Coordination; University Osijek, Mechanical Engineering Faculty: Slavonski Brod, Croatia, 2011; Volume 4, pp. 11–21. [Google Scholar]
- Gandhewar, R.; Gaurav, A.; Kokate, K.; Khetan, H.; Kamat, H. Cloud Based Framework for IIOT Application with Asset Management. In Proceedings of the 3rd International Conference on Electronics and Communication and Aerospace Technology (ICECA), Coimbatore, India, 12–14 June 2019. [Google Scholar] [CrossRef]
- Zare-Mehrjerdi, Y. RFID and its benefits: A multiple case analysis. In Assembly Automation; Emerald: Bingley, UK, 2011; Volume 31, pp. 251–262. [Google Scholar]
- Liukkonen, M. RFID Technology in Manufacturing and Supply Chain. Int. J. Comput. Integr. Manuf. 2015, 28, 861–880. [Google Scholar] [CrossRef]
- Lee, D.; Park, J. RFID-enabled supply chain traceability: Existing methods, applications and challenges: Sustainable radio frequency identification solutions. In Proceedings of the INTECH 2010, Prague, Czech Republic, 14–16 September 2010; pp. 51–68. [Google Scholar]
- Gandino, F.; Montrucchio, B.; Rebaudengo, M.; Sanchez, E.R. Analysis of an RFID-Based information system for tracking and tracing in an agri-food chain. In Proceedings of the IEEE 1st Annual RFID Eurasia, Istanbul, Turkey, 5–6 September 2007; pp. 1–6. [Google Scholar]
- Yoo, S.; Kim, S.; Kim, E.; Jung, E.; Lee, K.H.; Hwang, H. Real-time location system-based asset tracking in the healthcare field: Lessons learned from a feasibility study. BMC Med. Inform. Decis. Mak. 2018, 18, 80. [Google Scholar] [CrossRef] [Green Version]
- Tan, G.; Fang, Y.; Meng, Y. Research on the remote monitoring system for chemical raw materials in storage tank based on ARM embedded system. Chem. Eng. Trans. 2017, 62, 757–762. [Google Scholar] [CrossRef]
- Lee, C.K.M.; Ip, C.M.; Park, T.; Chung, S.Y. A bluetooth location-based indoor positioning system for asset tracking in warehouse. In Proceedings of the IEEE International Conference on Industrial Engineering and Engineering Management 2019, Macao, China, 15–19 December 2019; pp. 1408–1412. [Google Scholar] [CrossRef]
- He, W.; Xi, M.; Gardner, H.; Swift, B.; Adcock, M. Spatial anchor based indoor asset tracking. In Proceedings of the IEEE Virtual Reality and 3D User Interfaces (VR), Lisboa, Portugal, 27 March–1 April 2021; pp. 255–259. [Google Scholar] [CrossRef]
- Frankó, A.; Vida, G.; Varga, P. Reliable identification schemes for asset and production tracking in Industry 4.0. Sensors 2020, 20, 3709. [Google Scholar] [CrossRef]
- DIN Standards. Reference Architecture Model Industrie 4.0 (RAMI4.0); DIN SPEC 91345: Berlin, Germany, 2016. [Google Scholar]
- Kozma, D.; Soos, G.; Varga, P. Supporting digital production, product lifecycle and supply chain management in Industry 4.0 by the arrowhead framework—A survey. In Proceedings of the IEEE International Conference on Industrial Informatics (INDIN), Helsinki, Finaland, 22–25 July 2019. [Google Scholar]
- Barreto, L.; Amaral, A.; Pereira, T. Industry 4.0 implications in logistics: An overview. Procedia Manuf. 2017, 13, 1245–1252. [Google Scholar]
- Perez-Guirao, M.D.; Kull, B.; Luediger, H. An ultra-wideband approach towards autonomous radio control and positioning systems in manufacturing & logistics processes. In Proceedings of the 4th Workshop on Positioning, Navigation and Communication, Hannover, Germany, 22 March 2007. [Google Scholar]
- Asil, O.; Foad, M.P.; Dursun, D.; Leva, K.S. An RFID network design methodology for asset tracking in healthcare. Decis. Support Syst. 2010, 49, 100–109. [Google Scholar]
- Ullo, S.L.; Sinha, G.R. Advances in IoT and Smart Sensors for Remote Sensing and Agriculture Applications. Remote Sens. 2021, 13, 2585. [Google Scholar] [CrossRef]
- Ayaz, M.; Ammad-Uddin, M.; Sharif, Z.; Mansour, A.; Aggoune, E.-H.M. Internet-of-Things (IoT)-based smart agriculture: Toward making the fields talk. IEEE Access 2019, 7, 129551–129583. [Google Scholar] [CrossRef]
- Marcu, I.; Voicu, C.; Drăgulinescu, A.M.C.; Fratu, O.; Suciu, G.; Balaceanu, C.M.; Andronache, M.M. Overview of IoT basic platforms for precision agriculture. In Lecture Notes of the Institute for Computer Sciences, Social Informatics and Telecommunications Engineering; Springer International Publishing: Berlin/Heidelberg, Germany, 2019; Volume 283, pp. 124–137. [Google Scholar]
- Doshi, J.; Patel, T.; Bharti, S.K. Smart farming using IoT, a solution for optimally monitoring farming conditions. Procedia Comput. Sci. 2019, 160, 746–751. [Google Scholar] [CrossRef]
- Arias, M.; Campo-Bescós, M.Á.; Álvarez-Mozos, J. Crop classification based on temporal signatures of Sentinel-1 observations over Navarre province, Spain. Remote. Sens. 2020, 12, 278. [Google Scholar] [CrossRef] [Green Version]
- Nellis, M.D.; Price, K.P.; Rundquist, D. Remote Sensing of Cropland Agriculture; SAGE Publications: Thousand Oaks, CA, USA, 2013; pp. 368–382. [Google Scholar]
- Syrový, T.; Vik, R.; Pretl, S.; Syrová, L.; Čengery, J.; Hamáček, A.; Kubáč, L.; Menšík, L. Fully printed disposable IoT soil moisture sensors for precision agriculture. Chemosensors 2020, 8, 125. [Google Scholar] [CrossRef]
- Shafi, U.; Mumtaz, R.; García-Nieto, J.; Hassan, S.A.; Zaidi, S.A.R.; Iqbal, N. Precision agriculture techniques and practices: From considerations to applications. Sensors 2019, 19, 3796. [Google Scholar] [CrossRef] [Green Version]
- Fisher, D.K.; Woodruff, L.K.; Anapalli, S.S.; Pinnamaneni, S.R. Open-source wireless cloud-connected agricultural sensor network. J. Sens. Actuator Netw. 2018, 7, 47. [Google Scholar] [CrossRef] [Green Version]
- Lu, B.; Dao, P.; Liu, J.; He, Y.; Shang, J. Recent advances of hyperspectral imaging technology and applications in agriculture. Remote Sens. 2020, 12, 2659. [Google Scholar] [CrossRef]
- Piikki, K.; Söderström, M.; Eriksson, J.; John, J.M.; Muthee, P.I.; Wetterlind, J.; Lund, E. Performance evaluation of proximal sensors for soil assessment in smallholder farms in Embu County, Kenya. Sensors 2016, 16, 1950. [Google Scholar] [CrossRef] [PubMed] [Green Version]
- Elahi, H.; Munir, K.; Eugeni, M.; Atek, S.; Gaudenzi, P. Energy harvesting towards self-powered IoT devices. Energies 2020, 13, 5528. [Google Scholar] [CrossRef]
- Hassan, R.; Qamar, F.; Hasan, M.K.; Aman, A.H.M.; Ahmed, A.S. Internet of Things and its applications: A comprehensive survey. Symmetry 2020, 12, 1674. [Google Scholar] [CrossRef]
- Sinha, G.R. Advances in Modern Sensors—Physics, Design, Simulation and Applications; IOP Publishing: Bristol, UK, 2020. [Google Scholar]
- Vasisht, D.; Kapetanovic, Z.; Won, J.; Jin, X.; Chandra, R.; Kapoor, A.; Sinha, S.N.; Sudarshan, M.; Stratman, S. Farmbeats: An IoT platform for data-driven agriculture. In Proceedings of the 14th USENIX Symposium on Networked Systems Design and Implementation (NSDI ’17), Boston, MA, USA, 27–29 March 2017; pp. 515–529. [Google Scholar]
- Aggarwal, N.; Singh, D. Technology assisted farming: Implications of IoT and AI. In Proceedings of the 1st International Conference on Computational Research and Data Analytics (ICCRDA 2020), Rajpura, India, 24 October 2020; IOP Publishing: Bristol, UK, 2021; Volume 1022. [Google Scholar]
- Lakshmisudha, K.; Hegde, S.; Kale, N.; Iyer, S. Smart precision-based agriculture using sensors. Int. J. Comput. Appl. 2016, 146, 36–38. [Google Scholar] [CrossRef]
- Suanpang, P.; Jamjuntr, P. A smart farm prototype with an Internet of Things (IoT) case study: Thailand. J. Adv. Agric. Technol. 2019, 6, 241–245. [Google Scholar] [CrossRef]
- Zhang, D.; Wei, B. Smart sensors and devices in artificial intelligence. Sensors 2020, 20, 5945. [Google Scholar] [CrossRef]
- Madushanki, A.R.; Halgamuge, M.N.; Wirasagoda, W.S.; Syed, A. Adoption of the Internet of Things (IoT) in agriculture and smart farming towards urban greening: A review. Int. J. Adv. Comput. Sci. Appl. 2019, 10, 11–28. [Google Scholar] [CrossRef] [Green Version]
- Sishodia, R.P.; Ray, R.L.; Singh, S.K. Applications of remote sensing in precision agriculture: A review. Remote. Sens. 2020, 12, 3136. [Google Scholar] [CrossRef]
- Lakhankar, T.; Krakauer, N.; Khanbilvardi, R. Applications of microwave remote sensing of soil moisture for agricultural applications. Int. J. Terraspace Sci. Eng. 2009, 2, 81–91. [Google Scholar]
- Ruan, J.; Jiang, H.; Zhu, C.; Hu, X.; Shi, Y.; Liu, T.; Rao, W.; Chan, F.T. Agriculture IoT: Emerging trends, cooperation networks, and outlook. IEEE Wirel. Commun. 2019, 26, 56–63. [Google Scholar] [CrossRef]


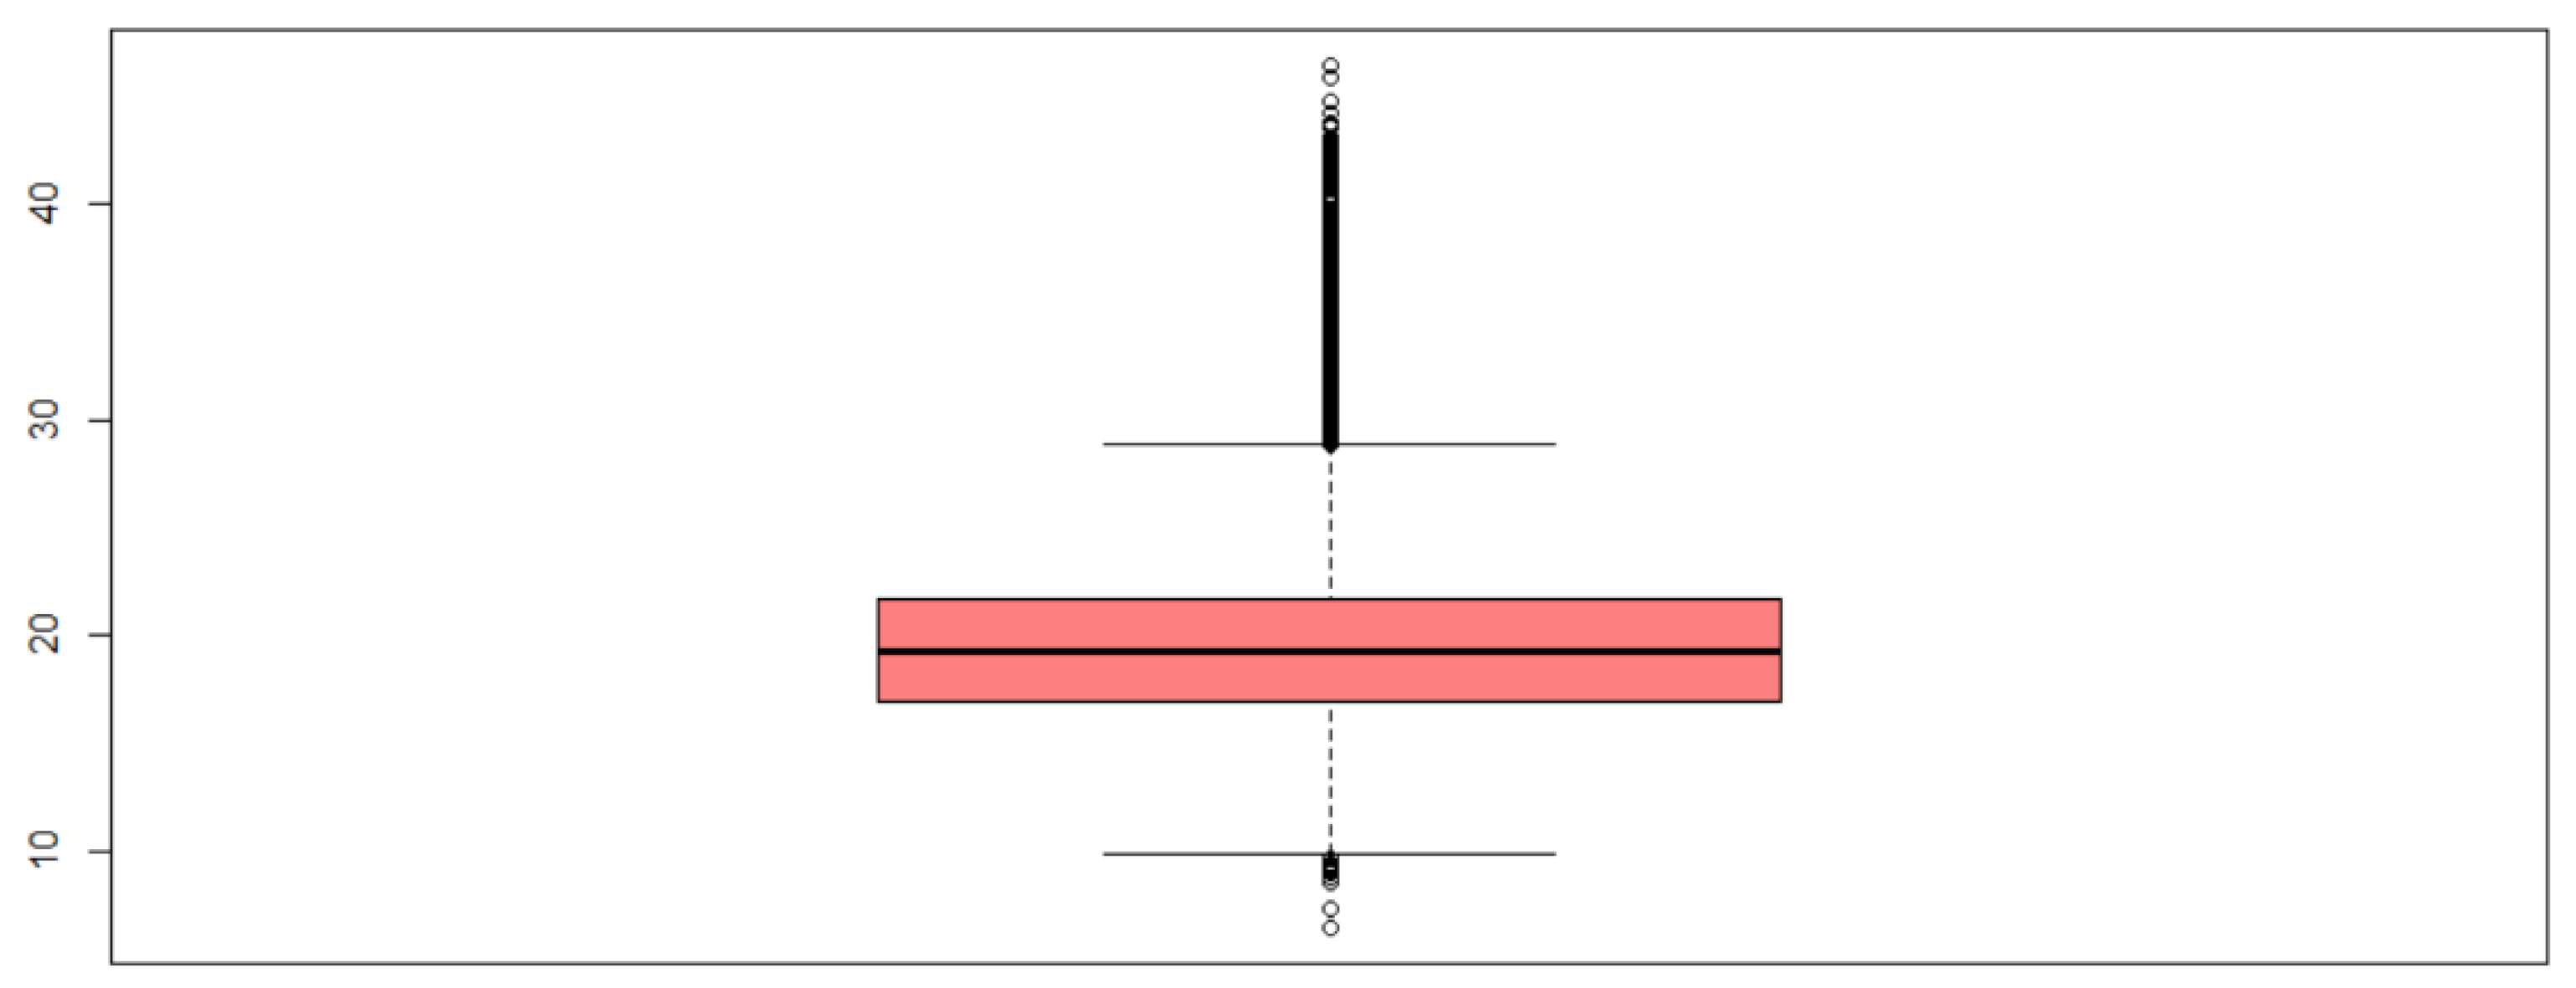
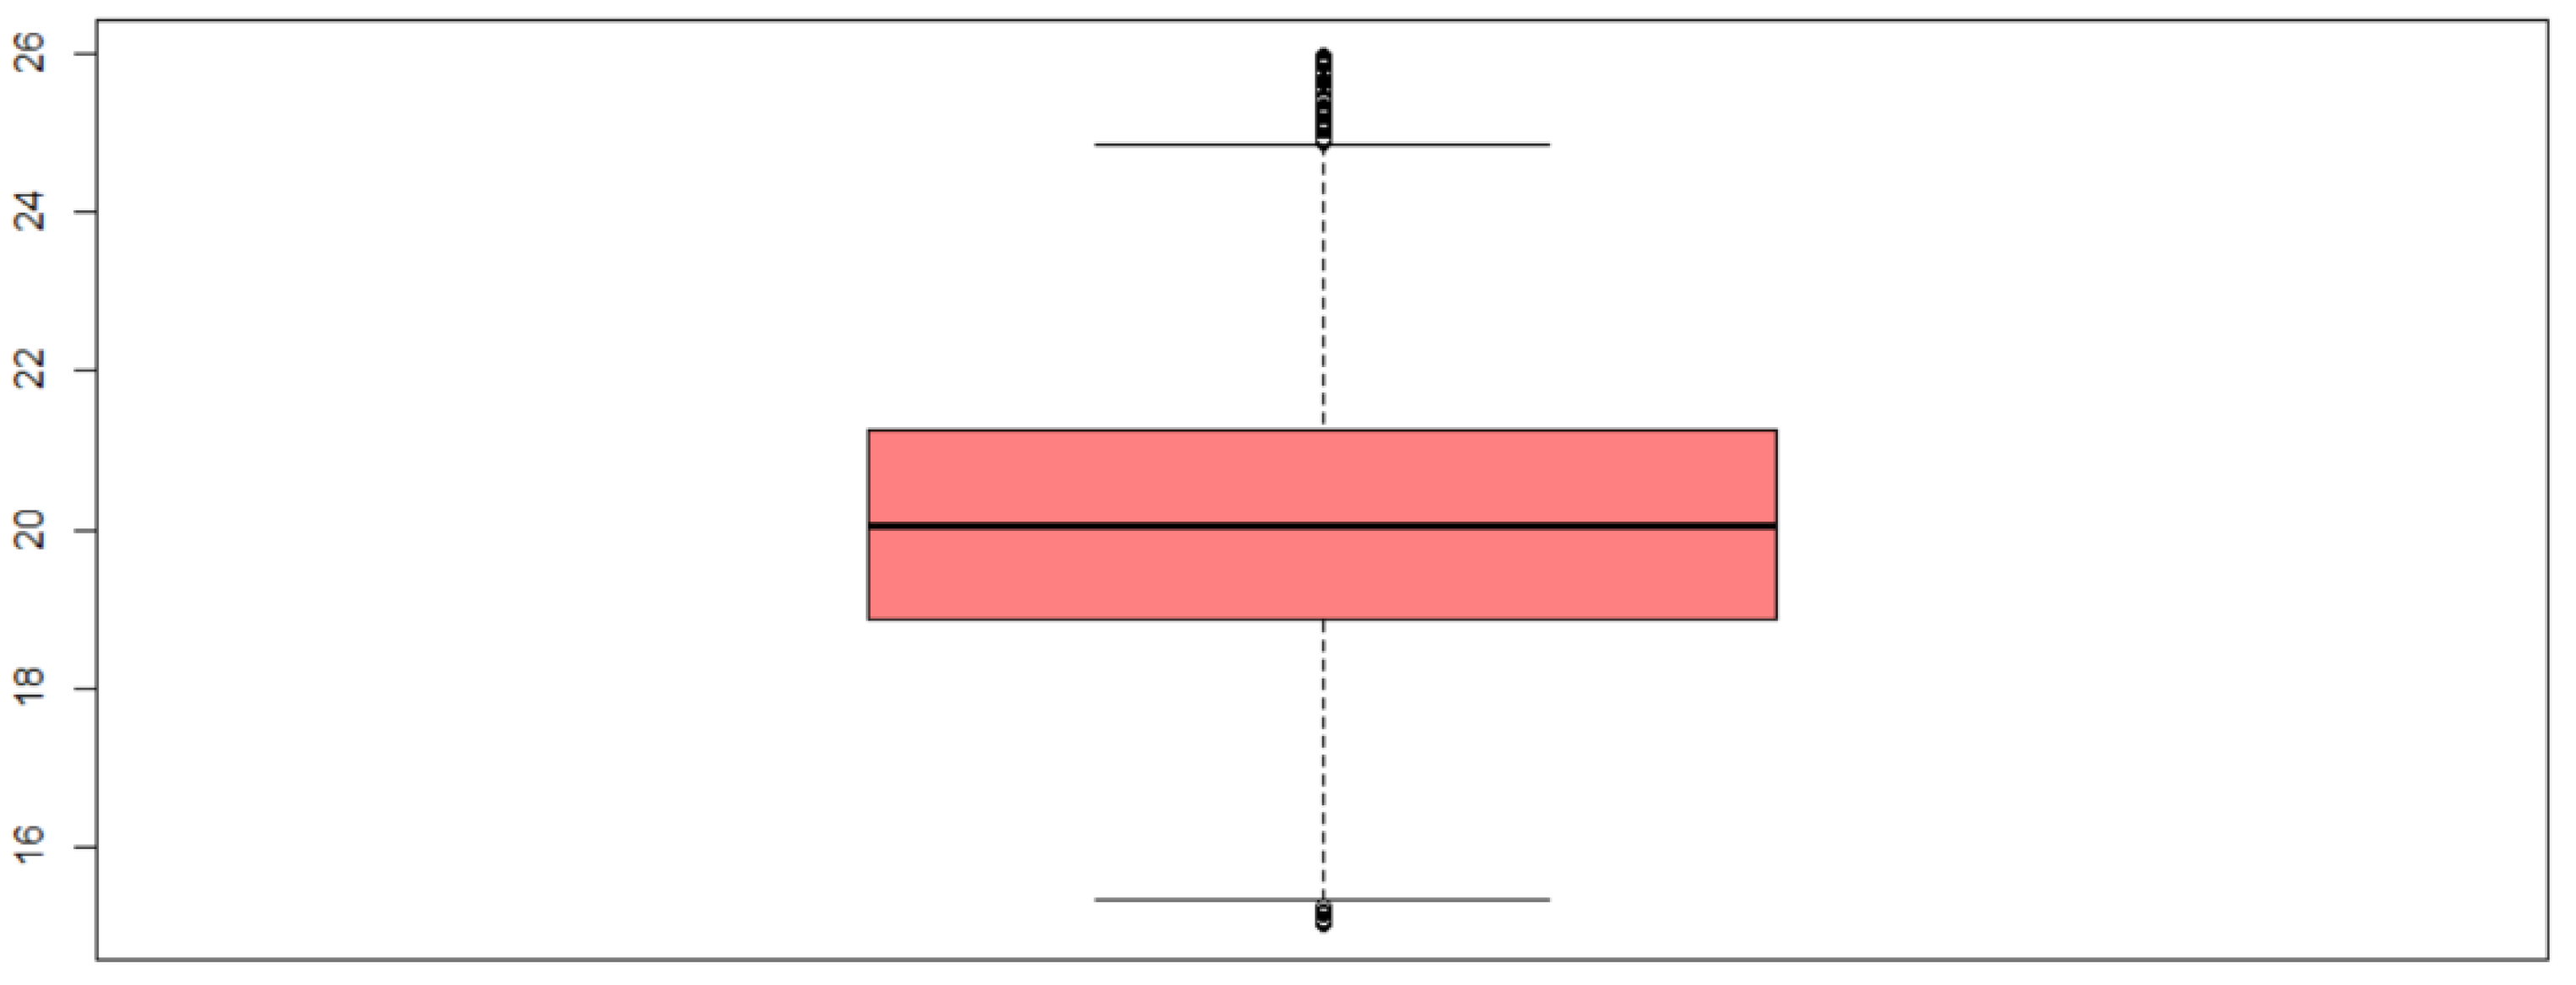
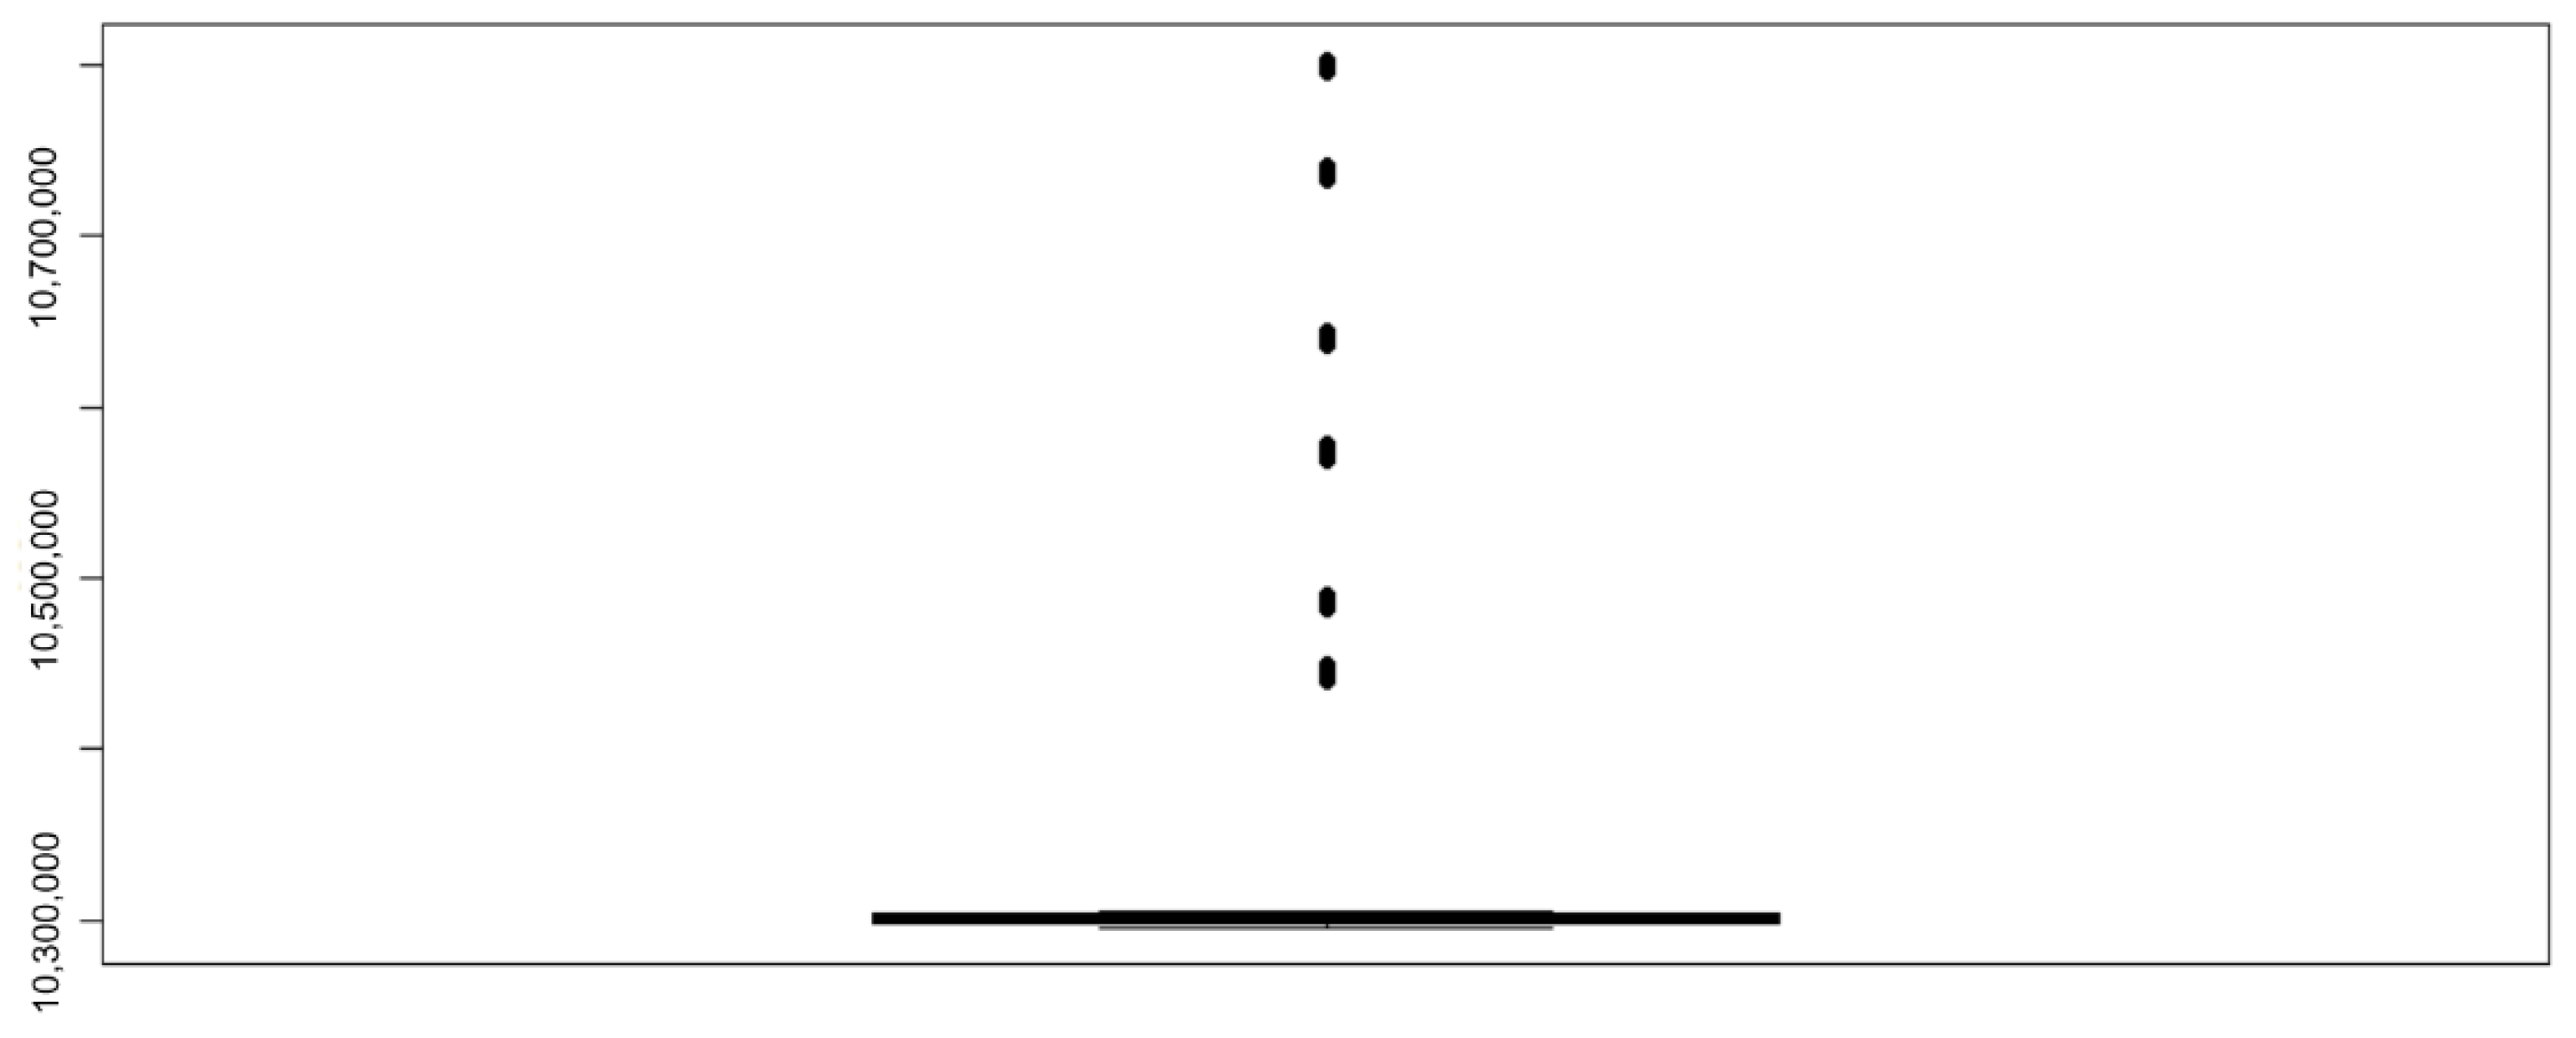
| Temperature [°C] | Humidity [%] | Tension [Pa] | |
|---|---|---|---|
| Minimum | 6.50 | 15.03 | 10,295,001 |
| 1st quartile | 16.98 | 18.86 | 10,297,708 |
| Median | 19.25 | 20.04 | 10,300,330 |
| Mean | 20.13 | 20.12 | 10,319,435 |
| 3rd quartile | 21.73 | 21.26 | 10,302,964 |
| Maximum | 46.38 | 25.98 | 10,803,336 |
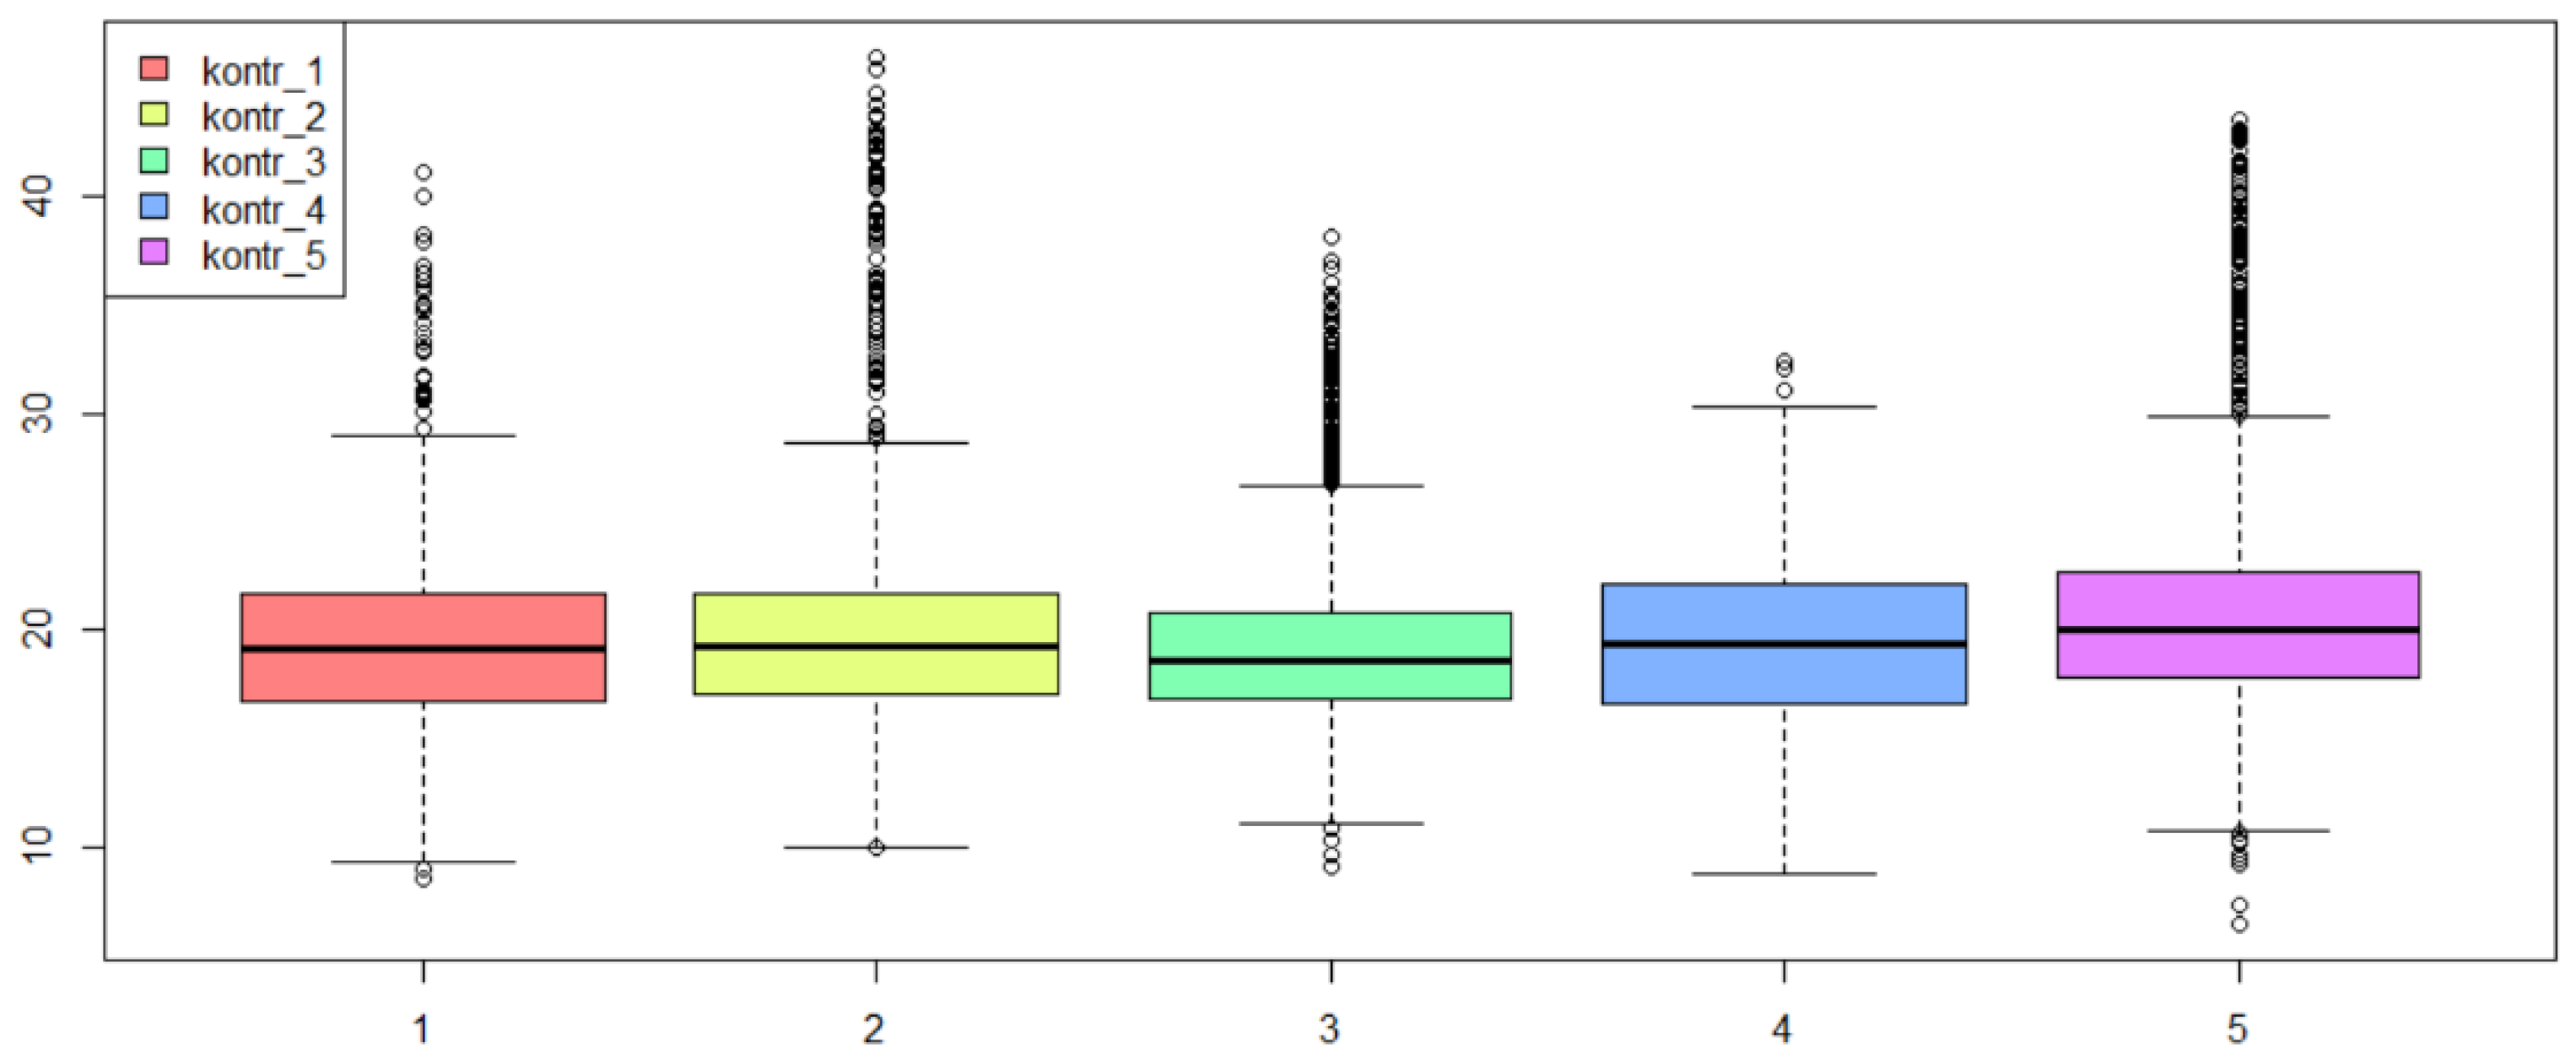
| kontr_1 | kontr_2 | kontr_3 | kontr_4 | kontr_5 | |
|---|---|---|---|---|---|
| Temperature (°C) | |||||
| Minimum | 8.52 | 10.02 | 9.12 | a.l.w. | 6.50 |
| 1st quartile | 16.89 | 17.04 | 16.91 | 16.65 | 17.82 |
| Median | 19.17 | 19.43 | 18.63 | 19.48 | 19.98 |
| 3rd quartile | 21.55 | 21.60 | 20.79 | 22.10 | 22.55 |
| Maximum | 41.07 | 46.38 | 38.35 | 32.41 | 43.53 |
| Humidity (%) | |||||
| Minimum | a.l.w. | a.l.w. | 15.03 | 25.98 | a.l.w. |
| 1st quartile | 18.20 | 19.03 | 19.06 | 19.17 | 18.97 |
| Median | 19.41 | 20.21 | 20.12 | 20.26 | 20.08 |
| 3rd quartile | 20.84 | 21.46 | 21.14 | 21.52 | 21.16 |
| Maximum | b.u.w. | 25.98 | b.u.w. | b.u.w. | b.u.w. |
| Tension (Pa) | |||||
| Minimum | a.l.w. | a.l.w. | a.l.w. | a.l.w. | a.l.w. |
| 1st quartile | 10,298,662 | 10,298,217 | 10,298,851 | 10,289,864 | 10,294,439 |
| Median | 10,301,026 | 10,301,277 | 10,301,153 | 10,300,994 | 10,302,083 |
| 3rd quartile | 10,302,364 | 10,305,138 | 10,302,319 | 10,304,735 | 10,307,376 |
| Maximum | b.u.w. | 10,741,059 | 10,446,672 | 10,803,336 | 10,666,239 |
Publisher’s Note: MDPI stays neutral with regard to jurisdictional claims in published maps and institutional affiliations. |
© 2022 by the authors. Licensee MDPI, Basel, Switzerland. This article is an open access article distributed under the terms and conditions of the Creative Commons Attribution (CC BY) license (https://creativecommons.org/licenses/by/4.0/).
Share and Cite
Grunt, M.; Błażejewski, A.; Pecolt, S.; Królikowski, T. BelBuk System—Smart Logistics for Sustainable City Development in Terms of the Deficit of a Chemical Fertilizers. Energies 2022, 15, 4591. https://0-doi-org.brum.beds.ac.uk/10.3390/en15134591
Grunt M, Błażejewski A, Pecolt S, Królikowski T. BelBuk System—Smart Logistics for Sustainable City Development in Terms of the Deficit of a Chemical Fertilizers. Energies. 2022; 15(13):4591. https://0-doi-org.brum.beds.ac.uk/10.3390/en15134591
Chicago/Turabian StyleGrunt, Maciej, Andrzej Błażejewski, Sebastian Pecolt, and Tomasz Królikowski. 2022. "BelBuk System—Smart Logistics for Sustainable City Development in Terms of the Deficit of a Chemical Fertilizers" Energies 15, no. 13: 4591. https://0-doi-org.brum.beds.ac.uk/10.3390/en15134591