
Carbon Emission Reduction by Bicycle-Sharing in China


1
International College Beijing, China Agricultural University, Beijing 100083, China
2
College of Economics and Management, China Agricultural University, Beijing 100083, China
*
Author to whom correspondence should be addressed.
Energies 2022, 15(14), 5136; https://0-doi-org.brum.beds.ac.uk/10.3390/en15145136
Submission received: 14 June 2022
/
Revised: 4 July 2022
/
Accepted: 12 July 2022
/
Published: 15 July 2022
(This article belongs to the Special Issue Energy Economic Policy of Low Carbon City)
Abstract
:Bicycle-sharing plays an important role in solving the “last mile” problem of Chinese people and promoting the construction of an environment-friendly society. This study assesses the carbon emissions generated in the life cycle of bicycle-sharing, examines the substitution effect of bicycle-sharing, and quantifies the depletion rate of bicycle-sharing in combination with the current rate of electric vehicles in China. The depletion rate of shared bicycles in China is high, roughly 5–15% per year. In addition, we discuss scenarios where the annual growth rate of electric vehicles is 40%, 50%, and 60%. Results show that when electric vehicles’ depletion rate is 5% and the annual growth rate of electric vehicles is 40%, the largest net emission reduction in 2025 is 1.96 million tons. Additionally, when electric vehicles’ depletion rate is 5% and the annual growth rate of electric vehicles is 60%, the smallest net emission reduction totals 1.7 million tons.
1. Introduction
China’s transportation industry, since its reform and opening up, has developed rapidly [1]. However, the development of the transportation industry has brought about significant environmental pollution and greenhouse gas emissions [2,3,4]. At present, the transportation sector generates about a quarter of the total carbon emissions [5], which is a serious obstacle to global environmental-friendly and sustainable development [6,7] and a significant barrier to China’s goal of achieving carbon peaking and carbon neutrality.
Carbon neutrality can be directly achieved using four approaches: clean energy, energy technology, vehicles and row materials, and carbon reduction. Firstly, for clean energy, there are four main types of energy: photovoltaic energy, wind energy, hydro energy, and hydrogen energy [8]. In addition, energy technology consists of energy storage and energy transmission [9]. Moreover, vehicles and row materials include clean energy vehicles and clean energy raw materials [10]. Finally, carbon reduction consists of four components: forest carbon sink, carbon trading system, storage and utilization of CCUS, and carbon monitoring of the monitor [11,12,13,14]. In this paper, we explore the indirect impact of the sharing economy on carbon emission reduction.
With the development of the sharing economy, bicycle-sharing has naturally become an important way to reduce carbon emissions. Currently, there are two main directions of research on the environmental impact of contributing bicycles. The first one is the study of the life cycle of bicycle-sharing, in which the threshold of zero carbon emissions is found by exploring the carbon emissions generated during the life cycle of bicycle-sharing [15,16,17]. Through the analysis of the carbon emission of bicycle-sharing, D’ Almeida et al. took Edinburgh, UK, as a case study, and then obtained the carbon emissions of bicycle-sharing [18]. In studying the substitution effect of bicycle-sharing, for instance, Kou et al. explored the substitution effect in eight cities in the United States [19]. Chen and Liu et al. analyzed the substitution effect of bicycle-sharing in China through the combination of the generated carbon emissions and the substitution effect [20], Chen and Zhang et al. further used a case study of the bicycle-sharing system in New York to expound on the effect of gender on the substitution effect [21], and van Marsbergen et al. investigated the combination of bicycle-sharing and other transportation modes for travel and thus substitution of car travel [22].
Among the current studies on the substitution effect of bicycle-sharing, Shaheen et al. obtained the substitution effect of bicycle-sharing in North America by analyzing the effect of bicycle-sharing on other travel mode preferences [23]. Fishman et al. studied the substitution effect generated by bicycle-sharing in the United States, the United Kingdom, and Australia, respectively [24,25], and Chen et al. obtained the combined emission reduction factor by investigating the substitution effect of bicycle-sharing in China on car and cabs, and the substitution effect of private cars and walking [15]. However, it can be seen that all the substitution effects for bicycle-sharing are static, i.e., the current studies are based on data studies over a certain period while they have not analyzed the impact of the development of electric vehicles on the combined emission reduction factor. Because of the development of electric vehicles, the proportion of fuel vehicles among the total vehicles is reduced. In the case of the total substitution effect of bicycle-sharing, the proportion of fuel vehicles decreases, and the carbon reduction efficiency of bicycle-sharing decreases. Therefore, we call this the “carbon reduction trade-off”.
Additionally, the substitution effect is influenced by the proportion of electric vehicles (EVs). With the introduction of relevant energy policies in China, the development of electric vehicles has been further promoted [26,27,28]. Further, the promotion of electric vehicle development is an important way to reduce emissions and realize the future carbon neutrality goals in China [29,30,31]. In addition, the current research on electric vehicles consists of analysis of the life cycle models of electric vehicles [15,32], the emission reduction options for renewable energy and electric vehicles [33], and the impact of substitution effects on different vehicle materials [34].
At present, there is a dearth of studies that analyze net carbon reduction from a dynamic perspective by combining the current rate of electric vehicles in China with different discount rates. Taking into account the depletion rate of bicycle-sharing, the phenomenon of many brands of bicycle-sharing in China makes it difficult to obtain an accurate overall average depletion rate [35]. For the development of electric vehicles in China, the 14th Five-Year Plan has been formulated, which explicitly aims to vigorously develop clean energy. Therefore, the impact of different depletion rates of bicycle-sharing and different shares of electric vehicles on the emission reduction efficiency of bicycle-sharing is analyzed.
The innovation points of this paper are as follows: (1) The combination of six different alternative transportation options for short trips is more in line with the actual situation; (2) the analysis of the impact of different vehicle depletion rates on carbon emission reduction; (3) the construction of a dynamic emission reduction model for bicycle-sharing according to the development trend of electric vehicles in China; (4) the discussion of the trade-off in the development of electric vehicles and the emission reduction efficiency of bicycle-sharing.
The rest of this paper is organized as follows. Section 2 proposes a research method to obtain the net emission reduction effect of bicycle-sharing through the carbon emission model and carbon emission reduction substitution model of bicycle-sharing. In Section 3, the relevant data sources and future trend analysis are presented. Section 4 discusses the simulation results under different scenarios and compares and analyzes them with the current research results. By discussing the development and future directions regarding bicycle-sharing, Section 5 proposes a series of corresponding policy recommendations. Finally, Section 6 concludes the study.
2. Method
In order to explore the emission reduction effect of bicycle-sharing, there are mainly two parts. To be specific, the first part is the carbon emission model of bicycle-sharing, which generates carbon emissions during the manufacturing, operation, and disposal process of bicycle-sharing. In addition, the second part is the carbon emission reduction model, optimizing people’s travel structure through the substitution effect of bicycle-sharing and then achieving carbon emission reduction. The structure of the module is shown in Figure 1. Further, the variables used in the equations are shown in Table 1, including the parameters, symbols, and variable explanations.
2.1. Carbon Emission Model
We set the initial year as year T. Then, in each year T, there is bicycle-sharing from year T−1, new input bicycles from year T, and depleted bicycles from year T, which is shown in Figure 2. Then, the total number of bicycle-sharing in year T satisfies:
where Input represents the input quantity of shared bicycles in the year T, and Depletion represents the depletion rate of shared bicycles in the year T.
After simplification, not only the actual stock of bicycles in year T but also the carbon emissions generated during the manufacturing, operation, and disposal of bicycle-sharing in year T are obtained:
Then, a carbon reduction substitution model is introduced, which considers the total Tth year distance ridden in bicycle-sharing.
where S represents the total distance of shared bicycle rides, L represents the average distance traveled per bike per day, and Bicycle represents the total number of bicycle-sharing.
2.2. Carbon Emission Reduction Model
In bicycle-sharing travel, it is considered that there exists a total of six potential alternative travel modes to bicycle-sharing, which are online cars, cabs, private cars, walking, subways, and buses. Carbon emission reduction can be realized through the substitution of other travel modes through bicycle-sharing, as shown in Figure 3. First, we introduce the substitution effect of different travel modes:
where represents the distance traveled by different alternative travel modes and represents the substitution ratios and satisfies .
To determine the substitution effect of bicycle-sharing for different modes of travel, we construct the matrix M.
In the matrix elements, i represents the selection of online cars, cabs, private cars, walking, subways, buses, bicycles, and other transportation modes not counted in our examination range as short-distance travel modes. In addition, j = 1 represents the probability of people’s short-distance travel mode selection before the introduction of bicycle-sharing, and j = 2 represents the proportion of people’s short-distance travel mode selection after the introduction of bicycle-sharing.
The element m is obtained through the weighted-average method:
where F represents the frequency of the choice of ride mode k in the nth data source, Ways represents the total number of trip mode choices in the nth data source, and Sum represents the total number of occurrences of ride mode k in the literature.
Further, the substitution effect shares for each type of travel mode are obtained, and the substitution utility is normalized. We consider the substitution effect realized by bicycle-sharing as the combined reduction factor of bicycle-sharing. We obtain the results as follows:
where represents the substitution ratio, R represents the integrated carbon emission reduction factor, and represents the carbon emission factor of travel mode i.
At this point, the total emission reduction A obtained by the substitution effect is obtained:
Subsequently, the reduction is collapsed to obtain the net reduction of bicycle-sharing in year T:
3. Data Preparation
3.1. Determination of the Data Set
Our data set involves four parts. Specifically, data set 1 is the bicycle-sharing data set, including the changes in the number of bicycle-sharing, the depletion rate, and the carbon emissions generated at different stages of the life cycle. Data set 2 is the substitution effect data set, including a variety of short-distance travel modes substituted by bicycle-sharing and the carbon emission factors. In addition, data set 3 is the car data set, including the proportion of online cars, cabs, and various types of cars and the future development. Table 2 shows the data sources. Data set 4 is the bicycle-sharing travel data, which is used to obtain the average travel distance per shared bicycle.
3.2. Number of Bicycle-Sharing and Depletion Rate
The total number of bicycle-sharing is obtained from the Ministry of Transport of the People’s Republic of China [27]. After Internet bicycle-sharing developed explosively, China’s bicycle-sharing market gradually tended to witness steady development. In 2017–2020, the analysis of relevant research reports showed that China’s bicycle-sharing input vehicles were maintained at a level between 16 and 20 million, with the growth rate gradually slowing down, and the market of bicycle-sharing was in a relatively saturated state [28]. Therefore, we estimate that the total number of bicycle-sharing vehicles in China will reach 20 million by 2025.
However, the depletion rate of bicycle-sharing also has a great impact on the total carbon emissions generated when bicycles are operated. When the depletion rate of bicycle-sharing is high, more new bicycle-sharing needs to be invested, hence, in turn, generating increasingly more carbon emissions. In addition, the public data of OFO points out that the depletion rate of bicycles is 5%, but the research results of the Internet analyst Tang [26] indicate that the depletion rate of OFO bicycle-sharing is about 20% while the depletion rate of Mobike bicycles is about 10%.
Therefore, bicycle-sharing in different vehicle depreciation rate scenarios was investigated. Among them, scenario A is a low-depletion scenario, where the annual depletion rate of bicycle-sharing is 5%. Scenario B is a medium-depletion scenario, where the annual depletion rate of bicycle-sharing is 10%. In addition, scenario C is a high-depletion scenario, where the annual depletion rate is 15%. In addition, by combining the 2017–2020 data [27,28], we assumed a constant net growth of 80,000 net bicycle-sharing units per year in China from 2021–2025, which was much lower than in the past. Since the market of bicycle-sharing in China is relatively saturated [37], the total number of bicycle-sharing in 2021–2025 is relatively small, and, therefore, the input and depletion of bicycle-sharing in 2025 under different scenarios are chosen, as shown in Table 3.
Based on our calculation, it is found that the depletion rate of bicycle-sharing largely affects the annual input quantity of bicycle-sharing. However, since the number of bicycle-sharing in China is currently in a relatively saturated state, the net annual increase in the number of bicycle-sharing decreases year by year, resulting in the relative closeness of the input and depletion of bicycle-sharing in 2025.
3.3. Proportion of Each Type of Car
For electric vehicles, data was obtained from the China Association of Automobile Manufacturers (CAAM) [35]. By the end of 2021, the national electric vehicle fleet reached a total of 7.84 million units, accounting for 2.60% of the total number of vehicles, with a 59.25% year-on-year increase in electric vehicles. Meanwhile, China’s 14th Five-Year Plan places much emphasis on vigorously developing clean energy and further promoting the development and popularity of electric vehicles. Therefore, we have reason to believe that the proportion of electric vehicles will gradually increase.
For private cars, we divided the cars into four categories, including low-fuel-consumption cars represented by small cars, medium-fuel-consumption cars represented by SUVs, high-fuel-consumption cars represented by MPVs, and electric cars. Given the data from the China Automobile Dealers Association (CADA) [36], we obtained the proportion of different fuel-consuming cars in China in 2020. Moreover, we obtained the dynamic development changes in different types of cars while considering the development proportion of electric cars.
In terms of online cars, the current operating status in China shows that only low-fuel-consumption cars, medium-fuel-consumption cars, and electric cars will be offered as online cars. Moreover, from the perspective of cabs, most cabs in China are small cars and electric cars, and we believe that only low-fuel-consumption and electric cars will be used as cabs [34]. Next, the changes in the share of different types of vehicles under the three different EV development scenarios were analyzed, as shown in Table 4.
On the whole, there is not much change in the overall proportion of high-fuel-consumption vehicles, and medium-fuel-consumption vehicles and low-fuel-consumption vehicles have a greater impact on the growth of the proportion of electric vehicles. In scenario 1, the annual growth rate of electric vehicles is 40%, and the proportion of electric vehicles will reach 9.99% by 2025. In scenario 2, the annual growth rate of electric vehicles is 50%, and the share of electric vehicles will reach 13.16% by 2025. In scenario 3, the annual growth rate of electric vehicles is 60%, and the share of electric vehicles will reach 17.04% by 2025.
Based on our calculation, the overall proportion of high-fuel-consumption vehicles does not change much, and medium-fuel-consumption vehicles and low-fuel-consumption vehicles have a greater impact on the growth of the proportion of electric vehicles. In scenario 1, the annual growth rate of electric vehicles is 40%, and the proportion of electric vehicles will reach 9.99% by 2025. In scenario 2, the annual growth rate of electric vehicles is 50%, and the share of electric vehicles will reach 13.16% by 2025. In scenario 3, the annual growth rate of electric vehicles is 60%, and the share of electric vehicles will reach 17.04% by 2025.
3.4. Carbon Emission Factors
3.5. Average Travel Distance per Shared Bicycle
For the average driving distance of each shared bicycle, data was obtained from the Shenzhen Municipal Government Data Open platform [37]. Specifically, we extracted the data of 120,000 shared bicycles in Shenzhen in 2021, including the start time and the end time. Moreover, the average daily travel distance of each shared bicycle was obtained by combining the Baidu map API to calculate the mileage of each trip, as shown in Figure 4.
Combined with the related survey results [47,48], we compiled the changes in the average distance of bike-sharing in China from 2016 to 2020, and the obtained results are shown in Figure 5.
We found that overall, there was a huge increase in the distance ridden by shared bicycles from 2016–2017, mainly due to the fact that shared bicycles were in a rapid development stage in 2016 and did not improve overall until 2017 [47]. Regarding the fall in the average distance traveled after 2019, we believe the main reasons are the introduction of relevant policies, the impact of the epidemic on travel, and the emergence of shared electric bikes [47,49].
Finally, based on our calculation, a total average distance of 1606.41 m was obtained by referring to the research results of Chen et al. on the average daily distance traveled by shared bicycles of 1620.51 m. We believe that our research results are similar to those of Chen et al. [7] and consider that the average distance traveled by each shared bicycle in Shenzhen at this time is representative of China.
4. Results
4.1. Substitution Effects
In this section, we analyze the substitution effect on bicycle-sharing and obtain the effect of bicycle-sharing on the choice of other travel modes and the substitution effect on different travel modes. First, the relevant literature and research reports were combined in order to obtain the data of matrix M, as shown in Figure 6.
Based on our calculation, we found that the introduction of bicycle-sharing leads to some changes in people’s choice of short-distance travel modes. On the whole, the probability of people using bicycles as their mode of travel for short trips increases significantly while all other modes of travel decrease. However, the promotion of bicycle-sharing has a greater impact on the substitution of private cars, online cars, and cabs, whereas a smaller impact on travel modes, such as walking and public transportation, is observed. In addition, for other short-distance travel modes, we think the carbon reduction effect of this part is smaller as the impact of bicycle-sharing is smaller and the probability of people choosing to travel is smaller. Therefore, we only considered the impact of bicycle-sharing on six travel options.
At the same time, the substitution ratios for the different modes of travel were obtained, as shown in Table 6.
Based on our calculation, we found that people often use bicycle-sharing instead of private cars, online cars, and cabs as their personal travel mode. Moreover, it is also seen that people use bicycle-sharing less often than the bus, subway, or walking as their travel mode.
The results we obtained for the alternative total distance traveled are shown in Figure 7.
Based on our calculation, we found that from 2017 to 2019, the growth rate of bicycle-sharing was faster and the substitution effect on all types of travel modes also grew faster while in the middle of 2020–2025, with the gradual saturation of the bicycle-sharing market, this effect basically stabilized. Until 2025, the total substitution effect of bicycle-sharing will be higher for online cars, cabs, and private cars, with 358, 344, and 265 million meters, respectively, while the total substitution effect for buses, subways, and walking will be relatively small, with 118, 59, and 69 million meters, respectively.
4.2. Integrated Carbon Emission Reduction Factors
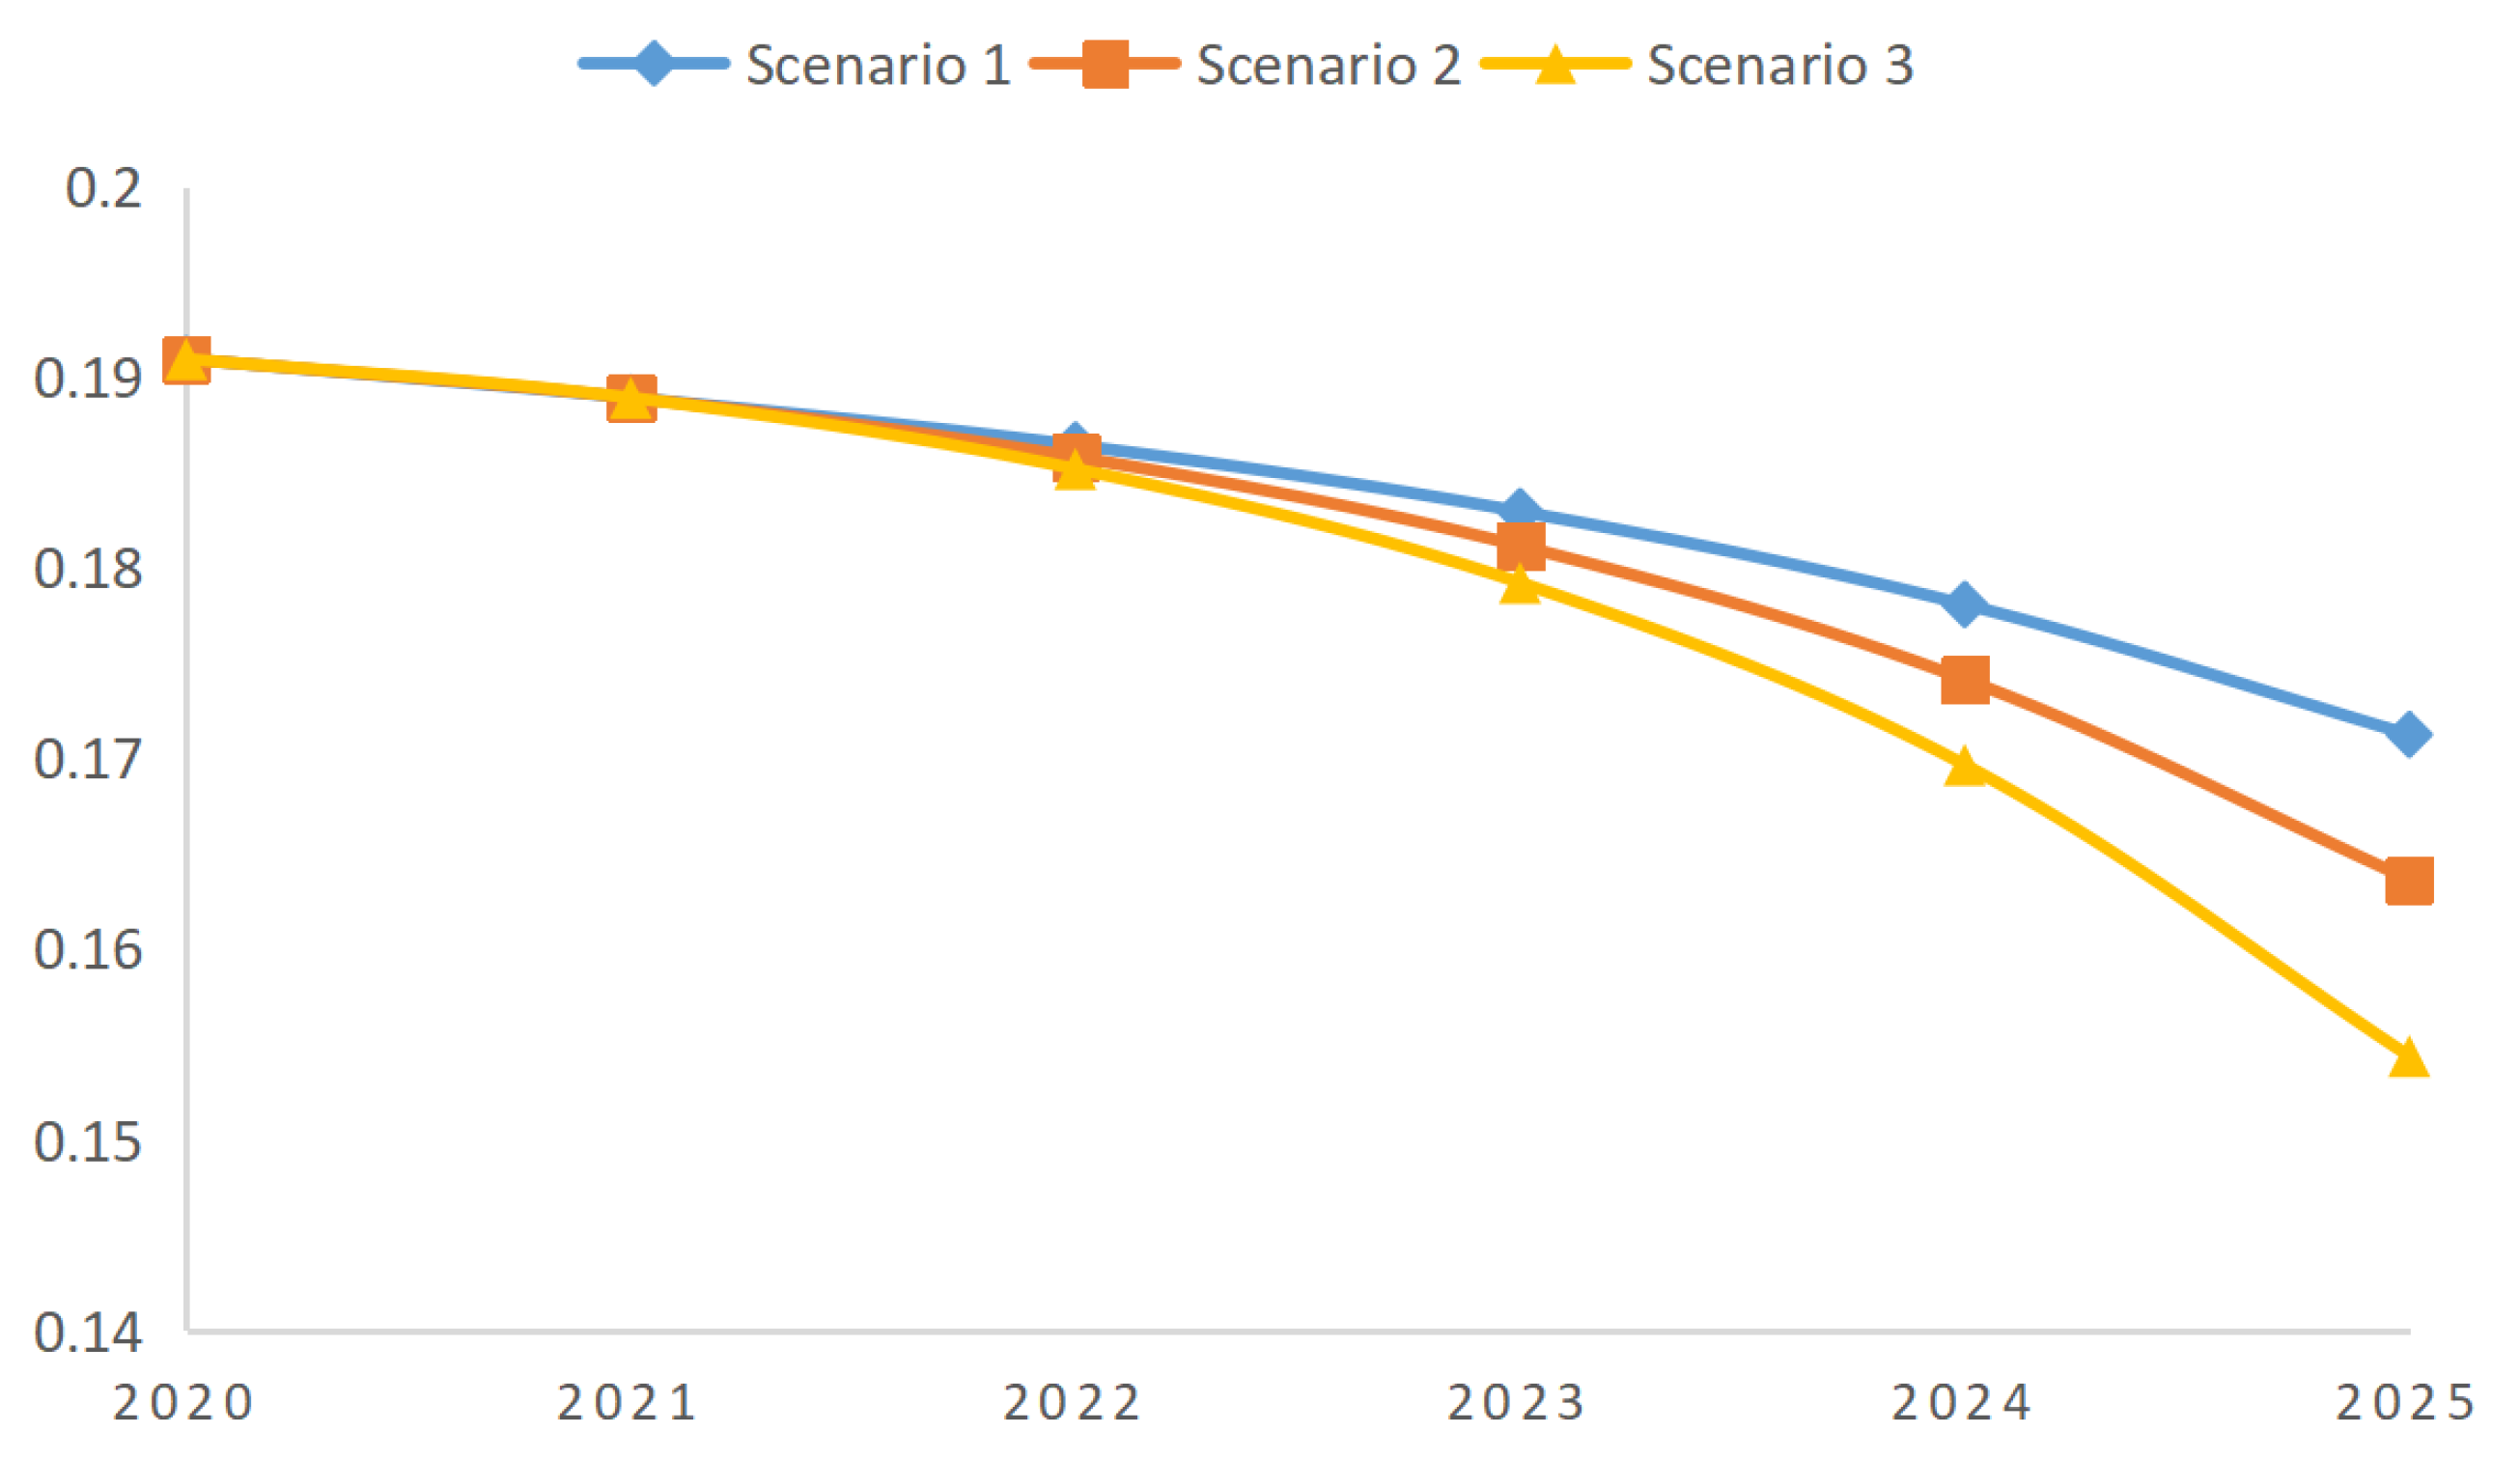
In this section, the development of integrated carbon emission reduction factors in different EV development contexts is discussed. The integrated carbon emission reduction factor was obtained by combining the carbon emission factors of different alternative travel modes for shared bicycle travel in kg CO2/km. The three Chinese electric vehicle development rates were combined and the results obtained, as shown in Figure 8.
Based on our calculation, it was found that the integrated carbon emission reduction factor decreases significantly as the proportion of electric vehicles increases. In scenario 1, the proportion of electric vehicles will reach 9.99% by 2025, and the integrated carbon emission reduction factor will be 0.171 kg CO2/km. In scenario 2, the proportion of electric vehicles will reach 13.16% by 2025, and the integrated carbon emission reduction factor will be 0.164 kg CO2/km. In scenario 3, the proportion of electric vehicles will reach 17.04% by 2025, and the integrated carbon emission reduction factor will be 0.154 kg CO2/km.
4.3. Net Carbon Reduction
In this section, carbon emission, the substitution effect and total net carbon reduction of bicycle-sharing are discussed comprehensively. First, combining with Chen et al.’s study, we conclude that the carbon emissions from the production, operation and maintenance, and disposal phases of bicycle-sharing are 31.45, 1.38, and 1.73 kg CO2, respectively [5]. Then, the total carbon emissions generated under different depletion rates were determined, and the obtained results are shown in Figure 9.
On the whole, we find that the total carbon emissions generated by bicycle-sharing do not change much each year, but the total carbon emissions are influenced more by their depletion rate. In scenario A, the annual depletion rate of bicycle-sharing is 5%, and the total carbon emissions of bicycles in 2025 is 63,300 tons. In scenario B, the annual depletion rate of bicycle-sharing is 10%, and the total carbon emissions of bicycles in 2025 is 96,500 tons. In scenario C, the annual depletion rate of bicycle-sharing is 15%, and the total carbon emissions of bicycles in 2025 is 129,700 tons.
Next, the emission reduction of the bicycle-sharing substitution effect in different electric vehicle percentages was analyzed, as shown in Figure 10.
Based on our calculation, we found that the substitution effect of bicycle-sharing will be affected more by the development of electric vehicles. In scenario 1, the proportion of electric vehicles will reach 9.99% by 2025, and the carbon emission reduction achieved by the substitution effect will be 2.0258 million tons. In scenario 2, the proportion of electric vehicles will reach 13.16% by 2025, and the carbon emission reduction achieved by the substitution effect will be 1,936,000 tons at this time. In addition, in scenario 3, the proportion of electric vehicles will reach 17.04% by 2025, and the carbon emission reduction achieved by the substitution effect will be 1.2863 million tons.
The total net emission reduction of bicycle-sharing was obtained by collating the total carbon emission from the operation of bicycle-sharing and the substitution effect. The results obtained are shown in Figure 11.
Based on our simulation, we found some interesting results. In scenario A, it is shown that the net emission reduction in 2025 for a 5% annual depletion rate of bicycle-sharing is 1.9624, 1.8726, and 1.7630 million tons of CO2 in 2025 for the different EV shares, respectively. In addition, in scenario B, it is shown that the net emission reduction in 2025 for a 5% annual depletion rate of bicycle-sharing is 1.9293, 1.8395, and 1.7298 million tons of CO2 in 2025 for the different EV shares, respectively.
In scenario C, the net emission reduction in 2025 is 1.8961, 1.8633, and 1.6966 million tons of CO2, respectively, with a 15% annual depletion rate of bicycle-sharing. In addition, the development ratio of electric vehicles was found to exert a greater impact on the carbon reduction effect. In contrast, it was found that the carbon emissions generated during the manufacturing, operation, and disposal of bicycle-sharing have less impact on carbon emission reduction.
4.4. Model Comparison
In this section, we compare the integrated carbon emission reduction factor of different studies to verify the accuracy of the model.
Chen et al. determined the combined emission reduction factor of bicycle-sharing to be 0.141 kg CO2/km [5], and Kou et al. determined the combined emission reduction factor of bicycle-sharing to be 0.253 kg CO2/km [19].
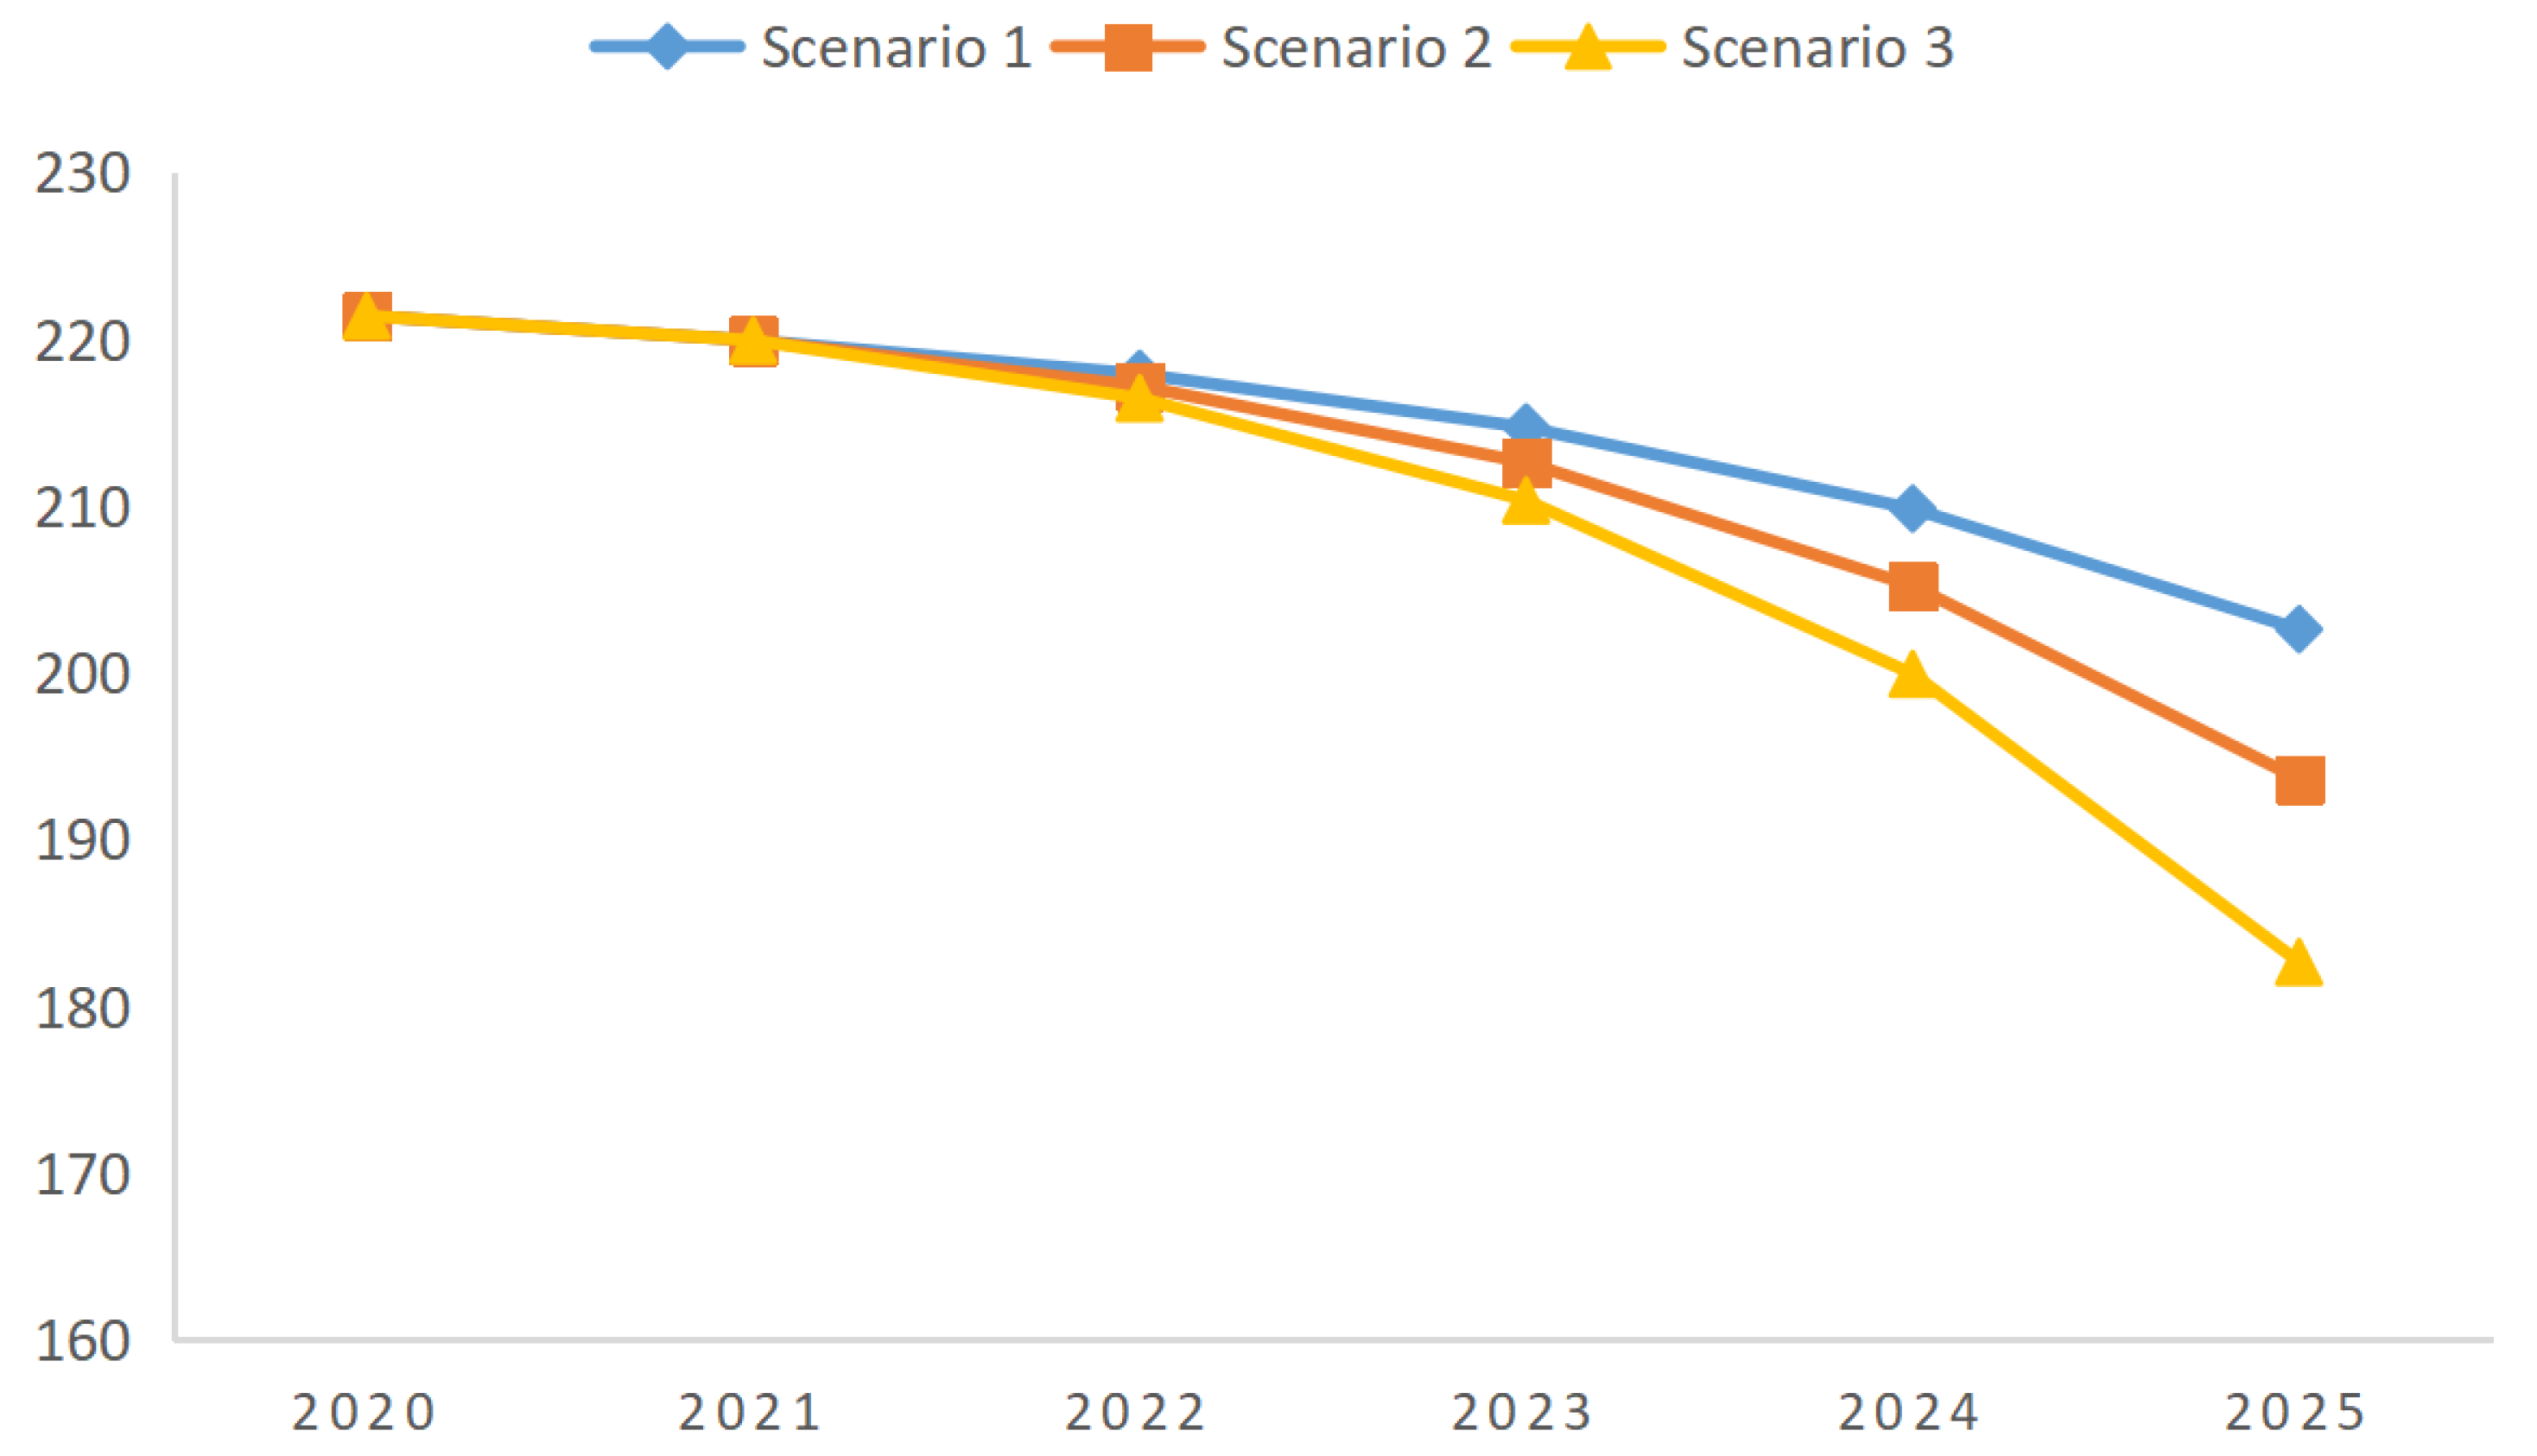
However, considering that the combined emission reduction factor of bicycle-sharing is influenced by different elements, we combined three different ratios of electric vehicles to perform the analysis. The comparison results are shown in Figure 12.
According to our study, the combined emission reduction factor in 2025 will be in the range of 0.154–0.171 kg CO2/km, which is slightly higher than that of Chen’s study and is lower than that of Kou’s study. In our opinion, this is because the integrated carbon emission reduction factor decreases as the proportion of electric vehicles increases in China, which makes our overall combined emission reduction factor in 2025 smaller than the average results of other studies. In addition, it is worth noting that Kou’s study is based on the US context while both our study and Chen’s study are based on the Chinese context, which also contributes to the error.
5. Discussion
In this section, the development and future direction of bicycle-sharing and proposed corresponding policy recommendations are discussed. First of all, the government should improve the corresponding bicycle-sharing regulation policies to reduce the depletion rate of bicycle-sharing. Without making any improvements, the overall depletion rate of bicycle-sharing is between 5% and 15%, which is still within a large depletion range. Our research found that the depletion rate has a relatively small impact on the overall carbon reduction effect, but the depletion of bicycle-sharing still generates a certain amount of wasted resources and human resources. As a result, the waste of resources caused by the depletion of bicycle-sharing also serves as a direction of our future research.
In addition, if the improvement of relevant technological processes by relevant companies during 2022–2025 leads to a reduction in the depletion rate, this will be more conducive to further achieving the goal of carbon emission reduction. It is also important to study the impact of different future policy simulations.
Moreover, in our study, we assumed that electric vehicles do not produce carbon emissions. However, electric vehicles push carbon emissions into a combination of electricity production, which may lead to some carbon emissions. It is essential that this is analyzed in a future study.
In addition, it is essential for the government to reasonably weigh the relationship between electric vehicle development and bicycle-sharing development. In this research, we found that the emission reduction effect of bicycle-sharing had a greater impact on the proportion of electric vehicles. This means an increase in the proportion of electric vehicles would lead to a decrease in the carbon reduction effect of bicycle-sharing to a certain extent. Accordingly, future research should not only reasonably weigh the emission reduction effect achieved by the development of electric vehicles against that achieved by bicycle-sharing but also develop the most optimal development strategy for electric vehicles.
Finally, the government should actively encourage the further development of bicycle-sharing enterprises. Through corresponding environmental protection publicity and policy encouragement, people can be further encouraged to adopt bicycle-sharing as their short-distance travel mode, and China can reach the goal of carbon neutrality as soon as possible.
6. Conclusions
Although the transportation industry plays an important role in the rapidly developing economy of China, it is more important to prevent a series of problems, such as a significant increase in carbon emissions and environmental pollution caused by rapid development, during the process of rapid development. Therefore, bicycle-sharing has emerged and is supported by the government and welcomed by the masses to both solve the problem of the “last mile” for the masses and promote the construction of an environment-friendly society.
In this paper, a dynamic emission reduction model was constructed for bicycle-sharing according to the development trend of electric vehicles in China. In the model, the combination of six different alternative transportation options for short trips is more in line with the actual situation. In addition, we analyzed the impact of different vehicle depletion rates and the development of electric vehicles on carbon emission reduction.
First, from 2017 to 2019, the growth rate of bicycle-sharing was faster and the substitution effect on all types of travel modes grew faster, but in 2020–2025, with the gradual saturation of the bicycle-sharing market, the substitution effect on all types of travel modes will tend to stabilize. Until 2025, the total distance substitution effect of bicycle-sharing will be higher for online cars, cabs, and private cars, with 358, 344, and 265 million meters, respectively, whereas the total distance substitution effect for buses, subways, and walking will be relatively small, with 118, 59, and 69 million meters, respectively.
Secondly, it was also found that the total carbon emissions generated by bicycle-sharing do not change much each year, but the total carbon emissions are influenced by their depletion rate. When the annual depletion rate of bicycle-sharing is 5–15%, the total carbon emission generated by bicycle-sharing in 2025 is 6.33–12.97 million tons.
In addition, the substitution effect of bicycle-sharing will be influenced more by the development of EVs on the whole. To be specific, when the proportion of electric vehicles changes from 9.99% to 17.04% in 2025, the carbon emission reduction achieved by the substitution effect decreases from 2.0258 to 1.8263 million tons. In addition, the development proportion of electric vehicles was found to exert a greater impact on the carbon emission reduction effect, whereas the carbon emissions generated during the manufacturing, operation, and disposal of bicycle-sharing were found to have less impact on carbon emission reduction.
In addition, we believe that carbon emission reductions are affected by the temperature in different regions. Specifically, high temperatures lead to less motivation to ride bicycles, which ultimately leads to lesser carbon emission reduction.
Finally, it was seen that the net emission reduction in 2025 was the largest among all the scenarios when the annual depletion rate of bicycle-sharing is 5% and the proportion of electric vehicles is 9.99%, in which the net carbon reduction is 1.9624 million tons in 2025. By contrast, it was found that the net emission reduction in 2025 was the smallest among all the scenarios when the annual depletion rate of bicycle-sharing is 15% and the proportion of electric vehicles is 17.04%, in which the net carbon emission reduction is 1.6966 million tons in 2025.
Author Contributions
Conceptualization, Z.N. and L.C.; methodology, Z.N.; software, Z.N.; data curation, Z.N.; writing—original draft preparation, Z.N.; writing—review and editing, Z.N. and L.C. All authors have read and agreed to the published version of the manuscript.
Funding
This research received no external funding.
Institutional Review Board Statement
Not applicable.
Informed Consent Statement
Not applicable.
Data Availability Statement
Not applicable.
Acknowledgments
The program is sponsored by the International College, China Agricultural University.
Conflicts of Interest
The authors declare no conflict of interest.
References
- Zhang, Y.J.; Jiang, L.; Shi, W. Exploring the growth-adjusted energy-emission efficiency of transportation industry in China. Energy Econ. 2020, 90, 104873. [Google Scholar] [CrossRef]
- Zhang, Y.J.; Peng, H.R.; Liu, Z.; Tan, W. Direct energy rebound effect for road passenger transport in China: A dynamic panel quantile regression approach. Energy Policy 2015, 87, 303–313. [Google Scholar] [CrossRef]
- Du, H.; Chen, Z.; Peng, B.; Southworth, F.; Ma, S.; Wang, Y. What drives CO2 emissions from the transport sector? A linkage analysis. Energy 2019, 175, 195–204. [Google Scholar] [CrossRef]
- Su, B.; Ang, B.W.; Low, M. Input–Output analysis of CO2 emissions embodied in trade and the driving forces: Processing and normal exports. Ecol. Econ. 2013, 88, 119–125. [Google Scholar] [CrossRef]
- McCollum, D.L.; Wilson, C.; Bevione, M.; Carrara, S.; Edelenbosch, O.Y.; Emmerling, J.; Guivarch, C.; Karkatsoulis, P.; Keppo, I.; Krey, V.; et al. Interaction of consumer preferences and climate policies in the global transition to low-carbon vehicles. Nat. Energy 2018, 3, 664–673. [Google Scholar] [CrossRef]
- Creutzig, F.; Jochem, P.; Edelenbosch, O.Y.; Mattauch, L.; Van Vuuren, D.P.; McCollum, D.; Minx, J. Transport: A roadblock to climate change mitigation? Science 2015, 350, 911–912. [Google Scholar] [CrossRef] [Green Version]
- Zhou, P.; Sun, Z.R.; Zhou, D.Q. Optimal path for controlling CO2 emissions in China: A perspective of efficiency analysis. Energy Econ. 2014, 45, 99–110. [Google Scholar] [CrossRef]
- Zou, C.; Xiong, B.; Xue, H.; Zheng, D.; Ge, Z.; Wang, Y.; Wu, S. The role of clean energy in carbon neutral. Pet. Explor. Dev. 2021, 48, 480–491. [Google Scholar] [CrossRef]
- Neetzow, P.; Pechan, A.; Eisenack, K. Electricity storage and transmission: Complements or substitutes? Energy Econ. 2018, 76, 367–377. [Google Scholar] [CrossRef] [Green Version]
- Zeng, I.Y.; Chen, J.; Niu, Z.; Liu, Q.; Wu, T. The GHG Emissions Assessment of Online Car-Hailing Development under the Intervention of Evaluation Policies in China. Sustainability 2022, 14, 1908. [Google Scholar] [CrossRef]
- Li, W.; Long, R.; Chen, H.; Yang, M.; Chen, F.; Zheng, X.; Li, C. Would personal carbon trading enhance individual adopting intention of battery electric vehicles more effectively than a carbon tax? Resour. Conserv. Recycl. 2019, 149, 638–645. [Google Scholar] [CrossRef]
- Zhang, X.; Li, F.; Wang, J.; Zhao, H.; Yu, X.F. Strategy for improving the activity and selectivity of CO2 electroreduction on flexible carbon materials for carbon neutral. Appl. Energy 2021, 298, 117196. [Google Scholar] [CrossRef]
- Ng, W.Y.; Low, C.X.; Putra, Z.A.; Aviso, K.B.; Promentilla, M.A.B.; Tan, R.R. Ranking negative emissions technologies under uncertainty. Heliyon 2020, 6, e05730. [Google Scholar] [CrossRef]
- Jiang, J.; Xie, D.; Ye, B.; Shen, B.; Chen, Z. Research on China’s cap-and-trade carbon emission trading scheme Overview and outlook. Appl. Energy 2016, 178, 902–917. [Google Scholar] [CrossRef]
- Chen, J.; Zhou, D.; Zhao, Y.; Wu, B.; Wu, T. Life cycle carbon dioxide emissions of bicycle-sharing in China: Production, operation, and recycling. Resour. Conserv. Recycl. 2020, 162, 105011. [Google Scholar] [CrossRef]
- Mao, G.; Hou, T.; Liu, X.; Zuo, J.; Kiyawa, A.I.; Shi, P.; Sandhu, S. How can bicycle-sharing have a sustainable future? A research based on life cycle assessment. J. Clean. Prod. 2021, 282, 125081. [Google Scholar] [CrossRef]
- Luo, H.; Kou, Z.; Zhao, F.; Cai, H. Comparative life cycle assessment of station-based and dock-less bike sharing systems. Resour. Conserv. Recycl. 2019, 146, 180–189. [Google Scholar] [CrossRef]
- D’Almeida, L.; Rye, T.; Pomponi, F. Emissions assessment of bicycle-sharing schemes: The case of Just Eat Cycles in Edinburgh, UK. Sustain. Cities Soc. 2021, 71, 103012. [Google Scholar] [CrossRef]
- Kou, Z.; Wang, X.; Chiu, S.F.; Cai, H. Quantifying greenhouse gas emissions reduction from bicycle share systems: A model considering real-world trips and transportation mode choice patterns. Resour. Conserv. Recycl. 2020, 153, 104534. [Google Scholar] [CrossRef]
- Chen, W.; Liu, Q.; Zhang, C.; Mi, Z.; Zhu, D.; Liu, G. Characterizing the stocks, flows, and carbon impact of dockless sharing bicycles in China. Resour. Conserv. Recycl. 2020, 162, 105038. [Google Scholar] [CrossRef]
- Chen, Y.; Zhang, Y.; Coffman, D.; Mi, Z. An environmental benefit analysis of bicycle-sharing in New York City. Cities 2022, 121, 103475. [Google Scholar] [CrossRef]
- Van Marsbergen, A.; Ton, D.; Nijënstein, S.; Annema, J.A.; van Oort, N. Exploring the role of bicycle-sharing programs in relation to urban transit. Case Stud. Transp. Policy 2022, 10, 529–538. [Google Scholar] [CrossRef]
- Shaheen, S.; Martin, E. Unraveling the modal impacts of bicyclesharing. ACCESS Mag. 2015, 1, 8–15. [Google Scholar]
- Fishman, E.; Washington, S.; Haworth, N. Bicycle share’s impact on car use: Evidence from the United States, Great Britain, and Australia. Transp. Res. Part D-Transp. Environ. 2014, 31, 13–20. [Google Scholar] [CrossRef] [Green Version]
- Fishman, E.; Washington, S.; Haworth, N. Bicycle share: A synthesis of the literature. Transp. Rev. 2013, 33, 148–165. [Google Scholar] [CrossRef] [Green Version]
- Wang, H.K.; Fu, L.X.; Wang, M.; Yao, Z.L. Vehicle technologies, fuel-economy policies, and fuel-consumption rates of Chinese vehicle. Energy Policy 2012, 43, 30–36. [Google Scholar]
- Bartocci, A.; Pisani, M. Green fuel tax on private transportation services and subsidies to electric energy. A model-based assessment for the main European countries. Energy Econ. 2013, 40, S32–S57. [Google Scholar] [CrossRef]
- Ong, H.C.; Mahlia, T.M.I.; Masjuki, H.H. A review on energy pattern and policy for transportation sector in Malaysia. Renew. Sustain. Energy Rev. 2012, 16, 532–542. [Google Scholar] [CrossRef]
- Hepburn, C.; Qi, Y.; Stern, N.; Ward, B.; Xie, C.; Zenghelis, D. Towards carbon neutrality and China’s 14th Five-Year Plan: Clean energy transition, sustainable urban development, and investment priorities. Environ. Sci. Ecotechnol. 2021, 8, 100130. [Google Scholar] [CrossRef]
- Howden-Chapman, P.; Keall, M.; Whitwell, K.; Chapman, R. Evaluating natural experiments to measure the co-benefits of urban policy interventions to reduce carbon emissions in New Zealand. Sci. Total Environ. 2020, 700, 134408. [Google Scholar] [CrossRef]
- Yan, X.Y.; Crookes, R.J. Life cycle analysis of energy use and greenhouse gas emissions for road transportation fuels in China. Renew. Sustain. Energy Rev. 2009, 13, 2505–2514. [Google Scholar] [CrossRef]
- Li, T.; Sun, J.; Shi, C.; Yun, F.; Zhang, Q.; Tao, H. Carbon emission accounting and assessment in the life cycle of large public buildings. Green Techonol. 2017, 16, 13–15. [Google Scholar]
- Bellocchi, S.; Gambini, M.; Manno, M.; Stilo, T.; Vellini, M. Positive interactions between electric vehicles and renewable energy sources in CO2-reduced energy scenarios: The Italian case. Energy 2018, 161, 172–182. [Google Scholar] [CrossRef]
- Kawajiri, K.; Kobayashi, M.; Sakamoto, K. Lightweight materials equal lightweight greenhouse gas emissions: A historical analysis of greenhouse gases of vehicle material substitution. J. Clean. Prod. 2020, 253, 119805. [Google Scholar] [CrossRef]
- Eastmoney. Available online: https://finance.eastmoney.com/news/1355,20161224696938357.html (accessed on 10 February 2022).
- Ministry of Transport of the People’s Republic of China. Available online: https://www.mot.gov.cn/ (accessed on 10 February 2022).
- Forward Industry Research Institute. Available online: https://www.qianzhan.com/analyst/detail/220/210712-cc7a5dd7.html (accessed on 10 February 2022).
- iResearch. Available online: https://www.iresearch.com.cn/Detail/report?id=2961&isfree=0 (accessed on 10 February 2022).
- China Academy of Information and Communications Technology (CAICT). 2018 Report on the Development of China’s Bicycle-sharing Industry. Available online: http://www.caict.ac.cn/kxyj/qwfb/ztbg/201804/P020180320523449466152.pdf (accessed on 10 February 2022).
- 36kr. Available online: https://36kr.com/p/1722342096897 (accessed on 10 February 2022).
- Carbonstop. Available online: http://2018.carbonstop.net/carbon_calculator/standard/ (accessed on 10 February 2022).
- Huaon. Available online: https://www.huaon.com/channel/trend/739739.html (accessed on 10 February 2022).
- Sohu. Available online: https://www.sohu.com/a/202827464_824138 (accessed on 10 February 2022).
- China Association of Automobile Manufacturers (CAAM). Available online: http://www.caam.org.cn/search/con_5235354.html (accessed on 10 February 2022).
- China Automobile Dealers Association (CADA). Available online: http://cada.cn/ (accessed on 10 February 2022).
- Shenzhen Municipal Government Data Open Platform. Available online: https://opendata.sz.gov.cn/ (accessed on 10 February 2022).
- Iimedia. Available online: https://www.iimedia.cn/c400/75039.html (accessed on 4 July 2022).
- Cnr. Available online: http://sz.cnr.cn/szfwgb/szyw/20200825/t20200825_525226601.shtml (accessed on 4 July 2022).
- Forward Industry Research Institute. Available online: https://www.qianzhan.com/analyst/detail/220/210207-039c2e47.html (accessed on 4 July 2022).
Figure 1.
The structure of the module.

Figure 2.
Carbon emission model.

Figure 3.
Substitution effect of different travel modes.

Figure 4.
Average travel distance per shared bike.

Figure 5.
Average travel distance from 2016–2021.

Figure 6.
The substitution effect of bicycle-sharing.

Figure 7.
Total alternative distance travelled by the six modes of travel (million meters).

Figure 8.
Integrated carbon emission reduction factors.

Figure 9.
Total carbon emissions generated under different depletion rates (10,000 tons).

Figure 10.
Emission reduction of the bicycle-sharing substitution effect (10,000 tons).

Figure 11.
Total net emission reduction of bicycle-sharing.


Figure 12.
Comparison of integrated carbon emission reduction factors.


Table 1.
Variable description.
| Parameter (Unit) | Symbol | Explanation and References |
|---|---|---|
| Number of shared bicycle (unit) | Bicycle | [36,37] |
| Depletion of shared bicycles | Depletion | Retrieved from simulation |
| Input of shared bicycles | Input | Retrieved from simulation |
| Carbon emission | β | [15] |
| Average distance traveled per bike per day | L | Retrieved from simulation |
| Distance traveled by alternative travel modes | X | Retrieved from simulation |
| Substitution ratio | θ | Retrieved from simulation |
| Total distance shared bicycle rides | S | Retrieved from simulation |
| Selection probability | m | [38,39,40] |
| Integrated carbon emission reduction factor | R | Retrieved from simulation |
| Carbon emission factor | α | [41] |
| Total emission reduction | A | Retrieved from simulation |
| Net carbon reduction of bicycle-sharing | NA | Retrieved from simulation |
Table 2.
Data set.
| Source | Content | Use for Reference |
|---|---|---|
| Chen et al. [15] | Carbon emissions from bicycle-sharing | Data set 1 |
| Eastmoney [35] | Bicycle-sharing depletion rate | |
| Shaheen et al. [23] | The impact of bicycle-sharing on different travel options | Data set 2 |
| Fishman et al. [24] | ||
| Fishman et al. [25] | ||
| iResearch [38] | ||
| CAICT [39] | ||
| 36 kr [40] | ||
| Carbonstop [41] | Carbon emission factors for each type of travel mode | |
| Ministry of Transport of The People’s Republic of China [36] | The stock of online bicycles, bicycle-sharing, and cabs | Data set 3 |
| Huaon [42] | Cab development analysis | |
| Sohu [43] | ||
| Foresight Industry Research Institute [37] | Analysis of the development of bicycle-sharing | |
| CAAM [44] | Analysis of the development of cars | |
| CADA [45] | ||
| Shenzhen Municipal Government Data Open platform [46] | Bicycle-sharing travel data | Data set 4 |
Table 3.
Input and depletion of bicycle-sharing in 2025.
| 2019 | 2020 | 2021 | 2022 | 2023 | 2024 | 2025 | ||
|---|---|---|---|---|---|---|---|---|
| Scenario A | Depletion | 97.00 | 98.00 | 98.40 | 98.80 | 99.20 | 99.60 | 100.00 |
| Input | 110.30 | 108.00 | 106.40 | 106.80 | 107.20 | 107.60 | 108.00 | |
| Scenario B | Depletion | 194.70 | 196.00 | 196.80 | 197.60 | 198.40 | 199.20 | 200.00 |
| Input | 208.30 | 206.00 | 204.80 | 205.60 | 206.40 | 207.20 | 208.00 | |
| Scenario C | Depletion | 293.50 | 294.00 | 295.20 | 296.40 | 297.60 | 298.80 | 300.00 |
| Input | 305.00 | 304.00 | 303.20 | 304.40 | 305.60 | 306.80 | 308.00 |
Table 4.
Share of different types of vehicles.
| 2020 | 2021 | 2022 | 2023 | 2024 | 2025 | ||
|---|---|---|---|---|---|---|---|
| Scenario 1 | Electric vehicles | 1.75% | 2.60% | 3.64% | 5.10% | 7.13% | 9.99% |
| Low fuel consumption | 45.78% | 45.39% | 44.90% | 44.23% | 43.28% | 41.95% | |
| Medium fuel consumption | 46.57% | 46.17% | 45.67% | 44.98% | 44.02% | 42.67% | |
| High fuel consumption | 5.90% | 5.84% | 5.78% | 5.69% | 5.57% | 5.40% | |
| Scenario 2 | Electric vehicles | 1.75% | 2.60% | 3.90% | 5.85% | 8.78% | 13.16% |
| Low fuel consumption | 45.78% | 45.39% | 44.78% | 43.87% | 42.51% | 40.47% | |
| Medium fuel consumption | 46.57% | 46.17% | 45.55% | 44.63% | 43.24% | 41.16% | |
| High fuel consumption | 5.90% | 5.84% | 5.77% | 5.65% | 5.47% | 5.21% | |
| Scenario 3 | Electric vehicles | 1.75% | 2.60% | 4.16% | 6.66% | 10.65% | 17.04% |
| Low fuel consumption | 45.78% | 45.39% | 44.66% | 43.50% | 41.64% | 38.66% | |
| Medium fuel consumption | 46.57% | 46.17% | 45.43% | 44.25% | 42.35% | 39.32% | |
| High fuel consumption | 5.90% | 5.84% | 5.75% | 5.60% | 5.36% | 4.98% |
Table 5.
Carbon emission factors of each travel mode.
| Type | Carbon Emission Factors (kg CO2/km) |
|---|---|
| Low fuel consumption | 0.27 |
| Medium fuel consumption | 0.3 |
| High fuel consumption | 0.41 |
| Bus | 0.01 |
| Subway | 0.1 |
Table 6.
Substitution ratios for the different modes of travel.
| Traveling Method | Replacement Ratio |
|---|---|
| Private car | 22.43% |
| Bus | 9.97% |
| Subway | 4.98% |
| Walking | 3.32% |
| Cab | 29.07% |
| Online cars | 30.23% |
Publisher’s Note: MDPI stays neutral with regard to jurisdictional claims in published maps and institutional affiliations. |
© 2022 by the authors. Licensee MDPI, Basel, Switzerland. This article is an open access article distributed under the terms and conditions of the Creative Commons Attribution (CC BY) license (https://creativecommons.org/licenses/by/4.0/).
Share and Cite
MDPI and ACS Style
Niu, Z.; Chai, L. Carbon Emission Reduction by Bicycle-Sharing in China. Energies 2022, 15, 5136. https://0-doi-org.brum.beds.ac.uk/10.3390/en15145136
AMA Style
Niu Z, Chai L. Carbon Emission Reduction by Bicycle-Sharing in China. Energies. 2022; 15(14):5136. https://0-doi-org.brum.beds.ac.uk/10.3390/en15145136
Chicago/Turabian StyleNiu, Ziheng, and Li Chai. 2022. "Carbon Emission Reduction by Bicycle-Sharing in China" Energies 15, no. 14: 5136. https://0-doi-org.brum.beds.ac.uk/10.3390/en15145136
Note that from the first issue of 2016, this journal uses article numbers instead of page numbers. See further details here.