1. Introduction
The fuel-cladding system plays a critical role in nuclear power plants (NPPs) as the first level of defence against the release of radioactive substances. Uranium dioxide (UO
2) and zirconium (Zr) alloys have been employed as fuel and cladding materials, respectively, for over 60 years in light water reactors (LWRs). However, in 2011, the severe accident at the Fukushima Daiichi NPP revealed the inherent vulnerability of these materials. Particularly, in a loss-of-coolant accident scenario, the Zr cladding undergoes an exothermic oxidation with high-temperature steam. The oxidation heat, coupled with the inevitable decay heat, accelerate the rate of temperature increase in the core. The oxidation also produces large amounts of ignitable free hydrogen. Consequently, core meltdown and gas explosion could ensue, as witnessed at Fukushima. In response, the nuclear industry was driven to explore alternative fuel and cladding materials that would enhance the safety and reliability of NPPs. Thus, accident-tolerant fuels (ATFs) have been proposed [
1,
2].
One of the most promising long-term ATF cladding materials is ceramic-based silicon carbide (SiC) [
3,
4,
5]. In comparison with Zr alloys, SiC is anticipated to deliver an overall improved performance in LWRs at both normal and accident conditions due to its higher resistance to oxidation, wear, and creep; higher melting and sublimation point; higher strength; lower neutron-induced activation; smaller thermal neutron absorption cross-section; chemical inertness with both the fuel and coolant; and longer lifetime expectancy at higher burnup. In general, irradiation poses minimum effects on SiC, with the exception of a measured reduction in its thermal conductivity and fracture toughness. Various ongoing research efforts are invested in exploring ways to overcome such limitations. More details can be found in the literature [
6,
7,
8,
9].
Much of the early research on monolithic ceramics is focused on the compensation of their brittle nature. One approach has been the production of composites that incorporate ceramic fibres reinforced in a ceramic matrix. The matrix provides load distribution across the composite structure to protect the fibres. Different fibre winding and braiding patterns have also been investigated to further improve the material strength. The description and evaluation of potential fibre techniques can be found in [
9,
10,
11,
12]. In the case of SiC, SiC fibres are embedded in the SiC matrix to give a rise to the SiC/SiC composite. This composite has gained considerable commercial traction over the past decade, especially in high-temperature hostile applications. For example, within the aeronautic industry, SiC/SiC composites have successfully replaced Nickle (Ni) alloy components in jet engines. With continual advancements in the engineering production of ceramic composites, SiC/SiC of a nuclear grade is now possible to manufacture [
1].
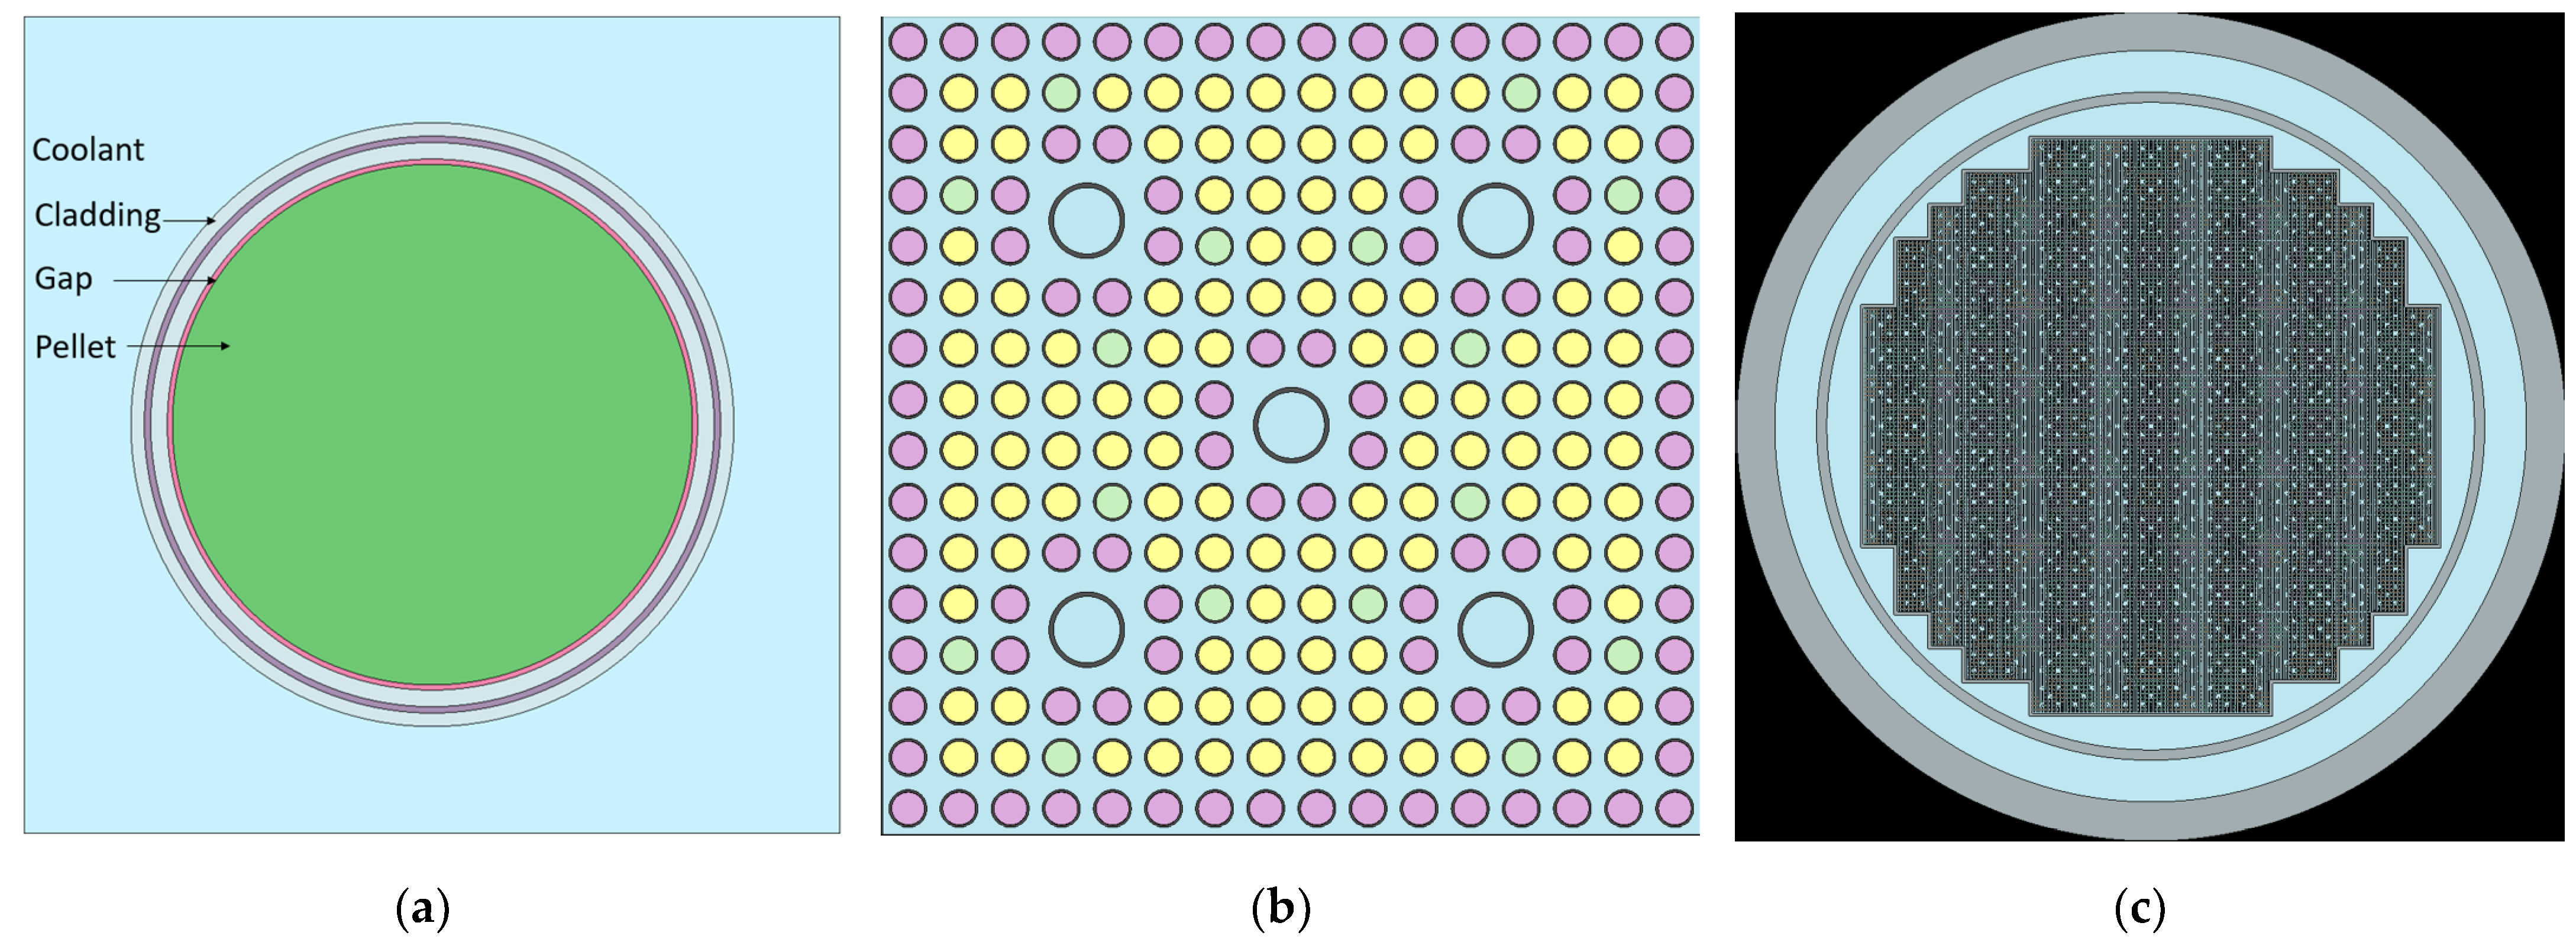
A prevalent SiC/SiC composite used in ATF cladding concepts is the “sandwich” design, led and patented by the CEA. As shown in
Figure 1, it consists of a thin metallic liner placed in between two layers of SiC/SiC composites. A typical fuel rod cladding has a thickness of ~0.6 mm. Hence, the inner and outer thicknesses are 0.2–0.5 mm and 0.3–1 mm, respectively, to ensure the rod is viable for the current fleet of LWRs. Based on this, the CEA found that an optimum liner thickness of 50–100 µm was sufficient to compensate for the hermicity of SiC without the risk of embrittlement by the excessive plastic deformation of the metal under reactor stresses. Furthermore, it was found that such thickness would not introduce large neutron penalties, which is a typical neutronic characteristic associated with refractory metals or alloys. Thus, it would not affect the overall absorption cross-section of the cladding. Lastly, it was found that this thickness would also not cause any obstacles for employing conventional end-plug joining techniques such as welding to seal the cladding, which is one of the main advantages promoted for this sandwich design [
13,
14].
The SiC/SiC composite is applied to both the inner and outer surfaces because it offers higher flexural stress and strain resistance. This is important for claddings as they are long and thin walled, which makes them susceptible to buckling under a wide array of situations, e.g., fuel handling, shipping, or deformation by circumferential heterogeneities in temperature and neutron flux. The liner is included to ensure leak tightness, provide bonding between the fibre and matrix, as well as assist in the deflection of cracks. Several metallics have been studied because the material must be able to withstand extreme temperatures presented during the interphase fabrication and matrix densification stages. It must also be thermochemically compatible and stable with the SiC/SiC composite cladding and surrounding H
2O coolant. Based on the studies conducted by the CAE under normal and off-normal operation conditions, it was deduced that current favourable liner candidates are Niobium (Nb) and Tantalum (Ta) [
14,
15,
16,
17].
Figure 1.
CAE SiC/SiC composite cladding design [
11,
16].
Figure 1.
CAE SiC/SiC composite cladding design [
11,
16].
To ensure safe, reliable, and economical nuclear power generation with new fuel-cladding materials over a desired NPP lifetime, reactor engineers must be confident that the core conditions will not deviate or breach any imposed operational limits enforced by regulatory bodies. Some typical core design constraints include maintaining criticality, negative reactivity coefficient, and minimum power oscillations. The prediction of such information entails the execution of numerous full-core calculations with many depletion steps and different configurations per step [
18]. The process is complex due to the coupled neutronics, thermal hydraulics, and structure mechanics that need to be addressed [
16,
19].
With regard to neutronics, calculations are performed at numerous state points in a lattice physics code to cover core operation conditions with respect to both space and energy using neutron transport theory. In these state points, various neutronic characteristics such as the multiplication factor are updated to account for feedback effects caused by temperature, density, boron concentration, and so on. These data are simultaneously gathered to generate macroscopic cross-section tables that can then be fed into nodal routines. As a result, changes in criticality overtime brought about by the fission reaction, fuel composition depletion, and isotope evolution can be examined [
19,
20].
A number of eminent papers have been published on the neutronic performance of various ATF concepts via different codes. One example is the work of Alam et al. [
21] whereby the researchers used WIMS-10 to study a small modular reactor assembly with micro-heterogeneous duplex fuel. Another example is Naceur and Marleau [
22] who used DRAGON5 to assess SS-310, FeCrAl/APTAM, and Zr coated with SiC in a CANDU reactor assembly. For similar materials, George et al. [
23] used SCALE/TRITON from SCALE 6.1.2 to perform 2D pin cell calculations based on a Westinghouse 17 × 17 PWR fuel rod. A parallel investigation was conducted by Mustafa, but with a Monte Carlo N-particle extended (MCNPX) code. A general consensus is that SiC reveals superior performance in comparison to Zr alloy claddings. However, these studies used monolithic SiC cladding and not composite SiC/SiC. Additionally, the majority were restricted to pin cell level with only a few at assembly level.
For a better understanding of the neutronic behaviour presented by ATFs in a LWRs, the neutron transport theory must be extended to core level. Therefore, the aim of this work is to examine the neutronics performance of SiC/SiC ‘sandwich’ design cladding in a pressurised water reactor (PWR) under normal operation conditions at two-dimensional pin cell, assembly, and core levels. The lattice physics calculations are carried out through Monte Carlo methods embedded in a Serpent Version 2.31 (Serpent 2) physics lattice code. The main neutronics of interest investigated herein include criticality, power distribution, and burnup. To establish the extent of variation in neutronic behaviour due to SiC/SiC cladding, the results are compared against ZIRLOTM cladding for the initial fuel cycle.
The content is organised as follows:
Section 2 describes the plant geometry and fuel rod material compositions;
Section 3 details the Serpent 2 code and the input parameters;
Section 4 presents and discusses the simulation results at the pin cell, assembly, and core levels; finally,
Section 5 concludes with a summary of the main outputs.
4. Pin Cell Model Analysis
On a pin level, the effect of (A) metallic liner, (B) the thermal conductivity of irradiated SiC, and (C) the thickness ratios of cladding constituents on the multiplication factor, neutron spectrum, and Pu-239 production were examined for a fuel enriched at 3.14 w/o.
4.1. Case A: Metallic Liners
Metallic liners are included in the “sandwich” design to provide leak tightness. The current favourable candidates are niobium (Nb) and tantalum (Ta) [
8,
9].
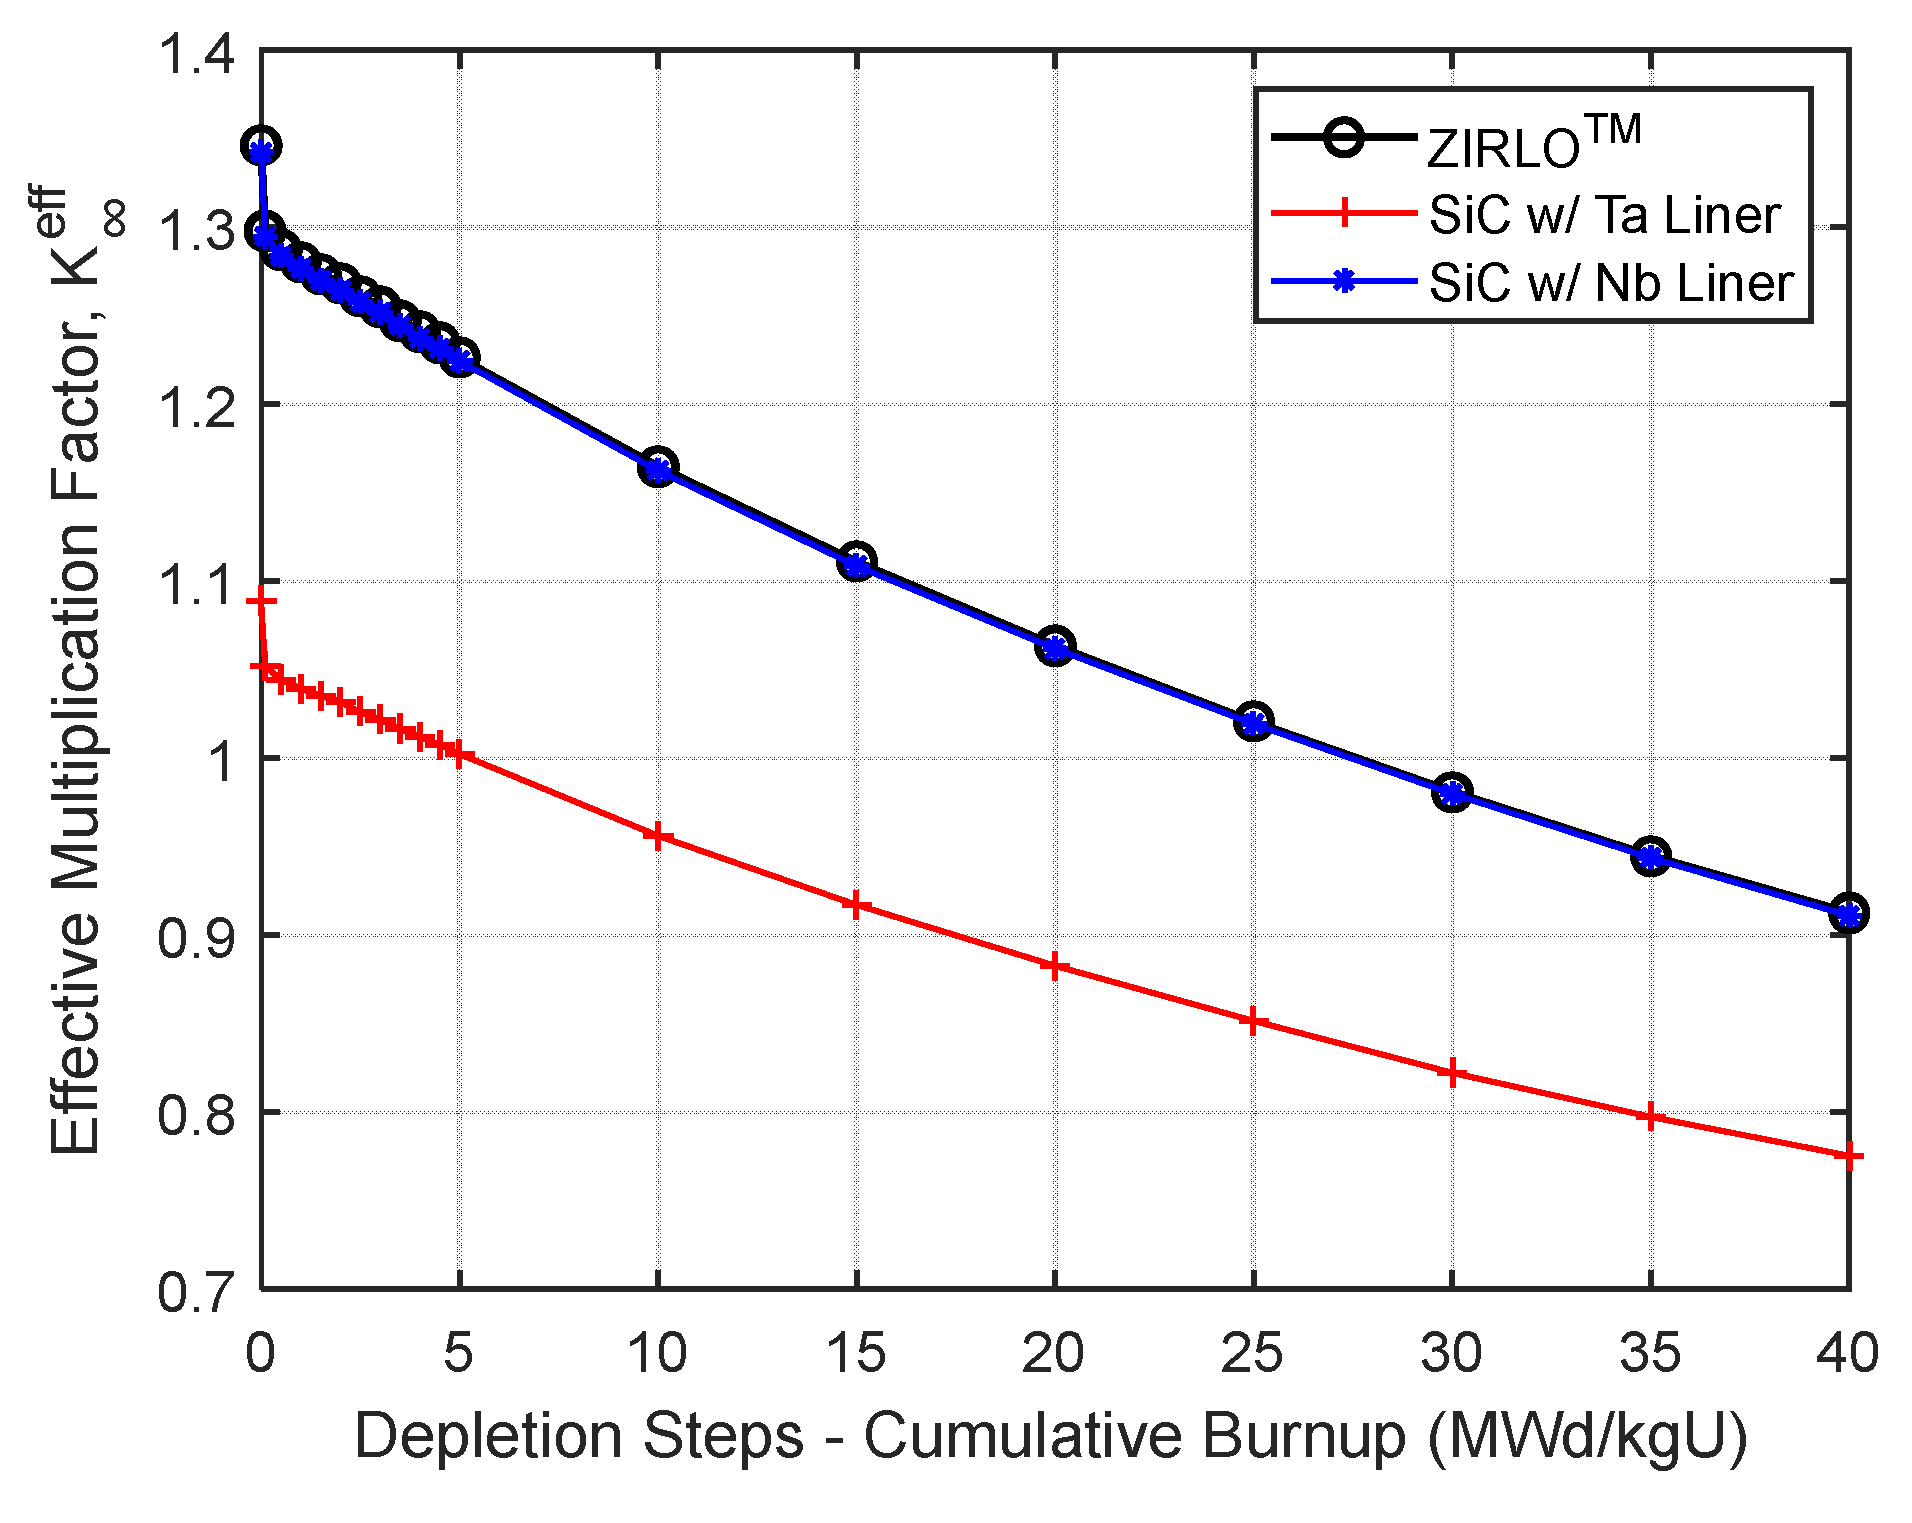
Figure 5 presents the influence of Ta liner on Model 1 and Nb liner on Model 2 on the multiplication factor with respect to burnup. The behaviours exhibited by the proposed liners were very different from each other. Compared to the ZIRLO
TM cladding, Model 2 showed negligible disparity whilst Model 1 showed a drastic disparity. At the BOC, Model 1 yielded to a multiplication factor of 1.09, which was 20% lower than Model 2 and the datum. At this stage of the cycle, the reactor condition was clean (no neutron poison) and cold (room temperature).
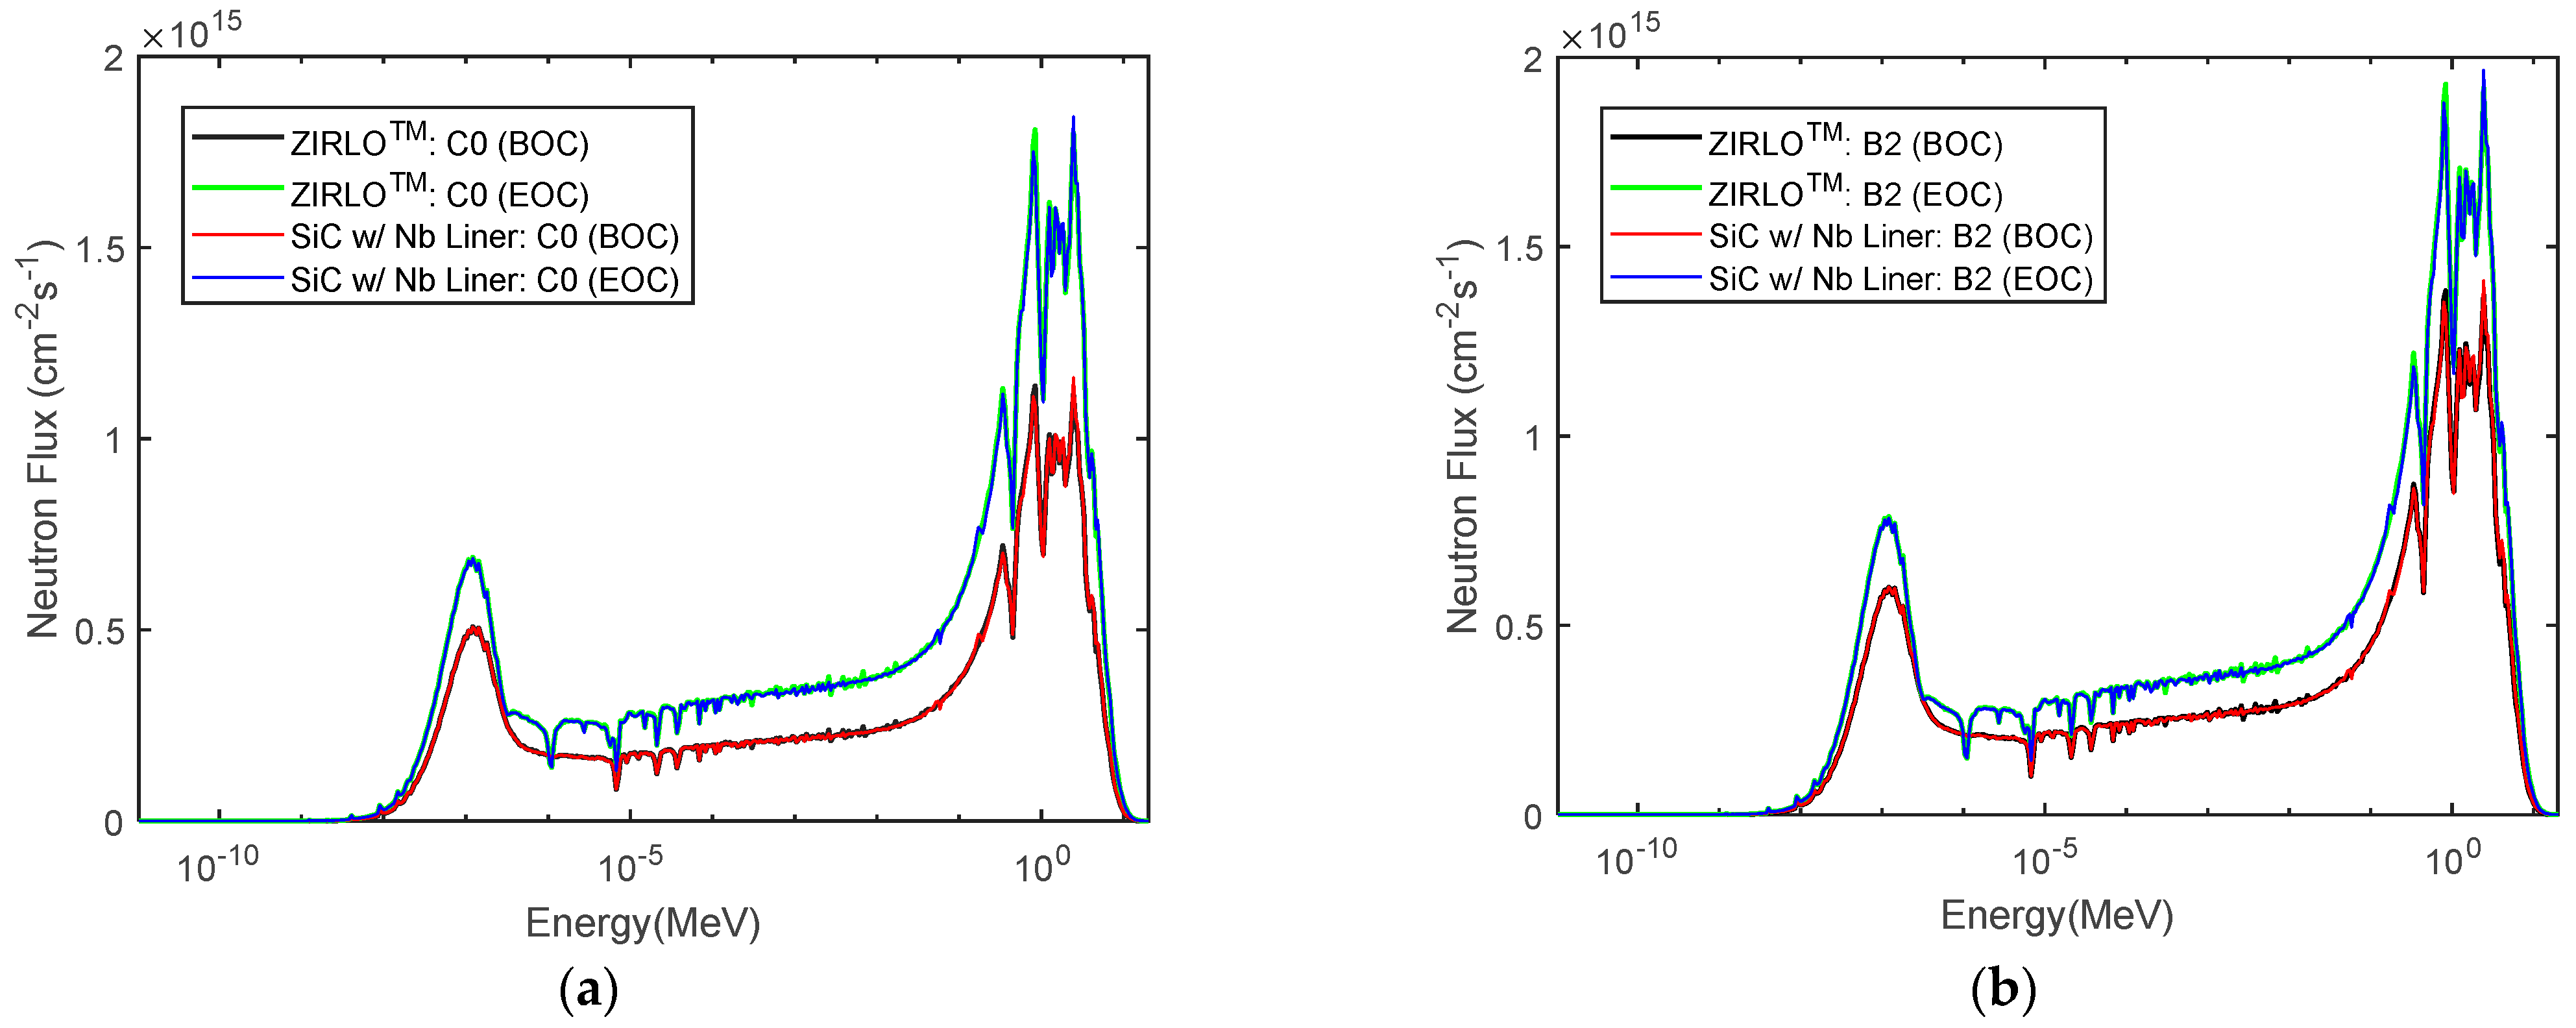
Additionally, from
Figure 6a, the neutron spectra at BOC shows that all models had approximately the same number of thermal neutrons initially. Then, one possible reason for the contrast in the multiplication factor profiles displayed could largely be attributed to the microscopic absorption cross-sections of the different materials employed. Evident from
Figure 7, Ta possesses higher absorption cross-sections across the entire defined energy range. For instance, the cross-section of Ta is ~100 barns and Nb is ~3 barns at 0.01 eV, a notable difference of two orders of magnitude. As a result, a Ta liner would absorb more thermalised neutrons than its competitor Nb liner, as seen in
Figure 6b. This, in turn, gives arise to the smaller multiplication factor witnessed by the former liner.
Furthermore, a closer look at
Figure 5 reveals that the absolute difference in the multiplication factor between Model 1 and the other two models decreased over time. At the BOC the variation was ~20%, whereas at the EOC the variation was ~15%. In other words, the rate reduction in the multiplication factor in the former declines with burnup. Such a trend can be explained by the greater hardening of the neutron spectrum demonstrated by Model 1 overtime. First, with respect to thermal neutrons, the density remained almost the same for Model 1 but increased for both Model 2 and the datum with burnup. On the other hand, whilst the density of fast neutrons amplified for all models, Model 1 presented the largest increase. For example, the number of neutrons with an energy of 2.5 MeV increased from 5.8 × 10
12 cm
−2s
−1 at BOC to 8.8 × 10
12 cm
−2s
−1 at EOC for Ta liner, and from 4.5 × 10
12 cm
−2s
−1 at BOC to 7.3 × 10
12 cm
−2s
−1 at EOC for Model 2 and the datum. With a higher number of fast neutrons, a higher probability of U-238 nuclides transmute to Pu-239 nuclides. Consequently, a higher percentage of Pu-239 can be observed by the former model in
Figure 8. Since Pu-239 is a fissile isotope, it will contribute to the production of more neutrons for the subsequent fission reactions and offset the multiplication factor overtime. Thus, the evolution of the multiplication factor revealed in
Figure 5 is quite parallel for all three cladding materials. This was also expected, as they all share the same fuel geometry and operation conditions.
4.2. Case B: Thermal Conductivity of Irradiated SiC
The thermal conductivity of irradiated SiC was accounted through the modification of the fuel rod temperatures. Based on literature suggestions, the temperatures of the pellet, cladding, and coolant were correspondingly increased to 1100 K, 900 K, and 900 K [
9]. Overall, it was found that the neutronic performance as a function of burnup did not substantially degrade in any aspect. For instance, the multiplication factor for Models 3 and 4 were 1.08 and 1.33 at BOC, respectively, which is a trivial difference when compared to Models 1 and 2 in Case A. A similar pattern is also noted for the neutron spectra and Pu-239 production. The negligible variation witnessed mainly stems from the fact that the thermal conductivity of irradiated SiC has been found in experiments to reach a saturation of 80 W/mK at 650 K. Beyond this point, the thermal conductivity exhibits a plateau as a function of dpa [
14].
4.3. Case C: Thickness Ratios of Cladding Constituents
In Cases A and B, the dimensions used for the inner SiC/SiC layer, metallic liner, and outer SiC/SiC layer were of the ratios of 0.3:0.1:0.6, as per the CEA patent “sandwich” model [
15]. To further investigate the impact of these ratios over the burnup cycle, the relative proportion of the cladding constituents was altered in accordance with
Table 1.
The simulations revealed that a change in the dimensions of the SiC/SiC cladding constituents can degrade the neutronics performance. When the sizes of the inner and outer SiC/SiC layers were the same (i.e., ratio 0.45:0.1:0.45), the multiplication factors of Models 5 and 6 deteriorated to 1.07 and 1.32. Likewise, but to a lesser degree, when the sizes of the inner and outer SiC/SiC layers were switched (i.e., ratio 0.6:0.1:0.3), the multiplication factors of Models 7 and 8 were reduced to 1.08 and 1.34. However, when the thickness of the metallic layer was increased (i.e., ratio 0.4:0.2:0.4), the multiplication factors of Models 9 and 10 substantially decreased to 0.93 and 1.30. For example, the extent of degradation demonstrated by Model 9 in comparison with Model 1 was ~20%. Again, this would largely be attributed to its higher thermal neutron absorption cross-section. Thus, a thicker Ta liner would cause more thermal neutrons to be lost in the intermediate layer and less to reach to the fuel pellet. Then, a lower number of U-235 fission reactions take place. The same patterns are observed in the neutron spectra and Pu-239 production.
Overall, the sensitivity analysis showed that the general neutronics performance of the Nb liner was much more positive when compared to the Ta liner. For this reason, only the SiC/SiC sandwich cladding with the Nb liner was modelled in the proceeding assembly and core levels. The temperatures were increased to the suggested values to consider irradiation effects on the thermal conductivity, and the dimensions of the cladding constituents were set to the ratios established by the CEA.
5. Assembly Model Analysis
The fuel assemblies were designed and organised in a particular manner to optimise the neutronics performance with respect to both space and energy. The calculations were performed at various state points that covered operation conditions to initially ensure criticality through, for example, the multiplication factor and flux distribution. In these state points, the fuel composition, irradiated material, temperature, boron concentration, and so on, changed. Thereby, any changes had to be updated in the calculations to cover the feedback effects. Furthermore, in this study, on an assembly level, burnup calculations were integrated to measure the changes due to fission, decay, and the production of new isotopes over the reactor lifetime. Additionally, to examine the impact of different fuel enrichments and the inclusion of burnable absorbers, the C0 and B2 assembly designs were used as examples. Group constant generation, depletion, spectral, and radial analysis are presented and discussed for SiC/SiC cladding with the Nb liner in comparison to ZIRLOTM cladding.
5.1. Group Constants
The continuous-energy neutron cross-section was used in the computation of the neutron transport equation. The change in the rate of neutron density was defined as the production rate minus the leakage and absorption rates. Each rate was determined by its relevant macroscopic cross-section, which varied with energy. To resolve such information is too computationally expensive for a full core. Thus, initially, various reaction rates for individual fuel assemblies were computed. In these simulations, homogenisation and two-group approximation were applied. Hence, the cross-sections were averaged over the depletion steps and a single value was given per energy group. The diffusion parameters and delayed neutrons were also obtained.
The neutron reaction cross-sections were ultimately used to derive the thermal power output. The various grouped constants for the macroscopic reaction cross-sections are shown in
Table 4 and
Table 5 for fuel assemblies C0 and B2, respectively. It is evident that the simulated macroscopic cross-sections are consistent for both cladding materials. Similar patterns were found for the diffusion coefficient and transport cross-section, as well as the delayed neutron groups. This was anticipated, as the models utilise the same fuel and coolant materials. All group constants generated by Serpent 2 for both the conventional and ATF models were equivalent to those documented in the literature for PWRs and APR-1400 [
24].
5.2. Multiplication Factor and Neutron Spectrum
At the BOC, the multiplication factors of the fuel assemblies C0 and B2 were 1.243 and 1.048 for both cladding materials, respectively. The difference in these initial values arises because the former holds higher enrichment fuel rods and the latter contains burnable absorber rods made from Gd
2O3-UO
2. The predominant elements in the burnable absorber are Gd-155 and Gd-157, with absorption cross-sections of 61,000 and 255,000 barns, respectively [
30]. With time, the trends associated with the multiplication factors of the assemblies begin to differ from each other. For C0 assembly, the value decreases sharply and continues to do so to the end of the depletion steps.
Table 4 and
Table 5 reveal that, for every neutron consumed by the fissile isotopes in the fuel, namely, U-235 and the subsequently produced Pu-239 from U-238, approximately 2.6 neutrons are emitted. This means that the number of the neutrons produced by the fission available in generation ‘i’ should be more than the neutrons lost through absorption in the preceding, which in turn should increase the multiplication factor. However, that was not the case due to the presence of poison fission products as well as boron in the moderator, which capture the newly born fission neutrons. The concentration of boron was tuned with burnup and decreased to accommodate for the declining multiplication factor with time.
On the other hand, after a small decline in the multiplication factor in the first step of the calculation for B2 assembly, the value did not drop anymore between approximately 5 and 15 MWd/kgU. On the contrary, it began to increase. This is because the Gd-155 and Gd-157 isotopes in the burnable absorber consume neutrons in generation ‘i-1′ and transmute them into Gd-156 and Gd-158 isotopes, respectively. The absorption cross-sections of these subsequent isotopes were ~2 barns, meaning they were less effective by a factor of 30,000–100,000 than their predecessors. Moreover, when the burnable absorbers began to deplete at ~15 MWd/kgU, the multiplication factor did not increase any more. Instead, it began to fall in a similar manner to C0 assembly, owing to the poison fission products and boron in the moderator. Overall, the drop in the multiplication factor is a critical aspect of safe reactor design because it guarantees that the system has a negative reactivity feedback in operating conditions. Thus, the changes which follow the increase in reactor power, e.g., the increase in fuel and coolant/moderator temperature, result in the decrease in multiplication factor. If it were to increase, then the reactor would be in a supercritical condition, making it uncontrollable.
The averages of the multiplication factors for the two assemblies C0 and B2 were, 1.025 and 0.9628, respectively, for both cladding materials. This implies that assemblies with no burnable absorbers (such as A0, B0, and C0) will be in a slight supercritical state, whilst those with burnable absorbers will be in a slight subcritical state initially. As mentioned before, referring back to
Figure 2, the non-uniform property approach in the reactor leads to flat power density. Together, the different multiplication factors of the fuel assemblies would counter each other to achieve criticality.
The averaged neutron flux spectra for the C0 and B2 assemblies of both cladding materials are visualised in
Figure 9. Overall, the simulated spectra in each assembly design are fairly similar across time. The higher thermal neutron density witnessed in C0 is attributed to the absence of neutron poisons. Thus, more neutrons are available to fission with U-235 nuclides, whereas in B2, the presence of burnable absorbers means that neutrons are captured and less are available for fission with U-235 nuclides. These are further supported by the exhibited corresponding multiplication factors. Additionally, inherent to fission reactions is the increase in the fraction of born fast neutrons in the system. As a result, C0 possesses a higher fast neutron density.
5.3. Isotopic Evolution
The mass/atomic densities of various isotopes in a fuel assembly are continuously changing due to fission, neutron capture, and radioactive decay. The key products are presented in
Figure 10. Monitoring the inventory of these products is important because some of them are neutron poisons, which could inhibit subsequent nuclear reactions. Therefore, the accumulation of fission product poisons is a vital factor in determining the maximum duration a given fuel element can be kept within the reactor. There are two main fission products addressed in reactor design: Xe-135 and Sm-149. These two isotopes have a very high absorption cross-section to the degree of causing reactor shutdown. In addition, their build-up may interfere with the normal control of the reaction during restart or the restoration of full power, potentially causing or contributing to an accident scenario. No notable disparity between the model with conventional cladding and the one with ATF cladding was seen. Once again, this mainly stems from the fact that the same fuel, fuel enrichment, and fuel positions were used in the assembly models.
5.4. Pin Power and Flux Distribution
The pin power distribution is an important output in neutronic safety analysis because it deduces the power peaking factor and highlights the restricting fuel rod, i.e., the fuel rod with the highest fuel centreline temperature or highest heat flux at the cladding surface. It is also important to see if the distribution varies with time.
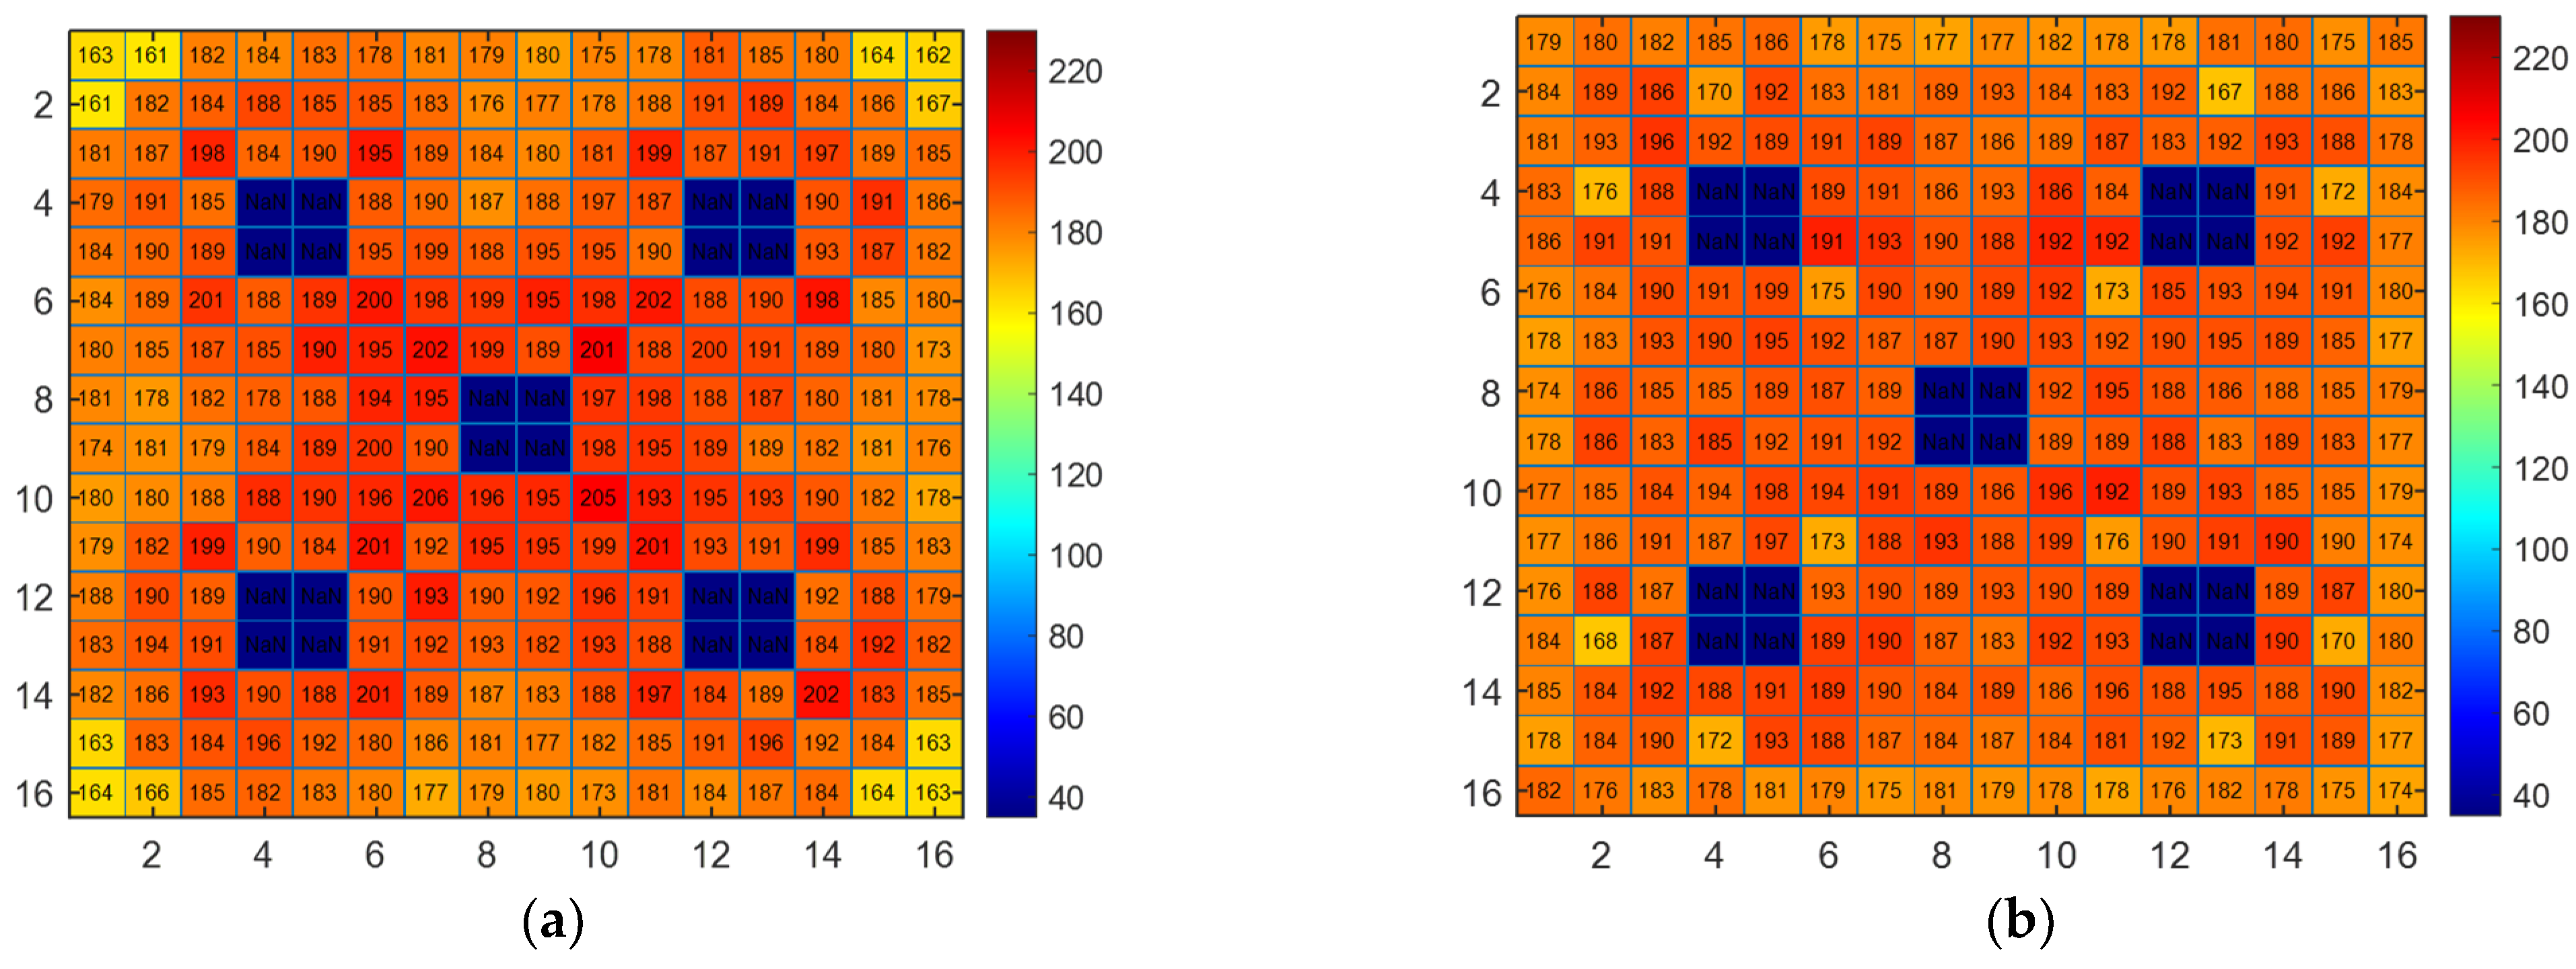
Figure 11 was calculated and plotted using radial reaction rate density distributions based on the detector output. The linear power of each pin is indicated by colour and text. For both fuel assemblies at the BOC, the maximum linear powers displayed in dark red range between 190 and 220 W/cm. These values correspond to the pins at the lattice positions located mainly at the borders of the instrument and guide tubes. For B2 assembly, they also appear at the inner periphery of the outer boundary. This could be explained using mesh plots.
In
Figure 12, the mesh plot’s colour scheme consists of “hot” shades of red and yellow, representing relative fission power, and “cold” shades of blue, representing relative thermal flux (i.e., below 0.625 eV). Darker colours indicate lower values and lighter colours indicate higher values. Therefore, one reason for such pin power distribution is that both the highest fission and thermal flux are in the proximity of tubes, as shown in
Figure 10. The average linear powers for C0 and B2 were 186.68 and 185.93 W/cm, respectively. In contrast, it can easily be seen that the pins located at the outer boundaries possessed the lowest power. This is because a larger surface area of outer cladding was in contact with a larger volume of coolant. On the other hand, the linear power of the burnable absorber rods in B2, as expected, were the lowest with a value of approximately 40 W/cm. Additionally, the fuel rods nearest to the inner-located burnable absorbers had lower linear powers than the remaining fuels. Based on the mesh plot in
Figure 12b, it can be observed that the fission power was much lower in the burnable absorber rods than in the fuel rods. Moreover, a depression in the thermal flux distribution can be seen in the immediate surroundings of the burnable absorbers. This is caused due to their poison nature, stemming from their large absorption cross-section that kills neutrons.
In the process of burnup, the power in the interior zone would decrease while the power in the exterior area would increase. This stems from the faster depletion of U-235 inside the assembly compared to the exterior. Nonetheless, the average linear powers for both Zr and SiC models remained almost constant for both assembly designs. The distribution for C0 was nearly the same; for B2, the distribution became more evened out after the depletion of the burnable absorbers. Overall, the simulated data were very close to the 183.7 W/cm full-power core average stated in the APR-1400 design control document [
24]. The influence of different kinds of cladding materials on fission power distribution in fuel pellets appears to be limited.
6. Core Model Analysis
The safety and reliability of a core is strongly linked to the neutronics characteristics that influence criticality. The main attributes examined throughout this study so far on all pin and assembly models have been the multiplication factor, fission product evolution, and flux and power distribution, with respect to both space and energy, to understand the feedback effects of variations in fuel composition, irradiated material, delayed neutrons, temperature, boron concentration, and so on. The same process applies on a core model to examine the overall neutronics performance of SiC/SiC cladding in comparison with the ZIRLOTM cladding. The analysis would also highlight if any changes, e.g., in the core loading pattern, were required for the replacement of this ATF cladding.
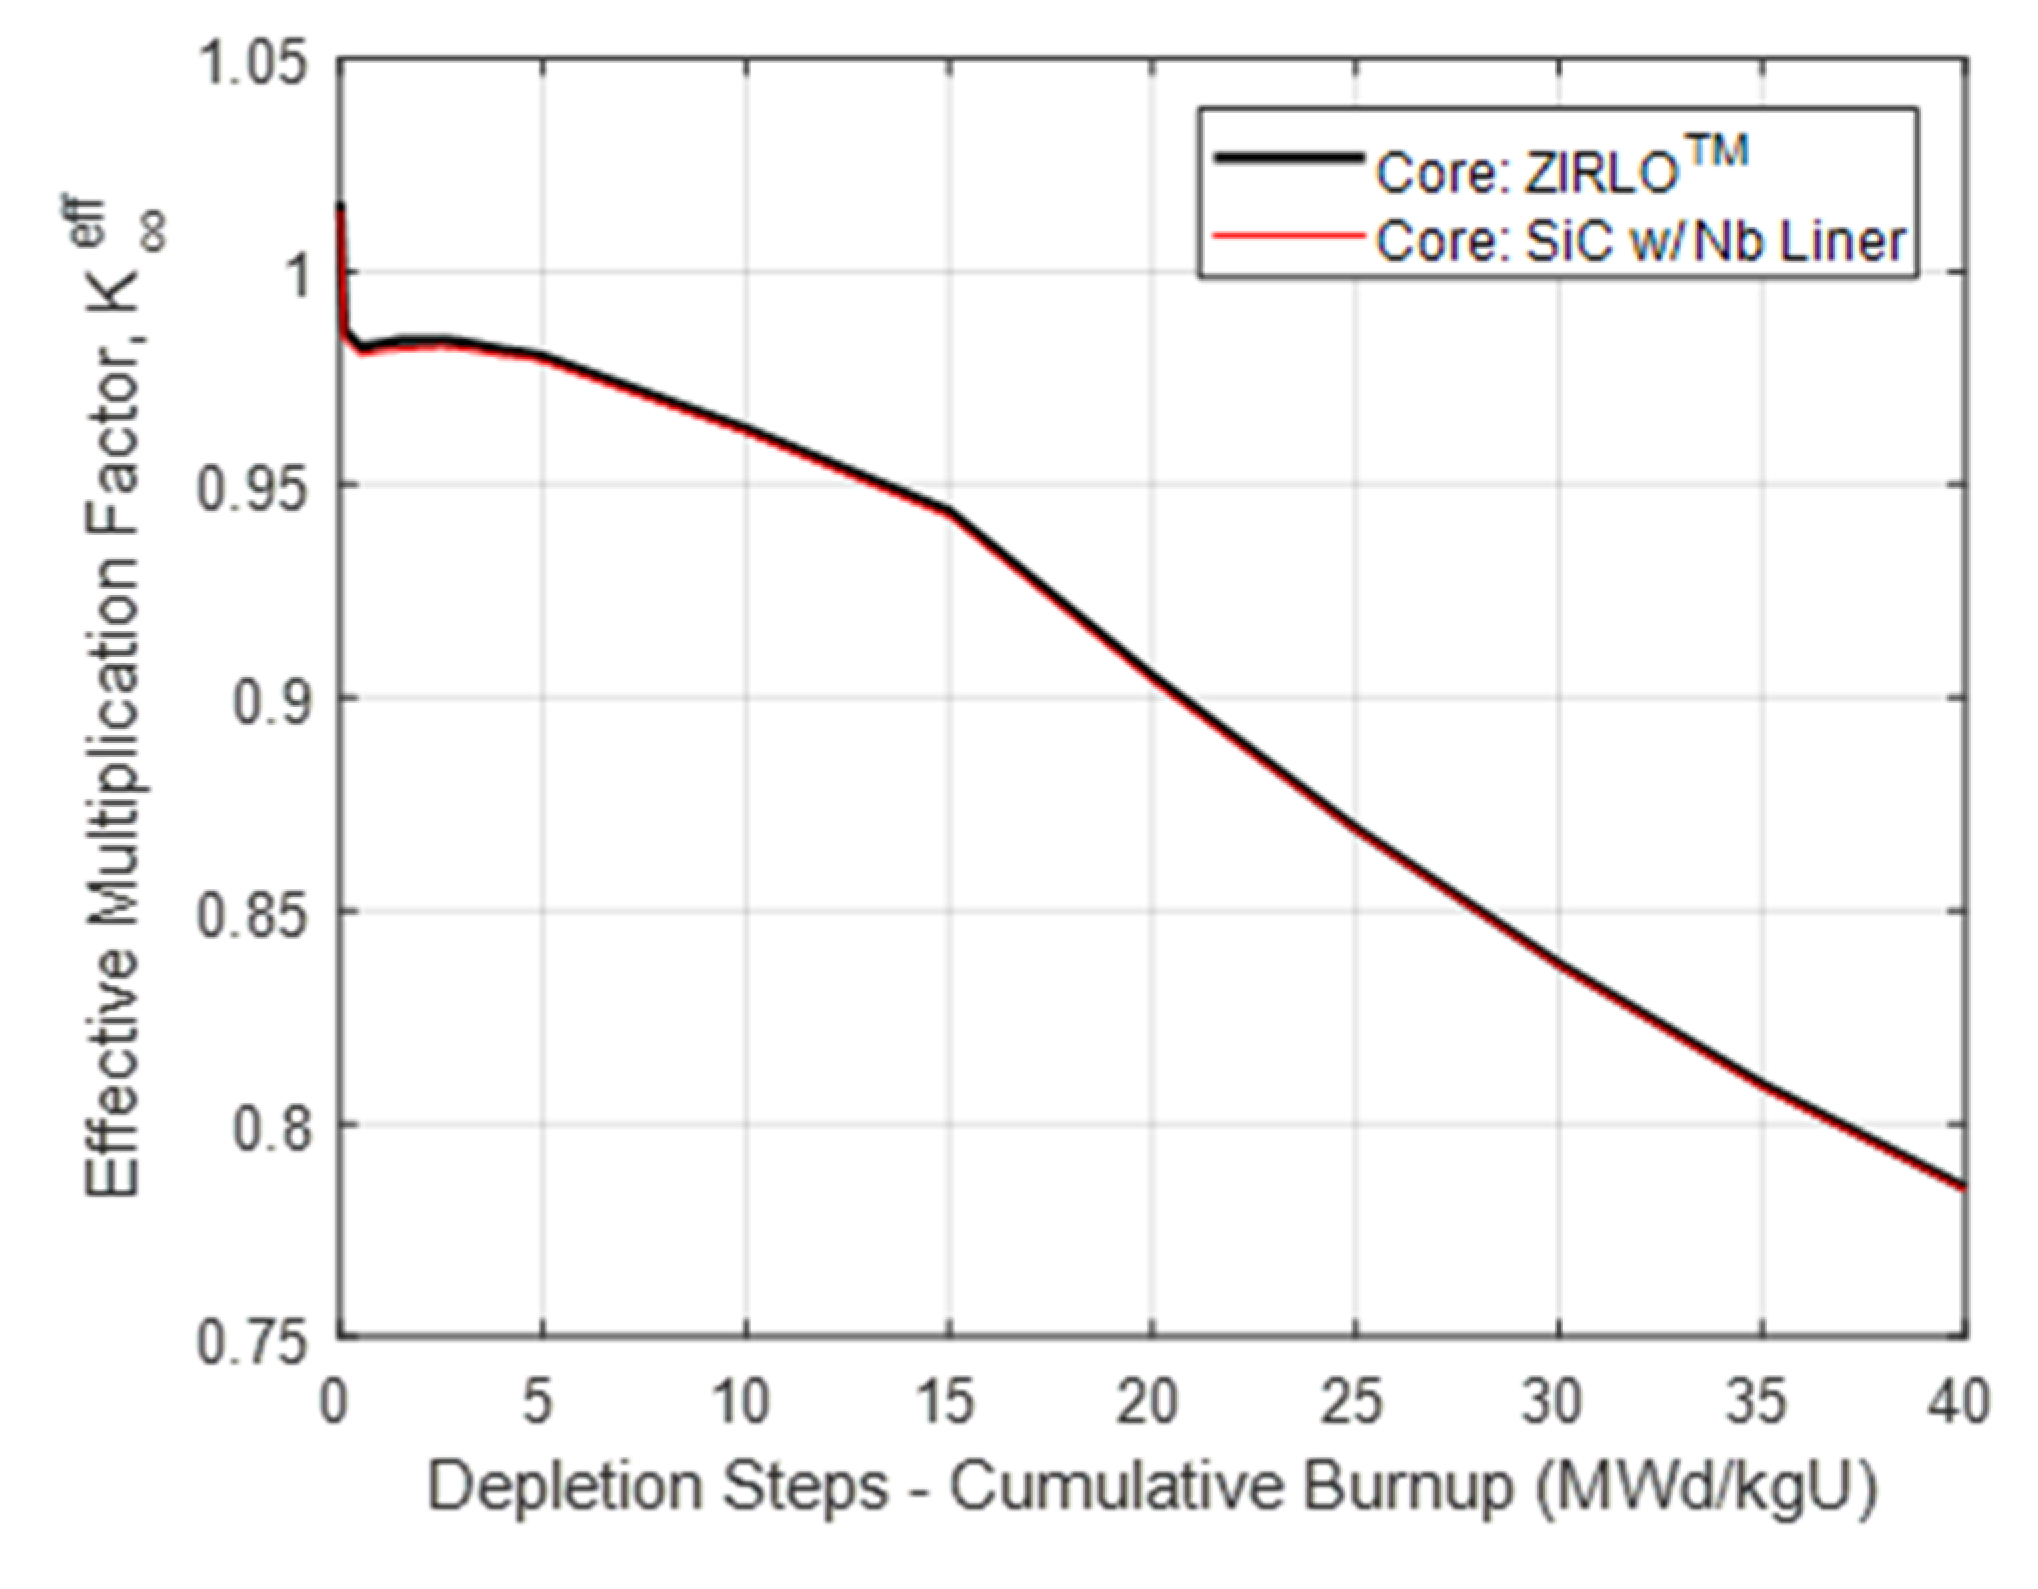
Figure 13 demonstrates the behaviour of the multiplication factor over time for the APR-1400 core. A total replication can be seen in the core model that used ZIRLO
TM claddings and that which used SiC/SiC sandwich claddings over the entire burnup cycle. The multiplication factor for both core models was 1.016 at the BOC, which fell down to 0.785 at EOC. The simulation values for ZIRLO
TM are in good agreement with those listed in the design control document for APR-1400 [
24].
The neutron spectra presented by both core models also matched the simulation throughout. The thermal peaks occurred at around 0.012 eV, whilst the fast peaks occurred at around 2.3 MeV. With burnup, the former peaks increased from 3.4 × 10
18 to 3.9 × 10
18 cm
−2s
−1, whilst the latter peaks increased from 6.2 × 10
18 to 8.7 × 10
18 cm
−2s
−1. This was expected as neutrons were born by fission reactions with high energies, hence adding to the fast peaks, and then moderated to lower energies, hence adding to the thermal peaks. Furthermore, the difference in thermal peaks overtime was smaller than that of the fast peaks. The disparity stemmed from the various neutron poisons present in the core—whether in the form of burnable absorbers, boric acid, or fission products—that kill thermal neutrons. This is supported by
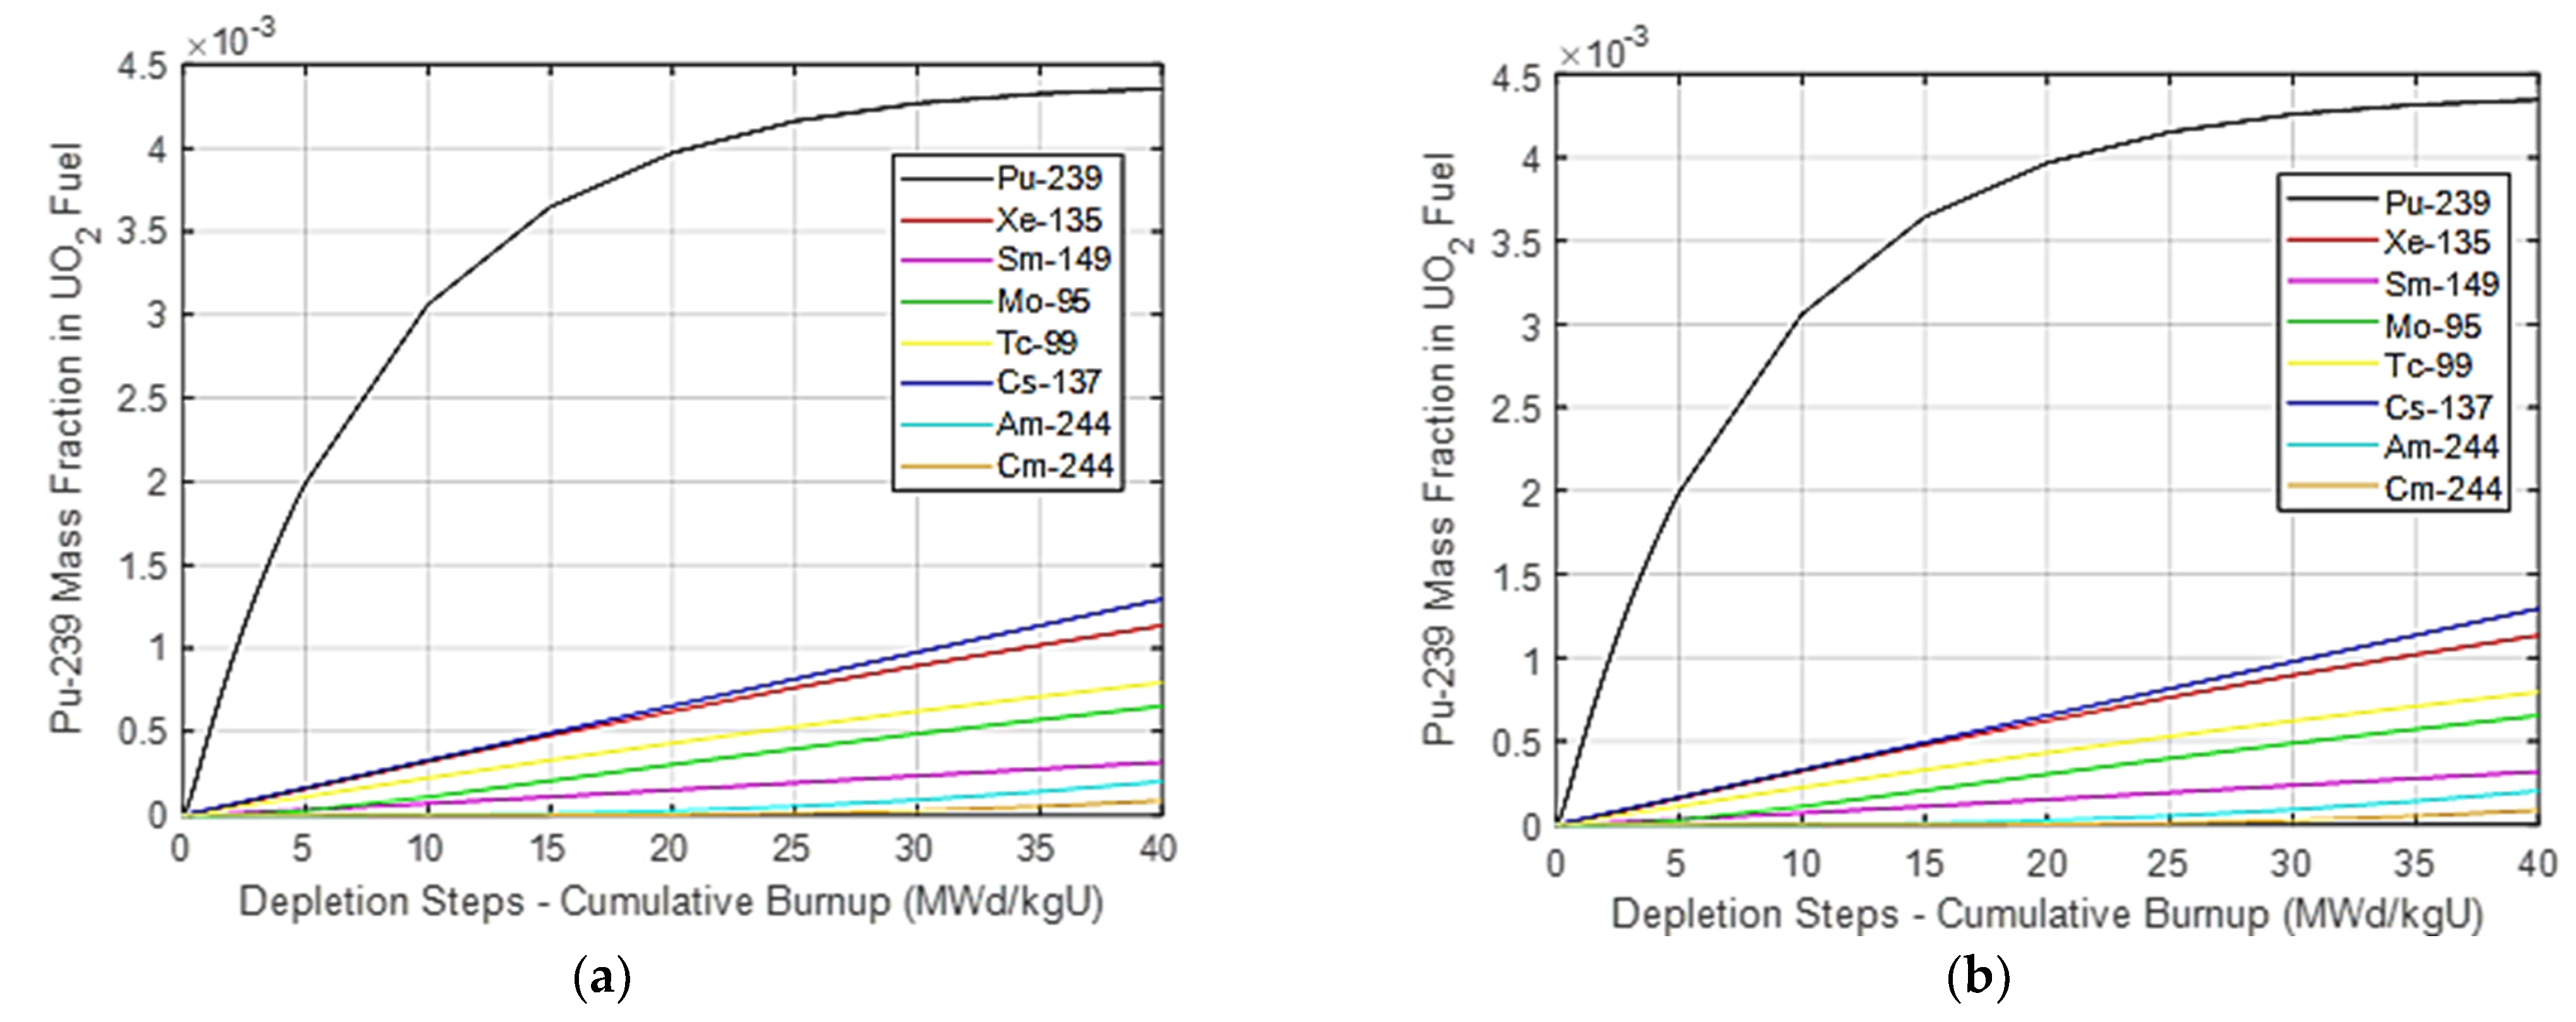
Figure 14, which shows the build-up of, e.g., Xe-135. It also stems from the transmutation of U-238 to Pu-239, which is fissile and therefore produces more fast neutrons as it undergoes fission. Again, from
Figure 14, the accumulation of Pu-239 can be seen over time.
Power Distribution
As mentioned earlier, the fission products released during burnup must be monitored as some isotopes would initiate fission reactions whilst others would impede them. The record of isotopic evolution plays an integral part in setting the parameters of the control methods, such as boron concentration in the coolant overtime. These fission products also affect the power and flux distribution in the core. From
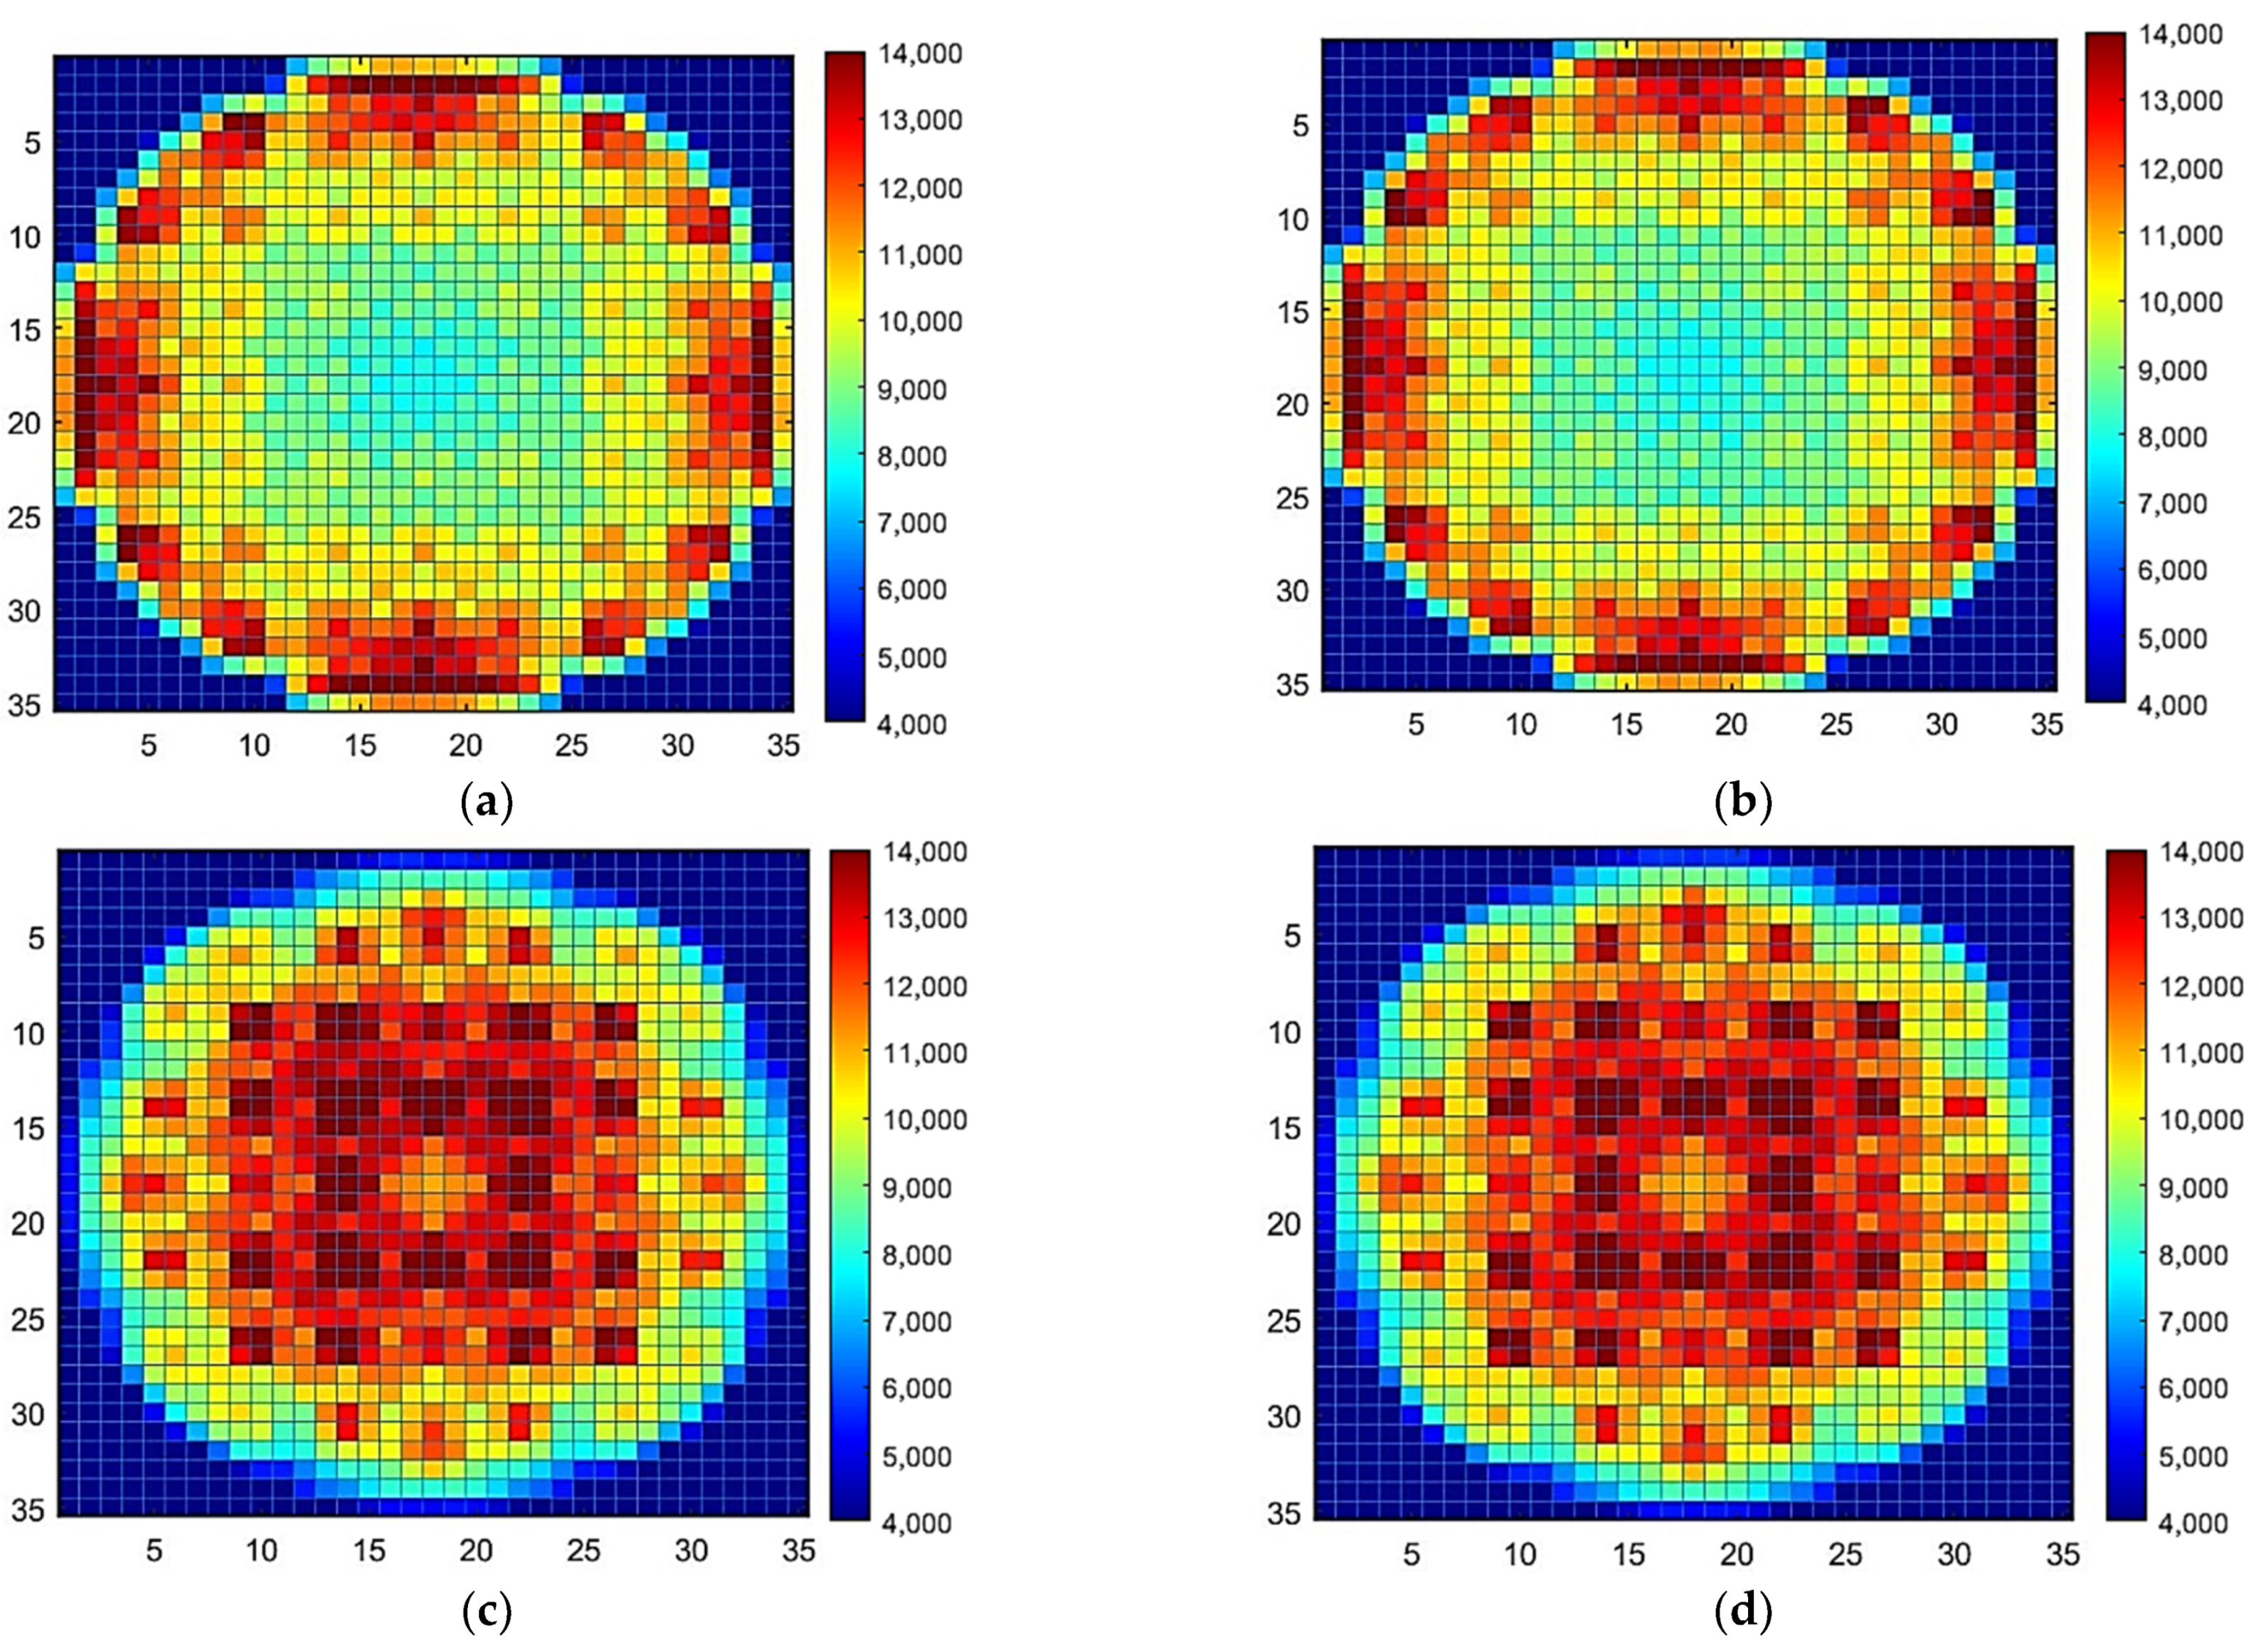
Figure 14, it can be noticed that the power distribution for both core models are very alike.
Figure 15a shows that, at the BOC, the two present the highest power at the core outer region and the lowest power at the core centre. This emanates from the highest and lowest enriched assemblies placed at those locations, respectively, as can be seen in
Figure 2b. It should be noted that the core with SiC/SiC cladding displays less hotspots at BOC, which is attributed to its initial high thermal conductivity that causes heat to transfer more efficiently to the coolant. Nonetheless, with time, the power becomes more uniform across the core cross-sectional area for both due to the depletion of fuel isotopes, the accumulation of fission products, and the implementation of control methods in the reactor. Power continues to be produced, especially with the contribution of Pu-239. As opposed to the BOC,
Figure 15b shows that the power at EOC concentrates in the inner region of the core. The higher enriched assemblies at the outer region that produced power initially, and at a higher rate due to their higher density of U-235, would have been consumed by the end. As a result, shades of blue are visualised at the periphery. Even so, the power distribution is mostly uniform, even at the EOC.


