Article

In-Situ LID and Regeneration of Al-BSF Solar Cells from Different Positions of a B-Doped Cz-Si Ingot

1
School of Materials Science and Engineering, Sun Yat-sen University, Guangzhou 510006, China
2
Guangdong Provincial Key Laboratory of Photovoltaic Technologies, Sun Yat-sen University, Guangzhou 510006, China
3
CSG PVTECH Co., Ltd., Dongguan 523141, China
4
Yichang CSG Polysilicon Co., Ltd., Yichang 443007, China
*
Authors to whom correspondence should be addressed.
Submission received: 16 June 2022 / Revised: 24 July 2022 / Accepted: 29 July 2022 / Published: 1 August 2022
(This article belongs to the Special Issue Recent Development of Silicon Solar Cells)

Abstract

:
In this paper, five groups of industrial aluminium back-surface-field (Al-BSF) solar cells were made from silicon wafers from different locations of a B-doped Czochralski silicon ingot. Then, we performed the first LID (45 °C, 1 sun, 12 h), regeneration (100 °C, 1 sun, 24 h), and second LID (45 °C, 1 sun, 12 h) treatments on the cells, and measured the in-situ changes of their I-V characteristic parameters by using an I-V tester during the experiment. The cells were also characterized by Suns-Voc measurement, full-area light beam induced current scanning, and external quantum efficiency measurement at the four breakpoints of treatments (before and after the first LID, after regeneration and the second LID). It was found that the LID and regeneration of the Al-BSF solar cells can be explained by the LID and regeneration reaction of B-O defects and the LID caused by dissociation of Fe-B pairs. After regeneration, the relative decay rate of efficiency decreased from 2.75–3.8% during the first LID to 0.42–1.23% during the second LID, indicating that regeneration treatment (100 °C, 1 sun, 24 h) can improve the anti-LID ability of Al-BSF solar cells.

1. Introduction

Monocrystalline silicon (mono-Si) solar cells using B-doped Czochralski silicon (Cz-Si) wafers are the mainstream products in both the present photovoltaic market and accumulative photovoltaic installation, which include conventional aluminium back-surface-field (Al-BSF) solar cells and new-type passivated emitter and rear cell (PERC) devices. However, B-doped Cz-Si solar cells suffer losses caused by light-induced degradation (LID). It is generally believed that the LID of B-doped Cz-Si solar cells results from the formation of recombination active B-O defects [1,2,3]. Since Cz-Si wafers possess higher oxygen content (1017 cm−3) caused by incorporation of oxygen from the inner wall of the quartz crucible into the silicon ingot during the pulling process, the LID of a solar cell fabricated from a B-doped Cz-Si wafer is more severe [1,2,3]. The efficiency loss due to the LID is 3–4%relative for Al-BSF solar cells, while the corresponding value is 4–6%relative for PERC solar cells [3]. On the other hand, in order to save costs, a certain proportion of recycled silicon is used in the production of solar grade Cz-Si ingots, which means that the metal impurities in the Cz-Si wafers cannot be neglected. These metal impurities can also result in LID such as Fe-related LID [4,5], Cu-related LID [6] and etc. As the LID of solar cells can cause huge power generation losses, people have put a lot of effort into research on the inhibition of LID of B-doped Cz-Si solar cells. In 2006, Herguth et al. [7] made a big breakthrough in this respect by finding that B-O defects can be passivated by a treatment called regeneration. Specifically, by injecting minority carriers (electrical injection or optical injection) while heating (60–200 °C), B-O defects in a silicon wafer or bulk region of a solar cell can transform from the degraded state into the passivated state, resulting in recovered minority carrier lifetime of the silicon wafer or recovered electrical performance of the solar cell, and what is more important is that they no longer decay when illuminated again under typical solar cell working conditions [7,8].
It should be emphasized that most experimental results on B-O defects related LID (BO-LID) and regeneration phenomena have been obtained from lifetime samples [1,2]. However, only a few experiments have been conducted on B-doped Cz-Si solar cells and conflicting results have even been reported [9]. Due to the difference in the structure of lifetime samples and Cz-Si solar cells, the research results from lifetime samples cannot be applicable to Cz-Si solar cells completely [10], which makes it indispensable to study the LID and regeneration of B-doped Cz-Si solar cells directly. For the study of LID and regeneration of Cz-Si Al-BSF solar cells, Ebong et al. [11] investigated the effect of rapid thermal processing (RTP) on the LID of Al-BSF solar cells in 2015, and found that belt transfer speed and contact firing can remarkably affect the LID of Al-BSF solar cells. Specifically, the higher the belt transfer speed, the less the degradation. In 2016, Padmanabhan et al. [12] found that multi-crystalline silicon Al-BSF solar cells treated at 1 sun, 90 °C within ~200 h can be nearly completely regenerated. With heavier phosphorus diffusion, the maximum relative degradation rate of the Al-BSF solar cells decreases from 2% to 1.5%. In 2018, Cho et al. [13] reported that p-type mono-Si Al-BSF solar cells can be almost completely passivated (over 99%) by moderate temperature regeneration (130 °C, 2 suns, 1.5 h) treatment. Varshney et al. [14] reported in 2020 that Al-BSF solar cells suffer a less light- and elevated temperature-induced degradation (LeTID) than PERC solar cells. In 2020, Sinha et al. [15] found that Al-BSF solar cells are less vulnerable to ultraviolet-induced degradation than high-efficiency solar cells such as PERC, heterojunction and interdigitated back-contact cells.
Although some research results have been reported on the LID and regeneration of Al-BSF solar cells, no research work has been found on the in-situ LID and regeneration of Al-BSF solar cells. However, such in-situ research is very important for the following reasons. First, unknown changes in the I-V characteristic parameters of Al-BSF solar cells may have occurred when transferring the samples from the processing device to the test device and vice versa, thus in-situ LID and regeneration experiments need to be done to avoid this uncertainty. Second, in order to accurately obtain the real-time variations of the I-V characteristic parameters of Al-BSF solar cells with processing time during the LID and regeneration treatments, in-situ LID and regeneration research is also needed. To meet this requirement, the in-situ LID and regeneration of industrial Al-BSF solar cells were investigated by utilizing a solar cell I-V tester for the first time in this paper. These were made from silicon wafers from different locations of a commercial B-doped Cz-Si ingot. Since different positions of silicon wafers possess different impurity contents, the research results reflect the effect of positions of silicon wafers and resultant difference in impurity content on the LID and regeneration of the industrialized Al-BSF solar cells.

2. Experiment

Five groups of 180 μm thick 156.75 mm × 156.75 mm pseudo-square silicon wafers were taken from an industrial solar grade B-doped Cz-Si ingot at certain intervals, named A1 to A5 from the head to tail. The contents of Fe, Cu and Ni impurities in silicon wafers were measured by using Agilent 7900 inductively coupled plasma mass spectrometry (ICP-MS), while the contents of O and C were determined by measuring adjacent 2 mm thick polished silicon wafers by using a Thermo Nicolet 6700 Fourier transform infrared (FT-IR) spectrometer at room temperature. After eliminating thermal donors by thermally annealing the silicon wafers at 650 °C in Ar atmosphere for 2 h, boron concentration was indirectly obtained by measuring the resistivity of the samples through the use of a KUNDE KDB-1 four-probe tester. After that, five groups of silicon wafers were manufactured into Al-BSF solar cells by adopting the standard industrial process, which comprises the following steps: the damaged layer was removed and the surface textured by KOH solution, phosphorus diffusion was performed at 850 °C to form an 85 Ω/□ emitter, phosphor silicate glass (PSG) together with back junction were removed by HF/HNO3 solution, about 80 nm SiNx anti-reflection layer was prepared on the front side by PECVD at 450 °C, the front and back electrodes were screen printed, and the final sintering was carried out with peak temperature of 800 °C. The efficiencies of as-prepared Al-BSF solar cells (cell area = 244.67 cm2) range from 19.2% to 19.8% at the standard condition (AM1.5 spectra, 1000 W/m2, 25 °C).
Then, the as-prepared Al-BSF solar cells were in-situ processed and measured by a VS-6821M solar cell I-V tester during the first 12-h LID (45 °C, 1 sun), 24-h regeneration (100 °C, 1 sun) and the second 12-h LID (45 °C, 1 sun) in turn. At the four breakpoints of treatments (before and after the 1st LID, after regeneration and the 2nd LID), the Al-BSF solar cells were characterized by full-area LBIC scan with 2 μm step by using a SemiLab WT-2000 tester in a dark box at room temperature, EQE measurement by an Enlitech QE-R equipment and Suns-Voc measurement by a Sinton WCT-120 apparatus. With the help of the powerful I-V tester, we were able to measure the I-V characteristic parameters (efficiency η, short-circuit current Isc, open-circuit voltage Voc, and fill factor FF) of the cells per 10 s in first hour, per 1 min from the 1st hour to the 3rd hour, and per 5 min after the 3rd hour during the experiment, thus we obtained the in-situ LID and regeneration curves of the I-V characteristic parameters of the cells.

3. Results and Discussion

3.1. Impurity Concentrations of Silicon Wafers

Table 1 lists the resistivities together with the contents of B, O, C, Fe, Cu and Ni of the five groups of Cz-Si wafers. As can be seen from Table 1, O concentration gradually declines while B, C, Fe, Cu and Ni concentrations gradually rise from the head to tail of the Cz-Si ingot. The reason why different impurities have different distribution in a Cz-Si ingot can be found in [16]. As far as impurity content is concerned, O content is highest and is in the order of magnitude of 1017, C content is second highest in the order of magnitude of 1016, and B content is third highest in the order of magnitude of 1015. As compared with the above impurity contents, Fe, Cu and Ni concentrations are much less. Specifically speaking, Fe content is three orders of magnitude lower than O content, while Cu and Ni contents are four orders of magnitude lower than O content. Our O content as well as distribution along the ingot agree well with [17], and the transition metal impurity contents together with distributions coincide with [18]. Since C content shows a little difference in different groups of samples, and has little impact on minority carrier lifetime of Cz-Si wafers [19], the effect of C concentration on the LID and regeneration of the Al-BSF solar cells will be neglected in subsequent discussion.

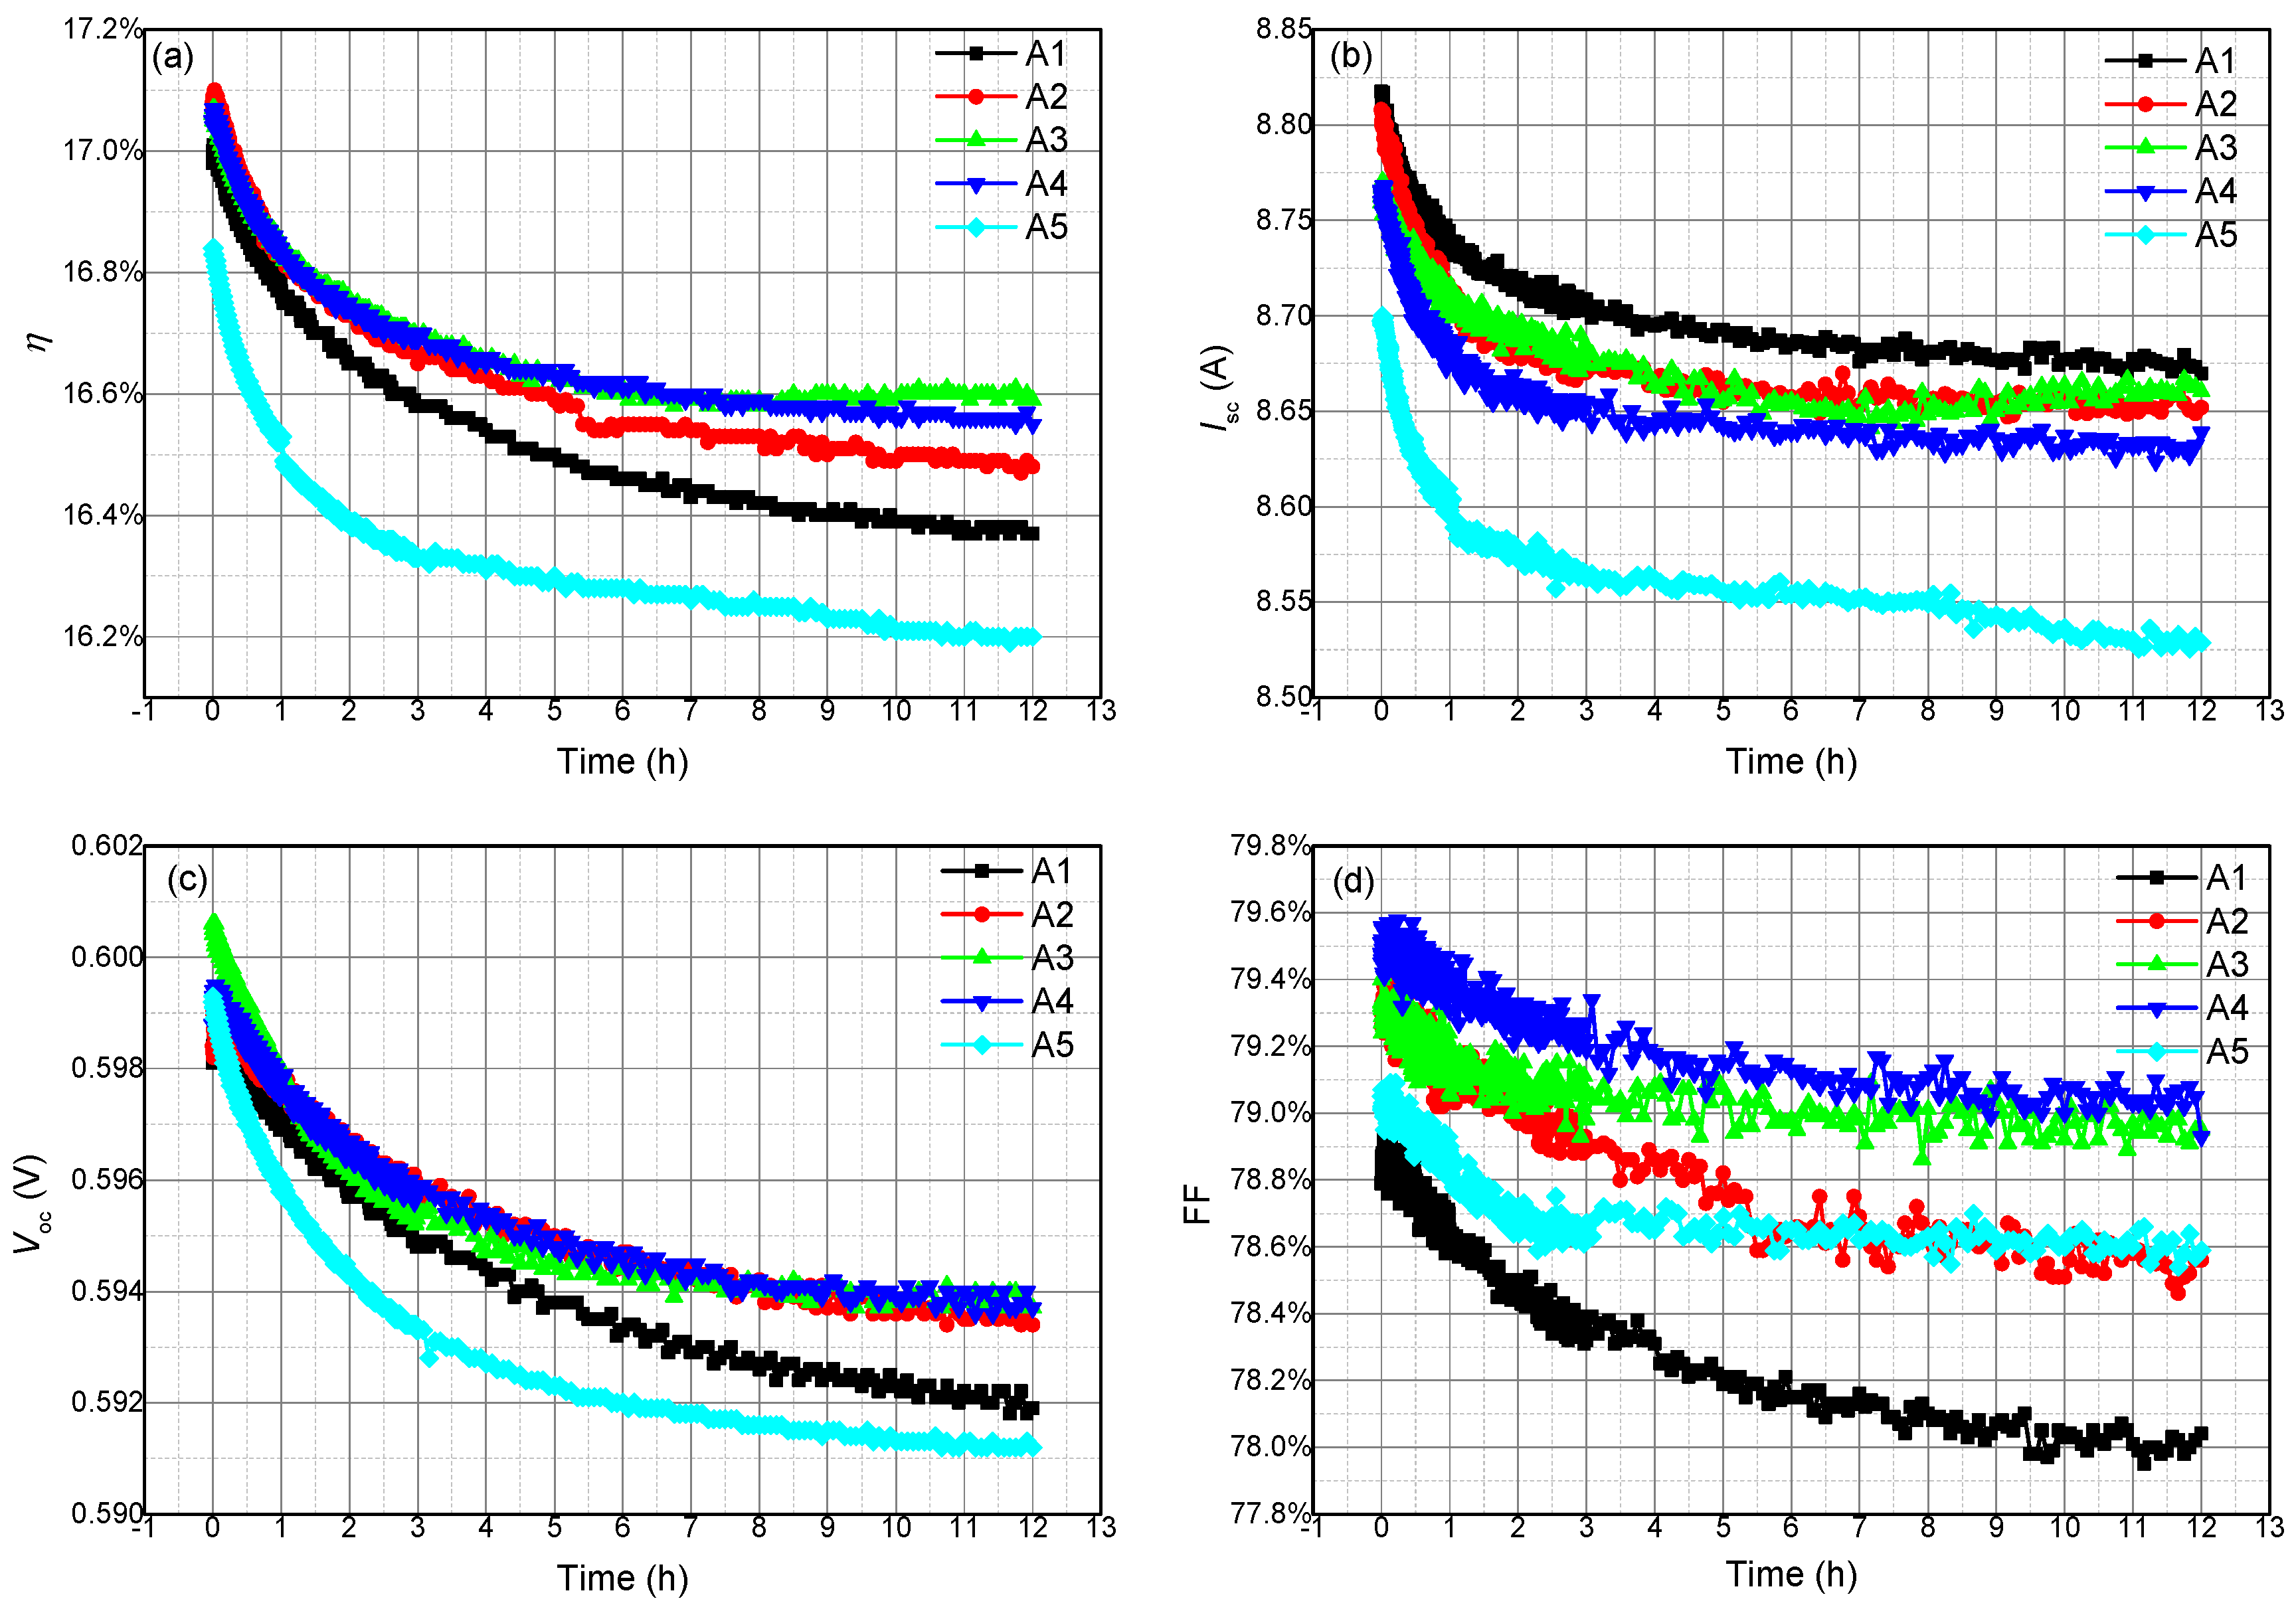
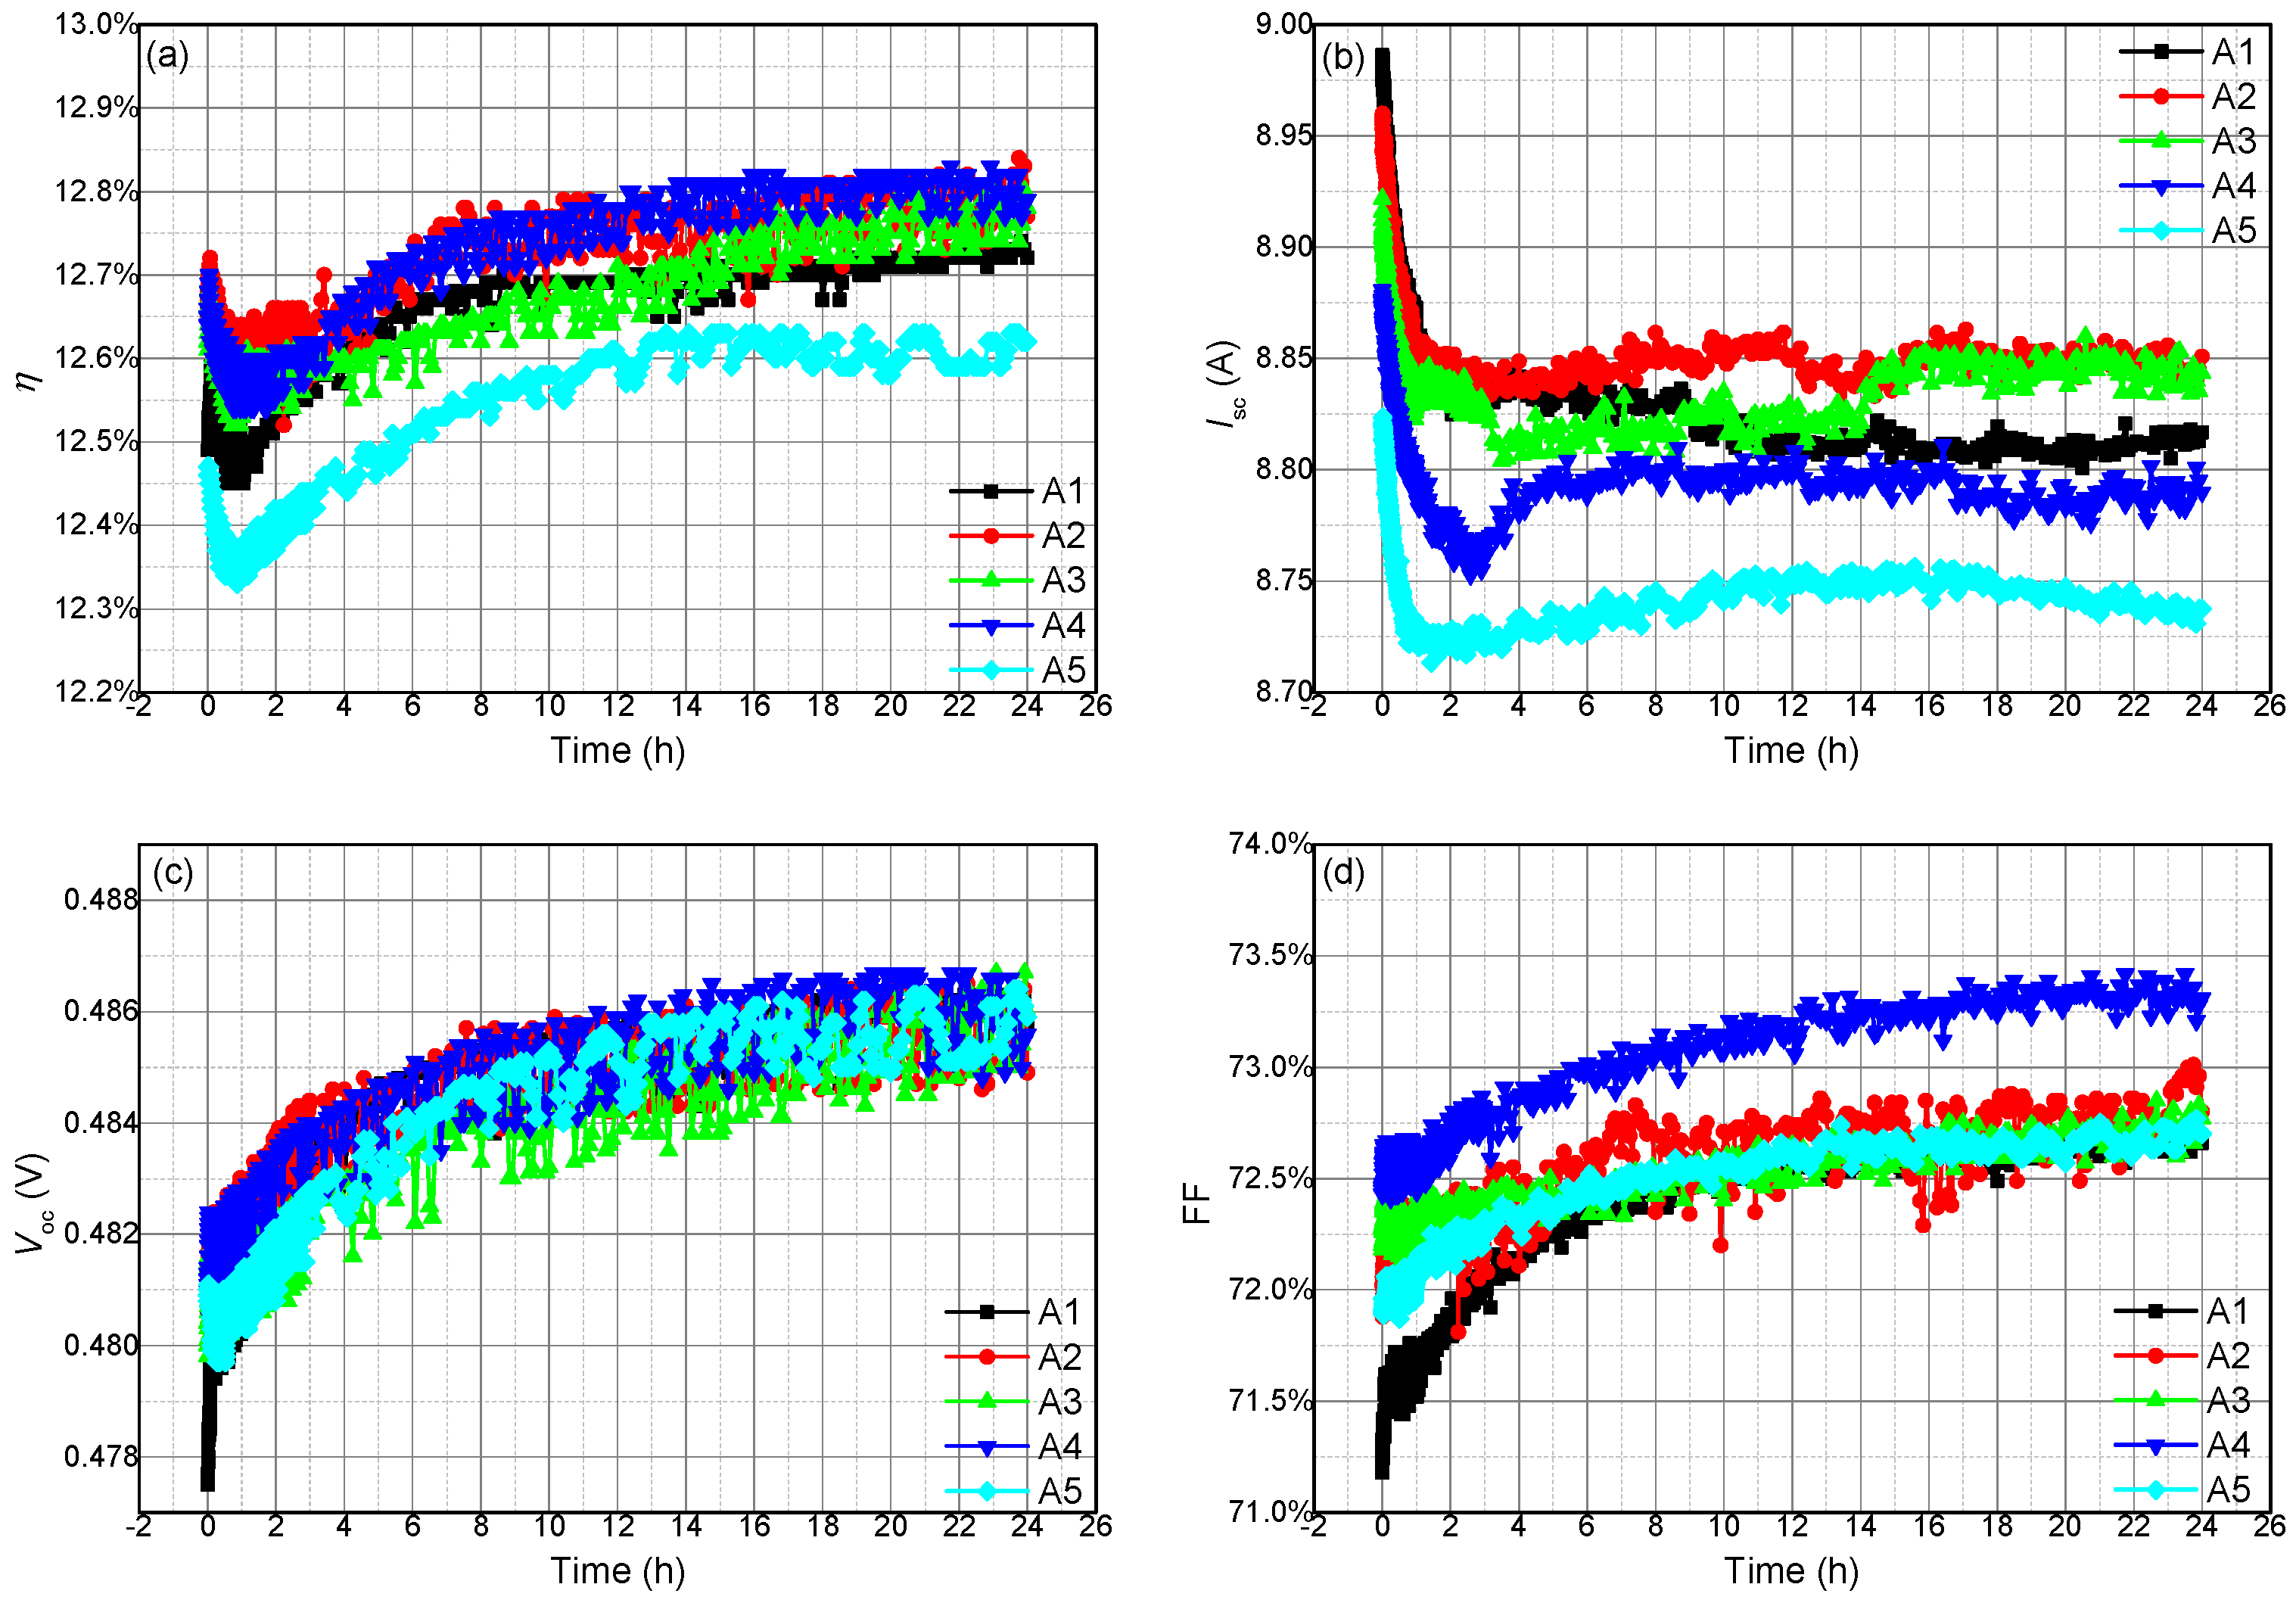
3.2. In-Situ LID and Regeneration of the Al-BSF Solar Cells

Figure 1 demonstrates the in-situ variations of η, Isc, Voc, and FF of the five groups of Al-BSF solar cells with processing time throughout the 1st LID (45 °C, 1 sun, 12 h). As shown in Figure 1, η, Isc, Voc and FF of almost all the samples show an exponential decay with time and then gradually approach saturation. The experimental results can be explained by the formation of degraded state B-O defects with recombination activity under illumination [20], and their contents increase with the time and finally reach saturation. The increase in concentration of degraded state B-O defects leads to a decrease in the bulk minority carrier lifetime (τ), which results in the increase of dark saturation current and thus the decay of Voc, meanwhile causes the reduction of carrier collection efficiency and thus the decay of Isc [21]. The decay of Voc can also induce that of FF, while the decay of Voc, Isc and FF will eventually result in that of η. We note that A5 possesses the lowest η, Isc and Voc, while A1 has the highest Isc and the lowest FF. This result can be explained by the fact that the Cz-Si wafers used by A5 have the highest boron content and thus the lowest τ, while those used by A1 have the lowest boron content and thus the highest τ and bulk resistance.
Figure 2 presents the in-situ variation of η, Isc, Voc, and FF of the five groups of Al-BSF solar cells with processing time throughout the regeneration (100 °C, 1 sun, 24 h). It can be seen from Figure 2 that the η of all the samples first decays, then rises, and eventually approaches saturation, with the η after regeneration higher than that before regeneration. We note that the Isc of all the samples shows a sharp decrease at the initial stage of regeneration. In contrast, the Voc and FF of all the samples gradually rise and tend to reach saturation eventually. Obviously, the initial decay of η results from the rapid decrease of Isc, and the subsequent rise of η is mainly induced by the rise of Voc and FF.
The gradual rise and saturation of Voc can be elucidated by the regeneration reaction of B-O defects. Specifically, with the proceeding of the regeneration treatment, more and more B-O defects transform from the degraded state into the passivated state without recombination activity [20], which results in the increase of τ and thus the rise of Voc. When most of the B-O defects convert into the passivated state, the τ and Voc would approach saturation. FF shows a similar trend to Voc, which indicates that at our regeneration condition the variation of FF is dominated by that of Voc. As for the rapid decay of Isc at the early stage of regeneration, we think that this results from the dissociation of Fe-B pairs. The reasons are as follows: (1) the decay of Isc at the beginning of regeneration cannot be induced by BO-LID due to lack of annealed state B-O defects without recombination activity. Specifically, almost all the B-O defects in the samples have converted into degraded state after the 1st LID, thus, no BO-LID would appear at the beginning of regeneration. (2) Isc and Voc show very different changes at the beginning of regeneration, i.e., Voc increases while Isc decreases, which is one of the basic features of LID caused by dissociation of Fe-B pairs [4,5]. According to [4,5], the change in recombination activity resulting from dissociation of Fe-B pairs depends on the relative position between the excess carrier injection level (Δn) and the crossover-point carrier concentration (ΔnCOP), while ΔnCOP is related to the contents of B and Fe. Since Voc and Isc are measured at very different Δn (Isc is measured at the Δn always below the ΔnCOP, while Voc is measured at the Δn either higher or equal to or lower than the ΔnCOP), the dissociation of Fe-B pairs can always induce a remarkable decay in Isc but either increase, maintain or decrease in Voc [4,5]. (3) The as-used Cz-Si wafers have higher Fe content (see Table 1), furthermore, the Coulomb action between Fe+ and B can largely decrease the effectiveness of phosphorus diffusion gettering (PDG) [22], which would result in some Fe impurities remaining in Al-BSF solar cells [21]. (4) Before regeneration treatment, we conducted a whole-area LBIC scan on the samples by utilizing a WT-2000 tester in a dark box at room temperature for 1.5 h, which led to a result in which a considerable proportion of Fe+ and B re-pair to form Fe-B pairs. At the beginning of the regeneration (1 sun, 100 °C, 24 h), the dissociation of Fe-B pairs would result in decay of Isc.
Figure 3 demonstrates the in-situ variations of η, Isc, Voc, and FF of the five groups of Al-BSF solar cells with processing time throughout the 2nd LID (45 °C, 1 sun, 12 h). As shown in the Figure 3, the η and Isc of almost all of the cells show a rapid decay at the beginning of the 2nd LID, while Voc and FF of all the cells except the Voc of A5 fundamentally stay the same during the 2nd LID, and the Voc and FF of A3 even show a slight upward trend. The above results show that, except for A5, the decay of η at the beginning of the 2nd LID is caused by that of Isc. We think that the changes of I-V characteristic parameters at the early stage of the 2nd LID result from the dissociation of Fe-B pairs. The reasons are as follows: (1) Almost all of the B-O defects in the samples have transformed into passivated state after regeneration treatment, which are stable under the condition of the 2nd LID (45 °C, 1sun, 12 h) and will not cause decay [20]. (2) The Voc and Isc of the samples show different changes at the beginning of the 2nd LID, that is, Voc of A1 and A2 keeps stable, Voc of A3 increases, and Voc of A4 and A5 decrease, while Isc of all the samples decreases, which is consistent with the feature of LID resulting from dissociation of Fe-B pairs [4,5]. (3) Before the 2nd LID, we conducted a whole-area LBIC scan on the samples in a dark box at room temperature for 1.5 h. During this process, a considerable amount of Fe+ and B would re-pair to form Fe-B pairs. The dissociation of Fe-B pairs at the beginning of the 2nd LID would result in the decay of Isc and thus η. After that, all the I-V characteristic parameters basically remain constant, implying that the passivated state BO defects are stable under the condition of the 2nd LID (45 °C, 1 sun, 12 h).

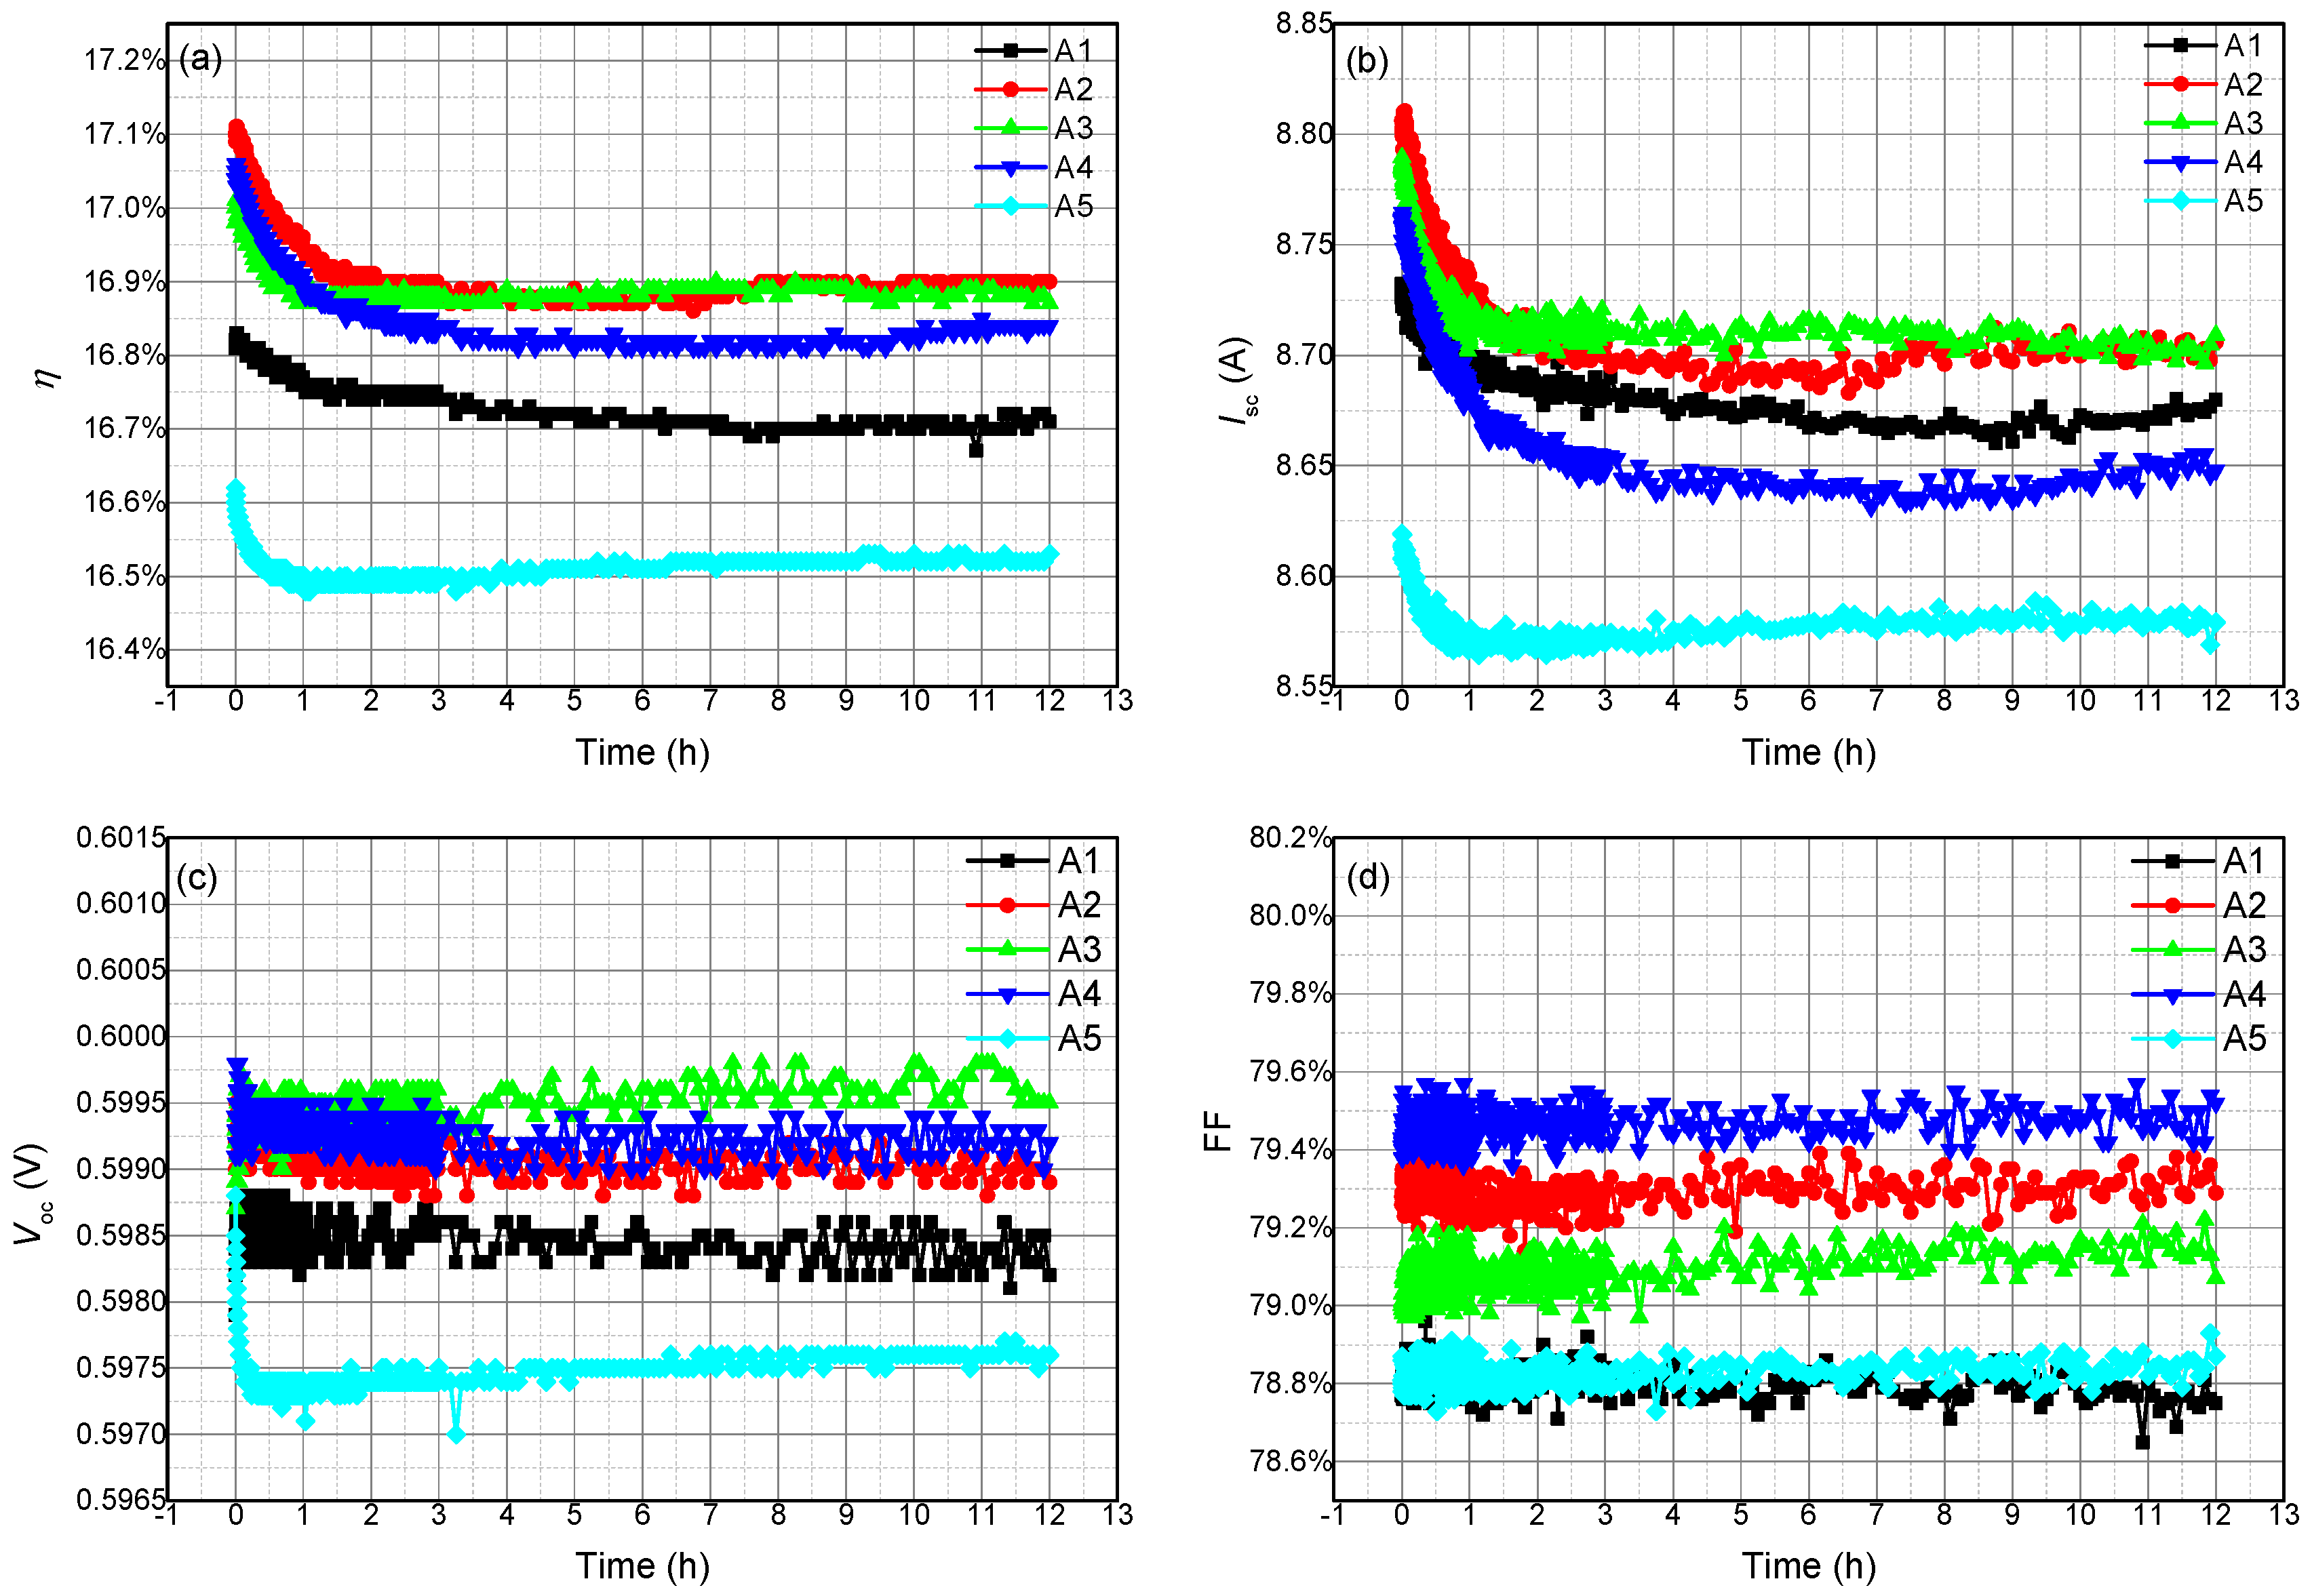
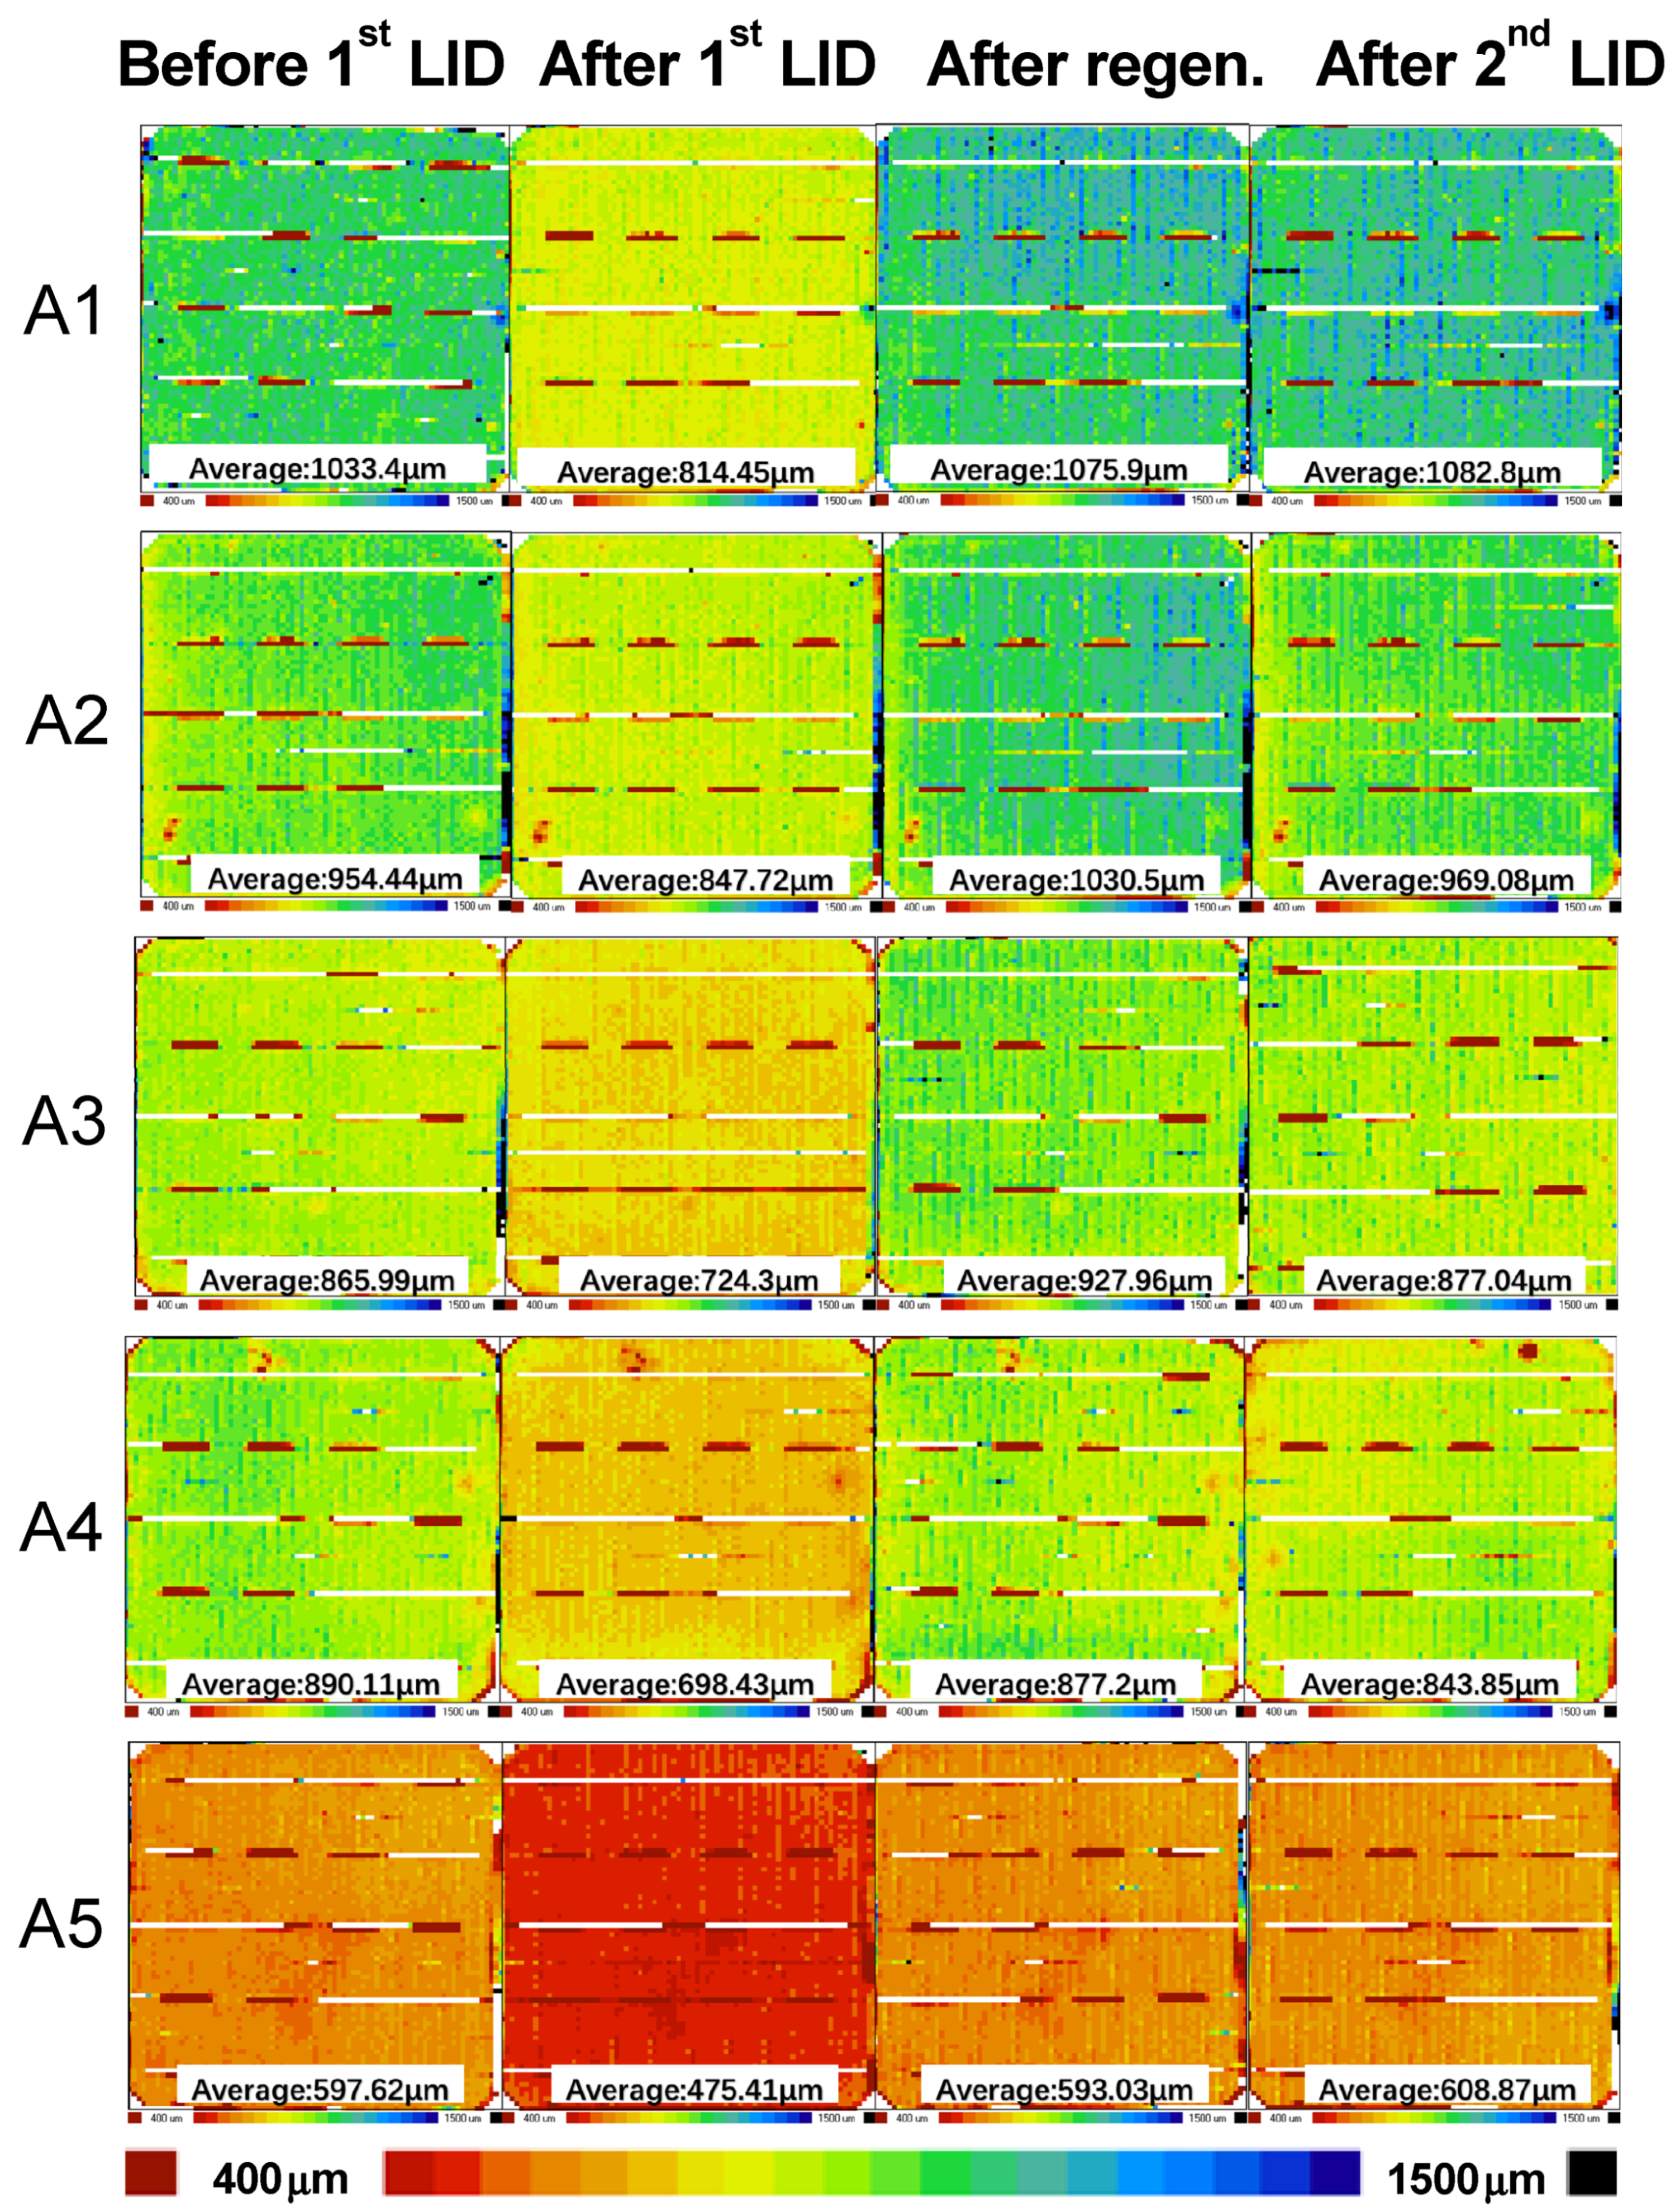
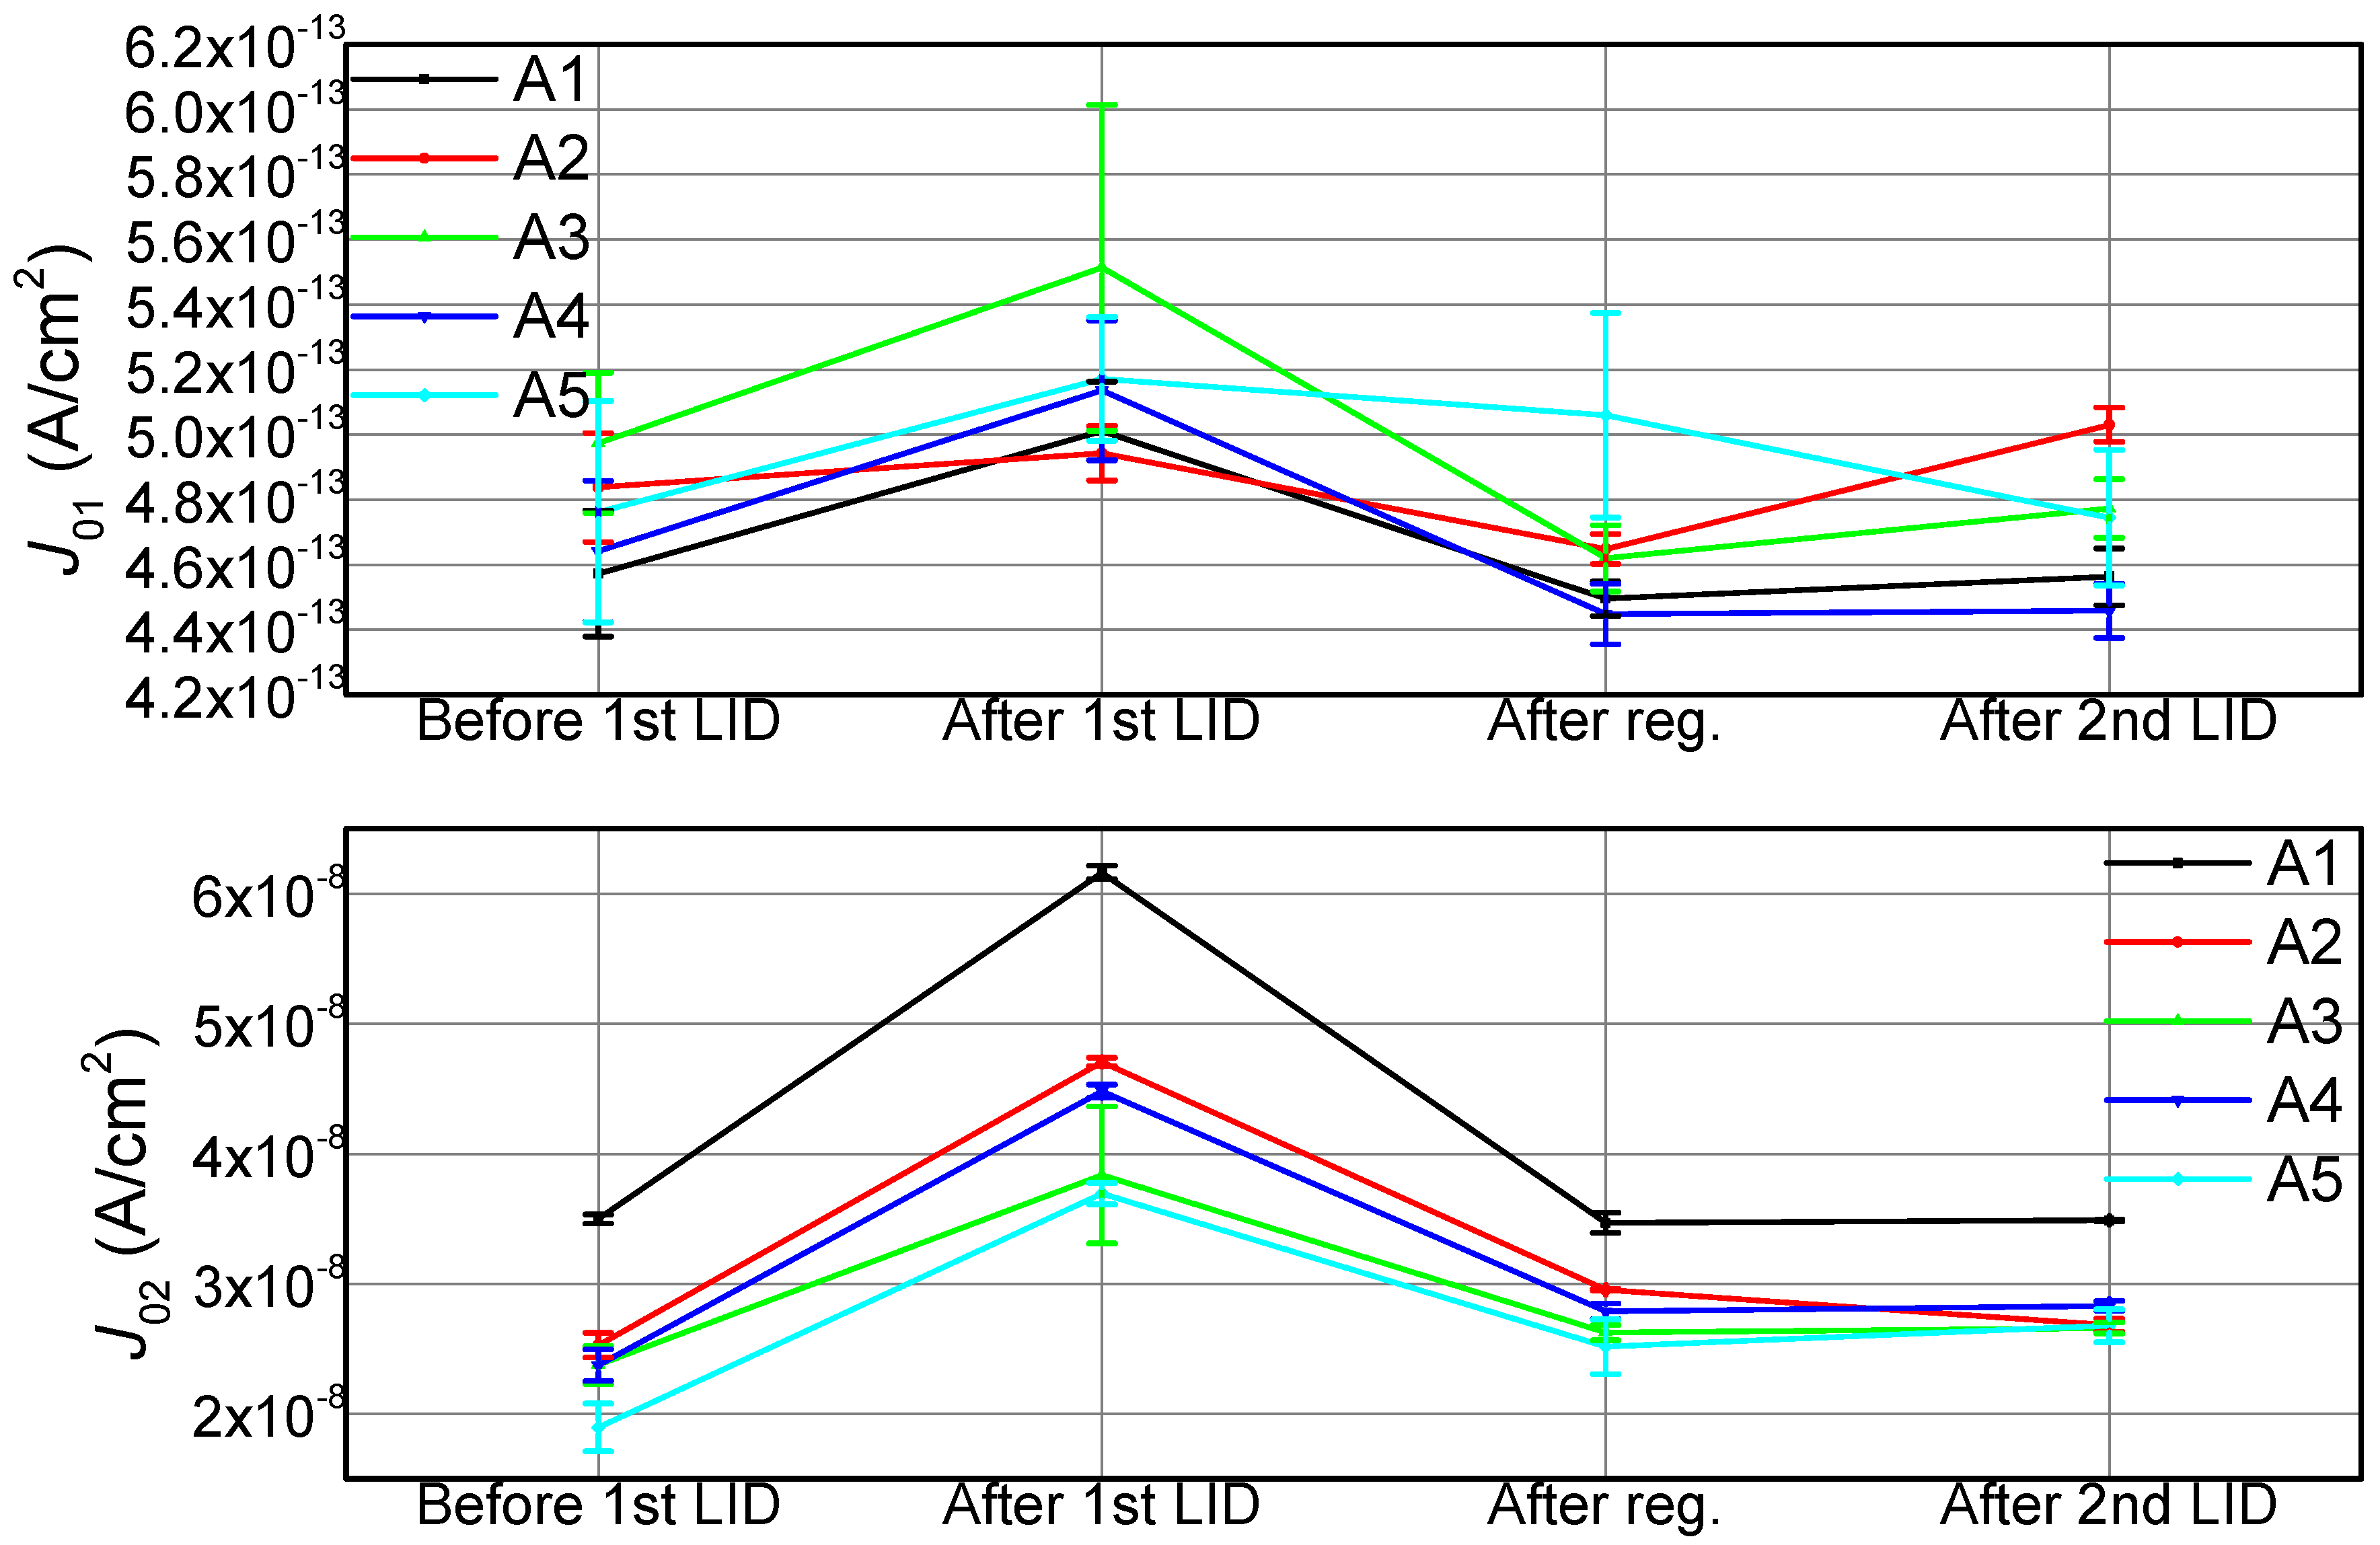
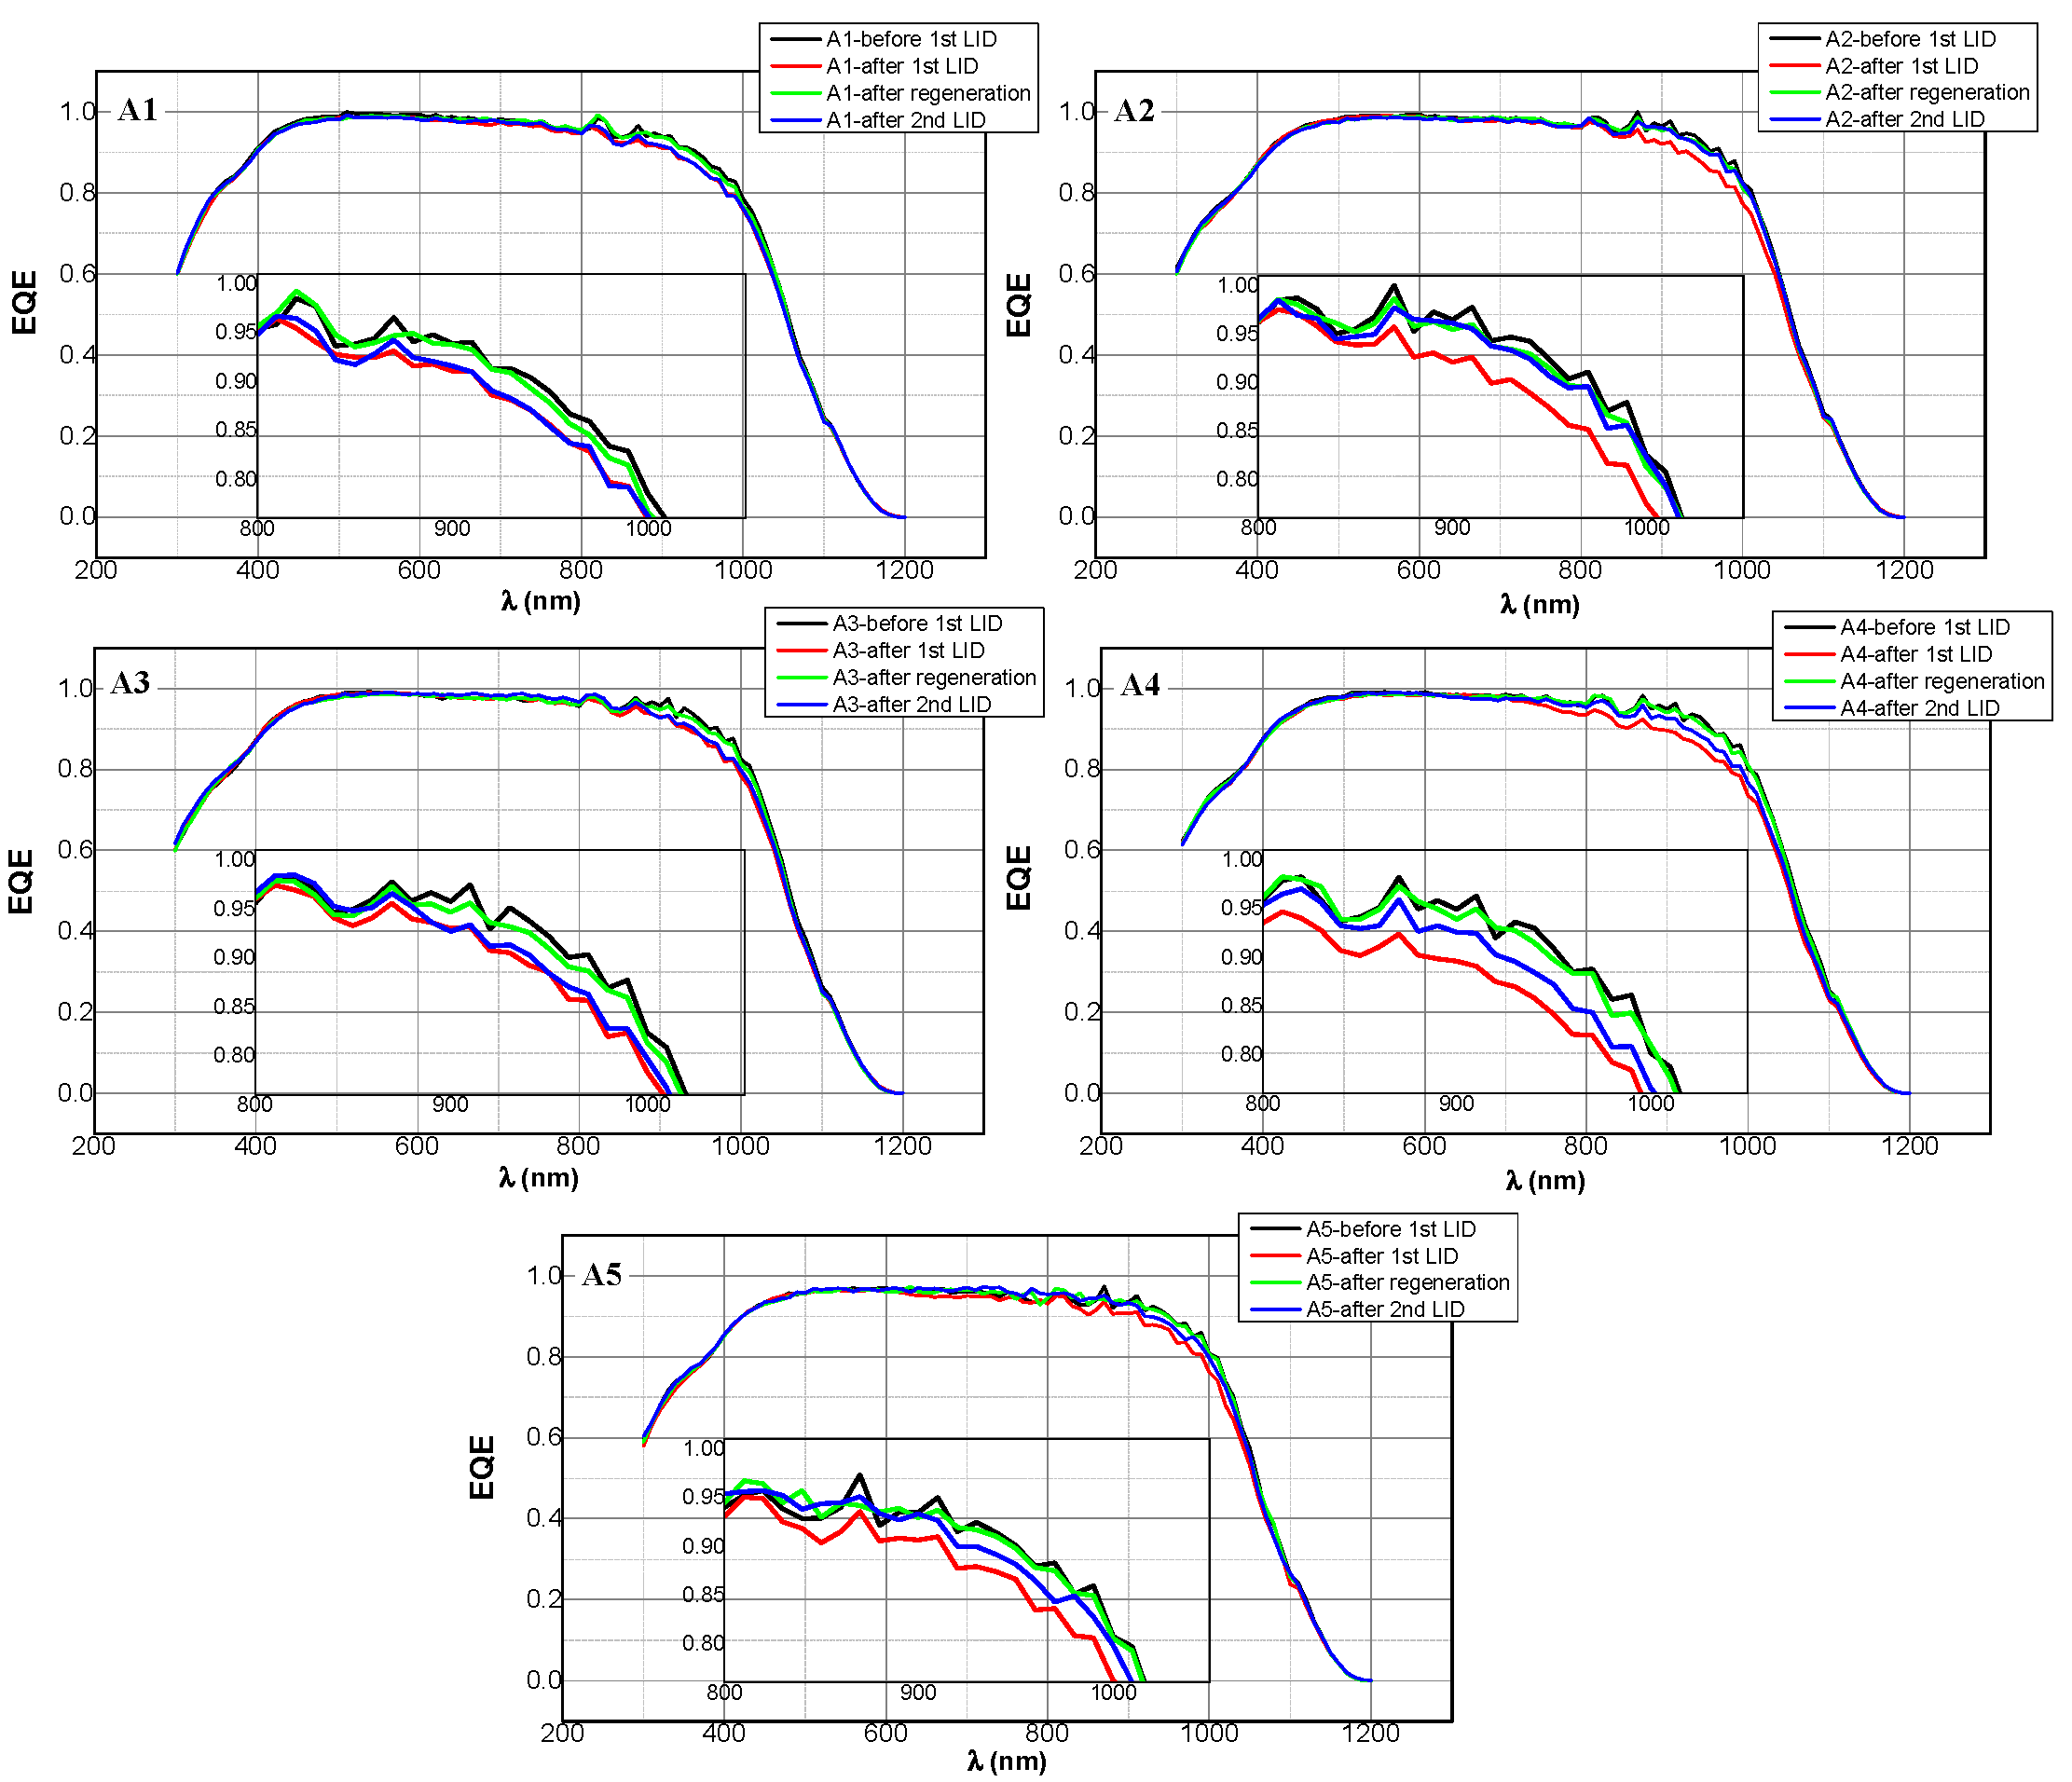
3.3. Measurements of Al-BSF Solar Cells at Four Time Nodes

Figure 4 shows the distribution diagram of minority carrier diffusion length (LD) of five groups of Al-BSF solar cells obtained by a whole-area LBIC scan on the cells by WT-2000 tester at four breakpoints of treatments (before and after the 1st LID, after regeneration and the 2nd LID). As shown in Figure 4, the average minority carrier diffusion lengths (LA) of the five groups of cells basically decrease with the increase of boron content. We note that the LA of all the cells decreases during the 1st LID and increases during the regeneration, and the LA after the regeneration approaches the initial values before the 1st LID, indicating that the LA can be well recovered by the regeneration (100 °C, 1 sun, 24 h). Furthermore, the LA basically remain stable during the 2nd LID, which implies that the regenerated cells possess anti-LID ability. In a word, the change of the LA during the 1st LID, regeneration and the 2nd LID can be fundamentally elucidated by the LID and regeneration reaction of B-O defects [20].
Figure 5 shows the variations of the bulk region dark saturation current density (J01) and the space charge region dark saturation current density (J02) of the five groups of Al-BSF solar cells obtained by Suns-Voc measurement with the processing steps. It can be seen from Figure 5 that J01 and J02 increase after the 1st LID, decrease after the regeneration, and basically remain unchanged after the 2nd LID. The changes of J01 and J02 can be explained by the transition of B-O defects in the three states (annealed state, degraded state, and passivated state) [20]. During the 1st LID, the transition of B-O defects from the annealed state to the degraded state increases the recombination in the bulk and space charge regions and thus both J01 and J02. During the regeneration, the transition of B-O defects from the degraded state to the passivated state reduces the recombination in the bulk and space charge regions and thus both J01 and J02. During the 2nd LID, the passivated state B-O defects are stable under the 2nd LID condition, thus J01 and J02 nearly remain unchanged.
Figure 6 presents the external quantum efficiency (EQE) curves of the five groups of Al-BSF solar cells at four breakpoints of treatments (before and after the 1st LID, after regeneration and the 2nd LID), which can reflect the collection efficiencies of the cells to excess minority carriers generated by light with different wavelengths. As shown in Figure 6, the LID and regeneration treatments mainly affect the spectral response of the cells in the medium and long wavebands, but hardly affect those in the medium and short wavebands. In particular, the spectral responses of all the cells in the medium and long wavebands decrease after the 1st LID, increase to the initial level after regeneration, and show different degrees of decrease after the 2nd LID. The reason for this result is that only the light in the medium and long wavebands can penetrate to a deeper region of the cells, and the carriers generated there, far away from the PN junction, would inevitably be affected by the formation and passivation of degraded state B-O defects in the bulk region when they move to the PN junction by diffusion. In contrast, the light in medium and short wavebands can be largely absorbed by the surface layers of the cells, and the photogenerated carriers are very close to the PN junction (the junction depth of an Al-BSF solar cell is about 1 μm), which are easily collected and hardly affected by the formation and passivation of the degraded state B-O defects in the bulk regions.
Relating the in-situ LID and regeneration results of the cells with the results measured at the four breakpoints of treatments, the following conclusions can be drawn: During the 1st LID, the generation of the degraded state B-O defects increases the recombination of carriers, resulting in reduction of LD, increase of J01 and J02, and decay of η, Voc, Isc and FF. During the regeneration, the passivation of the degraded state B-O defects reduces the recombination of carriers, leading to increase of LD, reduction of J01 and J02, and increase of η, Voc and FF. During the 2nd LID, the passivated state B-O defects are stable under the condition of the 2nd LID, so that the recombination of carriers basically remains unchanged, thus LD, J01, J02, Voc and FF also remain roughly stable. From the above analysis and discussion, we know that the decays of Isc and η at the beginning of the regeneration and the 2nd LID result from the dissociation of Fe-B pairs. In fact, the dissociation of Fe-B pairs also involved in the decay of Isc and η at the beginning of the 1st LID, because we also performed an LBIC scan on the cells before the 1st LID, and Fe-B pairs were generated during this scan process. Overall, the in-situ LID and regeneration of the Al-BSF solar cells can be elucidated by the LID and regeneration reaction of B-O defects combining the dissociation of Fe-B pairs.
Furthermore, we note that the generation and passivation of degraded state B-O defects and the dissociation of Fe-B pairs only affect the spectral response in the medium and long wavebands, implying that both of these are bulk defects and no surface-related degradation is involved. Moreover, after the regeneration treatment, the relative decay rate of η decreases from 2.75~3.8% during the 1st LID to 0.42~1.23% during the 2nd LID, indicating that the regeneration treatment (100 °C, 1 sun, 24 h) can improve the anti-LID ability of Al-BSF solar cells. In addition, compared with the Al-BSF solar cells made from the silicon wafers from the middle of the Cz-Si ingot (such as A2 and A3), those from the head or tail of the ingot have lower Voc and η values but larger decay and rise extent, which should be related to the higher oxygen or boron content of the wafers. For example, the Al-BSF solar cells prepared by wafers from the tail of the ingot possess the lowest η, Voc and Isc throughout the whole process due to the highest boron content of the wafers and thus lowest LD.
In order to further illustrate that our experimental results can be explained by the LID and regeneration reaction of B-O defects and the LID caused by Fe-B pair dissociation, we would like to give further reasonings and evidence.
(1) According to our measurement results, O content is highest and in the order of magnitude of 1017, B content is in the order of magnitude of 1015. As compared with O and B contents, Fe, Cu and Ni concentrations are much less. Specifically speaking, Fe content is three orders of magnitude lower than O content, while Cu and Ni contents are four orders of magnitude lower than O content. Furthermore, by using the empirical formulas from [23], the solubilities and diffusion coefficients of Fe, Cu, and Ni impurities in silicon at 800 °C were calculated to be 2.84 × 10¹² atoms/cm3, 5.54 × 10¹⁶ atoms/cm3 and 1.58 × 10¹⁶ atoms/cm3, and 8.32 × 107 cm2/s, 4.49 × 105 cm2/s and 1.24 × 105 cm2/s, respectively. Since the solubilities of Cu and Ni at 800 °C are three orders of magnitude higher than the measured concentrations (Cu content is less than 3.94 × 10¹³ atoms/cm−3, and Ni content is less than 1.68 × 10¹³ atoms/cm−3), and Cu and Ni are both fast diffusing metal impurities in silicon, they can be effectively eliminated by phosphorus diffusion gettering (PDG) and phosphorus silicon glass etching steps [22]. In contrast, the measured Fe content (>3.25 × 10¹⁴ atoms/cm3) is two orders of magnitude higher than the solubility of Fe in silicon at 800 °C, and the diffusion coefficient of Fe is two orders of magnitude lower than those of Cu and Ni. In addition, the Coulomb action between Fe+ and B can remarkably decrease the effectiveness of the PDG process in removing Fe impurities [22]. All these factors would lead to a certain part of Fe impurities remaining in the solar cells especially fabricated from the silicon wafers with higher B and Fe contents [21]. Although the solar cell fabrication process includes a hydrogen passivation step (i.e., the sintering step with hydrogen-containing passivation layer), no evidence shows that hydrogen can completely passivate the Fe+ and Fe-B pairs [21]. Therefore, our explanation has a solid substance basis that the LID and regeneration of the Al-BSF solar cells are caused by the LID and regeneration reaction of B-O defects and the LID resulting from the dissociation of Fe-B pairs.
(2) The LID and regeneration of B-doped Cz-Si lifetime samples and solar cells are dominated by LID and regeneration reaction of B-O defects, which has been confirmed by a large number of research works (see references [1,2,3,4]). However, we found that the changes of the I-V characteristic parameters of the Al-BSF solar cells at the initial stage of the regeneration and the 2nd LID cannot be explained by the LID and regeneration reaction of B-O defects. In contrast, the changes of the I-V characteristic parameters that we observed at the beginning of the regeneration and the 2nd LID just coincide with the feature of change of the I-V characteristic parameters induced by dissociation of Fe-B pairs. In particular, at the initial stage of the 2nd LID, the dissociation of Fe-B pairs leads to the decay of Isc of all the samples, but different changes of Voc (i.e., Voc of A1 and A2 remain unchanged, Voc of A3 increases, and Voc of A4 and A5 decrease). Since the contents of B and Fe gradually increase from A1 to A5, the variations of Voc of A1 to A5 are highly consistent with the Figure 1 reported by [5], which offers direct experimental evidence that the changes of I-V characteristic parameters of the Al-BSF solar cells at the beginning of the 2nd LID are caused by dissociation of Fe-B pairs.
(3) According to [24], if there exist multiple LID mechanisms in a Cz-Si solar cell, their occurrence order is the Fe-related LID, BO-LID, LeTID and surface related degradation, which further supports our explanation that the changes of I-V characteristic parameters of the Al-BSF solar cells at the beginning of the regeneration and the 2nd LID are caused by the dissociation of Fe-B pairs.
In a word, with the help of ICP-MS technology, we found that the solar-grade Cz-Si wafers were polluted by Fe to a relatively high extent, thus we make a preliminary judgment that Fe-related degradation should be involved in the LID and regeneration of the cells. With the help of the in-situ LID and regeneration measuring technology, we captured the fingerprints of the changes of I-V characteristic parameters of the cells solely caused by the dissociation of Fe-B pairs at the beginning of the regeneration and the 2nd LID, which offers the most direct and critical experimental proof for our explanation that the changes of I-V characteristic parameters at the beginning of the regeneration and the 2nd LID result from the dissociation of Fe-B pairs. The reason why we can capture the feature of LID caused by the dissociation of Fe-B pairs is that the VS-6821M solar cell I-V tester is a powerful tool which makes the in-situ LID and regeneration experiment of a solar cell become feasible. Specifically speaking, in our experiment the I-V test was set to automatically measure the I-V characteristic curve of a solar cell per 10 s in the first hour and per 1 min from the first to the third hour while the solar cell performed the LID or regeneration treatment on the same I-V tester. Without the help of the I-V tester, it would be difficult to find or easy to ignore the LID caused by the dissociation of Fe-B pairs at the beginning of the regeneration and the 2nd LID. In conclusion, it is sufficient and reasonable to elucidate the observed experimental results by the LID and regeneration reaction of B-O defects combining the LID caused by dissociation of Fe-B pairs, which has conclusive experimental evidence and extensive literature support.

3.4. Uncertainty Illustration

According to the declaration of the producer (IVT company) of the VS-6821M solar cell I-V tester, the relative uncertainties of the measured Isc, Voc, FF and η can reach 4.99%, 0.51%, 0.48%, and 5.00%, respectively. In our experiment, Fe, Cu and Ni contents were measured by using an Agilent 7900 ICP-MS strictly following the relevant national test standard of China (GB/T 31584-2015, Test method for measuring metallic impurities content in silicon materials used for photovoltaic applications by inductively coupled plasma mass spectrometry, 3 July 2015). The uncertainties of Fe, Cu and Ni contents measured by the ICP-MS were estimated to be in the range of 1.5–3.4%. The concentrations of interstitial oxygen and substitutional carbon in silicon wafer samples were measured by a Thermo Fisher Nicolet 6700 FT-IR spectrometer strictly following the relevant national test standard of China (GB/T 1557-2018, Test method for determining interstitial oxygen content in silicon by infrared absorption, 17 September 2018; GB/T 1558-2009, Test method for substitutional atomic carbon content of silicon by infrared absorption, 30 October 2009). According to the claim of the national test standard, the relative standard uncertainties of FT-IR measurement results are less than 4.4%. The relative uncertainty of the measured resistivities of the silicon wafers by the KUNDE KDB-1 four probe tester was estimated to be less than 1% under ideal test conditions. J01 and J02 of the Al-BSF solar cells were obtained by fitting the measured Suns-Voc curves with a built-in software of the Sinton WCT-120 apparatus. For each solar cell sample, Suns-Voc measurements were performed three times, and the arithmetic mean deviations of J01 and J02 were calculated by using the results obtained and presented in Figure 5. The accuracy of the EQE measurement results given by the Enlitech QE-R equipment has been recognized by the academic community. For example, the EQE measurement results of the Enlitech QE-R equipment have been published in top journals like Nature Energy (see [25]). Since the manufacturer of SemiLab WT-2000 tester neither provide the solution method of minority carrier diffusion length, nor provide the uncertainty of the calculated minority carrier diffusion length, the uncertainty of the obtained minority carrier diffusion length cannot be offered. Moreover, the average value of minority carrier diffusion length given in this paper is not only related to its magnitude, but also related to its distribution. Nevertheless, the obtained distribution maps and average values of minority carrier diffusion length show a clear change tendency with the processing steps. It should be mentioned that the above relative uncertainty values all correspond to the confidence level of 95.4%.

4. Conclusions

In this paper, the in-situ LID and regeneration of industrial Al-BSF solar cells fabricated from silicon wafers from different locations of a commercial solar-grade Cz-Si ingot were investigated. The results show that the in-situ LID and regeneration of the Al-BSF solar cells can be elucidated by combining the LID and regeneration reaction of B-O defects and the LID results from the dissociation of Fe-B pairs. Moreover, the latter only occurs at the beginning of the LID or regeneration. After the regeneration treatment, the relative decay rate of η drops from 2.75–3.8% during the 1st LID to 0.42–1.23% during the 2nd LID, indicating that the regeneration treatment (100 °C, 1 sun, 24 h) can improve the anti-LID ability of the Al-BSF solar cells. Furthermore, the LID and regeneration of the Al-BSF solar cells mainly affect the spectral responses in the medium and long wavebands, but hardly affect those in the medium and short wavebands, implying that B-O defects and Fe-B pairs are both bulk defects. In addition, compared with the Al-BSF solar cells prepared from silicon wafers from the middle of the Cz-Si ingot, the Al-BSF solar cells fabricated from those from the head or tail of the ingot not only have lower Voc and η values, but also have larger decay or rise extent in Voc and η during the LID or regeneration.

Author Contributions

Conceptualization, B.A.; methodology, B.A.; validation, S.D., C.Y. and S.Y.; formal analysis, S.D., C.Y., S.Y., B.A. and C.Q.; investigation, S.D., C.Y., S.Y. and C.Q.; resources, X.S., J.Y., Q.L. and X.L.; data, S.D., C.Y. and S.Y.; writing—original draft preparation, S.D. and C.Y.; writing—review and editing, S.D., C.Y., B.A., Z.L. and Y.Z.; visualization, S.D.; supervision, B.A.; project administration, B.A.; funding acquisition, B.A. All authors have read and agreed to the published version of the manuscript.

Funding

This research was funded by the National Natural Science Foundation of China, grant number 61774171.

Institutional Review Board Statement

Not applicable.

Informed Consent Statement

Not applicable.

Data Availability Statement

The data used to support the findings of this study are included within the paper.

Conflicts of Interest

The authors declare no conflict of interest.

Nomenclature

LIDlight induced degradation
BO-LIDB-O defects related light induced degradation
Al-BSFaluminium back-surface-field
PERCpassivated emitter and rear cell
Cz-SiCzochralski silicon
Mono-Simonocrystalline silicon
RTPrapid thermal processing
LeTIDlight- and elevated temperature-induced degradation
ICP-MSInductively Coupled Plasma-Mass Spectrometry
FT-IRFourier transform infrared
PSGphosphor silicate glass
PECVDPlasma Enhanced Chemical Vapor Deposition
LBIClight-beam induced current
EQEexternal quantum efficiency
PDGphosphorus diffusion gettering
η[%] efficiency
Isc[A] short-circuit current
Voc[V] open-circuit voltage
FF[%] fill factor
τ[μs] minority carrier lifetime
Δn[cm−3] excess carrier injection level
ΔnCOP[cm−3] crossover-point carrier concentration
LD[μm] minority carrier diffusion length
LA[μm] average minority carrier diffusion lengths
J01[A/cm2] bulk region dark saturation current density
J02[A/cm2] space charge region dark saturation current density

References

  1. Niewelt, T.; Schon, J.; Warta, W.; Glunz, S.W.; Schubert, M.C. Degradation of Crystalline Silicon Due to Boron–Oxygen Defects. IEEE J. Photovolt. 2017, 7, 383–398. [Google Scholar] [CrossRef]
  2. Lindroos, J.; Savin, H. Review of light-induced degradation in crystalline silicon solar cells. Sol. Energy Mater. Sol. C 2016, 147, 115–126. [Google Scholar] [CrossRef]
  3. Hallam, B.; Herguth, A.; Hamer, P.; Nampalli, N.; Wilking, S.; Abbott, M.; Wenham, S.; Hahn, G. Eliminating Light-Induced Degradation in Commercial p-Type Czochralski Silicon Solar Cells. Appl. Sci. 2018, 8, 10. [Google Scholar] [CrossRef] [Green Version]
  4. Schmidt, J.; Bothe, K.; Macdonald, D.; Adey, J.; Jones, R.; Palmer, D.W. Electronically stimulated degradation of silicon solar cells. J. Mater. Res. 2006, 21, 5–12. [Google Scholar] [CrossRef] [Green Version]
  5. Schmidt, J. Effect of dissociation of iron-boron pairs in crystalline silicon on solar cell properties. Prog. Photovolt. 2005, 13, 325–331. [Google Scholar] [CrossRef]
  6. Boulfrad, Y.; Lindroos, J.; Wagner, M.; Wolny, F.; Yli-Koski, M.; Savin, H. Experimental evidence on removing copper and light-induced degradation from silicon by negative charge. Appl. Phys. Lett. 2014, 105, 182108. [Google Scholar] [CrossRef] [Green Version]
  7. Herguth, A.; Schubert, G.; Kaes, M.; Hahn, G. Avoiding boron-oxygen related degradation in highly boron doped Cz silicon. In Proceedings of the 21st European Photovoltaic Solar Energy Conference (EUPVSEC), Dresden, Germany, 4–8 September 2006; pp. 530–537. [Google Scholar]
  8. Wilking, S.; Engelhardt, J.; Ebert, S.; Beckh, C.; Herguth, A.; Hahn, G. High Speed Regeneration of BO-Defects: Improving Long-Term Solar Cell Performance within Seconds. In Proceedings of the 29th European Photovoltaic Solar Energy Conference and Exhibition (EUPVSEC), Amsterdam, The Netherlands, 22–26 September 2014; pp. 366–437. [Google Scholar]
  9. Basnyat, P.; Sopori, B.; Devayajanam, S.; Shet, S.; Binns, J.; Appel, J.; Ravindra, N.M. Experimental study to separate surface and bulk contributions of light-induced degradation in crystalline silicon solar cells. Emerg. Mater. Res. 2015, 4, 239–246. [Google Scholar] [CrossRef]
  10. Herguth, A.; Wilking, S.; Horbelt, R.; Ebert, S.; Beckh, C.; Friedrich, D.; Hahn, G. Accelerating boron-oxygen related regeneration: Lessons learned from the BORNEO project. In Proceedings of the 31st European Photovoltaic Solar Energy Conference 2015 (EUPVSEC), Hamburg, Germany, 14–18 September 2015; pp. 804–810. [Google Scholar]
  11. Ebong, A.; Chen, N.; Chowdhury, A.; Unsur, V. The impact of rapid thermal processing (RTP) on crystalline silicon solar cell performance and light induced degradation (LID). In Proceedings of the IEEE 42nd Photovoltaic Specialist Conference (PVSC), New Orleans, LA, USA, 14–19 June 2015; pp. 1–4. [Google Scholar]
  12. Padmanabhan, M.; Jhaveri, K.; Sharma, R.; Kanti Basu, P.; Raj, S.; Wong, J.; Li, J. Light-induced degradation and regeneration of multicrystalline silicon Al-BSF and PERC solar cells. Phys. Status Solidi Rapid Res. Lett. 2016, 10, 874–881. [Google Scholar] [CrossRef]
  13. Cho, E.; Rohatgi, A.; Ok, Y. Comparison of light-induced degradation and regeneration in P-type monocrystalline full aluminum back surface field and passivated emitter rear cells. Curr. Appl. Phys. 2018, 18, 1600–1604. [Google Scholar] [CrossRef]
  14. Varshney, U.; Li, W.; Li, X.; Chan, C.; Hoex, B. Impact of wafer properties and production processes on the degradation in industrial PERC solar cells. In Proceedings of the 47th IEEE Photovoltaic Specialists Conference (PVSC), Calgary, AB, Canada, 15 June–21 August 2020; pp. 0803–0806. [Google Scholar]
  15. Sinha, A.; Qian, J.; Hurst, K.; Moffitt, S.L.; Schelhas, L.T.; Miller, D.C.; Hacke, P. UV-Induced Degradation of High-Efficiency Solar Cells with Different Architectures. In Proceedings of the 47th IEEE Photovoltaic Specialists Conference (PVSC), Calgary, AB, Canada, 15 June–21 August 2020; pp. 1990–1991. [Google Scholar]
  16. Yuan, S.; Ding, S.; Ai, B.; Chen, D.; Jin, J.; Ye, J.; Qiu, D.; Sun, X.; Liang, X. In Situ LID and Regeneration of PERC Solar Cells from Different Positions of a B-Doped Cz-Si Ingot. Int. J. Photoenergy 2022, 2022, 6643133. [Google Scholar] [CrossRef]
  17. Wagner, M.; Wolny, F.; Hentsche, M.; Krause, A.; Sylla, L.; Kropfgans, F.; Ernst, M.; Zierer, R.; Bonisch, P.; Muller, P.; et al. Correlation of the LeTID amplitude to the Aluminium bulk concentration and Oxygen precipitation in PERC solar cells. Sol. Energy Mater. Sol. C 2018, 187, 176–188. [Google Scholar] [CrossRef]
  18. Shabani, M.B.; Yamashita, T.; Morita, E. Metallic Impurities in Mono and Multi-crystalline Silicon and Their Gettering by Phosphorus Diffusion. ECS Trans. 2008, 16, 179–193. [Google Scholar] [CrossRef]
  19. Miyamura, Y.; Harada, H.; Nakano, S.; Nishizawa, S.; Kakimoto, K. Relationship between carbon concentration and carrier lifetime in CZ-Si crystals. J. Cryst. Growth 2018, 486, 56–59. [Google Scholar] [CrossRef]
  20. Hallam, B.; Abbott, M.; Nampalli, N.; Hammer, P.; Wenham, S. Influence of the formation- and passivation rate of boron-oxygen defects for mitigating carrier-induced degradation in silicon within a hydrogen-based model. J. Appl. Phys. 2016, 119, 065701. [Google Scholar] [CrossRef]
  21. Yakimov, E.B. Metal Impurities and Gettering in Crystalline Silicon. In Handbook of Photovoltaic Silicon; Springer: Berlin/Heidelberg, Germany, 2019; pp. 495–540. ISBN 978-3-662-56471-4. [Google Scholar]
  22. Shabani, M.B.; Yamashita, T.; Morita, E. Study of Gettering Mechanisms in Silicon: Competitive Gettering between Phosphorus Diffusion Gettering and Other Gettering Sites. Solid State Phenom. 2007, 131–133, 399–404. [Google Scholar] [CrossRef]
  23. Weber, E.R. Transition metals in silicon. Appl. Phys. A 1983, A30, 1–22. [Google Scholar] [CrossRef]
  24. Herguth, A. Application of the Concept of Lifetime-Equivalent Defect Density in Defect Systems Comprising a Multitude of Defect Species. Phys. Status Solidi A 2019, 216, 1900322. [Google Scholar] [CrossRef]
  25. Chen, H.; Zhang, R.; Chen, X.; Zeng, G.; Kobera, L.; Abbrent, S.; Zhang, B.; Chen, W.; Xu, G.; Oh, J.; et al. A guest-assisted molecular-organization approach for >17% efficiency organic solar cells using environmentally friendly solvents. Nat. Energy 2021, 6, 1045–1053. [Google Scholar] [CrossRef]
Figure 1. In-situ changes of illuminated I-V characteristic parameters of the five groups of Al-BSF solar cells with processing time within the 1st LID (45 °C, 1 sun, 12 h). (a) efficiency; (b) short-circuit current; (c) open-circuit voltage; (d) fill factor.
Energies 15 05591 g001
Figure 2. In-situ changes of illuminated I-V characteristic parameters of five groups of Al-BSF solar cells with processing time within the regeneration (100 °C, 1 sun, 24 h). (a) efficiency; (b) short-circuit current; (c) open-circuit voltage; (d) fill factor.
Energies 15 05591 g002
Figure 3. In-situ changes of illuminated I-V characteristic parameters of the five groups of Al-BSF solar cells with processing time within the 2nd LID (45 °C, 1 sun, 12 h). (a) efficiency; (b) short-circuit current; (c) open-circuit voltage; (d) fill factor.
Energies 15 05591 g003
Figure 4. The minority carrier diffusion length mapping of the five groups of Al-BSF solar cells obtained by full-area LBIC scan at four breakpoints of treatments (before and after the 1st LID, after regeneration and the 2nd LID).
Energies 15 05591 g004
Figure 5. The variations of dark saturation current density (J01, J02) of the five groups of Al-BSF solar cells with the processing steps.
Energies 15 05591 g005
Figure 6. EQE curves of the five groups of Al-BSF solar cells at four breakpoints of treatments (before and after the 1st LID, after regeneration and the 2nd LID).
Energies 15 05591 g006
Table 1. The average resistivity as well as average contents of B, O, C, Fe, Cu and Ni of the five groups of Cz-Si wafers.
GroupResistivity
(Ω∙cm)
B
(cm−3)
O
(cm−3)
C
(cm−3)
Fe
(cm−3)
Cu
(cm−3)
Ni
(cm−3)
11.798.10 × 10159.65 × 10170.78 × 10173.25 × 10142.26 × 10131.07 × 1013
21.788.16 × 10158.53 × 10170.81 × 10173.40 × 10143.23 × 10131.12 × 1013
31.499.83 × 10157.51 × 10170.90 × 10173.44 × 10143.41 × 10131.23 × 1013
41.2911.47 × 10157.24 × 10170.97 × 10174.47 × 10143.73 × 10131.36 × 1013
51.1612.91 × 10156.43 × 10171.12 × 10175.39 × 10143.94 × 10131.68 × 1013
Publisher’s Note: MDPI stays neutral with regard to jurisdictional claims in published maps and institutional affiliations.

