Article

Comparison of LID and Electrical Injection Regeneration of PERC and Al-BSF Solar Cells from a Cz-Si Ingot

1
School of Materials Science and Engineering, Sun Yat-sen University, Guangzhou 510006, China
2
Guangdong Provincial Key Laboratory of Photovoltaic Technologies, Sun Yat-sen University, Guangzhou 510006, China
3
CSG PVTECH Co., Ltd., Dongguan 523141, China
4
Yichang CSG Polysilicon Co., Ltd., Yichang 443007, China
*
Author to whom correspondence should be addressed.
Submission received: 6 September 2022 / Revised: 12 October 2022 / Accepted: 17 October 2022 / Published: 20 October 2022
(This article belongs to the Special Issue Recent Development of Silicon Solar Cells)

Abstract

:
In order to study the effect of device structures and silicon wafer positions on light-induced degradation (LID) and regeneration, five groups of industrial PERC and Al-BSF solar cells were fabricated by using silicon wafers from different positions of a B-doped Czochralski silicon (Cz-Si) ingot. Then, the cells were subjected to a dark annealing (200 °C, 30 min), the first LID (45 °C, 1 sun, 12 h), an electrical injection regeneration (175 °C, 18 A, 30 min) and the second LID (45 °C, 1 sun, 12 h) in order, and the variations of performance of the cells with processing time were measured. It was found that after the electrical injection regeneration, the efficiency losses of PERC cells decreased from 1.28–1.76%absolute in the first LID to 0.09–0.16%absolute in the second LID, while those of Al-BSF cells decreased from 0.3–0.66%absolute in the first LID to 0 in the second LID. The efficiency losses of PERC cells during the first LID were caused by the co-action of B-O-defect-induced LID (BO-LID) and dissociation of Fe-B pairs, and the latter contributed 5.81–9.56% of the efficiency loss, while those of Al-BSF cells during the first LID were almost contributed by BO-LID solely. For both kinds of cells, the cells made from the silicon wafers from middle of the ingot had the best performance throughout the experiment. In addition, the LID and regeneration treatments only affected the spectral response of the cells in the wavelength larger than 700 nm.

1. Introduction

Although B-doped Czochralski silicon (Cz-Si) solar cells have many merits, such as high efficiency, low cost, long service life, mature fabrication technique, etc., they have a demerit of light-induced degradation (LID), which has severely impeded their further development. It is generally thought that boron–oxygen (B-O) defects generated in the bulk region of B-doped Cz-Si solar cells due to illumination or applying forward bias in dark are responsible for the LID [1,2]. Because of B-O defects induce LID (BO-LID), aluminum back surface field (Al-BSF) solar cells and passivated emitter and rear cells (PERC) without performing anti-LID treatment (i.e., regeneration) would suffer an efficiency loss of 3–4%relative and 4–6%relative, respectively [3]. Moreover, since solar-grade crystalline silicon wafers are often polluted by transition metal impurities and these impurities cannot be completely removed or passivated by the subsequent solar cell fabrication processes [4], the LID induced by transition metal impurities generally cannot be neglected [5,6]. Taking Fe-related LID as an example, the dissociation of Fe-B pairs under illumination can result in degradation of short-circuit current (Isc) and efficiency (η) of the solar cells [6].
In order to eliminate the LID of B-doped Cz-Si solar cells, a lot of efforts have been made [3,6,7,8]. It is worth mentioning that Herguth et al. presented a new approach in 2006 called regeneration to inhibit BO-LID by combining heating (65–200 °C) and carrier injection (light injection or electrical injection) [9,10]. Through regeneration, degraded-state B-O defects can be converted into the regenerated-state ones, leading to the recovery of electrical performance of lifetime samples or solar cells. More importantly, the regenerated state B-O defects are stable and will not cause degradation at the typical operating conditions of solar cells. At present, the regeneration acting as an anti-LID method has been widely applied in the production of the industrial B-doped Cz-Si PERC cells.
In respect of a comparative study on LID and regeneration of B-doped Cz-Si PERC and Al-BSF cells, Cascant et al. [11] fabricated three kinds of solar cells (PERC, Al-BSF and PERT (passivated emitter rear totally diffused)) by using silicon wafers from the same region of a B-doped Cz-Si ingot, and studied the effects of device architectures on LID (0.5 suns, 50 °C, under open-circuit condition) and regeneration (1.5 suns, 148 °C) of the cells in 2014. Compared with Al-BSF and PERT cells, PERC cells have the larger efficiency degradation amplitude and faster regeneration rate, which were attributed to the better back surface passivation, resulting in higher sensitivity of electrical performance to the degradation of bulk lifetime and higher minority carrier injection level under the identical illumination. All three kinds of regenerated cells showed non-apparent change during the subsequent 72 h illumination (0.5 suns, 50 °C). In 2015, Herguth et al. [12] compared the regeneration (~1 sun, 130 °C) of B-doped Cz-Si Al-BSF and PERC cells, and found that the PERC cells regenerated faster than Al-BSF cells. Besides the higher minority carrier injection level of PERC cells indicated by Cascant et al., the authors pointed out that the back surface passivation layers acting as an additional hydrogen source also contribute to the acceleration by releasing more hydrogen atoms to the bulk region. In 2018, Cho et al. [13] studied the LID (0.8 suns, 37 °C, 48 h) and regeneration of B-doped Cz-Si Al-BSF and PERC cells, wherein three regeneration conditions were attempted to examine the stability of the regenerated cells. The authors confirmed the previous finding that PERC cells would suffer a larger efficiency degradation than Al-BSF cells due to the degradation of bulk lifetime. As compared to low temperature/long time (75 °C, 1 sun, 48 h) and high temperature/short time regeneration (200 °C, 3 suns, 30 s), only the intermediate temperature/time regeneration (130 °C, 2 suns, 1.5 h) can achieve almost complete recovery (over 99%) for both cells through balancing regeneration rate and avoiding the destabilization and annihilation reactions of B-O defects. It should be mentioned that the PERC cells reported by the literature [12,13] used SiOx/SiNx:H or SiO2/SiNx stacks as the back surface passivation layer, which is different from the AlOx/SiNx:H or Al2O3/SiNx:H stack actually adopted by industrial PERC cells.
Although some comparative studies have been carried out on the LID and regeneration of B-doped Cz-Si PERC and Al-BSF cells, only the results of light injection regeneration were reported; moreover, no comparative study on effects of silicon wafer positions on LID and regeneration of both cells can be found. To address this issue, this work is intended to perform a comparative investigation on LID and electrical injection regeneration of industrial PERC and Al-BSF cells made from silicon wafers from different positions of a B-doped Cz-Si ingot. For the study of electrical injection regeneration of industrial PERC cells, we have investigated the influence of the regeneration conditions (temperature, injection current and treatment time) on the recovery of industrial PERC cells, and preliminarily optimized the regeneration condition to be 180 °C, 10 A and 30 min [14]. After that, by using five-level orthogonal experiments, the optimum regeneration condition was determined as 175 °C, 18 A, 30 min [15]. In this work, this optimum electrical injection regeneration condition was directly used. After the device fabrication using standard industrial processes, the as-prepared PERC and Al-BSF cells were treated by a dark annealing (200 °C, 30 min), the first LID (1 sun, 45 °C, 12 h), an electrical injection regeneration (175 °C, 18 A, 30 min) and the second LID (1 sun, 45 °C, 12 h) in turn, and the LID curves of the I-V characteristic parameters during the two LID treatments were measured in situ. At the breakpoints of treatments, I-V characteristic measurement, LBIC scan, Suns-Voc measurement and EQE measurement were performed.
This research aims to clarify the difference in the LID and regeneration of industrial PERC and Al-BSF cells made from silicon wafers from different positions of a solar-grade B-doped Cz-Si ingot, reveal the impacts of silicon wafer positions and device architectures on the LID and regeneration, identify the major LID mechanisms and their contribution ratios by analyzing the experimental results, including the impurity contents of as-used silicon wafers, in situ LID curves of I-V characteristic parameters, EQE measurement results, etc., and provide valuable clues for further inhibiting the LID of both industrial cells in the end.

2. Experiment

Five groups of 180 μm thick M2 silicon wafers (156.75 mm × 156.75 mm) were cut from a solar grade B-doped Cz-Si ingot at a certain distance from head to tail, and named group 1 to group 5 in order. The contents of transition metal impurities (Fe, Cu, Ni) and those of oxygen and carbon in the silicon wafers were measured by an Agilent 7900 inductively coupled plasma mass spectrometry (ICP-MS) and a Thermo Nicolet 6700 Fourier transform infrared (FT-IR) spectrometer at room temperature, respectively. After removing thermal donors through annealing silicon wafers at 650 °C in Ar for 2 h, boron content was indirectly obtained by measuring the resistivities of the silicon wafers by a KUNDE KDB-1 four-probe tester. For the measurement details, please see the literature [16,17]. Then, the five groups of silicon wafers were made into PERC and Al-BSF cells by using the standard industrial processes, respectively. The fabrication process of the PERC cells was described in the literature [16]. Compared with the PERC cell process, the Al-BSF cell process only omits two steps (deposition of AlOx/SiNx back passivation layers by PECVD and laser ablation of the back passivation layers to form local back contact window). The five groups of PERC and Al-BSF cells made from five groups of silicon wafers (group 1 to group 5) were named P1-P5 and A1-A5 in order, respectively. It should be emphasized that no regeneration treatments were performed on as-prepared PERC and Al-BSF cells. In addition, the actual efficiency (η) and short-circuit current (Isc) of both cells should be higher than the measured values, because the light intensity of the solar simulator was calibrated to 1 sun by using a reference cell certified by Fraunhofer Institute for Solar Energy Systems (ISE), but the shading caused by five rows of probes makes the light intensity actually received by the tested cell be lower than 1 sun.
Then, the five groups of PERC and Al-BSF cells were subjected to a dark annealing (200 °C, 30 min), the first LID (1 sun, 45 °C, 12 h), an electrical injection regeneration (175 °C, 18 A, 30 min) and the second LID (1 sun, 45 °C, 12 h) treatments in turn. Herein, the dark annealing was carried out on a WXD2620 thermal stage in a dark room, the two LID treatments were performed on a IVT VS-6821M solar cell I-V tester, and the electrical injection regeneration was conducted on a home-made apparatus described in the literature [14]. During the two LID treatments, the I-V tester was set to automatically measure the I-V characteristic curve of the tested cell per 1 min, thus the in situ LID curve of the cell was obtained. At five breakpoints of treatments (before the dark annealing, after the dark annealing, after the first LID, after the regeneration and after the second LID), the I-V characteristic curve of the tested cell was measured at STC condition (AM1.5 spectra, 1 sun, 25 °C) by using the I-V tester, full area LBIC (light-beam-induced current) scan was performed on a SemiLab WT-2000 tester using 2 μm step, and Suns-Voc measurement was conducted by using a Sinton WCT-120 apparatus. It should be mentioned that when we performed LBIC calibration before the formal LBIC scan, we were prompted that two laser diodes were abnormal with light intensity below the normal values. As a result, the values of minority carrier diffusion length of cells obtained from the LBIC scan were inaccurate or unreliable, and thus not shown in this paper. However, the LBIC scan which was carried out in a dark box for at least 1.5 h can provide a chance for forming Fe-B pairs. At four breakpoints of treatments (before the dark annealing, after the first LID, after the regeneration and after the second LID), the external quantum efficiency (EQE) curve of the tested cell in 300–1200 nm was measured by using a PVE300-IVT QE equipment after the sample was kept in dark for more than 48 h. For the uncertainty illustration of the above apparatus and their measurement results, please see the literature [17].

3. Results and Discussion

3.1. Resistivities and Impurity Contents of Silicon Wafers

Table 1 presents the measured resistivities and impurity concentrations of five groups of B-doped Cz-Si wafers. As shown in Table 1, from head to tail of the Cz-Si ingot, boron, carbon, iron, copper and nickel concentrations rise gradually, whereas oxygen concentration drops gradually. Oxygen concentration is highest, which is larger than carbon concentration by about one order of magnitude, larger than boron concentration by two orders of magnitude, larger than iron concentration by three orders of magnitude, and larger than copper and nickel concentrations by four orders of magnitude. The measured oxygen concentration and distribution along the Cz-Si ingot are in line with the literature [18], and the iron, copper and nickel concentrations as well as distributions are in good accordance with the literature [19]. As different groups of Cz-Si wafers have similar carbon concentration, and carbon concentration has no apparent effect on the carrier lifetime of Cz-Si wafers [20], the impact of carbon concentration on LID and regeneration of the PERC and Al-BSF cells will be neglected in the following.

3.2. LID and Electrical Injection Regeneration of PERC and Al-BSF Cells

Figure 1 shows the in situ variations of efficiency (η), open circuit voltage (Voc), short circuit current (
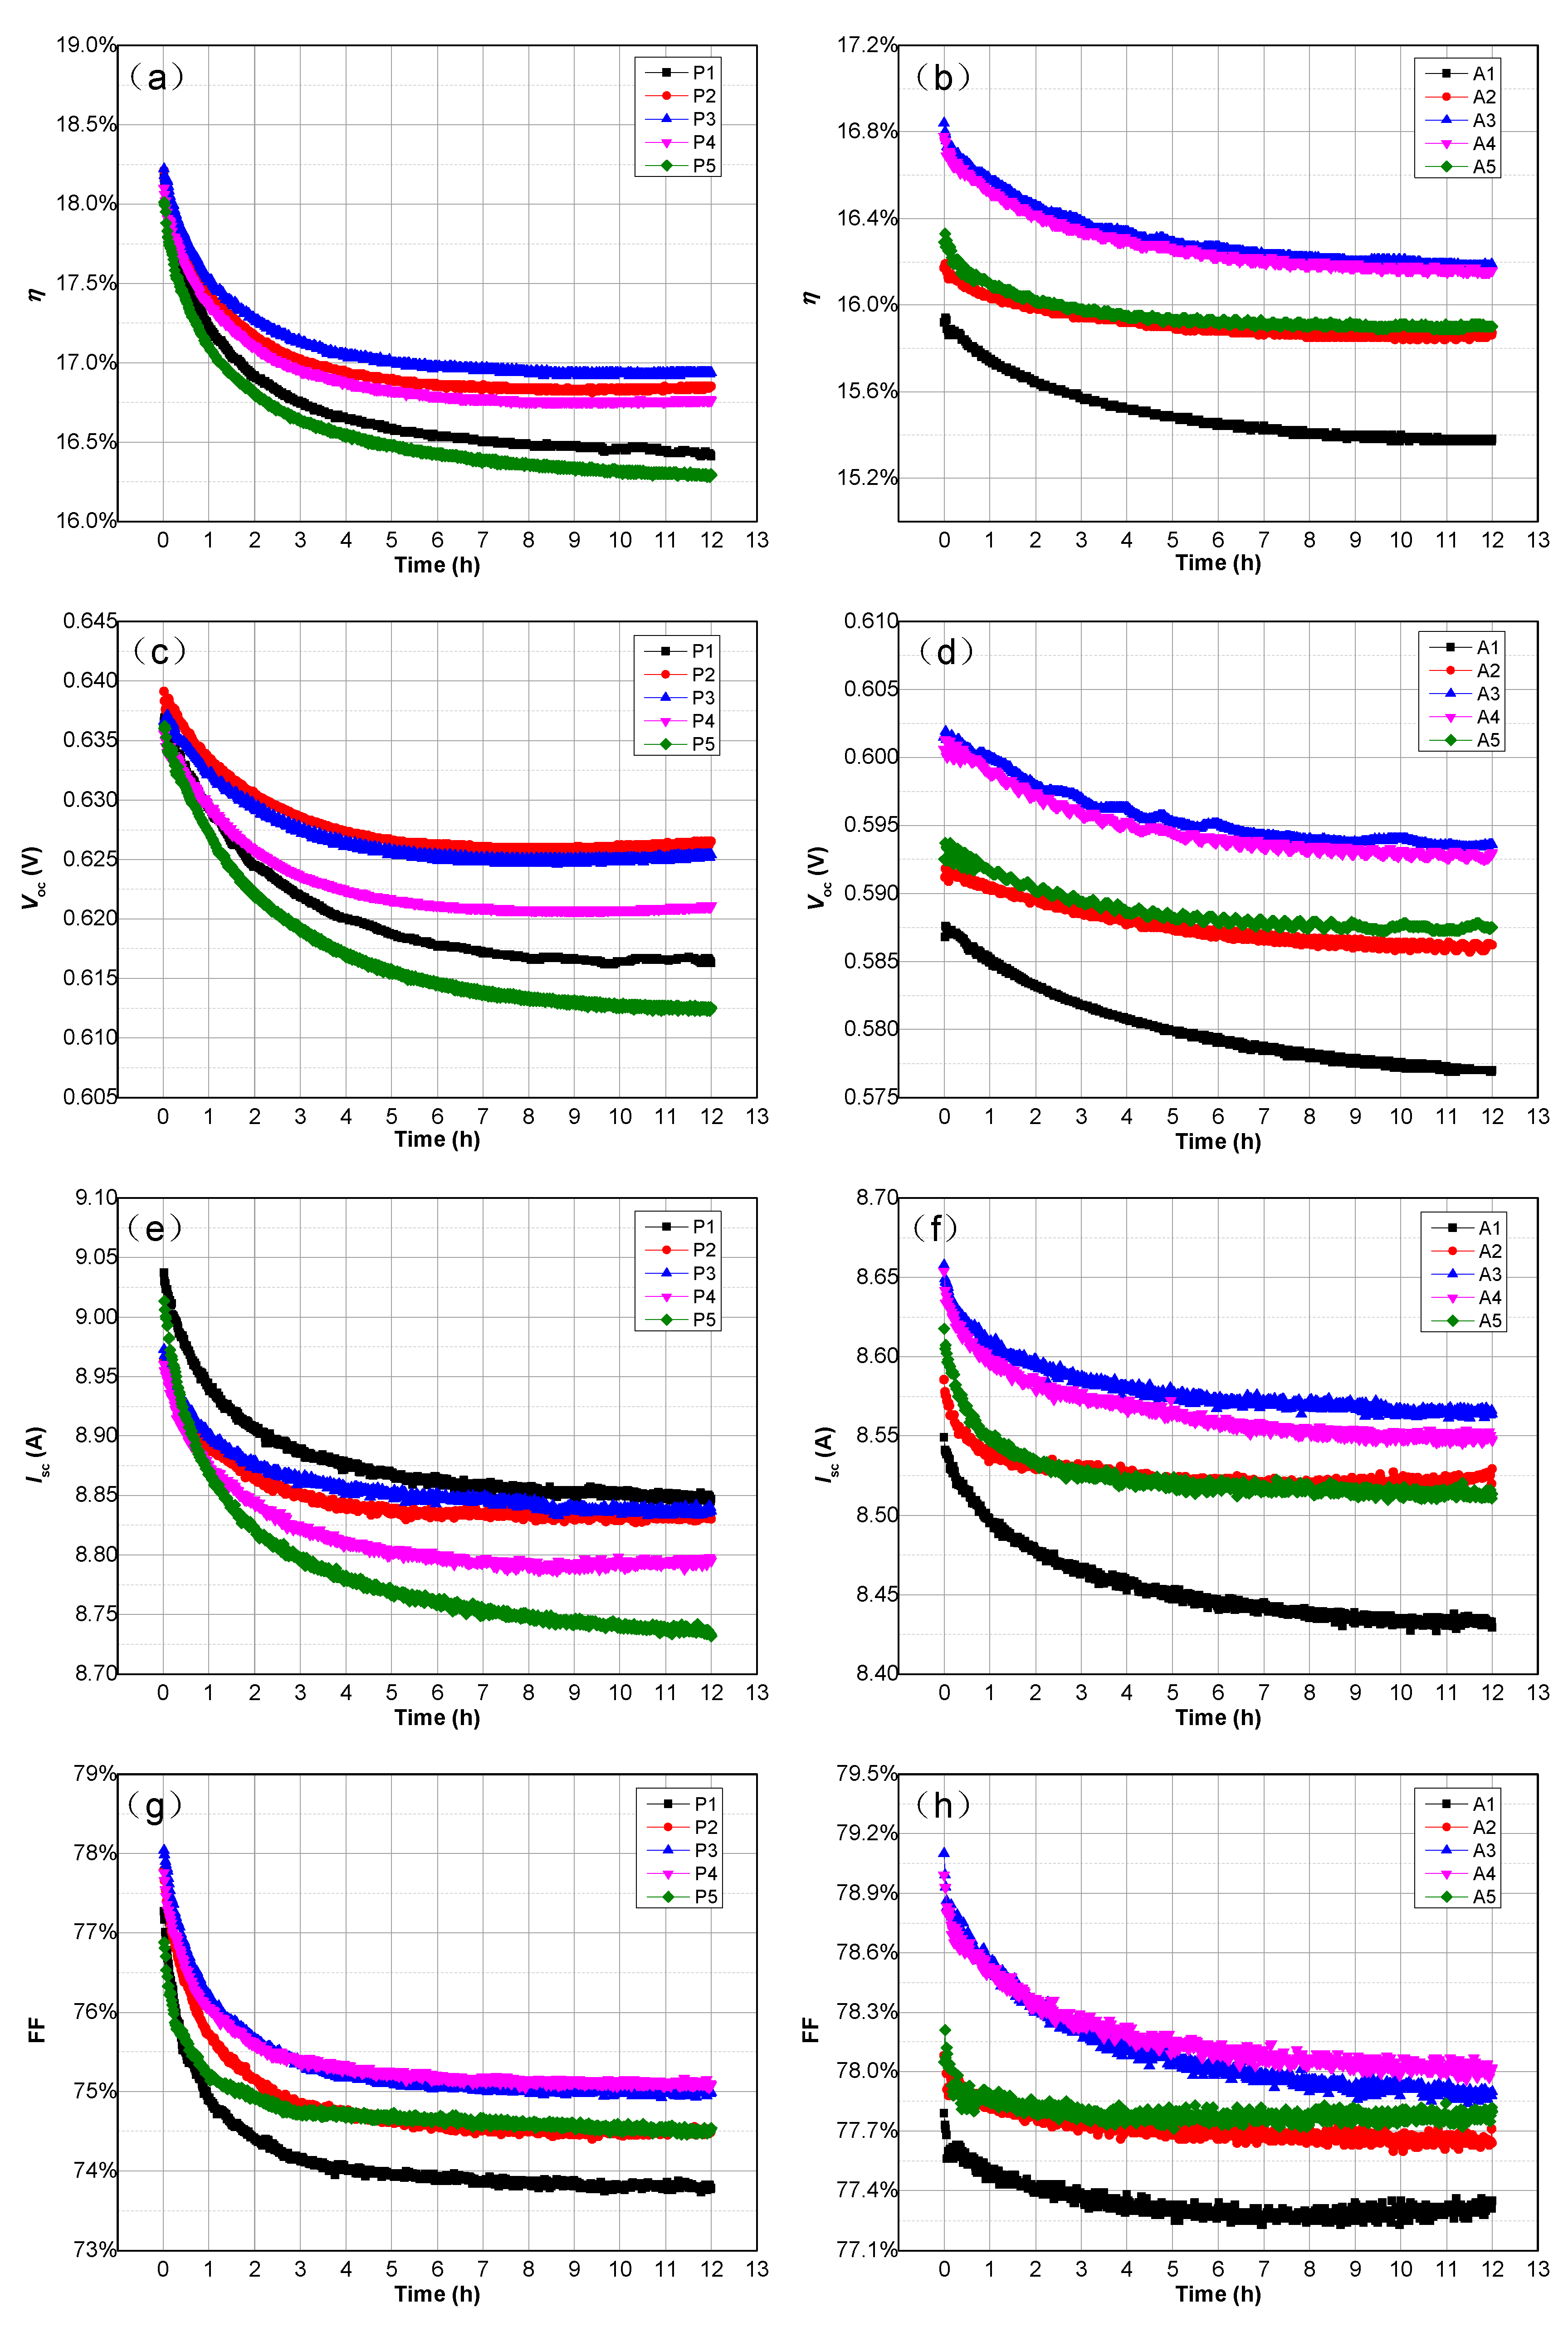
Isc) and filling factor (FF) of the five groups of PERC (left column) and Al-BSF cells (right column) with process time during the first LID (1 sun, 45 °C, 12 h). It can be seen from Figure 1 that the η, Voc, Isc and FF of both cells all decay exponentially with time, with the decay amplitudes of the PERC cells larger than those of the Al-BSF cells. For both cells, the middle samples (P3, A3) generally have the highest η, Voc, Isc and FF, while the head or tail samples (P5, A1) have the worst performance. Specifically, P5 has the lowest η, Voc and Isc, and A1 has the lowest η, Voc, Isc and FF. In addition, we note that the η, Voc and Isc of the PERC cells are higher than those of the Al-BSF cells, but the FF is lower than that of Al-BSF cells.
The exponential decay of the four I-V characteristic parameters of both cells with time can be explained by degradation of bulk lifetime caused by generation of the degraded state B-O defects. The major reasons are as follows: (1) The LID of boron-doped Cz-Si solar cells is dominated by BO-LID, which has been confirmed by a large number of experiments [1,2,3,6,7,8]; (2) oxygen and boron contents are much higher than concentrations of transition metal impurities in as-used Cz-Si wafers (see Table 1), and the difference in concentration would be even larger after cell fabrication; (3) the LID curves of four I-V characteristic parameters of both kinds of cells follow the feature of BO-LID [16,17]; that is to say, all four I-V characteristic parameters decay exponentially with time. For a more detailed explanation, please refer to the literature [16,17]. The larger decay amplitudes of PERC cells in the four I-V characteristic parameters can be elucidated by higher sensitivity of the performance to the degradation of bulk lifetime and higher minority carrier injection level caused by better back surface passivation [11]. In addition, the better back surface passivation also results in the higher η, Voc and Isc of PERC cells, while the lower FF of PERC cells results from the larger series resistance (Rs) brought by the local back contact. The best performance of the middle samples (P3, A3) may be related to the moderate boron and oxygen contents and lower defect concentration of as-used silicon wafers, while the worst performance of P5 and A1 may be associated with the highest boron and transition metal impurity contents and highest oxygen content, respectively. The moderate performance of A5 vs. the worst performance of P5 indicates the role of the aluminum gettering step (i.e., sintering for forming Al back surface field) contained in the Al-BSF cell process in reducing transition metal impurities in the bulk region. This result is in good agreement with the literature [21,22], which reported that the aluminum gettering can remove transition metal impurities to a certain extent, and literature [23] which demonstrated that local back contact structure of a PERC cell limits the action of the aluminum gettering in removing transition metal impurities.
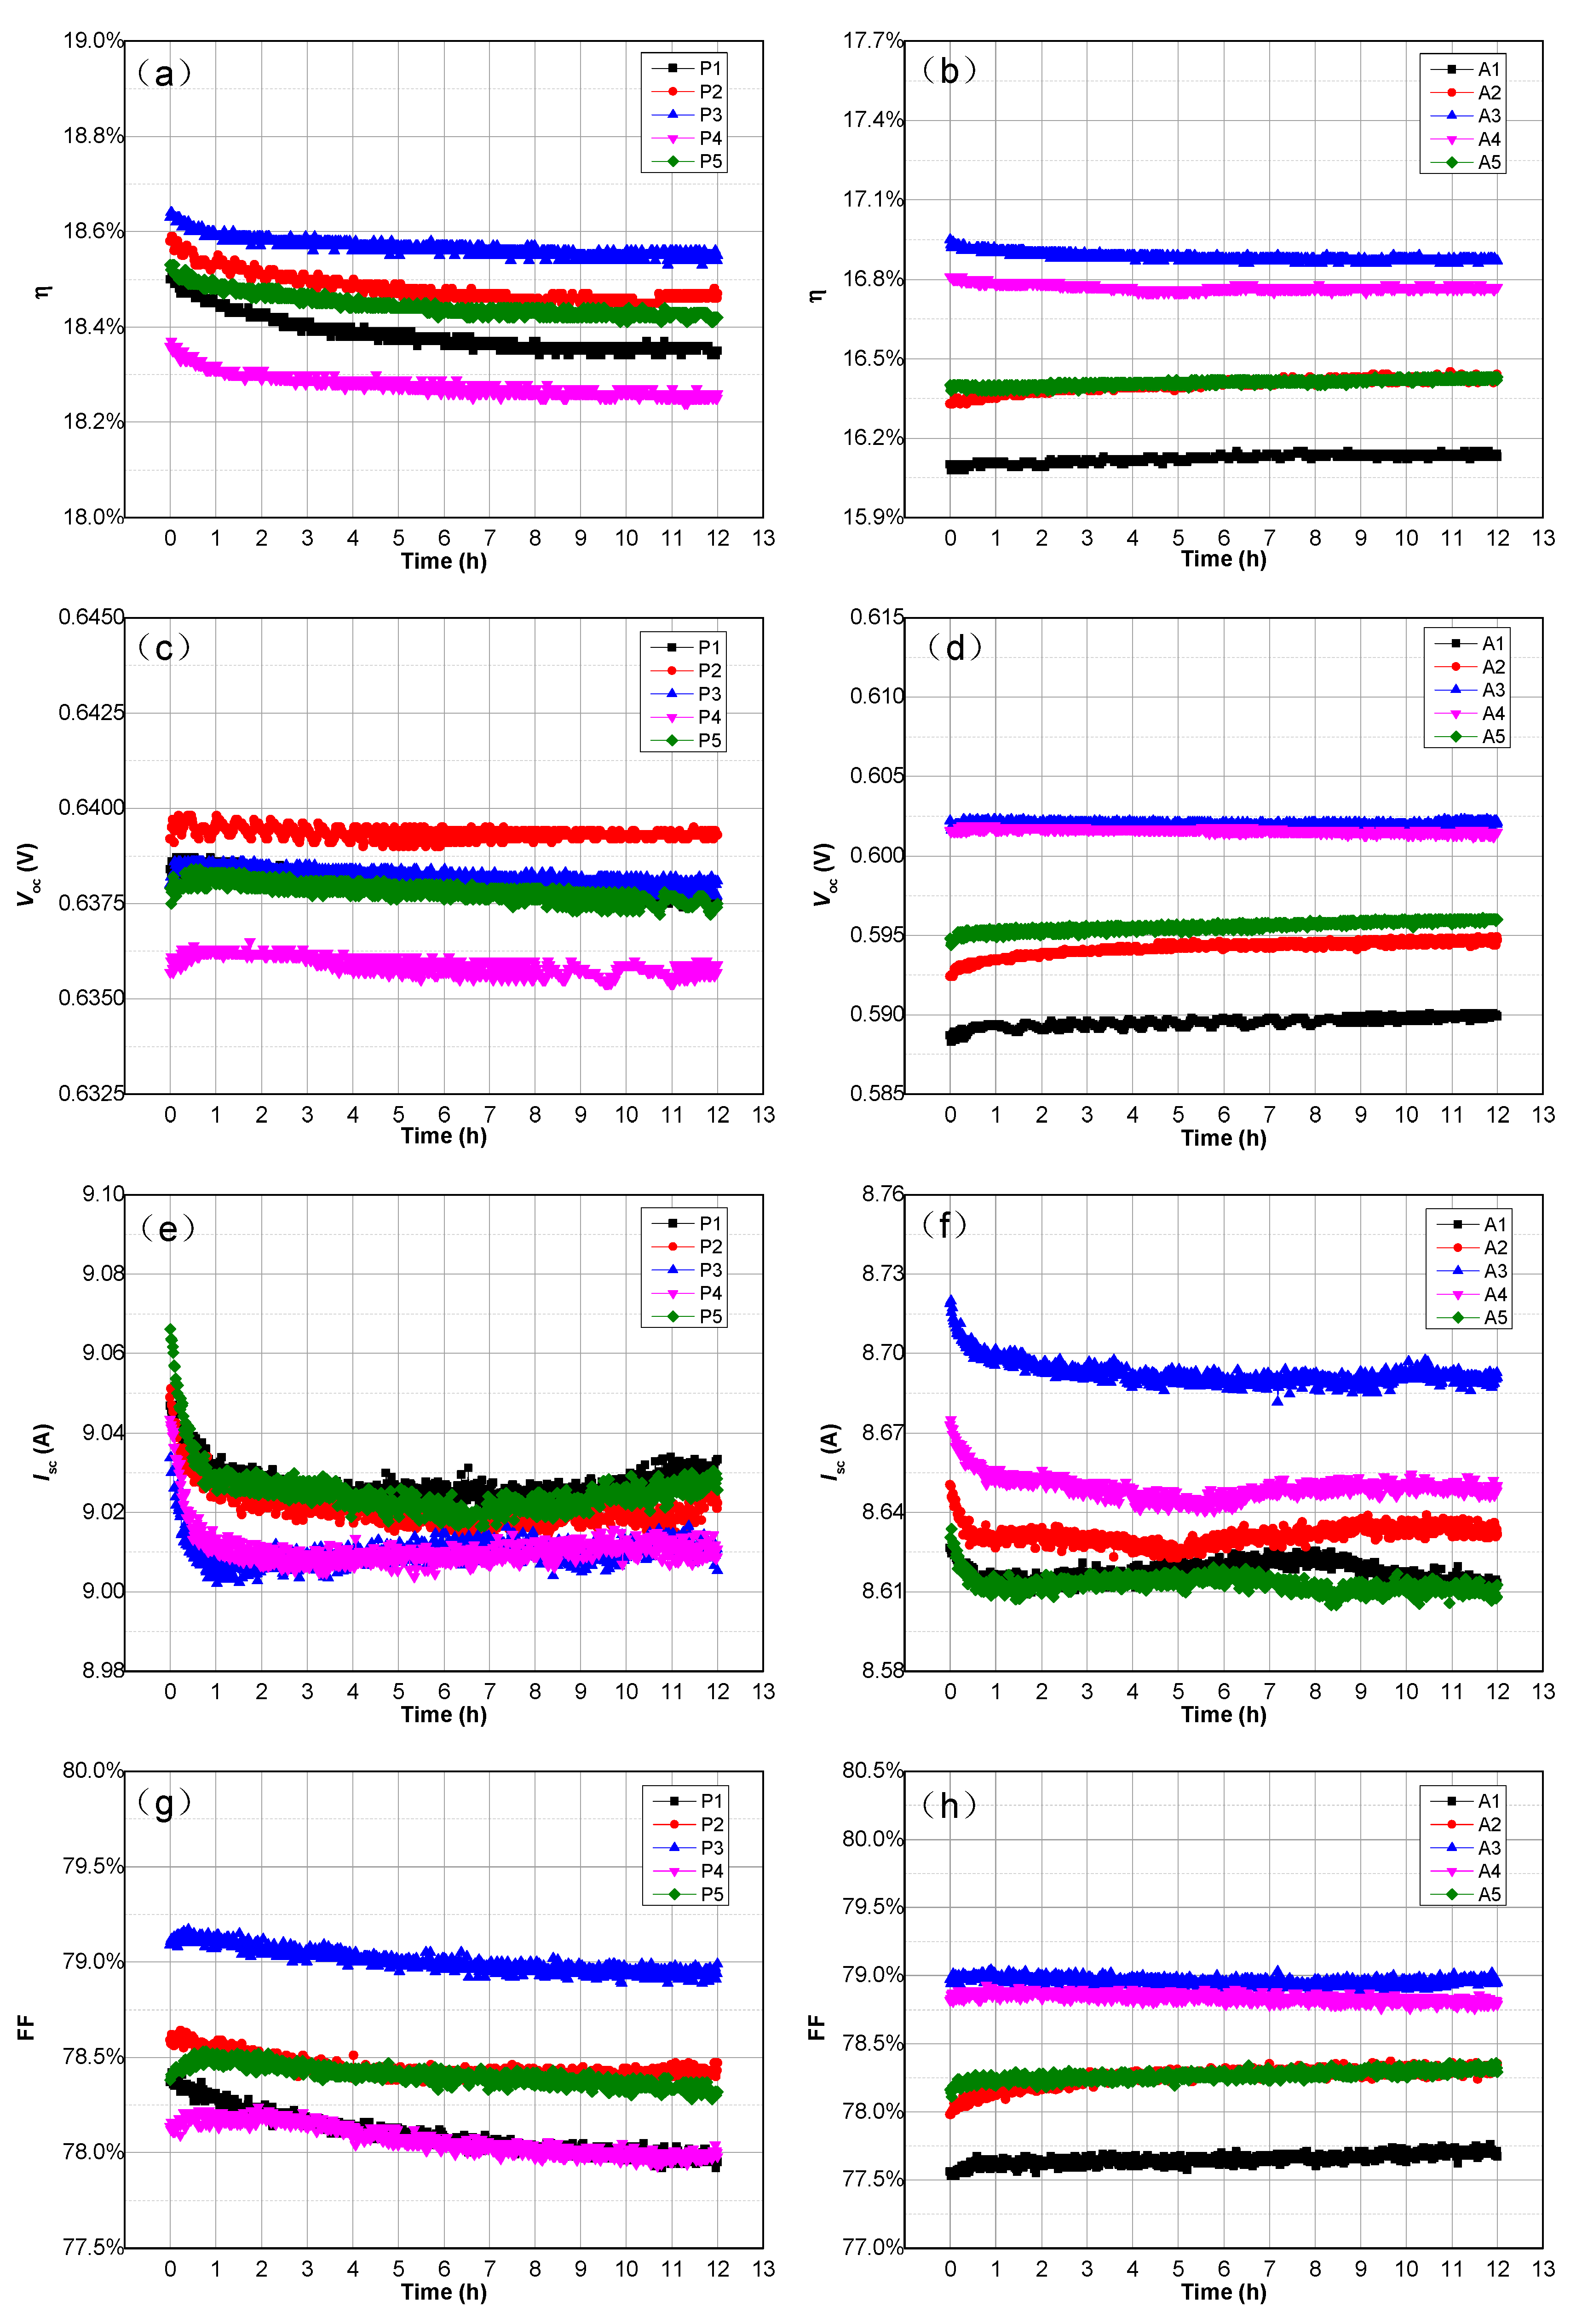
Figure 2 presents the in situ changes of the η, Voc, Isc and FF of five groups of PERC (left column) and Al-BSF cells (right column) with time during the second LID (1 sun, 45 °C, 12 h). It can be seen from Figure 2 that both cells show remarkable decrease in Isc at the early stage (or in the first hour) of the second LID and then tend to be stable. PERC cells have larger decay amplitude in Isc, which can be attributed to the better back surface passivation of the cells [11]. In contrast, in the first hour of the second LID, the Voc and FF of both cells show different changes; specifically speaking, they either increase slightly (Voc and FF of P4-P5, Voc and FF of A1-A2), or remain unchanged (Voc of P1-P3, FF of P3, Voc and FF of A3-A5,) or decrease slightly (FF of P1-P2). The different change tendency between the Isc and Voc of both cells at the early stage of the second LID can be explained by the dissociation of Fe-B pairs, which has been given a detailed demonstration in the literature [16,17]. Here, we just give a brief explanation on why the second LID is solely caused by dissociation of Fe-B pairs: (1) After regeneration, almost all of the B-O defects were converted into the regeneration state. B-O defects in regeneration state are stable under the condition of the second LID, and would not induce LID; (2) the changes of the four I-V characteristic parameters of the cells at the initial stage of the second LID conform with the feature of dissociation of Fe-B pairs [6,24], that is, Isc decays, while Voc either increases or remains unchanged or decreases; (3) the as-used silicon wafers have higher Fe content which is one order of magnitude higher than Cu and Ni contents, and the cell fabrication processes cannot remove Fe impurities completely. In contrast, Cu and Ni impurities with higher solubilities and larger diffusion coefficients in silicon can be effectively removed by phosphorus diffusion gettering (PDG) [16,17,25]; (4) if Fe-related LID, BO-LID, LeTID (light- and elevated temperature-induced degradation) and surface-related degradation co-exist in a Cz-Si solar cell, the Fe-related LID occurs first [26]; (5) before the second LID treatment, the solar cell was subjected to an LBIC scan in a dark box for at least 1.5 h, and Fe-B pairs were formed during this process. In fact, an LBIC scan was also performed before the first LID, thus the dissociation of Fe-B pairs was also involved in the first LID.
After the first hour of the treatment, the η, Voc and FF of Al-BSF cells and Voc of PERC cells basically remain stable; however, the η and FF of PERC cells show a slow and slight decay, which might be caused by passivation degradation of the back passivation layer (AlOx/SiNx:H) [27]. Similar to the situation of the first LID, the middle samples have the best performance, while the head or tail samples have the worst performance. Specifically, P3 has the highest η and FF, and A3 has the largest η, Voc, Isc and FF, whereas P4 and A1 have the lowest η, Voc, Isc and FF. The reason for this phenomenon is closely associated with the impurity contents of the as-used silicon wafers. Notably, the FF values of PERC cells were improved to approach those of Al-BSF cells by electrical injection regeneration, and maintained during the second LID. This result implies that the electrical injection regeneration has thermal annealing effect which can improve the contact resistance thus FF of PERC cells.
Table 2 shows the relative decay extent and decay rate of Voc during the first LID and those of Isc during the second LID for five groups of PERC and Al-BSF cells. Herein, the relative decay extent was calculated by dividing the increment by the initial value, while the decay rate (Rdeg) was obtained by fitting a LID curve (i.e., Voc-t or Isc-t curve) with the exponential decay function ( y t = y 0 + A · e x p R d e g · t ). Since no apparent decay occurred in Voc during the second LID, only a part of a decay curve of Isc that follows the exponential decay law (i.e., the first 4 h of data of PERC cells and the first 2 h of data of Al-BSF cells) was fitted. As shown in Table 2, during the first LID, both the relative decay extents and decay rates of Voc of PERC cells were larger than those of Al-BSF cells, which can be attributed to the better back surface passivation of PERC cells. In addition, P3 shows the least relative decay extent in Voc, while A1 has the largest relative decay extent in Voc. During the second LID, the relative decay extents of Isc of PERC cells were larger than those of Al-BSF cells. More importantly, the relative decay extents of Isc of both cells increased from head to tail, showing a positive correlation with iron and boron contents, which supports our judgement that the decays of Isc of both cells at the early stage of the second LID are caused by the dissociation of Fe-B pairs.
As far as absolute efficiency losses of both cells during the two LID treatments are concerned, it can be concluded from Figure 1 and Figure 2 that, through electrical injection regeneration, the efficiency losses of PERC and Al-BSF cells decrease from 1.28–1.76%absolute and 0.3–0.66%absolute during the first LID to 0.09–0.16%absolute and zero during the second LID, respectively. According to the fact that both LID treatments use the same condition, and the first LID is caused by co-action of BO-LID and dissociation of Fe-B pairs while the second LID is solely caused by dissociation of Fe-B pairs, we can estimate that BO-LID and dissociation of Fe-B pairs bring about efficiency losses of 1.19–1.62%absolute and 0.09–0.16%absolute to PERC cells during the first LID, respectively, which means that dissociation of Fe-B pairs contributes 5.81–9.56% of degradation to PERC cells during the first LID. In contrast, 0.3% to 0.66%absolute of efficiency losses of Al-BSF cells during the first LID are completely caused by BO-LID. Compared with the Al-BSF cell process, the gettering efficiency of PERC cell process for transition metal impurities drops, which results from the local back contact structure [23]. Therefore, it is necessary to use Cz-Si wafers with low transition-metal-impurity content to fabricate PERC cells to reduce LID.
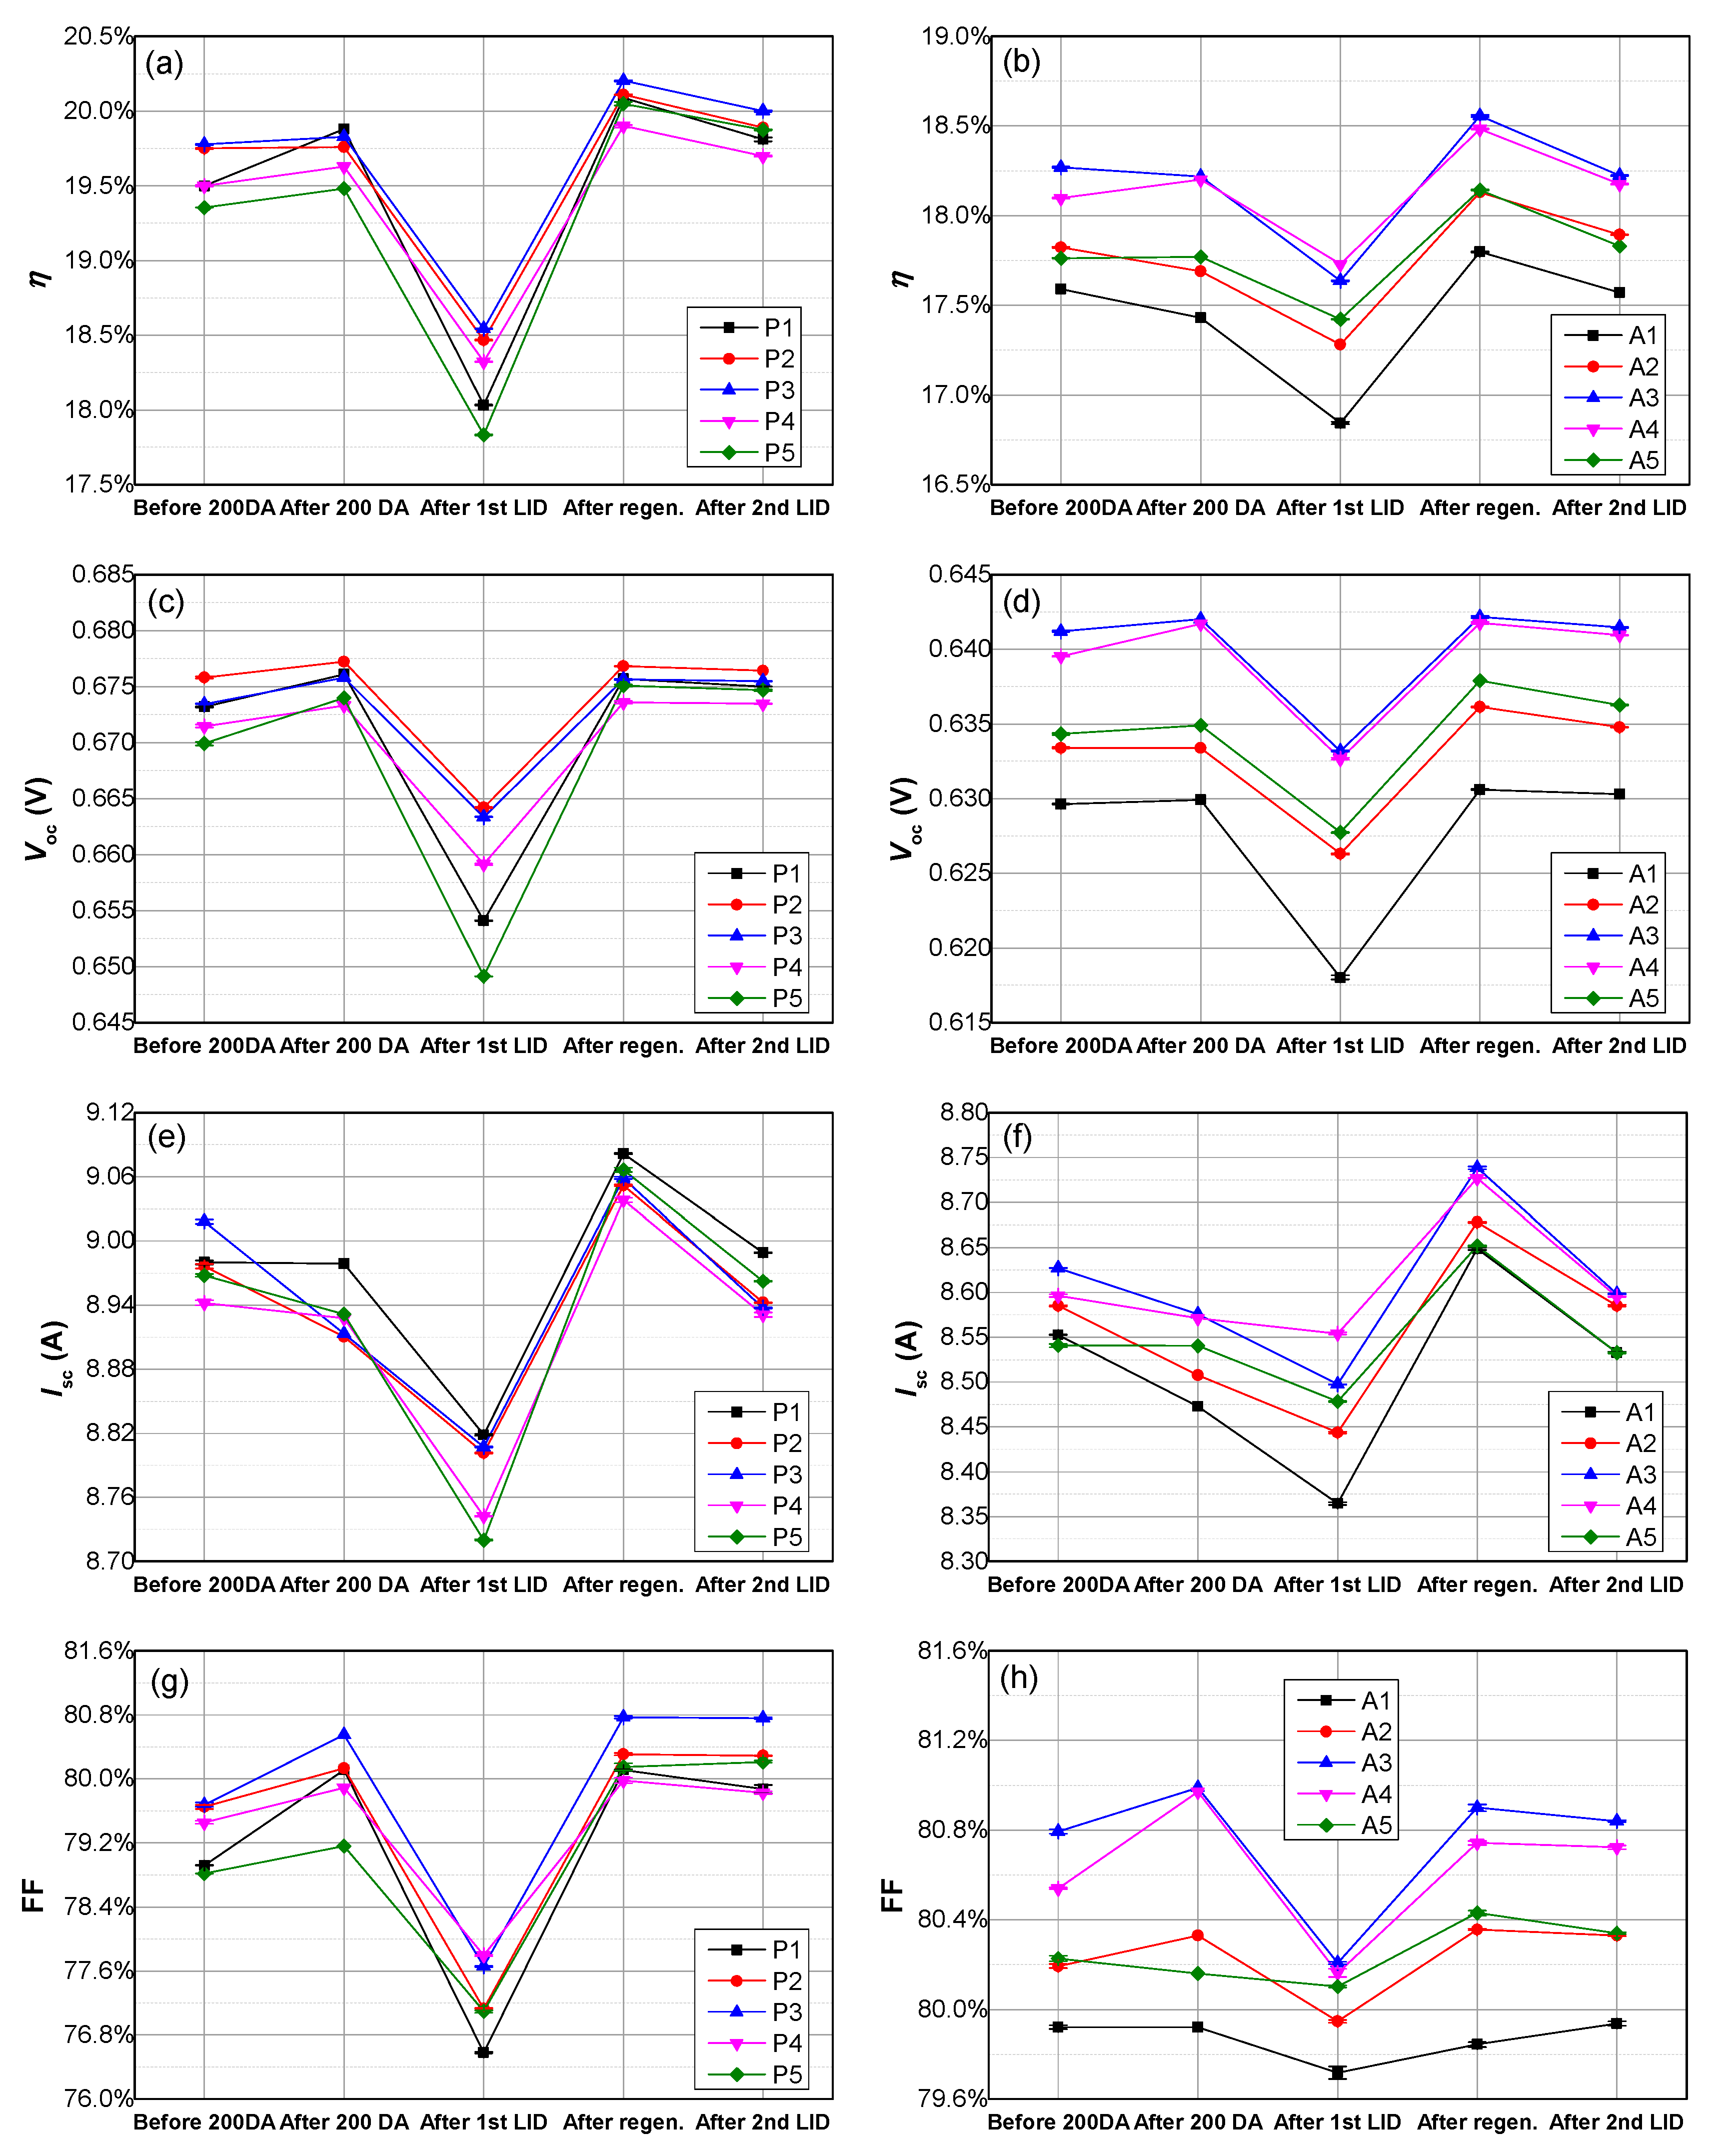
Figure 3 presents the changes of I-V characteristic parameters of five groups of PERC (left column) and Al-BSF cells (right column) measured at STC condition (AM1.5 spectra, 1 sun, 25 °C) with process steps. As shown in Figure 3, after dark annealing at 200 °C, Isc values of all the cells except P1 and A5 decrease, while the Voc and FF of both cells either increase or remain unchanged. The inconsistent changes between Isc and Voc might be caused by the co-action of annihilation of the degraded state B-O defects and the dissociation of Fe-B pairs. Moreover, a small increase in Voc after the dark annealing indicates that newly fabricated PERC and Al-BSF cells contain less degraded state B-O defects. In addition, the increase of FF after the dark annealing can be attributed to the improvement of the electrical contact of the cells. The η, Voc, Isc and FF of both cells show a large decay during the first LID and a significant rise during electrical injection regeneration, with the decay and rise amplitudes of PERC cells being larger than those of Al-BSF cells. This phenomenon can be elucidated by the LID and regeneration reaction of B-O defects and better back surface passivation of PERC cells [16,17,28]. Interestingly, we note that the Isc and η of both cells after the regeneration are higher than those after the 200 °C dark annealing, while the Voc values of both cells after the regeneration are comparable to those after the dark annealing. This result may imply that the electrical injection regeneration can passivate other crystal defects besides B-O defects. During the second LID, Voc and FF remained unchanged or decreased slightly, whereas the η and Isc of both cells decreased. The apparent decay of Isc and η combining with basically stable Voc during the second LID confirm the dominant role of the dissociation of Fe-B pairs at this stage [6,24]. Throughout the whole experiment, the middle samples (P3 and A3) possessed the highest η and FF, while A1 had the worst performance.
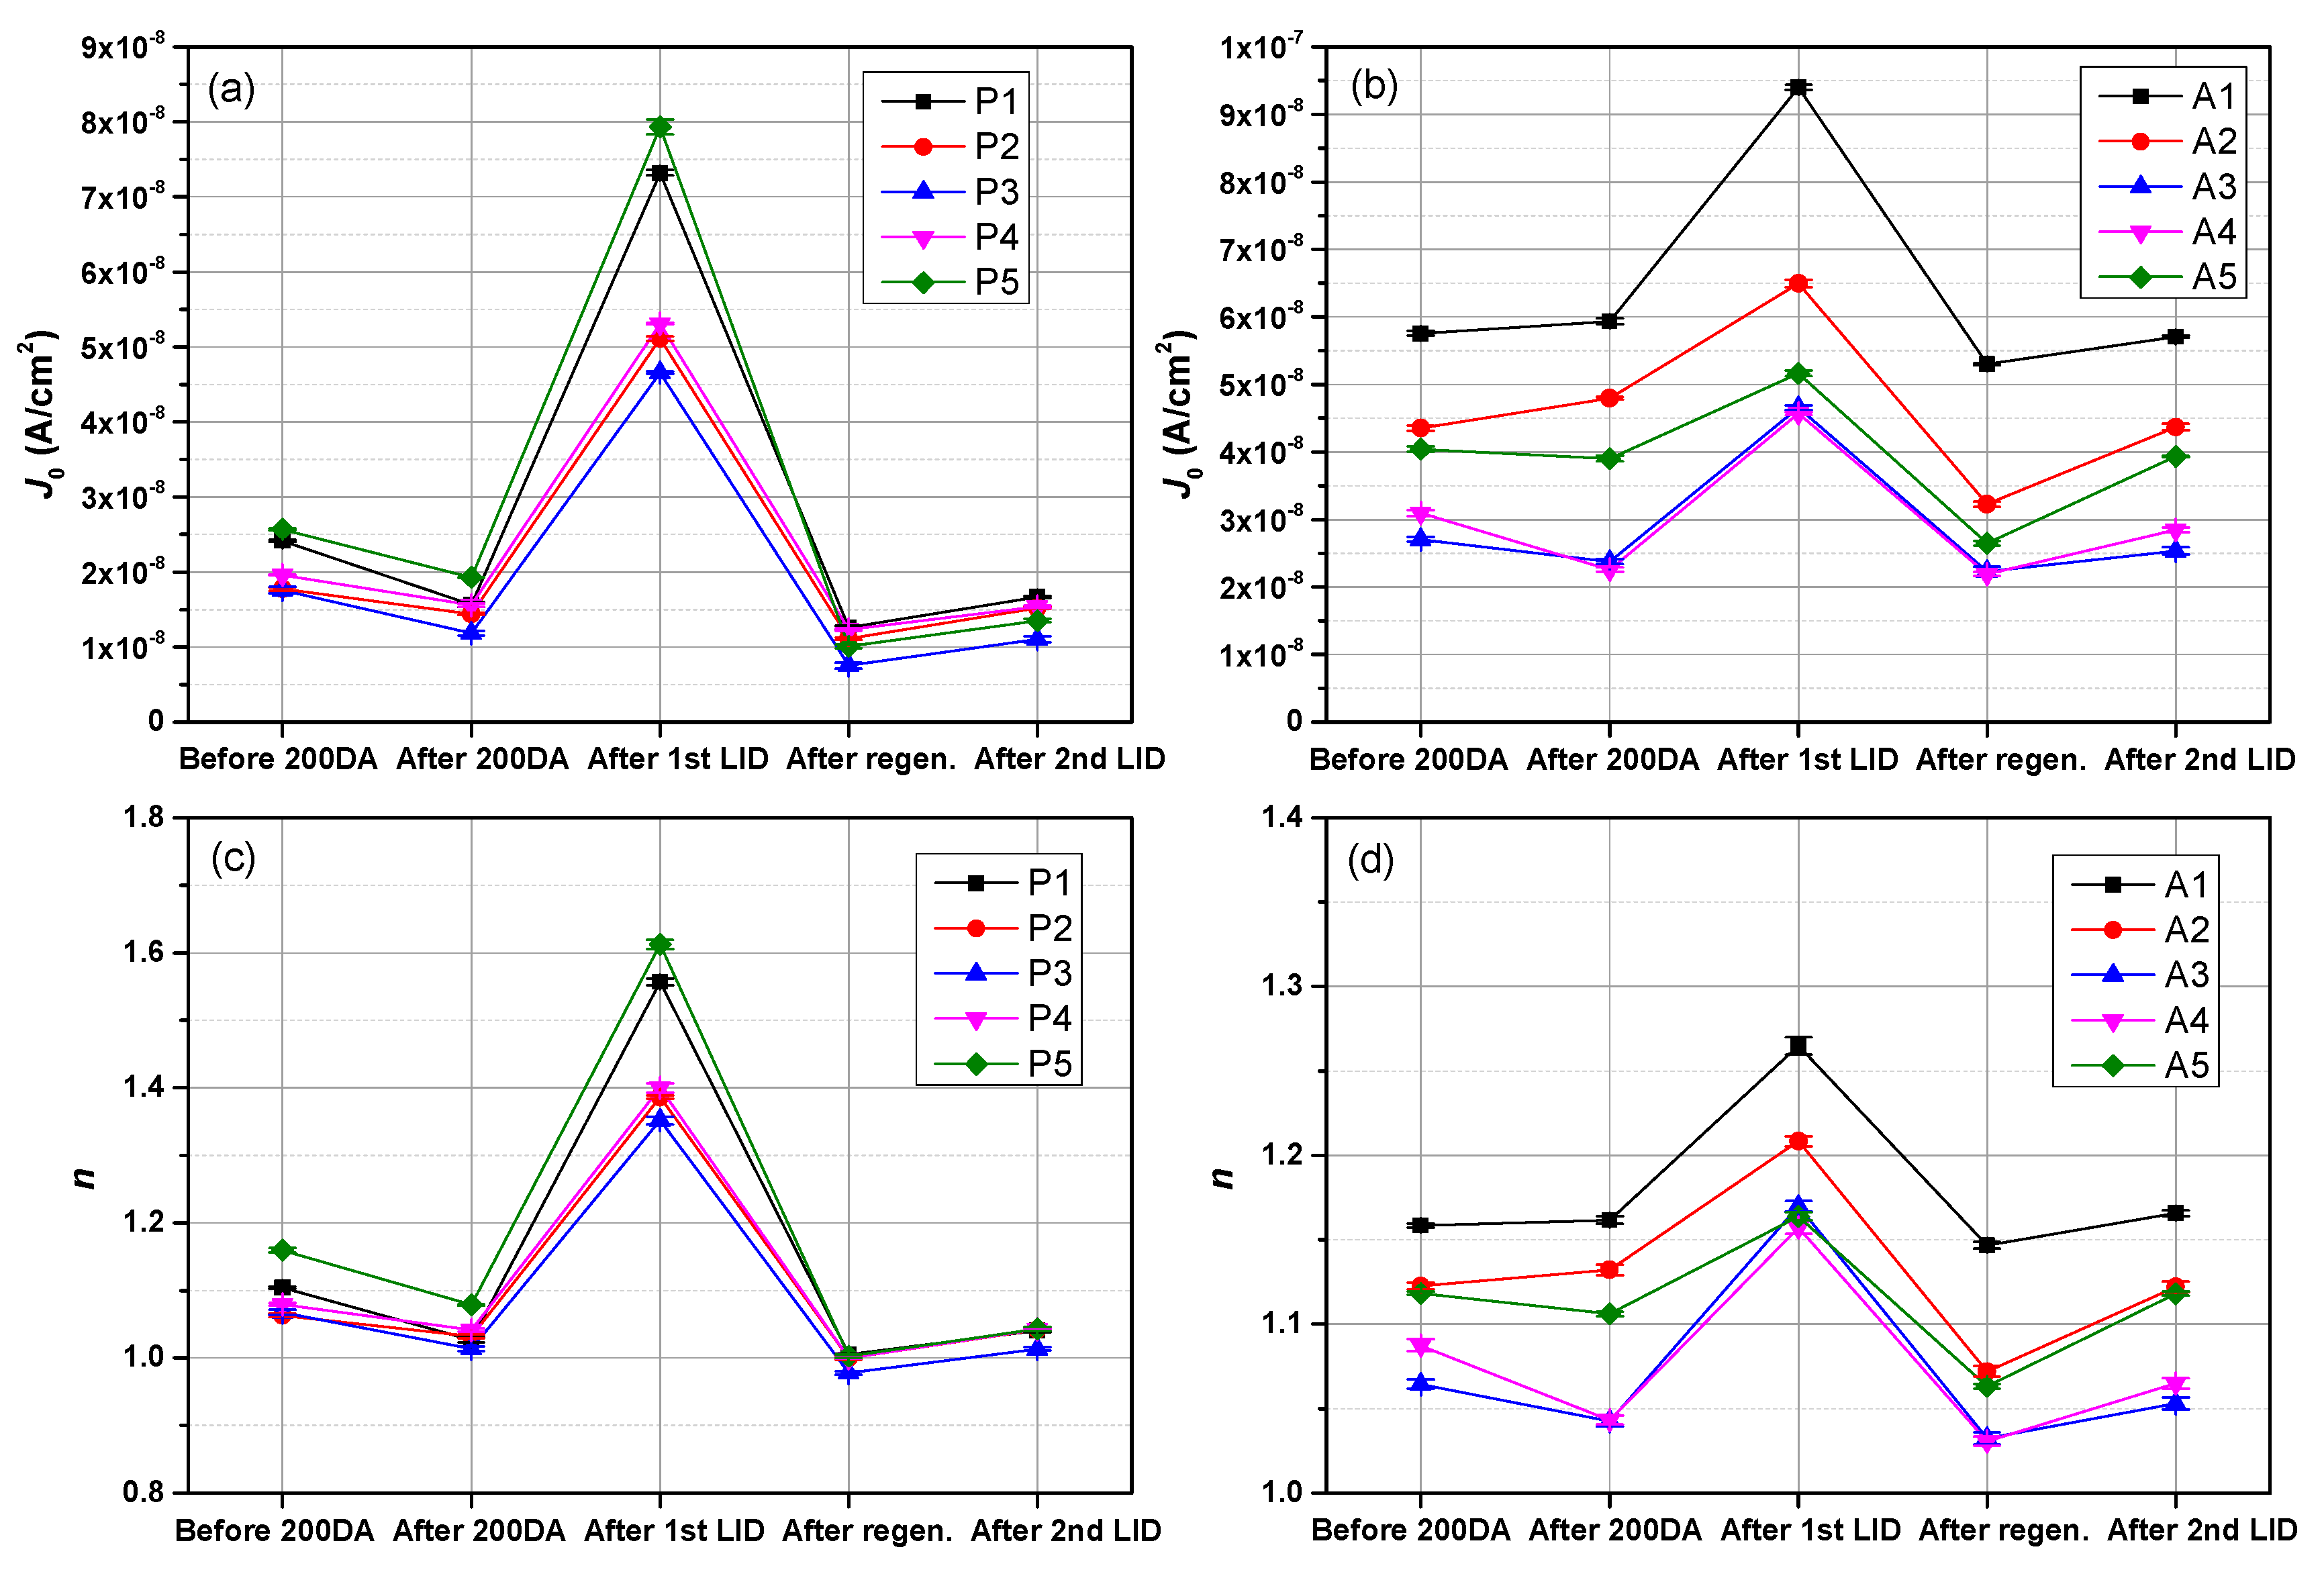
Figure 4 shows the changes of dark saturation current density (J0) and the diode ideality factor (n) of five groups of PERC (left column) and Al-BSF cells (right column) with process steps, which was obtained by Suns-Voc measurement at five time-nodes (before and after the 200 °C dark annealing, after the first LID, after the regeneration and after the second LID). As shown in Figure 4, for each cell, both J0 and n show the same change tendency with process steps. Specifically, the J0 and n of all the cells except A1 and A2 decrease slightly after the 200 °C dark annealing, whereas J0 and n of all the cells increase markedly after the first LID, decrease remarkably after the regeneration, and increase moderately after the second LID. Furthermore, the changes of J0 of PERC cells exhibit better consistency with the change of recombination caused by transition of B-O defects. During the first LID and regeneration, P5 and A1 have the largest J0 as well as the largest decay and rise amplitudes, which is in good agreement with their worst performance, as well as the largest decay and rise amplitudes in η, Voc and Isc at the same stages (see Figure 3). In addition, the remarkable increase and decrease of n during the first LID and regeneration indicate that the contribution from recombination in the space charge region increases and decreases significantly during the same phases.
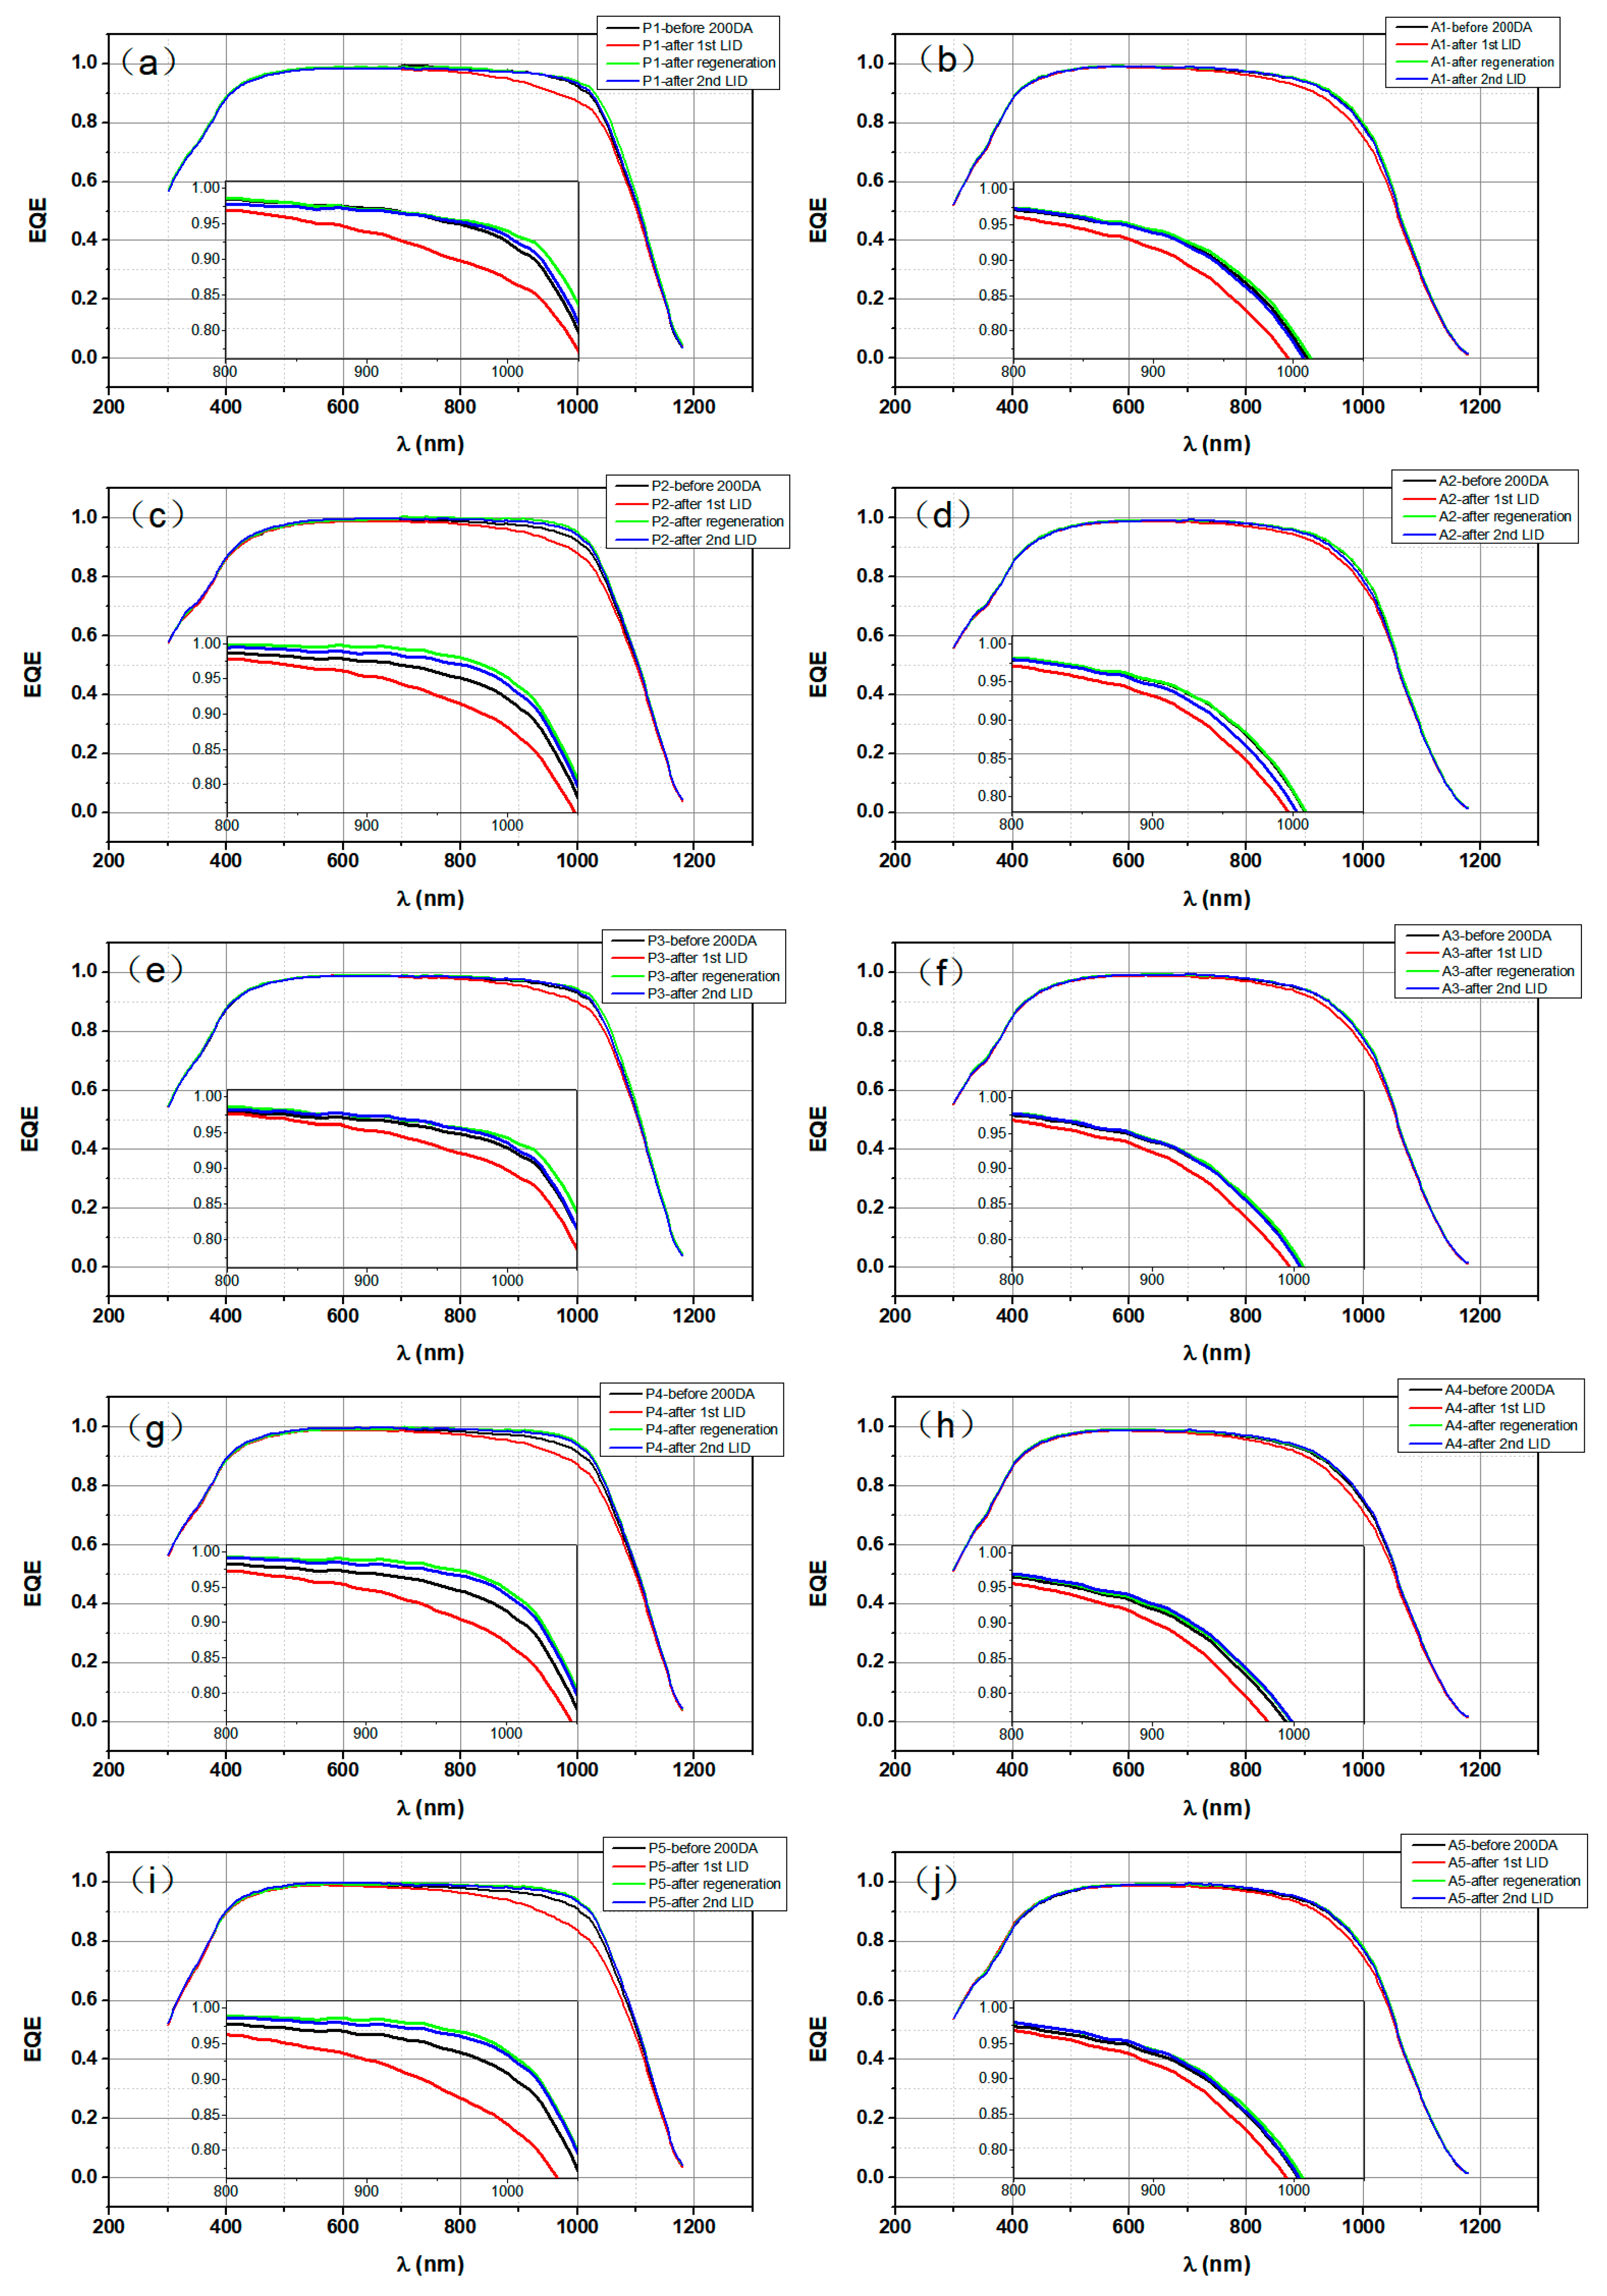
Figure 5 presents the external quantum efficiency (EQE) curves of PERC and Al-BSF cells in 300–1200 nm measured at four time-nodes (before dark annealing, after the first LID, after the regeneration, and after the second LID). The inset is a partial enlarged diagram in 800–1050 nm. It should be noted that all the EQE measurements were performed after the cells being stored in dark for more than 48 h so that Fe ions mainly stayed in the form of Fe-B pairs before each measurement. Furthermore, the EQE measurement could not trigger the dissociation of Fe-B pairs. Therefore, the changes of spectral response of the cells with the process steps were solely caused by transition of B-O defects. As shown in Figure 5, the LID and regeneration treatments only affected the spectral response in the wavelength larger than 700 nm for both cells, which indicates that the B-O defects responsible for the change of spectral response are a bulk defect. For the detailed reasons, please see the literature [17]. The drop and rise of spectral response during the first LID and electrical injection regeneration for both cells can be attributed to the generation and passivation of degraded state B-O defects, respectively. The larger drop and rise amplitudes of the spectral response of PERC cells result from the better back surface passivation. After the second LID, the spectral responses of both cells remain unchanged or decrease slightly, implying that the regenerated cells are basically stable under the condition of the second LID. During the first LID and regeneration, the drop and rise amplitudes of P5 and A1 were largest, while those of P3, A3 and A5 were smallest, which are in good agreement with the above I-V characteristic measurement results.
To sum up, the exponential decays of the four I-V characteristic parameters of both cells during the first LID were mainly caused by the generation of the degraded state B-O defects, while the changes of I-V characteristic parameters of both cells in the first hour of the second LID resulted from the dissociation of Fe-B pairs. After the first hour of the treatment, four I-V characteristic parameters of Al-BSF cells and Voc of PERC cells tended to be stable, which indicates that the regenerated state B-O defects are stable under the condition of the second LID. In contrast, the η and Isc of PERC cells show a slow and slight decay, which can be attributed to passivation degradation of the back passivation layer. Due to better back surface passivation, PERC cells not only show the larger decay and rise amplitudes in the four I-V characteristic parameters during the first LID and regeneration, but also exhibit better consistency with the change of recombination caused by transition of B-O defects. Through electrical injection regeneration, the efficiency losses of both cells were further reduced. The middle samples (P3 and A3) have the highest η and Voc, and the least decay and rise amplitudes during the first LID and regeneration, which is associated with moderate B and O contents of the as-used silicon wafers. The tail sample (P5) has the least η, Voc and Isc, and largest decay and rise amplitudes, which is related to the highest B and transition metal impurity contents. The head sample (A1) has least four I-V characteristic parameters, and largest decay and rise amplitudes in η, Voc and Isc, which is relevant to the highest oxygen content. Furthermore, both Suns-Voc and EQE measurement results show good accordance with the I-V characteristic measurement results.
Finally, we would like to compare the experimental results of this paper with those of our two published papers ([16,17]). Before making a comparison between these works, it is necessary to point out the positions of the as-used silicon wafers in the Cz-Si ingot. It should be noted that 4745 pieces of 180 μm thick 156.75 mm × 156.75 mm pseudo-square silicon wafers were cut from a whole solar-grade Cz-Si ingot from company A. Then, the silicon wafers were numbered and marked with S0001, S0002, …, S4745 in order from head to tail of the ingot by using a laser marking machine. Therefore, the number of a silicon wafer can indicate the position of the silicon wafer in the ingot. The numbers of silicon wafers used for PERC cell fabrication in the literature [16] are S0635-0637, S1263-1265, S3461-3463, S4089-4091 and S4560-4562, while the numbers of silicon wafers used for Al-BSF cell fabrication in the literature [17] are S0629-S0631, S1257-S1259, S3455-S3457, S4083-S4085, and S4554-S4556. In other words, the five groups of silicon wafers used in [16,17] come from approximately the same five positions of the Cz-Si ingot, thus they have the same impurity contents (see [16,17]). In this paper, the silicon wafers used to prepare PERC and Al-BSF cells are from another five positions of the same Cz-Si ingot. The numbers of silicon wafers used to fabricate PERC cells are S0050-0052, S1002-1004, S1931-1933, S2876-2878, and S3815-3817, whereas the numbers of silicon wafers used to prepare Al-BSF cells are S0044-S0046, S0996-S0998, S1925-S1927, S2870-S2872, and S3809-S3811. Therefore, the impurity contents of as-used silicon wafers given by this paper are different from those presented by [16,17].
According to the results of [16,17], for the PERC cells, P3 (S3461-3463) has the best performance, while P4 (S4089-4091) possesses the lower performance. For Al-BSF cells, A3 (S3455-S3457) has the best performance, whereas A5 (S4554-S4556) possesses the worst performance. According to the results of this work, the middle samples P3 (S1931-1933) and A3 (S1925-S1927) have the best performance during the entire experiment process. For Al-BSF cells, A1 (S0044-S0046) has the worst performance throughout the whole experiment process. For PERC cells, P5 (S3815-3817) has the worst performance during the first LID, and P4 (S2876-2878) possesses the worst performance during the second LID. To sum up the above results, cells prepared by the silicon wafers from middle of the ingot (S1925-3463), whether PERC cells or Al-BSF cells, usually have the best performance. Al-BSF cells prepared by silicon wafers from the head or tail of the ingot, i.e., A1 (S0044-S0046) or A5 (S4554-S4556), have the worst performance, while PERC cells prepared by silicon wafers near the tail of the ingot, i.e., P4 (S4089-4091) in [16] and P5 (S3815-3817) in this paper, possess lower performance. It should be mentioned that although P4 (S2876-2878) in this paper was made from the silicon wafer from the middle of the ingot, it had the worst performance during the 2nd LID. We think this is an individual case or belongs to a normal fluctuation of data, which does not affect the overall trend. Therefore, generally speaking, the results given by this paper are not in contradiction with the results reported by [16,17]. All these results show that, whether they are PERC or Al-BSF cells, the cells made from the silicon wafers from middle of the ingot have the best performance, while the cells made from the silicon wafers from head or tail of the ingot possess poor performance. In addition, all these works have another shared conclusion, i.e., the first LIDs of both kinds of cells are caused by the co-action of BO-LID and dissociation of Fe-B pairs, while the second LIDs are solely induced by the dissociation of Fe-B pairs. We think that these common conclusions may result from the fact that all these works use silicon wafers from the same Cz-Si ingot and adopted a similar process to fabricate the same type of cells.
The literature [16,17] reported our research results on the in situ LID and in situ light injection regeneration of PERC cells and those of Al-BSF cells prepared from silicon wafers from different positions of a Cz-Si ingot, respectively. In contrast, this paper compares the in situ LID and electrical injection regeneration of PERC and Al-BSF cells prepared from silicon wafers from different positions of the same Cz-Si ingot. This is the biggest difference between this work and our two previous works. Furthermore, this work and our two previous works used different experimental processes and conditions. In [16,17], the cells were subjected to the 1st LID (45 °C, 1 sun, 12 h), a light injection regeneration (100 °C, 1 sun, 24 h) and the 2nd LID (45 °C, 1 sun, 12 h) in turn. However, in this paper, the cells underwent a dark annealing (200 °C, 30 min), the 1st LID (45 °C, 1 sun, 12 h), an electrical injection regeneration (175 °C, 18 A, 30 min) and the 2nd LID (45 °C, 1 sun, 12 h) in order. Even though all these works used similar processes to fabricate the same type of cells, there exist slight differences in specific cell fabrication processes. Specifically, the PERC cells in [16] and Al-BSF cells in [17] were prepared by company B and company C, respectively. However, both PERC and Al-BSF cells in this paper were fabricated by company C, with fabrication time being approximately one year later than those given by the literature [16,17]. Finally, compared with the literature [16,17], this paper gives more new conclusions about the difference in the LID and electrical injection regeneration of industrial PERC and Al-BSF cells prepared from silicon wafers from different positions of a Cz-Si ingot, and the effects of electrical injection regeneration on the performances of two kinds of cells.

4. Conclusions

This paper compares the changes of performance of PERC and Al-BSF cells made from silicon wafers from different positions of a Cz-Si ingot during the dark annealing (200 °C, 30 min), the first LID (45 °C, 1 sun, 12 h), the electrical injection regeneration (175 °C, 18 A, 30 min) and the second LID (45 °C, 1 sun, 12 h). The results show that: (1) Due to the better back surface passivation, PERC cells show larger decay and rise amplitude in I-V characteristic parameters during the LID and regeneration. (2) After the electrical injection regeneration, the efficiency losses of PERC cells decrease from 1.28–1.76%absolute in the first LID to 0.09–0.16%absolute in the second LID, while those of Al-BSF cells decrease from 0.3–0.66%absolute in the first LID to 0 in the second LID. (3) The first LID is caused by the co-action of BO-LID and dissociation of Fe-B pairs, whereas the second LID is solely induced by the dissociation of Fe-B pairs. Since the two LID treatments use the same conditions, it can be inferred that dissociation of Fe-B pairs contributes 5.81–9.56% of efficiency loss to PERC cells during the first LID, while efficiency loss of Al-BSF cells during the first LID is almost completely caused by BO-LID. This result implies that the Al gettering step (i.e., sintering for forming Al back surface field) contained in Al-BSF cell process can effectively reduce Fe content in bulk region of the cell. Furthermore, the worst performance of P5 vs. the moderate performance of A5 provides a further proof for this judgement. (4) After the electrical injection regeneration, η and Isc of both kinds of cells are higher than those after 200 °C dark annealing, suggesting that the electrical injection regeneration can not only passivate B-O defects, but also passivate other defects. (5) FF values of PERC cells are lower than those of Al-BSF cells before the electrical injection regeneration. However, they increase to the values equivalent to those of Al-BSF cells after the electrical injection regeneration. This result suggests that the electrical injection regeneration has a thermal annealing effect which can improve the electrical contact, and thus FF of PERC cells. (6) Whether they are PERC or Al-BSF cells, the cells made from the silicon wafers from middle of the ingot have the best performance throughout the whole experiment. (7) The LID and regeneration treatments only affect the spectral response of both kinds of cells in the wavelength greater than 700 nm, indicating that the metastable defects responsible for the LID and regeneration of the cells are bulk defects, and no surface-related degradation is involved.

Author Contributions

Conceptualization, B.A.; methodology, B.A.; validation, S.D., C.Y. and C.Q.; formal analysis, S.D., C.Y., C.Q. and B.A.; investigation, S.D., C.Y. and C.Q.; resources, X.S., J.Y., Q.L. and X.L.; data, S.D., C.Y. and C.Q.; writing—original draft preparation, S.D. and C.Y.; writing—review and editing, S.D., C.Y. and B.A.; visualization, S.D.; supervision, B.A.; project administration, B.A.; funding acquisition, B.A. All authors have read and agreed to the published version of the manuscript.

Funding

This research was funded by the National Natural Science Foundation of China, grant number 61774171.

Institutional Review Board Statement

Not applicable.

Informed Consent Statement

Not applicable.

Data Availability Statement

The data used to support the findings of this study are included within the paper.

Conflicts of Interest

The authors declare no conflict of interest.

References

  1. Lindroos, J.; Savin, H. Review of light-induced degradation in crystalline silicon solar cells. Sol. Energy Mater. Sol. Cells 2016, 147, 115–126. [Google Scholar] [CrossRef]
  2. Niewelt, T.; Schön, J.; Warta, W.; Glunz, S.W.; Schubert, M.C. Degradation of Crystalline Silicon Due to Boron-Oxygen Defects. IEEE J. Photovolt. 2017, 7, 383–398. [Google Scholar] [CrossRef]
  3. Hallam, B.; Herguth, A.; Hamer, P.; Nampalli, N.; Wilking, S.; Abbott, M.; Wenham, S.; Hahn, G. Eliminating Light-Induced Degradation in Commercial p-Type Czochralski Silicon Solar Cells. Appl. Sci. 2018, 8, 10:1–10:19. [Google Scholar] [CrossRef] [Green Version]
  4. Yakimov, E.B. Metal Impurities and Gettering in Crystalline Silicon. In Handbook of Photovoltaic Silicon; Yang, D., Ed.; Springer Berlin Heidelberg: Berlin, Heidelberg, 2019; pp. 495–540. ISBN 978-3-662-56471-4. [Google Scholar]
  5. Lindroos, J.; Savin, H. Formation kinetics of copper-related light-induced degradation in crystalline silicon. J. Appl. Phys. 2014, 116, 234901:1–234901:5. [Google Scholar] [CrossRef] [Green Version]
  6. Schmidt, J.; Bothe, K.; MacDonald, D.; Adey, J.; Jones, R.; Palmer, D.W. Electronically stimulated degradation of silicon solar cells. J. Mater. Res. 2006, 21, 5–12. [Google Scholar] [CrossRef] [Green Version]
  7. Saitoh, T.; Hashigami, H.; Rein, S.; Glunz, S. Overview of light degradation research on crystalline silicon solar cells. Prog. Photovolt. 2000, 8, 537–547. [Google Scholar] [CrossRef]
  8. Schmidt, J. Light-induced degradation in crystalline silicon solar cells. Solid State Phenom. 2004, 95–96, 187–196. [Google Scholar] [CrossRef]
  9. Herguth, A.; Schubert, G.; Kaes, M.; Hahn, G. A new approach to prevent the negative impact of the metastable defect in boron doped Cz silicon solar cells. In Proceedings of the 4th World Conference on Photovoltaic Energy Conversion, Waikoloa, HI, USA, 7–12 May 2006; pp. 940–943. [Google Scholar]
  10. Herguth, A.; Schubert, G.; Kaes, M.; Hahn, G. Avoiding boron-oxygen related degradation in highly boron doped Cz silicon. In Proceedings of the 21st European Photovoltaic Solar Energy Conference (EUPVSEC), Dresden, Germany, 4–8 September 2006; pp. 530–537. [Google Scholar]
  11. Cascant, M.; Enjalbert, N.; Monna, R.; Dubois, S. Influence of various p-type Czochralski silicon solar cell architectures on light-induced degradation and regeneration mechanisms. In Proceedings of the 29th European Photovoltaic Solar Energy Conference (EUPVSEC), Amsterdam, The Netherlands, 22–26 September 2014; pp. 2570–2573. [Google Scholar]
  12. Herguth, A.; Horbelt, R.; Wilking, S.; Job, R.; Hahn, G. Comparison of BO Regeneration dynamics in PERC and Al-BSF solar cells. Energy Procedia 2015, 77, 75–82. [Google Scholar] [CrossRef] [Green Version]
  13. Cho, E.; Rohatgi, A.; Ok, Y. Comparison of light-induced degradation and regeneration in P-type monocrystalline full aluminum back surface field and passivated emitter rear cells. Curr. Appl. Phys. 2018, 18, 1600–1604. [Google Scholar] [CrossRef]
  14. Ye, J.; Ai, B.; Jin, J.; Qiu, D.; Liang, R.; Shen, H. Study on the electrical injection regeneration of industrialized B-doped Czochralski silicon PERC solar cells. Int. J. Photoenergy 2019, 2019, 1–10. [Google Scholar] [CrossRef]
  15. Liang, R.; Ai, B.; Jin, J.; Ye, J.; Zhang, W.; Pang, Y.; He, Y.; Shen, H. Optimization of electrical injection regeneration conditions of boron-doped p-type monocrystalline silicon PERC solar cells by orthogonal experiment method. Acta Sci. Nat. Univ. Sunyatseni 2019, 58, 81–89. [Google Scholar] [CrossRef]
  16. Yuan, S.; Ding, S.; Ai, B.; Chen, D.; Jin, J.; Ye, J.; Qiu, D.; Sun, X.; Liang, X. In Situ LID and Regeneration of PERC Solar Cells from Different Positions of a B-Doped Cz-Si Ingot. Int. J. Photoenergy 2022, 2022, 1–12. [Google Scholar] [CrossRef]
  17. Ding, S.; Yang, C.; Yuan, S.; Ai, B.; Qin, C.; Li, Z.; Zhou, Y.; Sun, X.; Yang, J.; Liu, Q.; et al. In-Situ LID and Regeneration of Al-BSF Solar Cells from Different Positions of a B-Doped Cz-Si Ingot. Energies 2022, 15, 5591:1–5591:13. [Google Scholar] [CrossRef]
  18. Wagner, M.; Wolny, F.; Hentsche, M.; Krause, A.; Sylla, L.; Kropfgans, F.; Ernst, M.; Zierer, R.; Bönisch, P.; Müller, P.; et al. Correlation of the LeTID amplitude to the Aluminium bulk concentration and Oxygen precipitation in PERC solar cells. Sol. Energy Mater. Sol. Cells 2018, 187, 176–188. [Google Scholar] [CrossRef]
  19. Shabani, M.B.; Yamashita, T.; Morita, E. Metallic Impurities in Mono and Multi-crystalline Silicon and Their Gettering by Phosphorus Diffusion. ECS Trans. 2008, 16, 179–193. [Google Scholar] [CrossRef]
  20. Miyamura, Y.; Harada, H.; Nakano, S.; Nishizawa, S.; Kakimoto, K. Relationship between carbon concentration and carrier lifetime in CZ-Si crystals. J. Cryst. Growth 2018, 486, 56–59. [Google Scholar] [CrossRef]
  21. Phang, S.P.; Macdonald, D. Direct comparison of boron, phosphorus, and aluminum gettering of iron in crystalline silicon. J. Appl. Phys. 2011, 109, 073521:1–073521:6. [Google Scholar] [CrossRef] [Green Version]
  22. Hieslmair, H.; McHugo, S.A.; Weber, E.R. Aluminum gettering and transition metal precipitates in PV silicon. AIP Conf. Proc. 1997, 394, 759–770. [Google Scholar] [CrossRef]
  23. Liu, A.; Phang, S.P.; Macdonald, D. Gettering in silicon photovoltaics: A review. Sol. Energ. Mat. Sol. Cells 2022, 234, 111447:1–111447:21. [Google Scholar] [CrossRef]
  24. Schmidt, J. Effect of dissociation of iron-boron pairs in crystalline silicon on solar cell properties. Prog. Photovolt. 2005, 13, 325–331. [Google Scholar] [CrossRef]
  25. Shabani, M.B.; Yamashita, T.; Morita, E. Study of Gettering Mechanisms in Silicon: Competitive Gettering between Phosphorus Diffusion Gettering and Other Gettering Sites. Solid State Phenom. 2007, 131–133, 399–404. [Google Scholar] [CrossRef]
  26. Herguth, A. Application of the Concept of Lifetime-Equivalent Defect Density in Defect Systems Comprising a Multitude of Defect Species. Phys.Status Solidi A 2019, 216, 1900322:1–1900322:7. [Google Scholar] [CrossRef]
  27. Fertig, F.; Krauß, K.; Rein, S. Light-induced degradation of PECVD aluminium oxide passivated silicon solar cells. Phys. Status Solidi Rapid Res. Lett. 2015, 9, 41–46. [Google Scholar] [CrossRef]
  28. Hallam, B.; Abbott, M.; Nampalli, N.; Hamer, P.; Wenham, S. Influence of the formation- and passivation rate of boron-oxygen defects for mitigating carrier-induced degradation in silicon within a hydrogen-based model. J. Appl. Phys. 2016, 119, 065701:1–065701:9. [Google Scholar] [CrossRef]
Figure 1. In situ variations of η, Voc, Isc and FF of five groups of PERC (left column) and Al-BSF cells (right column) with process time during the first LID (1 sun, 45 °C, 12 h). (a) η of PERC cells; (b) η of Al-BSF cells; (c) Voc of PERC cells; (d) Voc of Al-BSF cells; (e) Isc of PERC cells; (f) Isc of Al-BSF cells; (g) FF of PERC cells; (h) FF of Al-BSF cells.
Energies 15 07764 g001
Figure 2. In situ variations of η, Voc, Isc and FF of five groups of PERC (left column) and Al-BSF cells (right column) with process time during the second LID (1 sun, 45 °C, 12 h). (a) η of PERC cells; (b) η of Al-BSF cells; (c) Voc of PERC cells; (d) Voc of Al-BSF cells; (e) Isc of PERC cells; (f) Isc of Al-BSF cells; (g) FF of PERC cells; (h) FF of Al-BSF cells.
Energies 15 07764 g002
Figure 3. Variations of I-V characteristic parameters of five groups of PERC (left column) and Al-BSF cells (right column) measured at STC condition with process steps. (a) η of PERC cells; (b) η of Al-BSF cells; (c) Voc of PERC cells; (d) Voc of Al-BSF cells; (e) Isc of PERC cells; (f) Isc of Al-BSF cells; (g) FF of PERC cells; (h) FF of Al-BSF cells.
Energies 15 07764 g003
Figure 4. The variations of dark saturation current density J0 and the diode ideality factor n of five groups of PERC (left column) and Al-BSF cells (right column) with process steps. (a) J0 of PERC cells; (b) J0 of Al-BSF cells; (c) n of PERC cells; (d) n of Al-BSF cells.
Energies 15 07764 g004
Figure 5. EQE curves of five groups of PERC (left column) and Al-BSF cells (right column) measured at four time-nodes of the experiment. (a) EQE of PERC cell P1; (b) EQE of Al-BSF cell A1; (c) EQE of PERC cell P2; (d) EQE of Al-BSF cell A2; (e) EQE of PERC cell P3; (f) EQE of Al-BSF cell A3; (g) EQE of PERC cell P4; (h) EQE of Al-BSF cell A4; (i) EQE of PERC cell P5; (j) EQE of Al-BSF cell A5.
Energies 15 07764 g005
Table 1. The average values of resistivities and impurity contents of five groups of Cz-Si wafers.
Groupρ
(Ω∙cm)
B
(×1015 cm−3)
O
(×1017 cm−3)
C
(×1016 cm−3)
Fe
(×1014 cm−3)
Cu
(×1013 cm−3)
Ni
(×1013 cm−3)
11.967.3810.137.32.932.010.98
21.708.539.368.13.442.411.13
31.529.688.598.93.952.811.27
41.3610.847.829.74.473.221.42
51.2411.997.0510.54.983.621.56
Table 2. Relative decay extent and decay rate of Voc during the first LID and those of Isc during the second LID for five groups of PERC and Al-BSF cells.
GroupPERCAl-BSF
1st LID
Voc
Decay Extent
(rel.)
1st LID
Voc
Decay Rate
(1/s)
2nd LID
Isc
Decay
Extent
(rel.)
2nd LID
Isc
Decay Rate
(1/s)
1st LID
Voc
Decay Extent
(rel.)
1st LID
Voc
Decay Rate
(1/s)
2nd LID
Isc
Decay
Extent
(rel.)
2nd LID
Isc
Decay Rate
(1/s)
13.20%1.19 × 10−40.23%2.80 × 10−41.79%6.30 × 10−50.17%9.65 × 10⁻⁴
22.11%1.49 × 10−40.31%6.41 × 10−40.95%6.52 × 10−50.24%1.45 × 10⁻³
31.89%1.46 × 10−40.32%1.24 × 10−31.43%7.65 × 10−50.24%8.13 × 10⁻⁴
42.34%1.49 × 10−40.40%7.46 × 10−41.40%8.57 × 10−50.25%6.64 × 10⁻⁴
53.73%1.13 × 10−40.44%7.79 × 10−41.08%9.73 × 10−50.25%1.13 × 10⁻³
Note: the first 4 h of data of PERC cells and the first 2 h of data of Al-BSF cells during the 2nd LID were fitted for obtaining the decay rate Rdeg of Isc of PERC and Al-BSF cells, respectively.
Publisher’s Note: MDPI stays neutral with regard to jurisdictional claims in published maps and institutional affiliations.

